the Creative Commons Attribution 4.0 License.
the Creative Commons Attribution 4.0 License.
 | 03 Aug 2020
Effects of continental emissions on cloud condensation nuclei (CCN) activity in the northern South China Sea during summertime 2018
Mingfu Cai
Baoling Liang
Qibin Sun
Shengzhen Zhou
Xiaoyang Chen
Min Shao
Haobo Tan
Aerosol particles in marine atmosphere have been shown to significantly affect cloud formation, atmospheric optical properties, and climate change. However, high temporally and spatially resolved atmospheric measurements over the sea are currently sparse, limiting our understanding of aerosol properties in marine atmosphere. In this study, a ship-based cruise campaign was conducted over the northern South China Sea (SCS) region during summertime 2018. The chemical composition of non-refractory PM1 (NR-PM1), the particle number size distribution (PNSD), and size-resolved cloud condensation nuclei (CCN) activity were measured by a time-of-flight aerosol chemical speciation monitor (ToF-ACSM) and the combination of a cloud condensation nuclei counter (CCNc) and a scanning mobility particle sizer (SMPS). Overall, aerosol particles exhibited a unimodal distribution centering at 60–80 nm and the chemical composition of the NR-PM1 was dominated by sulfate (∼ 46 %), which likely originated from anthropogenic emissions rather than dimethyl sulfide (DMS) oxidation. Two polluted episodes (P1 and P2) were observed, and both were characterized by high particle number concentrations (NCN) which originated from local emissions and from emissions in inland China via long-range transport. The concentrations of trace gases (i.e., O3, CO, NOx) and particles (NCN and NCCN at ss = 0.34 %) were elevated during P2 at the end of the campaign and decreased with offshore distance, further suggesting important impacts of anthropogenic emissions from the inland Pearl River Delta (PRD) region. Two relatively clean periods (C1 and C2) prior to and after tropical storm Bebinca were classified and the air was affected by air masses from the southwest and from the Indo-Chinese Peninsula, respectively. Chemical composition measurements showed an increase in organic mass fraction during P2 compared to C2; however, no obviously different κ values were obtained from the CCNc measurements, implying that the air masses carried pollutants from local sources during long-range transport. We report an average value of about 0.4 for the aerosol hygroscopicity parameter κ, which falls within the literature values (i.e., 0.2–1.0) for urban and remote marine atmosphere. In addition, our results showed that the CCN fraction (NCCN∕NCN, tot) and the κ values had no clear correlation either with the offshore distance or with concentrations of the particles. Our study highlights dynamical variations in particle properties and the impact of long-range transport from continental China and the Indo-Chinese Peninsula on the northern SCS region during summertime.
- Article
(3687 KB) - Full-text XML
-
Supplement
(772 KB) - BibTeX
- EndNote


Aerosol particles directly affect the global radiation balance by scattering and absorbing solar radiation. Meanwhile, they can alter cloud microphysics, lifetime, and albedo, indirectly affecting heat transfer through atmosphere (IPCC, 2013). However, high uncertainties still exist in their contributions to the climatic impact, partly owing to our limited knowledge of the spatial and temporal distribution of aerosol particles and their properties in various environments. Thus, it is essential to conduct field measurements under different environments to obtain chemical and physical properties of particles, including chemical composition, particle number size distribution (PNSD), and cloud condensation nuclei (CCN) activity, in order to better understand the radiation forcing induced by aerosol particles.
CCN activity describes how particles grow into cloud droplets and further affect cloud development. Whether particles can be activated as CCN is determined by their chemical composition, hygroscopicity, size, and ambient supersaturation (ss). Generally, CCN activity can be described by Köhler theory based on the water activity in solution, the surface tension, the molecular weight of water, temperature, and the diameter of the particle (Köhler, 1936). Alternatively, the hygroscopicity parameter κ proposed by Petters and Kreidenweis (2007) can be used to characterize CCN activity. Aerosol hygroscopicity describes the ability of particles to grow by absorbing moisture in ambient environments. The κ values can be measured in subsaturation (RH < 100 %) conditions by the hygroscopicity tandem differential mobility analyzer (HTDMA) measurements or in supersaturation (RH > 100 %) by the cloud condensation nuclei counter (CCNc) measurements.
Field measurements for CCN activity have been conducted primarily in terrestrial environments (e.g., urban cities, forested areas, and remote countryside areas) (Rose et al., 2010; Wang et al., 2010; Cerully et al., 2011; Pierce et al., 2012; Hong et al., 2014; Cai et al., 2018). Cerully et al. (2011) reported κ values ranging from 0.1 to 0.4 in forest during the 2007 EUCAARI campaign and concluded that the κ values obtained from the HTDMA measurements were generally 30 % lower than those from the CCNc measurements. Wang et al. (2010) showed that the mixing state of particles was important in predicting the CCN number concentration (NCCN). Cai et al. (2018) found that CCN activity increased by decreasing the surface tension through an increase in organic fractions in particles based on the measurements of CCN activity, hygroscopicity, and chemical composition in the Pearl River Delta (PRD) region. Progress on the aforementioned field measurements conducted in continental environments has substantially improved our understanding of the influence of aerosols in global radiation forcing and precipitation in terrestrial environments.
Aerosol particles in the marine atmosphere, on the other hand, have been well known to significantly affect cloud development, atmospheric optical properties, and climate change (Johnson et al., 2004; Ackerman et al., 2004; Mulcahy et al., 2008). Fewer field measurements have been conducted in the oceanic atmosphere than on land, leading to less characterization of marine aerosol particles. Remote-sensing and ship-based cruise methods are two typical approaches employed to measure aerosol properties in marine environments (Durkee et al., 1986; Kim et al., 2009; Lehahn et al., 2010; Huang et al., 2018). Compared to ship-based measurements, remote sensing covers a larger area spatially and a longer period temporally, which are essential in the characterization of marine aerosols. For example, Reid et al. (2013) employed remote sensing to describe long-range transport patterns in southeast Asia. The aerosol size information was compared between the retrievals from the Moderate Resolution Imaging Spectroradiometer (MODIS) and the measurements from ground-based radiometers such as the Aerosol Robotic Network (AERONET) over the ocean (Kleidman et al., 2005). However, extensive cloud coverage over oceanic regions can significantly affect the quality and availability of satellite measurements. Meanwhile, dry bias or clear-sky bias also challenge satellite measurements for obtaining accurate data (John et al., 2011; Reid et al., 2013; Choi and Ghim, 2017). Moreover, remote sensing using satellite sensors is limited in providing high time resolution (i.e., minutes), high spatial resolution (i.e., within tens of meters in dimension) data and specific particle properties (i.e., hygroscopicity and chemical composition). Although ship-based measurements are limited in spatial coverage, they can provide higher spatial and temporal resolution for obtaining comprehensive physical and chemical properties of gas and aerosol particles. Huang et al. (2018) measured the chemical composition of particles with a high-resolution time-of-flight aerosol mass spectrometer (HR-ToF-AMS) over the Atlantic Ocean aboard a campaign ship and found that about 19 % of organics originated from continental long-range transport. Kim et al. (2009) found that particle size distribution varied in a dynamic range, depending on the meteorological conditions over the Yellow Sea and the East China Sea. Atwood et al. (2017) showed that biomass burning, anthropogenic pollution from the continent, and ship emissions would affect the remote South China Sea during the southwestern monsoon (SWM) season. However, few ship-based campaigns are available in the literature on measurements of atmospheric composition including gases and aerosol particles, especially in several important China sea regions (e.g., SCS).
The air over the northern SCS is affected by anthropogenic pollution from the adjacent Pearl River Delta region, inner continental China, and the Indo-Chinese Peninsula (Zhang et al., 2018). Furthermore, as one of the most important and busy trading regions in China, the PRD and the northern SCS are subjected to severe air pollution due to emissions from heavy loadings of cargo ships and fishing vessels (Lv et al., 2018). Special weather patterns are dominant in the SCS during summertime which are characterized by the SWM and occasionally affected by typhoons. Typically, a typhoon brings heavy precipitation and strong wind to this region, which helps to remove air pollutants. However, on the one hand, it has been found that downdrafts prior to a typhoon usually negatively affect atmospheric diffusion, leading to the accumulation of air pollutants in the region (Feng et al., 2007). On the other hand, marine background particles and emissions from the Indo-Chinese Peninsula are brought into this region through SWM. As a result, the physical and chemical properties of marine aerosol particles vary dynamically, which can be distinguished from those of continental particles. Differences (i.e., physical and chemical properties, life cycle) between the two types of aerosol particles reflect different transport pathways and source origins, which are not well known. In addition, a lack of understanding on aerosol characteristics will inevitably hinder our ability to evaluate the impacts of aerosol particles on global radiation forcing and atmospheric processes. Thus, ship-based field measurements are urgently needed in this region in order to understand CCN activity, chemical composition, particle size distribution, and their relationships with continental and marine air masses.
In this study, we report results from a recent ship-based cruise measurement in the northern SCS during summertime 2018. During the campaign, size-resolved CCN activity, chemical composition, and particle number size distribution were measured by a CCNc, a time-of-flight aerosol chemical speciation monitor (ToF-ACSM) and a scanning mobility particle sizer (SMPS), respectively. Temporal and spatial distributions of the aerosol chemical and physical properties and the impact of different air masses on the properties were investigated. Our results provide valuable knowledge on the effects of long-range transport and on the atmospheric processes in the SCS.
2.1 Ship-based campaign
The cruise campaign was a routine comprehensive exercise organized by Sun Yat-sen University (SYSU) during summertime 2018 (6 to 27 August) including a variety of multidisciplinary sciences (i.e., atmosphere, ocean, chemistry, geology, and biology). The round-trip journey started and ended at Huizhou port (22∘43′ N, 114∘36′ E), which is about 140 km from Guangzhou, traveling towards the northern SCS in an area between 19∘37′ to 22∘43′ N and 113∘44′ to 118∘12′ E. The ship track includes two routes during which the vessel was anchored near the port due to tropical storm Bebinca as its track is shown in Fig. 1a, along with the complete, color-coded ship track. The first route started on 7 August from the port and arrived northeast of Dongsha Islands (20∘45′ N 118∘12′ E) on 10 August 2018; it then returned to anchor near the port during the typhoon period (11 to 15 August). The second route left the port on 15 August toward Hong Kong and arrived south of Hong Kong in the afternoon (18:00 LT, local time). The vessel then headed southeast for about 42 h on 18 August and turned toward Dongsha Islands. It anchored at several sites around this sea area and then returned on 24 August following a similar pathway as the first route to Huizhou port on 27 August.
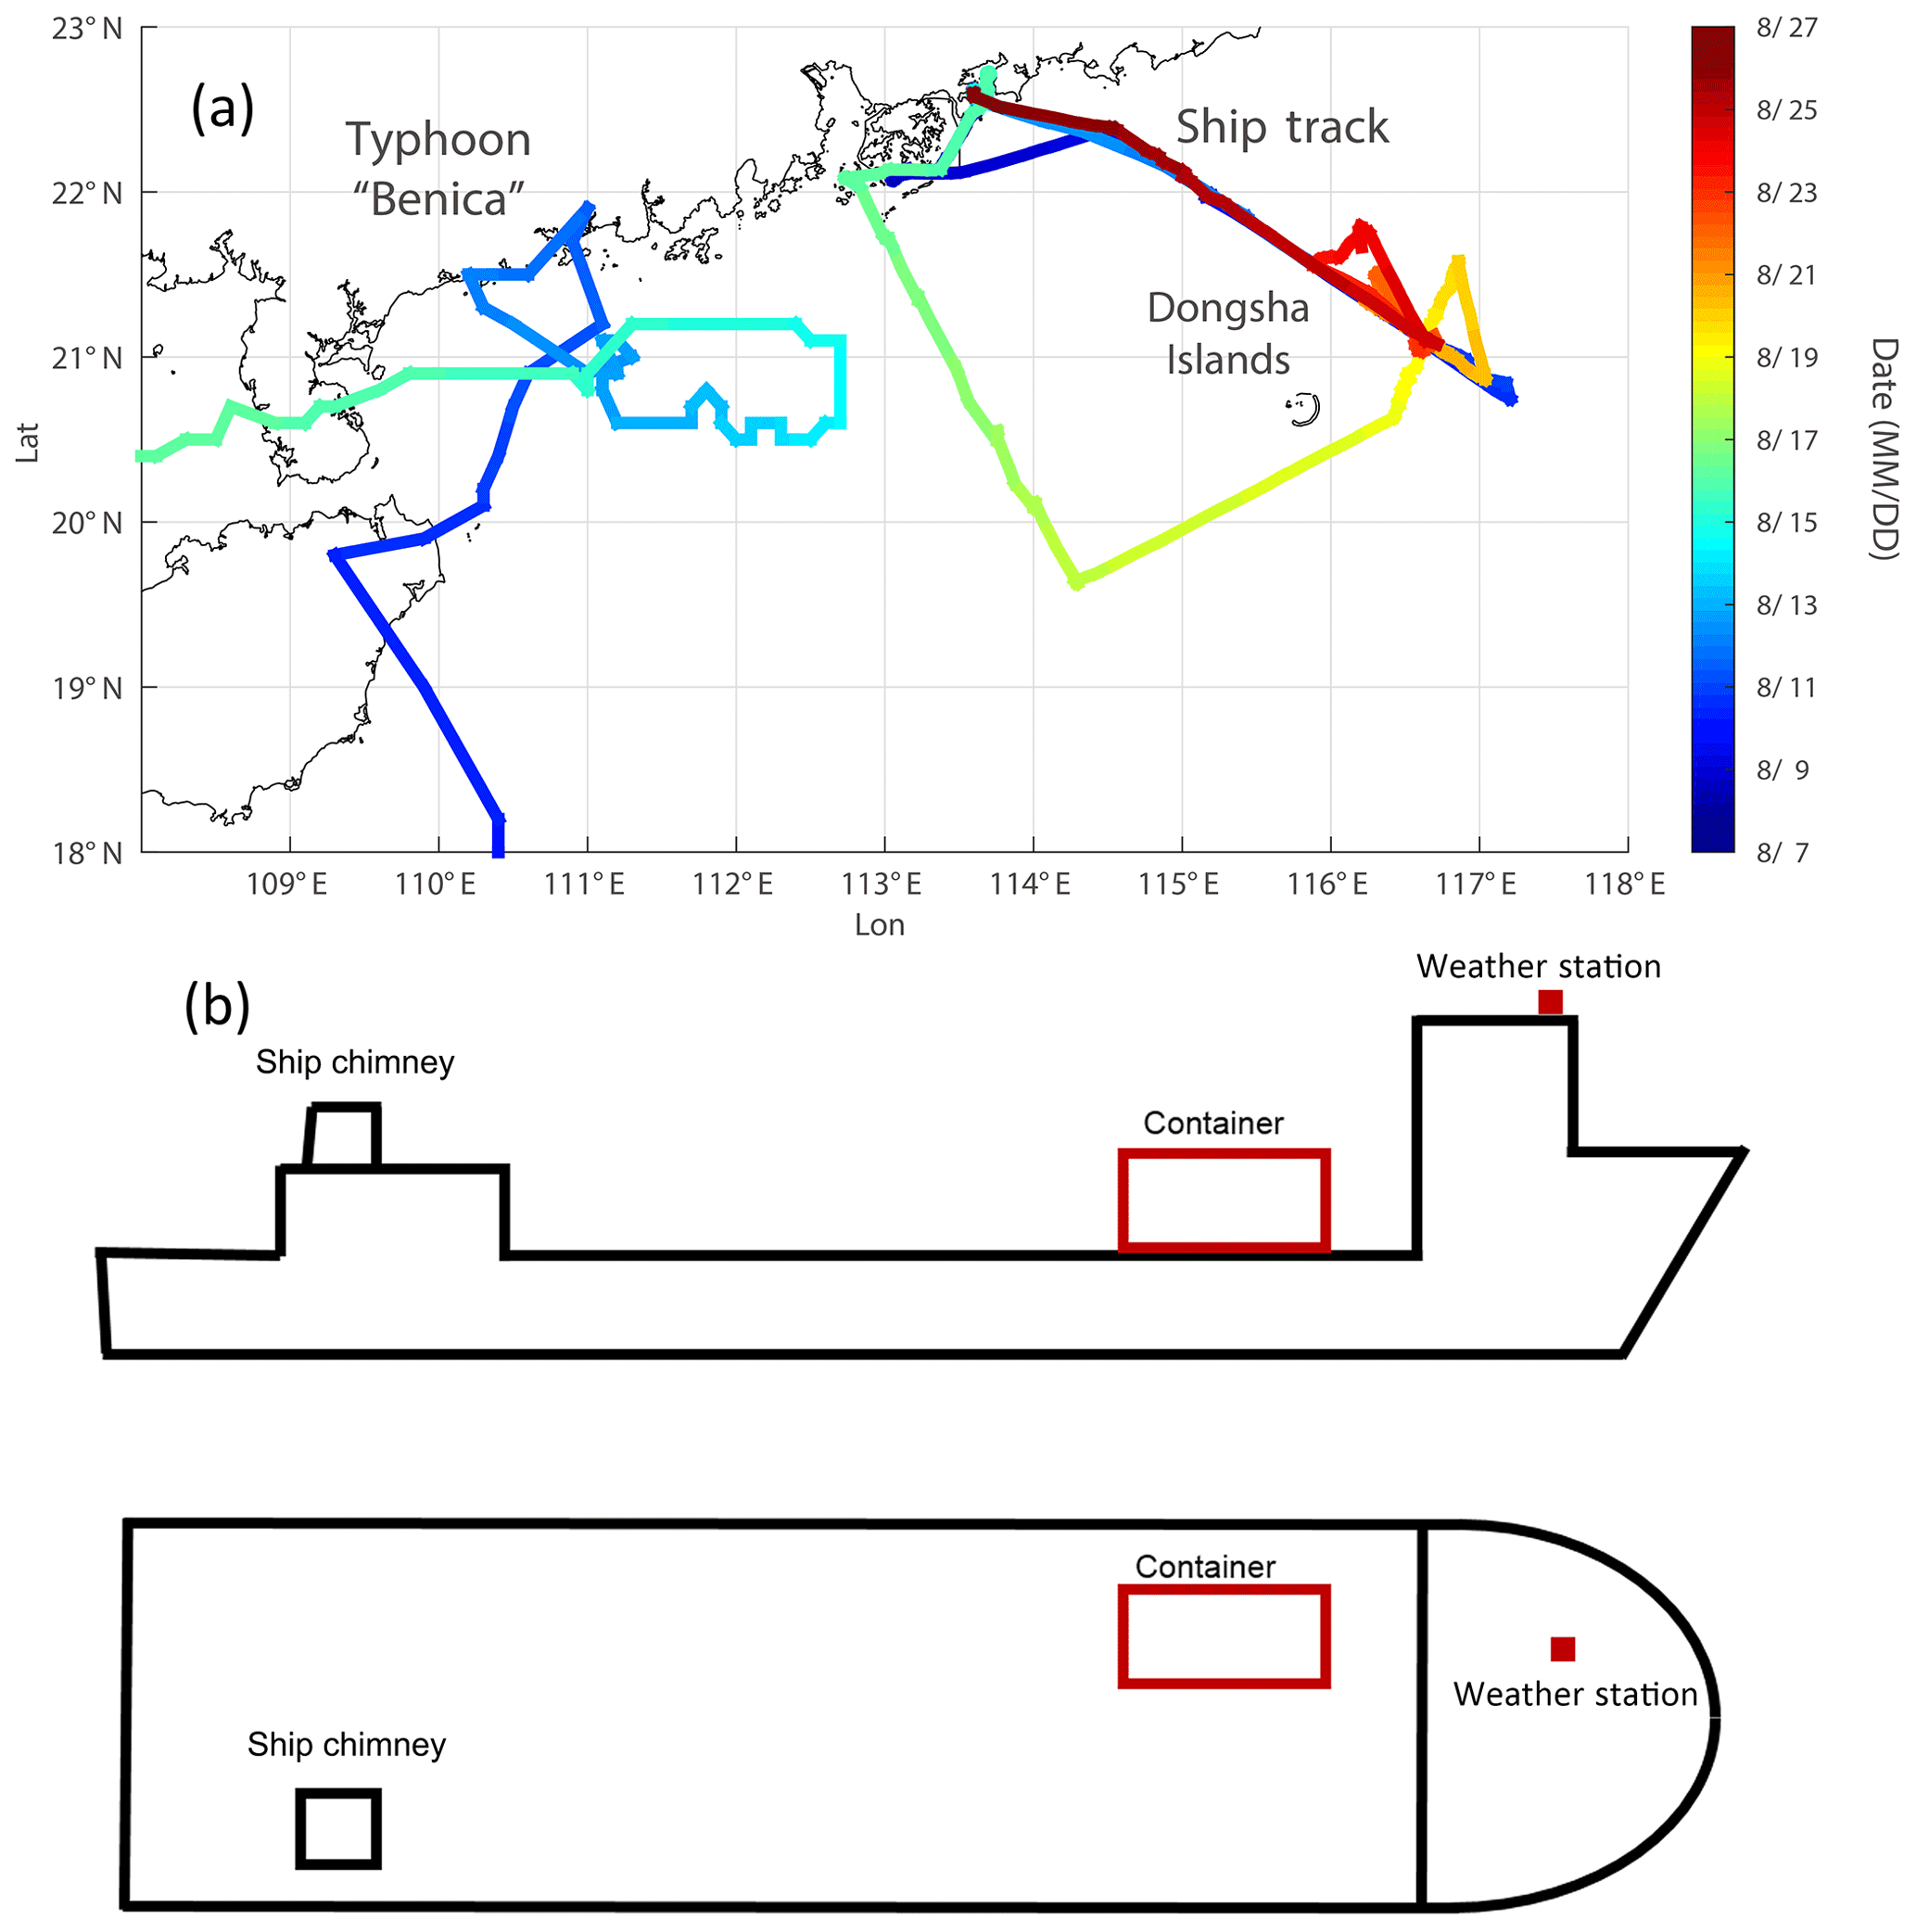
Figure 1Ship track and tropical storm Bebinca track during the campaign (a) and schematic diagram of the vessel showing the location of the sea container which housed the onboard instruments during the campaign (b).
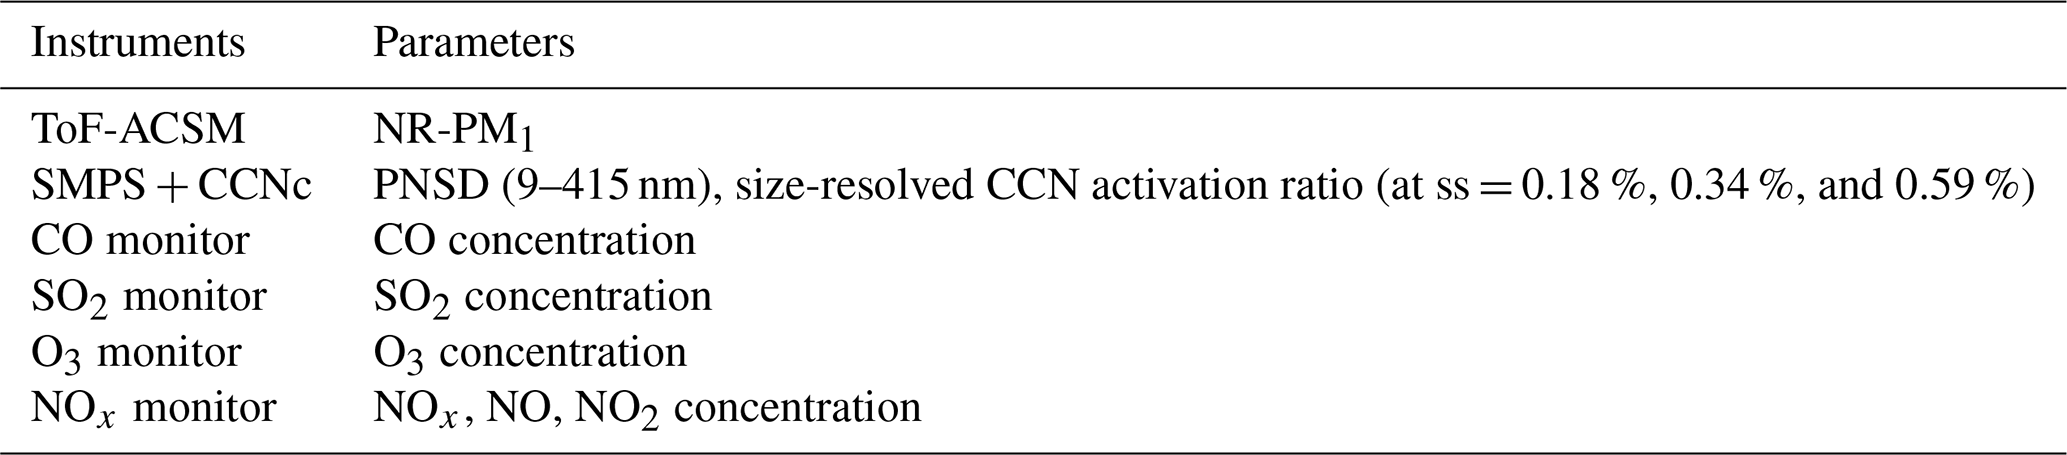
A commercial vessel with a capacity of 8000 t was employed for the routine summer measurement campaign whose schematic diagram is shown in Fig. 1b. An air-conditioned (T=298 K) sea container of about 30 m2 housed all the instruments, as listed in Table 1, and was placed on the front deck of the vessel. Trace gases, including O3, SO2, CO, and NOx (NO and NO2), were measured by gas analyzers (model T400U, T100U, T300, and T200U, Teledyne API Inc., USA, respectively). Detailed descriptions of the major instruments used in the campaign can be found in the following subsection. The aerosol sampling port with a PM2.5 cyclone inlet was made of a 5 m long, o.d. stainless-steel tube which extended outside of the container with an inclination angle of 45∘ to the deck. The inlet was about 2.5 m above the deck and 1.5 m away from the container. All aerosol sampling flows first passed through a Nafion dryer (model MD-700, Perma Pure Inc., USA) to reach a relative humidity (RH) lower than 30 %. The gas sample inlet made of a 2 m long, o.d. Teflon tube with a similar inclination angle also extended outside of the container.
2.2 Origins of air masses by HYSPLIT
The HYbrid Single-Particle Lagrangian Integrated Trajectory (HYSPLIT) model developed by National Oceanic and Atmospheric Administration (NOAA) was used to investigate trajectories of air movement for the identification of source origins which might affect the northern SCS region during the campaign. The model calculated the 72 h back trajectories of air masses at 6 h intervals arriving at the campaign vessel. The arrival height of the trajectories was set to be 150, 500, and 1000 , a reasonable representative of the air masses. The Global Data Assimilation System (GDAS) meteorological data were employed to drive HYSPLIT.
2.3 Measurements
2.3.1 Size-resolved cloud condensation nuclei activity
The size-resolved CCN activity was measured with a combination of a custom-built scanning mobility particle sizer system and a cloud condensation nuclei counter (model CCNc-200, DMT Inc., USA). The custom-built SMPS system consisted of a differential mobility analyzer (DMA; model 3081L, TSI., Inc.) and a condensation particle counter (CPC; model 3787, TSI Inc.). The CCNc-200 has two parallel cloud columns (columns A and B) which measure the CCN concentrations (NCCN) at two specific ss at the same time. Only the NCCN measured by column A was discussed in this study. During the measurements, the SMPS system was operated in a scanning mode. After the Nafion dryer, the sample particles were first neutralized by an X-ray neutralizer (model 3088, TSI., Inc., USA) and were subsequently classified by the DMA. The selected particles were split into the CPC for measurements of total particle number concentration (with a flow rate of 0.6 L min−1) and the CCNc for measurements of the CCN number concentration at a specific supersaturation (with a flow rate of 0.5 L min−1). The SMPS and the CCNc system were set to measure particle number size distribution and size-resolved CCN number concentration at a mobility size range of 10–400 nm. The supersaturation of the CCNc was set to be 0.18 %, 0.34 %, and 0.59 %. Before the measurements, the CCNc-200 was calibrated with ammonium sulfate ((NH4)2SO4) particles at three ss (0.18 %, 0.34 %, and 0.59 %); a detailed description of the calibration can be found in Cai et al. (2018). The SMPS system was also calibrated with standard polystyrene latex spheres (PSLs; with a size of 20, 50, and 200 nm) prior to the campaign.
2.3.2 Aerosol chemical composition
An Aerodyne time-of-flight aerosol chemical speciation monitor was deployed to measure bulk non-refectory PM1 chemical composition during the campaign. The ToF-ACSM can provide the mass concentration of sulfate, nitrate, ammonium, chloride, and organics, except for non-refectory components such as sea salt, black carbon, and crustal species. A detailed description of the ToF-ACSM can be found in Fröhlich et al. (2013), and only a brief introduction relevant to this work is given here. During the campaign, the measurement cycle of the ToF-ACSM was set to be about 10 min and the mass-resolving power was about 160. The sample flow dried by the Nafion dryer entered an automatic three-way valve, of which one way was directly connected to the lens system and the other way was connected to a filter before entering the aerodynamic lens. By switching the automatic valve periodically, the instrument can measure the total signal without a filter and the background signal with a filter; thus the net signal representing the chemical composition of the aerosol particles can be obtained. The aerodynamic lens system removes particles larger than 1 µm (at aerodynamic diameter, DVA) and has a relatively low transmission for small particles (DVA < 50 nm). Monodisperse pure ammonium nitrate (NH4NO3) and ammonium sulfate ((NH4)2SO4) particles generated by a custom-built atomizer and then selected by a DMA (about 300 nm in diameter) were used to calibrate the relative ionization efficiency (RIE) value of NH4 (RIE) and SO4 (RIE) at the beginning and at the end of the campaign.
2.4 Data processing of CCN activation
The size-resolved NCN and NCCN measured by the SMPS and CCNc-200 system were used to calculate the activation ratio (AR), which was defined as the ratio of NCCN to NCN at each size bin. The size-resolved ARs were inverted based on the method described by Moore et al. (2010). The AR spectrum was then fitted using a three-parameter fit:
where Dp represents dry particle diameter (nm); B, C, and D50 are the three fitting parameters which represent the asymptote, the slope, and the inflection point of the sigmoid, respectively (Moore et al., 2010). The D50 is called the critical diameter, where 50 % of the particles are activated at a specific ss.
A hygroscopicity parameter κ which represents CCN activity was calculated from the critical saturation ratio (Sc) and D50 from the following equation (Petters and Kreidenweis, 2007):
where ρw is the density of pure water (about 997.04 kg m−3 at 298.15 K), Mw is the molecular weight of water (0.018 kg mol−1), σs/a is the surface tension of the solution–air interface which is assumed to be the value of pure water (σs/a=0.0728 N m−1 at 298.15 K), R is the universal gas constant (8.314 ), T is thermodynamic temperature in kelvin (298.15 K), and D50 is the critical diameter (in m).
3.1 Overview
Figure 2 shows the number size distribution (a), mass concentration and fraction (b, c), number concentration of CCN (d), and hygroscopicity parameter (e) measured by different instruments during the campaign. The particle sizes were predominantly larger than 10 nm, implying that no new particle formation events were observed during the campaign. Furthermore, the distribution exhibited mainly unimodal characteristics which peaked at a size range of about 60–80 nm. The average number concentration was about 3400 cm−3, which was in general lower than that in the inland PRD region (Cai et al., 2017) and slightly lower than the ship measurement (4335 cm−3) over the East China Sea (Kim et al., 2009). However, two relatively polluted periods were classified with high particle number concentrations at the beginning (6–8 August, defined as P1 with a particle size peaking at about 80 nm) and at the end (25–26 August, defined as P2 peaking at about 100 nm) of the campaign. In contrast, two relatively clean periods were identified in between (9–10 August, defined as C1, and 19–21 August, defined as C2).
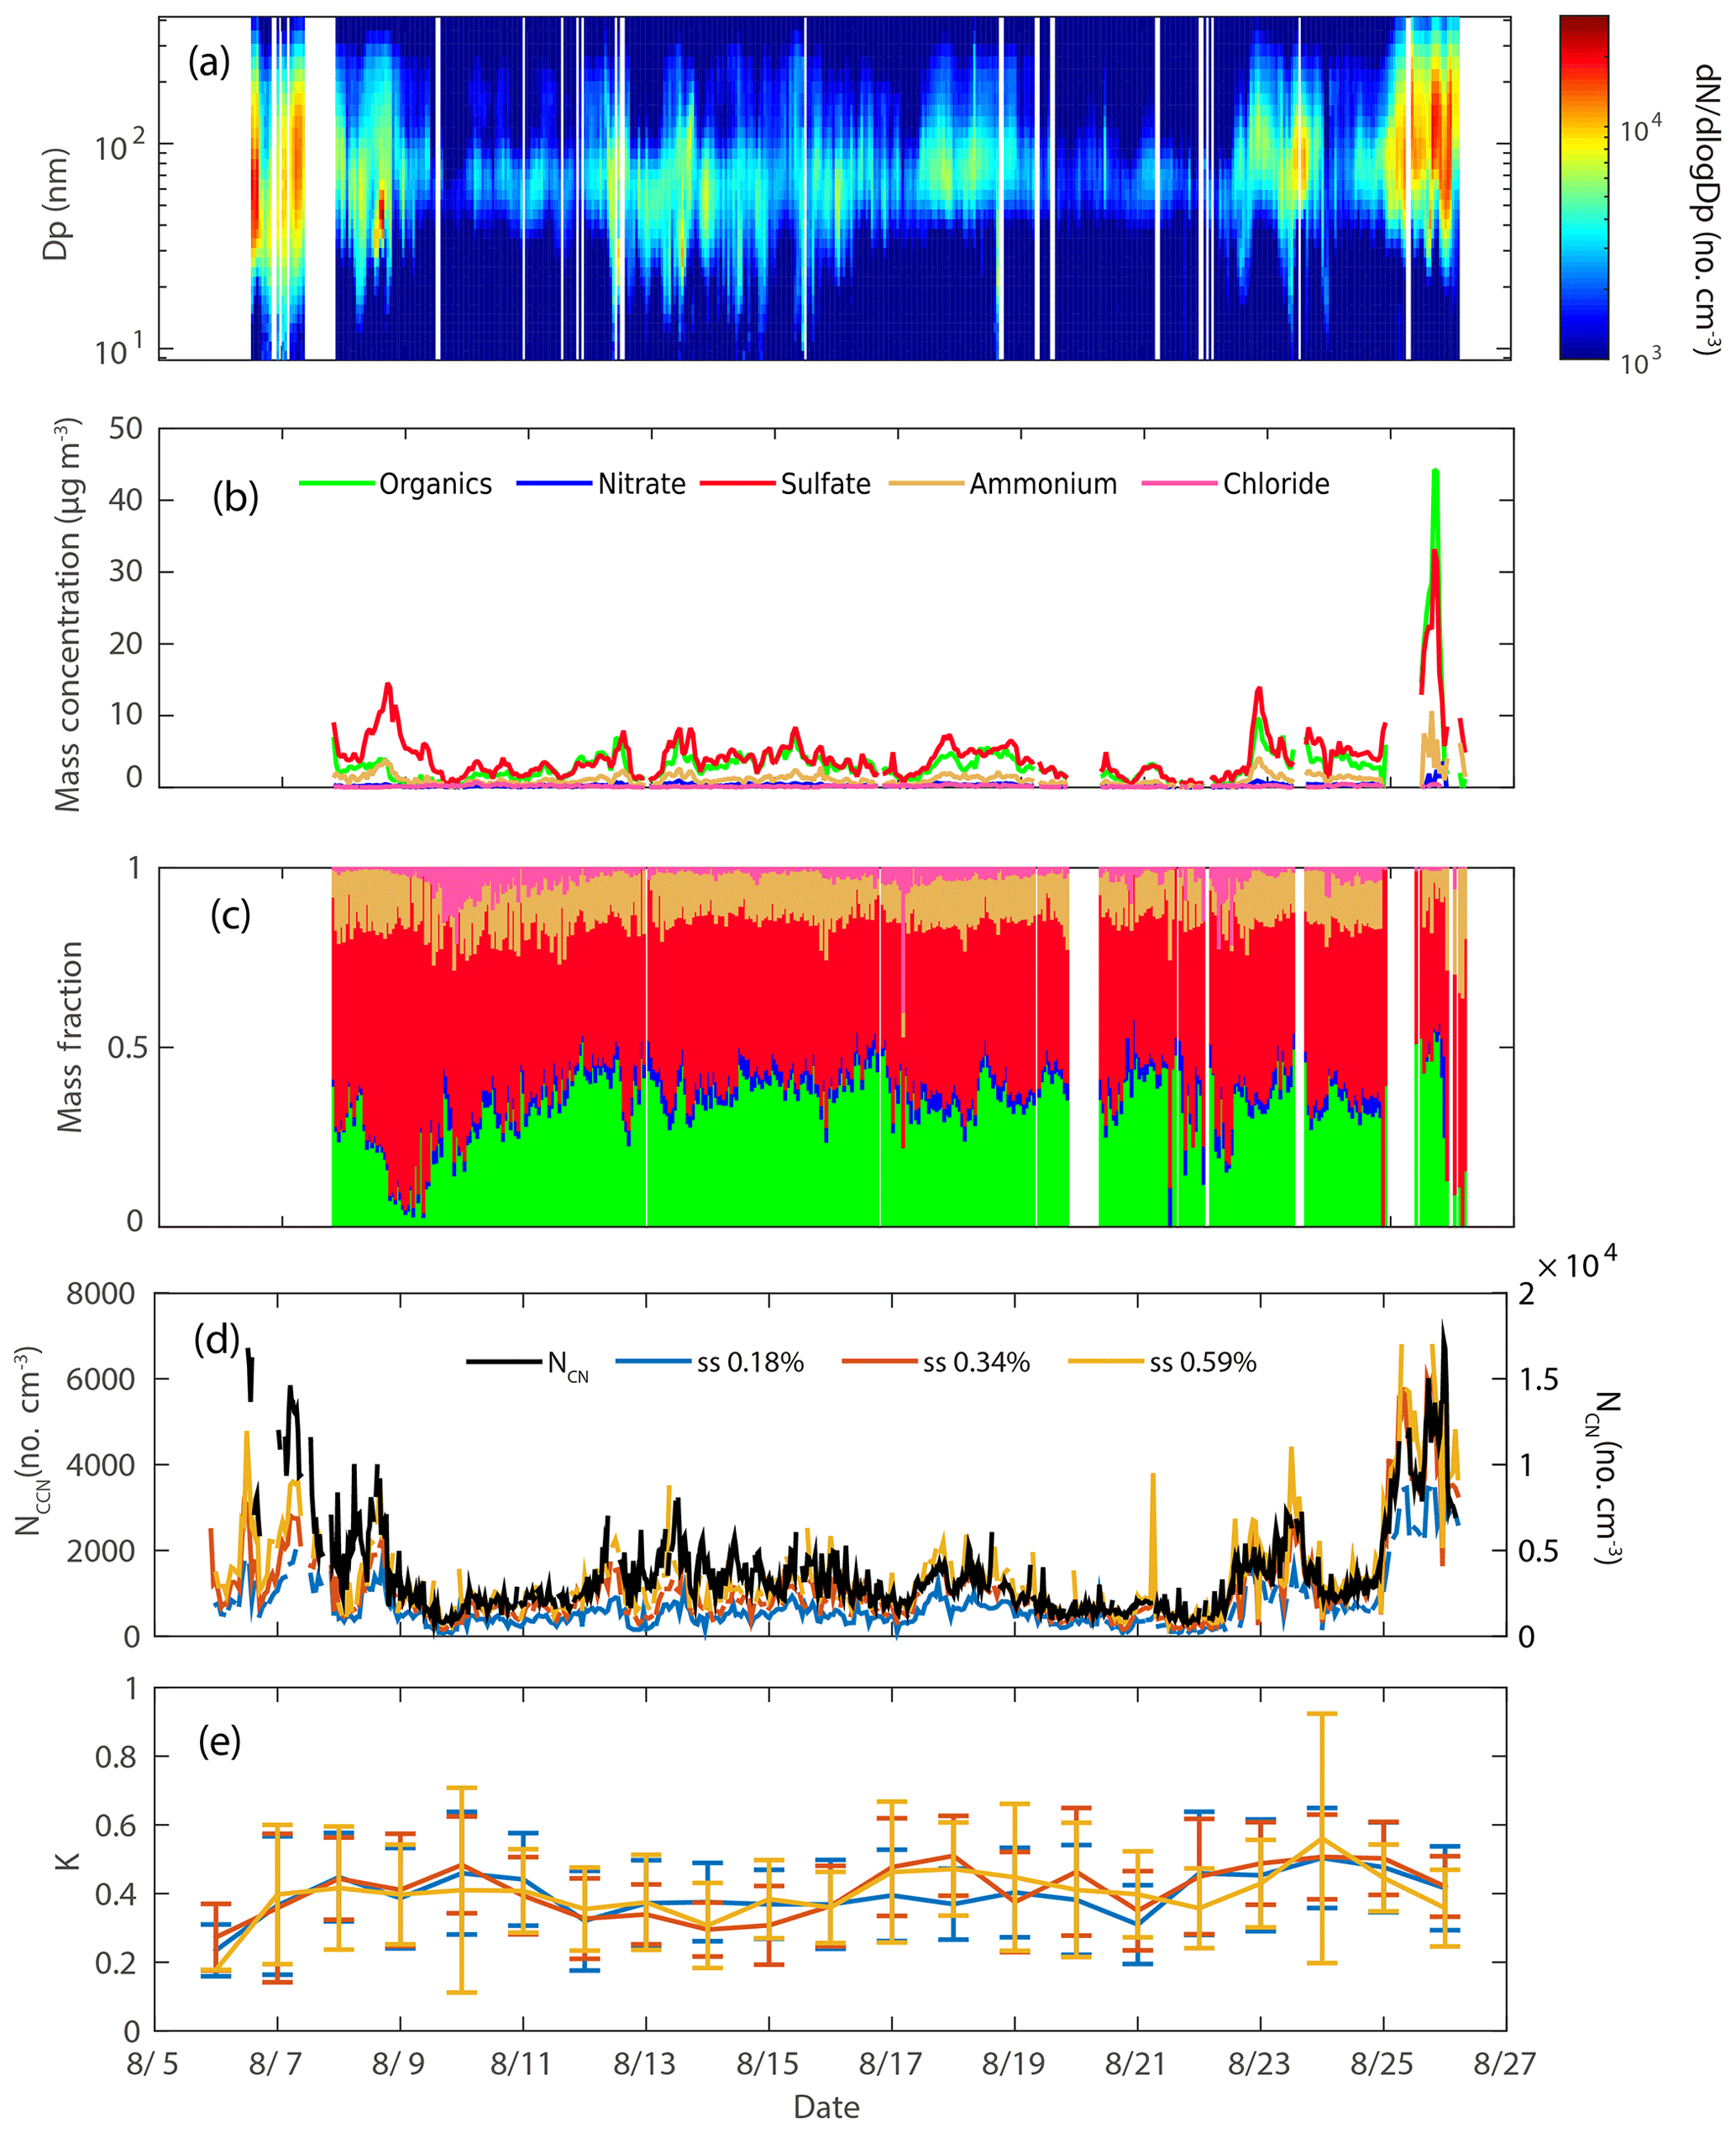
Figure 2Temporal profiles of the measured particle number size distribution (a), mass concentration (b) and mass fraction (c) of chemical composition, NCCN, and NCN (d) and the daily averaged κ values with the upper and lower error bars (e). No data are shown between 6 and 8 August due to the instrumental failure of the TOF-ACSM.
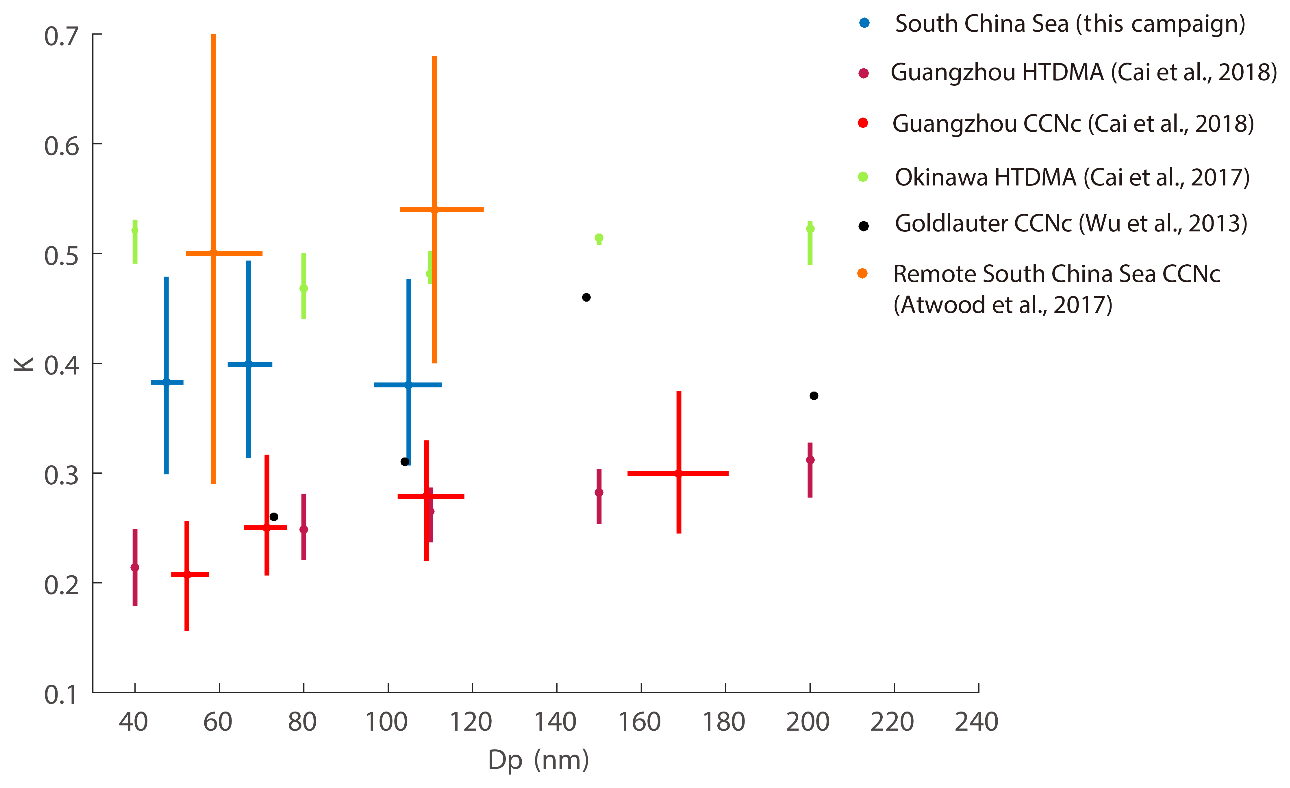
Figure 3The median and interquartile κ values measured over the South China Sea, at an urban site in Guangzhou, and at a marine background site in Okinawa and the mean and SD κ values measured over the remote South China Sea and at mountain site in Goldlauter. The κ values over the South China Sea were obtained from CCNc measurements (ss = 0.18 %, 0.34 %, and 0.59 %; in blue). The κ values in urban Guangzhou were obtained from CCNc (ss = 0.1 %, 0.2 %, 0.4 % and 0.7 %; in orange) and HTDMA measurements (in purple). The κ values in the marine region Okinawa were obtained from HTDMA measurements (in green). The κ values in the remote South China Sea were obtained from CCNc (ss = 0.14 % and 0.38 %; in orange). The κ values at the mountain site in Goldlauter were obtained from CCNc (ss = 0.07 %, 0.10 %, 0.19 % and 0.38 %; in black).
The temporal profile of the mass concentration (Fig. 2a) measured by ToF-ACSM was consistent with that of PNSD, which showed the highest concentration on 25 August. The total measured mass concentration of non-refractory PM1 (NR-PM1) varied dramatically from 0.92 to 85.08 µg m−3, with a median of 7.97 µg m−3. Mass concentrations of PM2.5 were reported over the same region during Cruise I (27.6 µg m−3) and Cruise II (10.10 µg m−3) in Zhang et al. (2007). The mass concentration in our measurements was higher than that in the clean marine atmosphere (from 0.27 to 1.05 µg m−3) reported at a coastal station in Ireland (Ovadnevaite et al., 2014) and the atmosphere over the Atlantic Ocean (Huang et al., 2018). Mass concentration of varied from 0.35 to 33.20 µg m−3, with a median of 3.66 µg m−3, which falls in the range of previous measurement in Dongsha Islands (1.3 to 5.5 µg m−3; Chuang et al., 2013). The average mass fraction of NR-PM1 during the campaign was dominated by sulfate (46 %), followed by organics (35 %), ammonium (14 %), nitrate (3 %), and chloride (2 %), which was similar to the measurement over the Atlantic Ocean (Huang et al., 2018). The chemical composition over the northern SCS was quite different from that at the urban site, which was dominated by organics largely from anthropogenic sources (Cai et al., 2017). A higher mass fraction of sulfate in the marine atmosphere may probably be attributed to anthropogenic emissions (such as nearby ship emissions) rather than the oxidation of dimethyl sulfide (DMS) emitted from the ocean. The oxidation of DMS leads to the formation of sulfur dioxide and methanesulfonic acid (MSA) both of which can be further oxidized to produce non-sea-salt (NSS) sulfate in marine atmosphere. The oxidation of SO2 from ship emissions or inland transport can also be a major source of NSS sulfate (Savoie et al., 2002). As an intermediate between DMS and sulfate, MSA in principle can be detected by ToF-ACSM, although the resolution of the instrument is low. An early study showed that anthropogenic sulfate accounted for about 81 %–97 % of NSS sulfate over the China Sea (Gao et al., 1996). A ratio of 15–655 NSS sulfate to MSA in PM2.5 was reported in the northern South China Sea (Zhang et al., 2007), much higher than that (18–20) in the remote marine region (Savoie et al., 2002). Here we employed the Modern-Era Retrospective analysis for Research and Applications, Version 2 (MERRA-2), to analyze the distribution of the ratio of sulfate to MSA at 925 hPa during the measurement period (GMAO, 2015). The results are shown in Fig. S2a in the Supplement and the ratio ranged from 100 to 10 000 over the SCS, much higher than that in the remote Pacific Ocean (1–50). The sulfate fraction contributed from MSA was calculated based on a ratio of 18 for NSS sulfate to MSA reported in remote marine regions (Savoie et al., 2002). The sulfate fraction was lower than 25 % in the northern SCS region and above 80 % in the remote Pacific Ocean (Fig. S2b). In addition, the ratio decreases with latitude, indicating that anthropogenic emissions rather than DMS are likely the major sources of the total sulfate in the northern SCS region.
The number concentrations of CCN (NCCN at ss=0.18, 0.34 %, and 0.59 %) and total particles (NCN) are shown in Fig. 2d. The NCN values during the two polluted periods (P1 and P2) were significantly higher than the average NCN (3463 cm−3) over the whole campaign period and those from other marine measurements (Cai et al., 2017; Kim et al., 2009). This average value falls between the smoke type (2280 cm−3) and the port type (4890 cm−3) measured over the remote South China Sea (Atwood et al., 2017). Note that since the abnormally spiked signals, which were probably caused by emissions of the nearby ships or the ship itself, were removed in the data processes, the high NCN values during those episodes were likely attributed to regional pollution or long-range transport from continents. For consistency, we removed spikes likely associated with the smoking of cigarettes, emissions from the ship itself and other adjacent ships, and cooking from further data analysis, including either abrupt high number concentrations of particles (measured by SMPS), organics (measured by ToF-ACSM), and NOx (measured by the NOx monitor) (detailed criteria can be found in the descriptions and Fig. S1). In general, the NCCN values at the three supersaturations increased with an increase in the NCN. The average value of NCCN (1544 cm−3, ss = 0.34 %) was similar to the simulated value (1000–2000 cm−3, ss = 0.4 %), suggesting that the model simulation could satisfactorily predict the NCCN in this region (Yu and Luo, 2009). Although the NCCN and NCN were relatively higher in P1 and P2 than the average value, they remained overall low during the campaign compared to those from the inland PRD sites. The NCCN values in P1 were lower than those in P2 with similar values of NCN in both P1 and P2, suggesting a lower activation fraction in P1 than in P2, which cloud be attributed to relatively high fractions of smaller particles and a lower hygroscopicity in P1. As discussed above, particles peaked at a smaller size in P1, leading to fewer particles larger than D50. The time series of the κ values calculated using Eq. (2) show that the aerosol hygroscopicity was lower at the beginning of the campaign, leading to a lower CCN activity in P1. The measurements could be affected by local fresh emissions with lower hygroscopic particles in urban atmosphere since the ship was anchored near Huizhou port and Hong Kong during P1, similar to lower hygroscopicity for urban particles previously measured by Cai et al. (2017). Furthermore, low particle hygroscopicity was found from 11 to 15 August when the ship was sheltering at the port from the tropical storm Bebinca.
Aerosol hygroscopicity, an important parameter affecting CCN activity, can vary greatly in its values under different environments due to a variety of particle sources (Adam et al., 2012; Liu et al., 2014; Hong et al., 2014; Wu et al., 2013; Cai et al., 2017). A comparison of the hygroscopicity parameter κ obtained from this study, urban Guangzhou, remote marine Okinawa, the remote South China Sea, and the mountain in Goldlauter is shown in Fig. 3. The κmedian values obtained from this study (around 0.4) fall between those at the continental sites (Guangzhou and Goldlauter) and remote marine measurements (remote South China Sea and Okinawa) and are barely dependent on particle sizes whose pattern is quite similar to those in Okinawa. Moreover, a κ value was reported to be in a range of 0.22–0.65 measured by CCNc over the remote South China Sea and in a range of 0.30–0.56 measured by HTDMA over the coast of central California during a flight campaign (Atwood et al., 2017; Hersey et al., 2009). In addition, high hygroscopicity values (0.56–1.04) measured by HTDMA were also reported over the Pacific and Southern oceans (Berg et al., 1998). In contrast to maritime environments (i.e., SCS and Okinawa), the κmedian values in Guangzhou (0.21–0.31) are much lower and obviously increase with particle sizes. The low hygroscopicity for small particles in Guangzhou was attributed to local emissions from traffic and industry (Cai et al., 2017). The cruise in this campaign is in an offshore region where the air is affected by anthropogenic emissions from the adjacent inland PRD region, leading to medium values of aerosol hygroscopicity between urban and marine background regions.
3.2 Temporal and spatial distributions
As discussed above, the air over the offshore northern SCS is affected by local emissions from inland PRD regions. The shoreline along Huizhou port is roughly 45∘ inclined to the latitude (from south to north), and it is reasonable to assume that the concentrations of the air pollutants originating from local emissions are generally dependent on the distance offshore, which can be roughly represented by latitude in this study. Hence in this section, the temporal and spatial concentration distributions of air pollutants (particles and gases) were presented with latitude and the dates were color-coded, representing the time from the beginning (dark blue) to the end (dark red) of the cruise (Fig. 4). The concentrations of trace gases (O3, CO, and NOx), NCN, and NCCN (ss = 0.34 %) were higher during the late half than during early half of the campaign, while SO2 concentration varied in an opposite way, suggesting that the sources of the air pollutants or the air masses were different at the beginning and at the end of the campaign. In particular, the aforementioned quantities increased substantially with latitude (the higher the latitude, the closer to the shore) from 19 to 26 August, indicating that the air masses from inland China could affect the northern SCS region during this period. However, the NCCN∕NCN, tot and κ values (ss = 0.34 %) showed almost no pattern (Fig. 4g and h), except that the NCCN∕NCN, tot values were both high (about 0.8) at the beginning and at the end of the cruise. The NCCN∕NCN, tot was defined as the ratio of the number concentration of cloud condensation nuclei and total aerosol particles at a specific ss. The κ values were observed to be relatively low when the vessel was located at a latitude of about 22∘ N corresponding to 6 and 26 August, suggesting that the air was affected by local fresh emissions which increased the organic content of the particles. Interestingly, a higher value on 26 August than on 6 August was clearly shown (Fig. 4g) due probably to larger averaged particle sizes on 26 August (about 110 nm) which were more easily activated than smaller particles on 6 August (about 60–90 nm).
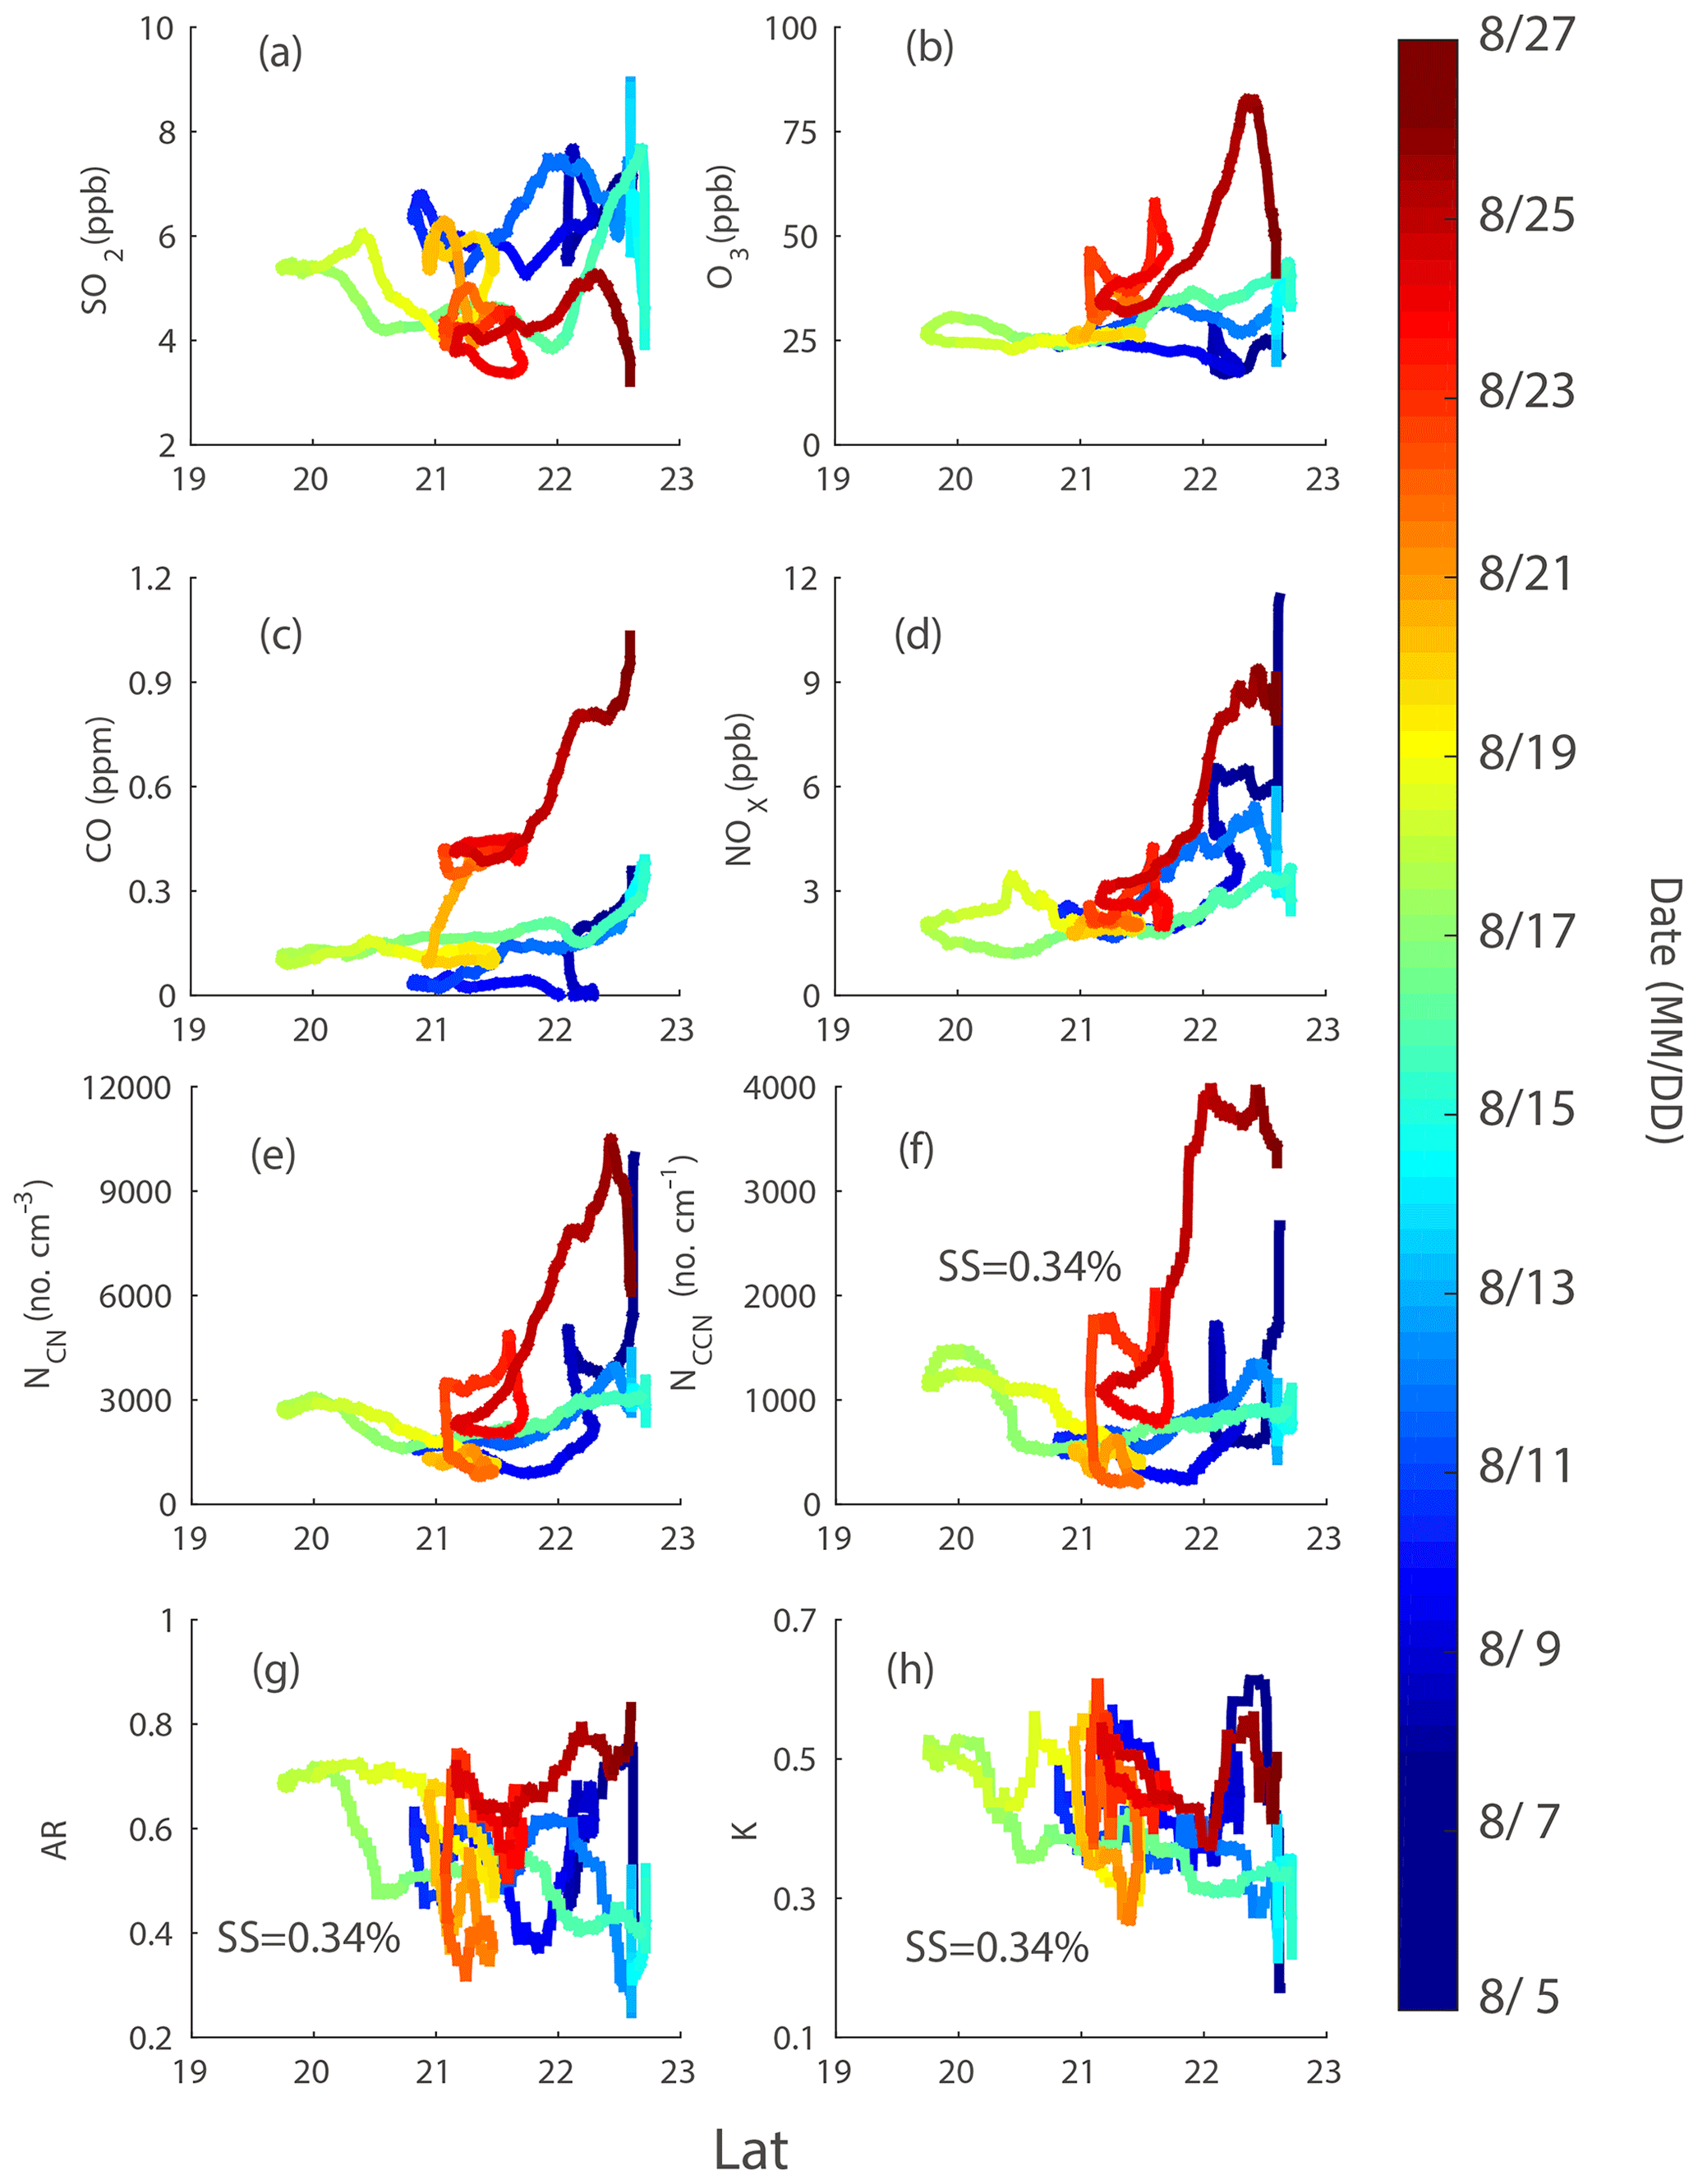
Figure 4Concentrations of SO2 (a), O3 (b), CO (c), NOx (d), NCN (e), NCCN (f), NCCN∕NCN, tot at 0.34 % ss (g), and κ at 0.34 % ss (h) as a function of latitude. The data points were color-coded according to date.
To further investigate the effects of local emissions on aerosol particles over the northern SCS, the correlations of SO2, CO, NOx concentration, NCCN, NCCN∕NCN, tot, and κ with NCN were explored (Fig. 5). The variation in SO2 concentration was independent of NCN, suggesting that SO2 did not have the same source as particles. The CO concentration was positively correlated with NCN during the second half of the cruise, while no obvious correlation was observed during the first half, implying that sources of particles could be different during the two periods. The correlation during the second half of the cruise indicates that the particles might have had the same source as CO, which was attributed to biomass burning or anthropogenic emissions. An excellent correlation between NOx concentration and NCN was shown in all ranges of particle number concentrations, implying that the aerosol particles might have originated from the same source as NOx, which was likely attributed to traffic and industry in the continental PRD region. The NCCN was observed to follow two distinct trends for the first and second half of the cruise, showing in general a higher activation efficiency during the second half of the campaign, especially when NCN was greater than about 7000 cm−3; this was further validated by a much higher NCCN∕NCN, tot ratio against NCN as shown in Fig. 5e. As discussed in the previous paragraph, distinct κ values were seen at the very beginning and at the end of the campaign, suggesting that the properties and sources of the particles could be different as will be further discussed in the case study below.
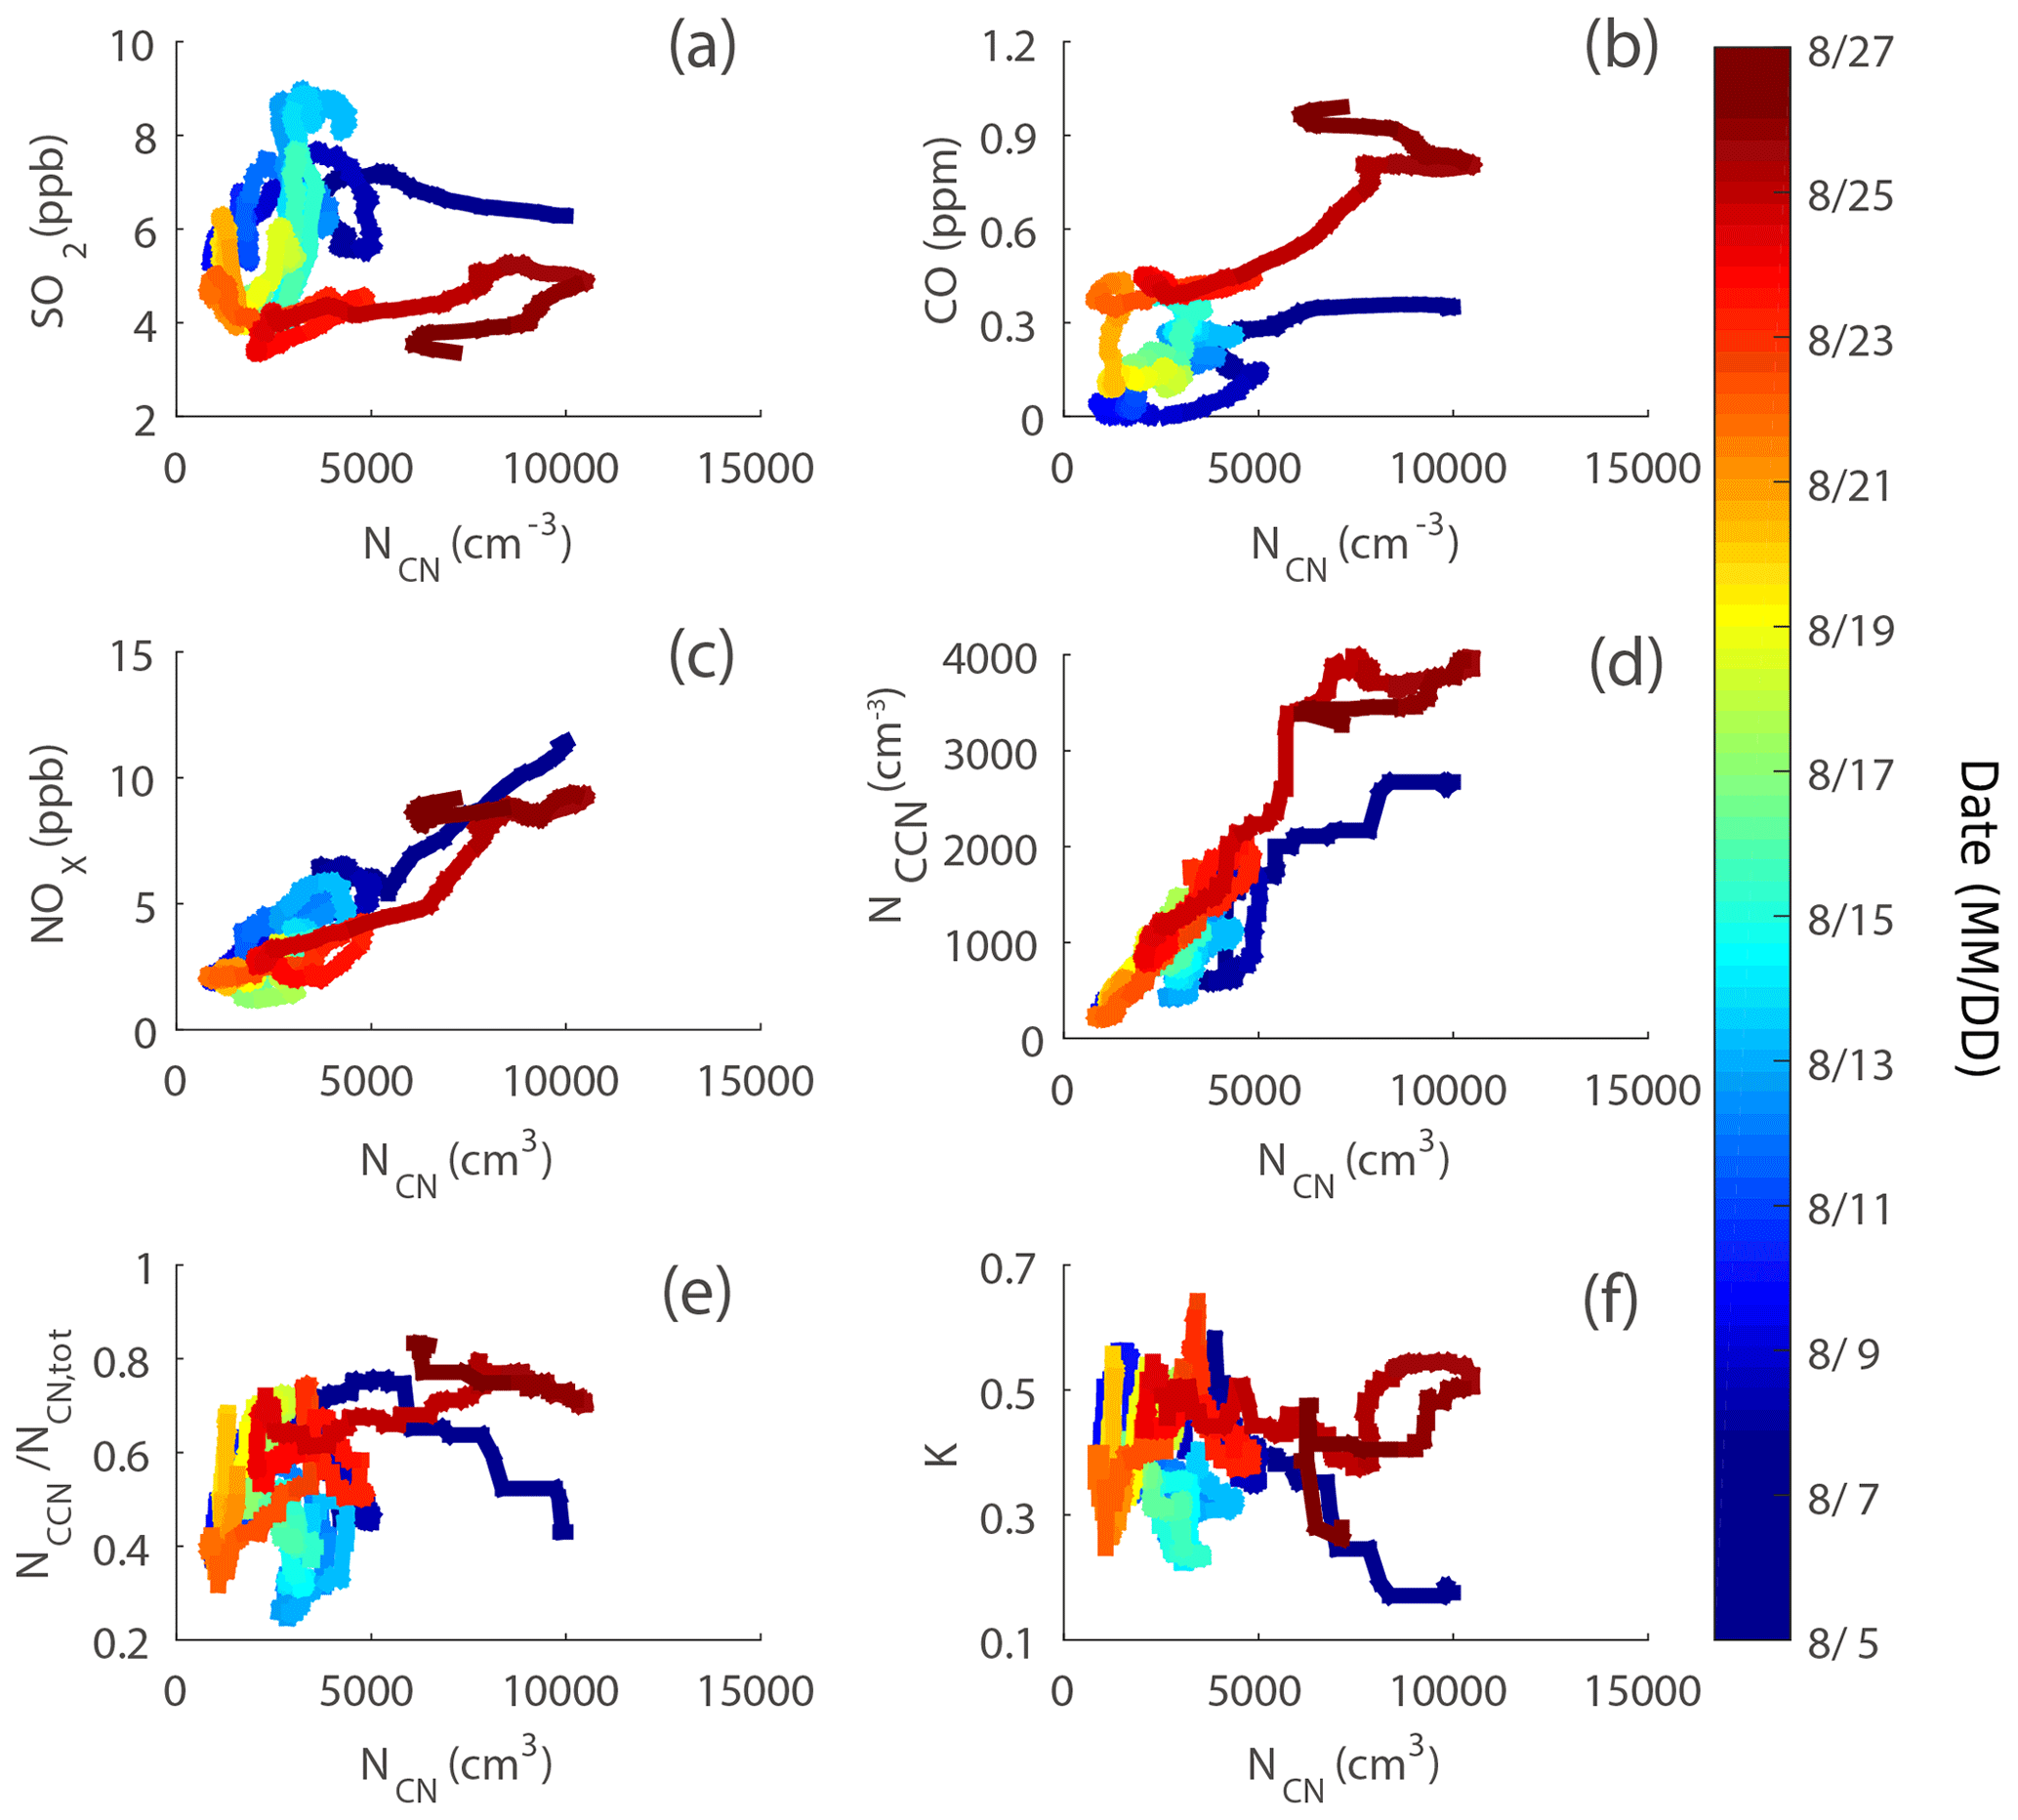
Figure 5Correlations of SO2 (a), CO (b), NOx (c), NCCN (d), AR at 0.34 % ss (e), and κ at 0.34 % ss (f) with NCN. The data were plotted according to color-coded dates.
3.3 Case study
In Sect. 3.1, we classified four periods (all in August) based upon particle number concentration, corresponding to P1 (6 to 8), C1 (9 to 10), C2 (19 to 21), and P2 (25 to 26) as shown in Fig. 6. During the two clean periods (C1, before Bebinca; C2, after Bebinca), the vessel traveled around the northeast of Dongsha Islands where the particle number concentrations remained relatively low and were not affected by the continental emissions from the PRD region. However, high number concentrations of particles were observed during P1 when the vessel was close to the shore where the air was substantially affected by local emissions from either Hong Kong or Huizhou. During the last 2 d in P2, even higher particle number concentrations were observed, suggesting that the pollutants might originate from the inland continent via long-range transport.
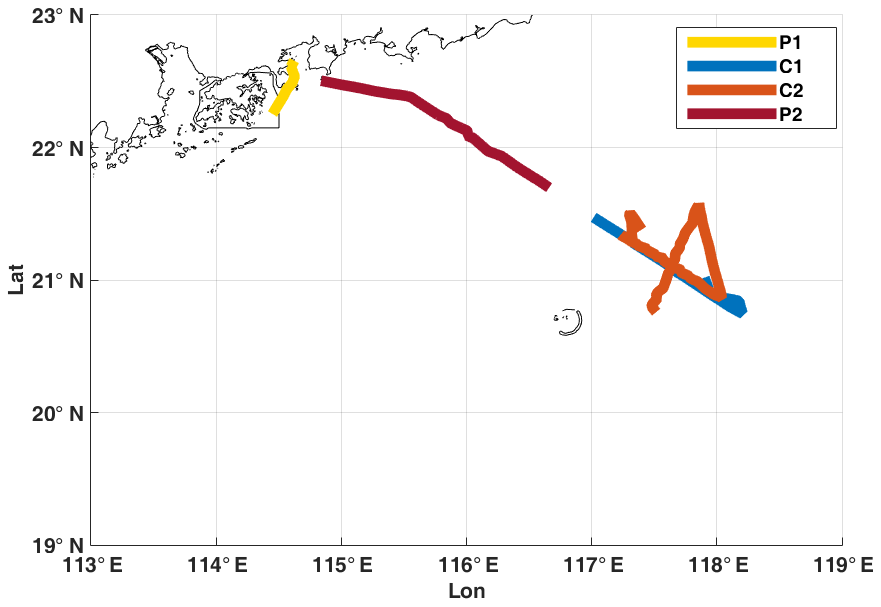
Figure 6The ship track during the P1, C1, C2, and P2 periods.
We performed HYSPLIT to investigate the source origins of the air pollutants according to the movement of air masses during the campaign (Fig. 7). The backward trajectories during P1 showed that the air masses were mainly from the east and south, and when arriving at the location of the vessel, the air masses were stagnant on the shore, suggesting that the pollutants might originate from local emissions. Interestingly, particle number concentrations were low during 11 to 15 August when the vessel was sheltering from Bebinca, due probably to the arrival of the typhoon, which caused high wind speeds and brought rainfall in the northern SCS, resulting in the removal of air pollutants in Huizhou and in Hong Kong. The air masses over the northern SCS originated from the southwest (C1) or from the Indo-Chinese Peninsula (C2) due to summer monsoon during the two clean periods (Fig. 7). The air masses moved northwards during P2 and brought high concentrations of particles from inland China to the PRD region and then further to the northern SCS (Fig. 7).
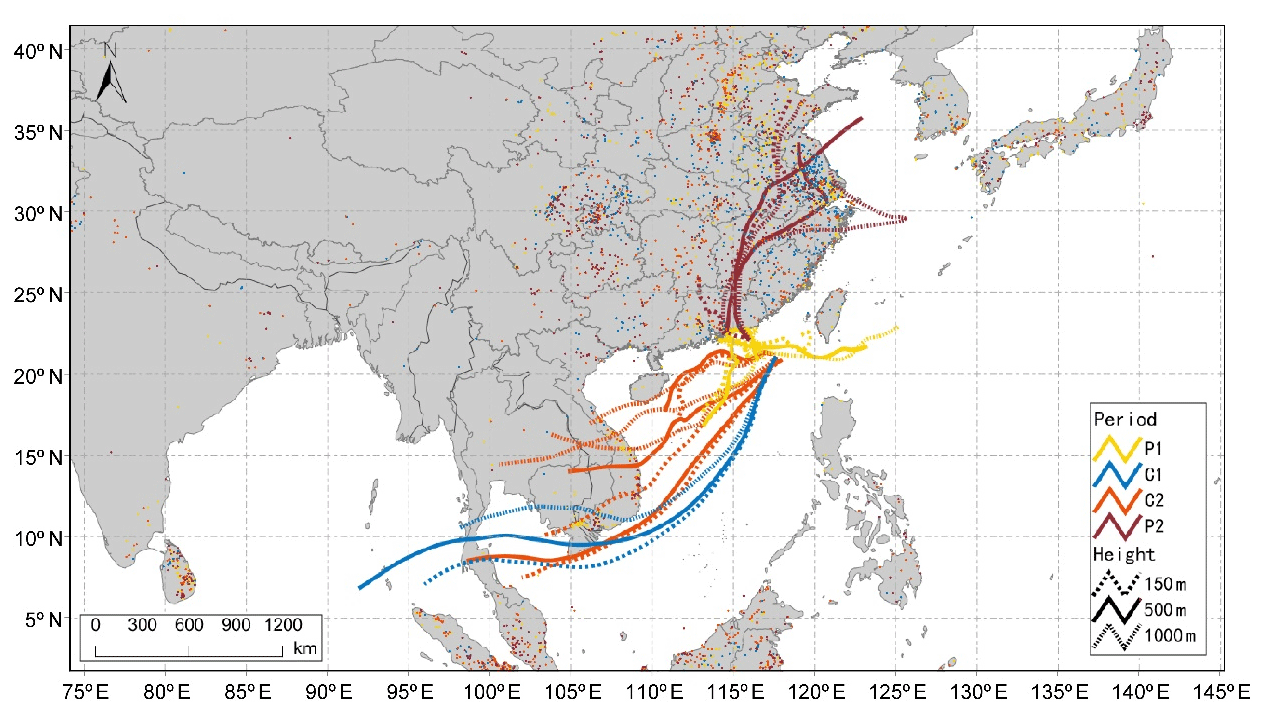
Figure 7The 72 h backward trajectories arriving at the location of the vessel with three heights (150, 500, and 1000 m) during P1, C1, C2, and P2s. The dots represent the fire spots detected by MODIS.
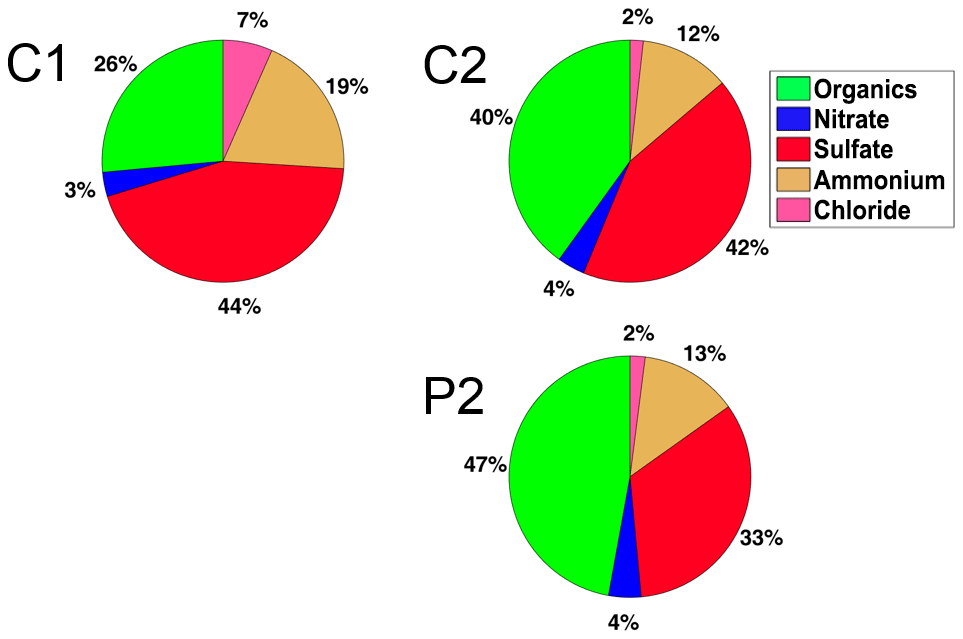
Chemical speciation measured by ToF-ACSM showed that the mass fractions of aerosol composition were substantially different during C1, C2, and P2, except for nitrate whose fraction remain almost constant among the above three periods (Fig. 8). Note that the mass fraction during P1 was not available for a comparison due to instrumental failure. Even the mass fractions during the two clean periods were distinctly different, in particular, those of organics (26 % for C1 vs. 40 % for C2), ammonium (19 % for C1 vs. 12 % for C2), and chloride (7 % for C1 vs. 2 % for C2), although the particle composition was dominated by sulfate which was almost equal in mass fraction (44 % for C1 vs. 42 % for C2). The mass fraction during C1 was dominated by sulfate, followed by organics, and ammonium, which was similar to that in remote marine region (Cai et al., 2017). The mass fraction of sulfate in the NR-PM1 during C1 and C2 was also similar to the previous study (44 % and 43 % in PM2.5 for Cruise I and II, respectively) over the northern SCS (Zhang et al., 2007). Although the mass fraction was still dominated by sulfate, a substantially increasing organic fraction (increase of 26 % for C1 to 40 % for C2) was observed. This increase in organic fraction was likely attributed to the air masses passing through the Indo-Chinese Peninsula, which brought significant local sources. In contrast to the clean periods, the mass fraction in the NR-PM1 during P2 was dominated by organics (47 %), followed by sulfate (33 %) and ammonium (13 %), similar to that in urban areas (Huang et al., 2014), indicating that air masses from the north could bring continental particles from inland China to the northern SCS.
The particle number size distribution (PNSD) was measured by the custom-made SMPS which was described in the Methodology section. The average particle number concentrations during P1 and P2 (9239 and 10 088 cm−3, respectively) were much higher than those during the clean periods (1826 and 1683 cm−3 for C1 and C2, respectively). In addition, the PNSD during the pollution periods was characterized by an obvious accumulation mode that was attributed to secondary aerosols (Fig. 9), while the one during the clean periods has a smaller and a less obvious accumulation mode and a more obvious Aitken mode, which was more related to marine background particles (Cai et al., 2017; Atwood et al., 2017; Kim et al., 2009). The median diameters and concentration of the accumulation mode during C1 and C2 were similar to those previously reported in the South China Sea (Reid et al., 2015). Note that the fitted nucleation modes for both clean and pollution periods were barely seen due to the obviously low concentrations of particles in this mode. The lognormal median diameters for the Aitken mode (70.4 nm) and the accumulation mode (165.7 nm) during P2 were larger than those (48.6 nm and 143.1 nm) during P1, implying more aging processes and particle growth in the long-range transport from the inland continent. Furthermore, a wider accumulation mode during C2 than during C1 was observed, implying more complex sources for larger size particles, which could probably be attributed to biomass burning or anthropogenic activities across the Indo-Chinese Peninsula. The backward trajectories during C2 pass through the burning regions in southeast Asia (e.g., Vietnam, Laos, Cambodia), also supporting this conjecture. Here we assume that the burning regions were based on the fire points provided by MODIS, and the records of burning by local governments were missing. However, more solid evidence is needed since the observation of biomass burning tracers (such as K and levoglucosan) is missing in this campaign.
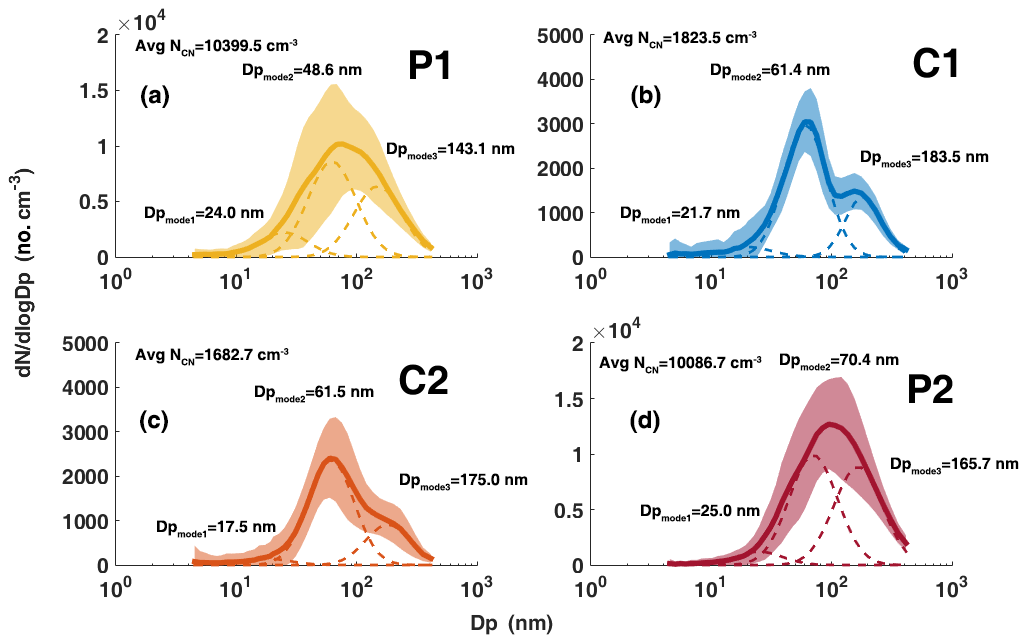
Figure 9The average and SD (shaded area) PNSD, along with trimodal lognormal fitted modes (dashed colored lines). The average NCN during each period and the median size of each lognormal fit are shown.
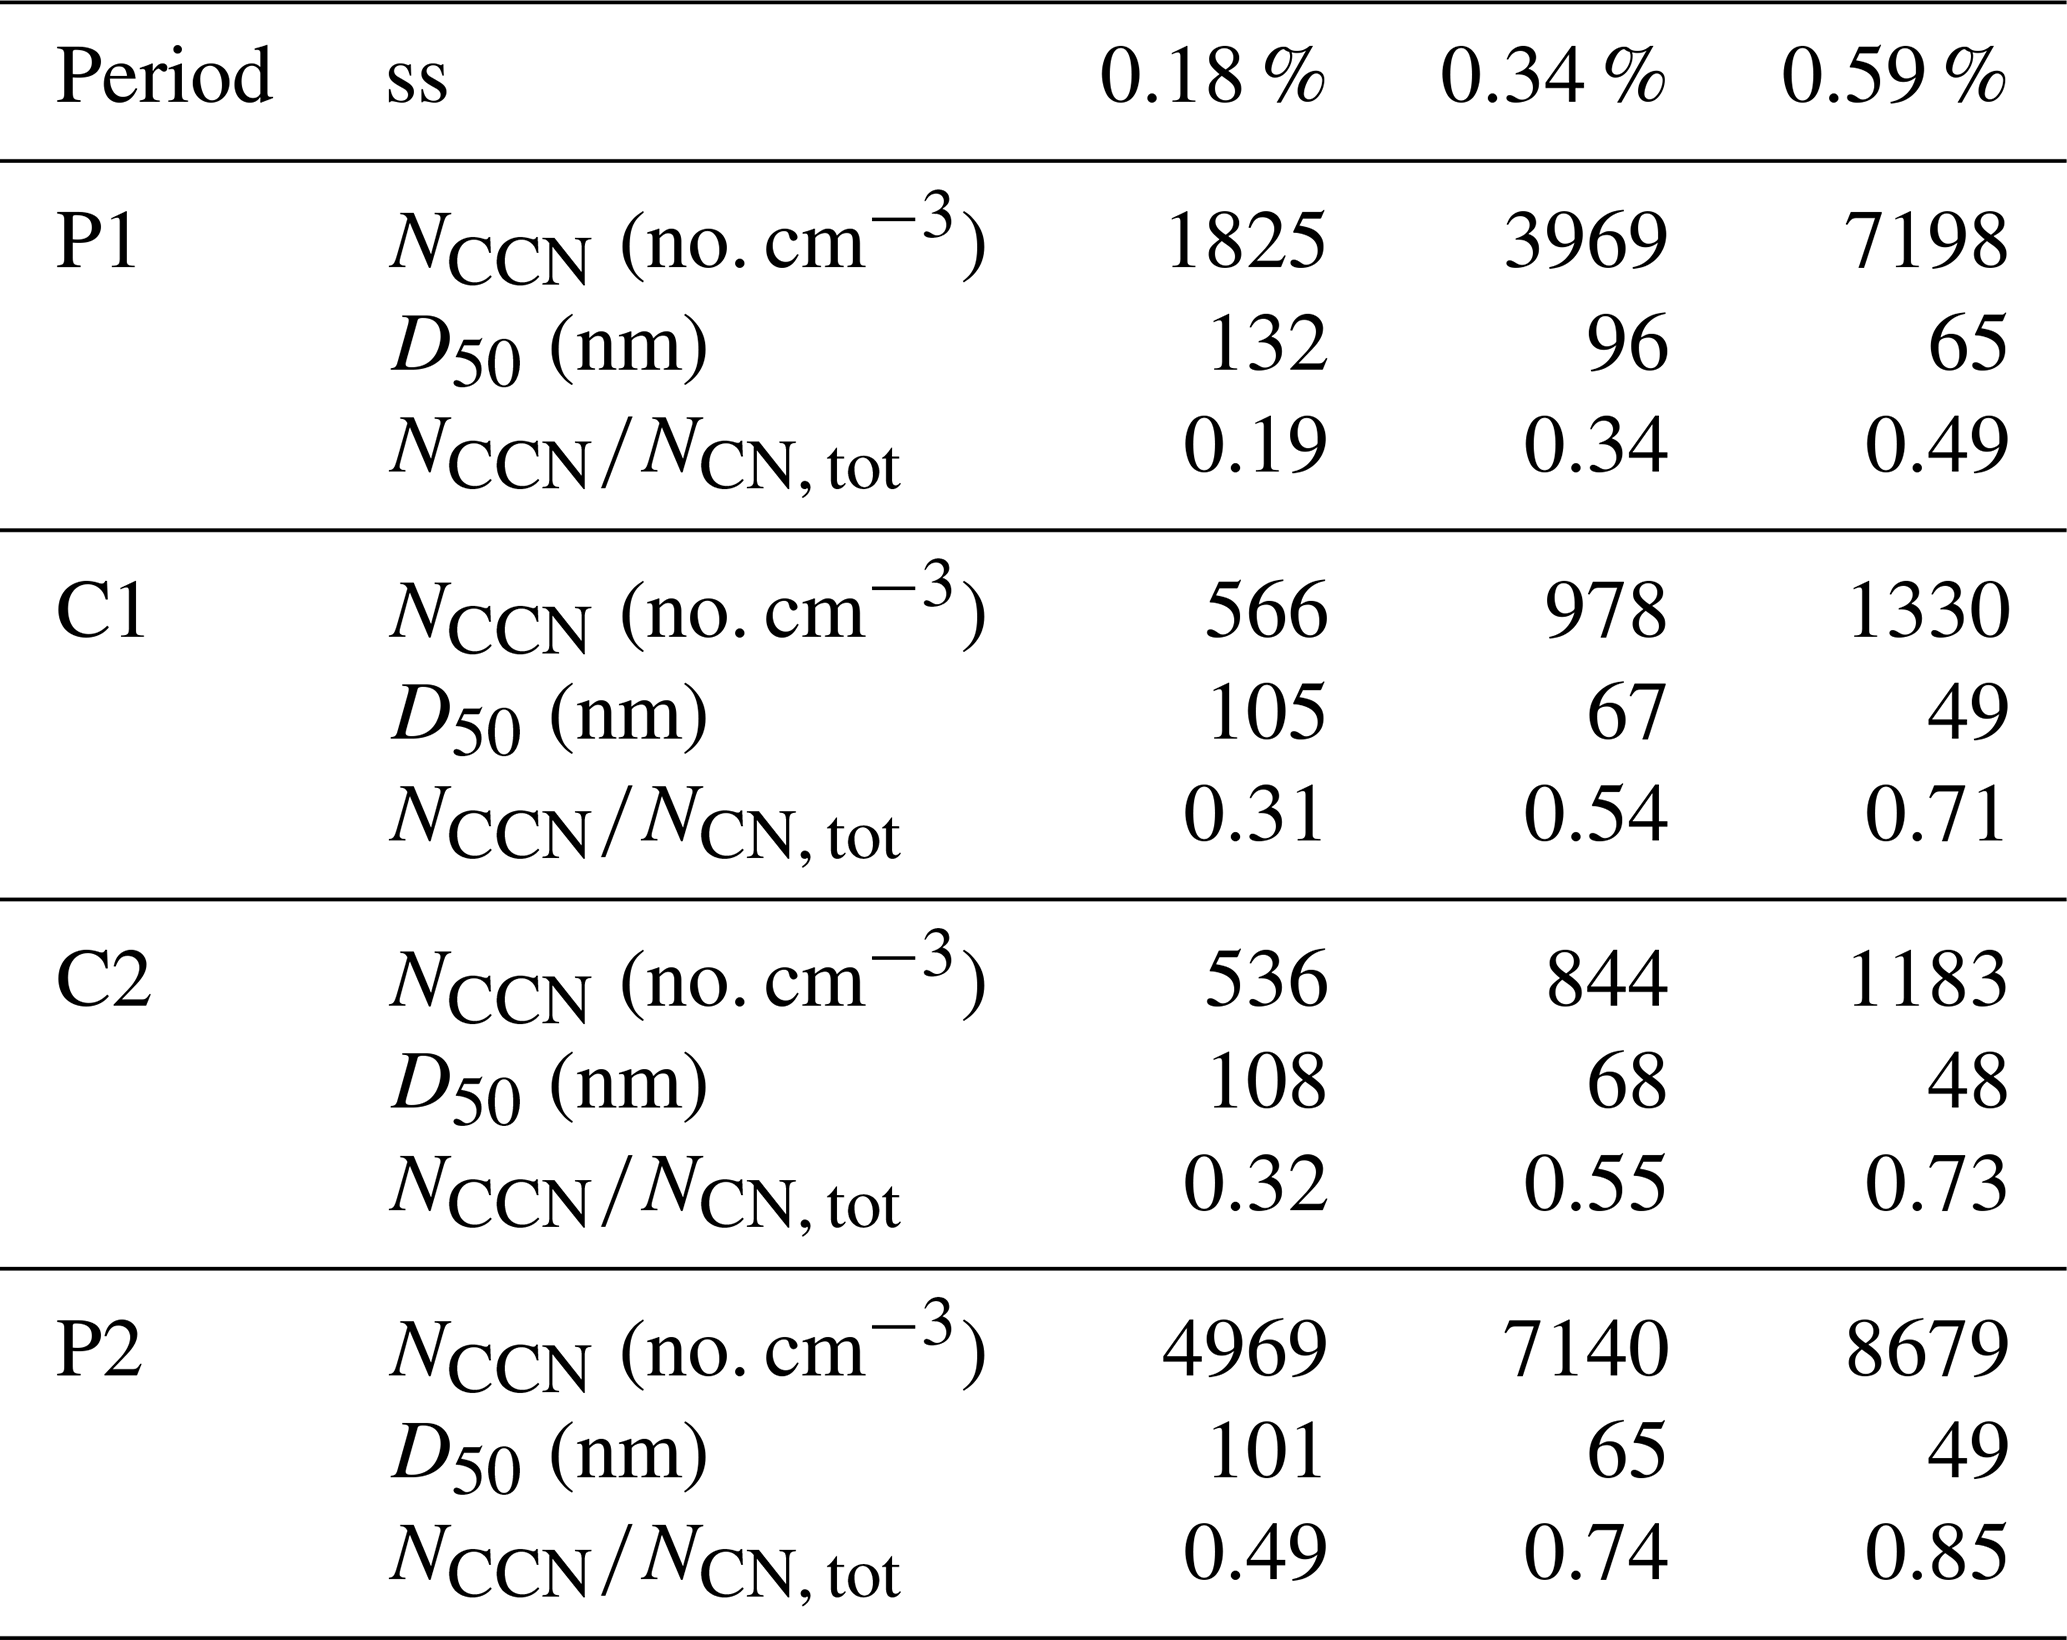
The CCN activity parameters (average NCCN, D50, and NCCN∕NCN, tot at ss = 0.18 %, 0.34 %, and 0.59 %) during each period were summarized in Table 2. The NCCN (ss = 0.34 %) during P1 and P2 were 3969 and 7139 cm−3, much higher than the simulated annual mean values in the northern SCS region (1000–2000 cm−3, ss = 0.4 %; Yu and Luo, 2009). It implies that the continental emissions could have a significant impact on the CCN concentration over this region. Although the mass fractions of chemical composition for C1, C2, and P2 were quite different among those periods, no significant differences of the hygroscopicity parameter κ values were seen, indicating that particles with a size range of 30–120 nm were less affected by long-range transport from the Indo-Chinese Peninsula or inland China continent. The calculated median κ values based on the measured D50 ranged from 0.32 to 0.41, and no significant differences in diameters and periods were observed (Fig. S3), suggesting that the high mass fractions of organics during C2 might be distributed across larger particle sizes (Fig. 8). The D50 values during P2 were smaller at all supersaturation ratios, suggesting higher hygroscopicity and CCN activity during this period. In addition, the NCCN∕NCN, tot and NCCN during P2 was larger than during P1, owing to a larger number fraction of accumulation mode and a higher hygroscopicity. Meanwhile, the median κ values fell in a range of 0.12–0.19 during P1, significantly lower than those during three other periods but similar to the values measured in urban cities (Tan et al., 2013; Jiang et al., 2016; Cai et al., 2018). Such lower values of hygroscopicity were probably contributed from local emissions originating from inland urban cities or heavy-duty ships. More cruise campaigns are hence needed to identify the source origins of marine aerosols over the SCS region.
Table 2Summary of average NCCN, D50, and NCCN∕NCN, tot at 0.18, 0.34, and 0.59 % ss during P1, C1, C2, and P2.
The mixing state and heterogeneity of particles can affect the steepness of the activation curves (Cai et al., 2018). A steeper curve indicates that particles tend to be internally mixed and have a higher similarity in hygroscopicity. The average activation curves at 0.18 % ss during the P1, C1, C2, and P2 periods are shown in Fig. S4. The parameter C (in Eq. 1) can be used to present the steepness of the activation curve. A small C value indicates a steep activation curve. The C values during P1, C1, C2, and P2 periods were −8.5, −14.3, −13.7, and −10.6, respectively. The smooth curve and the largest C value during P1 suggest that particles had a higher degree of external mixing and higher heterogeneity, owing to the local fresh emissions. The C values during the C1 and C2 periods were close and smaller than those in pollution periods, implying that particles during clean periods were more aged and tend to be more internally mixed. The backward trajectories show that the air masses during clean periods were less affected by fresh emissions. The activation curve during the P2 period was smoother than C1 and C2 but steeper than P1, indicating that the particles during this period could be a mixture of aged particles from inland China and fresh particles from onshore emissions.
As an annual routine exercise for the SCS expedition during summertime, the 2018 cruise campaign organized by Sun Yat-sen University is a comprehensive and interdisciplinary field measurement involving the atmosphere, ocean, geology, biology, and chemistry, etc. The measurement includes stationary and navigating observations based on compromise among multiple disciplines. For atmospheric measurements, several key scientific questions are emerging to be addressed over the SCS region, including the sources of air pollutants (gases and particles) in marine atmosphere and impacts of biomass burning from southeastern Asia and of the summer monsoon on atmospheric chemistry and physics in the SCS region. In this study, CCN activity, chemical composition, and particle number size distribution over the northern SCS were measured using several onboard instruments including a ToF-ACSM, a CCNc, an SMPS, and several monitors for trace gases (i.e., SO2, NOx, CO, and O3). On the one hand, lower concentrations of key trace gas pollutants and particle number or mass were observed in the atmosphere of the SCS than in urban areas in the PRD region, consistent with previously reported values for background marine atmosphere. Overall, the chemical composition of NR-PM1 was dominated by sulfate (46 %), and the PNSD showed a unimodal distribution centering at about 60–80 nm, with the hygroscopicity κ values being higher than those in urban areas. On the other hand, characteristics of air pollutants (e.g., concentrations, physical and chemical properties) show substantially variations during the summer monsoon season, depending on source origins. Characteristics similar to continental aerosols were shown when air masses originated from inland continental China or the Indo-Chinese Peninsula possibly via long-range transport, leading to an increase in the organic fraction in chemical composition and a decrease in hygroscopicity which might be attributed to picking up locally emitted and fresh pollutants during transport. Furthermore, low hygroscopicity κ values were shown when the air was affected by local fresh emissions, and in this case the number concentration of particles increased with a decrease in offshore distance. In addition, concentrations of both NOx and CCN concentrations were well correlated with the total concentration of particles. Interestingly, a tropical storm Bebinca was caught in the middle of the campaign, resulting in two relatively clean periods (C1 and C2). These clean periods were likely attributed to strong wind and rainfalls brought by the storm, which could obviously blow away or wash out pollutants in the northern SCS region.
Our results suggest that aerosol properties and trace gas concentration over the northern SCS is complex and substantially variable. The median hygroscopicity κ values of the particles in the northern SCS were measured to be about 0.4, ranging between those in the remote northwestern Pacific Ocean and those in the urban PRD region and implying that particles in the northern SCS could be a mixture of marine background and anthropogenic particles from continents (e.g., the Indo-Chinese Peninsula and inland continental China). Concentrations of aerosol particles and trace gases exhibit a complex temporal and spatial distribution. Concentrations of trace gases (i.e., O3, CO, and NOx except SO2), and particles (i.e., NCN and NCCN) were higher at the beginning (pollution episode: P1) than at the end (pollution episode: P2) of the campaign, implying different source origins for the two periods. At the beginning of the campaign, the air was likely affected by local fresh emissions from Huizhou, leading to an increase in concentrations of both measured trace gases (except SO2) and particles with a decrease in offshore distance. Meanwhile, the concentration of NOx had a good correlation with the NCN, suggesting both might originate from the same sources. Similarly, at the end of the campaign, concentrations of both measured trace gases (except SO2) and particles also increased with a decrease in offshore distance, while because of more larger particles, higher fractions of particles were activated at the end than at the beginning of the campaign. We attributed the source origin during this period to inland continental China via long-range transport with additional local fresh pollutants during the transport process, leading to barely clear patterns for both NCCN∕NCN, tot and D50 at all applied ss (ss = 0.18 %, 0.34 %, and 0.59 %). Furthermore, our results indicate that biomass burning from southeastern Asia may have important impacts on chemical composition and properties of aerosol particles over the northern SCS, in particular, leading to an increase in organic mass fractions and a decrease in hygroscopicity κ values and hence affecting CCN activity in the region. Our study highlights the necessity for performing more intensive ship-based atmospheric measurements in order to better understand marine aerosols and air pollution in the SCS region.
Data from the ship-based cruise measurements are available upon request (Jun Zhao via zhaojun23@mail.sysu.edu.cn).
The supplement related to this article is available online at: https://doi.org/10.5194/acp-20-9153-2020-supplement.
MC, JZ, and HT designed the research. MC and BL performed the ship-based cruise measurements. XC performed sulfate and MSA analysis. MC, JZ, HT, BL, and QS analyzed the data. MC, JZ, and HT wrote the paper with contributions from all co-authors.
The authors declare that they have no conflict of interest.
Additional support from the crew of the vessel and from Southern Marine Science and Engineering Guangdong Laboratory (Zhuhai) is greatly acknowledged. We also thank the two anonymous referees for valuable comments and suggestions.
This research has been supported by the National Key Project of MOST (grant nos. 2017YFC0209502, 2016YFC0201901, 2016YFC2003305), the National Natural Science Foundation of China (grant nos. 91644225, 21577177, 41775117), the Science and Technology Innovation Committee of Guangzhou (grant nos. 201803030010), the “111 plan” Project of China (grant no. B17049), and the Scientific and Technological Innovation Team Project of Guangzhou Joint Research Center of Atmospheric Sciences, China Meteorological Administration (grant no. 201704).
This paper was edited by Fangqun Yu and reviewed by two anonymous referees.
Ackerman, A. S., Kirkpatrick, M. P., Stevens, D. E., and Toon, O. B.: The impact of humidity above stratiform clouds on indirect aerosol climate forcing, Nature, 432, 1014–10177, https://doi.org/10.1038/nature03174, 2004.
Adam, M., Putaud, J. P., Martins dos Santos, S., Dell'Acqua, A., and Gruening, C.: Aerosol hygroscopicity at a regional background site (Ispra) in Northern Italy, Atmos. Chem. Phys., 12, 5703–5717, https://doi.org/10.5194/acp-12-5703-2012, 2012.
Atwood, S. A., Reid, J. S., Kreidenweis, S. M., Blake, D. R., Jonsson, H. H., Lagrosas, N. D., Xian, P., Reid, E. A., Sessions, W. R., and Simpas, J. B.: Size-resolved aerosol and cloud condensation nuclei (CCN) properties in the remote marine South China Sea – Part 1: Observations and source classification, Atmos. Chem. Phys., 17, 1105–1123, https://doi.org/10.5194/acp-17-1105-2017, 2017.
Berg, O. H., Swietlicki, E., and Krejci, R.: Hygroscopic growth of aerosol particles in the marine boundary layer over the Pacific and Southern Oceans during the First Aerosol Characterization Experiment (ACE 1), J. Geophys. Res.-Atmos., 103, 16535–16545, 1998.
Cai, M., Tan, H., Chan, C. K., Mochida, M., Hatakeyama, S., Kondo, Y., Schurman, M. I., Xu, H., Li, F., and Shimada, K.: Comparison of Aerosol Hygroscopcity, Volatility, and Chemical Composition between a Suburban Site in the Pearl River Delta Region and a Marine Site in Okinawa, Aerosol Air Qual. Res., 17, 3194–3208, 2017.
Cai, M., Tan, H., Chan, C. K., Qin, Y., Xu, H., Li, F., Schurman, M. I., Liu, L., and Zhao, J.: The size-resolved cloud condensation nuclei (CCN) activity and its prediction based on aerosol hygroscopicity and composition in the Pearl Delta River (PRD) region during wintertime 2014, Atmos. Chem. Phys., 18, 16419–16437, https://doi.org/10.5194/acp-18-16419-2018, 2018.
Cerully, K. M., Raatikainen, T., Lance, S., Tkacik, D., Tiitta, P., Petäjä, T., Ehn, M., Kulmala, M., Worsnop, D. R., Laaksonen, A., Smith, J. N., and Nenes, A.: Aerosol hygroscopicity and CCN activation kinetics in a boreal forest environment during the 2007 EUCAARI campaign, Atmos. Chem. Phys., 11, 12369–12386, https://doi.org/10.5194/acp-11-12369-2011, 2011.
Choi, Y. and Ghim, Y. S.: Assessment of the clear-sky bias issue using continuous PM10 data from two AERONET sites in Korea, J. Environ. Sci., 53, 151–160, 2017.
Chuang, M.-T., Chang, S.-C., Lin, N.-H., Wang, J.-L., Sheu, G.-R., Chang, Y.-J., and Lee, C.-T.: Aerosol chemical properties and related pollutants measured in Dongsha Island in the northern South China Sea during 7-SEAS/Dongsha Experiment, Atmos. Environ., 78, 82–92, 4, 2013.
Durkee, P. A., Jensen, D., Hindman, E., and Haar, T.: The relationship between marine aerosol particles and satellite-detected radiance, J. Geophys. Res.-Atmos., 91, 4063–4072, 1986.
Feng, Y., Wang, A., Wu, D., and Xu, X.: The influence of tropical cyclone Melor on PM10 concentrations during an aerosol episode over the Pearl River Delta region of China: Numerical modeling versus observational analysis, Atmos. Environ., 41, 4349–4365, 2007.
Fröhlich, R., Cubison, M. J., Slowik, J. G., Bukowiecki, N., Prévôt, A. S. H., Baltensperger, U., Schneider, J., Kimmel, J. R., Gonin, M., Rohner, U., Worsnop, D. R., and Jayne, J. T.: The ToF-ACSM: a portable aerosol chemical speciation monitor with TOFMS detection, Atmos. Meas. Tech., 6, 3225–3241, https://doi.org/10.5194/amt-6-3225-2013, 2013.
Gao, Y., Arimoto, R., Duce, R. A., Chen, L. Q., Zhou, M. Y., and Gu, D. Y.: Atmospheric non-sea-salt sulfate, nitrate and methanesulfonate over the China Sea, J. Geophy. Res.-Atmos., 101, 12601–12611, 1996.
Global Modeling and Assimilation Office (GMAO): MERRA-2 inst3_3d_aer_Nv: 3d,3-Hourly,Instantaneous,Model-Level,Assimilation,Aerosol Mixing Ratio V5.12.4, Goddard Earth Sciences Data and Information Services Center (GES DISC), Greenbelt, MD, USA, https://doi.org/10.5067/LTVB4GPCOTK2 (last access: April 2020), 2015.
Hersey, S. P., Sorooshian, A., Murphy, S. M., Flagan, R. C., and Seinfeld, J. H.: Aerosol hygroscopicity in the marine atmosphere: a closure study using high-time-resolution, multiple-RH DASH-SP and size-resolved C-ToF-AMS data, Atmos. Chem. Phys., 9, 2543–2554, https://doi.org/10.5194/acp-9-2543-2009, 2009.
Hong, J., Häkkinen, S. A. K., Paramonov, M., Äijälä, M., Hakala, J., Nieminen, T., Mikkilä, J., Prisle, N. L., Kulmala, M., Riipinen, I., Bilde, M., Kerminen, V.-M., and Petäjä, T.: Hygroscopicity, CCN and volatility properties of submicron atmospheric aerosol in a boreal forest environment during the summer of 2010, Atmos. Chem. Phys., 14, 4733–4748, https://doi.org/10.5194/acp-14-4733-2014, 2014.
Huang, R.., Zhang, Y., Bozzetti, C., Ho, K.-F., Cao, J.-J., Han, Y., Daellenbach, K. R., Slowik, J. G., Platt, S. M., and Canonaco, F.: High secondary aerosol contribution to particulate pollution during haze events in China, Nature, 514, 218–222, https://doi.org/10.1038/nature13774, 2014.
Huang, S., Wu, Z., Poulain, L., van Pinxteren, M., Merkel, M., Assmann, D., Herrmann, H., and Wiedensohler, A.: Source apportionment of the organic aerosol over the Atlantic Ocean from 53∘ N to 53∘ S: significant contributions from marine emissions and long-range transport, Atmos. Chem. Phys., 18, 18043–18062, https://doi.org/10.5194/acp-18-18043-2018, 2018.
IPCC, 2013: Climate Change 2013: The Physical Science Basis in: Contribution of Working Group I to the Fifth Assessment Report of the Intergovernmental Panel on Climate Change, edited by: Stocker, T. F., Qin, D., Plattner, G.-K., Tignor, M., Allen, S. K., Boschung, J., Nauels, A., Xia, Y., Bex, V., and Midgley P. M., Cambridge University Press, Cambridge, United Kingdom and New York, NY, USA, 1535 pp., https://doi.org/10.1017/CBO9781107415324, 2013.
Jiang, R., Tan, H., Tang, L., Cai, M., Yin, Y., Li, F., Liu, L., Xu, H., Chan, P. W., and Deng, X.: Comparison of aerosol hygroscopicity and mixing state between winter and summer seasons in Pearl River Delta region, China, Atmos. Res., 169, 160–170, 2016.
John, V. O., Holl, G., Allan, R. P., Buehler, S. A., Parker, D. E., and Soden, B. J.: Clear-sky biases in satellite infrared estimates of upper tropospheric humidity and its trends, J. Geophys. Res.-Atmos., 116, D14108, https://doi.org/10.1029/2010JD015355, 2011.
Johnson, B., Shine, K., and Forster, P.: The semi-direct aerosol effect: Impact of absorbing aerosols on marine stratocumulus, Q. J. Roy. Meteor. Soc., 130, 1407–1422, 2004.
Köhler, H.: The nucleus in and the growth of hygroscopic droplets, T. Faraday Soc., 32, 1152–1161, 1936.
Kim, J. H., Yum, S. S., Lee, Y. G., and Choi, B. C.: Ship measurements of submicron aerosol size distributions over the Yellow Sea and the East China Sea, Atmos. Res., 93, 700–714, 2009.
Kleidman, R. G., O'Neill, N. T., Remer, L. A., Kaufman, Y. J., Eck, T. F., Tanré, D., Dubovik, O., and Holben, B. N.: Comparison of Moderate Resolution Imaging Spectroradiometer (MODIS) and Aerosol Robotic Network (AERONET) remote-sensing retrievals of aerosol fine mode fraction over ocean, J. Geophys. Res.-Atmos., 110, D22205, https://doi.org/10.1029/2005JD005760, 2005.
Lehahn, Y., Koren, I., Boss, E., Ben-Ami, Y., and Altaratz, O.: Estimating the maritime component of aerosol optical depth and its dependency on surface wind speed using satellite data, Atmos. Chem. Phys., 10, 6711–6720, https://doi.org/10.5194/acp-10-6711-2010, 2010.
Liu, H. J., Zhao, C. S., Nekat, B., Ma, N., Wiedensohler, A., van Pinxteren, D., Spindler, G., Müller, K., and Herrmann, H.: Aerosol hygroscopicity derived from size-segregated chemical composition and its parameterization in the North China Plain, Atmos. Chem. Phys., 14, 2525–2539, https://doi.org/10.5194/acp-14-2525-2014, 2014.
Lv, Z., Liu, H., Ying, Q., Fu, M., Meng, Z., Wang, Y., Wei, W., Gong, H., and He, K.: Impacts of shipping emissions on PM2.5 pollution in China, Atmos. Chem. Phys., 18, 15811–15824, https://doi.org/10.5194/acp-18-15811-2018, 2018.
Moore, R. H., Nenes, A., and Medina, J.: Scanning Mobility CCN Analysis-A Method for Fast Measurements of Size-Resolved CCN Distributions and Activation Kinetics, Aerosol Sci. Tech., 44, 861–871, 2010.
Mulcahy, J., O'Dowd, C., Jennings, S., and Ceburnis, D.: Significant enhancement of aerosol optical depth in marine air under high wind conditions, Geophys. Res. Lett., 35, L16810, https://doi.org/10.1029/2008GL034303, 2008.
Ovadnevaite, J., Ceburnis, D., Leinert, S., Dall'Osto, M., Canagaratna, M., O'Doherty, S., Berresheim, H., and O'Dowd, C.: Submicron NE Atlantic marine aerosol chemical composition and abundance: Seasonal trends and air mass categorization, J. Geophys. Res.-Atmos., 119, 11850–11863, 2014.
Petters, M. D. and Kreidenweis, S. M.: A single parameter representation of hygroscopic growth and cloud condensation nucleus activity, Atmos. Chem. Phys., 7, 1961–1971, https://doi.org/10.5194/acp-7-1961-2007, 2007.
Pierce, J. R., Leaitch, W. R., Liggio, J., Westervelt, D. M., Wainwright, C. D., Abbatt, J. P. D., Ahlm, L., Al-Basheer, W., Cziczo, D. J., Hayden, K. L., Lee, A. K. Y., Li, S.-M., Russell, L. M., Sjostedt, S. J., Strawbridge, K. B., Travis, M., Vlasenko, A., Wentzell, J. J. B., Wiebe, H. A., Wong, J. P. S., and Macdonald, A. M.: Nucleation and condensational growth to CCN sizes during a sustained pristine biogenic SOA event in a forested mountain valley, Atmos. Chem. Phys., 12, 3147–3163, https://doi.org/10.5194/acp-12-3147-2012, 2012.
Reid, J. S., Hyer, E. J., Johnson, R. S., Holben, B. N., Yokelson, R. J., Zhang, J., Campbell, J. R., Christopher, S. A., Di Girolamo, L., and Giglio, L.: Observing and understanding the Southeast Asian aerosol system by remote sensing: An initial review and analysis for the Seven Southeast Asian Studies (7SEAS) program, Atmos. Res., 122, 403–468, 2013.
Reid, J. S., Lagrosas, N. D., Jonsson, H. H., Reid, E. A., Sessions, W. R., Simpas, J. B., Uy, S. N., Boyd, T. J., Atwood, S. A., Blake, D. R., Campbell, J. R., Cliff, S. S., Holben, B. N., Holz, R. E., Hyer, E. J., Lynch, P., Meinardi, S., Posselt, D. J., Richardson, K. A., Salinas, S. V., Smirnov, A., Wang, Q., Yu, L., and Zhang, J.: Observations of the temporal variability in aerosol properties and their relationships to meteorology in the summer monsoonal South China Sea/East Sea: the scale-dependent role of monsoonal flows, the Madden–Julian Oscillation, tropical cyclones, squall lines and cold pools, Atmos. Chem. Phys., 15, 1745–1768, https://doi.org/10.5194/acp-15-1745-2015, 2015.
Rose, D., Nowak, A., Achtert, P., Wiedensohler, A., Hu, M., Shao, M., Zhang, Y., Andreae, M. O., and Pöschl, U.: Cloud condensation nuclei in polluted air and biomass burning smoke near the mega-city Guangzhou, China – Part 1: Size-resolved measurements and implications for the modeling of aerosol particle hygroscopicity and CCN activity, Atmos. Chem. Phys., 10, 3365–3383, https://doi.org/10.5194/acp-10-3365-2010, 2010.
Savoie, D. L., Arimoto, R., Keene, W. C., Prospero, J. M., Duce, R. A., and Galloway, J. N.: Marine biogenic and anthropogenic contributions to non-sea-salt sulfate in the marine boundary layer over the North Atlantic Ocean, J. Geophy. Res.-Atmos., 107, AAC 3-1–AAC 3-21, https://doi.org/10.1029/2001JD000970, 2002.
Tan, H., Yin, Y., Gu, X., Li, F., Chan, P. W., Xu, H., Deng, X., and Wan, Q.: An observational study of the hygroscopic properties of aerosols over the Pearl River Delta region, Atmos. Environ., 77, 817–826, 2013.
Wang, J., Cubison, M. J., Aiken, A. C., Jimenez, J. L., and Collins, D. R.: The importance of aerosol mixing state and size-resolved composition on CCN concentration and the variation of the importance with atmospheric aging of aerosols, Atmos. Chem. Phys., 10, 7267–7283, https://doi.org/10.5194/acp-10-7267-2010, 2010.
Wu, Z. J., Poulain, L., Henning, S., Dieckmann, K., Birmili, W., Merkel, M., van Pinxteren, D., Spindler, G., Müller, K., Stratmann, F., Herrmann, H., and Wiedensohler, A.: Relating particle hygroscopicity and CCN activity to chemical composition during the HCCT-2010 field campaign, Atmos. Chem. Phys., 13, 7983–7996, https://doi.org/10.5194/acp-13-7983-2013, 2013.
Yu, F. and Luo, G.: Simulation of particle size distribution with a global aerosol model: contribution of nucleation to aerosol and CCN number concentrations, Atmos. Chem. Phys., 9, 7691–7710, https://doi.org/10.5194/acp-9-7691-2009, 2009.
Zhang, M., Wang, Y., Ma, Y., Wang, L., Gong, W., and Liu, B.: Spatial distribution and temporal variation of aerosol optical depth and radiative effect in South China and its adjacent area, Atmos. Environ., 188, 120–128, 2018.
Zhang, X., Zhuang, G., Guo, J., Yin, K., and Zhang, P.: Characterization of aerosol over the Northern South China Sea during two cruises in 2003, Atmos. Environ., 41, 7821–7836, 2007.