the Creative Commons Attribution 4.0 License.
the Creative Commons Attribution 4.0 License.
 | 23 Jan 2020
Significant contribution of organics to aerosol liquid water content in winter in Beijing, China
Xiaoai Jin
Fang Zhang
Weiqi Xu
Xinxin Fan
Guangyu Chen
Jingye Ren
Qiuyan Wang
Maureen Cribb
The aerosol liquid water (ALW) content (ALWC), an important component of atmospheric particles, has a significant effect on atmospheric optical properties, visibility and multiphase chemical reactions. In this study, ALWC is determined from aerosol hygroscopic growth factor (GF) and particle number size distribution (PNSD) measurements and is also simulated by ISORROPIA II, a thermodynamic equilibrium model, with measured aerosol chemical composition data taken at an urban site in Beijing from 8 November to 15 December 2017. Rich measurements made during the experiment concerning virtually all aerosol properties allow us not only to derive the ALWC but also to study the contributions by various species for which little has been done in this region. The simulated ALWC including the contribution of organics and the calculated ALWC are highly correlated (coefficient of determination R2=0.92). The ALWC contributed by organics (ALWCOrg) accounts for 30 %±22 % of the total ALWC during the sampling period. These results suggest a significant contribution of organics to ALWC, which is rather different from previous studies that showed negligible contributions by organics. Our results also show that ALWC correlates well with the mass concentrations of sulfate, nitrate, and secondary organic aerosols (SOAs) (R2=0.66, 0.56 and 0.60, respectively). We further noted that accumulation mode particles play a key role in determining ALWC, dominating among all the aerosol modes. ALWC is an exponential function of ambient relative humidity (RH), whose strong diurnal variation influence the diurnal variation of ALWC. However, there is a 3 h lag between the extremes of ALWC and RH values, due to the diurnal variations in PNSD and aerosol chemical composition. Finally, a case study reveals that ALWCOrg plays an important role in the formation of secondary aerosols through multiphase reactions at the initial stage of a heavy-haze episode.
- Article
(2050 KB) - Full-text XML
-
Supplement
(281 KB) - BibTeX
- EndNote


China has experienced rapid economic developments during the past few decades, resulting in frequent heavy-haze events. Severe air pollution may harm human health and affect the regional climate through aerosol direct and indirect radiation effects (Li et al., 2016; Wu et al., 2016; Wei et al., 2019a, b). However, air pollution formation mechanisms and aerosol climate effects remain highly uncertain due to the complex physical and chemical processes involved (Tao et al., 2012; Wang et al., 2014).
Aerosol liquid water (ALW), a component of atmospheric particles in the atmosphere, exists universally and plays an important role in many atmospheric physical and chemical processes (Nguyen et al., 2016). For example, ALW can influence aerosol optical properties, resulting in increased extinction coefficients, lowered atmospheric visibilities, enhanced aerosol optical depths (AODs) and changes in the direct climatic effect of aerosols (Dougle et al., 1996; Adams and Seinfeld, 2001; Liao et al., 2005; Seinfeld and Pandis, 2006). Secondary aerosols (SAs) are considered to be the main source of particulate pollution during heavy-haze events in China (Huang et al., 2014). Many studies now highlight the significance of aerosol liquid water content (ALWC) in the formation of SA through chemical reactions (e.g., Arellanes et al., 2006; Wang et al., 2016; Cheng et al., 2016). This is because ALW can dilute the absolute concentration of solutes, adjust aerosol acidity and serve as a reactant, resulting in increases in trace gas (e.g., N2O5 and HO2) uptake coefficients (Wahner et al., 1998; Bertram et al., 2009; Abbatt et al., 2012). H. Wang et al. (2017) found that the uptake coefficient of N2O5 can be high, which is related to high ALWC in Beijing, thereby increasing the formation of nitrates. ALW can also speed up the aqueous phase chemical reaction by serving as a reactor for the transformation of SO2 to sulfate (Zheng et al., 2015; Wang et al., 2016; Cheng et al., 2016). Some studies have found that ALWC can facilitate the formation of secondary organic aerosols (SOAs) through aqueous-phase chemistry and photochemistry (Blando and Turpin, 2001; Surratt et al., 2007; Hennigan et al., 2008; Song et al., 2019). Furthermore, observations in Beijing have shown that aqueous-phase processes play a dominant role in the additional formation of oxidized SOAs (Xu et al., 2017). Overall, investigating the formation of SA and haze in northern China requires an examination of ALWC and its factors including aerosol particle number size distribution (PNSD), aerosol chemical composition and ambient related humidity (RH) in this region.
However, directly measuring real-time ALWC is not feasible yet because of technical limitations (Kuang et al., 2018). Four indirect methods have been proposed to calculate real-time ALWC: (1) the aerosol PNSD under dry conditions and ambient RH conditions are first measured, then ALWC is calculated as the difference between dry and ambient aerosol volumes (Stanier et al., 2004); (2) the increased aerosol volume due to water uptake (i.e., ALWC) is calculated according to the measured dry PNSD, size-dependent aerosol hygroscopicity and ambient RH (Kitamori et al., 2009; Bian et al., 2014; Tan et al., 2017); (3) the dry and ambient aerosol volumes are first estimated using the measured aerosol optical enhancement and Ångström exponent, then ALWC is calculated as the difference between dry and ambient aerosol volumes (Kuang et al., 2018); and (4) ALWC is simulated using thermal equilibrium models such as the ISORROPIA thermodynamic model (Nenes et al., 1998), Aerosol Inorganics Model (Wexler and Clegg, 2002), the Simulating Composition of Atmospheric Particles in Equilibrium model (Kim et al., 1993), and the Gibbs Free Energy Minimization model (Ansari and Pandis, 1999) with aerosol chemical composition information as an input.
ALWC mostly depends on aerosol PNSD, chemical composition and ambient RH. Hodas et al. (2014) reported that ALWC in the Po Valley in Italy was driven by locally formed anthropogenic nitrates. The implications for the lifetimes of water-soluble organic compounds and its potential influence on SOA formation were also discussed. Another study also revealed that ALWC in Beijing was driven by secondary inorganic aerosols (SIAs; Wu et al., 2018). Most previous studies have focused on the interaction between inorganic salts and ALWC, but the impact of organic species on ALWC has been ignored to our knowledge (Blando et al., 2001; Surratt et al., 2007; Hennigan et al., 2008; Carlton et al., 2013). A thorough understanding of the association of ALWC with organic aerosols in the atmosphere is lacking.
In this study, ALWC is calculated using the indirect method (2) and simulated using the ISORROPIA II model, i.e., indirect method (4), discussed previously. The effects of inorganic aerosols, organic aerosols, PNSD and ambient RH on ALWC are then investigated separately. We demonstrate the significant contribution of organics to ALWC in Beijing and provide evidence that the ALW contributed by organics serves as a reactor for sulfate and SOA formation.
2.1 Sampling site
The Air Pollution and Human Health (APHH) winter field campaign took place from 8 November to 15 December 2016 at the Chinese Academy of Sciences' Institute of Atmospheric Physics Tower Branch in Beijing. Beijing is located in the northwestern part of the North China Plain, which has experienced rapid economic developments during the last few decades. A large amount of gaseous precursors and other air pollutants are emitted in this region every year, causing serious air pollution problems. The sampling site is located in the northwestern urban area of Beijing (39.97∘ N, 116.37∘ E), between the northern 3rd and 4th Ring Roads and surrounded by restaurants. Traffic and cooking emissions are thus the main pollutants at the site. Aerosols at this site can, therefore, represent anthropogenic aerosols in highly polluted areas well. Sun et al. (2013) and Y. Wang et al. (2017) provide more detailed descriptions of the sampling site.
2.2 Instrumentation
Sampling instruments used during the field campaign included a scanning mobility particle sizer (SMPS) equipped with a long differential mobility analyzer (DMA; model 3081A, TSI) and a condensation particle counter (CPC; model 3772, TSI). A custom-built hygroscopicity tandem differential mobility analyzer (H-TDMA) was installed in an air-conditioned mobile container at ground level. The temperature inside the container was maintained at 20–25 ∘C. A high-resolution aerosol mass spectrometer (HR-AMS) was set up in a sampling room located on a two-story roof, about 25 m north from the container. Sampled air went through a PM2.5 cyclone inlet fixed on the top of the container before entering the instruments. The RH of the sampled air was dried to below 20 % by a dryer system consisting of a tube filled with silica gel and a Nafion dryer (model PD-70T-24ss, Perma Pure Inc., USA). Various meteorological parameters, including wind speed (WS), wind direction (WD), temperature (T), and RH, were measured from a 325 m meteorological tower located ∼20 m west of the container. In this study, all times are reported in Beijing local time (UTC+8 h).
PNSDs with electrical-mobility diameters ranging from 10 to 600 nm were measured by a scanning mobility particle sizer (SMPS) at a 5 min time resolution. PNSDs were extended to diameters ranging from 0.6 to 1 µm by fitting the measured PNSDs with functions consisting of three-mode log-normal distributions (Hussein et al., 2005). Thus generated are PNSDs with a diameter range of 10 nm to 1 µm.
The H-TDMA system developed by the Guangzhou Institute of Tropical and Marine Meteorology measured the size-dependent aerosol hygroscopic growth factor (GF). The H-TDMA system mainly consists of four parts. The first part is a Nafion dryer to keep the RH of sampled air below 20 % and a bipolar neutralizer (soft X-ray, model 3088, TSI Inc.) to equilibrate the particle charge (Wiedensohler et al., 1988). Next, the sampled air passes through the first differential mobility analyzer (DMA1; model 3081L, TSI Inc.) to produce mono-dispersed particles. In this study, the diameters were set to 40, 80, 110, 150 and 200 nm. The sampled air then went through a Nafion humidifier (model PD-70T-24ss, Perma Pure Inc., USA) used to humidify the RH of sampled air to 90 %. The last part of the H-TDMA is the second DMA (same model as the DMA1) and a water-based condensation particle counter (model 3787, TSI Inc.) used to measure the number size distribution of humidified particles in the five selected diameters. Y. Wang et al. (2017) provide a detailed introduction to the H-TDMA system.
Size-resolved non-refractory submicrometer aerosol chemical species, including organics (Org), sulfate (), nitrate (), ammonium () and chloride (Cl−), were measured by the HR-AMS. The sampled air dried by diffusion silica gel dryers was drawn into the HR-AMS through a PM2.5 cyclone inlet to remove coarse particles larger than 2.5 µm. The HR-AMS was calibrated with pure ammonium nitrate following the procedures detailed in Jimenez et al. (2003). Sun et al. (2016b) provide operational details about the HR-AMS.
3.1 ALWC calculations based on H-TDMA measurements
The ALWC is calculated based on measurements of the aerosol GF and particle number size distribution. Briefly, H-TDMA data are first used to derive the size-resolved particle GFs at various RHs. Then ALWC is calculated as the increased aerosol volume due to hygroscopic growth attributed to water uptake.
Chen et al. (2012) showed how to calculate size-resolved particle GFs at different RHs. First, a three-mode log-normal distribution is applied to fit the measured PNSD to produce fitting parameters for each mode. The hygroscopicity parameter (κ) in any mode is assumed to be constant. The H-TDMA-derived size-dependent κ can then be used to deduce the corresponding κ for the nucleation mode, the Aitken mode and the accumulation mode of PNSDs according to the following equation:
where κi refers to the κ of the ith mode and Ni(Dp) refers to the number concentration of particles in the ith mode. According to the κ-Köhler theory (Petters and Kreidenweis, 2007), κ at a certain diameter (Dd) can be calculated as
where RH is the control value by the humidifier in the H-TDMA system, T is the mean room temperature of the container set to 293 K, σs∕a is the surface tension of the solution–air interface assumed to be the same as the surface tension coefficient between water and air (about 0.0728 N m−1 at 293 K), Mw is the molecular weight of water, R is the universal gas constant, ρw is the density of water, and Dd is the diameter of the dry particles. The GF at a given RH is defined as the ratio of the humidified diameter [Dp (RH)] to Dd as
The known κ of each mode derives the size-resolved κ at 90 % RH using Eq. (1). Substituting the size-resolved κ into Eq. (2) results in size-resolved GFs at various RHs. Finally, the volume of ALWC at ambient RH is equal to the increased aerosol volume due to water uptake, i.e., ALWC can be calculated as
where ni refers to the particle number concentration of dry particles for the corresponding particle size range in the ith mode and Dp,i refers to the particle diameter for the corresponding particle size range.
3.2 ALWC simulations based on the ISORROPIA II model
The thermodynamic equilibrium model ISORROPIA II developed by Fountoukis and Nenes (2007) using aerosol chemical composition information from the HR-AMS can simulate ALWC (ALWCISO). The bulk chemical composition was used in the model. However, the ISORROPIA II model only considers the contribution of inorganic species (Ca2+, K+, Mg2+, NH+, Na+, , , Cl− and H2O) on ALWC and neglects the contribution of organics. In this study, the model was set to reverse mode due to the lack of measurements of gaseous ammonia, and the phase state was assumed to be stable in the model calculation. As shown in Fig. S1, the simulated ALWC in stable mode is similar to that in metastable mode (R2=0.99).
According to the model assumptions that the aerosol curvature effect in the κ-Köhler theory is ignored, and the aerosol water uptake has no effect on ambient vapor pressure, the water activity (aw) defined as the effective mole fraction of water is equal to the ambient RH in this model (Seinfeld and Pandis, 2006).
The ALWC can be calculated using the Zdanovskii–Stokes–Robinson (ZSR) mixing rule (Stokes and Robinson, 1966),
where Mi is the molar concentration of the ith species (mol m−3 in air) and m0i(aw) is the corresponding molality of the binary solution of the ith species under the same aw with complex solution. Finally, measured ambient RH and T values as input ALWCISO values under different RH and T conditions can be derived.
3.3 Inferring the contribution of organics to ALWC
According to the κ-Köhler theory and the ZSR mixing rule, κ can also be expressed as the sum of the contributions of each aerosol component.
where εi and κi are the volume fraction and hygroscopicity of the ith species, respectively. Submicrometer aerosols mainly consist of organic and inorganic species (Carbone et al., 2013; Zieger et al., 2017). As mentioned in Sect. 2.2, the HR-AMS measures the mass concentrations of organics and inorganics, including , , and Cl−. The volume fraction of inorganic species can be calculated based on the ion-pairing scheme given by the following equations (Gysel et al., 2007):
where n represents the molar numbers and “min” and “max” are minimum and maximum values, respectively. The κ values of the inorganic species sulfuric acid, ammonium sulfate, ammonium hydrogen sulfate and ammonium nitrate are 1.19, 0.48, 0.56 and 0.58, respectively (Topping et al., 2005; Petters and Kreidenweis, 2007). So the ZSR model can be used to estimate the contribution of inorganic species to the κ value. In this paper, the chloride was not taken into account in ion pairing because its source is hard to determine. This may result in a minor uncertainty in κ calculation. The hygroscopicity parameter of organics (κOrg) can be calculated using the volume fraction of organics, and the total κ value can be derived from the H-TDMA, according to Eq. (7). Finally, ALWC contributed by organic species (ALWCOrg) can be calculated as (Petters and Kreidenweis, 2007)
where mOrg is the organic mass concentration from the AMS (Xu et al., 2015) and ρOrg is the density of organics, taken as 1.4 g cm−3 (Moore et al., 2011; Lathem et al., 2013; Cerully et al., 2015).
4.1 Comparison of calculated and simulated ALWC
The trends in ALWC calculated based on the hygroscopic growth factor and PNSD (ALWCHTDMA) and simulated from the ISORROPIA II model (ALWCISO) are generally consistent. Figure 1a shows that ALWCHTDMA and ALWCISO agree well and that their coefficient of determination (R2) is 0.89. The correlation is especially strong for RH over 90 %. However, for RH below 60 %, ALWCISO is less than ALWCHTDMA and even close to zero in some cases. Bian et al. (2014) and Tan et al. (2017) observed a similar phenomenon in northern and southern China. There are three possible explanations for these results. H-TDMA samples were humidified to 90 % RH during the field campaign, thereby leading to the neglect of the deliquescence process in the ALWCHTDMA calculation. This may lead to an overestimation of ALWCHTDMA for RH below the deliquescence relative humidity (DRH). Second, the assumption of constant κ in each mode may lead to small uncertainty in size-resolved GFs at different RHs, resulting in a small deviation in the ALWC calculation. This may be another reason for the difference between ALWCHTDMA and ALWCISO. In addition, the ISORROPIA II model ignores the effect of aerosol shape and complex organic species on the DRH. Previous studies have suggested that the particle spherical assumption and simplified aerosol chemical species in this model can overestimate the DRH (Seinfeld and Pandis, 2006; Sjogren et al., 2007). So for RH below the simulated DRH (∼60 %), particles may still be dry in the ISORROPIA II model, but they may have been hydrated in the real atmosphere. Therefore, this model underestimates ALWC. The ambient aerosol deliquescent phenomenon is rare in the North China Plain (Kuang et al., 2016). In addition, the ISORROPIA II model cannot simulate water uptake by organics, which can lead to some bias between simulated and calculated ALWCs. As described in Sect. 3.3, ALWCOrg can be inferred and used to discuss differences between ALWCISO and ALWCHTDMA. Figure 1b shows that adding ALWCOrg to ALWCISO leads to a stronger correlation with ALWCHTDMA (R2=0.92). The correlation improves significantly for RH below 60 %. This demonstrates that (1) organic species contribute significantly to ALWC and (2) the underestimation of ALWC by the ISORROPIA II model is also related to the neglect of organic species in the model.
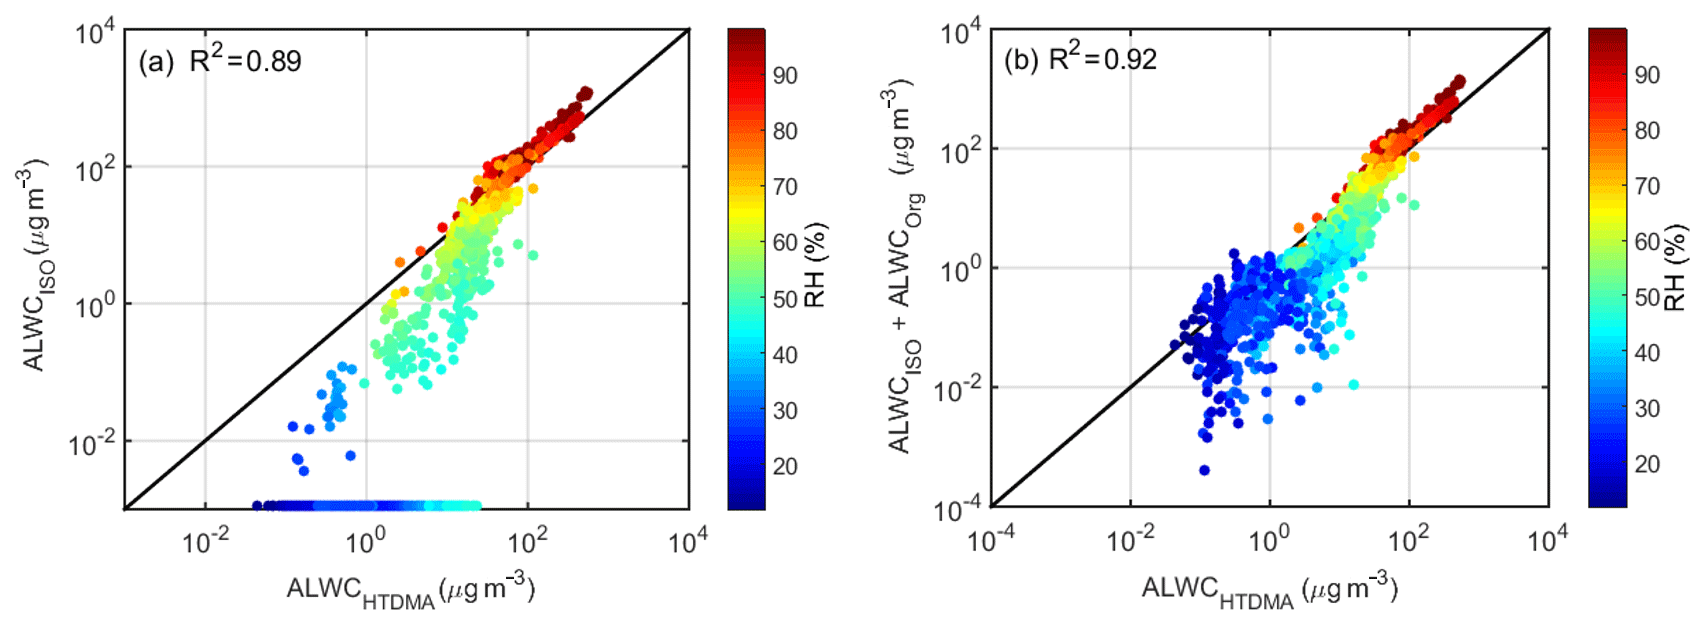
Figure 1Comparison between ALWCHTDMA and (a) ALWCISO and (b) the sum of ALWCISO and ALWCOrg. ALWCHTDMA refers to calculated ALWC based on the measured growth factor and PNSDs; ALWCISO refers to simulated ALWC from the ISORROPIA II model; and ALWCOrg refers to the inferred ALWC contributed by organic species. The coefficient of determination R2 is given in each panel. The color of the dots denotes the ambient RH; the solid line denotes the 1:1 line.
4.2 Impact of different factors on ALWC
4.2.1 Impact of aerosol chemical species on ALWC
Figure 2 shows the characteristics of seven heavy pollution events selected for examination. Figure 2a and c display the time series of WS, WD, and ambient RH. The prevailing wind during the haze episodes was a weak southerly wind that was favorable for bringing in pollutants from the highly populated and industrialized neighboring regions to the sampling site. This is beneficial to the formation and accumulation of SA (Wang et al., 2010; Y. Wang et al., 2017). However, the prevailing winds during the clean events were strong northerly winds that always carried in a clean air mass, resulting in pollutants being quickly removed (Fig. 2c). Note that the PM1 mass concentration decreases somewhat in the evening during haze episodes, following the short-term change of WD from southerly to northerly. This is related to mountain valley breezes in Beijing (Wehner et al., 2008; Gao et al., 2011; Y. Wang et al., 2017). These results demonstrate that heavy-haze episodes have a strong correlation with local wind direction in Beijing.
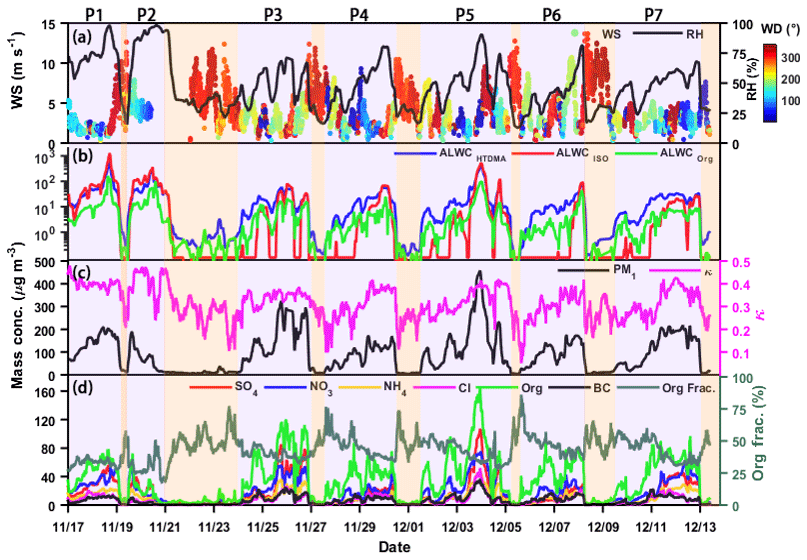
Figure 2Time series of (a) wind speed (WS; left y axis), ambient relative humidity (RH; right y axis) and wind direction (WD; colored dots); (b) ALWCHTDMA (in blue), ALWCISO (in red) and ALWCOrg (in green); (c) PM1 mass concentration (left y axis) and hygroscopicity parameter (κ; right y axis) calculated using the ZSR model described by Eq. (7); and (d) mass concentrations of aerosol species in PM1 (left y axis) and organic aerosol mass fraction (right y axis). Seven polluted episodes (segments of the time series with a purple background) are selected for examination. The date in this figure is in the mm/dd format.
Figure 2a and d show the time series of ambient RH and mass concentrations of aerosol chemical species in PM1. These figures suggest that the increase in inorganic and organic aerosols is synchronous with the increase in ambient RH during the heavy pollution periods (P1–P7). This is likely because of a positive-feedback mechanism driven by Henry's law and thermodynamic equilibrium (Wu et al., 2018). Figure 2b also shows that ALWC continuously increases during the pollution accumulation period. On average, ALWC increases from 8 to 89 µg m−3 as ambient RH increases from 15 % to 80 %, and the inorganic and organic aerosol mass concentrations increase from 15 to 120 µg m−3 and from 12 to 78 µg m−3, respectively. These results imply that the increase in ambient RH and aerosol mass concentration are all important for the increase in ALWC.
Equation (4) also suggests that the absolute value of ALWC is dependent on the value of ambient RH and aerosol chemical composition (i.e., the GF value). To further investigate the impact of chemical composition on ALWC, the impact of RH on ALWC should be accounted for. Previous studies suggest that there is an exponential relationship between ALWC and RH (e.g., Z. Wu et al., 2018). Here, we define the relative ALWC as the ratio of ALWCHTDMA and the function of ambient RH (ebRH). The b is derived according to the relationship between ALWCHTDMA and RH that is fitted by the function y=aebx. Figure 3a shows the relationship between relative ALWC and primary aerosol (PA) or SA mass concentrations. PA consists of primary organic aerosols (POAs) and black carbon (BC), and SA consists of SOA, sulfate and nitrate. The positive matrix factorization (Paatero and Tapper, 1994) was applied on the organic aerosol (OA) spectral matrices to identify POA and SOA. The relative ALWC is highly correlated with SA mass concentrations (R2=0.94) but poorly correlated with PA mass concentrations (R2=0.69). High relative ALWC coincident with high SA mass concentrations suggest that SA plays a key role in the increase in ALWC. This is likely because SA is mainly generated from photochemical reactions in the daytime or reactions at night, making SA highly aged with a hygroscopicity stronger than that of PA (Ervens et al., 2011; Sareen et al., 2017). SA can, therefore, absorb more water vapor than PA in the atmosphere. The enhanced aerosol liquid water induced by SA is further favorable for the formation of SA by speeding up the atmospheric chemical reaction rate and serving as the medium for gas-particle heterogeneous reactions (Wang et al., 2016; Cheng et al., 2016). This further increases the bulk aerosol hygroscopicity. This is also the reason why the inferred κ value based on the ZSR model continuously increases during haze episodes (Fig. 2c).
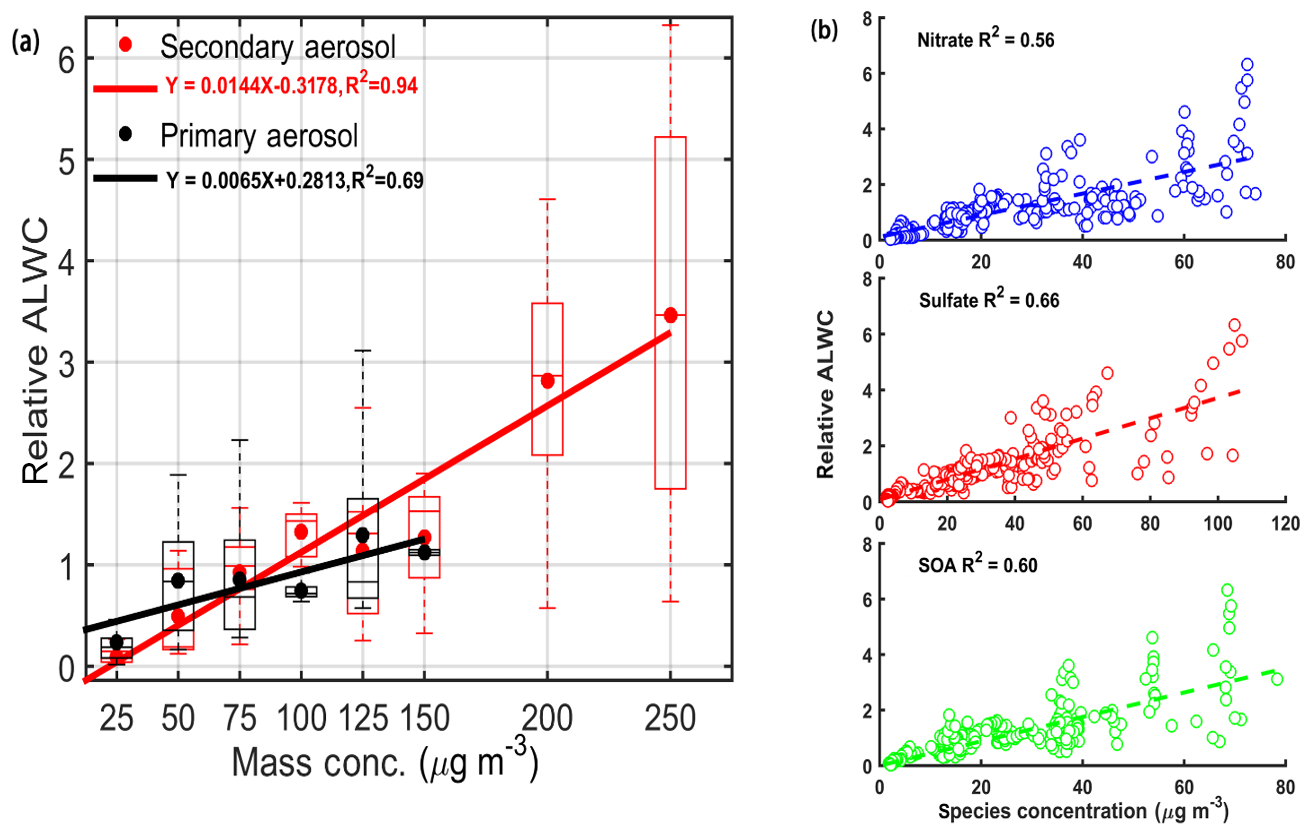
Figure 3The correlation analysis between relative ALWC and (a) primary (in black) and secondary (in red) aerosol mass concentrations and (b) nitrate, sulfate and secondary organic aerosol (SOA) mass concentrations. Shown in (a) are mean relative ALWCs (solid dots) with boxes showing the 25th, 50th and 75th percentiles. The extremities show the 5th and 95th percentiles. The solid lines in (a) and the dashed lines in (b) both represent the corresponding best-fit lines from linear regression.
Secondary aerosols are mainly composed of nitrate, sulfate, ammonium and SOA. To determine which species is the driver for ALWC in Beijing, Fig. 3b shows the correlation analysis between relative ALWC and the mass concentrations of different aerosol chemical species. Relative ALWC and all SIA agree well (R2 equals 0.66 for sulfate and 0.56 for nitrate). It has been reported that ALWC is driven by inorganic salts with both nitrate and sulfate playing key roles in determining ALWC (Wu et al., 2018). ALWC also agrees well with SOA (R2=0.60) in our study. This is unexpected because the hygroscopicity of SOA is relatively lower than that of nitrate and sulfate. Some studies have also suggested that the water uptake of aged organics accounts for only a few percent of the total aerosol water uptake (e.g., Gysel et al., 2007; Engelhart et al., 2011). In our study, the contribution of ALWCOrg to total ALWC is significant, accounting for 30%±22 %. As shown in Fig. 4, the contribution of organics to total ALWC varies strongly. This is likely related with the variation in the mass fraction and hygroscopicity parameter of organics (κorg). The mass concentration of inorganics increases more than that of organics as RH increases, leading to a lower mass fraction of organics in the case of high ambient RH. Figure 4 also shows that the ALWCOrg fraction increases significantly with the increase of κorg. All these help explain a large variation in the ALWCOrg contribution to total ALWC. Considering the distinct ambient RH and κorg between clean and polluted periods, we calculated the respective fraction of ALWCOrg during two periods. There is a higher ALWCOrg fraction (33 %±23 %) during clean periods than during polluted periods (26 %±11 %). Yet, there is little variability of the ALWCOrg fraction during polluted periods. The larger variability in the ALWCOrg fraction during clean periods is likely caused by the highly variable κorg value when the ambient RH is low. In summary, the contribution of organics in total ALWC varies with the variations of the mass fraction of organics and κorg, and this contribution is significant during both clean and polluted periods. Studies of ALWC in Beijing, therefore, cannot neglect ALWCOrg. This is different from the studies in other regions such as in the Po Valley in Italy (Hodas et al., 2014) and the eastern US (Carlton et al., 2013), where the ALWC was found to be only driven by nitrate and sulfate, respectively.
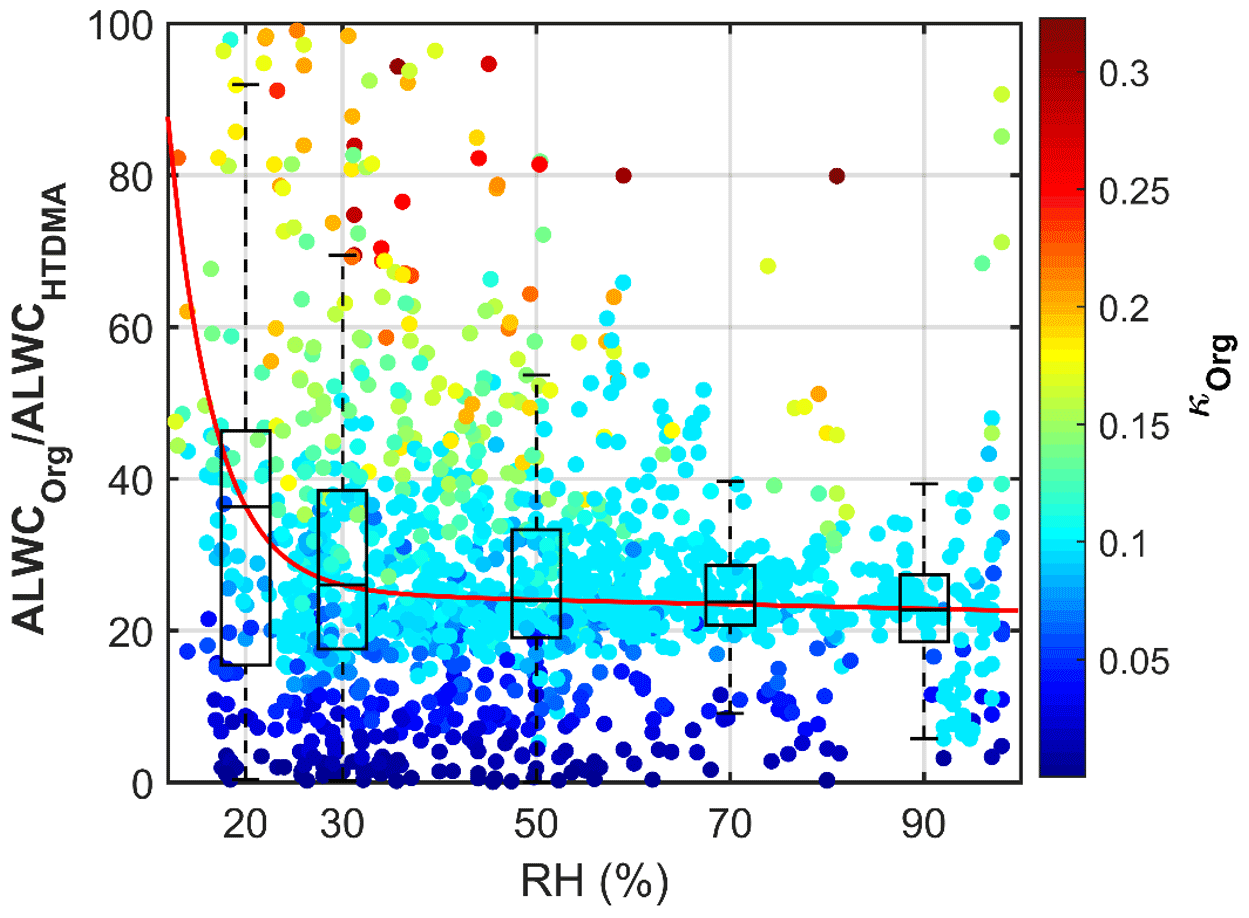
Figure 4The variation of the fraction of ALWCOrg in total ALWC (ALWCHTDMA) with the ambient relative humidity (RH). The color of the dots denotes the hygroscopicity parameter of organics (κOrg). The boxes show the fraction of ALWCOrg with the 25th, 50th and 75th percentiles. The extremities show the 5th and 95th percentiles. The red line shows the fitting curve with the function y=aebx.
An interesting phenomenon is frequently observed at the initial stage of heavy-haze episodes (e.g., P4, P5, P6 and P7). ALWCISO is almost close to 0, but both ALWCHTDMA and ALWCOrg are always larger than 0, and the organic aerosol mass fraction is high at this stage. These observations reveal that at the initial stage of heavy-haze episodes, the ALWC is mostly contributed by organic species. Meanwhile, κ is not very low and increases markedly as the PM1 mass concentration increases, which is unexpected because of the lower hygroscopicity of organic aerosols compared to SIA. Therefore, some highly hygroscopic substance (i.e., SA) must be generated through multiphase chemical reaction at this stage. We propose that the liquid water contributed by organic species provides a reactor for the transformation of gaseous precursors to SA at the initial stages of heavy-haze episodes, increasing the uptake of more liquid water by more SA and further accelerating the formation of heavy haze. Section 4.3 provides a case study to demonstrate this.
4.2.2 Impact of PNSD on ALWC
In addition to aerosol chemical composition, ALWC also depends on PNSD (Bian et al., 2014). PNSD does not influence ALWC directly, but it is an important factor to determine the mass concentration and the distribution of hygroscopic materials. As described in Sect. 3.1, the nucleation mode (< 30 nm), the Aitken mode (30–110 nm) and the accumulation mode (110 nm to 1 µm) (Whitby, 1978; Birmili et al., 2001) are considered in this study. Particles with diameters greater than 1 µm are not considered because although some particles in the coarse mode are water soluble, their contribution on the ALWC is low (e.g., Hussein et al., 2004; Liu et al., 2008; Bian et al., 2014; Tan et al., 2017).
The contributions of nucleation mode, Aitken mode, and accumulation mode particles to ALWCHTDMA are about 1.0 %, 18.0 % and 82.0 %, respectively. Figure 5 shows the correlations between ALWCHTDMA and the volume concentrations of different mode particles and the average contribution of different mode particles to ALWCHTDMA (fALWC) under five different RH conditions. The R2 and fALWC of the nucleation mode particles (left column in Fig. 5) are all less than 0.1 % and 1 %, respectively, under all RH conditions. This is likely because the volume concentration of nucleation mode particles is very low, and most of these small particles are composed of hydrophobic chemical species such as BC and POA. Similarly, the number concentration of Aitken mode particles also shows weak correlations with ALWCHTDMA (R2 < 0.2) under RH < 90 % conditions, but their correlation (R2=0.25) is enhanced significantly under RH > 90 % conditions (middle column of Fig. 5). This is because there are more aged particles in the Aitken mode which can absorb much more water when the ambient RH is higher than 90 %. However, the contribution of the Aitken mode to ALWC ranges from 14 % to 21 % and decreases as RH increases. ALWCHTDMA is strongly correlated to the volume concentration of accumulation mode particles, with R2 and fALWC greater than 0.6 % and 75 %, respectively, under all RH conditions (right column of Fig. 5). Figure 5 also shows that ALWC increases slightly as the volume concentration of accumulation mode particles increases under RH < 70 % conditions (slope < 0.001), but it increases strongly under higher RH conditions, especially under RH > 90 % conditions (slope =0.0041). This is likely because there are more accumulation mode SAs formed due to multiphase chemical reactions under conditions of high ambient RH. Swietlicki et al. (1999) have suggested that the contribution of accumulation mode particles to ALWC is largest for all-mode particles.
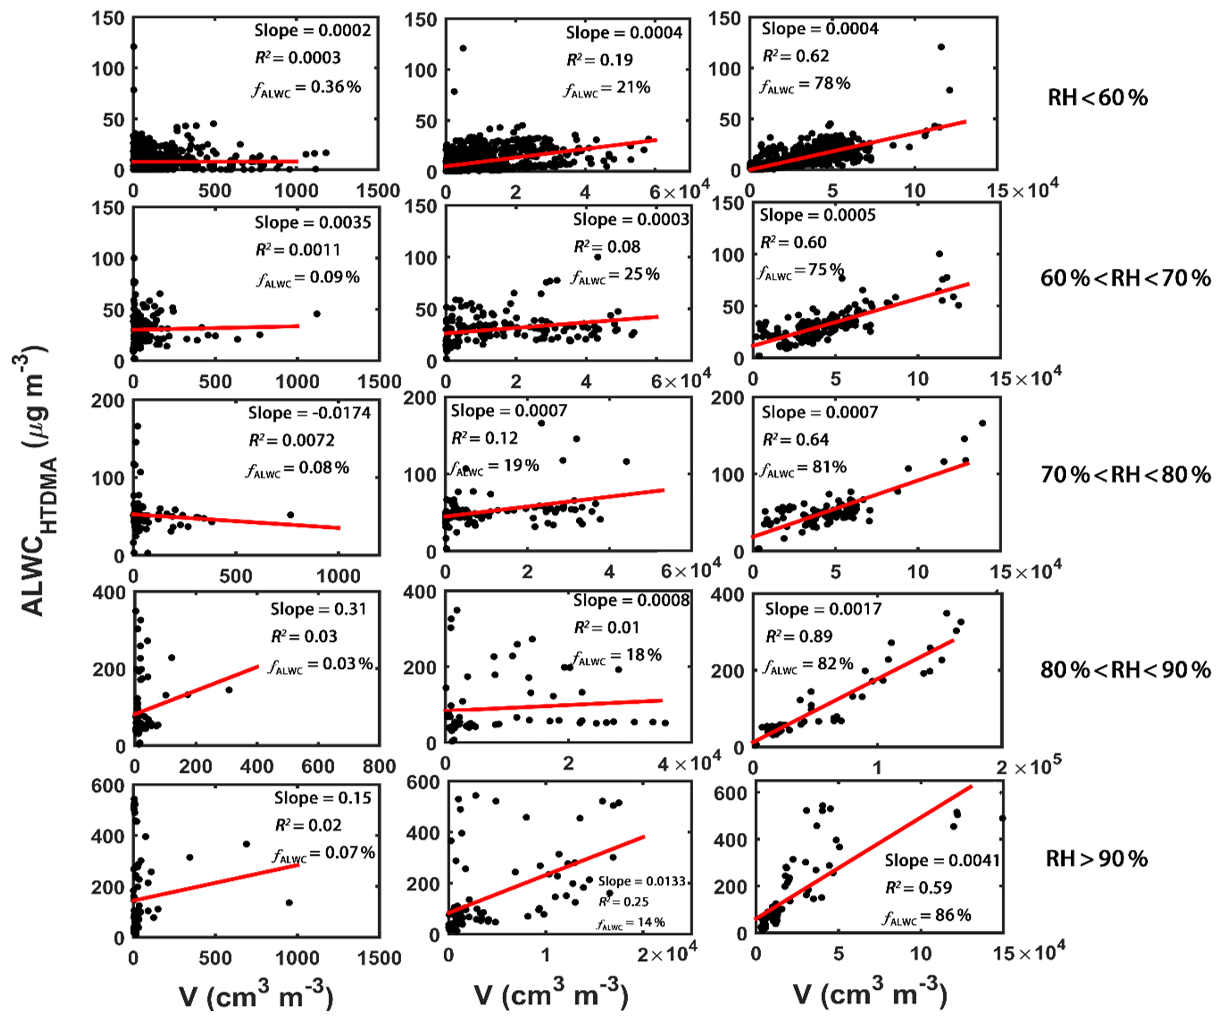
Figure 5The correlation analysis between ALWCHTDMA and the volume concentration of nucleation mode (left column), Aitken mode (middle column) and accumulation mode (right column) particles under different ambient relative humidity (RH) conditions. The average contribution of each mode particles to ALWC under different ambient RH conditions is denoted by fALWC. The red lines represent the best-fit lines from linear regression.
In summary, the contribution of nucleation mode particles to ALWC is very low. The contribution of Aitken mode particles is much higher than nucleation mode particles and decreases with increasing ambient RH. The contribution of accumulation mode particles to ALWC is largest under all RH conditions and increases with increasing ambient RH, thus playing a key role in determining ALWC.
4.2.3 Impact of RH on ALWC
As discussed in Sect. 4.2.1, the absolute value of ALWC has an exponential relationship with ambient RH. Figure 6 shows the relationship between ALWC and RH for different PM1 mass concentration ranges. ALWC increases slowly as RH increases under conditions of lower ambient RH then sharply increases when RH exceeds a critical RH value. This critical RH value is different for different PM1 mass concentrations. This is because the low RH conditions cannot provide enough water for aerosol particles, even though the PNSD is dominated by accumulation mode particles with higher hygroscopicity (Tan et al., 2017). This demonstrates the important influence of RH on ALWC. The lower critical RH value for higher PM1 mass concentrations (∼80 %) suggests that ALWC is easily formed under heavily polluted conditions. This is likely because there are more SA and accumulation mode particles during pollution periods (Sun et al., 2016a; Y. Wang et al., 2017).
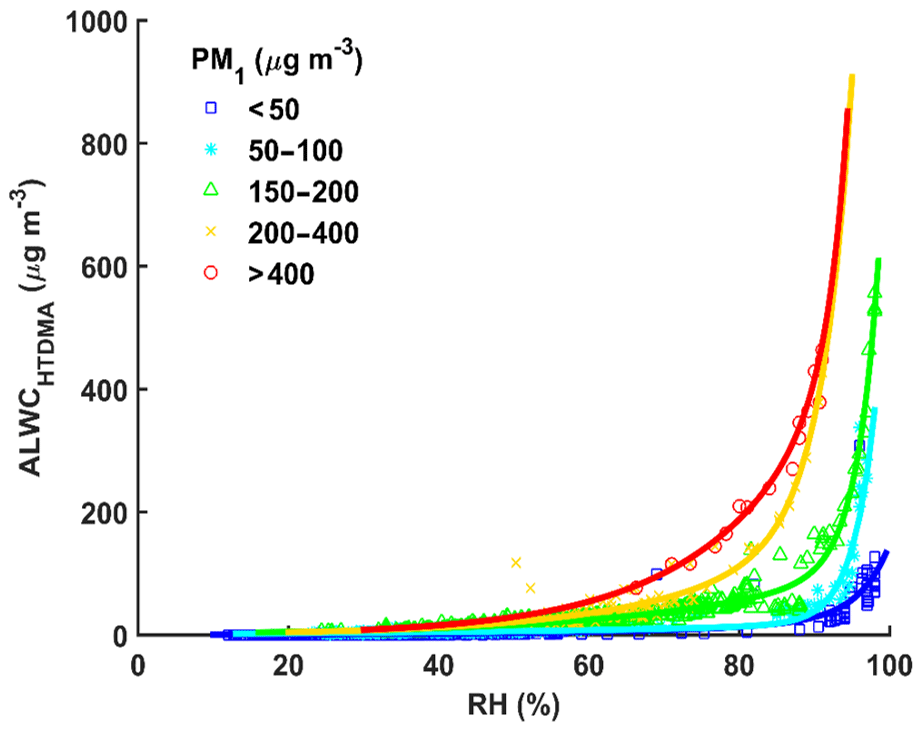
Figure 6The dots show how ALWCHTDMA varies with the ambient relative humidity (RH) for different PM1 mass concentration ranges (colored symbols). The colored curves represent the best-fit lines through the data using the fitting function y=aebx.
Figure 7a shows the diurnal variations of ALWCHTDMA and ambient RH during the sampling period. The extreme ALWCHTDMA values appear at night and during the day, respectively, likely related to the diurnal variations of ambient RH. The elevated ambient RH at night not only increases ALWC through water uptake of particles directly but also facilitates the formation of hydrophilic particulate nitrate through the speeding up of the uptake coefficient of N2O5 (Thornton et al., 2003; Bertram et al., 2009). This can further enhance ALWC. However, although the diurnal variations of ALWCHTDMA and ambient RH are similar, the peak and nadir of ALWCHTDMA (03:00 and 11:00 LT, respectively) appear 3 h earlier than the peak and nadir of ambient RH (06:00 and 14:00 LT, respectively). This time difference is likely related to changes in PNSD. The diurnal variation of PNSD (Fig. 7b) shows that the number concentrations of Aitken and accumulation mode particles begin to decrease quickly at 03:00 LT. ALWC also begins to decrease although the ambient RH increases slightly at that time. In the morning, ALWC decreases sharply following the ambient RH and PNSD changes due to the lifting planetary boundary layer height. ALWC decreases to its minimum value at ∼11:00 LT then begins to increase quickly. However, ambient RH still decreases at that time and reaches its minimum value at ∼14:00 LT. The increase in ALWC is likely associated with changes in aerosol chemical species and PNSD. Figure 7b and c show that there are many newly formed Aitken and accumulation mode particles and that the fraction of SA increases at noon, likely because of strong photochemical reactions. Y. Wang et al. (2017, 2018) have suggested that daytime photochemical reactions are efficient enough to enhance aerosol hygroscopicity and change the aerosol mixing state from external to internal in northern China through the formation of hydrophilic chemical species. All this suggests that ambient RH is not the only determining factor for ALWC. PNSD and aerosol chemical composition are also important for ALWC.
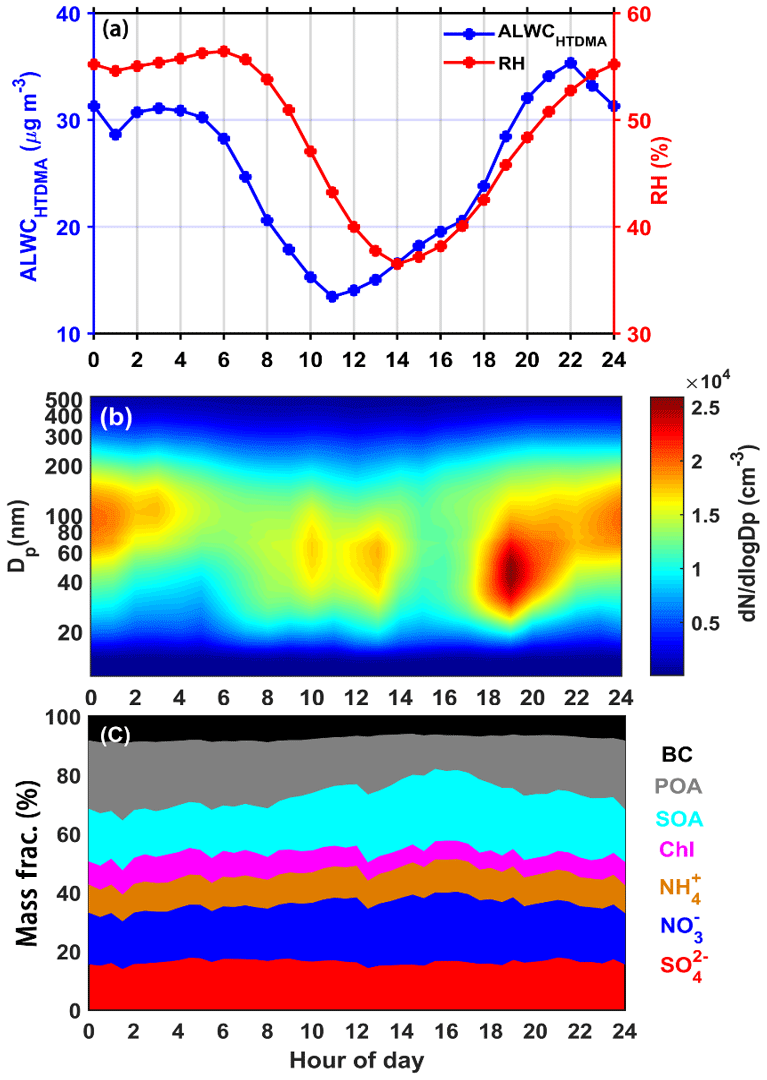
Figure 7Diurnal variations of (a) ALWCHTDMA (in blue) and ambient RH (in red), (b) particle number size distribution, and (c) the mass fraction of different chemical species. The time is in Beijing time.
4.3 A case study on the impact of ALWCOrg on SA formation
As discussed in Sect. 4.2.1, a hypothesis is proposed that ALWCOrg may provide a reactor for the formation of secondary species. To verify this hypothesis, the P4 case shown in Fig. 2 is selected to further analyze the influence of ALWCOrg on the formation of secondary aerosols (Fig. 8). Figure 8a shows the time series of ALWCHTDMA, ALWCISO and ALWCOrg during this case. On 27 November 2017, ALWCISO was close to zero all day long because of the low ambient RH, but both ALWCHTDMA and ALWCOrg were always larger than 0, increasing with the increasing PM1 mass concentration (Fig. 8a). Figure 8a also shows that the fraction of ALWCOrg in ALWCHTDMA was high at the initial stage of this pollution case, but this fraction decreased as haze increased. This case was further divided into three periods (Fig. 8b). Organics were the most abundant chemical species during the first period (64 %), which explains the high fraction of ALWCOrg in ALWCHTDMA at the initial stage of this haze case. The pie charts in Fig. 8b also show that both SOA and SIA (sulfate, nitrate and ammonium) increase from the first to third periods, but POA decreases, likely related to multiphase reactions (i.e., aqueous-phase reactions) due to the enhanced ALWC. Time series of f44 and the fraction of sulfate in total sulfur () are also shown to further illustrate the influence of aqueous-phase reactions on aerosol chemical species. The mass-to-charge ratio (m∕z) 44 signal intensity f44 (mostly contributed by the ion) measured by the AMS can be used as an indicator of the oxidation level in organic species (Mei et al., 2013). The sulfur oxidation ratio (Sun et al., 2006) is defined as
where and n[SO2] refer to the molar concentrations of and SO2, respectively. Figure 8b suggests that f44 and both increase gradually with increasing ALWCHTDMA and PM1 mass concentrations from 27 November to 30 November 2017. This is likely because the increase in ALWC is beneficial to the oxidation of organics and the transformation of SO2 to , implying the importance of aqueous-phase chemical reactions on haze formation in Beijing. The production of secondary organic and inorganic species can further enhance aerosol hygroscopicity, increasing ALWC in the atmosphere. This positive feedback is the reason behind the rapid formation of heavy-haze events in Beijing (Wang et al., 2016). A rapid increase in f44 and was seen during the first period at night on 27 November (shown by green and red arrows in Fig. 8) when organics contributed the most to ALWC. This suggests that ALWC contributed by organics may have played an important role in the formation of secondary species at the initial stage of the pollution event.

Figure 8Time series of (a) ALWCHTDMA (in blue), ALWCISO (in red), ALWCOrg (in green) and RH (right y axis) and (b) the sulfur oxidation ratio (), f44 and PM1 mass concentration (right y axis) during the P4 case in Fig. 2. The pie charts in (b) represent the average chemical compositions of PM1 during three stages of the pollution event (denoted by brown horizontal lines). The red and green arrows in (b) indicate the rapid increase in and f44 at the initial stage. The date in this figure is in the mm/dd format.
In this study, the aerosol liquid water content was calculated using the size-resolved aerosol hygroscopic growth factor and the particle number size distribution measured at a Beijing urban site during the APHH winter campaign (8 November to 15 December 2017). Also done were simulations using the ISORROPIA II model with measured aerosol chemical composition data as input data. During the sampling period, seven heavy-haze episodes were selected to investigate the influence of different factors (PNSD, ambient RH and aerosol chemical composition) on ALWC.
The calculated and simulated ALWC (ALWCHTDMA and ALWCISO) agree well (correlation of determination R2 equals 0.89). However, ALWCISO is much lower than ALWCHTDMA for RH below 60 %, even approaching zero many times. This deviation is in part attributed to the neglect of the contribution of organics to ALWC (ALWCOrg) in the ISORROPIA II model, contradicting previous studies which ignored this contribution. The aerosol hygroscopicity of organics was also derived in this study for use in calculating ALWCOrg. The sum of ALWCISO and ALWCOrg has a higher correlation (R2=0.92) with the calculated ALWC (i.e., ALWCHTDMA), especially for RH below 60 %. This implies that organic aerosols are also an important contributor to ALWC.
PNSD, ambient RH and aerosol chemical composition are all found to affect ALWC significantly. Nucleation mode and Aitken mode particles have little influence on ALWC. Accumulation mode particles play a key role in determining ALWC and dominate among all aerosol modes. ALWC is highly related to the relative humidity when RH exceeds a critical RH value that is different for different PM1 mass concentrations. ALWC varies diurnally with its extreme values appearing at night and during the day, respectively. The diurnal variation of ambient RH explains this. However, there is a 3 h difference between when the extreme ALWC and RH values occur, caused by the diurnal variations in PNSD and aerosol chemical composition.
On average, ALWCOrg accounts for of the total aerosol liquid water during the sampling period. This shows the significant contribution of organic species to ALWC. Our results suggest that ALWC is driven not only by inorganic salts but also by organics in Beijing. This is different from the results obtained in the Po Valley in Italy (Hodas et al., 2014) and the eastern US (Carlton et al., 2013), where the ALWC is driven by nitrate and sulfate, respectively. Finally, one case study was used to study the importance of ALWCOrg on multiphase chemical reactions. ALWCOrg was found to play an important role in the formation of secondary aerosols by speeding up aqueous-phase reactions at the initial stage of the heavy haze. Our study is important for investigating the contribution of organics to ALWC and its importance on haze formation in Beijing.
The observation data are available upon request by contacting Xiaoai Jin at 201631490012@mail.bnu.edu.cn.
The supplement related to this article is available online at: https://doi.org/10.5194/acp-20-901-2020-supplement.
ZL and YW designed the experiment. YW, XJ and WX carried out the experiment and analyzed the data. Other co-authors participated in scientific discussions and suggested additional analyses. XJ and YW prepared the paper with contributions from all co-authors.
The authors declare that they have no conflict of interest.
This research has been supported by the National Key R&D Program of China (grant no. 2017YFC1501702), the National Natural Science Foundation of China (NSFC) (grant nos. 91544217, 41575132, 41675141 and 41705125) and the National Basic Research Program of China 973 (grant no. 2013CB955801). Yuying Wang was supported by the Startup Foundation for Introducing Talent of NUIST.
This paper was edited by Yafang Cheng and reviewed by two anonymous referees.
Abbatt, J. P. D., Lee, A. K. Y., and Thornton, J. A.: Quantifying Trace Gas Uptake to Tropospheric Aerosol: Recent Advances and Remaining Challenges, Chem. Soc. Rev., 41, 6555–6581, https://doi.org/10.1039/c2cs35052a, 2012.
Adams, P. J. and Seinfeld, J. H.: General circulation model assessment of direct radiative forcing by the sulfate-nitrate-ammonium-water inorganic aerosol system, J. Geophys. Res.-Atmos., 106, 1097–1111, https://doi.org/10.1029/2000JD900512, 2001.
Ansari, A. S. and Pandis, S. N.: Prediction of multicomponent inorganic atmospheric aerosol behavior, Atmos. Environ., 33, 745–757, https://doi.org/10.1016/S1352-2310(98)00221-0, 1999.
Arellanes, C., Paulson, S. E., Fine, P. M., and Sioutas, C.: Exceeding of Henry's Law by Hydrogen Peroxide Associated with Urban Aerosols, Environ. Sci. Technol., 40, 4859–4866, https://doi.org/10.1021/es0513786, 2006.
Bertram, T. H. and Thornton, J. A.: Toward a general parameterization of N2O5 reactivity on aqueous particles: the competing effects of particle liquid water, nitrate and chloride, Atmos. Chem. Phys., 9, 8351–8363, https://doi.org/10.5194/acp-9-8351-2009, 2009.
Bian, Y. X., Zhao, C. S., Ma, N., Chen, J., and Xu, W. Y.: A study of aerosol liquid water content based on hygroscopicity measurements at high relative humidity in the North China Plain, Atmos. Chem. Phys., 14, 6417–6426, https://doi.org/10.5194/acp-14-6417-2014, 2014.
Birmili, W., Wiedensohler, A., Heintzenberg, J., and Lehmann, K.: Atmospheric particle number size distribution in central Europe: Statistical relations to air masses and meteorology, J. Geophys. Res.-Atmos., 106, 32005–32018, https://doi.org/10.1029/2000JD000220, 2001.
Blando, J. D. and Turpin, B. J.: Secondary organic aerosol formation in cloud and fog droplets: a literature evaluation of plausibility, Atmos. Environ., 34, 1623–1632, https://doi.org/10.1016/S1352-2310(99)00392-1, 2001.
Carbone, S., Saarikoski, S., Frey, A., Reyes, F., Reyes, P., Castillo, M., Gramsch, E., Oyola, P., Jayne, J., Worsnop, D. R., and Hillamo, R.: Chemical characterization of submicron aerosol particles in Santiago de Chile, Aerosol Air Qual. Res., 13, 462–473, https://doi.org/10.4209/aaqr.2012.10.0261, 2013.
Carlton, A. G. and Turpin, B. J.: Particle partitioning potential of organic compounds is highest in the Eastern US and driven by anthropogenic water, Atmos. Chem. Phys., 13, 10203–10214, https://doi.org/10.5194/acp-13-10203-2013, 2013.
Cerully, K. M., Bougiatioti, A., Hite Jr., J. R., Guo, H., Xu, L., Ng, N. L., Weber, R., and Nenes, A.: On the link between hygroscopicity, volatility, and oxidation state of ambient and water-soluble aerosols in the southeastern United States, Atmos. Chem. Phys., 15, 8679–8694, https://doi.org/10.5194/acp-15-8679-2015, 2015.
Chen, J., Zhao, C. S., Ma, N., Liu, P. F., Göbel, T., Hallbauer, E., Deng, Z. Z., Ran, L., Xu, W. Y., Liang, Z., Liu, H. J., Yan, P., Zhou, X. J., and Wiedensohler, A.: A parameterization of low visibilities for hazy days in the North China Plain, Atmos. Chem. Phys., 12, 4935–4950, https://doi.org/10.5194/acp-12-4935-2012, 2012.
Cheng, Y., Zheng, G., Wei, C., Mu, Q., Zheng, B., Wang, Z., Gao, M., Zhang, Q., He, K., Carmichael, G., Pöschl, U., and Su, H.: Reactive nitrogen chemistry in aerosol water as a source of sulfate during haze events in China, Sci. Adv., 2, e1601530, https://doi.org/10.1126/sciadv.1601530, 2016.
Dougle, P. G., Vlasenko, A. L., Veefkind, J. P., and Brink, H. M. T.: Humidity dependence of the light scattering by mixtures of ammonium nitrate, ammonium sulfate and soot, J. Aerosol. Sci., 27, 513–514, https://doi.org/10.1016/0021-8502(96)00329-1, 1996.
Engelhart, G. J., Hildebrandt, L., Kostenidou, E., Mihalopoulos, N., Donahue, N. M., and Pandis, S. N.: Water content of aged aerosol, Atmos. Chem. Phys., 11, 911–920, https://doi.org/10.5194/acp-11-911-2011, 2011.
Ervens, B., Turpin, B. J., and Weber, R. J.: Secondary organic aerosol formation in cloud droplets and aqueous particles (aqSOA): a review of laboratory, field and model studies, Atmos. Chem. Phys., 11, 11069–11102, https://doi.org/10.5194/acp-11-11069-2011, 2011.
Fountoukis, C. and Nenes, A.: ISORROPIA II: a computationally efficient thermodynamic equilibrium model for K+–Ca2+–Mg2+––Na+–SONO–Cl−–H2O aerosols, Atmos. Chem. Phys., 7, 4639–4659, https://doi.org/10.5194/acp-7-4639-2007, 2007.
Gao, Y., Liu, X., Zhao, C., and Zhang, M.: Emission controls versus meteorological conditions in determining aerosol concentrations in Beijing during the 2008 Olympic Games, Atmos. Chem. Phys., 11, 12437–12451, https://doi.org/10.5194/acp-11-12437-2011, 2011.
Gysel, M., Grosier, J., Topping, D. O., Whitehead, J. D., Bower, J. N., Cubison, M. J., Williams, P. I., Flynn, M. J., McFiggans, G. B., and Coe, H.: Closure study between chemical composition and hygroscopic growth of aerosol particles during TORCH2, Atmos. Chem. Phys., 7, 6131–6144, https://doi.org/10.5194/acp-7-6131-2007, 2007.
Hennigan, C. J., Bergin, M. H., Dibb, J. E., and Weber, R. J.: Enhanced secondary organic aerosol formation due to water uptake by fine particles, Geophys. Res. Lett., 35, L18801, https://doi.org/10.1029/2008GL035046, 2008.
Hodas, N., Sullivan, A. P., Skog, K., Keutsch, F. N., Collett, J. L., Decesari, S., Facchini, M. C., Carlton, A. G., Laaksonen, A., and Turpin, B. J.: Aerosol Liquid Water Driven by Anthropogenic Nitrate: Implications for Lifetimes of Water-Soluble Organic Gases and Potential for Secondary Organic Aerosol Formation, Environ. Sci. Technol., 48, 11127–11136, https://doi.org/10.1021/es5025096, 2014.
Huang, R., Zhang, Y., Bozzetti, C., Ho, K., Cao, J., Han, Y., Daellenbach, K. R., Slowik, J. G., Platt, S. M., and Canonaco, F.: High secondary aerosol contribution to particulate pollution during haze events in China, Nature, 514, 218–222, https://doi.org/10.1038/nature13774, 2014.
Hussein, T., Puustinen, A., Aalto, P. P., Mäkelä, J. M., Hämeri, K., and Kulmala, M.: Urban aerosol number size distributions, Atmos. Chem. Phys., 4, 391–411, https://doi.org/10.5194/acp-4-391-2004, 2004.
Hussein, T., Dal Maso, M., Petäjä, T., Koponen, I. K., Paatero, P., Aalto, P. P., Hämeri, K., and Kulmala, M.: Evaluation of an automatic algorithm for fitting the particle number size distributions, Boreal Environ. Res., 10, 337–355, 2005.
Jimenez, J. L., Jayne, J. T., Shi, Q., Kolb, C. E., Worsnop, D. R., Yourshaw, I., and Morris, J. W.: Ambient aerosol sampling using the aerodyne aerosol mass spectrometer, J. Geophys. Res.-Atmos., 108, 8425, https://doi.org/10.1029/2001JD001213, 2003.
Kim, Y. P., Seinfeld, J. H., and Saxena, P.: Atmospheric gas-aerosol equilibrium I. Thermodynamic model, Aerosol Sci. Tech., 19, 157–181, https://doi.org/10.1080/02786829308959628, 1993.
Kitamori, Y., Mochida, M., and Kawamura, K.: Assessment of the aerosol water content in urban atmospheric particles by the hygroscopic growth measurements in Sapporo, Japan, Atmos. Environ., 43, 3416–3423, https://doi.org/10.1016/j.atmosenv.2009.03.037, 2009.
Kuang, Y., Zhao, C. S., Ma, N., Liu, H. J., Bian, Y. X., Tao, J. C., and Hu, M.: Deliquescent phenomena of ambient aerosols on the North China Plain, Geophys. Res. Lett., 43, 8744–8750, https://doi.org/10.1002/2016GL070273, 2016.
Kuang, Y., Zhao, C. S., Zhao, G., Tao, J. C., Xu, W., Ma, N., and Bian, Y. X.: A novel method for calculating ambient aerosol liquid water content based on measurements of a humidified nephelometer system, Atmos. Meas. Tech., 11, 2967–2982, https://doi.org/10.5194/amt-11-2967-2018, 2018.
Lathem, T. L., Beyersdorf, A. J., Thornhill, K. L., Winstead, E. L., Cubison, M. J., Hecobian, A., Jimenez, J. L., Weber, R. J., Anderson, B. E., and Nenes, A.: Analysis of CCN activity of Arctic aerosol and Canadian biomass burning during summer 2008, Atmos. Chem. Phys., 13, 273–2756, https://doi.org/10.5194/acp-13-2735-2013, 2013.
Li, Z., Lau, W. M., Ramanathan, V., Wu, G., Ding, Y., Manoj, M. G., Liu, J., Qian, Y., Li, J., and Zhou, T.: Aerosol and mon- soon climate interactions over Asia, Rev. Geophys., 54, 866–929, https://doi.org/10.1002/2015RG000500, 2016.
Liao, H. and Seinfeld, J. H.: Global impacts of gas-phase chemistry aerosol interactions on direct radiative forcing by anthropogenic aerosols and ozone, J. Geophys. Res.-Atmos., 110, D18208, https://doi.org/10.1029/2005JD005907, 2005.
Liu, S., Hu, M., Wu, Z., Wehner, B., Wiedensohler, A., and Cheng, Y.: Aerosol number size distribution and new particle formation at a rural/coastal site in Pearl River Delta (PRD) of China, Atmos. Environ., 42, 6275–6283, https://doi.org/10.1016/j.atmosenv.2008.01.063, 2008.
Mei, F., Setyan, A., Zhang, Q., and Wang, J.: CCN activity of organic aerosols observed downwind of urban emissions during CARES, Atmos. Chem. Phys., 13, 12155–12169, https://doi.org/10.5194/acp-13-12155-2013, 2013.
Moore, R. H., Bahreini, R., Brock, C. A., Froyd, K. D., Cozic, J., Holloway, J. S., Middlebrook, A. M., Murphy, D. M., and Nenes, A.: Hygroscopicity and composition of Alaskan Arctic CCN during April 2008, Atmos. Chem. Phys., 11, 11807–11825, https://doi.org/10.5194/acp-11-11807-2011, 2011.
Nenes, A., Pandis, S. N., and Pilinis, C.: ISORROPIA: a new thermodynamic equilibrium model for multiphase multicomponent inorganic aerosols, Aquat. Geochem., 4, 123–152, https://doi.org/10.1023/A:1009604003981, 1998.
Nguyen, T. K. V., Zhang, Q., Jimenez, J. L., Pike, M., and Carlton, A. G.: Liquid Water: Ubiquitous Contributor to Aerosol Mass, Environ. Sci. Tech. Let., 3, 257–263, https://doi.org/10.1021/acs.estlett.6b00167, 2016.
Paatero, P. and Tapper, U.: Positive matrix factorization: a non-negative factor model with optimal utilization of error estimates of data values, Environmetrics, 5, 111–126, https://doi.org/10.1002/env.3170050203, 1994.
Petters, M. D. and Kreidenweis, S. M.: A single parameter representation of hygroscopic growth and cloud condensation nucleus activity, Atmos. Chem. Phys., 7, 1961–1971, https://doi.org/10.5194/acp-7-1961-2007, 2007.
Sareen, N., Waxman, E. M., Turpin, B. J., Volkamer, R., and Carlton, A. G.: Potential of Aerosol Liquid Water to Facilitate Organic Aerosol Formation: Assessing Knowledge Gaps about Precursors and Partitioning, Environ. Sci. Technol., 51, 3327–3335, https://doi.org/10.1021/acs.est.6b04540, 2017.
Seinfeld, H. J. and Pandis, N. S.: Atmospheric Chemistry and Physics: From Air Pollution to Climate Change, John Wiley & Sons, https://doi.org/10.1080/00139157.1999.10544295, 2006.
Sjogren, S., Gysel, M., Weingartner, E., Baltensperger, U., Cubison, M. J., Coe, H., Zardini, A. A., Marcolli, C., Krieger, U. K., and Peter, T.: Hygroscopic growth and water uptake kinetics of two-phase aerosol particles consisting of ammonium sulfate, adipic and humic acid mixtures, J. Aerosol. Sci., 38, 157–171, https://doi.org/10.1016/j.jaerosci.2006.11.005, 2007.
Song, S., Gao, M., Xu, W., Sun, Y., Worsnop, D. R., Jayne, J. T., Zhang, Y., Zhu, L., Li, M., Zhou, Z., Cheng, C., Lv, Y., Wang, Y., Peng, W., Xu, X., Lin, N., Wang, Y., Wang, S., Munger, J. W., Jacob, D. J., and McElroy, M. B.: Possible heterogeneous chemistry of hydroxymethanesulfonate (HMS) in northern China winter haze, Atmos. Chem. Phys., 19, 1357–1371, https://doi.org/10.5194/acp-19-1357-2019, 2019.
Stanier, C. O., Khlystov, A. Y., Chan, W. R., Mandiro, M., and Pandis, S. N.: A method for the in situ measurement of fine aerosol water content of ambient aerosols: The Dry Ambient Aerosol Size Spectrometer (DAASS), Aerosol Sci. Tech., 38, 215–228, https://doi.org/10.1080/02786820390229525, 2004.
Stokes, R. H. and Robinson, R. A.: Interactions in aqueous nonelectrolyte solutions. I. Solute-solvent equilibria, J. Phys. Chem., 70, 2126–2131, https://doi.org/10.1021/j100879a010, 1966.
Sun, Y., Zhuang, G., Tang, A., Wang, Y., and An, Z.: Chemical characteristics of PM2.5 and PM10 in haze-fog episodes in Beijing, Environ. Sci. Technol., 40, 3148–3155, https://doi.org/10.1021/es051533g, 2006.
Sun, Y., Chen, C., Zhang, Y., Xu, W., Zhou, L., Cheng, X., Zheng, H., Ji, D., Jie, L., and Xiao, T.: Rapid formation and evolution of an extreme haze episode in Northern China during winter 2015, Sci. Rep.-UK, 6, 27151, https://doi.org/10.1038/srep27151, 2016a.
Sun, Y., Wang, Z., Wild, O., Xu, W., Chen, C., Fu, P., Du, W., Zhou, L., Zhang, Q., and Han, T.: “APEC Blue”: Secondary Aerosol Reductions from Emission Controls in Beijing, Sci. Rep.-UK, 6, 20668, https://doi.org/10.1038/srep20668, 2016b.
Sun, Y. L., Wang, Z. F., Fu, P. Q., Yang, T., Jiang, Q., Dong, H. B., Li, J., and Jia, J. J.: Aerosol composition, sources and processes during wintertime in Beijing, China, Atmos. Chem. Phys., 13, 4577–4592, https://doi.org/10.5194/acp-13-4577-2013, 2013.
Surratt, J. D., Kroll, J. H., Kleindienst, T. E., Edney, E. O., Claeys, M., Sorooshian, A., Ng, N. L., Offenberg, J. H., Lewandowski, M., Jaoui, M., Flagan, R. C., and Seinfeld, J. H.: Evidence for organosulfates in secondary organic aerosol, Environ. Sci. Technol., 41, 517–527, https://doi.org/10.1021/es062081q, 2007.
Swietlicki, E., Zhou, J., Berg, O. H., Martinsson, B. G., Frank, G., Cederfelt, S. I., Dusek, U., Berner, A., Birmili, W., Wiedensohler, A., Yuskiewicz, B., and Bower, K. N.: A closure study of sub-micrometer aerosol particle hygroscopic behaviour, Atmos. Res., 50, 205–240, https://doi.org/10.1016/S0169-8095(98)00105-7, 1999.
Tan, H., Cai, M., Fan, Q., Liu, L., Li, F., Chan, P. W., Deng, X., and Wu, D.: An analysis of aerosol liquid water content and related impact factors in pearl river delta, Sci. Total Environ., 579, 1822–1830, https://doi.org/10.1016/j.scitotenv.2016.11.167, 2017.
Tao, W. K., Chen, J. P., Li, Z., Wang, C., and Zhang, C.: Impact of Aerosols on Convective Clouds and Precipitation, Rev. Geophys., 50, 1–62, https://doi.org/10.1029/2011RG000369, 2012.
Thornton, J. A., Braban, C. F., Abbatt, J. P. D.: N2O5 hydrolysis on sub-micron organic aerosols: the effect of relative humidity, particle phase, and particle size. Atmos. Chem. Phys., 5 (20), 4593−4603, https://doi.org/10.1039/b307498f, 2003.
Topping, D. O., Mcfiggans, G. B., and Coe, H.: A curved multi-component aerosol hygroscopicity model framework: Part 1 – Inorganic compounds, Atmos. Chem. Phys., 5, 1205–1222, https://doi.org/10.5194/acp-5-1205-2005, 2005.
Wahner, A., Mentel, T. F., Sohn, M., and Stier, J.: Heterogeneous reaction of N2O5 on sodium nitrate aerosol, J. Geophys. Res.-Atmos., 103, 31103–31112, https://doi.org/10.1029/1998JD100022, 1998.
Wang, G., Zhang, R., Gomez, M. E., Yang, L., Levy Zamora, M., Hu, M., Lin, Y., Peng, J., Guo, S., Meng, J., Li, J., Cheng, C., Hu, T., Ren, Y., Wang, Y., Gao, J., Cao, J., An, Z., Zhou, W., Li, G., Wang, J., Tian, P., MarreroOrtiz, W., Secrest, J., Du, Z., Zheng, J., Shang, D., Zeng, L., Shao, M., Wang, W., Huang, Y., Wang, Y., Zhu, Y., Li, Y., Hu, J., Pan, B., Cai, L., Cheng, Y., Ji, Y., Zhang, F., Rosenfeld, D., Liss, P. S., Duce, R. A., Kolb, C. E., and Molina, M. J.: Persistent sulfate formation from London Fog to Chinese haze, P. Natl. Acad. Sci. USA, 113, 13630–13635, https://doi.org/10.1073/pnas.1616540113, 2016.
Wang, H., Lu, K., Chen, X., Zhu, Q., Chen, Q., Guo, S., Jiang, M., Li, X., Shang, D., Tan, Z., Wu, Y., Wu, Z., Zou, Q., Zheng, Y., Zeng, L., Zhu, T., Hu, M., and Zhang, Y.: High N2O5 Concentrations Observed in Urban Beijing: Implications of a Large Nitrate Formation Pathway, Environ. Sci. Tech. Let., 4, 416–420, https://doi.org/10.1021/acs.estlett.7b00341, 2017.
Wang, T., Nie, W., Gao, J., Xue, L. K., Gao, X. M., Wang, X. F., Qiu, J., Poon, C. N., Meinardi, S., Blake, D., Wang, S. L., Ding, A. J., Chai, F. H., Zhang, Q. Z., and Wang, W. X.: Air quality during the 2008 Beijing Olympics: secondary pollutants and regional impact, Atmos. Chem. Phys., 10, 7603–7615, https://doi.org/10.5194/acp-10-7603-2010, 2010.
Wang, Y., Zhang, Q., Jiang, J., Zhou, W., Wang, B., He, K., Duan, F., Zhang, Q., Philip, S., and Xie, Y.: Enhanced sulfate formation during China's severe winter haze episode in January 2013 missing from current models, J. Geophys. Res.-Atmos., 119, 10425–10440, https://doi.org/10.1002/2013JD021426, 2014.
Wang, Y., Zhang, F., Li, Z., Tan, H., Xu, H., Ren, J., Zhao, J., Du, W., and Sun, Y.: Enhanced hydrophobicity and volatility of submicron aerosols under severe emission control conditions in Beijing, Atmos. Chem. Phys., 17, 5239–5251, https://doi.org/10.5194/acp-17-5239-2017, 2017.
Wang, Y., Li, Z., Zhang, Y., Du, W., Zhang, F., Tan, H., Xu, H., Fan, T., Jin, X., Fan, X., Dong, Z., Wang, Q., and Sun, Y.: Characterization of aerosol hygroscopicity, mixing state, and CCN activity at a suburban site in the central North China Plain, Atmos. Chem. Phys., 18, 11739–11752, https://doi.org/10.5194/acp-18-11739-2018, 2018.
Wehner, B., Birmili, W., Ditas, F., Wu, Z., Hu, M., Liu, X., Mao, J., Sugimoto, N., and Wiedensohler, A.: Relationships between sub micrometer particulate air pollution and air mass history in Beijing, China, 2004–2006, Atmos. Chem. Phys., 8, 6155–6168, https://doi.org/10.5194/acp-8-6155-2008, 2008.
Wei, J., Huang, W., Li, Z., Xue, W., Peng, Y., Sun, L., and Cribb, M.: Estimating 1-km-resolution PM2.5 concentrations across China using the space-time random forest approach, Remote Sens. Environ., 231, 1–14, https://doi.org/10.1016/j.rse.2019.111221, 2019a.
Wei, J., Li, Z., Guo, J., Sun, L., Huang, W., Xue, W., Fan, T, and Cribb, M.: Satellite-derived 1-km-resolution PM1 concentrations from 2014 to 2018 across China, Environ. Sci. Technol., 53, 13265–13274, https://doi.org/10.1021/acs.est.9b03258, 2019b.
Wexler, A. S. and Clegg, S. L.: Atmospheric aerosol models for systems including the ions H+, , Na+, , , Cl−, Br−, and H2O, J. Geophys. Res.-Atmos., 107, ACH 14-1–ACH 14-14, https://doi.org/10.1029/2001JD000451, 2002.
Whitby, K. T.: The physical characteristics of sulfur aerosols, Atmos. Environ., 12, 135–159, https://doi.org/10.1016/j.atmosenv.2007.10.057, 1978.
Wiedensohler A.: An approximation of the bipolar charge distribution for particles in the submicron size range, J. Aerosol Sci., 19, 387–389, https://doi.org/10.1016/0021-8502(88)90278-9, 1988.
Wu, G. X., Li, Z. Q., Fu, C. B., Zhang, X. Y., Zhang, R. Y., Zhang, R. H., Zhou, T. J., Li, J. P., Li, J. D., and Zhou, D. G.: Advances in studying interactions between aerosols and monsoon in China, Sci. China Earth Sci., 59, 1–16, https://doi.org/10.1007/s11430-015-5198-z, 2016.
Wu, Z., Wang, Y., Tan, T., Zhu, Y., Li, M., Shang, D., Wang, H., Lu, K., Guo, S., Zeng, L., and Zhang, Y.: Aerosol liquid water driven by anthropogenic inorganic salts: implying its key role in the haze formation over north china plain, Environ. Sci. Tech. Let., 5, 160–166, https://doi.org/10.1021/acs.estlett.8b00021, 2018.
Xu, L., Guo, H., Boyd, C. M., Klein, M., Bougiatioti, A., Cerully, K. M., Hite, J. R., Isaacman-VanWertz, G., Kreisberg, N. M., Knote, C., Olson, K., Koss, A., Goldstein, A. H., Hering, S. V., de Gouw, J., Baumann, K., Lee, S.-H., Nenes, A., Weber, R. J., and Ng, N. L.: Effects of anthropogenic emissions on aerosol formation fromisoprene and monoterpenes in the southeastern United States, P. Natl. Acad. Sci. USA, 112, 37–42, https://doi.org/10.1073/pnas.1417609112, 2015.
Xu, W., Han, T., Du, W., Wang, Q., Chen, C., Zhao, J., Zhang, Y., Li, J., Fu, P., Wang, Z., Worsnop, D. R., and Sun, Y.: Effects of Aqueous-Phase and Photochemical Processing on Secondary Organic Aerosol Formation and Evolution in Beijing, China, Environ. Sci. Tech. Let., 51, 762–770, https://doi.org/10.1021/acs.est.6b04498, 2017.
Zheng, B., Zhang, Q., Zhang, Y., He, K. B., Wang, K., Zheng, G. J., Duan, F. K., Ma, Y. L., and Kimoto, T.: Heterogeneous chemistry: a mechanism missing in current models to explain secondary inorganic aerosol formation during the January 2013 haze episode in North China, Atmos. Chem. Phys., 15, 2031–2049, https://doi.org/10.5194/acp-15-2031-2015, 2015.
Zieger, P., Väisänen, O., Corbin, J. C., Partridge, D. G., Bastelberger, S., Mousavi-Fard, M., Rosati, B., Gysel, M., Krieger, U. K., Leck, C., Nenes, A., Riipinen, I., Virtanen, A., and Salter, M. E.: Revising the hygroscopicity of inorganic sea salt particles, Nat. Commun., 8, 15883, https://doi.org/10.1038/ncomms15883, 2017.