the Creative Commons Attribution 4.0 License.
the Creative Commons Attribution 4.0 License.
 | 27 Jul 2020
Cloudy-sky contributions to the direct aerosol effect
Bjørn H. Samset
Christian W. Mohr
Kari Alterskjær
Yves Balkanski
Nicolas Bellouin
Mian Chin
James Haywood
Øivind Hodnebrog
Stefan Kinne
Guangxing Lin
Marianne T. Lund
Joyce E. Penner
Michael Schulz
Nick Schutgens
Ragnhild B. Skeie
Philip Stier
Toshihiko Takemura
Kai Zhang
The radiative forcing of the aerosol–radiation interaction can be decomposed into clear-sky and cloudy-sky portions. Two sets of multi-model simulations within Aerosol Comparisons between Observations and Models (AeroCom), combined with observational methods, and the time evolution of aerosol emissions over the industrial era show that the contribution from cloudy-sky regions is likely weak. A mean of the simulations considered is 0.01±0.1 W m−2. Multivariate data analysis of results from AeroCom Phase II shows that many factors influence the strength of the cloudy-sky contribution to the forcing of the aerosol–radiation interaction. Overall, single-scattering albedo of anthropogenic aerosols and the interaction of aerosols with the short-wave cloud radiative effects are found to be important factors. A more dedicated focus on the contribution from the cloud-free and cloud-covered sky fraction, respectively, to the aerosol–radiation interaction will benefit the quantification of the radiative forcing and its uncertainty range.
- Article
(1454 KB) - Full-text XML
- BibTeX
- EndNote


The radiative forcing (RF) of anthropogenic aerosols in the atmosphere due to the aerosol–radiation interaction – RFari (earlier denoted as direct aerosol effect) – was assessed as −0.35 [−0.85 to +0.15] W m−2 in the Fifth Assessment Report (AR5) by the Intergovernmental Panel on Climate Change (IPCC) (Boucher et al., 2013). The AR5 uncertainty range is even slightly wider than in the Fourth Assessment Report (Forster et al., 2007). Despite major progress in the understanding of atmospheric aerosol composition and almost 2 decades of multi-aerosol type model simulations, little progress had been made in reducing the large uncertainty in this number, until recently where Bellouin et al. (2020) estimate a range of −0.45 to −0.05 W m−2. Bellouin et al. estimate RFari from normalized clear-sky radiative effect by aerosol optical depth (AOD) and multiply this by an assessment of anthropogenic AOD. No direct simulations were used to calculate RFari in regions of clouds.
One reason for the larger uncertainty range in AR5 compared to AR4 was the enhanced uncertainty and magnitude of RFari of black carbon (BC) (Boucher et al., 2013). Bond et al. (2013) indicated that emission of BC was too low in the inventories applied in climate models and therefore scaled RFari from models to observed AERONET (Aerosol Robotic Network) absorption aerosol optical depth (AAOD) retrievals. More recently it has been suggested that AAOD data from AERONET may have a sampling bias due to sites being located close to emission source regions (Wang et al., 2018) but uncertain in magnitude (Schutgens, 2020) and that most global aerosol models may have a bias towards too much BC in the middle and upper troposphere (Kipling et al., 2013; Samset et al., 2014; Wang et al., 2014). Both of these factors indicate a BC RFari that is too strong in Bond et al. (2013). However, the most recent estimates of emission from fossil and biofuel BC (Hoesly et al., 2018) is much higher than used in previous global modelling (Lamarque et al., 2010). These new findings indicate that the BC RFari may be stronger than what was given in some of the multi-model global aerosol modelling exercises (Myhre et al., 2013a; Schulz et al., 2006) but likely weaker than estimated in Bond et al. (2013). The uncertainties in RFari are also large for other aerosol species. For nitrate (Bian et al., 2017), the abundance is particularly uncertain, and for organic aerosols, uncertainties are large both due to abundance (Tsigaridis et al., 2014) and the optical properties, particularly for brown carbon (Samset et al., 2018).
A further complication when estimating RFari is the atmospheric mix of scattering and absorbing aerosols. Since RFari is dependent on aerosol optical properties and the underlying albedo (Haywood and Shine, 1997), it is therefore also very dependent on where the aerosols are located relative to clouds (Takemura et al., 2002). Absorbing aerosols above clouds have a strong positive RFari (Chand et al., 2009; Keil and Haywood, 2003), but it becomes considerably weaker if the aerosols are located below clouds (Takemura et al., 2002). Scattering aerosols above or below clouds may enhance the reflection of solar radiation in conditions of thin clouds. The all-sky RFari can be separated into contributions from clear- and cloudy-sky portions:
where RFariclear and RFaricloud are the clear-sky and cloudy-sky portion to RFariallsky, respectively. RFariclear and RFaricloud can further be described as and , where AC is cloud fraction, RFaritotal-clear is simulations excluding all clouds and RFaritotal-cloud is the aerosol radiative effect assuming the whole grid is covered by clouds. All three variables vary as a function of longitude, latitude and time. RFari is the initial perturbation to top-of-the-atmosphere (TOA) radiative fluxes (the instantaneous RF which for aerosol is very similar to RF). Rapid adjustments from short-wave absorption by aerosols, mostly BC, may alter atmospheric temperatures, water vapour and clouds. The sum of RFari and rapid adjustments is denoted effective radiative forcing (Boucher et al., 2013; Myhre et al., 2013b; Sherwood et al., 2015). The rapid adjustment of absorbing aerosols can be strong and may counteract RFari substantially (Smith et al., 2018). Since RFari includes no rapid adjustments, AC is constant in simulations of RFariclear and RFaricloud. Oikawa et al. (2013, 2018) provide estimates of all-sky, clear-sky and cloudy-sky radiative effect of aerosols in different regions based on satellite retrievals of clouds and aerosols. These studies further describe large differences resulting from whether aerosols are below or above clouds. Lacagnina et al. (2017) and Zhang et al. (2016) found large regional variation in the radiative effect of aerosols above clouds. Note that the above-mentioned studies investigate the present, total aerosol abundance which consists of anthropogenic and natural aerosols, whereas in terms of RFari only, the anthropogenic aerosols are considered. Anthropogenic aerosols are changes to the atmospheric composition since pre-industrial times. Matus et al. (2019) combined satellite-derived aerosol radiative effect with model simulations of anthropogenic aerosol to make an estimate of RFari.
The aim of the present study is to provide insight into factors determining RFaricloud and thus the contribution from cloudy-sky regions to RFari from combining global models and observation-based approaches. We present estimates of this quantity from several global studies, and we use multivariate data analysis to provide insight into the core factors causing the diversity among models.
2.1 Global estimates of cloudy-sky contribution to RFari
The models, experiments and RFari from Aerosol Comparisons between Observations and Models (AeroCom) Phase I and II are documented in detail by Schulz et al. (2006) and Myhre et al. (2013a), respectively. We also analyse the historical evolution of RFari due to anthropogenic aerosols using output from a series of OsloCTM3 simulations (Lund et al., 2018) with emissions from the Community Emission Data System (CEDS) (Hoesly et al., 2018) inventory from the year 1750 to 2014. The OsloCTM3 is a global three-dimensional chemistry-transport model driven by 3-hourly meteorological forecast data.
The analysis is further supplemented by variables from Eq. (1) extracted from Myhre (2009), who presented results from OsloCTM2 and an observation-based method to explain the difference in all-sky RFari between observation-based and global aerosol model approaches. The model simulations were made to investigate several assumptions on aerosol optical properties and impacts of assumptions related to missing data and change in industrial-era aerosol concentration for the observational method. The Max Planck Aerosol Climatology (MACv2) method combines aerosol column optical properties for fine-mode and coarse-mode sizes (of an AeroCom Phase I model median regionally adjusted by AERONET/MAN – Maritime Aerosol Network – monthly statistics) with MODIS (Moderate Resolution Imaging Spectroradiometer) surface albedo data, ISCCP (International Satellite Cloud Climatology Project) cloud properties and vertical scaling by size mode from 20 years of ECHAM-HAM aerosol simulations. The anthropogenic properties is defined as a fraction of the fine mode, where the fine-mode AOD scaling factor is prescribed from AeroCom Phase I simulations (Kinne, 2019a, b).
The cloudy-sky contribution to all-sky RFari is calculated from daily or monthly diagnostics of all-sky RFari, RFariclear and AC. RF is taken at the top of the atmosphere and all estimates are from pre-industrial times to present.
2.2 Multivariate data analysis
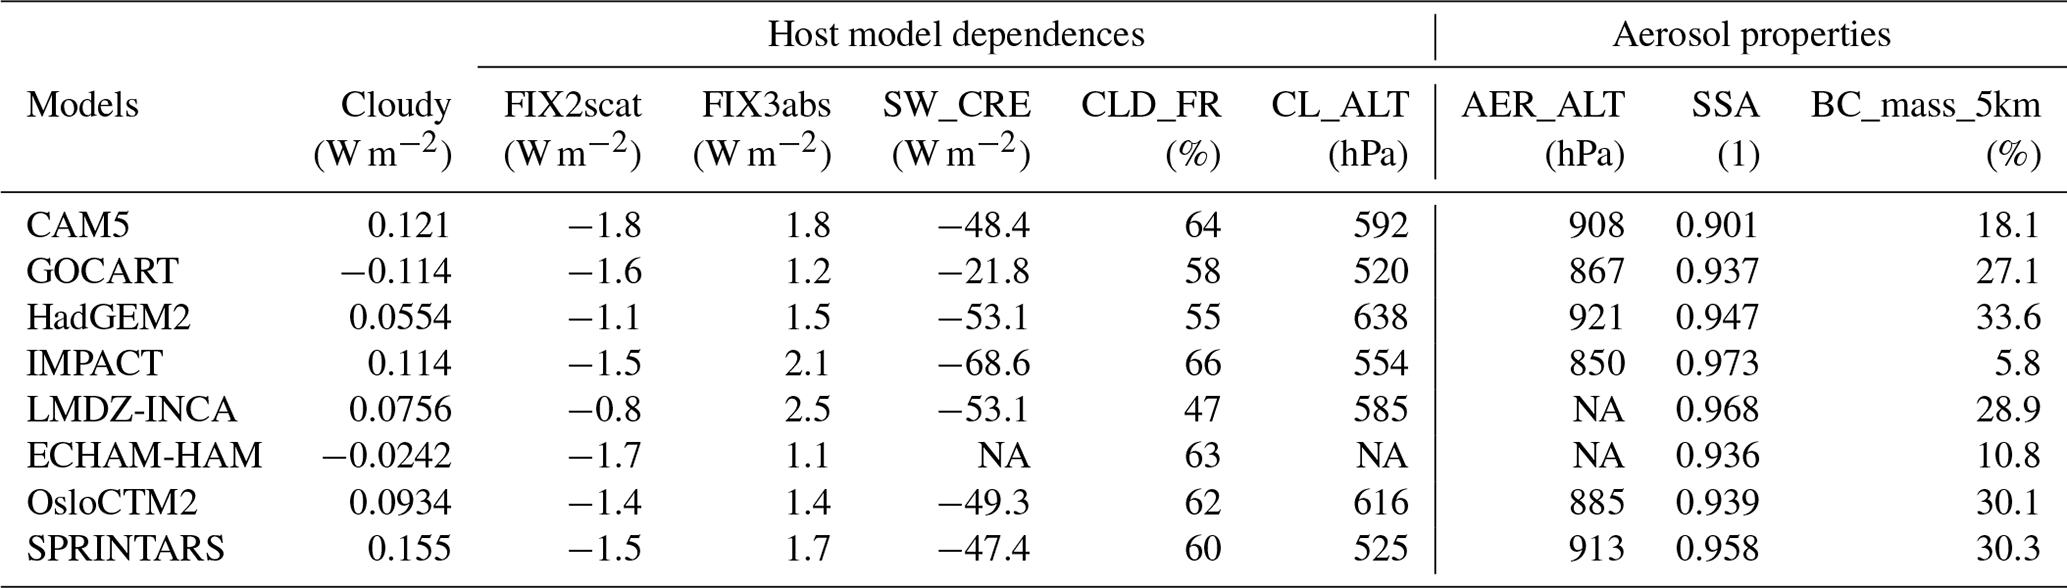
Multivariate data analysis in this study is based on results from a subset of the models participating in AeroCom Phase II (CAM5, GOCART, HadGEM2, IMPACT, INCA, ECHAM-HAM, OsloCTM2 and SPRINTARS). These eight models participated in the AeroCom Phase II experiment (Myhre et al., 2013a) with no constrain on aerosol processes, and in addition they participated in the host model AeroCom exercise with fixed aerosol optical properties (Stier et al., 2013). From the latter, FIX2scat and FIX3abs experiments can be used to retrieve the contributions from cloudy-sky to RFari in two highly idealized aerosol radiative properties experiments. FIX2scat is a purely scattering aerosol case, and FIX3abs is an absorbing aerosol case. The origin of the different variables derived from AeroCom Phase II model simulations (Myhre et al., 2013a; Samset et al., 2013) can be found Table 1.
Table 1Diagnostics from AeroCom Phase II (Myhre et al., 2013a; Samset et al., 2013; Stier et al., 2013) used in multivariate data analysis to investigate factors influencing the cloudy-sky contribution to RFari. The variable “Cloudy” is the cloudy-sky contribution to RFari (second term on the right-hand side of Eq. 1). Fixed scattering experiment 2 (FIX2scat) and Fixed absorption experiment 3 (FIX3abs) are the contributions from cloudy sky to RFari in two highly idealized aerosol radiative properties experiments in Stier et al. (2013), where FIX2scat is a purely scattering aerosol case and FIX3abs is an absorbing aerosol case. The other variables, from AeroCom Phase II model simulations, are the total short-wave cloud radiative effect (SW_CRE), cloud fraction (CLD_FR), weighted cloud height (CL_ALT), weighted anthropogenic aerosol height (AER_ALT), single-scattering albedo (SSA) of anthropogenic aerosols and fraction of anthropogenic BC mass above 5 km (BC_mass_5km). The variables Cloudy, FIX2scat, FIX3abs and SW_CRE are given in watts per square metre; CLD_FR and BC_mass_5km are in percent; and SSA is unitless. AER_ALT and CL_ALT are given in hectopascals, where the pressure levels are weighted by aerosol extinction and cloud fractions, respectively. Some model output fields are not available (NA).
The global mean data in Table 1 are analysed using principal component analysis (PCA). Here, the variables that may influence RFaricloud are orthogonally transformed into linearly uncorrelated variables named principal components (PCs). The transformation is defined so that the first principal component (PC1) accounts for most of the variance exhibited by the underlying variables. PCA is a dimension reduction technique, allowing for the visualization of all the variance between the variables in a two-dimensional plot (biplot). All PCs are anticorrelated with each other, which is why PC1 and PC2 are perpendicular to each other. How the variables relate to each other can to some extent be explained (magnitude) with each exceeding PC. In other words, each PC does not exclusively show its relation to RFaricloud.
Data are normalized prior to PCA to ensure comparison of variance between variables. PCA results are usually plotted in a biplot, where only PC1 and PC2 (the second PC) are plotted on the x and y axis, respectively, since the two PCs explain most of the variance. In the biplot, variables are projected as vectors along PC1 and PC2. The combined length and direction of the vector indicates the correlation the variable has with PC1 and PC2. Values range from −1 to 1, indicating negative to positive correlation with the PC. A value of 0 indicates no correlation with the PC. Since the projected vectors are directional, it is possible to have high correlation with PC1 (values or ∼1) and poor correlation with PC2 (value ∼ 0) or vice versa. Variables that point in the same direction are positively correlated with each other. Variables that point in the opposite direction of each other are negatively correlated. Variables that are perpendicular to each other are not correlated with each other. The missing data (see Table 1) for two of the models (LMDZ-INCA and ECHAM-HAM) are filled-in using regularized iterative PCA. This technique estimates the missing values, based on the correlation between the variables and the principal components (Josse and Husson, 2012).
RFaricloud (second term in Eq. 1) is added as a supplementary variable in PCA. This is to ensure that this dependent variable, the cloudy-sky contribution, does not influence the projected correlations the independent variables have on each other. The same approach is applied to FIX2scat and FIX3abs, as these variables are not independent, as they are composed of the many of the variables used in the analysis. In addition, linear-regression correlation coefficients are calculated between all the variables to assess the individual relationships.

Figure 1All-sky anthropogenic RFari and its decomposition into contributions from cloudy-sky and clear-sky areas (second and first term on the right-hand side of Eq. 1, respectively), based on AeroCom Phase II simulations (Myhre et al., 2013a).
3.1 Estimates of cloudy-sky contributions to RFari
Figure 1 shows the all-sky RFari due to anthropogenic aerosols separated into clear-sky (first term on right-hand side in Eq. 1) and cloudy-sky (second term on right-hand side in Eq. 1) portions from AeroCom Phase II models (Myhre et al., 2013a). The uncertainty ranges given in the figure are one standard deviation among the global aerosol models in AeroCom Phase II. The figure shows the two main results that the cloudy-sky RFari is weak and that the uncertainties in the contributions from cloudy sky and clear sky are substantial with the latter somewhat larger in magnitude.
Figure 2 shows an example from OsloCTM3 (Lund et al., 2018) of the spatial distribution terms involved in Eq. (1). In the lower row of Fig. 2 the annual-mean AC, RFariclear-total and RFaricloud-total are shown, with strong negative RFariclear-total over most land areas except over regions of high surface albedo such as deserts. RFaricloud-total is particularly positive over regions of biomass-burning aerosols overlying low-level stratocumulus but also over parts of high aerosol abundance over China. The second row shows the two terms on the right-hand side in Eq. (1), namely the contribution from the cloud-free and cloudy regions to the all-sky RFari. The contribution from the clear-sky regions (RFariclear, first term on the right-hand side of Eq. 1) is much weaker than RFariclear-total itself, since cloud fraction is high in many of the regions of anthropogenic aerosols. While the influence from cloud fraction on RFaricloud relative to RFaricloud-total is weak over biomass-burning regions, it weakens relative to the negative values in RFaricloud-total over many areas in the Northern Hemisphere. In the top row the all-sky RFari is the sum of the contributions from clear and cloudy regions where their importance for RFari varies regionally.
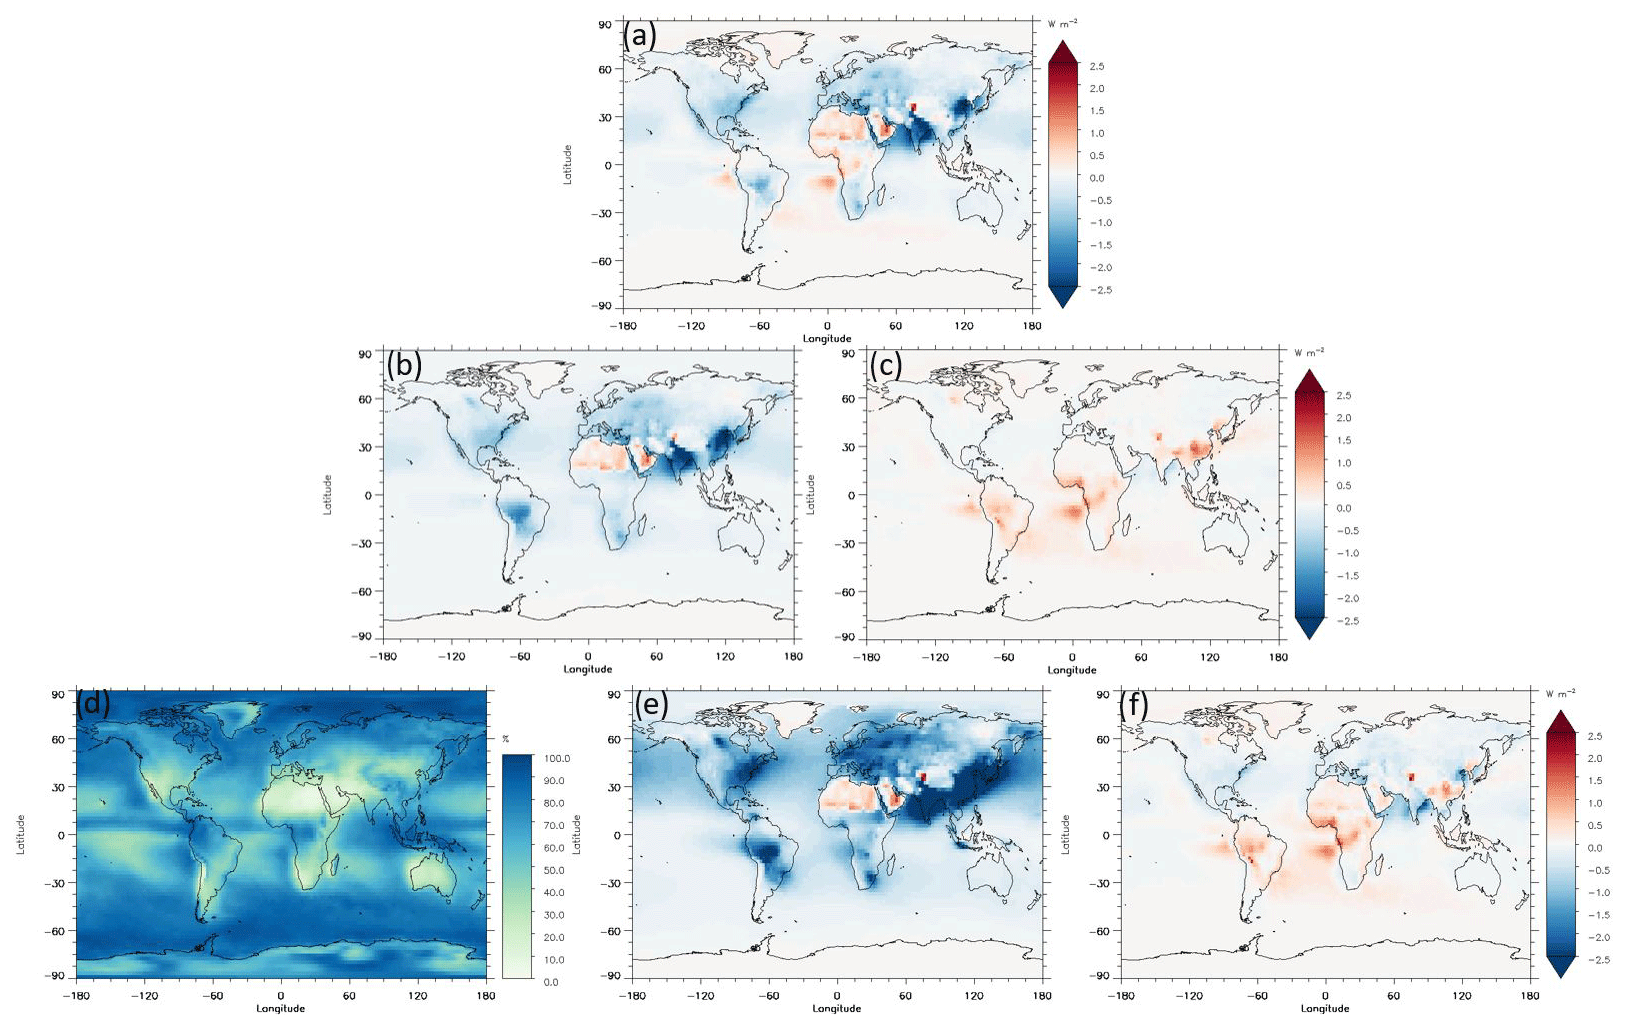
Figure 2Annual-mean all-sky anthropogenic RFari and various terms from clear and cloudy skies simulated with OsloCTM3 (Lund et al., 2018). The panel in the top row shows the all-sky RFari (a); the second row shows the contributions from clear (RFariclear) and cloudy skies (RFaricloud) (first, b, and second term, c, on the right-hand side on Eq. 1, respectively). The third row shows cloud fraction (AC) (d), RFaritotal-clear (e) and RFaritotal-cloud, (f), respectively. Panel (d) on cloud fraction is shown in percent, and the other panels are in watts per square metre.
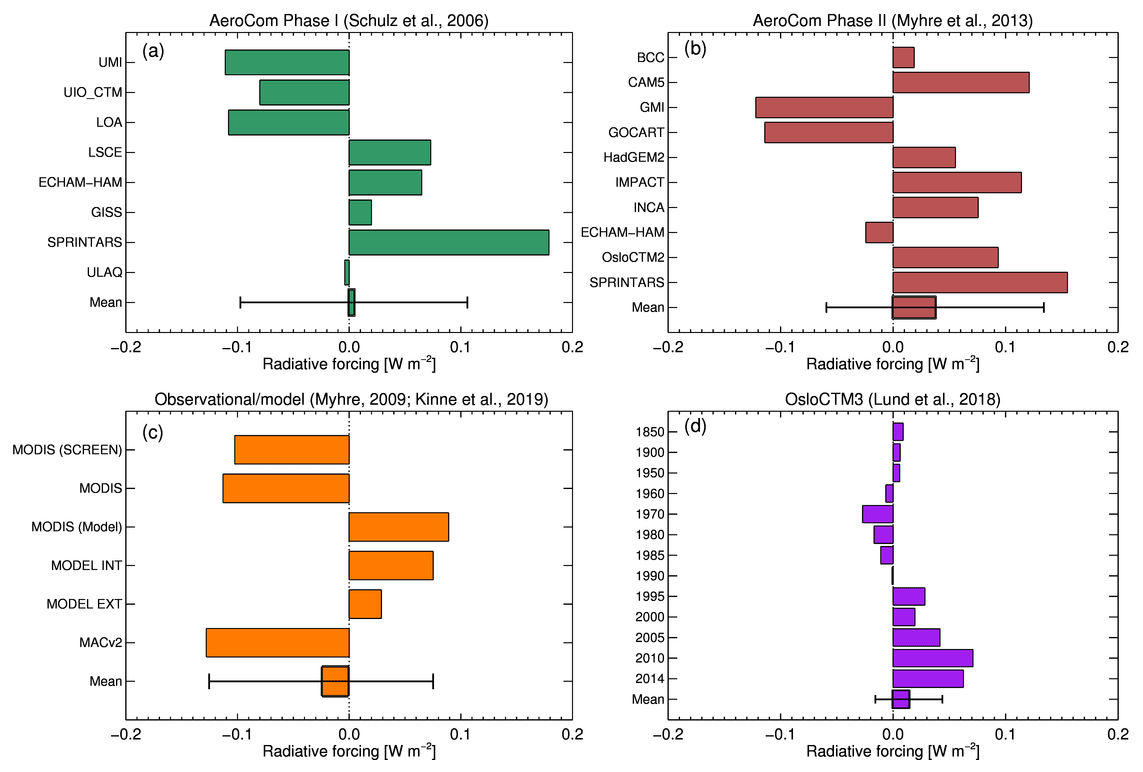
Figure 3The cloudy-sky contribution to RFari from AeroCom Phase I (Schulz et al., 2006) (a); AeroCom Phase II (Myhre et al., 2013a) (b); the combination of observation-based and model simulation (Kinne, 2019a; Myhre, 2009), where mean and standard deviation are based on all methods used in the panel (c); and the time evolution from OsloCTM3 (Lund et al., 2018) (d). The multi-model mean is shown by the bars, and the uncertainty range of one standard deviation of the models is given by whiskers.
Figure 3a–d shows estimates of the contribution from cloudy-sky regions to RFari from several studies: two are multi-model studies, one combines model and observation-based methods, and one study investigates the time evolution using one model. The two multi-model AeroCom studies (Myhre et al., 2013a; Schulz et al., 2006) show that the sign varies among the global aerosol models and that two versions from one model change sign between the two AeroCom phases (two versions of ECHAM-HAM, UIO_CTM versus OsloCTM2 and UMI versus IMPACT). The two model versions INCA and LSCE have positive values in both AeroCom phases. SPRINTARS has the strongest positive (and overall strongest magnitude) RFaricloud in both AeroCom phases. About half of the models shown in Fig. 3a and b have provided sufficient diagnostics to extract estimates from both AeroCom phases. The AeroCom Phase II results will be further discussed in Sect. 3.2.
In Myhre (2009) several experiments were performed to explain that differences in RFari between observation-based methods and global aerosol models arise from a relatively larger change in absorbing aerosols over the industrial era than in the current abundance of the absorbing aerosols. Whereas an observational method uses aerosol optical properties from measurements of the present time of the combined natural and anthropogenic aerosols, the models simulate a relatively larger change in the abundance of anthropogenic absorbing aerosols than assuming no change in the industrial-era aerosol optical properties. Figure 3c shows the cloudy-sky contribution to RFari from several of these experiments. The two experiments screened for missing MODIS data (SCREEN) and MODIS use satellite retrievals of aerosol optical depth (AOD), present aerosol optical properties retrieved (single-scattering albedo and asymmetry factor) from AERONET and a model estimate of the anthropogenic AOD. The difference between these experiments is that the MODIS experiment uses model information over regions of missing AOD from the satellite retrievals, while these regions are ignored in MODIS (SCREEN). RFaricloud is similar in these two experiments. On the other hand, in the experiment using MODIS in combination with model data (Model), changes in the aerosol optical properties from pre-industrial times to present cause the change in sign in the cloudy-sky contribution to RFari compared to MODIS and MODIS (SCREEN). MODIS (Model) has very similar RFari, as well as RFaricloud, to the standard global aerosol model simulations (with internal mixing, MODEL INT, and with external mixing, MODEL EXT). The two latter model simulations differ on whether internal or external mixing of BC is taken into account, respectively. The MACv2 RFaricloud is −0.13 W m−2. This estimate does not consider change in the aerosol optical properties over the industrial era and can thus be compared to MODIS (SCREEN) and MODIS experiments described above.
The time evolution of the cloudy-sky contribution to RFari in OsloCTM3 is shown in Fig. 3d, where all variations are caused by changes in the anthropogenic aerosol composition and abundance, since all other factors are kept constant. Values are negative in the period 1960 to 1990 due to a strong increase in SO2 emissions and thereby a domination of scattering aerosols and radiative impacts even in cloudy skies. In the period after 1990, the regional SO2 emissions have changed strongly but with a small reduction in the global emissions. Emissions of BC have on the other hand increased substantially making anthropogenic aerosols more absorbing in OsloCTM3, causing a relatively stronger positive contribution from cloudy-sky regions to RFari.
3.2 Multivariate data analysis of cloudy-sky contribution to the all-sky RFari
Table 1 lists the AeroCom Phase II models and variables included in the multivariate data analysis for investigating RFaricloud denoted as “Cloudy” in the table (the second term on the right-hand side of Eq. 1). The results of the multivariate data analysis are plotted in a biplot and a correlogram in Fig. 4. The principal component analysis (PCA) found that 68.2 % of the total variance is explained by the first and second principal components (PC1 and PC2; see Fig. 4a). Adding PC3 this number increases to 89.2 % (see Fig. 4c). The analysis shows that several factors are important for the cloudy-sky contribution to RFari (Cloudy). Among all variables total short-wave cloud radiative effect (SW_CRE) is the most important. SW_CRE is near-perfectly positively correlated with PC2 (Fig. 4a); hence it must be anticorrelated with every other PC. Therefore, the vector in Fig. 4a is perpendicular to the PC1 axis. This is also why the length of the vector is so short in Fig. 4c, since it neither correlates with PC3 nor PC1. SW_CRE is correlated with PC2, and Cloudy is correlated with PC2. The vector is pointing in the opposite direction between SW_CRE and Cloudy, which means the two variables are negatively correlated with each other. Figure 4b also shows a negative correlation between the two variables. A biplot with PC1 and PC3 (Fig. 4c) can explain more about a variable than PC1 and PC2. For example, CL_ALT has a slightly stronger projection in the PC1 and PC3 biplot and suggests that there is an anticorrelation with FIX2scat. However, in PC1 and PC2 they are positively correlated with each other. This suggests that there is partial correlation, and Fig. 4b shows there is a weak positive correlation between these two variables.
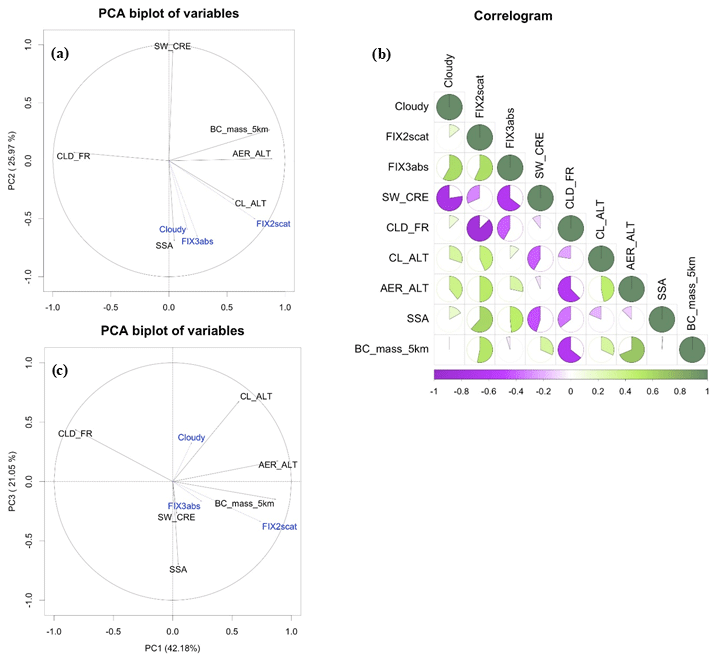
Figure 4Multivariate data analysis of eight AeroCom Phase II models (Myhre et al., 2013a) using diagnostics shown in Table S1. Principal component analysis biplot of the variables (a). The length of the arrows indicates the strength of the correlation each variable has in relation to PC1 and PC2, representing 42.2 % and 26.0 % of the variance, respectively. Variables clustered together indicate positive correlation with each other. Variables opposing each other indicate negative correlation. Cloudy, FIX3abs and FIX2scat (in blue) are added as supplementary variables and do not influence the projection of the other variables. This requirement is made, since cloudy, FIX2scat and FIX3abs already depend on the other variable and see their correlation. FIX2scat and FIX3abs have fixed SSA globally and for all models where the former experiment has pure scattering aerosol and FIX3abs has relatively low SSA (and thus high aerosol absorption). In panel (b), the correlogram shows the one-to-one linear-regression correlation each variable has to each other. The correlation coefficients (r) are presented on a colour scale from −1 (purple) to 0 (white) to +1 (green). The strength of the correlation is additionally presented as pie charts filling clockwise in green for positive correlations between two variables and anticlockwise in purple for negative correlation, where they can range from empty to full pie charts, indicating an absolute correlation, respectively, from 0 to 1. Panel (c) is the same as panel (a) but for PC1 and PC3.
Single-scattering albedo (SSA) being a crucial variable for the anthropogenic aerosols may potentially be an important factor (a higher SSA is expected to give a more negative cloudy-sky forcing). However, independent correlations plotted in the correlogram (Fig. 4b) suggest that the contribution to RFaricloud and SSA is weak (r=0.17). In-depth analysis of the linear correlation between cloudy sky to RFari and SSA suggests that the linear relationship exists only at higher PCs (see Fig. 4c).
The cloudy-sky contribution to RFari shows a closer dependence on similar quantities for the idealized experiment FIX3abs than FIX2scat, where FIX2scat has purely scattering aerosols. Both FIX2scat and FIX3abs are dependent on host model properties such as surface albedo and radiative transfer schemes (Stier et al., 2013). They are further strongly dependent on the host model clouds and their radiative effect and anticorrelated to cloud fraction (CLD_FR) and total short-wave cloud radiative flux (SW_CRE), respectively.
PCA finds negative correlation between RFaricloud and SW_CRE, also supported by the linear regression. One example here is the GOCART model with the weakest SW_CRE and most negative cloudy-sky contribution to RFari of the models included in the multivariate data analysis. At the same time, PCA finds a small dependence between the cloudy-sky contribution to RFari and cloud fraction (CLD_FR) or cloud altitude (CL_ALT). The negative correlation between RFaricloud and SW_CRE can be explained by reflective clouds enhancing the underlying albedo and thus making the radiative forcing more positive with an increase in absorbing aerosols in the cloudy-sky portion.
Overall FIX3abs (where models have a fixed SSA) and SW_CRE seem to be the main explanatory variables for the variance in the cloudy-sky contribution to RFari. It is however worth noting that the correlation for cloudy-sky contribution to RFari with the variables is not particularly strong in any direction (indicated by the short arrow). This suggests that some of the variance may be explained along the third or fourth principal component etc.
The multivariate data analysis shows that host model characteristics (especially SW_CRE) are important for the modelled cloudy-sky contribution to RFari (RFaricloud) but further indicates that many other factors are important. Furthermore, several other studies presented here show that aerosol properties (in particular SSA) are important for this quantity. Locally and especially in regions with aerosols above clouds, as well as in single-model studies, the SSA is crucial for RFaricloud. The two AeroCom phases give RFaricloud estimates of 0.0±0.10 and 0.04±0.10 W m−2, and the mean of two observation-based methods is −0.02 (range from −0.13 to 0.09 W m−2). Combining the numbers from these three studies, we find an RFaricloud value of 0.01±0.1 W m−2. The new emission inventory from CEDS has a strong increase in BC emissions leading to an increase in RFaricloudof 0.05 W m−2 from 2000 to 2014 in OsloCTM3. Using OsloCTM3 simulations to investigate the importance of diagnostics for every radiation time step (3 hourly) shows differences up to 0.01 W m−2 relative to daily mean data and up to 0.04 W m−2 for monthly data, but this may be model dependent (Haywood and Shine, 1997). The simulations used in this study only include the RF of the aerosol–radiation interaction. In a recent multi-model study, a decomposition of all aerosol effects (including aerosol-cloud interactions) provides weak RFaricloud for all models of magnitude and multi-model means similar to this study (Gryspeerdt et al., 2020). A separate single-model study however found RFaricloud to be substantial (Ghan, 2013).
Determining the quantity of black carbon from instrumentation such as the Single Particle Soot Photometer (SP2) has provided a new set of consistent data for assessing the performance of aerosol models (e.g. Kipling et al., 2013; Wang et al., 2014). Knowledge of BC mass is fundamentally insufficient for determining the ambient aerosol single-scattering albedo owing to additional complexities such as the degree of internal and external mixing. In the past, the aerosol modelling community has relied either on indirect remotely sensed measurements from AERONET (e.g. Chin et al., 2009) or on imperfect in situ measurements of aerosol scattering from nephelometers (e.g. Anderson et al., 2003) and absorption from filter-based systems (e.g. Bond et al., 1999). Both of these systems are relatively imprecise corrections to account for scattering and absorption artefacts (e.g. Davies et al., 2019; Massoli et al., 2009). The single-scattering albedos can be determined much more accurately using combinations of cavity ring-down measurements of extinction (e.g. Lack et al., 2006) and photoacoustic measurements of aerosol absorption (e.g. Baynard et al., 2006). These instruments are becoming more routine on aircraft equipped for making atmospheric measurements that can make highly accurate assessments of the aerosol single-scattering albedo at above-cloud altitudes (e.g. Davies et al., 2019; Langridge et al., 2011). These measurements will provide an invaluable additional source of data for model evaluation. All the global models that supplied simulations for this study treat the major anthropogenic aerosol components sulfate, organic aerosols and black carbon, with some also treating nitrate, but none include anthropogenic dust aerosols which have highly uncertain radiative effects.
Koffi et al. (2016, 2012) show that global aerosol models generally tend to have an overabundance of aerosols at higher altitude compared to satellite retrievals from CALIPSO (Cloud-Aerosol Lidar and Infrared Pathfinder Satellite Observations), and Samset et al. (2014) show that the AeroCom models overestimate BC at mid- and high-tropospheric altitudes compared to aircraft measurements. Too much BC above the clouds would overestimate RFaricloud. On the other hand, Peers et al. (2016) show that over the biomass-burning region in southern Africa most of the AeroCom models underestimate the AAOD over the stratocumulus layer, which would underestimate RFaricloud.
In future studies of RFari, particular attention should be put on how global aerosol models simulate the location of aerosols in relation to clouds and how aerosol optical properties change with altitude in regions with high cloud cover compared to measurements in order to further constrain the spread in the modelled cloudy-sky contribution. Nowhere is this high sensitivity more clearly demonstrated than over the southeastern Atlantic, where biomass-burning aerosols overlie (and sometimes interact with) relatively bright stratocumulus clouds (e.g. Zuidema et al., 2016). In addition to further analysis of aerosol RF in cloudy-sky regions, more emphasis should be devoted to quantifying RFari in cloud-free regions and its trend (Paulot et al., 2018), where the magnitude of forcing is larger than in cloudy regions.
All AeroCom data are available from the AeroCom server (https://wiki.met.no/aerocom/user-server, last access: 6 June 2020).
This research has been supported by the Research Council of Norway (grant no. 250573) and the European Research Council (ERC) (grant no. 724602).
This paper was edited by Pedro Jimenez-Guerrero and reviewed by two anonymous referees.
Anderson, T. L., Masonis, S. J., Covert, D. S., Ahlquist, N. C., Howell, S. G., Clarke, A. D., and McNaughton, C. S.: Variability of aerosol optical properties derived from in situ aircraft measurements during ACE-Asia, J. Geophys. Res.-Atmos., 108, 8647, https://doi.org/10.1029/2002JD003247, 2003.
Baynard, T., Garland, R. M., Ravishankara, A. R., Tolbert, M. A., and Lovejoy, E. R.: Key factors influencing the relative humidity dependence of aerosol light scattering, Geophys. Res. Lett., 33, L06813, https://doi.org/10.1029/2005GL024898, 2006.
Bellouin, N., Quaas, J., Gryspeerdt, E., Kinne, S., Stier, P., Watson-Parris, D., Boucher, O., Carslaw, K. S., Christensen, M., Daniau, A.-L., Dufresne, J.-L., Feingold, G., Fiedler, S., Forster, P., Gettelman, A., Haywood, J. M., Lohmann, U., Malavelle, F., Mauritsen, T., McCoy, D. T., Myhre, G., Mülmenstädt, J., Neubauer, D., Possner, A., Rugenstein, M., Sato, Y., Schulz, M., Schwartz, S. E., Sourdeval, O., Storelvmo, T., Toll, V., Winker, D., and Stevens, B.: Bounding Global Aerosol Radiative Forcing of Climate Change, Rev. Geophys., 58, e2019RG000660. https://doi.org/10.1029/2019RG000660, 2020.
Bian, H., Chin, M., Hauglustaine, D. A., Schulz, M., Myhre, G., Bauer, S. E., Lund, M. T., Karydis, V. A., Kucsera, T. L., Pan, X., Pozzer, A., Skeie, R. B., Steenrod, S. D., Sudo, K., Tsigaridis, K., Tsimpidi, A. P., and Tsyro, S. G.: Investigation of global particulate nitrate from the AeroCom phase III experiment, Atmos. Chem. Phys., 17, 12911–12940, https://doi.org/10.5194/acp-17-12911-2017, 2017.
Bond, T. C., Anderson, T. L., and Campbell, D.: Calibration and Intercomparison of Filter-Based Measurements of Visible Light Absorption by Aerosols, Aerosol Sci. Technol., 30, 582–600, 1999.
Bond, T. C., Doherty, S. J., Fahey, D. W., Forster, P. M., Berntsen, T., DeAngelo, B. J., Flanner, M. G., Ghan, S., Karcher, B., Koch, D., Kinne, S., Kondo, Y., Quinn, P. K., Sarofim, M. C., Schultz, M. G., Schulz, M., Venkataraman, C., Zhang, H., Zhang, S., Bellouin, N., Guttikunda, S. K., Hopke, P. K., Jacobson, M. Z., Kaiser, J. W., Klimont, Z., Lohmann, U., Schwarz, J. P., Shindell, D., Storelvmo, T., Warren, S. G., and Zender, C. S.: Bounding the role of black carbon in the climate system: A scientific assessment, J. Geophys. Res.-Atmos., 118, 5380–5552, 2013.
Boucher, O., Randall, D., Artaxo, P., Bretherton, C., Feingold, G., Forster, P., Kerminen, V.-M., Kondo, Y., Liao, H., Lohmann, U., Rasch, P., Satheesh, S. K., Sherwood, S., Stevens, B., and Zhang, X.-Y.: Clouds and Aerosols, in: Climate Change 2013: The Physical Science Basis, Contribution of Working Group I to the Fifth Assessment Report of the Intergovernmental Panel on Climate Change, edited by: Stocker, T. F., Qin, D., Plattner, G.-K., Tignor, M., Allen, S. K., Boschung, J., Nauels, A., Xia, Y., Bex, V., and Midgley, P. M., Cambridge University Press, Cambridge, UK, New York, NY, USA, 571–657, 2013.
Chand, D., Wood, R., Anderson, T. L., Satheesh, S. K., and Charlson, R. J.: Satellite-derived direct radiative effect of aerosols dependent on cloud cover, Nat. Geosci., 2, 181–184, 2009.
Chin, M. Diehl, T., Dubovik, O., Eck, T. F., Holben, B. N., Sinyuk, A., and Streets, D. G.: Light absorption by pollution, dust, and biomass burning aerosols: a global model study and evaluation with AERONET measurements, Ann. Geophys., 27, 3439–3464, https://doi.org/10.5194/angeo-27-3439-2009, 2009.
Davies, N. W., Fox, C., Szpek, K., Cotterell, M. I., Taylor, J. W., Allan, J. D., Williams, P. I., Trembath, J., Haywood, J. M., and Langridge, J. M.: Evaluating biases in filter-based aerosol absorption measurements using photoacoustic spectroscopy, Atmos. Meas. Tech., 12, 3417–3434, https://doi.org/10.5194/amt-12-3417-2019, 2019.
Forster, P., Ramaswamy, V., Artaxo, P., Berntsen, T., Betts, R., Fahey, D. W., Haywood, J., Lean, J., Lowe, D. C., Myhre, G., Nganga, J., Prinn, R., Raga, G., Schulz, M., and Van Dorland, R., Changes in Atmospheric Constituents and in Radiative Forcing, in: Climate Change 2007: The Physical Science Basis, Contribution of Working Group I to the Fourth Assessment Report of the Intergovernmental Panel on Climate Change, Cambridge University Press, Cambridge, UK, New York, NY, USA, 2007.
Ghan, S. J.: Technical Note: Estimating aerosol effects on cloud radiative forcing, Atmos. Chem. Phys., 13, 9971–9974, https://doi.org/10.5194/acp-13-9971-2013, 2013.
Gryspeerdt, E., Mülmenstädt, J., Gettelman, A., Malavelle, F. F., Morrison, H., Neubauer, D., Partridge, D. G., Stier, P., Takemura, T., Wang, H., Wang, M., and Zhang, K.: Surprising similarities in model and observational aerosol radiative forcing estimates, Atmos. Chem. Phys., 20, 613–623, https://doi.org/10.5194/acp-20-613-2020, 2020.
Haywood, J. M. and Shine, K. P.: Multi-spectral calculations of the direct radiative forcing of tropospheric sulphate and soot aerosols using a column model, Q. J. Roy. Meteor. Soc., 123, 1907–1930, 1997.
Hoesly, R. M., Smith, S. J., Feng, L., Klimont, Z., Janssens-Maenhout, G., Pitkanen, T., Seibert, J. J., Vu, L., Andres, R. J., Bolt, R. M., Bond, T. C., Dawidowski, L., Kholod, N., Kurokawa, J.-I., Li, M., Liu, L., Lu, Z., Moura, M. C. P., O'Rourke, P. R., and Zhang, Q.: Historical (1750–2014) anthropogenic emissions of reactive gases and aerosols from the Community Emissions Data System (CEDS), Geosci. Model Dev., 11, 369–408, https://doi.org/10.5194/gmd-11-369-2018, 2018.
Josse, J. and Husson, F.: Handling missing values in exloratory multivariate data analysis methods, Journal de la Société Fraçaise de Statistique, 153, 79–99, 2012.
Keil, A. and Haywood, J. M.: Solar radiative forcing by biomass burning aerosol particles during SAFARI 2000: A case study based on measured aerosol and cloud properties, J. Geophys. Res.-Atmos., 108, 8467, https://doi.org/10.1029/2002JD002315, 8467, 2003.
Kinne, S.: Aerosol radiative effects with MACv2, Atmos. Chem. Phys., 19, 10919–10959, https://doi.org/10.5194/acp-19-10919-2019, 2019a.
Kinne, S.: The MACv2 aerosol climatology, Tellus B, 71, 1–21, 2019b.
Kipling, Z., Stier, P., Schwarz, J. P., Perring, A. E., Spackman, J. R., Mann, G. W., Johnson, C. E., and Telford, P. J.: Constraints on aerosol processes in climate models from vertically-resolved aircraft observations of black carbon, Atmos. Chem. Phys., 13, 5969–5986, https://doi.org/10.5194/acp-13-5969-2013, 2013.
Koffi, B., Schulz, M., Bréon, F.-M., Dentener, F., Steensen, B. M., Griesfeller, J., Winker, D., Balkanski, Y., Bauer, S. E., Bellouin, N., Berntsen, T., Bian, H., Chin, M., Diehl, T., Easter, R., Ghan, S., Hauglustaine, D. A., Iversen, T., Kirkevåg, A., Liu, X., Lohmann, U., Myhre, G., Rasch, P., Seland, Ø., Skeie, R. B., Steenrod, S. D., Stier, P., Tackett, J., Takemura, T., Tsigaridis, K., Vuolo, M. R., Yoon, J., and Zhang, K.: Evaluation of the aerosol vertical distribution in global aerosol models through comparison against CALIOP measurements: AeroCom phase II results, J. Geophys. Res.-Atmos., 121, 7254–7283, 2016.
Koffi, B., Schulz, M., Breon, F. M., Griesfeller, J., Winker, D., Balkanski, Y., Bauer, S., Berntsen, T., Chin, M. A., Collins, W. D., Dentener, F., Diehl, T., Easter, R., Ghan, S., Ginoux, P., Gong, S. L., Horowitz, L. W., Iversen, T., Kirkevag, A., Koch, D., Krol, M., Myhre, G., Stier, P., and Takemura, T.: Application of the CALIOP layer product to evaluate the vertical distribution of aerosols estimated by global models: AeroCom phase I results, J. Geophys. Res.-Atmos., 117, D10201, https://doi.org/10.1029/2011jd016858, 2012.
Lacagnina, C., Hasekamp, O. P., and Torres, O.: Direct radiative effect of aerosols based on PARASOL and OMI satellite observations, J. Geophys. Res.-Atmos., 122, 2366–2388, 2017.
Lack, D. A., Lovejoy, E. R., Baynard, T., Pettersson, A., and Ravishankara, A. R.: Aerosol Absorption Measurement using Photoacoustic Spectroscopy: Sensitivity, Calibration, and Uncertainty Developments, Aerosol Sci. Technol., 40, 697–708, 2006.
Lamarque, J.-F., Bond, T. C., Eyring, V., Granier, C., Heil, A., Klimont, Z., Lee, D., Liousse, C., Mieville, A., Owen, B., Schultz, M. G., Shindell, D., Smith, S. J., Stehfest, E., Van Aardenne, J., Cooper, O. R., Kainuma, M., Mahowald, N., McConnell, J. R., Naik, V., Riahi, K., and van Vuuren, D. P.: Historical (1850–2000) gridded anthropogenic and biomass burning emissions of reactive gases and aerosols: methodology and application, Atmos. Chem. Phys., 10, 7017–7039, https://doi.org/10.5194/acp-10-7017-2010, 2010.
Langridge, J. M., Richardson, M. S., Lack, D., Law, D., and Murphy, D. M.: Aircraft Instrument for Comprehensive Characterization of Aerosol Optical Properties, Part I: Wavelength-Dependent Optical Extinction and Its Relative Humidity Dependence Measured Using Cavity Ringdown Spectroscopy, Aerosol Sci. Technol., 45, 1305–1318, 2011.
Lund, M. T., Myhre, G., Haslerud, A. S., Skeie, R. B., Griesfeller, J., Platt, S. M., Kumar, R., Myhre, C. L., and Schulz, M.: Concentrations and radiative forcing of anthropogenic aerosols from 1750 to 2014 simulated with the Oslo CTM3 and CEDS emission inventory, Geosci. Model Dev., 11, 4909–4931, https://doi.org/10.5194/gmd-11-4909-2018, 2018.
Massoli, P., Murphy, D. M., Lack, D. A., Baynard, T., Brock, C. A., and Lovejoy, E. R.: Uncertainty in Light Scattering Measurements by TSI Nephelometer: Results from Laboratory Studies and Implications for Ambient Measurements, Aerosol Sci. Technol., 43, 1064–1074, 2009.
Matus, A. V., L'Ecuyer, T. S., and Henderson, D. S.: New Estimates of Aerosol Direct Radiative Effects and Forcing From A-Train Satellite Observations, Geophys. Res. Lett., 46, 8338–8346, 2019.
Myhre, G.: Consistency between satellite-derived and modeled estimates of the direct aerosol effect, Science, 325, 187–190, 2009.
Myhre, G., Samset, B. H., Schulz, M., Balkanski, Y., Bauer, S., Berntsen, T. K., Bian, H., Bellouin, N., Chin, M., Diehl, T., Easter, R. C., Feichter, J., Ghan, S. J., Hauglustaine, D., Iversen, T., Kinne, S., Kirkevåg, A., Lamarque, J.-F., Lin, G., Liu, X., Lund, M. T., Luo, G., Ma, X., van Noije, T., Penner, J. E., Rasch, P. J., Ruiz, A., Seland, Ø., Skeie, R. B., Stier, P., Takemura, T., Tsigaridis, K., Wang, P., Wang, Z., Xu, L., Yu, H., Yu, F., Yoon, J.-H., Zhang, K., Zhang, H., and Zhou, C.: Radiative forcing of the direct aerosol effect from AeroCom Phase II simulations, Atmos. Chem. Phys., 13, 1853–1877, https://doi.org/10.5194/acp-13-1853-2013, 2013a.
Myhre, G., Shindell, D., Bréon, F.-M., Collins, W., Fuglestvedt, J., Huang, J., Koch, D., Lamarque, J.-F., Lee, D., Mendoza, B., Nakajima, T., Robock, A., Stephens, G., Takemura, T., and Zhang, H., Anthropogenic and Natural Radiative Forcing, in: Climate Change 2013: The Physical Science Basis, Contribution of Working Group I to the Fifth Assessment Report of the Intergovernmental Panel on Climate Change, edited by: Stocker, T. F., Qin, D., Plattner, G.-K., Tignor, M., Allen, S. K., Boschung, J., Nauels, A., Xia, Y., Bex, V., and Midgley, P. M., Cambridge University Press, Cambridge, UK, New York, NY, USA, 659–740, 2013b.
Oikawa, E., Nakajima, T., Inoue, T., and Winker, D.: A study of the shortwave direct aerosol forcing using ESSP/CALIPSO observation and GCM simulation, J. Geophys. Res.-Atmos., 118, 3687–3708, 2013.
Oikawa, E., Nakajima, T., and Winker, D.: An Evaluation of the Shortwave Direct Aerosol Radiative Forcing Using CALIOP and MODIS Observations, J. Geophys. Res.-Atmos., 123, 1211–1233, 2018.
Paulot, F., Paynter, D., Ginoux, P., Naik, V., and Horowitz, L. W.: Changes in the aerosol direct radiative forcing from 2001 to 2015: observational constraints and regional mechanisms, Atmos. Chem. Phys., 18, 13265–13281, https://doi.org/10.5194/acp-18-13265-2018, 2018.
Peers, F., Bellouin, N., Waquet, F., Ducos, F., Goloub, P., Mollard, J., Myhre, G., Skeie, R. B., Takemura, T., Tanré, D., Thieuleux, F., and Zhang, K.: Comparison of aerosol optical properties above clouds between POLDER and AeroCom models over the South East Atlantic Ocean during the fire season, Geophys. Res. Lett., 43, 3991–4000, 2016.
Samset, B. H., Myhre, G., Herber, A., Kondo, Y., Li, S.-M., Moteki, N., Koike, M., Oshima, N., Schwarz, J. P., Balkanski, Y., Bauer, S. E., Bellouin, N., Berntsen, T. K., Bian, H., Chin, M., Diehl, T., Easter, R. C., Ghan, S. J., Iversen, T., Kirkevåg, A., Lamarque, J.-F., Lin, G., Liu, X., Penner, J. E., Schulz, M., Seland, Ø., Skeie, R. B., Stier, P., Takemura, T., Tsigaridis, K., and Zhang, K.: Modelled black carbon radiative forcing and atmospheric lifetime in AeroCom Phase II constrained by aircraft observations, Atmos. Chem. Phys., 14, 12465–12477, https://doi.org/10.5194/acp-14-12465-2014, 2014.
Samset, B. H., Myhre, G., Schulz, M., Balkanski, Y., Bauer, S., Berntsen, T. K., Bian, H., Bellouin, N., Diehl, T., Easter, R. C., Ghan, S. J., Iversen, T., Kinne, S., Kirkevåg, A., Lamarque, J.-F., Lin, G., Liu, X., Penner, J. E., Seland, Ø., Skeie, R. B., Stier, P., Takemura, T., Tsigaridis, K., and Zhang, K.: Black carbon vertical profiles strongly affect its radiative forcing uncertainty, Atmos. Chem. Phys., 13, 2423–2434, https://doi.org/10.5194/acp-13-2423-2013, 2013.
Samset, B. H., Stjern, C. W., Andrews, E., Kahn, R. A., Myhre, G., Schulz, M., and Schuster, G. L.: Aerosol Absorption: Progress Towards Global and Regional Constraints, Curr. Clim. Change Rep., 4, 65–83, 2018.
Schulz, M., Textor, C., Kinne, S., Balkanski, Y., Bauer, S., Berntsen, T., Berglen, T., Boucher, O., Dentener, F., Guibert, S., Isaksen, I. S. A., Iversen, T., Koch, D., Kirkevåg, A., Liu, X., Montanaro, V., Myhre, G., Penner, J. E., Pitari, G., Reddy, S., Seland, Ø., Stier, P., and Takemura, T.: Radiative forcing by aerosols as derived from the AeroCom present-day and pre-industrial simulations, Atmos. Chem. Phys., 6, 5225–5246, https://doi.org/10.5194/acp-6-5225-2006, 2006.
Schutgens, N. A. J.: Site representativity of AERONET and GAW remotely sensed aerosol optical thickness and absorbing aerosol optical thickness observations, Atmos. Chem. Phys., 20, 7473–7488, https://doi.org/10.5194/acp-20-7473-2020, 2020.
Sherwood, S. C., Bony, S., Boucher, O., Bretherton, C., Forster, P. M., Gregory, J. M., and Stevens, B.: Adjustments in the Forcing-Feedback Framework for Understanding Climate Change, B. Am. Meteorol. Soc., 96, 217–228, 2015.
Smith, C. J., Kramer, R. J., Myhre, G., Forster, P. M., Soden, B. J., Andrews, T., Boucher, O., Faluvegi, G., Fläschner, D., Hodnebrog, Ø., Kasoar, M., Kharin, V., Kirkevåg, A., Lamarque, J.-F., Mülmenstädt, J., Olivié, D., Richardson, T., Samset, B. H., Shindell, D., Stier, P., Takemura, T., Voulgarakis, A., and Watson-Parris, D.: Understanding Rapid Adjustments to Diverse Forcing Agents, Geophys. Res. Lett., 45, 12023–12031, 2018.
Stier, P., Schutgens, N. A. J., Bellouin, N., Bian, H., Boucher, O., Chin, M., Ghan, S., Huneeus, N., Kinne, S., Lin, G., Ma, X., Myhre, G., Penner, J. E., Randles, C. A., Samset, B., Schulz, M., Takemura, T., Yu, F., Yu, H., and Zhou, C.: Host model uncertainties in aerosol radiative forcing estimates: results from the AeroCom Prescribed intercomparison study, Atmos. Chem. Phys., 13, 3245–3270, https://doi.org/10.5194/acp-13-3245-2013, 2013.
Takemura, T., Nakajima, T., Dubovik, O., Holben, B. N., and Kinne, S.: Single-scattering albedo and radiative forcing of various aerosol species with a global three-dimensional model, J. Climate, 15, 333–352, 2002.
Tsigaridis, K., Daskalakis, N., Kanakidou, M., Adams, P. J., Artaxo, P., Bahadur, R., Balkanski, Y., Bauer, S. E., Bellouin, N., Benedetti, A., Bergman, T., Berntsen, T. K., Beukes, J. P., Bian, H., Carslaw, K. S., Chin, M., Curci, G., Diehl, T., Easter, R. C., Ghan, S. J., Gong, S. L., Hodzic, A., Hoyle, C. R., Iversen, T., Jathar, S., Jimenez, J. L., Kaiser, J. W., Kirkevåg, A., Koch, D., Kokkola, H., Lee, Y. H., Lin, G., Liu, X., Luo, G., Ma, X., Mann, G. W., Mihalopoulos, N., Morcrette, J.-J., Müller, J.-F., Myhre, G., Myriokefalitakis, S., Ng, N. L., O'Donnell, D., Penner, J. E., Pozzoli, L., Pringle, K. J., Russell, L. M., Schulz, M., Sciare, J., Seland, Ø., Shindell, D. T., Sillman, S., Skeie, R. B., Spracklen, D., Stavrakou, T., Steenrod, S. D., Takemura, T., Tiitta, P., Tilmes, S., Tost, H., van Noije, T., van Zyl, P. G., von Salzen, K., Yu, F., Wang, Z., Wang, Z., Zaveri, R. A., Zhang, H., Zhang, K., Zhang, Q., and Zhang, X.: The AeroCom evaluation and intercomparison of organic aerosol in global models, Atmos. Chem. Phys., 14, 10845–10895, https://doi.org/10.5194/acp-14-10845-2014, 2014.
Wang, Q. Q., Jacob, D. J., Spackman, J. R., Perring, A. E., Schwarz, J. P., Moteki, N., Marais, E. A., Ge, C., Wang, J., and Barrett, S. R. H.: Global budget and radiative forcing of black carbon aerosol: Constraints from pole-to-pole (HIPPO) observations across the Pacific, J. Geophys. Res.-Atmos., 119, 195–206, 2014.
Wang, R., Andrews, E., Balkanski, Y., Boucher, O., Myhre, G., Samset, B. H., Schulz, M., Schuster, G. L., Valari, M., and Tao, S.: Spatial Representativeness Error in the Ground-Level Observation Networks for Black Carbon Radiation Absorption, Geophys. Res. Lett., 45, 2106–2114, 2018.
Zhang, Z., Meyer, K., Yu, H., Platnick, S., Colarco, P., Liu, Z., and Oreopoulos, L.: Shortwave direct radiative effects of above-cloud aerosols over global oceans derived from 8 years of CALIOP and MODIS observations, Atmos. Chem. Phys., 16, 2877–2900, https://doi.org/10.5194/acp-16-2877-2016, 2016.
Zuidema, P., Redemann, J., Haywood, J., Wood, R., Piketh, S., Hipondoka, M., and Formenti, P.: Smoke and Clouds above the Southeast Atlantic: Upcoming Field Campaigns Probe Absorbing Aerosol's Impact on Climate, B. Am. Meteorol. Soc., 97, 1131–1135, 2016.