the Creative Commons Attribution 4.0 License.
the Creative Commons Attribution 4.0 License.
 | 23 Jan 2020
Air pollution slows down surface warming over the Tibetan Plateau
Aolin Jia
Dongdong Wang
Bo Jiang
Xiaotong Zhang
The Tibetan Plateau (TP) plays a vital role in regional and global climate change. The TP has been undergoing significant surface warming starting from 1850, with an air temperature increase of 1.39 K and surface solar dimming resulting from decreased incident solar radiation. The causes and impacts of solar dimming on surface warming are unclear. In this study, long-term (from 1850 to 2015) surface downward radiation datasets over the TP are developed by integrating 18 Coupled Model Intercomparison Project phase 5 (CMIP5) models and satellite products. The validation results from two ground measurement networks show that the generated downward surface radiation datasets have a higher accuracy than the mean of multiple CMIP5 datasets and the fused datasets of reanalysis and satellite products. After analyzing the generated radiation data with four air temperature datasets, we found that downward shortwave radiation (DSR) remained stable before 1950 and then declined rapidly at a rate of −0.53 W m−2 per decade, and that the fastest decrease in DSR occurs in the southeastern TP. Evidence from site measurements, satellite observations, reanalysis, and model simulations suggested that the TP solar dimming was primarily driven by increased anthropogenic aerosols. The TP solar dimming is stronger in summer, at the same time that the increasing magnitude of the surface air temperature is the smallest. The cooling effect of solar dimming offsets surface warming on the TP by 0.80±0.28 K (48.6±17.3 %) in summer since 1850. It helps us understand the role of anthropogenic aerosols in climate warming and highlights the need for additional studies to be conducted to quantify the influence of air pollution on regional climate change over the TP.
- Article
(5033 KB) - Full-text XML
-
Supplement
(1583 KB) - BibTeX
- EndNote


The Tibetan Plateau (TP), the so-called “third pole”, covers an area of approximately 2.65×10² km2 and has an average elevation of more than 4000 m. It contains the largest ice mass outside of the polar regions (Yao et al., 2007) which supplies several major rivers that sustain billions of people in China and south Asia, dominating regional social stabilization and development. The TP is a weak heat sink in winter but a strong heat source in summer and dominates the atmospheric circulation (Wu et al., 2015). The mechanical and thermal forcing of the large-scale orography is crucial for the formation of the Asian summer monsoon (Boos and Kuang, 2010) and water and heat exchange between the Pacific Ocean and Eurasia (Wu et al., 2012). The TP anticyclone transports water vapor and chemical gases into the lower stratosphere (Fu et al., 2006). Therefore, the local climate pattern over the TP plays a vital role in the climate in southern China (Xu et al., 2013), the boreal climate (Sampe and Xie, 2010), and global climate change (Cai et al., 2017).
The TP is currently undergoing significant climate change (Yao et al., 2018), such as increased surface air temperature (Kuang and Jiao, 2016) and downward longwave radiation (DLR), as well as decreased downward solar radiation (DSR) (You et al., 2010), which is a solar dimming phenomenon that can impact surface air temperatures (Wild et al., 2007) and precipitation (Wild, 2009). However, the causes of solar dimming over the TP are not yet conclusive (Kuang and Jiao, 2016; Xie and Zhu, 2013; Xie et al., 2015). Changes in DSR are mainly controlled by atmospheric clouds and aerosols (Liang et al., 2010) at century-level scales. You et al. (2013) suggested that aerosols have played an important role in solar dimming over the TP in recent decades, while Tang et al. (2011) speculated that solar dimming over the TP might be caused by cloud cover changes that have a comparable influence on solar dimming to that of aerosol loading changes. Although some studies have suggested that brown clouds that are formed due to aerosols over the Indian Ocean and Asia (Ramanathan et al., 2007) might be transported to the TP by the summer monsoon, Yang et al. (2012, 2014) contended that the main drivers are deep convective clouds and atmospheric water vapor, and that aerosol radiative forcing is too small to result in the decreased DSR over the TP. These studies clearly show contradictory conclusions regarding the proper attribution of the solar dimming; therefore, the roles of aerosols and clouds in solar dimming still need to be determined. Moreover, some of these studies were mainly based on ground measurements at a limited number of sites that cannot represent the entire TP. Furthermore, the surface observed sunshine duration data that were used for estimating DSR (Wang, 2014; Yang et al., 2006) were not available over the TP until the 1960s. Regardless, the statistical model can hardly capture the low aerosols' influence on surface solar radiation by sunshine duration because sunshine duration has a lower sensitivity than DSR to atmospheric turbidity changes that is estimated by aerosol optical depth (AOD) (Manara et al., 2017). Thus, considering that remote sensing has been developed for several decades, it provides a valuable opportunity to employ satellite observations to monitor spatiotemporal variations at regional scales.
The radiative effect of anthropogenic aerosols has not yet been well quantified over the TP, which is necessary for understanding the role of anthropogenic aerosols in climate warming and revealing impacts of human activities in remote areas. Aerosols have a net cooling effect on the global temperature with higher uncertainty based on the Intergovernmental Panel on Climate Change (IPCC) report (IPCC, 2014), whereas Andreae et al. (2005) have suggested that current aerosol loading may cause a hot future. Even Gettelman et al. (2015) contended that the net effect of aerosols on surface temperature can be neglected, and Samset et al. (2018) pointed out that aerosol depressed surface temperature by 0.5–1.1 K globally. In contrast, one recent study (Feng and Zou, 2019) argued that aerosols contributed K to global surface temperature change after the year 2000. Therefore, the aerosol effect on climate warming is still under discussion. Model simulations (Ji et al., 2015) have shown that carbonaceous aerosols have positive radiative forcing effects on climate warming over the TP, leading to a 0.1–0.5∘ warming in the monsoon season, while some studies have demonstrated that anthropogenic aerosols (AAs) have a cooling effect on local climate warming (Smith et al., 2016; Sundström et al., 2015). Gao et al. (2015) contended that aerosols cool the surface 0.8–2.8 K in the North China Plain, and Li et al. (2015) calculated the aerosol impact on climate warming in different seasons over arid–semiarid and humid–semiarid areas, and across China, and showed that China undergoes a cooling rate of −0.86 to −0.76 ∘C per century due to increased aerosols. However, former conclusions were mainly based on model simulations (Liao et al., 2015) and have not yet been combined with observations. Therefore, there is no consistent result of quantifying the impact of anthropogenic aerosols on climate warming especially at the TP, and the observations from multiple data sources are urgently needed in the quantification.
In this study, we aim to analyze the long-term spatiotemporal variation of surface radiation over the TP by generating long-term surface radiation datasets from satellite products and model simulations. Solar dimming will be attributed by analyzing multiple data sources. The depressing effect of aerosols on climate warming needs to be quantified in the end. Calibrated by the Clouds and the Earth's Radiant Energy System Energy Balanced and Filled (CERES EBAF) edition 4.0 surface downward radiation products (Kato et al., 2018), long-term (from 1850 to 2015) surface DSR and DLR datasets over the TP were developed by merging 18 Coupled Model Intercomparison Project phase 5 (CMIP5) models (Taylor et al., 2012). Site validation and comparison were processed to the calibrated data, the CMIP5 model outputs, and other long-term radiation products. The spatiotemporal variations in the generated surface radiation datasets and four long-term air temperature datasets were initially analyzed, and the TP solar dimming was attributed by using multiple types of satellite and reanalysis data, which were confirmed by climate model simulations. We characterized the seasonal difference of the TP solar dimming and further quantified the depressing effect on local climate warming starting from 1850 using two methods driven by satellite observations and model simulations.
2.1 Data
2.1.1 CMIP5 data
The CMIP5 (Taylor et al., 2012) datasets with at least one dimension of spatial resolution less than 2∘ were chosen in the paper, and 18 monthly modeled datasets (summarized in Table 1) from the historical experiment were included, covering the years 1850 to 2005; the following years (2006–2015) of records are from the Representative Concentration Pathway (RCP) 8.5 experiment. We used the first ensemble (r1i1p1) only of each experiment to reduce the calibration complexity of surface downward radiation. AOD, precipitation, and wind speed from the historical (1850–2005) and RCP8.5 (2006–2015) experiments of the models were used to analyze differences in dimming magnitudes at seasonal scales (Fig. 7). Surface temperature, wind speed, and relative humidity were employed for calculating the aerosol depressing effect due to the long-term coverage. The corresponding HistoricalMisc experiment (i.e., an experiment that combined different specific forcings) data were also utilized in the attribution analysis, including downward shortwave radiation driven by AA and noAA (all forcings except AA). The noAA-derived near-surface air temperature from multiple model ensembles is used in the depressing effect analysis. The piControl experiment provided the natural internal variation utilized in the optimal fingerprinting method (Sect. 2.2.2). The attribution and depressing effect calculation included all the available variable ensembles of each model, including wind speed, precipitation, surface temperature, air temperature, and relative humidity. All datasets were resampled into 1∘ lat/long using a bilinear interpolation method. CMIP5 datasets are available from http://www.ipcc-data.org/sim/gcm_monthly/AR5/Reference-Archive.html (last access: 15 December 2016).
Table 1Summary of the CMIP5 surface downward radiation simulations used in this study.
2.1.2 Remote sensing and assimilation products
Clouds and the Earth's Radiant Energy System Energy Balanced and Filled (CERES EBAF) radiation products
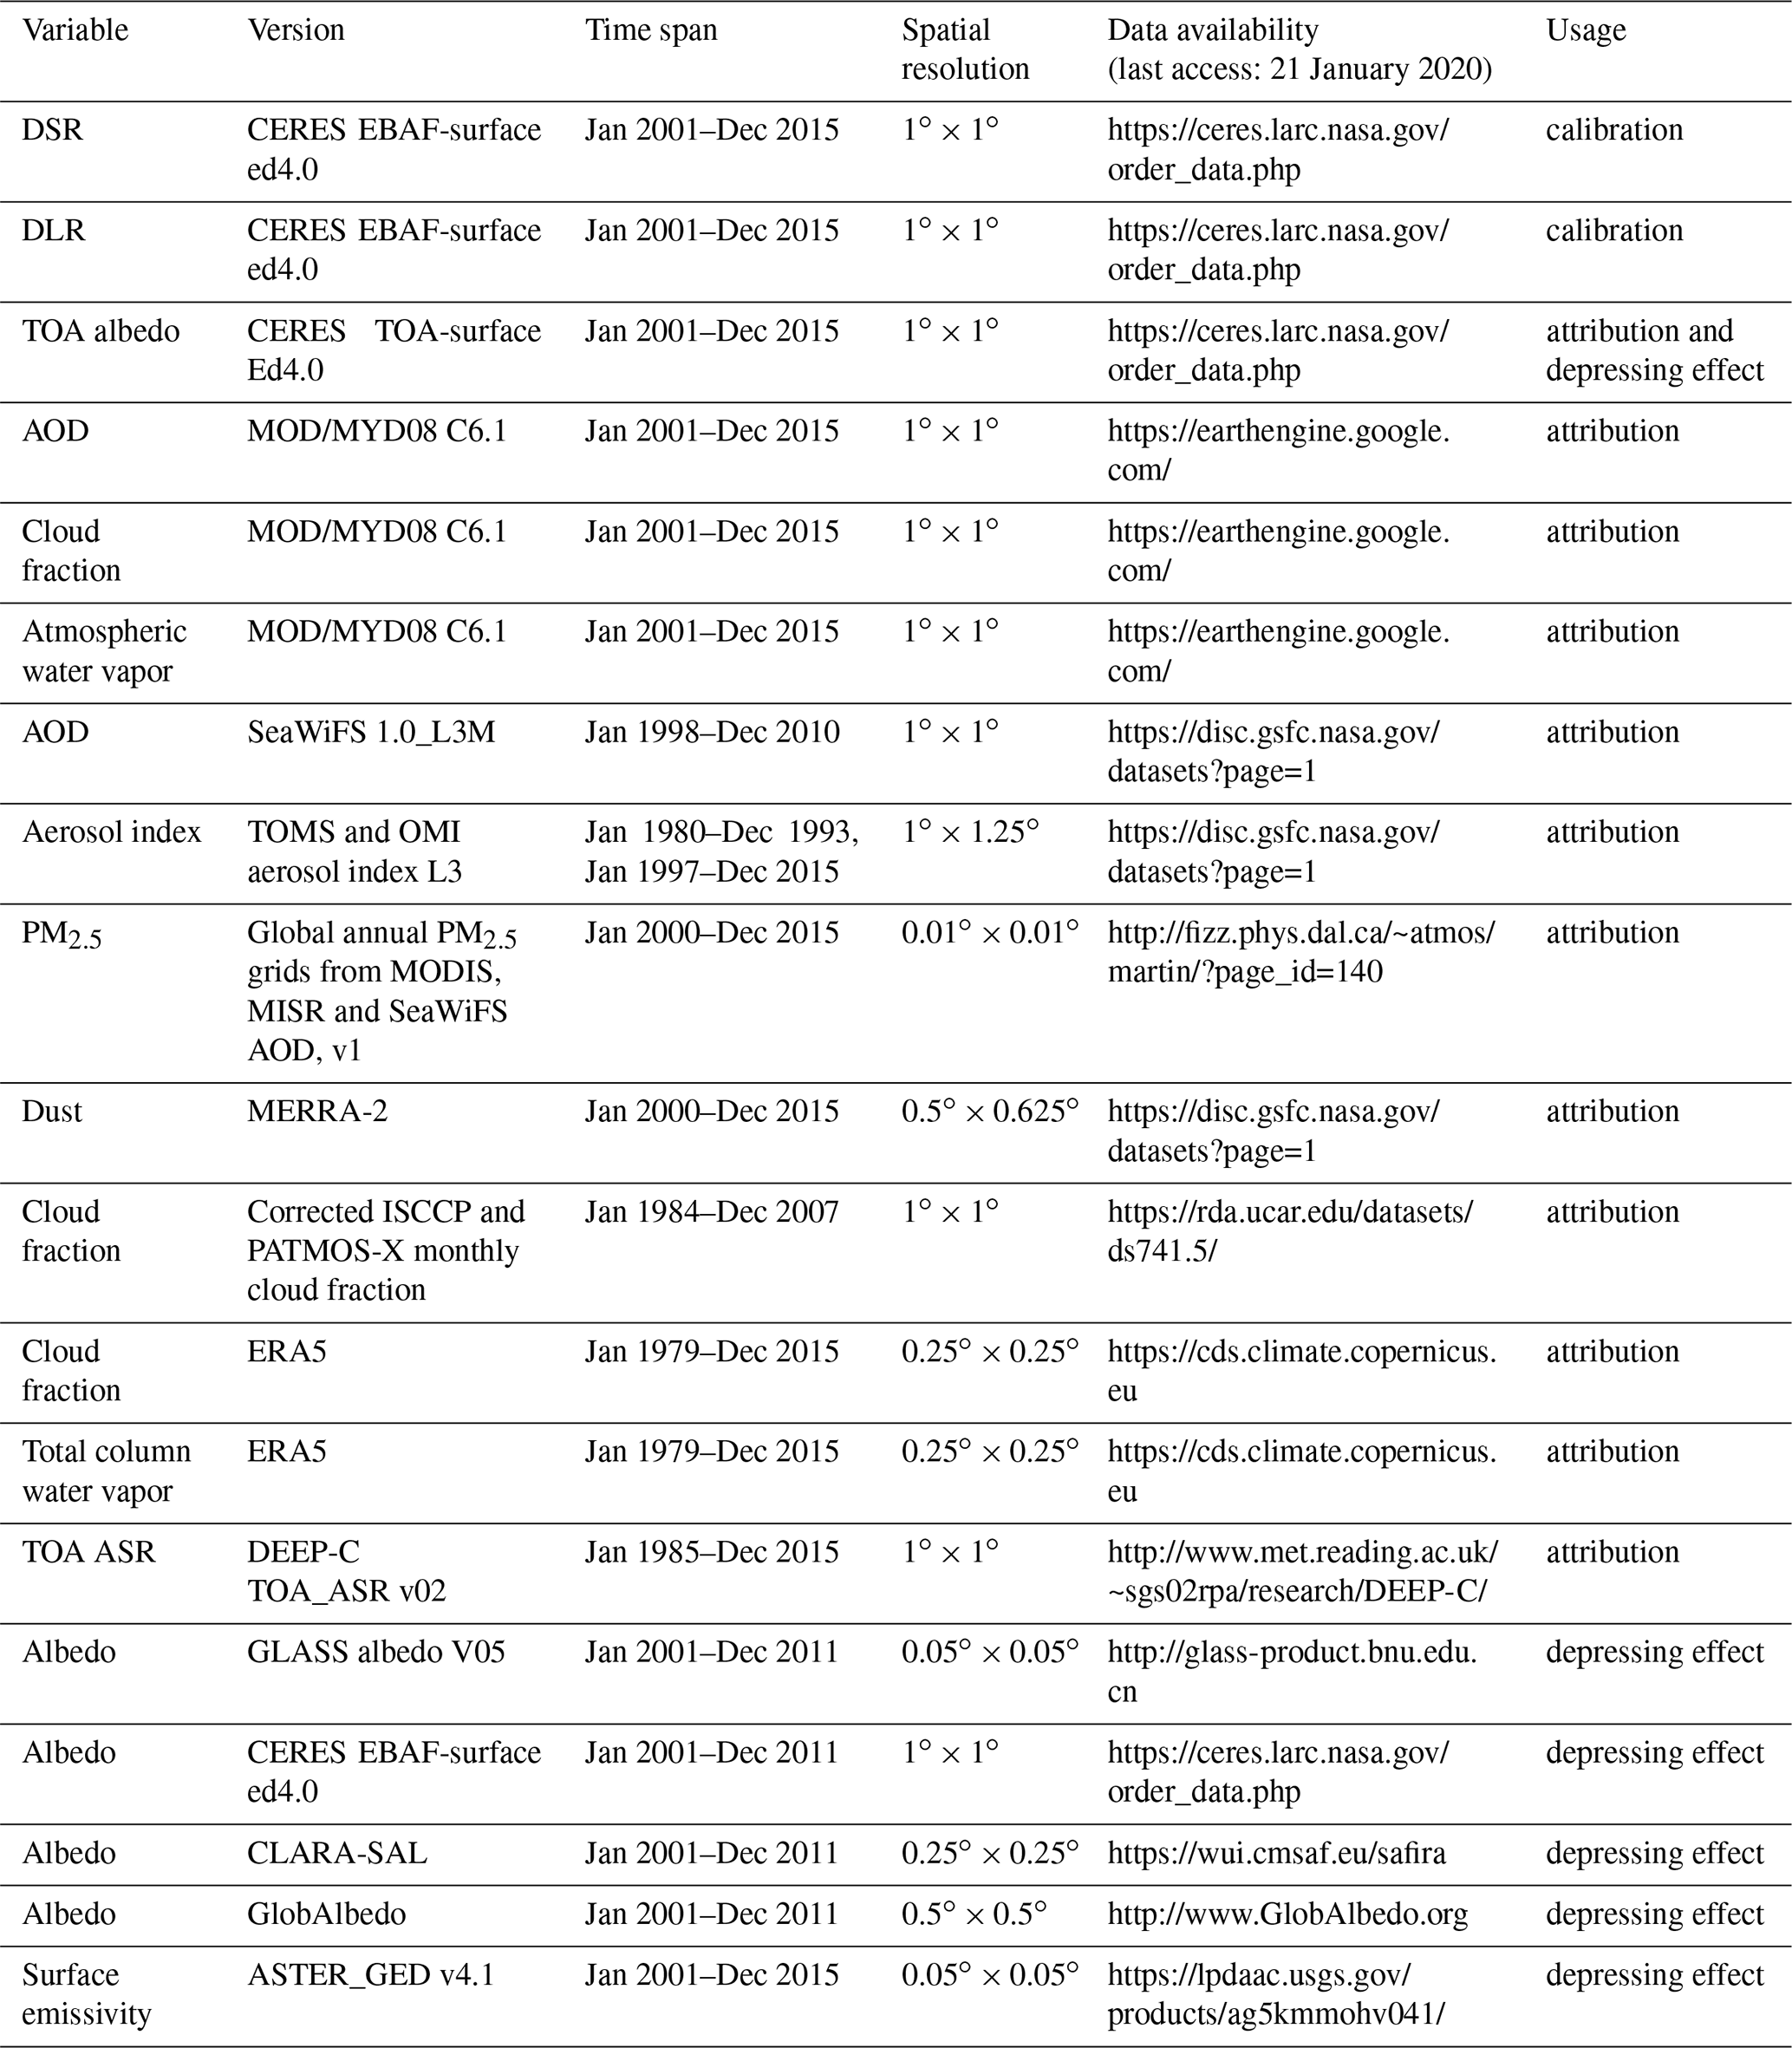
The CERES EBAF-surface edition 4.0 monthly downward shortwave and longwave radiation products (Kato et al., 2018) were employed as a benchmark for calibrating simulated CMIP5 surface radiation by a non-negative least squares (NNLS) regression approach (Bro and De Jong, 1997) (Sect. 2.2.1). Compared to former solar radiation products, CERES EBAF has been comprehensively assessed and considered as the most advanced surface radiation satellite product. It is usually used as a reference for model and reanalysis validation (Zhang et al., 2015, 2016). It can capture the temporal variation of surface radiation by comparing it with surface measurements (Fig. S1 in the Supplement). Besides, former studies have already used the CERES EBAF DSR product for applications and analysis (Feng and Wang, 2018; Ma et al., 2015). This new version contains surface fluxes consistent with the top-of-atmosphere (TOA) fluxes provided from the CERES Energy Balanced and Filled Top of Atmosphere (EBAF-TOA) data product. They also used improved cloud properties that are corrected by cloud profiling radar, and consistent input sources are employed, such as temperature, humidity, and aerosol data, in order to solve the spurious anomaly problem (Jia et al., 2018, 2016). All the advantages help to quantify the absolute magnitude and temporal trend of surface DSR (Feng and Wang, 2019). The CERES EBAF-TOA edition 4.0 monthly TOA albedo product (Loeb et al., 2018) was used for computing the temporal variation in the TOA albedo over the TP in the dimming attribution analysis. The CERES EBAF TOA solar radiation and surface albedo products were used as a monthly climatology. TOA solar radiation was combined with the calibrated surface DSR data to compute the atmospheric shortwave transmissivity in the aerosol depressing effect quantification. Meta information on the included products is summarized in Table 2. All products were pre-processed into 1∘ at a monthly scale for further analysis to unify the spatial and temporal resolutions.
Table 2Meta information on the satellite and reanalysis products. All products were resampled into 1∘ lat/long using bilinear interpolation or spatial averaging in the paper. All data were accessed on 15 December 2018.
Variables: DSR; DLR; TOA albedo; AOD; PM2.5; absorbed solar radiation (ASR). Products' names are illustrated in Sect. 2.
Aerosol, cloud, and dust products
Multiple aerosol, cloud, and dust products were employed for the attribution of solar dimming. The averages of the Moderate Resolution Imaging Spectroradiometer (MODIS) MOD/MYD08 Collection 6.1 AOD550 products that combine the Dark Target and Deep Blue algorithms were used for detecting aerosol variations over the TP. The MOD/MYD08 C6.1 cloud fraction was also included in the attribution analysis. In MODIS C6.1, the brightness temperature biases and trending were substantially reduced compared to C6, which affected the cloud retrieval and also caused large uncertainty with respect to the AOD over elevated areas (Sogacheva et al., 2018). Additionally, the MODIS AOD coverage increased in C6.1.
The Sea-Viewing Wide Field-of-View Sensor (SeaWiFS) AOD550 product (Sayer et al., 2012) utilized 12 candidate aerosol models for generating the aerosol lookup tables (Hsu et al., 2012), and AODs at different wavelengths have been retrieved over land with the use of the Deep Blue algorithm (Pozzer et al., 2015). The SeaWiFS AOD550 product was used for calculating the aerosol temporal variation over the TP.
The aerosol index data were inversed from Total Ozone Mapping Spectrometer (TOMS) Nimbus 7, TOMS Probe, and Ozone Monitoring Instrument (OMI) at different time periods (Ahmad et al., 2006). We employed TOMS N7 records from 1980 to 1992, TOMS Probe from 1997 to 2004, and OMI from 2005 to 2015. By using the 340 and 380 nm wavelength channels (which have negligible dependence on ozone absorption), the aerosol index was defined based on backscattered radiance measured by TOMS and OMI, and the radiance was calculated from a radiative transfer model for a pure Rayleigh condition (Hsu et al., 1999). This approach measures the relative amount of aerosols and has a comparable relationship with AOD (McPeters et al., 1998).
Particulate matter (PM) 2.5, characterizing very small particles that have a diameter of <2.5 µm and are produced by human activities, is a common index of air pollution (Wang et al., 2015). We employed the PM2.5 satellite products to link the aerosol loading with air pollution. The PM2.5 satellite product is calculated from MODIS, the Multi-angle Imaging SpectroRadiometer (MISR), and SeaWiFS AOD products based on a relationship generated from a chemical transport model (Van Donkelaar et al., 2016), and its uncertainty is determined by ground measurements.
Modern-Era Retrospective analysis for Research and Applications version 2 (MERRA-2) aerosol products are the new-generation reanalysis data that have assimilated MODIS and MISR land aerosol products starting from the year 2000 (Randles et al., 2017). Dust column mass density from MERRA-2 was included for comparison of the temporal variation with PM2.5 data to determine whether the AOD increase was due to air pollution.
The International Satellite Cloud Climatology Project (ISCCP) and Pathfinder Atmospheres–Extended (PATMOS-X) provide long-term cloud fraction products; however, the trend is spurious (Evan et al., 2007). This is because of the satellite zenith angle and equatorial crossing time, and because the sensor calibration lacks long-term stability. Corrected cloud fraction datasets (Norris and Evan, 2015), which were used for solar dimming attribution in this paper, employed an empirical method for removing artifacts from the ISCCP and PATMOS-X, and the corrected cloud products have been used for providing evidence for climate change in satellite cloud records in other studies (Norris et al., 2016).
The European Centre for Medium-Range Weather Forecasts (ECMWF) reanalysis 5 (ERA5) (Hersbach and Dee, 2016), as the newest reanalysis dataset, is also employed for attributing the solar dimming. ERA5 is the fifth generation of ECMWF atmospheric reanalyses and follows the widely used ERA-Interim. In comparison to ERA-Interim, it has higher spatial and temporal resolutions and finer atmospheric levels. In addition, it includes various newly reprocessed datasets and recent instruments that could not be ingested in ERA-Interim. ERA5 provides atmospheric profiles with high accuracy by assimilating conventional observations (e.g., balloon samples, buoy measurements) and satellite retrievals. Therefore, total column water vapor and cloud fraction from ERA5 are used in the study.
Diagnosing Earth's Energy Pathways in the Climate system (DEEP-C) TOA albedo was calculated by the DEEP-C monthly TOA absorbed solar radiation (ASR) (Allan et al., 2014) and monthly TOA incoming solar radiation climatology from the CERES EBAF-TOA ed4.0 product. The DEEP-C TOA albedo was used for detecting the radiative influence of increasing aerosols in the dimming attribution. Central to the DEEP-C TOA radiation reconstruction are monthly observations of the TOA radiation from the CERES scanning instruments after 2000 and Earth Radiation Budget Satellite (ERBS) wide field of view (WFOV) non-scanning instrument from 1985 to 1999. A strategy was required to homogenize the satellite datasets (Allan et al., 2014), and ERA-Interim has provided atmospheric information starting from 1979, also using a subset of nine climate models to represent direct and indirect aerosol radiative forcings.
Surface albedo products
According to He et al. (2014), the fine-resolution (0.05∘) climatological surface albedo products retrieved from satellite observations agree well with each other for all the land cover types in middle to low latitudes. Therefore, we selected four commonly used satellite surface albedo products for calculating the surface albedo climatology over the TP, including the CERES EBAF, the Global LAnd Surface Satellite (GLASS), the Clouds, Albedo, and Radiation-Surface Albedo (CLARA-SAL), and the GlobAlbedo from 2001 to 2011 (covered by the four products). First, we generated the monthly climatological albedo of each satellite product, and we computed all standard deviations of any possible three-product climatology combinations at each pixel. Then, for each pixel, we chose the product combination that had the lowest standard deviation and calculated the mean value to represent the ground truth climatology.
The GLASS albedo product from MODIS observations is based on two direct albedo estimation algorithms (He et al., 2014): one designed for surface reflectance and one for TOA reflectance (Qu et al., 2014). The statistics-based temporal filtering fusion algorithm is used to integrate these two albedo products (Liu et al., 2013a). The GLASS albedo product has been assessed by ground measurements and the MODIS albedo product, and has a comparable accuracy (Liu et al., 2013b). The CLARA-SAL product is retrieved from Advanced Very High Resolution Radiometer (AVHRR) observations (Riihelä et al., 2013). Atmospheric correction was done by assuming AOD and ozone are constant. Sensor calibration and orbital drift have been dealt with and the uncertainty of monthly albedo estimation is about 11 %. The GlobAlbedo product uses an optimal estimation approach for European satellites, including Advanced Along-Track Scanning Radiometer (AATSR), SPOT4-VEGETATION, SPOT5-VEGETATION2, and Medium-Resolution Imaging Spectrometer (MERIS) (Lewis et al., 2013). MODIS surface anisotropy information was used for gap filling. More detailed algorithm introductions and comparison can be found in He et al. (2014).
Advanced Spaceborne Thermal Emission and Reflection Radiometer Global Monthly Emissivity Dataset (ASTER_GED)
ASTER surface emissivity data were also used for calculating the aerosol depressing effect. The ASTER_GED data products are generated using the ASTER temperature emissivity separation algorithm (Gillespie et al., 1998) atmospheric correction method. This algorithm uses MODIS atmospheric profile product MOD07 and the MODTRAN 5.2 radiative transfer model, snow cover data from the standard monthly MODIS/Terra snow cover monthly global 0.05∘ product MOD10CM, and vegetation information from the MODIS monthly gridded normalized difference vegetation index (NDVI) product MOD13C2 (Hulley and Hook, 2010). Surface broadband emissivity is calculated according to Cheng et al. (2014).
2.1.3 Ground measurements
Utilized for surface radiation validation, ground radiation measurement sites over the TP are mainly from two ground networks – Global Energy and Water Exchanges (GEWEX) Asian Monsoon Experiment (GAME) (Yasunari, 1994) and Coordinated Energy and Water Cycle Observation Project (CEOP) Asia-Australia Monsoon Project (CAMP) (Leese, 2001) – that cover the years 1995–2005. GAME was proposed as an international project under the GEWEX program to understand the processes associated with the energy and hydrological cycle of the Asian monsoon system and its variability. The data are available at http://www.hyarc.nagoya-u.ac.jp/game/phase-1/game-aan.html (last access: 10 December 2016). CAMP, which followed GAME, focused on water and energy fluxes and reservoirs over specific land areas and monsoonal circulations. These data are available at http://metadata.diasjp.net/dmm/doc/CEOP_CAMP_Tibet-DIAS-en.html (last access: 10 December 2016). We ignored the spatial representative difference between site observations and downward radiation datasets in line with former studies (Wang and Dickinson, 2013; Zhang et al., 2015).
We also collected ground observations from five China Meteorological Administration (CMA) sites over the TP to detect long-term temporal variation of surface DSR from 1958 to 1980. The observations after the 1980s are not included due to the data discontinuity issue (Zhang et al., 2015). Even if the amount of sites is not large enough to represent the whole TP, the sampled surface measurements can reflect the ground truth and prove the dimming over the TP (Fig. S2). Overall, 22 sites that observed downward radiation in the TP were included in this study, and their distribution is shown in Fig. 1. The Tibetan Plateau region is defined as the Chinese Qinghai–Tibet Plateau in this paper, covering most of the Tibet Autonomous Region and Qinghai in western China (Wang et al., 2016).
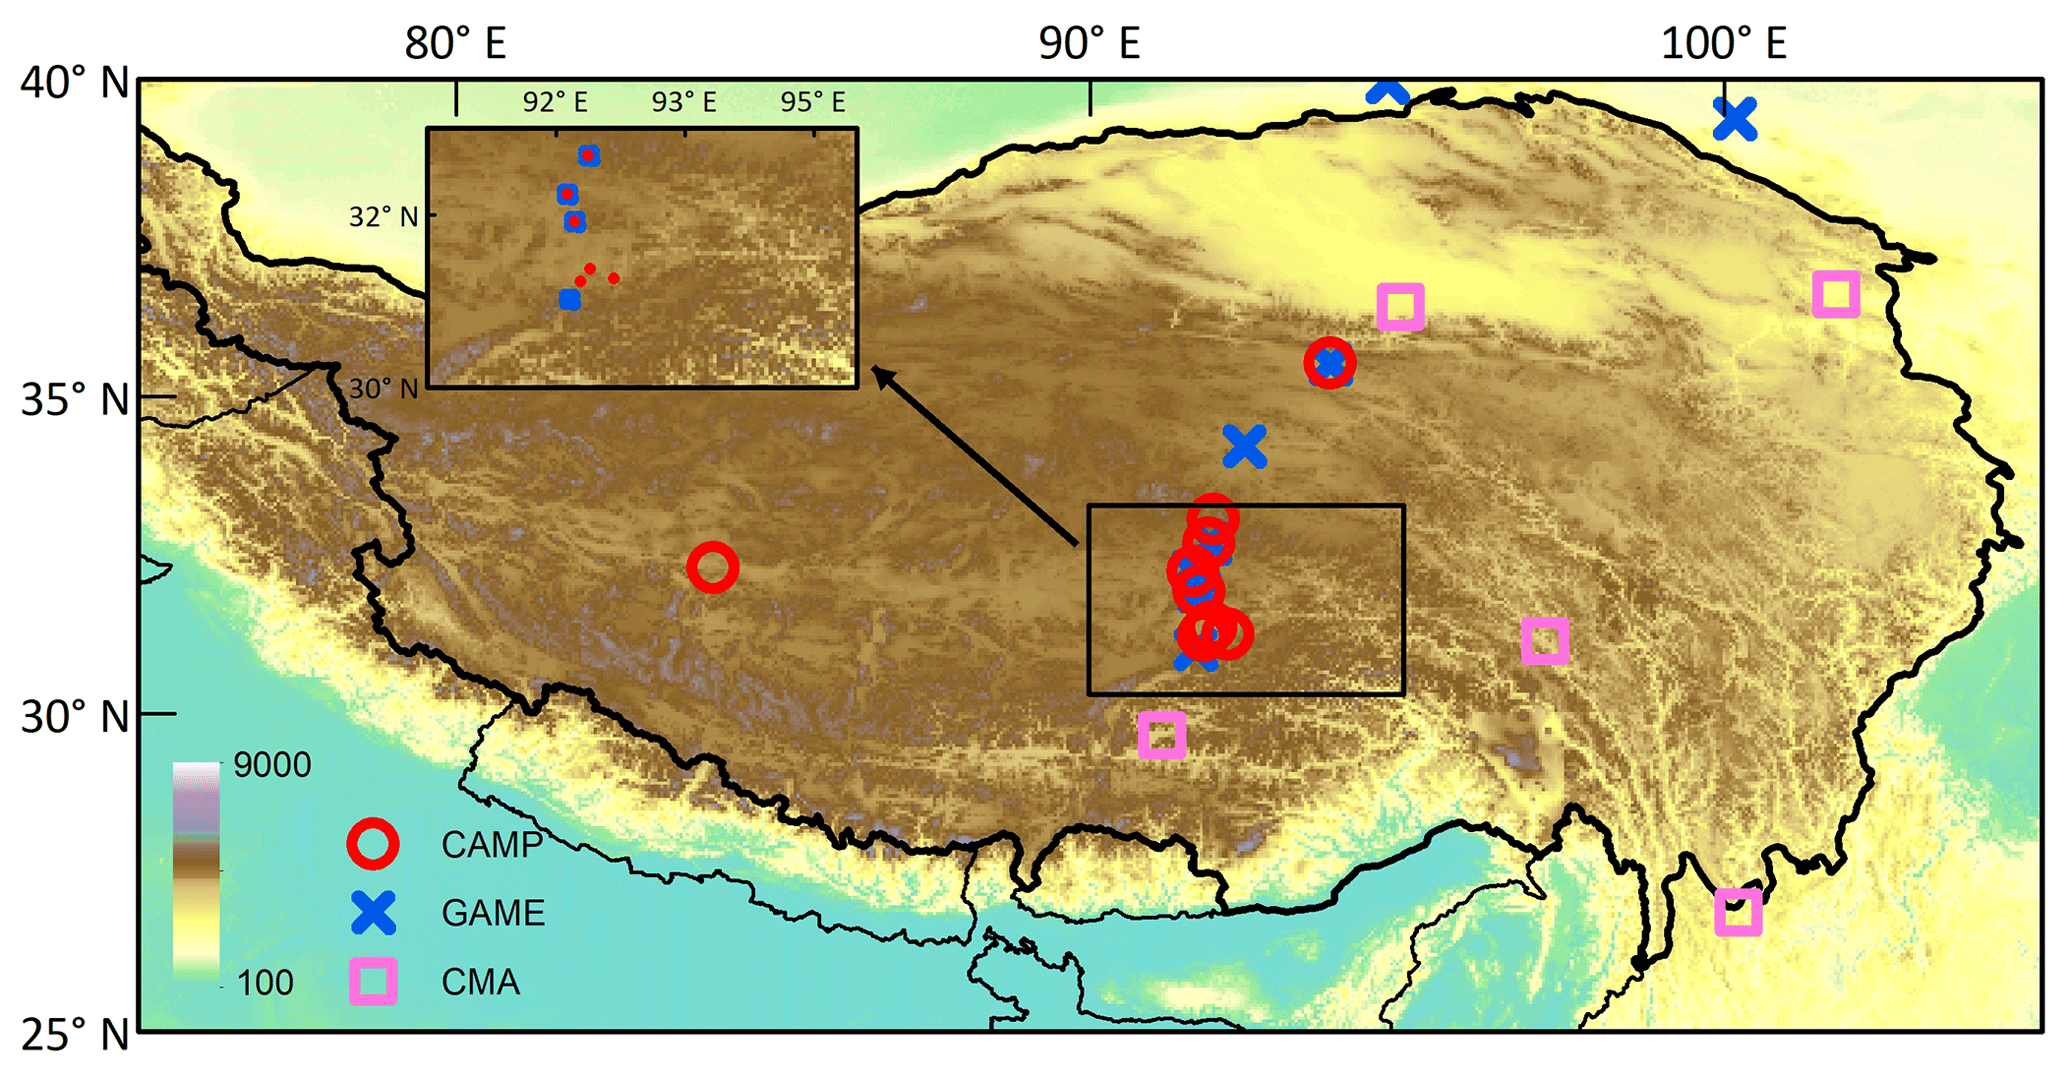
Figure 1Site distribution. Observations from three ground networks (GEWEX GAME, CEOP CAMP, and CMA) are from 1960 to 2005. Vector layer data are free for academic use, licensed by the Database of Global Administrative Areas (GADM). Elevation data are provided by the National Oceanic and Atmospheric Administration (NOAA) (GLOBE et al., 1999).
2.1.4 Surface air temperature datasets
Four long-term surface air temperature datasets were used for characterizing the temporal variation over the TP and corresponding aerosol depressing effect: the Berkley Earth Surface Temperature land surface air temperature dataset (BEST-LAND) (Rohde et al., 2013), Climate Research Unit Temperature Data Set version 4 (CRU-TEM4v) (Jones et al., 2012), National Aeronautics and Space Administration Goddard Institute for Space Studies (NASA-GISS) (Hansen et al., 2010), and NOAA National Center for Environmental Information (NOAA-NCEI) (Smith et al., 2008). These data were interpolated and homogenized from ground observation networks. Rao et al. (2018) provided data assessment of the four air temperature datasets, and a brief summary of the datasets is provided in Table S1 in the Supplement.
2.2 Methodology
2.2.1 Calibration method
Long-term series surface downward radiation data are urgently needed for characterizing the spatial–temporal variation of surface radiation budget over the TP, and they are also essential for the solar dimming attribution and calculating the aerosol radiative forcing and depressing effect on the increasing air temperature. To generate a long-term series surface downward radiation data record with high accuracy, a NNLS regression (Bro and De Jong, 1997) approach was employed for merging multiple CMIP5 model records. The non-negative multiple linear models are utilized because the non-negativity constraint of NNLS only applies a non-subtractive combination of all components (Eq. 1):
where y is the calibrated radiation data; ai is the coefficient of each CMIP5 model simulation xi.
The calibration was done pixel by pixel to avoid the influence of geolocation and elevation. Given that downward radiative fluxes are always positive, a key assumption here is that the CERES radiative flux can be expressed as a non-negative linear combination of each model output at each grid. One CMIP5 model may hardly present the variations in the actual radiative fluxes but should not have any negative contributions. To avoid the influence from the seasonal cycle on the expression of the interannual variation of the radiative flux, the fusion models were generated monthly. The CERES satellite products aid NNLS to provide the best-weighted combination for each CMIP5 model, producing improved validation results compared to those produced by only using the mean of all model outputs. Mean bias error (MBE), root mean square error (RMSE), and R2 were utilized for quantifying site validation and comparing with the mean CMIP5 data and multiple satellite and reanalysis product fused radiation data from Shi and Liang (2013). The temporal variation and comparison among products are calculated by using latitude-weighted average over the TP. A detailed description of assessment methods is introduced in Jia et al. (2018).
2.2.2 Attribution analysis
Optimal fingerprinting is a common method in the attribution analysis of model data. It is based on a linear relationship, and, if the scaling factor is >0 at a certain significance level, the variable has a positive contribution toward the responding variable. The optimal fingerprinting method has been widely applied for climate change detection and attribution (Sun et al., 2014; Zhou et al., 2018). It is assumed that the response variable has a linear relationship with different driving variables (Eq. 2):
where ε is the modeled natural internal variation obtained from the CMIP5 piControl experiment, and βi is the scaling factor of each driving variable. xi is the DSR simulation results from averages of aerosol-driven experiment ensembles and non-aerosol-driven experiment ensembles in this study. If the scaling factor is >0 at a certain significance level (in this study, 5 %–95 % uncertainties are estimated based on Monte Carlo simulations), the variable has a positive contribution toward the responding variable. In the CMIP5 HistoricalMisc experiment, anthropogenic forcings are focused; thus, in this study, only experiments with anthropogenic aerosols (AAs) and without AAs (noAAs) were employed for the attribution. Impact simulations of cloud/water vapor are not covered in the experiment, and we assumed that the noAA experiment can represent the model simulation about the cloud/water vapor impacts on surface downward shortwave radiation.
2.2.3 Depressing effect
For quantitating the depressing effect of aerosols on surface warming over the TP, the shortwave and longwave radiative effects must be separated. To calculate the relationship between the surface air temperature increase and surface radiation components, it is necessary to decompose the energy sources into separate mechanisms. The land surface energy balance is given by Eq. (3):
where Sn is the net shortwave radiation, Ln is the net longwave radiation, λ is the latent heat of vaporization, E is evapotranspiration, H is the sensible heat flux, and G is the ground heat flux that was neglected for the long time period. They can be decomposed in Eq. (4) as
where S is the TOA solar radiation, τ is the atmospheric shortwave transmissivity (ratio between the calibrated surface DSR and S), α is the surface albedo, εs is the surface broadband emissivity, Ta is the air temperature, Ts is the surface skin temperature, and ra is the aerodynamic resistance at 2 m height. σ is equal to W m−2 K−4, ρ is 1.21 kg m−3, and Cd is 1013 J kg−1 K−1. εa is the air emissivity parameterized based on Carmona et al. (2014) that has the highest accuracy by comparison with other parameterization methods (Guo et al., 2019). Considering that the ΔTa is mainly dominated by the change in Ts interacting with Ta through radiative and thermal processes and the change in atmospheric circulation (, for example, advection of cold and warm air masses), a first-order approximation of the direct near-surface temperature response to each component (Zeng et al., 2017) is derived from Eqs. (5) and (6):
where the f is
and f−1 represents the land surface air temperature sensitivity to 1 W m−2 radiative forcing at the land surface. We assumed that S, λ, ρ, Cd, σ, and εs are independent of Ts. We employed the α, εs, and S climatologies and the mean values of the satellite products for several years (details in Table 2). Therefore, the Ta response to the surface DSR change is calculated by the first term (related to Δτ) in the formula. are not computed in the analysis because they have limited impact on aerosol radiative effect. Based on Eq. (7),
from Eq. (8), we can also obtain the relationship between ΔTa and ΔDLR:
We then added the depressing effect from ΔDSR and ΔDLR to get the aerosol depressing effect on the TP climate warming. The first-order approximation method included many reliable remote sensing products, and it is reasonable to use climatology of the TOA and surface variables in the equation (Fig. S8). We also calculated the depressing effect of AAs by employing the CMIP5 air temperature data from multiple noAA simulations, which used physical parametrization methods. The two methods can validate each other. We then compared the two results (Fig. S7) and calculated the mean value as the final depressing effect result.
3.1 Validation and comparison of the calibrated downward radiation data
From January 1995 to December 2005, in situ observations were collected at 17 sites for monthly validation of DSR and DLR. The scatter diagrams and validation results of the CERES calibrated data, mean CMIP5, and reanalysis and satellite fused product from Shi and Liang (2013) at two networks are shown in Fig. 2.

Figure 2Scatterplot of site validation results from two ground networks: (a, b) DSR and (c, d) DLR.
Figure 2 indicates that the CERES calibrated datasets have the lowest bias and RMSE for DSR and DLR validation at the GAME and CAMP networks, and the R2 at the CAMP network has the highest. The bias of the calibrated DSR at CAMP (GAME) is −0.27 (−3.68) W m−2, and the RMSE is 20.59 (25.27) W m−2, whereas the bias of calibrated DLR at CAMP (GAME) is 0.63 (−4.31) W m−2, and the RMSE is 11.90 (21.08) W m−2. We can conclude that by using the NNLS method, the CERES calibration decreased the data bias and RMSE and improved the R2, providing the best-weighted combination for each CMIP5 model and producing better validation results than those produced by only using the mean of all model outputs and data from former studies. The minor validation RMSE difference (4.68 W m−2 in DSR and 9.18 W m−2 in DLR) between the two networks is mainly caused by disparate instruments and different site numbers. We ignored the spatial mismatch between site observations and downward radiation datasets in line with former studies (Wang and Dickinson, 2013; Zhang et al., 2015). Moreover, the annual anomaly temporal variation was compared with the data from Shi and Liang (2013) and is shown in Fig. 3.

Figure 3Trend comparison between calibrated downward radiation datasets and Shi and Liang (2013). Temporal variations over the TP in panels (a) and (b) were averaged by the 5-year moving window in order to remove the impact of annual variability.
The annual temporal variation illustrates that two products have a similar temporal trend of DSR and DLR at a decadal scale over the TP, and that the CERES calibrated data have longer time spans. The DSR output shown by Shi and Liang (2013) has a slightly larger decreasing trend, which may be because GEWEX and ISCCP surface radiation products have high weights in the model, and the related spurious cloud trend causes an overestimated dimming trend (Evan et al., 2007). Feng and Wang (2018) utilized a cumulative probability-density-function-based method to fuse CERES and longer time reanalysis surface DSR data; however, in their study, they only calibrated individual reanalysis, whereas in the present study we merged multiple CMIP5 data that cover a longer time span and include more climate general model simulations. Besides, most reanalysis did not include aerosol variation information, which is important to determine the DSR decadal variation and characterize the aerosol radiative forcing.
3.2 Characterizing long-term variations in air temperature and surface downward radiation over the Tibetan Plateau
Air temperatures slowly increased from 1850 to 2015. The DLR increased gradually prior to 1970 but rapidly during the following period. The DSR remained stable and decreased rapidly afterward, revealing an opposite trend to the DLR and air temperature (Fig. 4a). In total, DSR decreased by 4.1 W m−2 from 1850 to 2015 with a gradient of −0.53 W m−2 per decade after 1950, and DLR increased from 0.21 to 1.52 W m−2 per decade after 1970. Air temperature has increased by 1.39 K since 1850. Prior to 1950, increased air temperature was mainly triggered by increased DLR. Air temperature slightly decreased from 1950 to 1970, because both DSR and DLR decreased during that period. Although DLR increased rapidly after 1970, the air temperature gradient has not changed considerably, mainly due to solar dimming diminishing the greenhouse effect. The solar dimming over the TP is also detected by long-term ground DSR observations from five CMA sites starting from 1958 (Fig. S2) when the measurements were set up. Because heat exchange with other regions in the summer and winter is mostly counteracted, we ignored the interaction at decadal scales and suggested that air temperature is mainly driven by local radiation components. All four surface air temperature datasets show similar temporal trends, especially on the decadal scale.
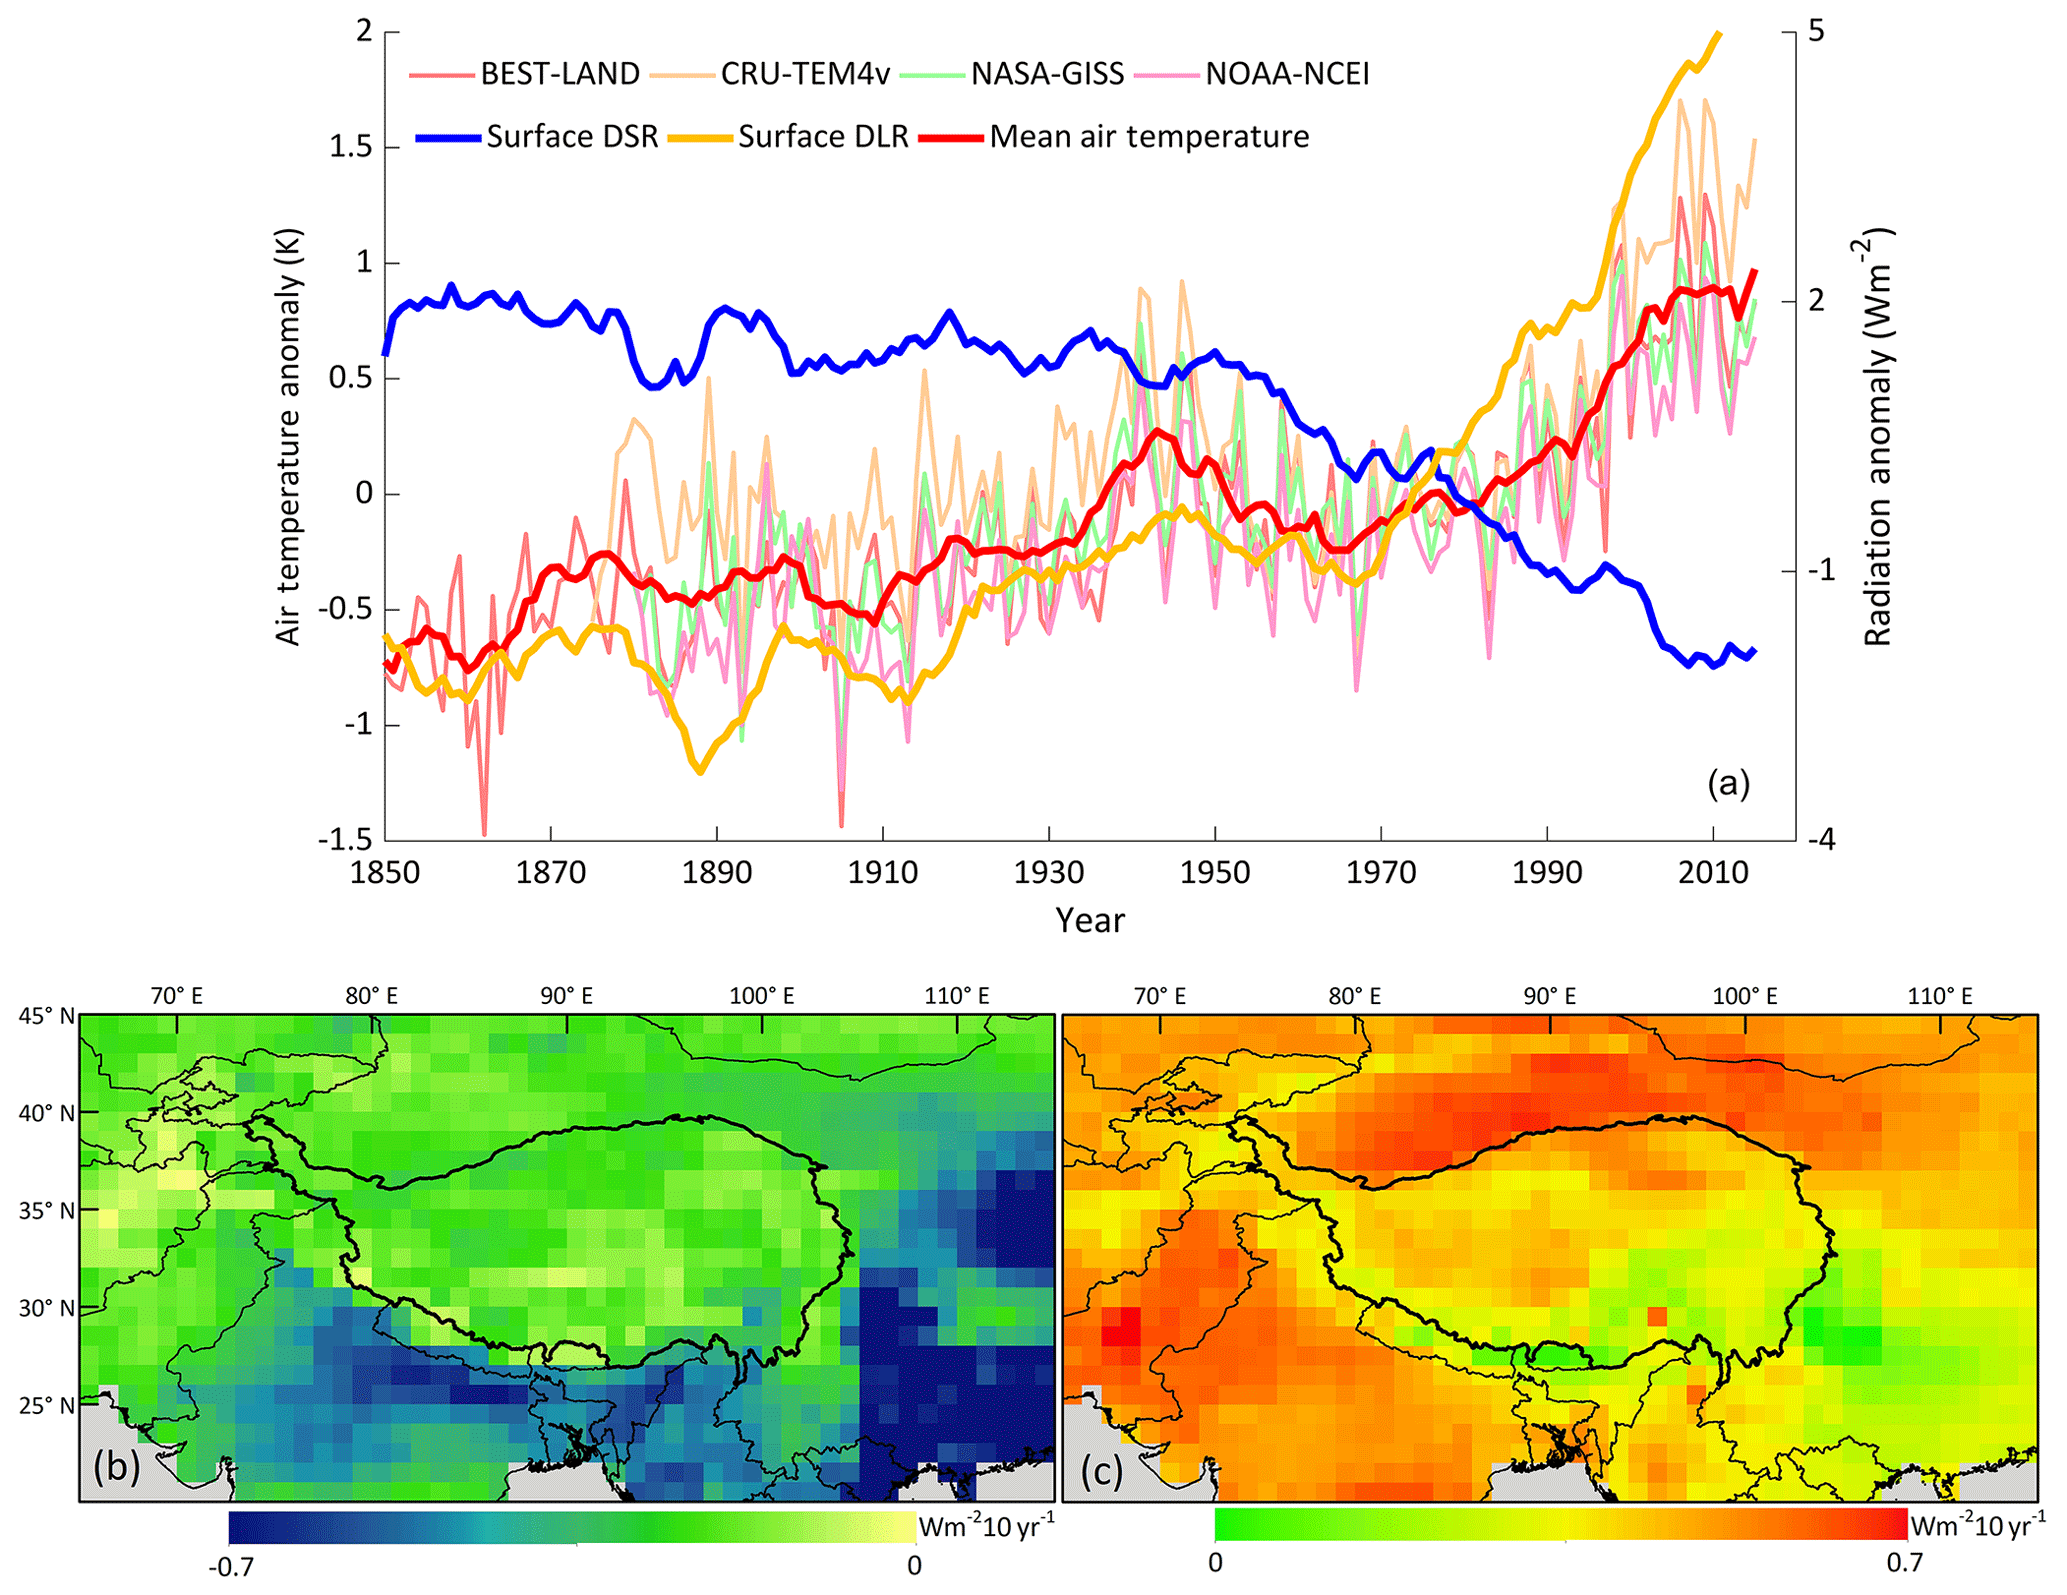
Figure 4Spatiotemporal variations in surface DSR and DLR over the TP and its neighboring regions from 1850 to 2015 based on calibrated radiation results. Mean air temperature is calculated by the four air temperature datasets. Temporal variations in panel (a) were averaged by the 10-year moving window in order to remove the impact of annual variability. The trends of DSR (b) and DLR (c) are significant, with p values < 0.01. Vector layer data are free for academic use, licensed by GADM.
The long-term spatiotemporal variations in downward surface radiation over the TP and surrounding regions are illustrated in Fig. 4b and c. Figure 4b demonstrates that the DSR decrease rate in the central region is about −0.08 W m−2 per decade, much lower than in surrounding areas. The fastest decrease in DSR appears in the southeastern TP at a gradient of about −0.37 W m−2 per decade since 1850. Northern India, south Asia, and southern China show a substantially dimming trend with a gradient of about −0.65 W m−2 per decade. The DLR has increased, especially in the central and northern TP (Fig. 4c). However, the rate of increase is much slower in the southern and southeastern TP, with a gradient of approximately 0.21 W m−2 per decade.
3.3 Attribution to the Tibetan Plateau solar dimming
3.3.1 Analysis of satellite products and reanalysis
Both observed satellite products and reanalysis datasets provide evidence that AAs are the major driver of the significant decrease in the DSR over the TP. The AOD products from the SeaWiFS (Sayer et al., 2012) and MODIS 08 C6.1 (Levy et al., 2007) satellite products demonstrated similar annual anomalies and slightly increasing trends after 1998 (Fig. 5a). The aerosol index, which measures the relative amount of aerosols and has a comparable relationship with AOD (McPeters et al., 1998), shows that the number of aerosols has been escalating over the past 30 years (Fig. 5a). The AOD has increased 0.0098 over the TP based on the trend, causing approximately 1.97 W m−2 of dimming since 1998, according to multiple CMIP5 AA simulations over the TP and near-linear relationship between AOD and radiative forcing at this magnitude level (Yang et al., 2012). This is larger than the calibrated DSR dimming result of 1.10 W m−2, and we inferred that some of the dimming caused by the aerosol increase is offset by decreased cloud cover (Fig. 5c).
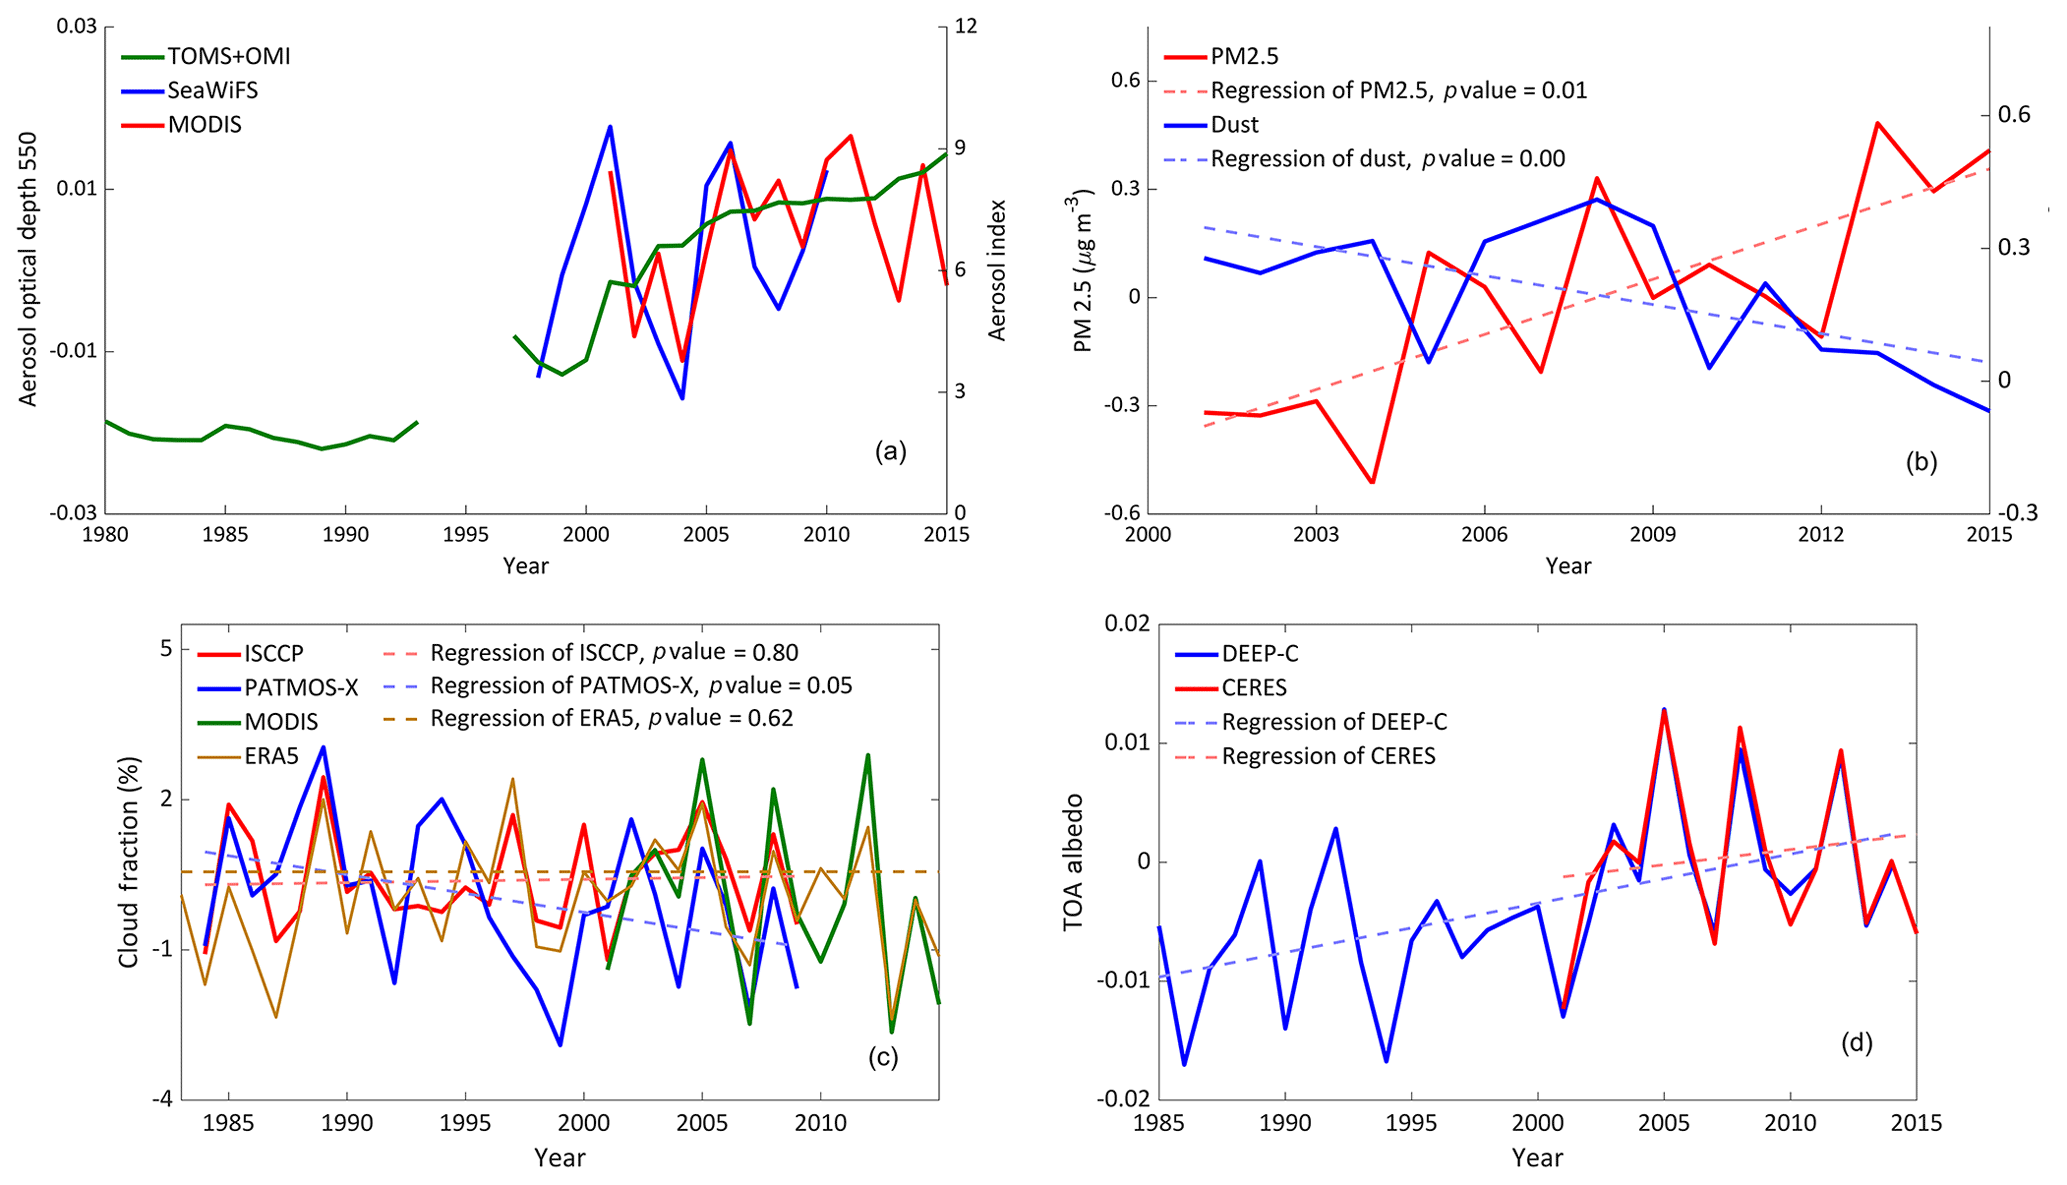
Figure 5Temporal variation in detected factors from remote sensing products over the TP: (a) AOD and aerosol index, (b) PM2.5 and dust, (c) cloud fraction, and (d) TOA albedo.
The PM2.5 satellite product (Van Donkelaar et al., 2015) also showed an increasing trend after 2000 (Fig. 5b), while MERRA-2 dust loading (Randles et al., 2017), which has been assimilated from MODIS and MISR land aerosol products starting from the year 2000, has been decreasing. PM2.5, characterizing very small particles that have a diameter of less than 2.5 µm and are produced by human activities, is a common index for measuring air pollution (Wang et al., 2015). The variation in PM2.5 and dust indicates that increased aerosols are mainly from air pollution rather than from natural causes.
Based on the corrected cloud fraction datasets (Norris and Evan, 2015) from ERA5, the PATMOS-X, and the average cloud fraction from MOD/MYD08 C6.1, the results demonstrate that the cloud fraction over the TP has been decreasing starting from 1980 (Fig. 5c), indicating a trend opposite to the TP solar dimming. The temporal variation of ISCCP and ERA5 is stable with a larger p value than 0.05. Even though different long-term products have uncertainties especially before 1990, the overall variation decreases after 1990. Therefore, we inferred that the overall trend demonstrated that cloud coverage is not a dimming driver. Moreover, former studies also found the decreasing cloud coverage trend based on site observations starting from the 1960s (Kuang and Jiao, 2016; Yang et al., 2012). The overall temporal variation of TOA albedo from DEEP-C (Allan et al., 2014) and CERES presents an increasing trend with a magnitude of ∼0.01 over the TP from 1985 to 2015 (Fig. 5d). The TOA albedo is an important component of Earth's energy budget and is mainly influenced by clouds and aerosols. It can be inferred that aerosols over the TP were recently increasing, reflecting more solar radiation into space and causing the TOA albedo increase and solar dimming at the surface.
Yang et al. (2012) argued that aerosols had limited radiative forcing compared with the DSR decrease over the TP; however, ground observations used in these studies were only from one AErosol RObotic NETwork (AERONET) site at the center of the TP (30.773∘ N, 90.962∘ E). Furthermore, the site was less impacted by surrounding regions and thus cannot represent the entire TP, especially the edge regions that are more easily contaminated by air pollution from surrounding areas (Cao et al., 2010).
Yang et al. (2012, 2014) also suggested that the increasing trend in the deep convective clouds was attributed to the solar dimming; however, our analysis has a different conclusion. We used the cloud top pressure and cloud optical depth released by MODIS at different atmospheric levels to detect which pixels are deep convective clouds. The threshold is based on the definition of ISCCP (Rossow and Schiffer, 1999). Then, we calculated the ratio of deep convective clouds in all pixels over the TP and obtained the temporal variation and spatial distribution. Moreover, regardless of cloud type, the cloud mainly affects the DSR by cloud optical depth, so we reviewed the temporal variation of the total cloud optical depth. The analysis illustrates that even though the ratio of deep convective clouds is increasing (Fig. S3a), deep convective clouds only appeared in the south and west of the TP (Fig. S3b). Additionally, the overall cloud optical depth has been slightly decreasing over the past 15 years (Fig. S3a). Therefore, deep convective clouds have little influence over the entire TP.
By analyzing MODIS satellite products and ERA5 reanalysis, we also assessed the temporal variation of the atmospheric water vapor and total column water vapor (Fig. S4), suggested as an important driving factor of the solar dimming by Yang et al. (2012), and the temporal variation illustrated that water vapor has been considerably decreasing since 1998 over the TP. However, solar dimming did not show a similar turning point around 1998 in their site observations and our results, and rather the overall increasing trend of water vapor starting from 1980 was limited. Therefore, the influence of water vapor variations can be ignored. The Yang et al. (2012) study also identified this phenomenon by using ECMWF reanalysis (ERA)-40; however, the analysis result ceased in 2005 and did not show an overall turning trend.
Although satellite product analysis only began in 1980, observational records have existed for more than 30 years, and the spatial extent of the satellite data over the entire TP supports our conclusions. Figure 4b shows that the regions of China, India, and south Asia surrounding the TP have large populations and serious air pollution. Balloon-borne observations (Tobo et al., 2007) and remote sensing products (Vernier et al., 2015) have shown that fine aerosols can be transported over the TP region and enter the Asian tropopause aerosol layer by deep convection via two key pathways over heavily polluted regions (Lau et al., 2018). Moreover, other studies also reported that black carbon deposition altered surface snow albedo and accelerated melting in the TP mountain ranges (Qian et al., 2015). Because of the decreasing dust amount trend the TP, we infer that the increased aerosols are mainly due to air pollution around the TP. Although the TP is still one of the cleanest areas in the world and the aerosol climatology is low, the dimming can be demonstrated by the variation of DSR decadal anomalies. It is necessary to point out that direct radiative effects (scattering and absorption effect) play a dominant role in the interactions between aerosols and the atmosphere (Li et al., 2017) when the aerosol loading is low. Thus, the TP is easily affected by the aerosol increase under a clean atmosphere condition.
3.3.2 Analysis of model simulations
The long-term model simulation results also show that AAs are the main driving factor of solar dimming. Based on the multiple CMIP5 HistoricalMisc (an experiment combining different specific forcings) model ensembles, we found that the calibrated DSR and the DSR driven by AAs and noAA had stable variations before 1950. The calibrated DSR obviously decreased after 1950 (Fig. 6a). Only the AA-driven DSR can capture the dimming trend starting from 1950; therefore, we can conclude that AAs are the main signal at the decadal scale, while the factors in the noAA-driven model process (such as cloud cover and water vapor) can be ignored. We also detected the AA and noAA driving factors using the optimal fingerprint method, and observed that AAs had a positive contribution, especially after 1970 (Fig. 6b) when AA and historical data showed considerable decrease, while noAA remained stable. The impact factor of noAA is negative, and the satellite cloud products reveal the same conclusion after 1980 (Fig. 5c), i.e., that the cloud fraction has been decreasing and has had a negative contribution to the TP solar dimming. DSR was driven by more forcings in noAA than AA experiments, introducing more uncertainties among model simulations after 1970. Therefore, it is possible that the noAA impact factor shows a larger uncertainty bar. We inferred that cloud coverage dominated the negative natural impact because water vapor has been quite stable since the 1980s (Fig. S4), which had little impact on the dimming.
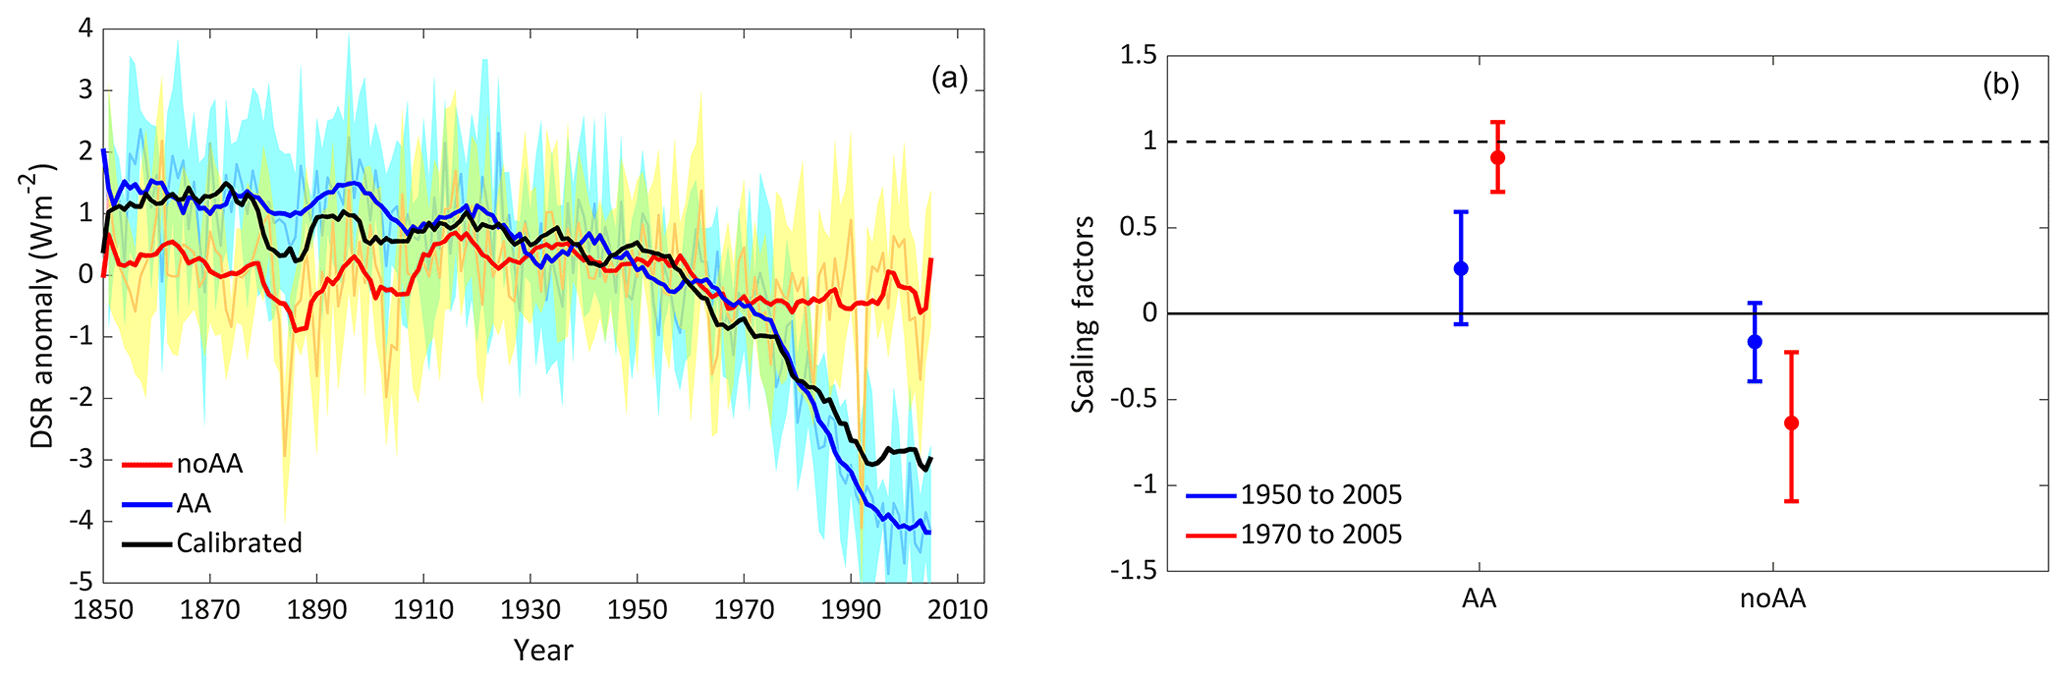
Figure 6(a) Temporal variations of the calibrated, anthropogenic aerosol-driven (AA-driven) and noAA-driven DSR. Temporal variations were averaged by a 10-year moving window to remove the impact of annual variability. The shaded area is the standard deviation of model average. (b) Scaling factors of the AA and noAA forcing simulation on DSR based on optimal fingerprinting method. The p value of the impact factor in 1950–2005 (1970–2005) is 0.22 (0.04).
General climate models have coarser spatial resolution, causing a lower elevation in the model than in reality, and this may cause higher AOD estimation over highland area. However, when we compared the multiple CMIP5 AODs with site measurements, they demonstrated that the overall magnitude and monthly variation of CMIP5 AODs match the AERONET observations (Fig. S5), even though they were slightly higher than the AODs in the non-monsoon season. Therefore, it is reasonable to include the CMIP5 AA and noAA simulations in the attribution work. Results of multiple models have uncertainties that are illustrated as colored shadows (standard deviation in each year), and the impact factor of analysis in 1970–2005 passed the significance test.
3.4 Depressing effects of aerosols on climate warming in summer
By comparing the first 30 years of climatology (1850–1880) and the last 30 years of climatology (1985–2015), we found that the TP solar dimming is stronger in summer (from June to August) at the same time that the increasing magnitude of the surface air temperature is the smallest (Fig. 7a). Multiple CMIP5 model ensembles show that changes in precipitation and wind speed over the TP during different seasons were related to the AOD increase. Precipitation in summer had the greatest decrease relative to other seasons, while AOD increased more in the summer (Fig. 7b). Furthermore, the wind speed clearly decreased in summer compared to other seasons (Fig. 7c). The TP is a strong heat source in summer, forming a sensible-heat-derived air pump that dominates the atmospheric circulation (Wu et al., 2015) and conveys aerosols into the lower stratosphere (Lau et al., 2018). However, increased precipitation will reduce the aerosol duration lifetime considerably (Liao et al., 2015), and wind speed also controls aerosol diffusion. Hence, it is evident that less precipitation and lower wind speeds in summer resulted in greater aerosol stability.

Figure 7Relationships between variable changed magnitudes at the seasonal scale from 1850 to 2015: (a) the decrease in DSR and increase in air temperature, (b) precipitation change and AOD increase, (c) wind speed change and AOD increase. Data are from the CMIP5 model average.
Although aerosols have considerably influenced summer downward radiation over the TP, their radiative effect on climate warming has not been quantitatively calculated. By employing the multiple noAA model simulations, the temporal variations of aerosol radiative forcing over the TP are illustrated in Fig. S6. It demonstrates that the aerosol radiative forcing has been increasing about 8.08 W m−2 by calculating the difference between the first 30 years of climatology (1850–1880) and the last 30 years of climatology (1985–2015).
Quantification of the depressing effect from AAs is essential for evaluating the impact of air pollution on local and continental climate warming and is also vital for improving our understanding of the role of human activities in remote areas. The depressing effects of aerosols on air temperature in summer (Fig. 8) were calculated using two methods: one is using first-order approximations of the direct near-surface air temperature response to each radiative and thermodynamic component and is based on remote sensing and modeling data; the other is calculated by using multiple noAA simulations. The two methods had similar depressing magnitudes (Fig. S7), and the mean is shown in Fig. 8. Surface air temperature increased almost 0.86 K (Fig. 7a) over the TP in summer when comparing the first 30 years and the last 30 years, whereas the increasing magnitude of the surface air temperature that has no aerosol impact (the red line in Fig. 8) is approximately 1.64±0.28 K, which indicates that approximately 0.80±0.28 K (48.6±17.3 %) of the local climate warming over the TP has been depressed by aerosols since 1850 in summer.
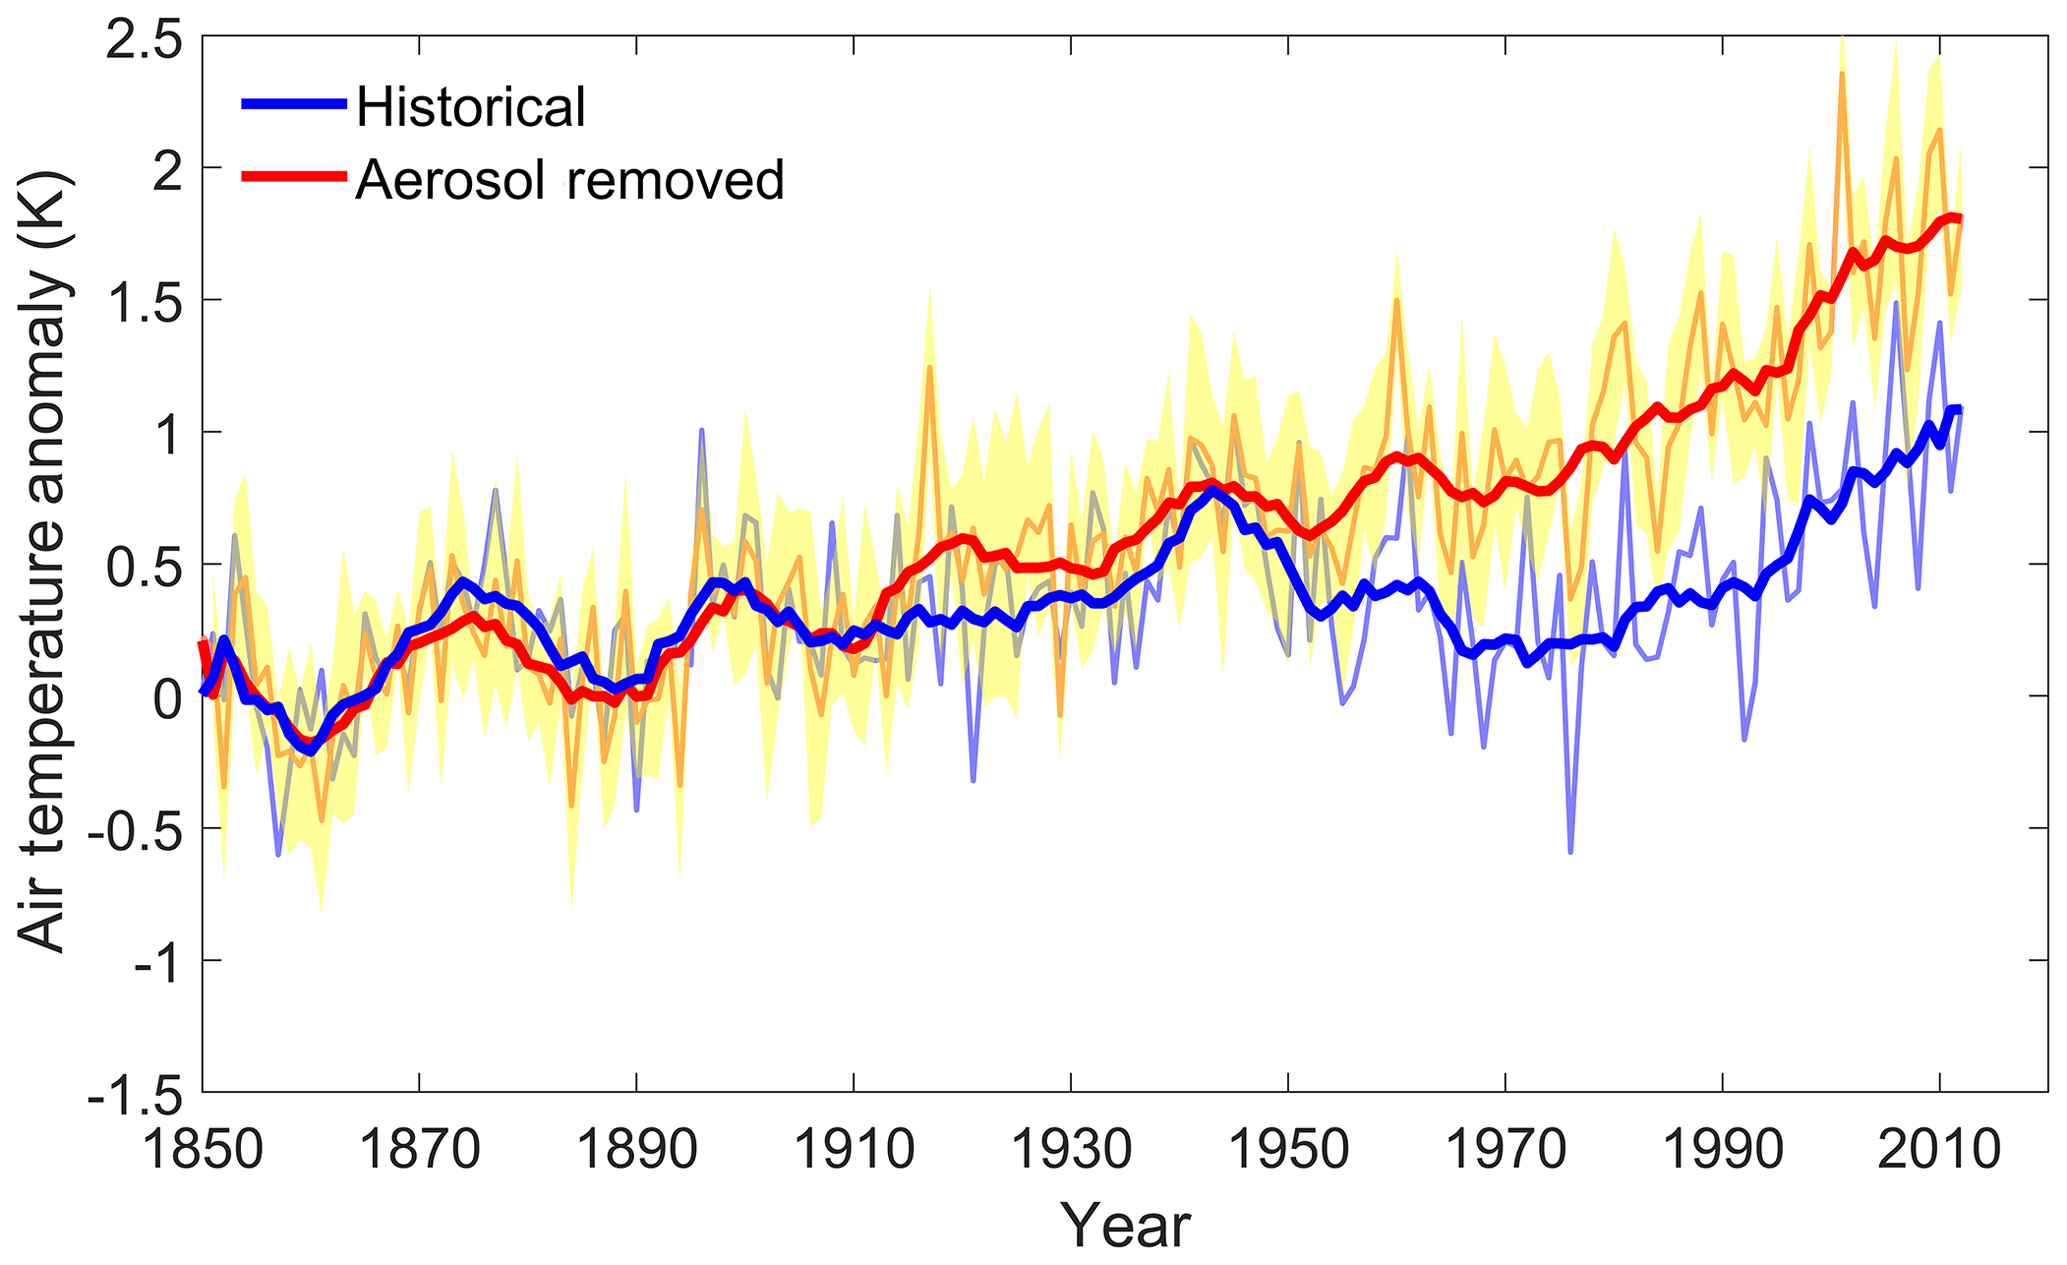
Figure 8Temporal annual variation in air temperature, and air temperature with the depressing effect of aerosols removed in the summer season. The shaded area is the standard deviation of the model average.
The first-order approximation method utilized many remote sensing products as climatology and forcing input, which are more reliable than the model simulation input (Fig. S8), while we also calculated the depressing effect of AAs by employing the CMIP5 air temperature data from multiple noAA simulations that used physical parameterization methods. Two methods can validate each other. Then, we calculated the mean value as the final depressing effect result for including the advantages of these two methods.
The attribution of solar dimming over the TP and corresponding aerosol effect quantification revealed that anthropogenic aerosols dominate the solar radiation decrease and depress the climate warming in recent decades. Aerosols are cloud condensation nuclei (CCN), and more CCN may depress the cloud formation and precipitation. Moreover, the black carbon aerosol deposition may affect snow albedo feedback (Qian et al., 2015). Thus, future studies need to analyze the indirect effect of aerosol loading (Qian et al., 2015) over there. However, it should be noticed that we do not conclude that the TP undergoes warming mitigation. In fact, the TP has a faster warming rate than global warming (Yao et al., 2018), and other varying factors also affect the warming rate in terms of the water vapor variation around 1998 (Fig. S4). Water vapor is a weak DSR-absorbing factor but a major greenhouse-gas-emitting downward longwave radiation, so its decrease might slow down the local warming rate. However, the impact of water vapor variation after 1998 is at an annual scale that cannot match the analysis in this study; thus, follow-up research may focus on it.
The TP plays a vital role in regional and global climate change due to its location and orography. Former studies have proven that this region undergoes significant climate change; however, the causes and impacts of solar dimming are still under debate. Calibrated by the CERES EBAF surface downward radiation products and using the NNLS method, long-term (from 1850 to 2015) surface DSR and DLR datasets over the TP were developed by merging 18 CMIP5 models. Compared with the mean of multiple CMIP5 data and fusion data from former studies, the CERES calibrated data had the lowest bias and RMSE for DSR and DLR validation at the GAME and CAMP networks, and the highest R2 at the CAMP network. The calibrated DSR and DLR have similar temporal trends over the TP at a decadal scale compared to the fusion of multiple reanalysis and satellite products.
Based on calibrated surface downward radiation data and four sets of air temperature data, we characterized the spatiotemporal variation in surface radiation along with air temperature. The TP is currently experiencing substantial climate warming and solar dimming at the surface. In total, DSR decreased by 4.1 W m−2 from 1850 to 2015 with a gradient of −0.53 W m−2 per decade after 1950, and DLR increased from 0.21 to 1.52 W m−2 per decade after 1970. Air temperature has increased by 1.39 K since 1850. The dimming is also detected from long-term observing CMA sites. Spatial and temporal analyses illustrated that the DSR decrease rate in the central region was approximately −0.08 W m−2 per decade, much lower than in surrounding areas. The fastest decrease in DSR appeared in the southeastern TP at a gradient of about −0.37 W m−2 per decade since 1850, and DLR has increased, especially in the central and northern TP. However, the rate of increase is much slower in the southern and southeastern TP, with gradients of approximately 0.21 W m−2 per decade.
By employing satellite and reanalysis products of aerosols, PM2.5, dust, cloud fractions, and TOA albedo, we determined that anthropogenic aerosols were the main cause of the solar dimming over the TP. The aerosol optical depth and the aerosol index have increased since the 1980s over the TP, and increasing PM2.5 and decreasing dust linked the increasing aerosol to air pollution. We also proved from satellite products and reanalysis data that deep convective cloud and atmospheric water vapors are not the main drivers, due to limited distribution and magnitude since the 1980s. Furthermore, the overall cloud optical depth is decreasing. Additional evidence from multiple CMIP5 HistoricalMisc experiment ensembles also supports the conclusion that anthropogenic aerosols were the main cause of solar dimming over the TP.
Solar dimming over the TP is stronger in summer when the increasing magnitude of the surface air temperature is the smallest. Decreased precipitation and wind speeds triggered increased aerosol stability. Comparing the averages of the first 30 years (1850–1880) and last 30 years (1985–2015), the surface air temperature increased by approximately 0.86 K over the TP in the summer. The depressing effect of aerosol was calculated using two methods, both of which showed similar depressing magnitudes. The increasing magnitude of the surface air temperature (with no aerosol impact) was approximately 1.58 K, which means approximately 0.80±0.28 K (48.6±17.3 %) of the local climate warming over the TP has been depressed by aerosols from 1850 to 2015 in the summer. The study reveals the impacts of human activities on regional warming, even in remote areas, and highlights the need for additional studies to be conducted to quantify the influence of air pollution on regional climate change over the TP. We will focus on the influences of air pollution on local precipitation over the TP and surrounding areas in the next work.
The data we generated can be accessed at PANGAEA (https://doi.pangaea.de/10.1594/PANGAEA.902049; Jia and Liang, 2019). All datasets supporting the findings of this study can be identified by referring to citations in the references section. Analysis scripts are available by request to Shunlin Liang.
The supplement related to this article is available online at: https://doi.org/10.5194/acp-20-881-2020-supplement.
SL conceived and scoped the research. AJ, BJ, and XZ downloaded and pre-processed the data. AJ and DW performed data statistics and the interpretation of the results. AJ and SL wrote the manuscript. All authors contributed to revising the article.
The authors declare that they have no conflict of interest.
This article is part of the special issue “Study of ozone, aerosols and radiation over the Tibetan Plateau (SOAR-TP) (ACP/AMT inter-journal SI)”. It is not associated with a conference.
This study was supported by NASA under grant 80NSSC18K0620 and the Chinese Grand Research Program on Climate Change and Response (projects 2016YFA0600101 and 2016YFA0600103). We gratefully acknowledge the IPCC data distribution center for providing the model simulation outputs. We also thank the CERES science team, MODIS science team, Goddard Earth Sciences Data and Information Services Center (GES DISC), Earth Observing System Data and Information System (EOSDIS), Atmospheric Composition Analysis Group at Dalhousie University, Research Data Archive at the National Center for Atmospheric Research (NCAR), GLASS science team, and Land Processes Distributed Active Archive Center (LP DAAC) for providing satellite and reanalysis products. We acknowledge the Berkeley Earth, Goddard Institute for Space Studies, National Centers for Environmental Information, and the Climate Research Unit for providing near-surface air temperature datasets. We thank GEWEX GAME, CEOP Asia-Australia Monsoon Project, and AERONET for providing ground measurements. We are also grateful for the contributions of the referees and one reader during the open discussion.
This research has been supported by the NASA (grant no. 80NSSC18K0620) and the Chinese Grand Research Program on Climate Change and Response (grant nos. 2016YFA0600101 and 2016YFA0600103).
This paper was edited by Hailong Wang and reviewed by two anonymous referees.
Ahmad, S. P., Torres, O., Bhartia, P. K., Leptoukh, G. G., and Kempler, S. J.: Aerosol Index from TOMS and OMI Measurements, 14th Joint Conference on the Applications of Air Pollution Meteorology with the Air and Waste Management Assoc., Atlanta, 2006.
Allan, R. P., Liu, C., Loeb, N. G., Palmer, M. D., Roberts, M., Smith, D., and Vidale, P. L.: Changes in global net radiative imbalance 1985–2012, Geophys. Res. Lett., 41, 5588–5597, 2014.
Andreae, M. O., Jones, C. D., and Cox, P. M.: Strong present-day aerosol cooling implies a hot future, Nature, 435, 1187–1190, https://doi.org/10.1038/nature03671, 2005.
Boos, W. R. and Kuang, Z. M.: Dominant control of the South Asian monsoon by orographic insulation versus plateau heating, Nature, 463, 218–222, https://doi.org/10.1038/nature08707, 2010.
Bro, R. and De Jong, S.: A fast non-negativity-constrained least squares algorithm, J. Chemometr., 11, 393–401, 1997.
Cai, D. L., You, Q. L., Fraedrich, K., and Guan, Y. N.: Spatiotemporal Temperature Variability over the Tibetan Plateau: Altitudinal Dependence Associated with the Global Warming Hiatus, J. Climate, 30, 969–984, https://doi.org/10.1175/Jcli-D-16-0343.1, 2017.
Cao, J., Tie, X., Xu, B., Zhao, Z., Zhu, C., Li, G., and Liu, S.: Measuring and modeling black carbon (BC) contamination in the SE Tibetan Plateau, J. Atmos. Chem., 67, 45, https://doi.org/10.1007/s10874-011-9202-5, 2010.
Carmona, F., Rivas, R., and Caselles, V.: Estimation of daytime downward longwave radiation under clear and cloudy skies conditions over a sub-humid region, Theor. Appl. Climatol., 115, 281–295, 2014.
Cheng, J., Liang, S., Yao, Y., Ren, B., Shi, L., and Liu, H.: A comparative study of three land surface broadband emissivity datasets from satellite data, Remote Sensing, 6, 111–134, 2014.
Dufresne, J.-L., Foujols, M.-A., Denvil, S., Caubel, A., Marti, O., Aumont, O., Balkanski, Y., Bekki, S., Bellenger, H., and Benshila, R.: Climate change projections using the IPSL-CM5 Earth System Model: from CMIP3 to CMIP5, Clim. Dynam., 40, 2123–2165, 2013.
Evan, A. T., Heidinger, A. K., and Vimont, D. J.: Arguments against a physical long-term trend in global ISCCP cloud amounts, Geophys. Res. Lett., 34, L04701, https://doi.org/10.1029/2006GL028083, 2007.
Feng, F. and Wang, K.: Merging satellite retrievals and reanalyses to produce global long-term and consistent surface incident solar radiation datasets, Remote Sensing, 10, 115, https://doi.org/10.3390/rs10010115, 2018.
Feng, F. and Wang, K.: Determining factors of monthly to decadal variability in surface solar radiation in China: evidences from current reanalyses, J. Geophys. Res.-Atmos., 124, 9161–9182, 2019.
Feng, H. and Zou, B.: Satellite-based estimation of the aerosol forcing contribution to the global land surface temperature in the recent decade, Remote Sens. Environ., 232, 111299, https://doi.org/10.1016/j.rse.2019.111299, 2019.
Franklin, C. N., Sun, Z., Bi, D. H., Dix, M., Yan, H. L., and Bodas-Salcedo, A.: Evaluation of clouds in ACCESS using the satellite simulator package COSP: Regime-sorted tropical cloud properties, J. Geophys. Res.-Atmos., 118, 6663–6679, https://doi.org/10.1002/jgrd.50496, 2013.
Fu, R., Hu, Y., Wright, J. S., Jiang, J. H., Dickinson, R. E., Chen, M., Filipiak, M., Read, W. G., Waters, J. W., and Wu, D. L.: Short circuit of water vapor and polluted air to the global stratosphere by convective transport over the Tibetan Plateau, P. Natl. Acad. Sci. USA, 103, 5664–5669, https://doi.org/10.1073/pnas.0601584103, 2006.
Gao, Y., Zhang, M., Liu, Z., Wang, L., Wang, P., Xia, X., Tao, M., and Zhu, L.: Modeling the feedback between aerosol and meteorological variables in the atmospheric boundary layer during a severe fog–haze event over the North China Plain, Atmos. Chem. Phys., 15, 4279–4295, https://doi.org/10.5194/acp-15-4279-2015, 2015.
Gent, P. R., Danabasoglu, G., Donner, L. J., Holland, M. M., Hunke, E. C., Jayne, S. R., Lawrence, D. M., Neale, R. B., Rasch, P. J., Vertenstein, M., Worley, P. H., Yang, Z. L., and Zhang, M. H.: The Community Climate System Model Version 4, J. Climate, 24, 4973–4991, https://doi.org/10.1175/2011jcli4083.1, 2011.
Gettelman, A., Shindell, D., and Lamarque, J.-F.: Impact of aerosol radiative effects on 2000–2010 surface temperatures, Clim. Dynam., 45, 2165–2179, 2015.
Gillespie, A., Rokugawa, S., Matsunaga, T., Cothern, J. S., Hook, S., and Kahle, A. B.: A temperature and emissivity separation algorithm for Advanced Spaceborne Thermal Emission and Reflection Radiometer (ASTER) images, IEEE T. Geosci. Remote Sens., 36, 1113–1126, 1998.
GLOBE Team and others (Hastings, David A., Paula K. Dunbar, Gerald M. Elphingstone, Mark Bootz, Hiroshi Murakami, Hiroshi Maruyama, Hiroshi Masaharu, Peter Holland, John Payne, Nevin A. Bryant, Thomas L. Logan, J.-P. Muller, Gunter Schreier, and John S. MacDonald) (Eds.): The Global Land One-kilometer Base Elevation (GLOBE) Digital Elevation Model, Version, 1, 80305-83328, National Oceanic and Atmospheric Administration, National Geophysical Data Center, USA, 1999.
Gordon, H. B., O'Farrell, S., Collier, M., Dix, M., Rotstayn, L., Kowalczyk, E., Hirst, T., and Watterson, I.: The CSIRO Mk3. 5 climate model, CSIRO and Bureau of Meteorology, Centre for Australian Weather and Climate Research, Melbourne VIC, 2010.
Guo, Y., Cheng, J., and Liang, S.: Comprehensive assessment of parameterization methods for estimating clear-sky surface downward longwave radiation, Theor. Appl. Climatol., 135, 1045–1058, 2019.
Hansen, J., Ruedy, R., Sato, M., and Lo, K.: Global surface temperature change, Rev. Geophys., 48, RG4004, https://doi.org/10.1029/2010RG000345, 2010.
He, T., Liang, S., and Song, D. X.: Analysis of global land surface albedo climatology and spatial-temporal variation during 1981–2010 from multiple satellite products, J. Geophys. Res.-Atmos., 119, 10281–10298, 2014.
Hersbach, H. and Dee, D.: ERA5 reanalysis is in production, ECMWF newsletter, 147, 5–6, 2016.
Hsu, N. C., Gautam, R., Sayer, A. M., Bettenhausen, C., Li, C., Jeong, M. J., Tsay, S.-C., and Holben, B. N.: Global and regional trends of aerosol optical depth over land and ocean using SeaWiFS measurements from 1997 to 2010, Atmos. Chem. Phys., 12, 8037–8053, https://doi.org/10.5194/acp-12-8037-2012, 2012.
Hsu, N. C., Herman, J., Torres, O., Holben, B., Tanre, D., Eck, T., Smirnov, A., Chatenet, B., and Lavenu, F.: Comparisons of the TOMS aerosol index with Sun-photometer aerosol optical thickness: Results and applications, J. Geophys. Res.-Atmos., 104, 6269–6279, 1999.
Hulley, G. C. and Hook, S. J.: Generating consistent land surface temperature and emissivity products between ASTER and MODIS data for earth science research, IEEE T. Geosci. Remote Sens., 49, 1304–1315, 2010.
IPCC: Climate Change 2013 – The Physical Science Basis: Working Group I Contribution to the Fifth Assessment Report of the Intergovernmental Panel on Climate Change, Cambridge University Press, Cambridge, 2014.
Ji, Z. M., Kang, S. C., Cong, Z. Y., Zhang, Q. G., and Yao, T. D.: Simulation of carbonaceous aerosols over the Third Pole and adjacent regions: distribution, transportation, deposition, and climatic effects, Clim. Dynam., 45, 2831–2846, https://doi.org/10.1007/s00382-015-2509-1, 2015.
Jia, A. and Liang, S.: Long-term surface downward surface radiation dataset over the Tibetan Plateau, PANGAEA, https://doi.org/10.1594/PANGAEA.902049, 2019.
Jia, A., Jiang, B., Liang, S., Zhang, X., and Ma, H.: Validation and Spatiotemporal Analysis of CERES Surface Net Radiation Product, Remote Sensing, 8, 90, https://doi.org/10.3390/rs8020090, 2016.
Jia, A., Liang, S., Jiang, B., Zhang, X., and Wang, G.: Comprehensive assessment of global surface net radiation products and uncertainty analysis, J. Geophys. Res.-Atmos., 123, 1970–1989, https://doi.org/10.1002/2017JD027903, 2018.
Jones, P., Lister, D., Osborn, T., Harpham, C., Salmon, M., and Morice, C.: Hemispheric and large-scale land-surface air temperature variations: An extensive revision and an update to 2010, J. Geophys. Res.-Atmos., 117, D05127, https://doi.org/10.1029/2011JD017139, 2012.
Jungclaus, J. H., Lorenz, S. J., Timmreck, C., Reick, C. H., Brovkin, V., Six, K., Segschneider, J., Giorgetta, M. A., Crowley, T. J., Pongratz, J., Krivova, N. A., Vieira, L. E., Solanki, S. K., Klocke, D., Botzet, M., Esch, M., Gayler, V., Haak, H., Raddatz, T. J., Roeckner, E., Schnur, R., Widmann, H., Claussen, M., Stevens, B., and Marotzke, J.: Climate and carbon-cycle variability over the last millennium, Clim. Past, 6, 723–737, https://doi.org/10.5194/cp-6-723-2010, 2010.
Kato, S., Rose, F. G., Rutan, D. A., Thorsen, T. J., Loeb, N. G., Doelling, D. R., Huang, X., Smith, W. L., Su, W., and Ham, S.-H.: Surface irradiances of edition 4.0 Clouds and the Earth's Radiant Energy System (CERES) Energy Balanced and Filled (EBAF) data product, J. Climate, 31, 4501–4527, 2018.
Kuang, X. X. and Jiao, J. J.: Review on climate change on the Tibetan Plateau during the last half century, J. Geophys. Res.-Atmos., 121, 3979–4007, https://doi.org/10.1002/2015jd024728, 2016.
Lau, W. K. M., Yuan, C., and Li, Z.: Origin, Maintenance and Variability of the Asian Tropopause Aerosol Layer (ATAL): The Roles of Monsoon Dynamics, Sci. Rep.-UK, 8, 3960, https://doi.org/10.1038/s41598-018-22267-z, 2018.
Leese, J. A.: Coordinated Enhanced Observing Period (CEOP) Implementation Plan, International GEWEX Project Office, Silver Spring, MD, 2001.
Levy, R. C., Remer, L., Mattoo, S., Vermote, E., and Kaufman, Y.: Second-generation algorithm for retrieving aerosol properties over land from MODIS spectral reflectance, J. Geophys. Res., 112, D13211, https://doi.org/10.1029/2006JD007811, 2007.
Lewis, P., Brockmann, C., and Muller, J.: GlobAlbedo: Algorithm theoretical basis document V4-12, in: Technical Report, Globalbedo Team, University College London, UK, available at: http://www.globalbedo.org/ (last access: 22 January 2020), 2013.
Li, C., Zhao, T., and Ying, K.: Effects of anthropogenic aerosols on temperature changes in China during the twentieth century based on CMIP5 models, Theor. Appl. Climatol., 125, 529–540, https://doi.org/10.1007/s00704-015-1527-6, 2015.
Li, Z., Rosenfeld, D., and Fan, J.: Aerosols and their impact on radiation, clouds, precipitation, and severe weather events, Oxford Research Encyclopedias, https://doi.org/10.1093/acrefore/9780199389414.013.126, 2017.
Liang, S., Wang, K., Zhang, X., and Wild, M.: Review on estimation of land surface radiation and energy budgets from ground measurement, remote sensing and model simulations, IEEE J. Sel. Top. Appl., 3, 225–240, 2010.
Liao, H., Chang, W., and Yang, Y.: Climatic effects of air pollutants over China: A review, Adv. Atmos. Sci., 32, 115–139, 2015.
Liu, N. F., Liu, Q., Wang, L. Z., Liang, S. L., Wen, J. G., Qu, Y., and Liu, S. H.: A statistics-based temporal filter algorithm to map spatiotemporally continuous shortwave albedo from MODIS data, Hydrol. Earth Syst. Sci., 17, 2121–2129, https://doi.org/10.5194/hess-17-2121-2013, 2013a.
Liu, Q., Wang, L., Qu, Y., Liu, N., Liu, S., Tang, H., and Liang, S.: Preliminary evaluation of the long-term GLASS albedo product, Int. J. Digital Earth, 6, 69–95, 2013b.
Loeb, N. G., Doelling, D. R., Wang, H. L., Su, W. Y., Nguyen, C., Corbett, J. G., Liang, L. S., Mitrescu, C., Rose, F. G., and Kato, S.: Clouds and the Earth's Radiant Energy System (CERES) Energy Balanced and Filled (EBAF) Top-of-Atmosphere (TOA) Edition-4.0 Data Product, J. Climate, 31, 895–918, https://doi.org/10.1175/Jcli-D-17-0208.1, 2018.
Long, M. C., Lindsay, K., Peacock, S., Moore, J. K., and Doney, S. C.: Twentieth-century oceanic carbon uptake and storage in CESM1 (BGC), J. Climate, 26, 6775–6800, 2013.
Ma, Q., Wang, K., and Wild, M.: Impact of geolocations of validation data on the evaluation of surface incident shortwave radiation from Earth System Models, J. Geophys. Res.-Atmos., 120, 6825–6844, 2015.
Manara, V., Brunetti, M., Maugeri, M., Sanchez-Lorenzo, A., and Wild, M.: Sunshine duration and global radiation trends in Italy (1959–2013): To what extent do they agree?, J. Geophys. Res.-Atmos., 122, 4312–4331, 2017.
McPeters, R. D., Bhartia, P., Krueger, A. J., Herman, J. R., Wellemeyer, C. G., Seftor, C. J., Jaross, G., Torres, O., Moy, L., and Labow, G.: Earth probe total ozone mapping spectrometer (TOMS): data products user's guide, NASA Technical Publications, Goddard Space Flight Center, Greenbelt, MD, available at: http://cedadocs.ceda.ac.uk/107/1/earthprobe_userguide.pdf (last access: 22 January 2020), 1998.
Meehl, G. A., Washington, W. M., Arblaster, J. M., Hu, A. X., Teng, H. Y., Kay, J. E., Gettelman, A., Lawrence, D. M., Sanderson, B. M., and Strand, W. G.: Climate Change Projections in CESM1(CAM5) Compared to CCSM4, J. Climate, 26, 6287–6308, https://doi.org/10.1175/Jcli-D-12-00572.1, 2013.
Mochizuki, T., Chikamoto, Y., Kimoto, M., Ishii, M., Tatebe, H., Komuro, Y., Sakamoto, T. T., Watanabe, M., and Mori, M.: Decadal Prediction Using a Recent Series of MIROC Global Climate Models, J. Meteorol. Soc. Jpn., 90, 373–383, https://doi.org/10.2151/jmsj.2012-A22, 2012.
Norris, J. R. and Evan, A. T.: Empirical Removal of Artifacts from the ISCCP and PATMOS-x Satellite Cloud Records, J. Atmos. Ocean. Tech., 32, 691–702, https://doi.org/10.1175/jtech-d-14-00058.1, 2015.
Norris, J. R., Allen, R. J., Evan, A. T., Zelinka, M. D., O'Dell, C. W., and Klein, S. A.: Evidence for climate change in the satellite cloud record, Nature, 536, 72–75, 2016.
Pozzer, A., de Meij, A., Yoon, J., Tost, H., Georgoulias, A. K., and Astitha, M.: AOD trends during 2001–2010 from observations and model simulations, Atmos. Chem. Phys., 15, 5521–5535, https://doi.org/10.5194/acp-15-5521-2015, 2015.
Qian, Y., Yasunari, T. J., Doherty, S. J., Flanner, M. G., Lau, W. K., Ming, J., Wang, H., Wang, M., Warren, S. G., and Zhang, R.: Light-absorbing particles in snow and ice: Measurement and modeling of climatic and hydrological impact, Adv. Atmos. Sci., 32, 64–91, 2015.
Qu, Y., Liu, Q., Liang, S., Wang, L., Liu, N., and Liu, S.: Direct-estimation algorithm for mapping daily land-surface broadband albedo from MODIS data, IEEE T. Geosci. Remote Sens., 52, 907–919, 2014.
Ramanathan, V., Ramana, M. V., Roberts, G., Kim, D., Corrigan, C., Chung, C., and Winker, D.: Warming trends in Asia amplified by brown cloud solar absorption, Nature, 448, 575–578, 2007.
Randles, C., Da Silva, A., Buchard, V., Colarco, P., Darmenov, A., Govindaraju, R., Smirnov, A., Holben, B., Ferrare, R., and Hair, J.: The MERRA-2 aerosol reanalysis, 1980 onward. Part I: System description and data assimilation evaluation, J. Climate, 30, 6823–6850, 2017.
Rao, Y., Liang, S., and Yu, Y.: Land Surface Air Temperature Data Are Considerably Different Among BEST‐LAND, CRU‐TEM4v, NASA‐GISS, and NOAA‐NCEI, J. Geophys. Res.-Atmos., 123, 5881–5900, 2018.
Riihelä, A., Manninen, T., Laine, V., Andersson, K., and Kaspar, F.: CLARA-SAL: a global 28 yr timeseries of Earth's black-sky surface albedo, Atmos. Chem. Phys., 13, 3743–3762, https://doi.org/10.5194/acp-13-3743-2013, 2013.
Rohde, R., Muller, R., Jacobsen, R., Muller, E., Perlmutter, S., Rosenfeld, A., Wurtele, J., Groom, D., and Wickham, C.: A new estimate of the average Earth surface land temperature spanning 1753 to 2011, Geoinfor. Geostat. Overview, 1, 2, https://doi.org/10.4172/2327-4581.1000101, 2013.
Rossow, W. B. and Schiffer, R. A.: Advances in understanding clouds from ISCCP, B. Am. Meteorol. Soc., 80, 2261–2288, 1999.
Sampe, T. and Xie, S. P.: Large-Scale Dynamics of the Meiyu-Baiu Rainband: Environmental Forcing by the Westerly Jet, J. Climate, 23, 113–134, https://doi.org/10.1175/2009jcli3128.1, 2010.
Samset, B., Sand, M., Smith, C., Bauer, S., Forster, P., Fuglestvedt, J., Osprey, S., and Schleussner, C. F.: Climate impacts from a removal of anthropogenic aerosol emissions, Geophys. Res. Lett., 45, 1020–1029, 2018.
Sayer, A. M., Hsu, N. C., Bettenhausen, C., Jeong, M.-J., Holben, B. N., and Zhang, J.: Global and regional evaluation of over-land spectral aerosol optical depth retrievals from SeaWiFS, Atmos. Meas. Tech., 5, 1761–1778, https://doi.org/10.5194/amt-5-1761-2012, 2012.
Scoccimarro, E., Gualdi, S., Bellucci, A., Sanna, A., Giuseppe Fogli, P., Manzini, E., Vichi, M., Oddo, P., and Navarra, A.: Effects of tropical cyclones on ocean heat transport in a high-resolution coupled general circulation model, J. Climate, 24, 4368–4384, 2011.
Shi, Q. and Liang, S.: Characterizing the surface radiation budget over the Tibetan Plateau with ground-measured, reanalysis, and remote sensing data sets: 1. Methodology, J. Geophys. Res.-Atmos., 118, 9642–9657, 2013.
Smith, D. M., Booth, B. B., Dunstone, N. J., Eade, R., Hermanson, L., Jones, G. S., Scaife, A. A., Sheen, K. L., and Thompson, V.: Role of volcanic and anthropogenic aerosols in the recent global surface warming slowdown, Nat. Clim. Change, 6, 936–940, 2016.
Smith, T. M., Reynolds, R. W., Peterson, T. C., and Lawrimore, J.: Improvements to NOAA's historical merged land–ocean surface temperature analysis (1880–2006), J. Climate, 21, 2283–2296, 2008.
Sogacheva, L., de Leeuw, G., Rodriguez, E., Kolmonen, P., Georgoulias, A. K., Alexandri, G., Kourtidis, K., Proestakis, E., Marinou, E., Amiridis, V., Xue, Y., and van der A, R. J.: Spatial and seasonal variations of aerosols over China from two decades of multi-satellite observations – Part 1: ATSR (1995–2011) and MODIS C6.1 (2000–2017), Atmos. Chem. Phys., 18, 11389–11407, https://doi.org/10.5194/acp-18-11389-2018, 2018.
Sun, Y., Zhang, X., Zwiers, F. W., Song, L., Wan, H., Hu, T., Yin, H., and Ren, G.: Rapid increase in the risk of extreme summer heat in Eastern China, Nat. Clim. Change, 4, 1082–1085, 2014.
Sundström, A.-M., Arola, A., Kolmonen, P., Xue, Y., de Leeuw, G., and Kulmala, M.: On the use of a satellite remote-sensing-based approach for determining aerosol direct radiative effect over land: a case study over China, Atmos. Chem. Phys., 15, 505–518, https://doi.org/10.5194/acp-15-505-2015, 2015.
Tang, W.-J., Yang, K., Qin, J., Cheng, C. C. K., and He, J.: Solar radiation trend across China in recent decades: a revisit with quality-controlled data, Atmos. Chem. Phys., 11, 393–406, https://doi.org/10.5194/acp-11-393-2011, 2011.
Taylor, K. E., Stouffer, R. J., and Meehl, G. A.: An overview of CMIP5 and the experiment design, B. Am. Meteorol. Soc., 93, 485–498, 2012.
Tjiputra, J. F., Roelandt, C., Bentsen, M., Lawrence, D. M., Lorentzen, T., Schwinger, J., Seland, Ø., and Heinze, C.: Evaluation of the carbon cycle components in the Norwegian Earth System Model (NorESM), Geosci. Model Dev., 6, 301–325, https://doi.org/10.5194/gmd-6-301-2013, 2013.
Tobo, Y., Iwasaka, Y., Shi, G.-Y., Kim, Y.-S., Ohashi, T., Tamura, K., and
Zhang, D.: Balloon-borne observations of high aerosol concentrations near
the summertime tropopause over the Tibetan Plateau, Atmos. Res.,
84, 233–241,
doi10.1016/j.atmosres.2006.08.003, 2007.
Van Donkelaar, A., Martin, R. V., Brauer, M., and Boys, B. L.: Global Annual PM2.5 Grids from MODIS, MISR and SeaWiFS Aerosol Optical Depth (AOD), 1998–2012, Palisades, NY: NASA Socioeconomic Data and Applications Center (SEDAC), https://doi.org/10.7927/h4028pfs, 2015.
Van Donkelaar, A., Martin, R. V., Brauer, M., Hsu, N. C., Kahn, R. A., Levy, R. C., Lyapustin, A., Sayer, A. M., and Winker, D. M.: Global estimates of fine particulate matter using a combined geophysical-statistical method with information from satellites, models, and monitors, Environ. Sci. Technol., 50, 3762–3772, 2016.
Vernier, J. P., Fairlie, T. D., Natarajan, M., Wienhold, F. G., Bian, J., Martinsson, B. G., Crumeyrolle, S., Thomason, L. W., and Bedka, K. M.: Increase in upper tropospheric and lower stratospheric aerosol levels and its potential connection with Asian pollution, J. Geophys. Res.-Atmos., 120, 1608–1619, https://doi.org/10.1002/2014JD022372, 2015.
Voldoire, A., Sanchez-Gomez, E., y Mélia, D. S., Decharme, B., Cassou, C., Sénési, S., Valcke, S., Beau, I., Alias, A., and Chevallier, M.: The CNRM-CM5.1 global climate model: description and basic evaluation, Clim. Dynam., 40, 2091–2121, 2013.
Volodin, E. M., Dianskii, N. A., and Gusev, A. V.: Simulating present-day climate with the INMCM4.0 coupled model of the atmospheric and oceanic general circulations, Izv. Atmos. Ocean. Phy+, 46, 414–431, https://doi.org/10.1134/S000143381004002x, 2010.
Wang, K.: Measurement biases explain discrepancies between the observed and simulated decadal variability of surface incident solar radiation, Sci. Rep.-UK, 4, 6144, https://doi.org/10.1038/srep06144, 2014.
Wang, K. and Dickinson, R. E.: Global atmospheric downward longwave radiation at the surface from ground-based observations, satellite retrievals, and reanalyses, Rev. Geophys., 51, 150–185, 2013.
Wang, Y. Q., Zhang, X. Y., Sun, J. Y., Zhang, X. C., Che, H. Z., and Li, Y.: Spatial and temporal variations of the concentrations of PM10, PM2.5 and PM1 in China, Atmos. Chem. Phys., 15, 13585–13598, https://doi.org/10.5194/acp-15-13585-2015, 2015.
Wang, Z., Li, Z., Xu, M., and Yu, G.: River morphodynamics and stream ecology of the Qinghai-Tibet Plateau, CRC Press, Balkema, St. Louis, USA, 2016.
Wild, M.: Global dimming and brightening: A review, J. Geophys. Res.-Atmos., 114, D00D16, https://doi.org/10.1029/2008JD011470, 2009.
Wild, M., Ohmura, A., and Makowski, K.: Impact of global dimming and brightening on global warming, Geophys. Res. Lett., 34, L04702, https://doi.org/10.1029/2006gl028031, 2007.
Wu, G. X., Liu, Y. M., He, B., Bao, Q., Duan, A. M., and Jin, F. F.: Thermal Controls on the Asian Summer Monsoon, Sci. Rep.-UK, 2, 404, https://doi.org/10.1038/srep00404, 2012.
Wu, G. X., Duan, A. M., Liu, Y. M., Mao, J. Y., Ren, R. C., Bao, Q., He, B., Liu, B. Q., and Hu, W. T.: Tibetan Plateau climate dynamics: recent research progress and outlook, Natl. Sci. Rev., 2, 100–116, https://doi.org/10.1093/nsr/nwu045, 2015.
Wu, T., Yu, R., Zhang, F., Wang, Z., Dong, M., Wang, L., Jin, X., Chen, D., and Li, L.: The Beijing Climate Center atmospheric general circulation model: description and its performance for the present-day climate, Clim. Dynam., 34, 123–147, 2010.
Xie, H. and Zhu, X.: Reference evapotranspiration trends and their sensitivity to climatic change on the Tibetan Plateau (1970–2009), Hydrol. Process., 27, 3685–3693, 2013.
Xie, H., Zhu, X., and Yuan, D. Y.: Pan evaporation modelling and changing attribution analysis on the Tibetan Plateau (1970–2012), Hydrol. Process., 29, 2164–2177, https://doi.org/10.1002/hyp.10356, 2015.
Xu, X. D., Lu, C. G., Ding, Y. H., Shi, X. H., Guo, Y. D., and Zhu, W. H.: What is the relationship between China summer precipitation and the change of apparent heat source over the Tibetan Plateau?, Atmos. Sci. Lett., 14, 227–234, https://doi.org/10.1002/asl2.444, 2013.
Yang, K., Koike, T., and Ye, B.: Improving estimation of hourly, daily, and monthly solar radiation by importing global data sets, Agr. Forest Meteorol., 137, 43–55, 2006.
Yang, K., Ding, B. H., Qin, J., Tang, W. J., Lu, N., and Lin, C. G.: Can aerosol loading explain the solar dimming over the Tibetan Plateau?, Geophys. Res. Lett., 39, L20710, https://doi.org/10.1029/2012gl053733, 2012.
Yang, K., Wu, H., Qin, J., Lin, C. G., Tang, W. J., and Chen, Y. Y.: Recent climate changes over the Tibetan Plateau and their impacts on energy and water cycle: A review, Global Planet. Change, 112, 79–91, https://doi.org/10.1016/j.gloplacha.2013.12.001, 2014.
Yao, T., Pu, J., Lu, A., Wang, Y., and Yu, W.: Recent glacial retreat and its impact on hydrological processes on the Tibetan Plateau, China, and surrounding regions, Arct. Antarct. Alp. Res., 39, 642–650, 2007.
Yao, T., Xue, Y., Chen, D., Chen, F., Thompson, L., Cui, P., Koike, T., Lau, W. K.-M., Lettenmaier, D., and Mosbrugger, V.: Recent Third Pole's rapid warming accompanies cryospheric melt and water cycle intensification and interactions between monsoon and environment: Multidisciplinary approach with observations, modeling, and analysis, B. Am. Meteorol. Soc., 100, 423–444, 2019.
Yasunari, T.: GEWEX-related Asian monsoon experiment (GAME), Adv. Space Res., 14, 161–165, 1994.
You, Q., Sanchez-Lorenzo, A., Wild, M., Folini, D., Fraedrich, K., Ren, G., and Kang, S.: Decadal variation of surface solar radiation in the Tibetan Plateau from observations, reanalysis and model simulations, Clim. Dynam., 40, 2073–2086, 2013.
You, Q. L., Kang, S. C., Pepin, N., Flugel, W. A., Sanchez-Lorenzo, A., Yan, Y. P., and Zhang, Y. J.: Climate warming and associated changes in atmospheric circulation in the eastern and central Tibetan Plateau from a homogenized dataset, Global Planet. Change, 72, 11–24, https://doi.org/10.1016/j.gloplacha.2010.04.003, 2010.
Yukimoto, S., Adachi, Y., Hosaka, M., Sakami, T., Yoshimura, H., Hirabara, M., Tanaka, T. Y., Shindo, E., Tsujino, H., and Deushi, M.: A New Global Climate Model of the Meteorological Research Institute: MRI-CGCM3 – Model Description and Basic Performance, J. Meteorol. Soc. Jpn., 90, 23–64, 2012.
Zeng, Z., Piao, S., Li, L. Z. X., Zhou, L., Ciais, P., Wang, T., Li, Y., Lian, X., Wood, E. F., Friedlingstein, P., Mao, J., Estes, L. D., Myneni, Ranga B., Peng, S., Shi, X., Seneviratne, S. I., and Wang, Y.: Climate mitigation from vegetation biophysical feedbacks during the past three decades, Nat. Clim. Change, 7, 432–436, https://doi.org/10.1038/nclimate3299, 2017.
Zhang, X., Liang, S., Wild, M., and Jiang, B.: Analysis of surface incident shortwave radiation from four satellite products, Remote Sens. Environ., 165, 186–202, 2015.
Zhang, X., Liang, S., Wang, G., Yao, Y., Jiang, B., and Cheng, J.: Evaluation of the Reanalysis Surface Incident Shortwave Radiation Products from NCEP, ECMWF, GSFC, and JMA Using Satellite and Surface Observations, Remote Sensing, 8, 225, https://doi.org/10.3390/rs8030225, 2016.
Zhou, C., Wang, K., and Qi, D.: Attribution of the July 2016 Extreme Precipitation Event Over China's Wuhang, B. Am. Meteorol. Soc., 99, S107–S112, 2018.