the Creative Commons Attribution 4.0 License.
the Creative Commons Attribution 4.0 License.
Measurements of traffic-dominated pollutant emissions in a Chinese megacity
Freya A. Squires
Eiko Nemitz
Ben Langford
Oliver Wild
Will S. Drysdale
W. Joe F. Acton
Pingqing Fu
C. Sue B. Grimmond
Jacqueline F. Hamilton
C. Nicholas Hewitt
Michael Hollaway
Simone Kotthaus
Stefan Metzger
Natchaya Pingintha-Durden
Marvin Shaw
Adam R. Vaughan
Xinming Wang
Ruili Wu
Qiang Zhang
Yanli Zhang
Direct measurements of NOx, CO and aromatic volatile organic compound (VOC) (benzene, toluene, C2-benzenes and C3-benzenes) flux were made for a central area of Beijing using the eddy-covariance technique. Measurements were made during two intensive field campaigns in central Beijing as part of the Air Pollution and Human Health (APHH) project, the first in November–December 2016 and the second during May–June 2017, to contrast wintertime and summertime emission rates. There was little difference in the magnitude of NOx flux between the two seasons (mean NOx flux was 4.41 mg m−2 h−1 in the winter compared to 3.55 mg m−2 h−1 in the summer). CO showed greater seasonal variation, with mean CO flux in the winter campaign (34.7 mg m−2 h−1) being over twice that of the summer campaign (15.2 mg m−2 h−1). Larger emissions of aromatic VOCs in summer were attributed to increased evaporation due to higher temperatures. The largest fluxes in NOx and CO generally occurred during the morning and evening rush hour periods, indicating a major traffic source with high midday emissions of CO, indicating an additional influence from cooking fuel. Measured NOx and CO fluxes were then compared to the MEIC 2013 emissions inventory, which was found to significantly overestimate emissions for this region, providing evidence that proxy-based emissions inventories have positive biases in urban centres. This first set of pollutant fluxes measured in Beijing provides an important benchmark of emissions from the city which can help to inform and evaluate current emissions inventories.
Please read the corrigendum first before continuing.
-
Notice on corrigendum
The requested paper has a corresponding corrigendum published. Please read the corrigendum first before downloading the article.
-
Article
(6523 KB)
-
The requested paper has a corresponding corrigendum published. Please read the corrigendum first before downloading the article.
- Article
(6523 KB) - Full-text XML
- Corrigendum
- BibTeX
- EndNote
Rapid development and population growth have led to an ever increasing number of “megacities”, defined by the United Nations (UN) as a “metropolitan area with a total population of more than 10 million people” (United Nations Department of Economic and Social Affairs, Population Division, 2016). In addition to being home to a large population, megacities are typically associated with high levels of industrialisation and extensive transportation networks, making air pollution a common problem. Beijing is one such city that regularly experiences significant air quality problems. High levels of particulate matter (PM) in Beijing during winter months have been widely reported. In 2017, annual PM2.5 (PM with a diameter less than 2.5 µm) concentrations reached 58 µg m−3, approximately 6 times greater than the World Health Organisation (WHO) guideline (Ministry of Ecology and Environment, the People's Republic of China, 2018). During the summer, concentrations of ozone, O3, a major component of photochemical smog, regularly exceeded the WHO 8 h mean limit of 100 µg m−3 in Beijing. Both PM and O3 have detrimental impacts on public health and both are formed in the atmosphere from reactions by precursor emissions that include nitrogen oxides (NOx), carbon monoxide (CO) and volatile organic compounds (VOCs). Secondary aerosols have been shown to comprise a large fraction of fine particulate matter in Beijing (Guo et al., 2014; Duan et al., 2020). China is the largest NOx emitter globally and is estimated to contribute as much as 18 % to global NOx emissions (European Commission, 2011), while Beijing itself is reported to have annual mean NO2 concentrations 16 µg m−3 higher than the national average (Ministry of Ecology and Environment, the People's Republic of China, 2018). At high concentrations, NO2 is a respiratory irritant (Strand et al., 1998; Tunnicliffe et al., 1994). CO is a harmful air pollutant produced from incomplete combustion processes, including those used in power generation and from vehicle engines. Liu et al. (2018) concluded that there is an association between short-term exposure to ambient CO and increased cardiovascular disease mortality, especially coronary heart disease mortality. For both these pollutants, traffic emissions tend to be the dominant source in megacities.
In order to manage air quality it is vital that legislators have a clear understanding of pollutant emissions to guide abatement strategies. Models of atmospheric chemistry provide an important mechanism to predict the efficacy of abatement measures on future air quality, yet these predictions are only as certain as the emissions inventories upon which they are based. For example, previous studies have highlighted large discrepancies between emissions inventories and measured emissions for UK cities both for NOx (Lee et al., 2015; Vaughan et al., 2016) and VOCs (Langford et al., 2010; Valach et al., 2015). In addition to discrepancies in magnitude, the sources of emissions are not always correctly identified in inventories. Karl et al. (2018) indicate via emission measurements that a large, unidentified source of oxygenated VOCs is not represented in emissions inventories and that actual non-methane VOC (NMVOC) emissions could be significantly higher than those used in most models. As new emissions controls are introduced and emissions technologies improve, the main sources of pollutant emissions will change. McDonald et al. (2018) showed that an increasing proportion of the VOC emission budget is from volatile chemical products containing organic solvents (e.g. pesticides, cleaning agents and personal care products) as the transportation sector becomes cleaner. Inventories in China are associated with large uncertainties and are rapidly changing in response to economic development and new environmental regulations. Saikawa et al. (2017) reviewed and compared five different emissions inventories for China and found large disagreements between them. Thus there is a critical need for reliable field measurements in order to further improve the emissions estimates and reduce the uncertainty of inventories at local and regional scales (Zhao et al., 2017).
Given this pressing need for measurements of pollutant emissions, fluxes of NOx, CO and commonly co-emitted VOCs (benzene, toluene, C2-benzenes and C3-benzenes) were calculated using the eddy-covariance (EC) technique for an urban area in Beijing. To the knowledge of the authors, this is the first time these emissions have been directly quantified in Beijing. This work was carried out as part of the Air Pollution and Human Health (APHH) Beijing project and an overview of this campaign can be found in Shi et al. (2019).
2.1 Site description
Measurements were taken from an inlet part-way up a 325 m meteorological tower at the Institute of Atmospheric Physics, Chinese Academy of Sciences (IAP, CAS) (39∘58′28′′ N, 116∘22′16′′ E), in central Beijing. The site is between the third and fourth ring roads and surrounding land use can be characterised as urban, being mainly residential with some busy (two- and three-lane dual-carriageway) roads nearby. The Jingzang Highway is approximately 400 m east of the site. Building heights surrounding the tower are predominantly 15–30 m in height, but with some almost 100 m tall within 500 m to the south of the tower. The site is in a “green” area with some park space and a canal close by. Measurements were made over two field campaigns: the winter campaign from 5 November 2016 to 11 December 2016 and the summer campaign from 22 May 2017 to 25 June 2017 to allow a seasonal comparison of emissions.
Instrumentation was housed in a temporary shipping container laboratory located at the base of the tower. Sample lines from an inlet platform at an elevation of 102 m ran down the tower to the laboratory. Air for sampling was drawn down a O.D. (I.D. 9 mm) perfluoroalkoxy (PFA) tube at a rate of approximately 95 L min−1, resulting in an inlet pressure of 44 kPa. This ensured turbulent flow was maintained (Reynolds number ≈7000) and attenuation of signals along the ∼120 m sample line were minimised. Particles were removed from the airflow via a 90 mm Teflon filter mounted near the inlet which was changed at 24 h intervals. The inlet of the tube comprised a custom-built, 32 mm diameter, stainless steel manifold cap with gauze to prevent larger debris entering the tube. The manifold was mounted 82 cm vertically below a sonic anemometer (model HS-50, Gill Instruments) which measured the three wind components u, v and w at a rate of 10 Hz. During the winter campaign it was orientated NW from the tower and during the summer campaign towards the SE to measure the main wind direction without obstructions. However, analysis of the turbulence characteristics did not suggest that the open structure of the tower affected the measurements even when the flow came through the tower. This may be due to the size of the eddy motions at this measurement height.
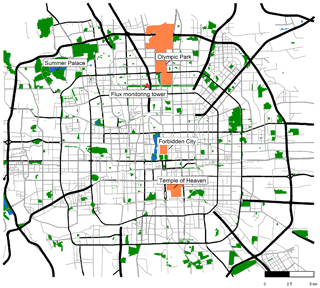
Figure 1Measurement site position is shown by the red triangle between the third and fourth ring roads. Key landmarks of Beijing are highlighted in orange with major roads shown in black and smaller roads in grey. Parks are shown in green and water in blue. Surrounding land use is mainly residential with many restaurants within a few hundred metres of the site with the Jingzang Highway close by. Map was built using data from © OpenStreetMap contributors 2019. Distributed under a Creative Commons BY-SA License.
2.2 Instrumental description
2.2.1 NOx sampling and measurement
Concentrations of NOx were measured using a dual-channel chemiluminescence instrument (Air Quality Designs Inc., Colorado). The instrument is similar to that described in Lee et al. (2009) but modified to enable high time resolution data to be collected with a residence time of 0.12 s inside the photolytic conversion cell. NO was measured directly by chemiluminescence from the reaction of NO and O3 in one channel. The second channel measures total NOx via photolytic conversion of NO2 to NO, at a wavelength of 395 nm, and then by chemiluminescence reaction with O3, as per the direct measurement of NO. Instrument data were recorded at a frequency of 5 Hz.
The NOx instrument was calibrated regularly (every 2–3 d) throughout the campaign using NO gas standards traceable to the UK's National Physical Laboratory's (NPL) NO scale. The instrument was calibrated via standard addition of a small flow of NO calibration gas to a flow of NOx-free ambient air (NOx was removed using a Sofnofil/charcoal trap). The sensitivities of the NO and NOx channels were calculated by direct addition of the diluted NO calibration gas. The NO2–NO conversion efficiency within the NOx channel was calculated by gas-phase titration of the diluted NO calibration gas with O3 to create a known quantity of NO2. During the calibration cycle, an instrument zero was quantified by diversion of sample flow to “zero volumes” so that the chemiluminescence reaction was completed before the gas reached the detectors. Zero measurements were scheduled to occur for 15 s every hour through the normal operating schedule.
2.2.2 CO sampling and measurement
CO was measured using a resonance fluorescent instrument (Model AL5002, Aerolaser GmbH, Germany). Flows were adjusted to reduce cell lag times so data could be recorded at 5 Hz to match the NOx data acquisition rate. Details of the unmodified system are described by Gerbig et al. (1996, 1999). The CO instrument was calibrated regularly (every 2–3 d) throughout the campaign as for the NOx instrument using a 1 ppm CO in synthetic air standard. Previous urban flux measurements with this type of instrumentation have been presented for UK cities by Famulari et al. (2010), Harrison et al. (2012), and Helfter et al. (2016).
2.3 VOC sampling and measurement
VOCs were measured using a Proton Transfer Reaction Time-of-Flight Mass Spectrometer (PTR-ToF-MS). The PTR-ToF-MS (PTR-MS 2000, Ionicon Analytik, Innsbruck, Austria) was installed at the base of the tower and sampled from the common inlet line at 30 sccm. The instrument was operated with a 5 Hz measurement frequency. The drift tube was maintained at 60 ∘C, with a pressure of 1.9 mbar and 490 V applied across it. This gave an E∕N (the ratio between electric field strength and buffer gas density) of 120 Td in the drift tube. This set-up is described in more detail by Acton et al. (2020).
The PTR-ToF-MS was calibrated twice a week during both the winter and summer campaigns using a VOC standard containing methanol, acetonitrile, ethanol, 1,3-butadiene, acetone, isoprene, butenone, butan-2-one, benzene, toluene, m-xylene and 1,2,4-trimethylbenzene at 1 ppmv (National Physics Laboratory, Teddington, UK). The standard was dynamically diluted in zero air to provide a six-point calibration. In the winter campaign the instrument was also calibrated using two Ionicon standards, the first containing methanol, acetonitrile, acetaldehyde, ethanol, acrolein, acetone, isoprene, crotonaldehyde, butan-2-one, benzene, toluene, o-xylene, chlorobenzene, α-pinene and 1,2-dichlorobenzene at 1 ppmv each and the second made up of formaldehyde, acetaldehyde, acrolein, propanal, crotonaldehyde, butanal, pentanal, hexanal, heptanal and octanal at 1 ppmv, nonanal at 600 ppbv and decanal at 500 ppbv. The background signal was corrected for by sampling a zero air standard for 5 min every hour. Background mixing ratios were subtracted from measurement data to give corrected mixing ratios. PTR-ToF-MS data were processed using PTRViewer (Ionicon Analytik).
2.4 Data processing
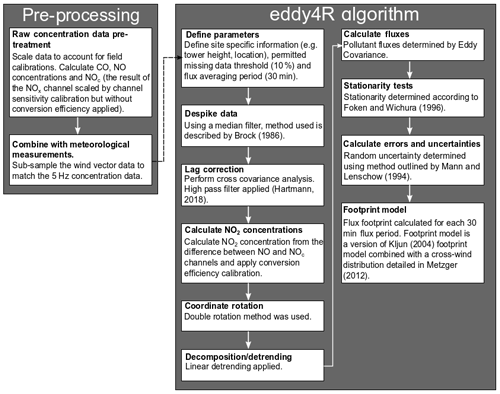
Prior to the calculation of pollutant fluxes, the raw data were scaled to take account of calibrations. The sensitivity within each channel of the NOx chemiluminescence instrument remained consistent throughout the winter and summer campaigns, so data were scaled using median sensitivity values. The conversion efficiency of the NOx channel gradually deteriorated over the two campaigns and so NO2 data were scaled using linearly interpolated conversion efficiency values. As highlighted in Fig. 2, the NO2 calibration was applied in two stages, the first during pre-processing and the second following lag correction. During the pre-processing stage the channel sensitivities (counts pptv−1) determined by field calibration are applied to both the NO and NOx channels to give NO (pptv) and a term referred to as converted NOx channel counts “NOc”. NO2 is then calculated from the difference between the time-lagged corrected NOc and NO divided by conversion efficiency. The time-lag correction is described below. For CO concentration data, the instrument sensitivity following each calibration was directly applied and the sensitivity remained consistent for the duration of the two campaigns.
Concentration data were coupled with wind data reported by the sonic anemometer by sub-sampling the wind data to match the 5 Hz concentration data. Data were then despiked prior to flux calculation as per the method described in Brock (1986) and Starkenburg et al. (2016). Following despiking, the lag time between vertical wind velocity measured in situ on the tower and the pollutant concentrations, measured on the ground, was calculated. The lag time correction was determined by maximisation of the cross-covariance between pollutant concentration and the vertical wind component. When determining the lag time for each species a high-pass filter (Hartmann et al., 2018) was used which improves the precision of the determined lag time by an order of magnitude. The median lag time was then calculated for each species during each campaign. The lag time between the concentration and vertical wind speed during the winter campaign was found to be 9.6±0.4, 10.0±0.4, and 10.2±0.3 s for NO, NO2, and CO respectively. For the summer campaign lag times were calculated as 9.4±0.4, 9.8±0.3 and 10.6±0.5 s. Because there was no discernible pattern or trend in the lag times and to prevent the flux bias that cross-covariance maximisation can introduce when fluxes are small (Langford et al., 2015), the final fluxes were calculated by applying the median lag time value for each campaign to all flux periods. Lag time correction was performed using the same method for the PTR-ToF-MS VOC concentrations. Lag times were calculated for isoprene (summer data) and benzene (winter data) within a 5–15 s window and these values were then applied to all compounds. Where the lag time was found to be outside of the 5–15 s range, a standard lag time of 9 s was applied.
2.5 Flux calculations
The flux, F, of each species, which can be defined as the vertical transport of a pollutant per unit area per unit time, was then calculated using the EC method (Lee et al., 2004):
where w′ is instantaneous change in vertical wind speed (i.e. , where overbars denote averages) and c′ is instantaneous change in pollutant concentration. The flux was calculated over a 30 min averaging period and quantified using the eddy4R family of R packages (Metzger et al., 2017) with a customised EC workflow template to suit the requirements of this study. Figure 2 shows the key steps involved in the calculation of pollutant fluxes. Random uncertainty was calculated using the method outlined by Mann and Lenschow (1994). The flux limit of detection was taken to be twice the random error. It should be noted that, due to the high measurement height, 30 min fluxes might be an underestimation of the “true” flux as the averaging period may not capture low-frequency contributions. To quantify the effect, a comparison between 30, 60 and 120 min averaging intervals was carried out for a week-long period of the summer campaign, which indicated 30 min fluxes were 93 % of the 60 min fluxes, whilst 120 min fluxes were considered too long an averaging period for sufficient temporal resolution. Additionally increasing the length of averaging time introduces more non-stationary periods into the data. The 30 min flux is therefore a compromise between capturing the entirety of the flux by keeping the low-frequency flux loss small (7 %) and having sufficient temporal resolution to relate the measurements to real-world processes. Fluctuations in temperature and humidity can impact fluxes by causing variation in air density (Webb et al., 1980). For closed path systems, such as those used in this study, air density variations caused by sensible heat flux are negligible; however, variations due to latent heat flux may need to be corrected for. For CO fluxes, samples were passed through a dryer, negating the need for this correction; however, latent heat flux could have an impact on the NOx fluxes (Moravek et al., 2019). The magnitude of the correction is proportional to the concentration–flux ratio, which for reactive species, like NOx, is small. The effect of latent heat flux on NOx fluxes was found to be significantly less than 1 % throughout the campaigns, and so the WPL correction was not applied (Pattey et al., 1992). The effect of high-frequency spectral loss on NOx and CO fluxes was investigated using a wavelet-based methodology (Nordbo and Katul, 2013). Spectral losses were found to be less than 3 % and so were not corrected for.
2.5.1 Corrections and filtering
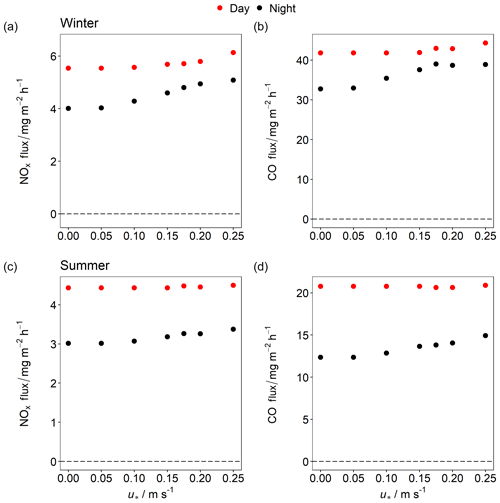
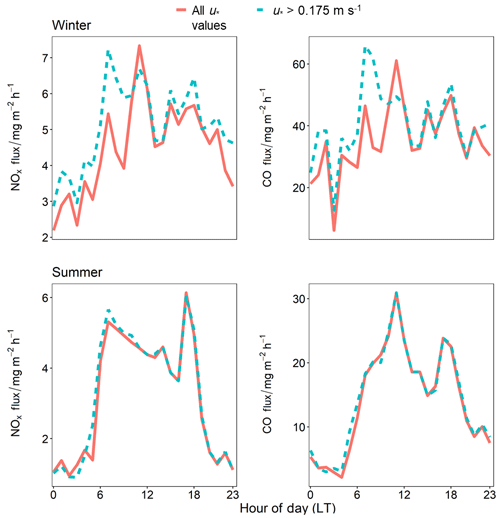
There are numerous assumptions made when calculating EC fluxes, all of which can introduce uncertainties in the derived quantity. Further conditions need to be met for the measured flux to be representative of surface flux. Assumptions include but are not limited to the flux being fully turbulent, with all transport done by eddy transfer, the terrain being homogeneous, measurements being made within the boundary layer, air density fluctuations being negligible and conditions remaining stationary. A common method to deal with periods of low turbulence, during which the flux at the measurement height may not reflect the surface flux, is to filter the data based on a friction velocity (u*) threshold. Friction velocity accounts for shear stress in the turbulent boundary layer and can be calculated from the instantaneous wind components u′, v′ and w′ (Foken, 2017). Concepts for u* filtering were originally developed by the community measuring CO2 exchange with vegetation. Here, incorrect application of u* filtering can lead to a “double-counting” of flux as described in Aubinet (2008). In addition, by filtering out low-turbulence cases (low u* values) the dataset can become biased, with little information about nighttime and winter periods. Whilst for CO2 exchange with vegetation fairly robust parametrisations exist that can be used to gap-fill periods of low turbulence, no such information is yet available for urban fluxes. Liu et al. (2012) therefore argue against applying u* filtering for the IAP site during a similar analysis of CO2 fluxes and suggest more errors could be introduced through filtering than not. Thus u* filtering was also not applied to the data presented here, unless otherwise stated. Approximately 29 % of winter fluxes and 11 % of summer fluxes were associated with u* values below 0.175 m s−1. Average fluxes as a function of u* values are presented in Appendix Fig. A1 and the effect of u* filtering on diurnal variation is shown in Fig. A2. These show the maximum possible effect of low turbulence on fluxes. Because low turbulence is correlated with nighttime conditions during which emission activity is reduced, an increasingly stringent u* filter preferentially removes periods during which the surface flux is smaller than the average. This may result in an increase in the average nighttime flux that does not necessarily reflect suppression of the flux by lack of turbulence.
Stationarity is another important consideration for flux data. Stationarity is when the flux is statistically invariant over the averaging period and is quantified using the method described in Foken and Wichura (1996). The stationarity criterion is likely not to be met when fluxes are small and subject to a large random uncertainty; this is irrespective of whether the conditions are actually non-stationary. As a result this filter tends to remove the smallest fluxes and can bias flux results (e.g. Nemitz, 2018). A broad stationarity filter of 60 % was applied to all flux data presented in any average diurnals, though non-stationary data are presented and highlighted in time series plots. This stationarity filter was used as a more rigorous filter of 30 %, commonly used within the CO2 flux community, removed a large proportion of the data. During the winter campaign 23 % of NOx fluxes and 22 % of CO fluxes were non-stationary under this more rigorous criterion. During the summer campaign these proportions were 16 % of NOx fluxes and 39 % of CO fluxes. The 60 % threshold used was determined to be appropriate as it falls within the stationarity range recommended for “general use”, such as using diurnal averages to interpret trends (Foken et al., 2004). Further to these corrections, any periods where the boundary layer was within 30 m above the measurement height were removed from the data. Boundary layer height was measured throughout both campaigns using a celiometer (Vaisala CL31). The data are analysed using the CABAM algorithm (Kotthaus and Grimmond, 2018).
It was also important to consider storage effects, due to the build-up or dilution of the pollutants below the measurement height. Build-up can occur during periods of low turbulence, e.g. during the night, and this accumulation reduces the flux at the measurement height with respect to the emission at the ground (Finnigan, 2006). As conditions become more turbulent the accumulated pollutant concentration gets diluted again and the measured flux contains a component that originates from the stored material rather than emission. Gas concentration profile measurements can be used to allow detection of build-ups by providing data for computing a storage term below measurement height. In this case, the storage flux, Fs, at time, t, was calculated according to the following equation (Andreae and Schimel, 1990):
The validity of calculating the storage flux at a single measurement height was evaluated by comparing CO2 concentration measurements made at the measurement height and CO2 concentration profile measurements made at three different heights on the tower. By comparing the evolution of the CO2 concentration at the single measurement height with the CO2 profile measurements, it was determined that calculating storage flux using the single concentration at the measurement height was a reasonable approximation of the storage within the column. It should be noted that this storage correction to some extent takes care of the flux suppression at low turbulence, except for the interaction with advection and chemistry.
Throughout, this paper focuses on the analysis of total NOx flux rather than NO and NO2 flux separately. Whilst the two compounds undergo rapid interconversion the total should be conserved at the timescale that governs the transport from the surface to the measurement height; the major loss route for NOx is HNO3 formation through reaction with the hydroxyl (OH) radical. This loss is assumed to be negligible between ground emission and sampling at the tower inlet. Calculation of Deardorff velocity suggests that on average the time taken for a parcel of air to reach the 102 m measurement point is ∼68 s (Deardorff, 1970). Assuming average OH concentrations of 1×10⁶ molec. cm−3, it is estimated that less than 1 % reacts with OH at this timescale.
2.6 Footprint model
A flux footprint is the area surrounding the measurement tower that contributes to a measured flux based on factors such as wind speed, wind direction, atmospheric stability and surface roughness. A statistical flux footprint model can be used to quantify the flux contribution of each cell of an emission grid relative to the distance away from the measurement position in all directions, creating a weighing matrix that estimates the ground influence of a particular cell contributing to the observed emission flux. A footprint was calculated for each half hour flux period at 100 m resolution. The footprint model used is based on Kljun et al. (2004) with a cross-wind distribution detailed in Metzger et al. (2012). Surface roughness values were taken from Liu et al. (2012) and taken to be 2.5, 3.0, 5.3 and 2.8 m for the NE, SE, SW, and NW wind quadrants respectively. Figure 3 shows the average footprint for the winter and summer campaigns with the 30 %, 60 % and 90 % cumulative contributions to the measured flux represented by the contours.
For both campaigns the 90 % contribution to the measured flux extended as far as 7 km from the measurement site for some averaging periods; however, as shown in Fig. 3, on average 90 % of the contribution to measured emissions was from within 2 km of the tower. Figure 3 shows the difference in areas of influence covered during the winter and summer campaigns due to differences in dominant wind directions. During the winter, the measured fluxes were predominantly from the NW, encompassing Beitucheng West Road and a block of predominantly commercial buildings and restaurants. The mean footprint maximum, the distance away from the tower at which the maximum contribution to the measured flux occurs, falls 0.26 km away from the tower in winter. In summer, the fluxes were mostly influenced by areas to the north-east and east of the tower, encompassing the Jingzang Expressway. The mean footprint maximum for summer was also 0.26 km away from the site.
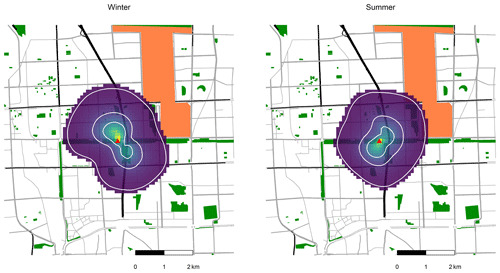
Figure 3The mean flux footprints for the winter and summer campaigns. The site is shown by the red triangle in the centre of the map. Each square is 100 m2 and the brighter colours indicate a greater influence on measured emission for a particular area. The white rings show the areas contributing 30 %, 60 % and 90 % to the flux total, with the inner ring representing the 30 % contribution and the outer ring representing the 90 % contribution. The 90 % of the influence from the footprint extends up to 2 km away from the tower with maximum contribution 0.26 km away from the tower. Map was built using data from © OpenStreetMap contributors 2019. Distributed under a Creative Commons BY-SA License.
2.7 Inventory
The measured pollutant fluxes were compared with the Multi-resolution Emissions Inventory for China (MEIC, Qi et al., 2017, http://meicmodel.org/, last access: 19 May 2020) to evaluate how well the inventory describes the diurnal evolution of pollutants and their absolute magnitude. MEIC emissions are available at 0.25×0.25∘ resolution and were downscaled to 3 × 3 km resolution on a sector-by-sector basis following the approach of Zheng et al. (2017). MEIC considers five emissions source sectors: power plants, industry, transport, residential, and agricultural. Agricultural emissions are not relevant within our flux footprint and so were not included in this work. Emissions are available on a monthly basis and are assumed to be the same each day of the month, and a diurnal cycle appropriate to Chinese sources is applied to each emission sector. Example emissions for Beijing are presented in Fig. A3 for November. The NOx and CO emissions predicted by the inventory are calculated from the multiplication of each footprint matrix by the MEIC grid. In order to match the scales of the footprint matrix and the inventory, a pseudo 100 m ×100 m MEIC grid was created by splitting the 3 km resolution inventory into smaller 100 m ×100 m grid squares, each with the same emission value.
Table 1Summary table for NOx and CO fluxes and concentrations. Data presented are for fluxes which are within 60 % stationarity criteria for all u* values.
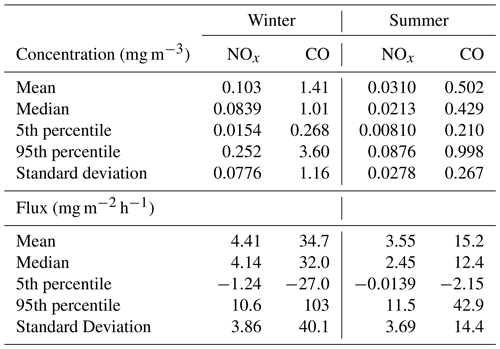
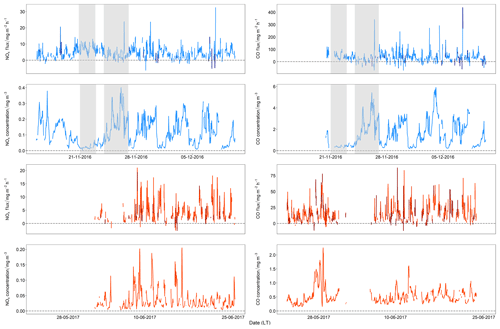
Figure 4Time series data for 30 min averaged NOx and CO fluxes for the winter (blue trace) and summer (orange trace) campaigns with fluxes outside of the 60 % stationarity criteria shown in darker colours. Gaps in the time series are due to instrument problems. The two contrasting periods discussed in Sect. 3.2 are highlighted in grey.
Statistics for NOx and CO fluxes and concentrations presented in this work are shown in Table 1. Figure 4 shows a time series of measured NOx and CO fluxes during the winter and summer measurement campaigns where grey coloured traces highlight data which do not meet the 60 % stationarity criteria. For winter, 3.5 % of NOx fluxes and 8.2 % of CO fluxes were non-stationary. In summer, slightly fewer measurements did not meet the stationarity criteria, with 3.1 % of NOx fluxes and 7.3 % of CO fluxes falling outside the 60 % stationarity limits. The mean flux for NOx during the winter measurement period was 4.4±3.9 and 3.6±3.7 mg m−2 h−1 for the summer measurement period. For CO, there was a larger difference between the two seasons, with the mean flux calculated as 35±40 mg m−2 h−1 for winter and 15±14 mg m−2 h−1 in summer. Some of the calculated fluxes were negative, corresponding to deposition to the surface; however, as expected in an urban environment, the net flux was strongly positive, indicating emission. The average NOx fluxes for the winter and summer periods were similar, suggesting an emissions source that did not change much between seasons. In contrast the average CO flux was over double in the winter compared to the summer, indicating an additional source in the winter.
When considering previous literature, the NOx fluxes measured in Beijing were low compared to London, UK, where net emissions were in the range of 10.8–14.4 mg m−2 h−1 (Lee et al., 2015). A study investigating NOx fluxes across 13 urban locations in Norfolk, Virginia, reported values in the range of 18–28 mg m−2 h−1, up to 8 times higher than those measured in Beijing (Marr et al., 2013). Fluxes measured in Beijing were similar to those measured in Innsbruck at a roadside site in July–October 2015, where NOx fluxes of 2.5–5.2 mg m−2 h−1 were reported (Karl et al., 2017). For CO, measured fluxes in central London were 2–3 times lower than those measured in Beijing. Average winter (December–February) CO flux was reported to be 12.5±3.4 mg m−2 h−1 and average summer (June–July) CO flux was reported to be 4.0±0.1 mg m−2 h−1 for the measurement period September 2011–December 2014 (Helfter et al., 2016). NOx emissions are likely to be lower in Beijing than for other cities as the majority of road vehicles in Beijing are light-duty gasoline vehicles (LDGVs) which made up to 93 % of the vehicle fleet in Beijing in 2013 (Yang et al., 2015) compared to other cities which have a higher proportion of diesel vehicles. However, because fluxes vary spatially within each city, care needs to be taken when comparing measurement datasets as the type of the location within the city needs to be considered.
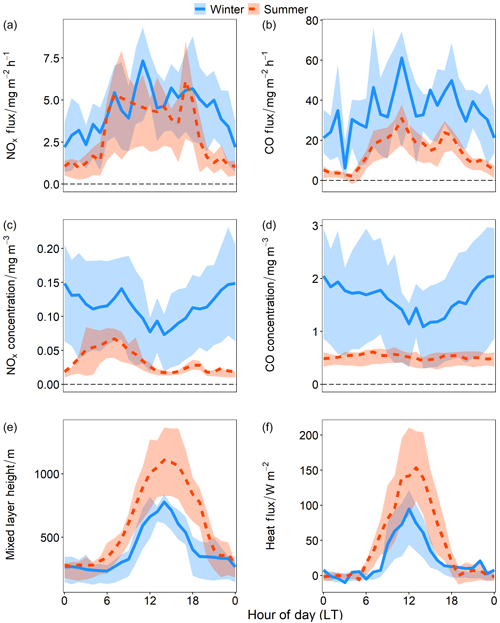
Figure 5Average diurnal profiles for (a) NOx flux, (b) CO flux, (c) NOx concentration, (d) CO concentration and (e) mixed layer height and (f) heat flux. Blue, solid lines are for measurements taken during the winter campaign and the orange, dashed lines are measurements taken during the summer campaign. The shaded areas represent the 25th and 75th percentiles. For the NOx and CO fluxes, only stationary data have been used, but no u* filtering has been applied when doing the diurnal averaging, as described in Sect. 2.5.1.
3.1 Average diurnal cycles
Figure 5 shows the mean diurnal profile for both campaigns for pollutant fluxes, concentrations and mixed layer height. Diurnal profiles are a useful way to visualise flux data, as time of day may indicate processes responsible for emissions. During the winter campaign, the NOx fluxes were lower during the early hours of the morning (between 00:00 and 05:00), ranging between 1.9 mg m−2 h−1 and 3.6 mg m−2 h−1. After 06:00, the NOx fluxes increased and remained elevated, though variable, throughout the day with a mean daytime value (06:00–18:00) of 5.1 mg m−2 h−1. The NOx fluxes decreased again in the evening. The daily variability in CO fluxes followed a similar pattern to NOx. The mean daytime CO flux was 38 mg m−2 h−1 and was lower during the night (19:00–05:00), with a mean nighttime value of 29 mg m−2 h−1. Concentrations are influenced by meteorology and long-range transport as well as local emissions (in this study local emissions refer to emissions from within the flux footprint). NOx and CO concentrations remained constant during the night due to stability in the mixed layer height. When NOx and CO emissions increased after 05:00, this enhancement in flux was reflected in the concentration data with a small peak in NOx and CO concentrations around 06:00, though the effect is masked as the mixed layer height begins to increase. Concentrations decreased to their minima at 15:00 when the mixed layer height reached its highest point and increased again when the mixed layer height contracted over night.
Fluxes were lower during the summer campaign than during the winter. The mean nighttime flux was less than 1.6 mg m−2 h−1 for NOx and 6.5 mg m−2 h−1 for CO. Emissions rapidly increased after 05:00 and started to decrease at around 17:00. Daytime emissions for NOx were fairly consistent, with a mean value of 4.6 mg m−2 h−1. The first of two distinct peaks in the observed NOx fluxes occurred at 07:00, where emissions reached 5.4 mg m−2 h−1 and the second occurred at 17:00 with a slightly higher value of 6.3 mg m−2 h−1. The daytime profile for CO showed two distinct peaks in emissions; the first peak occurred at 11:00 with CO emissions around 30 mg m−2 h−1 and the second at 17:00, when CO fluxes were around 24 mg m−2 h−1. Between these times the CO emissions dipped with a minimum daytime value of 16 mg m−2 h−1 at 14:00–15:00. The influence of local emissions on concentration is more clearly observed during the summer campaign; the peaks in NOx and CO fluxes at 17:00 occurred at the same time as an enhancement in NOx and CO concentrations. Both NOx and CO concentrations reached their daytime minima at 14:00–15:00 when the mixed layer height was at its peak.
Given that the NOx emissions were fairly consistent between the two seasons, it is likely that the major sources of NOx do not vary significantly over the year. In urban areas, vehicular emissions tend to be a dominant source of NOx (Parrish et al., 2009; von Schneidemesser et al., 2010; Borbon et al., 2013), and previous studies measuring NOx fluxes have attributed emissions to vehicles (Lee et al., 2015; Vaughan et al., 2016). Diurnal variations in summer NOx emissions agree well with previously reported diurnal variation in Beijing's traffic flow. Jing et al. (2016) show that traffic flow (vehicle number per hour) begins to increase from 05:00 in the morning, corresponding to the observed increase in NOx emissions. As would be expected, peak traffic flow coincided with the lowest average vehicle speeds and occurred at 08:00 and 18:00. NOx emissions are dependent on fuel type, engine type, combustion temperature, vehicle speed, engine load and exhaust after-treatment technology. It is known that “stop–start” driving conditions and idling can enhance NOx emissions compared to driving at steady speeds, and observations indicated that there are peaks in NOx emissions during these rush hour periods. Beijing has attempted to reduce emissions through traffic management as well as by imposing emissions reduction regulations; for example, yellow label vehicles, vehicles which do not meet the China I emissions standard, have been forbidden from entering Beijing since 2014 (Yang et al., 2015). One management strategy imposed restrictions on heavy-duty vehicles (HDVs) entering the city (past the sixth ring road) and only permits non-local vehicles to enter between 00:00 and 06:00. HDVs, particularly those using diesel fuel, are thought to be responsible for 85 % of NOx emissions, whilst light-duty vehicles (LDVs) are considered responsible for more than half of CO emissions (Yang et al., 2015). Nighttime emissions of NOx and CO during both seasons could be attributed to HDVs making up an unusually high proportion of the vehicle fleet. CO emissions for summer also suggested a strong daytime traffic influence, although the peak at 11:00 may indicate an additional source, possibly related to cooking given the time of day. Cooking was identified as a major contributor to the organic PM1 flux in aerosol flux measurements made during the same measurement period (Langford, 2020). NOx and CO fluxes measured during the winter also indicated some traffic influence, although the trend is less clearly resolved than for the summer measurements. Winter NOx emissions had a peak of 6.0 mg m−2 h−1 at 07:00 and there was a broader evening peak of similar magnitude between 17:00 and 18:00. NOx flux peaked at 11:00 at 6.7 mg m−2 h−1. CO flux was more variable: there was a small peak around the time of the morning rush hour, though this was not as clearly resolved as it is for NOx. CO flux peaked at 11:00 and in the evening, though the profile showed greater short-term variability for NOx.
The difference between the winter and summer diurnal averages was more significant for CO than for NOx, with larger CO emissions in the winter than the summer throughout the day. This may be in part due to an additional source unique to winter, for example domestic heating. Local heating sources are likely to be reasonably consistent throughout the day, which may go some way to explaining why the relative difference between nighttime and daytime emissions is smaller than for NOx. Local heating sources also appear to contribute to the NOx emissions measured, albeit to a lesser degree than for CO. The rush hour peaks that were clearly observed in NOx flux during the summer campaign are masked somewhat in the winter and the peak was broader in the evening, which could be due to increased residential emissions throughout the day. It is possible that additional emissions from the residential sector were not the only reason for the difference in magnitude of winter and summer CO emissions however. Strong seasonal variability in the fluxes of CO has been observed for London as another megacity where CO emissions measured in summer were 69 % lower than in winter (Helfter et al., 2016). In this case, higher winter CO emissions were attributed mainly to vehicle cold starts and reduced fuel combustion efficiency due to colder ambient temperatures. It should be noted that this study took place in a temperate, developed city and Beijing needs more winter heating, which until recently was primarily from coal. Indeed, Langford (2020) identified signatures of coal and solid fuel combustion within the flux footprint of the measurement, although residential heating is overwhelmingly dominated by district heating in this area of Beijing.
3.2 Impact of local emissions on air quality
The average diurnal profiles in Fig. 5 highlight the relationship between emissions, mixed layer height and concentrations. Whilst emissions and concentrations seem to be closely linked when averaged over the whole campaigns, there are periods where local emissions do not drive concentrations. During the winter months Beijing experiences a frequent cycling between “polluted” and “clean” days, and this phenomenon has been termed “sawtooth cycles”. During winter pollutants build up during near-stagnant periods, with south-easterly wind flow being trapped by the mountain range in the north-west. These are then advected out of the city when wind speed increases and the direction switches to the north-west, resulting in sharp reductions in atmospheric concentrations (Jia et al., 2008; Li et al., 2017). This distinctive meteorological phenomenon occurs in Beijing as a result of the East Asian Winter Monsoon, itself driven by temperature differences between the Pacific Ocean and the Asian continent (Chen et al., 1992). This cycling was observed during the winter field campaign and can be seen in NOx and CO concentrations highlighted in Fig. 4. During the period 21–23 November 2016 average daytime concentrations of 0.020 and 0.35 mg m−3 for NOx and CO respectively were observed. On the following three days, 24–27 November 2016, higher concentrations of 0.13 mg m−3 of NOx and 1.7 mg m−3 of CO were measured, a more than 5-fold increase in average daytime concentrations compared with the “clean” period. Corresponding increases and decreases in pollutant flux were not clearly observed however (Fig. 4). Figure 6 shows the distribution of the NOx and CO fluxes and concentrations over the “clean” and “polluted” days. Despite the higher concentrations during the polluted period the measured flux is slightly lower. During the polluted period more deposition flux occurred; 13 % of NOx fluxes and 23 % of CO fluxes (associated with u* values over 0.175 m s−1) were negative, whereas no deposition fluxes were measured during the clean period.
Figure 7 shows two flux footprints: one averaged for the clean period and one for the polluted period. Satellite images and Open Street Map data (https://www.openstreetmap.org, last access: 23 October 2019) show that these footprints cover very similar land use areas, predominantly residential with busy roads, so it is expected that the emissions would be similar for these areas, consistent with the variability in the measured flux. This indicates concentrations were more affected by meteorology, driving the accumulation at the city scale, or transport from regions outside Beijing than local emissions. There was not a significant contrast between mean mixed layer heights between the two periods. A mean height of 464 m (including nighttime and daytime) with a daytime maximum of 811 m for the clean period was measured. For the polluted period the mean mixed layer height was 434 m with a daytime maximum of 822 m. Wind speeds were much lower during the polluted period with a mean wind speed of 1.9 m s−1 compared to 6.0 m s−1 for the clean period. These more stagnant conditions cause emissions to build up before being advected out of the city when wind speeds increase once again. Additionally, the higher wind speeds experienced during the “clean” period mean the city is influenced by air masses from further away. To the north-west, the dominant wind direction for the “clean” period, there is less industrial activity compared to the south of the measurement site towards the centre of Beijing, so these air masses are also likely to be less polluted.
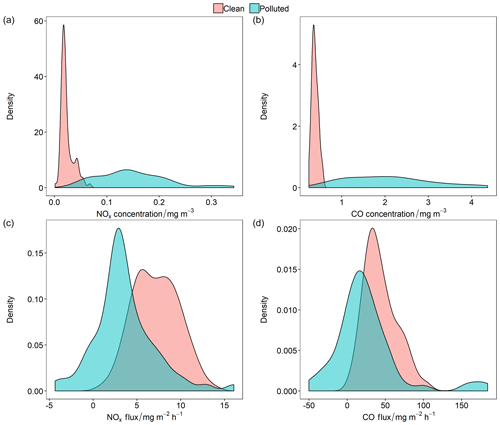
Figure 6The density distribution of NOx and CO concentrations and fluxes during the “clean” period (21 November 2016–23 Novemeber 2016) and “polluted” period (24 November 2016–27 November 2016). Only fluxes for which u* values are over 0.175 m s−1 and which meet the 60 % stationarity criteria are presented to allow a valid comparison.
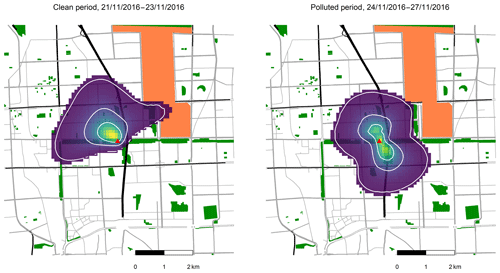
Figure 7Average footprints for the “clean” period, 21 November 2016–23 November 2016 (left), and the “polluted” period, 24 November 2016–27 November 2016 (right). Map was built using data from © OpenStreetMap contributors 2019. Distributed under a Creative Commons BY-SA License.
3.3 Dependence on wind direction
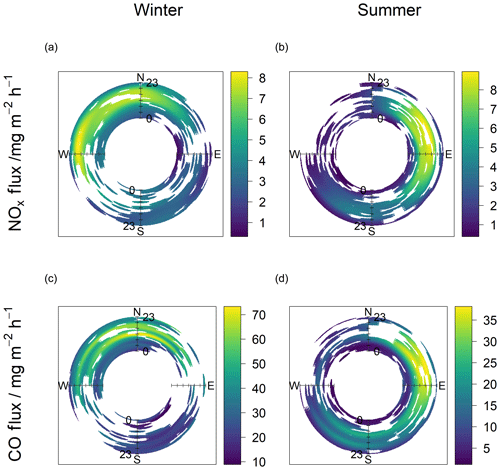
Examining the relationship between diurnal flux and wind direction can give further information about emissions sources. Figure 8 shows the average diurnal emission NOx and CO flux plotted as a function of wind direction for both the winter and summer campaigns. Hour of day is represented by the radial scale between the inner and outer rings and starts at 00:00 on the inner side of the ring to 23:00 on the outer side of the ring.
For the winter campaign there appears to have been an enhancement in flux when there is a northerly wind direction. For NOx the emission was largest throughout the afternoon hours, but for CO peaks are more distinct, with an enhancement at midday and again between 16:00 and 20:00. Within the flux footprint, to the north of the site are residential areas, Beitucheng West Road (a busy traffic route) as well as some university buildings and a hospital. Further north (approximately 1 km from the tower) is the fourth ring road. The largest NOx fluxes were observed between 16:00 and 20:00 when the wind direction was westerly. Within this wind sector lies Beitaipingzhuang Road, about 0.65 km from the tower, and Xueyuan Road, which links the third and fourth ring roads slightly further to the west and just under 2 km away from the tower.
During the summer campaign, there was an enhancement in the daytime flux of CO and NOx with an easterly wind, indicating an emissions source to the east of the site, probably the Jingzang Highway just 0.35 km east of the site as shown in Fig. 1. There are also some daytime enhancements in NOx and CO emissions from the south of the measurement site towards central Beijing. For CO, enhancements to the south show two quite distinct enhancement periods in the morning and evening, suggesting these emissions are from vehicles. It is unlikely that there were any significant seasonal changes in traffic density on roads surrounding the measurement site. The change from a westerly influence observed during the winter to an easterly influence in summer is due to changes in the dominant wind direction. Beijing's wind patterns are quite different during the winter and the summer. There is a noticeable absence of easterly winds in the winter and the mean flux footprints (Fig. 3) highlight the difference in regions contributing to the observed flux.
3.4 Comparison with VOC flux
Table 2Summary table for VOC concentrations and fluxes measured by PTR-ToF-MS. Data presented are for fluxes which are within 60 % stationarity criteria for all u* values.
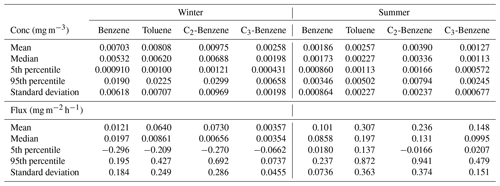
Aromatic hydrocarbons, including benzene, C2-benzene, C3-benzene and toluene, are components of gasoline fuel and are typically emitted from combustion and evaporation of fuels and solvents in urban environments (Caplain et al., 2006; Langford et al., 2009). Table 2 summarises the fluxes and concentrations measured during the APHH Beijing measurement campaigns. Concentrations were significantly greater during the winter season, while emissions were higher during the summer for all four hydrocarbon species. During the summer, toluene fluxes were the largest (0.31 mg m−2 h−1), followed by C2-benzene (0.24 mg m−2 h−1) and then C3-benzene (0.15 mg m−2 h−1), with the flux of benzene being the smallest (0.10 mg m−2 h−1). Diurnal variation of VOCs for winter and summer is shown in Fig. 9. The uncertainty in the diurnal averages makes drawing conclusions about variations between daytime and nighttime difficult, although there are some indications that summertime trends at least mimic those of CO and NOx. During summer, fluxes of all four species followed a very similar diurnal trend with generally higher emissions in the daytime compared to the nighttime. A smaller early morning peak was observed at 08:00, slightly later than the morning peak in NOx emissions which reached their maximum at 07:00. Emissions increased again in the afternoon for toluene, C2-benzene and C3-benzene, peaking between 15:00 and 16:00. Benzene remained fairly constant throughout the afternoon with a mean emission of 0.076 mg m−2 h−1. The peak during the night corresponds to a one-off event measured on 29 May 2017 at 03:30. During the winter, C2-benzene fluxes were the largest (0.073 mg m−2 h−1), followed by the toluene flux (0.064 mg m−2 h−1) and then benzene (0.012 mg m−2 h−1), with the flux of C3-benzene (0.0036 mg m−2 h−1) being the smallest. There was no clear difference between nighttime and daytime emissions for all species.
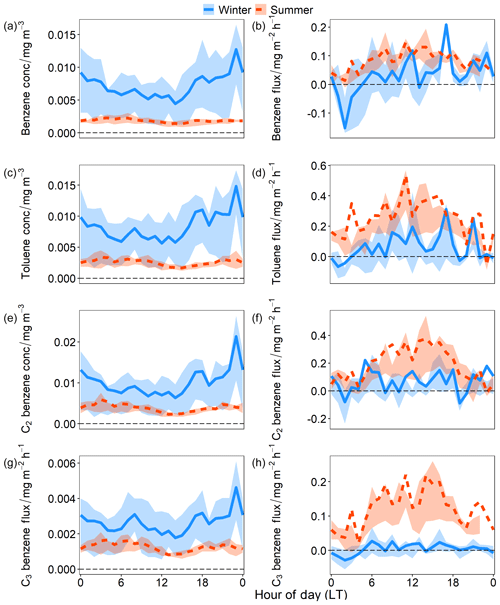
Figure 9Diurnal profiles for (a) benzene concentration, (b) benzene flux, (c) toluene concentration, (d) toluene flux, (e) C2-benzene concentration, (f) C2-benzene flux, (g) C3-benzene concentration and (h) C3-benzene flux measured by PTR-ToF-MS. Blue, solid lines are for measurements taken during the winter campaign and the orange, dashed lines are measurements taken during the summer campaign. The shaded areas represent the 25th and 75th percentiles to give an idea of the spread of the data. Only stationary data have been used, but no u* filtering has been applied when doing the diurnal averaging.
Table 3Summary of mean VOC fluxes measured in various urban or semi-urban locations.
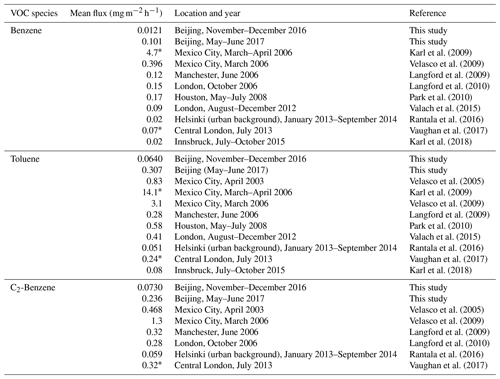
* Measured from an aircraft.
Table 3 summarises previous urban flux measurements to allow the VOC fluxes from Beijing to be put into context. The benzene fluxes measured in Beijing during summer fall into the range of those reported in Table 3 and are most similar to values reported for large cities in the UK. Toluene fluxes and C2-benzene fluxes measured during the summer in Beijing are also similar to the mean fluxes measured in UK cities where vehicular emissions were found to dominate aromatic fluxes. However, it should be noted that previous measurements over London were all made with a quadrupole PTR-MS instrument, which, unlike the time-of-flight instrument used in the present study, is restricted to a unit mass resolution. This means that the benzene, toluene and C2-benzene signals may have included contributions from other compounds and therefore are likely to be an overestimate of the true C2-benzene emission. The VOC flux values reported for Mexico City are much greater than those measured in Beijing for both seasons. Karl et al. (2009) reported an influence from evaporative emissions from the northern industrial district, but there is no industrial emissions source within the flux footprint for the Beijing measurements. This, along with a more modern vehicle fleet subject to stricter emissions regulation in Beijing, may explain the larger discrepancy between these two cities. Fluxes measured in Helsinki are lower than emissions measured in the summer but comparable to those measured during the winter.
Emissions of all four species were higher in summer than in winter, although the statistical significance of all but C3-benzene is somewhat uncertain. This is the opposite to the trend observed for NOx and CO emissions, most likely driven by higher evaporation rates due to higher temperatures. The mean daytime temperature was 281 K during the winter campaign and 305 K during the summer campaign. Comparing VOC fluxes to NOx and CO fluxes in the summer, emissions of C2-benzene and C3-benzene started to increase in the early hours of the morning (05:00) as observed for NOx and CO, indicating a rapid release of emissions from a new source, such as traffic emissions. This is true for toluene and benzene, although the relative difference between night and day emissions is less pronounced. All four hydrocarbon species showed an enhancement during the mid-morning during the summer, like CO, probably due to an additional contribution from residential and cooking emissions from local restaurants. There is possibly a winter contribution from evening rush hour traffic to the benzene and toluene emissions that mirrors that observed in the CO and NOx emissions at 17:00, though this is not clearly observed during the summer campaign. During the summer, the emissions of all four species are elevated in the afternoon (between 13:00 and 18:00) when temperatures are highest. These emissions are likely enhanced by evaporation which masks the evening rush hour traffic contribution. There is a strong correlation between total VOC flux and heat flux in summer (r=0.83) compared to the winter (r=0.35).
The ratio of benzene to toluene (B∕T) is often used to gauge the photochemical age of an air mass as the two species have different atmospheric lifetimes due to their different reactivity with the OH radical. Heeb et al. (2000) reported B∕T concentration ratios between 0.41 and 0.83 for primary exhaust emissions. As an air mass ages, the ratio increases as toluene is more reactive than benzene. For Beijing, the median B∕T concentration ratio in the winter was 0.89 and 0.73 for the summer at the upper end of the expected range for primary exhaust emissions. Barletta et al. (2005) reported a roadside B∕T value of 0.6 for Beijing; however, vehicle fleet and fuel types are rapidly changing in response to legislation, so this measurement may not be representative of the measurement period of this work. The difference in B∕T concentration ratios does however indicate that VOC sources are changing between winter and summer as the change in ratio cannot be explained by expected changes in atmospheric oxidation rates caused by seasonal differences in temperature. Langford et al. (2009) point out that temperature can impact B∕T ratios as reactivity rates increase with warmer temperatures, but if temperature was driving the seasonal difference, it would be expected that the B∕T ratio measured during summer is higher than during winter. It is likely that additional sources such as domestic burning and cooking are present in winter; Barletta et al. (2005) report that higher B∕T concentration ratios are associated with natural gas and biomass combustion, which supports the hypothesis that these types of emissions sources could be leading to an increased B∕T concentration ratio in the winter. The B∕T flux ratio should reflect better the ratio of the two pollutants in emissions sources as flux ratios are confined to the area of the flux footprint rather than being influenced by a wider area (Karl et al., 2009). The median B∕T flux ratios were 0.72 for the winter campaign and 0.31 for the summer campaign, further suggesting a change in emissions source between the two seasons. The B∕T flux ratio for summer is lower than expected for primary exhaust emissions, though similar values have been reported for vehicles without catalytic converters (Heeb et al., 2000), and given higher temperatures, emissions from other sources such as solvent evaporation may affect this ratio. Indeed, Karl et al. (2009) showed that fuel evaporative losses typically have a higher toluene fraction, leading to lower B∕T ratios. The strong VOC–heat flux correlation and the low B∕T ratio observed during the summer campaign suggest fuel evaporative loss is a source of aromatic VOC emissions in Beijing.
3.5 Comparison with an emissions inventory
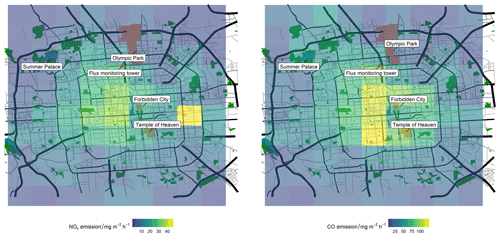
The measured NOx and CO fluxes were compared to the high-resolution (3 km × 3 km) MEIC v1.3 inventory with a base year of 2013. The comparison of VOC emissions with an emissions inventory is beyond the scope of this work. A direct comparison of the diurnal variation in measured emissions and that in the inventory indicates that NOx and CO emissions are grossly overestimated throughout the day for both campaigns. Total NOx emissions are overestimated by a factor of 3.8–17 (mean overestimation of 9.9 throughout the day) in the winter and 4.2–25 (mean =11) in the summer. For CO, winter emissions were between 1.6 and 9.7 (mean =4.8) times larger in the inventory than those measured and summer emissions between 5.2 and 21 (mean =10) times larger.
Part of the discrepancy between the inventory and measured emissions may be due to the comparison of observations (made in 2016/2017) with an older inventory (base year 2013). China's NOx emissions have rapidly changed in the past 3 decades. Liu et al. (2016) report that between 2005 and 2011 NO2 emissions increased by 53 % for the whole of China, attributed for the most part to increasing fuel consumption with coal the dominant fuel type. An estimated three-quarters of all electricity in China was generated by coal in 2016 (International Energy Agency, Energy and Air Pollution, 2016). After 2012 however, a combination of installation of power plant de-nitration devices and vehicle emissions controls led to a 32 % decrease in NO2 emissions (Liu et al., 2016; Krotkov et al., 2016; Miyazaki et al., 2017). In Beijing, NOx emissions are decreasing thanks to numerous air pollution control measures implemented since 2000; polluting industries and power plants have been relocated outside of the city, stricter emissions standards for industrial and domestic boilers have been introduced and the fuel type shifted from coal to gas (Wang et al., 2010). Since the introduction of the “Clean Air Action Plan” in Beijing in 2013, 900 000 households in Beijing have converted from using coal to cleaner technologies like gas or electricity. The burning of biomass, such as wood and crops, was completely forbidden by the end of 2016 (Cheng et al., 2019). The impact of the emissions controls was predicted to reduce emissions of NOx and VOCs by 43 % and 42 % respectively between 2013 and 2017 in Beijing (Cheng et al., 2019). Most significant for NOx emissions however are the stringent vehicle control measures introduced within the last decade, accounting for 47 % of the total reduction in emissions for the city.
CO emissions have also been declining in Beijing over the past 2 decades by an average rate of 1.14 % yr−1 (Wang et al., 2018). Zheng et al. (2018) highlight a reduction in inefficient domestic stoves and improvements in emissions standards for vehicles as being dominant forces for the observed reduction in CO emissions. For VOCs, vehicle emission controls were another significant contributor to the reduction, with 16.1 % of the reduction attributed to new controls. Improvements in management of solvent use (e.g. use of high-solid and waterborne paints instead of solvent-based ones) dominated the reduction in VOC emissions, contributing 49.3 % to the total reduction in Beijing. Emissions between 2013 and 2016 were predicted to reduce by 30 % for NOx and 35 % for VOCs (Cheng et al., 2019; Biggart et al., 2020).
These estimated changes were applied to the inventory, leading to reductions in emissions of 30 % in the winter and 43 % for the summer for both species. No emissions reductions were presented for CO alone, but given that its expected sources are similar to NOx, the same reduction factor was applied to the CO inventory emissions. The mean diurnal profiles for the lowered inventory estimates are presented in Fig. 10, with measured emissions shown by the black dashed line. With the expected reduction considered, NOx is still overestimated by a factor of 2.7–12 (mean =7.0) in the winter and 2.4–14 (mean =6.8) times in the summer. Similarly, CO emissions are still overestimated for both seasons, with inventory CO emissions 1.1–6.8 (mean =3.4) times larger than the measured CO emission for the winter campaign. For summer, the inventory overestimated CO emissions by a factor of 2.9–12 (mean =5.6). The closest agreements between inventory and measurements were during the nighttime in all cases. Applying these reductions does obviously improve the inventory comparison compared with the original; however, large overestimations remain.
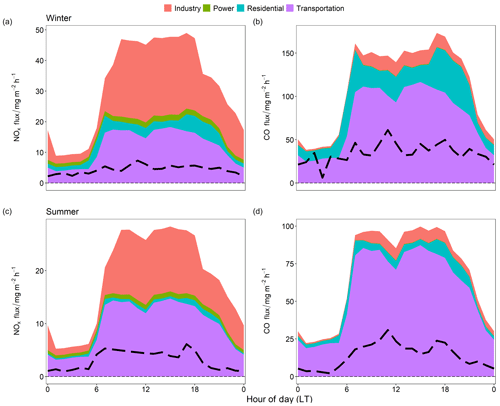
Figure 10Measured diurnal trend (dashed black line) and predicted diurnal trend using the MEIC inventory (filled areas by sector) for NOx and CO emissions. MEIC inventory data have been reduced by 30 % for comparison with the winter 2016 campaign and by 43 % for comparison with the summer 2017 campaign to take account of expected emissions reductions indicated in Cheng et al. (2019). Panels (a) and (b) show emissions for the winter campaign and panels (c) and (d) show emissions from the summer campaign.
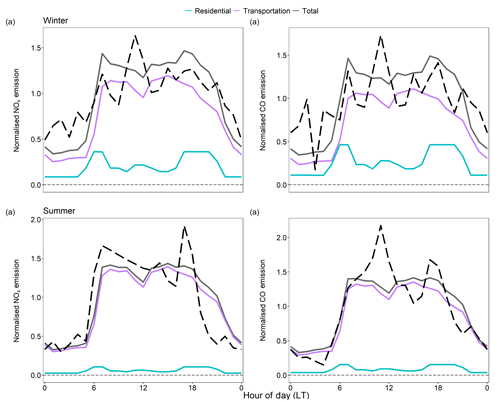
Figure 11Comparison of normalised diurnal variation in NOx and CO emission predicted by the MEIC inventory and measured flux. The normalised emission has been calculated for the inventory by dividing hourly sector emission by the mean daily sector emission. Given there are no clear industrial or power generation emissions sources within the flux footprint, only the residential (blue solid line) and transportation (purple solid line) sectors have been presented. The normalised diurnal variation for these sectors has been multiplied by the normalised diurnal variation for the sum of the residential and transportation sectors (grey solid line) to reflect the relative contributions of the two sectors. Normalised diurnal variation in the measured emission has been calculated by dividing mean hourly emission by mean daily emission (black dashed line). Panels (a) and (b) show data for NOx and CO from the winter campaign and panels (c) and (d) for the summer.
Examination of the flux footprint suggests that the majority of measured emissions are coming from transportation and residential sources. The inventory supports this for CO, suggesting that transportation is the largest contributing sector, followed by the residential sector. However, for NOx the inventory also suggests that there is a large industrial source, contributing up to 60 % to the total emissions for the winter campaign and 52 % for the summer campaign. No obvious industrial sources could be identified within the flux footprint for this study. Zheng et al. (2017) observed a decoupling between real-world emissions and the spatial proxies used to develop and downscale inventories as polluting industries are moved out of urban centres. The methods used to allocate emissions in the MEIC inventory appear to result in emissions being overestimated in the urban area of Beijing; spatial proxies such as population density and gross domestic product (GDP) are used to scale down national emissions statistics. This method tends to overestimate emissions in urban centres and underestimate emissions in rural areas, and so even if this comparison only considered the residential and transport sectors, NOx and CO emissions would still be overestimated by the inventory. Just considering these two sectors, NOx emissions are overestimated by a factor 1.6–5.1 (mean =3.3) for winter and 1.9–8.5 (mean =3.7) for summer. CO emissions are overestimated by 1.1–6.5 (mean =3.1) in winter and 2.7–12 (mean =5.2) in summer. The sensitivity of the inventory to location was tested by shifting the inventory grid 3 km in each direction (north, east, south and west), and it was found that this had little impact on the comparison with the inventory, still overestimating emissions for all directions.
The inventory did capture some of the general diurnal variation in emissions. Figure 11 shows the normalised diurnal variation for the transportation and residential sectors, calculated relative to one another assuming these sectors are the only emission sectors. The diurnal variation in measured emissions normalised by the daily average is overlaid. For NOx and CO emissions in the winter (Fig. 11a and b) the sum of the residential and transportation emissions captures the time of the morning rush hour peak at 07:00 and the evening enhancement in emissions in the mid-afternoon to evening due to a combination of increased residential and traffic activity. Residential emissions are predicted in the inventory to increase between 11:00 and 12:00, which was observed in the measurements, though to a greater extent than the inventory suggests.
Looking at the summer data for NOx (Fig. 11c), the increase in emissions after 05:00 when traffic density increased was well captured for NOx, though the measurements suggested a slightly quicker increase in emission than suggested by the inventory. The minimum daytime emission predicted by the inventory occurred at 12:00, where there was a dip in emissions from transportation, though this was not reflected in the measurements where there was an almost constant decrease in NOx emissions until the evening rush hour peak at 17:00. The evening rush hour peak for NOx in summer was much more distinct than the inventory suggests and NOx emissions decrease rapidly after 18:00, earlier than the inventory predicts. NOx emissions from residential sources in the inventory showed a small enhancement around midday which was not clearly observed in the measurements, suggesting traffic-related emissions dominate here.
For CO in summer (Fig. 11d), the increase in measured emissions after 05:00 matches the rate of increase predicted by the inventory very well. After 07:00 the inventory-predicted CO emissions would not increase further, which was not reflected in the measured emissions. Emissions from the residential sector are predicted to increase between 11:00 and 12:00, reflecting emissions from cooking activities. Within the flux footprint there were several restaurants, including barbecue restaurants where food was cooked over open coals. This is not likely to be included in the inventory but would explain the increase in measured CO emissions before lunchtime as food is prepared. As with NOx emissions, the evening rush hour peak in measured CO emissions was narrower and began to decrease earlier than suggested by the inventory.
The inventory suggests that total emissions are higher in winter than in summer; NOx emissions from the residential and transportation sectors are between 1.3 and 1.7 times larger, and for CO emissions from these two sectors are between 1.5 and 2.0 times larger. The inventory performs relatively well in capturing the measured seasonal difference for emissions of both species. The seasonal differences in NOx emissions are slightly overestimated (measured emissions were on average 1.2 times greater in winter compared to summer) and the inventory underestimates the seasonal difference in CO emissions (measured emissions were on average 2.3 times higher in winter than summer). For both NOx and CO the inventory suggests that seasonal variation is driven by increased residential sector emissions, which are predicted to be 5 times higher in winter than summer.
NOx, CO and aromatic VOC emissions have been quantified for the first time during two contrasting seasons for an area of central Beijing. The magnitudes of NOx emissions were found to be similar during the winter and summer periods, whilst the fluxes of CO showed a greater seasonal dependence with winter emissions being over 2 times greater than CO emissions measured during summer. The dominant source for NOx and CO emissions is traffic with influence from residential emissions. The diurnal variation in aromatic VOC fluxes also suggested traffic and residential sources, though evaporative effects due to higher summer temperatures meant emissions were greater in the summer than the winter. The NOx and CO fluxes presented in this work provide good evidence that proxy-based inventories can overestimate emissions for urban centres as suggested by Zheng et al. (2017). When developing inventories at an urban scale future work should look carefully at up-to-date proxies or at deriving emissions by bottom-up approaches in order to correctly predict the magnitude of emissions. When comparing the diurnal variation in inventory and measurement the inventory performed relatively well in capturing morning and evening rush hour peaks. The inventory also attributed traffic and residential emissions as the major source of NOx and CO emissions, which was supported by analysis in this work. This set of pollutant flux measurements can provide a useful basis for developing these high-resolution urban inventories which are at an appropriate scale to assess public health impacts of pollution.
Any flux data presented here may be accessed by contacting the authors. Concentration data are available via the Centre for Environmental Data Analysis (CEDA) depository available at https://catalogue.ceda.ac.uk/uuid/7ed9d8a288814b8b85433b0d3fec0300 (Fleming et al., 2017).
FAS made NOx and CO concentration measurements, calculated their flux and analysed the data presented. FAS prepared the manuscript with contributions from the co-authors. EN and BL measured wind data used in this study, set up tower instrumentation, provided extensive advice on flux calculations and provided detailed comments on the manuscript. OW assisted with interpretation of the inventory emissions data and gave ideas for analysis. WSD provided support calculating NOx and CO fluxes and reviewed the manuscript. WJFA and MS made VOC concentration measurements during the field campaigns and assisted with interpretation of the VOC fluxes. MH processed the raw emissions data into gridded format for comparison with the measured fluxes. SBG and SK provided boundary layer height data. ND and SM provided support on using eddy4R software for data processing and reviewed the manuscript. QZ and RW provided high-resolution emissions data. XW and YZ prepared the PTR-ToF-MS instrument and calibration system. PF maintained the tower and site necessary for this work. CNH, JFH and JL reviewed the manuscript.
The authors declare that they have no conflict of interest.
This article is part of the special issue “In-depth study of air pollution sources and processes within Beijing and its surrounding region (APHH-Beijing) (ACP/AMT inter-journal SI)”. It is not associated with a conference.
This work was supported by the UK Natural Environment Research Council and the Newton fund through the AIRPOLL project of the Air Pollution and Human Health in a Chinese Megacity (APHH-Beijing) programme. The authors would like to thank Rachel Dunmore and Neil Mullinger for their hard work during the field campaigns. Thanks also go to Shona Wilde and Stuart Grange for their assistance in creating plots for this work.
This work was supported by the UK Natural Environment Research Council and the Newton fund through the AIRPOLL project of the Air Pollution and Human Health in a Chinese Megacity (APHH-Beijing) programme (grant references NE/N006917/1, NE/N006992/1, NE/N006976/1 and NE/N00700X/1).
This paper was edited by Delphine Farmer and reviewed by two anonymous referees.
Acton, W. J. F., Huang, Z., Davison, B., Drysdale, W. S., Fu, P., Hollaway, M., Langford, B., Lee, J., Liu, Y., Metzger, S., Mullinger, N., Nemitz, E., Reeves, C. E., Squires, F. A., Vaughan, A. R., Wang, X., Wang, Z., Wild, O., Zhang, Q., Zhang, Y., and Hewitt, C. N.: Surface–atmosphere fluxes of volatile organic compounds in Beijing, Atmos. Chem. Phys. Discuss., https://doi.org/10.5194/acp-2020-343, in review, 2020. a
Andreae, M. O. and Schimel, D. S.: Exchange of trace gases between terrestrial ecosystems and the atmosphere, John Wiley and Sons Inc., New York, USA, https://doi.org/10.1007/BF00024600, 1990. a
Aubinet, M.: Eddy covariance CO2 flux measurements in nocturnal conditions: An analysis of the problem, Ecol. Appl., 18, 1368–1378, https://doi.org/10.1890/06-1336.1, 2008. a
Barletta, B., Meinardi, S., Rowland, F. S., Chan, C.-Y., Wang, X., Zou, S., Chan, L. Y., and Blake, D. R.: Volatile organic compounds in 43 Chinese cities, Atmos. Environ., 39, 5979–5990, https://doi.org/10.1016/j.atmosenv.2005.06.029, 2005. a, b
Biggart, M., Stocker, J., Doherty, R. M., Wild, O., Hollaway, M., Carruthers, D., Li, J., Zhang, Q., Wu, R., Kotthaus, S., Grimmond, S., Squires, F. A., Lee, J., and Shi, Z.: Street-scale air quality modelling for Beijing during a winter 2016 measurement campaign, Atmos. Chem. Phys., 20, 2755–2780, https://doi.org/10.5194/acp-20-2755-2020, 2020. a
Borbon, A., Gilman, J. B., Kuster, W. C., Grand, N., Chevaillier, S., Colomb, A., Dolgorouky, C., Gros, V., Lopez, M., Sarda-Esteve, R., Holloway, J., Stutz, J., Petetin, H., McKeen, S., Beekmann, M., Warneke, C., Parrish, D. D., and de Gouw, J. A.: Emission ratios of anthropogenic volatile organic compounds in northern mid-latitude megacities: Observations versus emission inventories in Los Angeles and Paris, J. Geophys. Res., 118, 2041–2057, https://doi.org/10.1002/jgrd.50059, 2013. a
Brock, F. V.: A Nonlinear Filter to Remove Impulse Noise from Meteorological Data, J. Atmos. Ocean. Tech., 3, 51–58, https://doi.org/10.1175/1520-0426(1986)003<0051:anftri>2.0.co;2, 1986. a
Caplain, I., Cazier, F., Nouali, H., Mercier, A., Déchaux, J.-C., Nollet, V., Joumard, R., André, J.-M., and Vidon, R.: Emissions of unregulated pollutants from European gasoline and diesel passenger cars, Atmos. Environ., 40, 5954–5966, https://doi.org/10.1016/j.atmosenv.2005.12.049, 2006. a
Chen, L. X., Dong, M., and Shao, Y. N.: The Characteristics Of Interannual Variations on the East Asian Monsoon, J. Meteorol. Soc. Jpn., 70, 397–421, https://doi.org/10.2151/jmsj1965.70.1B_397, 1992. a
Cheng, J., Su, J., Cui, T., Li, X., Dong, X., Sun, F., Yang, Y., Tong, D., Zheng, Y., Li, Y., Li, J., Zhang, Q., and He, K.: Dominant role of emission reduction in PM2.5 air quality improvement in Beijing during 2013–2017: a model-based decomposition analysis, Atmos. Chem. Phys., 19, 6125–6146, https://doi.org/10.5194/acp-19-6125-2019, 2019. a, b, c, d
Deardorff, J. W.: Convective velocity and temperature scales for the unstable planetary boundary layer and for Rayleigh convection, J. Atmos. Sci., 27, 1211–1213, https://doi.org/10.1175/1520-0469(1970)027<1211:CVATSF>2.0.CO;2, 1970. a
Duan, J., Huang, R.-J., Li, Y., Chen, Q., Zheng, Y., Chen, Y., Lin, C., Ni, H., Wang, M., Ovadnevaite, J., Ceburnis, D., Chen, C., Worsnop, D. R., Hoffmann, T., O'Dowd, C., and Cao, J.: Summertime and wintertime atmospheric processes of secondary aerosol in Beijing, Atmos. Chem. Phys., 20, 3793–3807, https://doi.org/10.5194/acp-20-3793-2020, 2020. a
European Commission (EC): Joint Research Centre (JRC)/Netherlands Environmental Assessment Agency (PBL), European Database For Global Atmospheric Research: Global Emissions EDGAR v4.2, https://doi.org/10.2904/EDGARv4.2, 2011 a
Famulari, D., Nemitz, E., Di Marco, C., Phillips, G. J., Thomas, R., House, E., and Fowler, D.: Eddy-covariance measurements of nitrous oxide fluxes above a city, Agr. Forest Meteorol., 150, 786–793, https://doi.org/10.1016/j.agrformet.2009.08.003, 2010. a
Finnigan, J.: The storage term in eddy flux calculations, Agr. Forest Meteorol., 136, 108–113, https://doi.org/10.1016/j.agrformet.2004.12.010, 2006. a
Fleming, Z. L., Lee, J. D., Liu, D., Acton, J., Huang, Z., Wang, X., Hewitt, N., Crilley, L., Kramer, L., Slater, E., Whalley, L., Ye, C., and Ingham, T.: APHH: Atmospheric measurements and model results for the Atmospheric Pollution & Human Health in a Chinese Megacity, Centre for Environmental Data Analysis, available at: https://catalogue.ceda.ac.uk/uuid/7ed9d8a288814b8b85433b0d3fec0300 (last access: 17 July 2020), 2017. a
Foken, T.: Micrometeorology, Springer, Berlin, Heidelberg, Germany, 2 edn., https://doi.org/10.1007/978-3-642-25440-6, 2017. a
Foken, T. and Wichura, B.: Tools for quality assessment of surface-based flux measurements, Agr. Forest Meteorol., 78, 83–105, https://doi.org/10.1016/0168-1923(95)02248-1, 1996. a
Foken, T., Göckede, M., Mauder, M., Mahrt, L., Amiro, B., and Munger, W.: Post-field data quality control in Handbook of Micrometeorology, in: A Guide for Surface Flux Measurement and Analysis, edited by: Lee, X., Massman, W., and Law, B., Kluwer Academic Publisher, Dordrecht, 181–208, https://doi.org/10.1007/1-4020-2265-4, 2004. a
Gerbig, C., Kley, D., VolzThomas, A., Kent, J., Dewey, K., and McKenna, D. S.: Fast response resonance fluorescence CO measurements aboard the C-130: Instrument characterization and measurements made during North Atlantic Regional Experiment 1993, J. Geophys. Res., 101, 29229–29238, https://doi.org/10.1029/95jd03272, 1996. a
Gerbig, C., Schmitgen, S., Kley, D., Volz-Thomas, A., Dewey, K., and Haaks, D.: An improved fast-response vacuum-UV resonance fluorescence CO instrument, J. Geophys. Res., 104, 1699–1704, https://doi.org/10.1029/1998jd100031, 1999. a
Guo, S., Hu, M., Zamora, M. L., Peng, J., Shang, D., Zheng, J., Du, Z., Wu, Z., Shao, M., Zeng, L., Molina, M. J., and Zhang, R.: Elucidating severe urban haze formation in China, P. Natl. Acad. Sci. USA, 111, 17373–17378, https://doi.org/10.1073/pnas.1419604111, 2014. a
Harrison, R. M., Dall'Osto, M., Beddows, D. C. S., Thorpe, A. J., Bloss, W. J., Allan, J. D., Coe, H., Dorsey, J. R., Gallagher, M., Martin, C., Whitehead, J., Williams, P. I., Jones, R. L., Langridge, J. M., Benton, A. K., Ball, S. M., Langford, B., Hewitt, C. N., Davison, B., Martin, D., Petersson, K. F., Henshaw, S. J., White, I. R., Shallcross, D. E., Barlow, J. F., Dunbar, T., Davies, F., Nemitz, E., Phillips, G. J., Helfter, C., Di Marco, C. F., and Smith, S.: Atmospheric chemistry and physics in the atmosphere of a developed megacity (London): an overview of the REPARTEE experiment and its conclusions, Atmos. Chem. Phys., 12, 3065–3114, https://doi.org/10.5194/acp-12-3065-2012, 2012. a
Hartmann, J., Gehrmann, M., Kohnert, K., Metzger, S., and Sachs, T.: New calibration procedures for airborne turbulence measurements and accuracy of the methane fluxes during the AirMeth campaigns, Atmos. Meas. Tech., 11, 4567–4581, https://doi.org/10.5194/amt-11-4567-2018, 2018. a
Heeb, N. V., Forss, A.-M., Bach, C., Reimann, S., Herzog, A., and Jäckle, H. W.: A comparison of benzene, toluene and C2-benzenes mixing ratios in automotive exhaust and in the suburban atmosphere during the introduction of catalytic converter technology to the Swiss Car Fleet, Atmos. Environ., 34, 3103–3116, https://doi.org/10.1016/S1352-2310(99)00446-X, 2000. a, b
Helfter, C., Tremper, A. H., Halios, C. H., Kotthaus, S., Bjorkegren, A., Grimmond, C. S. B., Barlow, J. F., and Nemitz, E.: Spatial and temporal variability of urban fluxes of methane, carbon monoxide and carbon dioxide above London, UK, Atmos. Chem. Phys., 16, 10543–10557, https://doi.org/10.5194/acp-16-10543-2016, 2016. a, b, c
International Energy Agency, Energy and Air Pollution: World Energy Outlook Special Report 2016, IEA, Paris, France, available at: https://www.iea.org/reports/energy-and-air-pollution (last access: 10 July 2020), 2016. a
Jia, Y. T., Rahn, K. A., He, K. B., Wen, T. X., and Wang, Y. S.: A novel technique for quantifying the regional component of urban aerosol solely from its sawtooth cycles, J. Geophys. Res., 113, D21309, https://doi.org/10.1029/2008jd010389, 2008. a
Jing, B., Wu, L., Mao, H., Gong, S., He, J., Zou, C., Song, G., Li, X., and Wu, Z.: Development of a vehicle emission inventory with high temporal–spatial resolution based on NRT traffic data and its impact on air pollution in Beijing – Part 1: Development and evaluation of vehicle emission inventory, Atmos. Chem. Phys., 16, 3161–3170, https://doi.org/10.5194/acp-16-3161-2016, 2016. a
Karl, T., Apel, E., Hodzic, A., Riemer, D. D., Blake, D. R., and Wiedinmyer, C.: Emissions of volatile organic compounds inferred from airborne flux measurements over a megacity, Atmos. Chem. Phys., 9, 271–285, https://doi.org/10.5194/acp-9-271-2009, 2009. a, b, c, d, e
Karl, T., Graus, M., Striednig, M., Lamprecht, C., Hammerle, A., Wohlfahrt, G., Held, A., von der Heyden, L., Deventer, M. J., Krismer, A., Haun, C., Feichter, R., and Lee, J.: Urban eddy covariance measurements reveal significant missing NOx emissions in Central Europe, Sci. Rep.-UK, 7, 2536, https://doi.org/10.1038/s41598-017-02699-9, 2017. a
Karl, T., Striednig, M., Graus, M., Hammerle, A., and Wohlfahrt, G.: Urban flux measurements reveal a large pool of oxygenated volatile organic compound emissions, P. Natl. Acad. Sci. USA, 115, 1186–1191, https://doi.org/10.1073/pnas.1714715115, 2018. a, b, c
Kljun, N., Calanca, P., Rotach, M. W., and Schmid, H. P.: A simple parameterisation for flux footprint predictions, Bound.-Lay. Meteorol., 112, 503–523, https://doi.org/10.1023/b:boun.0000030653.71031.96, 2004. a
Kotthaus, S. and Grimmond, C. S. B.: Atmospheric boundary-layer characteristics from ceilometer measurements. Part 1: A new method to track mixed layer height and classify clouds, Q. J. Roy. Meteorol. Soc., 144, 1525–1538, https://doi.org/10.1002/qj.3299, 2018. a
Krotkov, N. A., McLinden, C. A., Li, C., Lamsal, L. N., Celarier, E. A., Marchenko, S. V., Swartz, W. H., Bucsela, E. J., Joiner, J., Duncan, B. N., Boersma, K. F., Veefkind, J. P., Levelt, P. F., Fioletov, V. E., Dickerson, R. R., He, H., Lu, Z., and Streets, D. G.: Aura OMI observations of regional SO2 and NO2 pollution changes from 2005 to 2015, Atmos. Chem. Phys., 16, 4605–4629, https://doi.org/10.5194/acp-16-4605-2016, 2016. a
Langford, B., Davison, B., Nemitz, E., and Hewitt, C. N.: Mixing ratios and eddy covariance flux measurements of volatile organic compounds from an urban canopy (Manchester, UK), Atmos. Chem. Phys., 9, 1971–1987, https://doi.org/10.5194/acp-9-1971-2009, 2009. a, b, c, d, e
Langford, B., Nemitz, E., House, E., Phillips, G. J., Famulari, D., Davison, B., Hopkins, J. R., Lewis, A. C., and Hewitt, C. N.: Fluxes and concentrations of volatile organic compounds above central London, UK, Atmos. Chem. Phys., 10, 627–645, https://doi.org/10.5194/acp-10-627-2010, 2010. a, b, c
Langford, B., Acton, W., Ammann, C., Valach, A., and Nemitz, E.: Eddy-covariance data with low signal-to-noise ratio: time-lag determination, uncertainties and limit of detection, Atmos. Meas. Tech., 8, 4197–4213, https://doi.org/10.5194/amt-8-4197-2015, 2015. a
Langford, B.: Submicron aerosol fluxes above three contrasting megacities, in preparation, 2020. a, b
Lee, J. D., Moller, S. J., Read, K. A., Lewis, A. C., Mendes, L., and Carpenter, L. J.: Year-round measurements of nitrogen oxides and ozone in the tropical North Atlantic marine boundary layer, J. Geophys. Res., 114, D21302, https://doi.org/10.1029/2009jd011878, 2009. a
Lee, J. D., Helfter, C., Purvis, R. M., Beevers, S. D., Carslaw, D. C., Lewis, A. C., Moller, S. J., Tremper, A., Vaughan, A., and Nemitz, E. G.: Measurement of NOx Fluxes from a Tall Tower in Central London, UK and Comparison with Emissions Inventories, Environ. Sci. Technol., 49, 1025–1034, https://doi.org/10.1021/es5049072, 2015. a, b, c
Lee, X., Massman, W., and Law, B.: Handbook of Micrometeorology: A Guide for Surface Flux Measurement and Analysis, Atmospheric and Oceanographic Sciences Library, Springer Netherlands, Dordrecht, the Netherlands, https://doi.org/10.1007/1-4020-2265-4, 2004. a
Li, H., Zhang, Q., Zhang, Q., Chen, C., Wang, L., Wei, Z., Zhou, S., Parworth, C., Zheng, B., Canonaco, F., Prévôt, A. S. H., Chen, P., Zhang, H., Wallington, T. J., and He, K.: Wintertime aerosol chemistry and haze evolution in an extremely polluted city of the North China Plain: significant contribution from coal and biomass combustion, Atmos. Chem. Phys., 17, 4751–4768, https://doi.org/10.5194/acp-17-4751-2017, 2017. a
Liu, C., Yin, P., Chen, R., Meng, X., Wang, L., Niu, Y., Lin, Z., Liu, Y., Liu, J., and Qi, J.: Ambient carbon monoxide and cardiovascular mortality: a nationwide time-series analysis in 272 cities in China, Lancet Planet. Health, 2, e12–e18, https://doi.org/10.1016/S2542-5196(17)30181-X, 2018. a
Liu, F., Zhang, Q., Ronald, J. V., Zheng, B., Tong, D., Yan, L., Zheng, Y. X., and He, K. B.: Recent reduction in NOx emissions over China: synthesis of satellite observations and emission inventories, Environ. Res. Lett., 11, 114002, https://doi.org/10.1088/1748-9326/11/11/114002, 2016. a, b
Liu, H. Z., Feng, J. W., Järvi, L., and Vesala, T.: Four-year (2006–2009) eddy covariance measurements of CO2 flux over an urban area in Beijing, Atmos. Chem. Phys., 12, 7881–7892, https://doi.org/10.5194/acp-12-7881-2012, 2012. a, b
Mann, J. and Lenschow, D. H.: Errors in airborne flux measurements, J. Geophys. Res., 99, 14519–14526, https://doi.org/10.1029/94jd00737, 1994. a
Marr, L. C., Moore, T. O., Klapmeyer, M. E., and Killar, M. B.: Comparison of NOx Fluxes Measured by Eddy Covariance to Emission Inventories and Land Use, Environ. Sci. Technol., 47, 1800–1808, https://doi.org/10.1021/es303150y, 2013. a
McDonald, B. C., de Gouw, J. A., Gilman, J. B., Jathar, S. H., Akherati, A., Cappa, C. D., Jimenez, J. L., Lee-Taylor, J., Hayes, P. L., McKeen, S. A., Cui, Y. Y., Kim, S., Gentner, D. R., Isaacman-VanWertz, G., Goldstein, A. H., Harley, R. A., Frost, G. J., Roberts, J. M., Ryerson, T. B., and Trainer, M.: Volatile chemical products emerging as largest petrochemical source of urban organic emissions, Science, 359, 760–764, https://doi.org/10.1126/science.aaq0524, 2018. a
Metzger, S., Junkermann, W., Mauder, M., Beyrich, F., Butterbach-Bahl, K., Schmid, H. P., and Foken, T.: Eddy-covariance flux measurements with a weight-shift microlight aircraft, Atmos. Meas. Tech., 5, 1699–1717, https://doi.org/10.5194/amt-5-1699-2012, 2012. a
Metzger, S., Durden, D., Sturtevant, C., Luo, H., Pingintha-Durden, N., Sachs, T., Serafimovich, A., Hartmann, J., Li, J., Xu, K., and Desai, A. R.: eddy4R 0.2.0: a DevOps model for community-extensible processing and analysis of eddy-covariance data based on R, Git, Docker, and HDF5, Geosci. Model Dev., 10, 3189–3206, https://doi.org/10.5194/gmd-10-3189-2017, 2017. a
Ministry of Ecology and Environment, the People's Republic of China: 2017 Report on the State of the Ecology and Environment in China, available at: http://english.mee.gov.cn/Resources/Reports/soe/SOEE2017/201808/P020180801597738742758.pdf (last access: 10 July 2020), 2018. a, b
Miyazaki, K., Eskes, H., Sudo, K., Boersma, K. F., Bowman, K., and Kanaya, Y.: Decadal changes in global surface NOx emissions from multi-constituent satellite data assimilation, Atmos. Chem. Phys., 17, 807–837, https://doi.org/10.5194/acp-17-807-2017, 2017. a
Moravek, A., Singh, S., Pattey, E., Pelletier, L., and Murphy, J. G.: Measurements and quality control of ammonia eddy covariance fluxes: a new strategy for high-frequency attenuation correction, Atmos. Meas. Tech., 12, 6059–6078, https://doi.org/10.5194/amt-12-6059-2019, 2019. a
Nemitz, E., Mammarella, I., Ibrom, A., Aurela, M., Burba, G. G., Dengel, S., Gielen, B., Grelle, A., Heinesch B., Herbst, M., Hörtnagl, L., Klemedtsson, L., Lindroth, A., Lohila, A., McDermitt, D. K., Meier, P., Merbold, L., Nelson, D., Nicolini, G., Nilsson, M. B., Peltola, O., Rinne, J., and Zahniser, M.: Standardisation of eddy-covariance flux measurements of methane and nitrous oxide, Int. Agrophys., 32, 517–549, https://doi.org/10.1515/intag-2017-0042, 2018. a
Nordbo, A. and Katul, G.: A wavelet-based correction method for eddy-covariance high-frequency losses in scalar concentration measurements, Bound.-Lay. Meteorol., 146, 81–102, https://doi.org/10.1007/s10546-012-9759-9, 2013. a
Park, C., Schade, G. W., and Boedeker, I.: Flux measurements of volatile organic compounds by the relaxed eddy accumulation method combined with a GC-FID system in urban Houston, Texas, Atmos. Environ., 44, 2605–2614, https://doi.org/10.1016/j.atmosenv.2010.04.016, 2010. a, b
Parrish, D. D., Kuster, W. C., Shao, M., Yokouchi, Y., Kondo, Y., Goldan, P. D., de Gouw, J. A., Koike, M., and Shirai, T.: Comparison of air pollutant emissions among mega-cities, Atmos. Environ., 43, 6435–6441, https://doi.org/10.1016/j.atmosenv.2009.06.024, 2009. a
Pattey, E., Desjardins, R. L., Boudreau, F., and Rochette, P.: Impact of density fluctuations on flux measurements of trace gases: Implications for the relaxed eddy accumulation technique, Bound.-Lay. Meteorol., 59, 195–203, https://doi.org/10.1007/BF00120695, 1992. a
Qi, J., Zheng, B., Li, M., Yu, F., Chen, C., Liu, F., Zhou, X., Yuan, J., Zhang, Q., and He, K.: A high-resolution air pollutants emission inventory in 2013 for the Beijing-Tianjin-Hebei region, China, Atmos. Environ., 170, 156–168, https://doi.org/10.1016/j.atmosenv.2017.09.039, 2017. a
Rantala, P., Järvi, L., Taipale, R., Laurila, T. K., Patokoski, J., Kajos, M. K., Kurppa, M., Haapanala, S., Siivola, E., Petäjä, T., Ruuskanen, T. M., and Rinne, J.: Anthropogenic and biogenic influence on VOC fluxes at an urban background site in Helsinki, Finland, Atmos. Chem. Phys., 16, 7981–8007, https://doi.org/10.5194/acp-16-7981-2016, 2016. a, b, c
Saikawa, E., Kim, H., Zhong, M., Avramov, A., Zhao, Y., Janssens-Maenhout, G., Kurokawa, J.-I., Klimont, Z., Wagner, F., Naik, V., Horowitz, L. W., and Zhang, Q.: Comparison of emissions inventories of anthropogenic air pollutants and greenhouse gases in China, Atmos. Chem. Phys., 17, 6393–6421, https://doi.org/10.5194/acp-17-6393-2017, 2017. a
Shi, Z., Vu, T., Kotthaus, S., Harrison, R. M., Grimmond, S., Yue, S., Zhu, T., Lee, J., Han, Y., Demuzere, M., Dunmore, R. E., Ren, L., Liu, D., Wang, Y., Wild, O., Allan, J., Acton, W. J., Barlow, J., Barratt, B., Beddows, D., Bloss, W. J., Calzolai, G., Carruthers, D., Carslaw, D. C., Chan, Q., Chatzidiakou, L., Chen, Y., Crilley, L., Coe, H., Dai, T., Doherty, R., Duan, F., Fu, P., Ge, B., Ge, M., Guan, D., Hamilton, J. F., He, K., Heal, M., Heard, D., Hewitt, C. N., Hollaway, M., Hu, M., Ji, D., Jiang, X., Jones, R., Kalberer, M., Kelly, F. J., Kramer, L., Langford, B., Lin, C., Lewis, A. C., Li, J., Li, W., Liu, H., Liu, J., Loh, M., Lu, K., Lucarelli, F., Mann, G., McFiggans, G., Miller, M. R., Mills, G., Monk, P., Nemitz, E., O'Connor, F., Ouyang, B., Palmer, P. I., Percival, C., Popoola, O., Reeves, C., Rickard, A. R., Shao, L., Shi, G., Spracklen, D., Stevenson, D., Sun, Y., Sun, Z., Tao, S., Tong, S., Wang, Q., Wang, W., Wang, X., Wang, X., Wang, Z., Wei, L., Whalley, L., Wu, X., Wu, Z., Xie, P., Yang, F., Zhang, Q., Zhang, Y., Zhang, Y., and Zheng, M.: Introduction to the special issue “In-depth study of air pollution sources and processes within Beijing and its surrounding region (APHH-Beijing)”, Atmos. Chem. Phys., 19, 7519–7546, https://doi.org/10.5194/acp-19-7519-2019, 2019. a
Starkenburg, D., Metzger, S., Fochesatto, G. J., Alfieri, J. G., Gens, R., Prakash, A., and Cristobal, J.: Assessment of Despiking Methods for Turbulence Data in Micrometeorology, J. Atmos. Ocean. Tech., 33, 2001–2013, https://doi.org/10.1175/jtech-d-15-0154.1, 2016. a
Strand, V., Svartengren, M., Rak, S., Barck, C., and Bylin, G.: Repeated exposure to an ambient level of NO2 enhances asthmatic response to a nonsymptomatic allergen dose, Eur. Respir. J., 12, 6–12, https://doi.org/10.1183/09031936.98.12010006, 1998. a
Tunnicliffe, W. S., Burge, P. S., and Ayres, J. G.: Effect of domestic concentrations of nitrogen dioxide on airway responses to inhaled allergen in asthmatic patients, Lancet, 344, 1733–1736, https://doi.org/10.1016/s0140-6736(94)92886-x, 1994. a
United Nations Department of Economic and Social Affairs, Population Division: The World's Cities in 2016 – Data Booklet, UN, New York, https://doi.org/10.18356/8519891f-en, 2016. a
Valach, A. C., Langford, B., Nemitz, E., MacKenzie, A. R., and Hewitt, C. N.: Seasonal and diurnal trends in concentrations and fluxes of volatile organic compounds in central London, Atmos. Chem. Phys., 15, 7777–7796, https://doi.org/10.5194/acp-15-7777-2015, 2015. a, b, c
Vaughan, A. R., Lee, J. D., Misztal, P. K., Metzger, S., Shaw, M. D., Lewis, A. C., Purvis, R. M., Carslaw, D. C., Goldstein, A. H., Hewitt, C. N., Davison, B., Beevers, S. D., and Karl, T. G.: Spatially resolved flux measurements of NOx from London suggest significantly higher emissions than predicted by inventories, Faraday Discuss., 189, 455–472, https://doi.org/10.1039/c5fd00170f, 2016. a, b
Vaughan, A. R., Lee, J. D., Shaw, M. D., Misztal, P. K., Metzger, S., Vieno, M., Davison, B., Karl, T. G., Carpenter, L. J., Lewis, A. C., Purvis, R. M., Goldstein, A. H., and Hewitt, C. N.: VOC emission rates over London and South East England obtained by airborne eddy covariance, Faraday Discuss., 200, 599–620, https://doi.org/10.1039/c7fd00002b, 2017. a, b, c
Velasco, E., Lamb, B., Pressley, S., Allwine, E., Westberg, H., Jobson, B., Alexander, M., Prazeller, P., Molina, L., and Molina, M.: Flux measurements of volatile organic compounds from an urban landscape, Geophys. Res. Lett., 32, L20802, https://doi.org/10.1029/2005GL023356, 2005. a, b
Velasco, E., Pressley, S., Grivicke, R., Allwine, E., Coons, T., Foster, W., Jobson, B. T., Westberg, H., Ramos, R., Hernández, F., Molina, L. T., and Lamb, B.: Eddy covariance flux measurements of pollutant gases in urban Mexico City, Atmos. Chem. Phys., 9, 7325–7342, https://doi.org/10.5194/acp-9-7325-2009, 2009. a, b, c
von Schneidemesser, E., Monks, P. S., and Plass-Duelmer, C.: Global comparison of VOC and CO observations in urban areas, Atmos. Environ., 44, 5053–5064, https://doi.org/10.1016/j.atmosenv.2010.09.010, 2010. a
Wang, P., Elansky, N., Timofeev, Y. M., Wang, G., Golitsyn, G., Makarova, M., Rakitin, V., Shtabkin, Y., Skorokhod, A., Grechko, E., et al.: Long-Term Trends of Carbon Monoxide Total Columnar Amount in Urban Areas and Background Regions: Ground-and Satellite-based Spectroscopic Measurements, Adv. Atmos. Sci., 35, 785–795, https://doi.org/10.1007/s00376-017-6327-8, 2018. a
Wang, S. X., Zhao, M., Xing, J., Wu, Y., Zhou, Y., Lei, Y., He, K. B., Fu, L. X., and Hao, J. M.: Quantifying the Air Pollutants Emission Reduction during the 2008 Olympic Games in Beijing, Environ. Sci. Technol., 44, 2490–2496, https://doi.org/10.1021/es9028167, 2010. a
Webb, E. K., Pearman, G. I., and Leuning, R.: Correction of flux measurements for density effects due to heat and water vapour transfer, Q. J. Roy. Meteor. Soc., 106, 85–100, https://doi.org/10.1002/qj.49710644707, 1980. a
Yang, Z.,Wang, H., Shao, Z., and Muncrief, R.: Review of Beijing’s Comprehensive Motor Vehicle Emission Control Programs, International Council on Clean Transportation, available at: https://theicct.org/publications/review-beijings-comprehensive-motor-vehicle-emission-control-programs (last access: 10 July 2020), 2015. a, b, c
Zhao, Y., Zhou, Y. D., Qiu, L. P., and Zhang, J.: Quantifying the uncertainties of China's emission inventory for industrial sources: From national to provincial and city scales, Atmos. Environ., 165, 207–221, https://doi.org/10.1016/j.atmosenv.2017.06.045, 2017. a
Zheng, B., Zhang, Q., Tong, D., Chen, C., Hong, C., Li, M., Geng, G., Lei, Y., Huo, H., and He, K.: Resolution dependence of uncertainties in gridded emission inventories: a case study in Hebei, China, Atmos. Chem. Phys., 17, 921–933, https://doi.org/10.5194/acp-17-921-2017, 2017. a, b, c
Zheng, B., Chevallier, F., Ciais, P., Yin, Y., Deeter, M. N., Worden, H. M., Wang, Y., Zhang, Q., and He, K.: Rapid decline in carbon monoxide emissions and export from East Asia between years 2005 and 2016, Environ. Res. Lett., 13, 044007, https://doi.org/10.1088/1748-9326/aab2b3, 2018. a
The requested paper has a corresponding corrigendum published. Please read the corrigendum first before downloading the article.
- Article
(6523 KB) - Full-text XML


