the Creative Commons Attribution 4.0 License.
the Creative Commons Attribution 4.0 License.
 | 29 Jun 2020
Cloud regimes over the Amazon Basin: perspectives from the GoAmazon2014/5 campaign
David B. Mechem
Radiosonde observations collected during the GoAmazon2014/5 campaign are analyzed to identify the primary thermodynamic regimes accompanying different modes of convection over the Amazon. This analysis identifies five thermodynamic regimes that are consistent with traditional Amazon calendar definitions of seasonal shifts, which include one wet, one transitional, and three dry season regimes based on a k-means cluster analysis. A multisensor ground-based approach is used to project associated bulk cloud and precipitation properties onto these regimes. This is done to assess the propensity for each regime to be associated with different characteristic cloud frequency, cloud types, and precipitation properties. Additional emphasis is given to those regimes that promote deep convective precipitation and organized convective systems. Overall, we find reduced cloud cover and precipitation rates to be associated with the three dry regimes and those with the highest convective inhibition. While approximately 15 % of the dataset is designated as organized convection, these events are predominantly contained within the transitional regime.
- Article
(7700 KB) - Full-text XML
-
Supplement
(984 KB) - BibTeX
- EndNote


This paper has been authored by employees of Brookhaven Science Associates, LLC, under contract DE-SC0012704 with the U.S. DOE. The publisher by accepting the paper for publication acknowledges that the United States Government retains a nonexclusive, paid-up, irrevocable, worldwide license to publish or reproduce the published form of this paper, or allow others to do so, for United States Government purposes.
A primary source of uncertainty in global climate or Earth system model (GCM; ESM) predictions of possible climate change is the representation of cloud processes and associated cloud feedbacks that regulate Earth's energy and water cycles (e.g., Klein and Del Genio, 2006; Del Genio, 2012). One explanation for continuing deficiencies in climate model cloud-process representations points to uncertainties in how deep convection is parameterized. Unfortunately, the assumptions underpinning the parameterizations are often poorly constrained by observations. Formulating well-behaved convective parameterizations necessitates routine cloud observations, married to their associated meso- and synoptic-scale controls and collected over the variety of global convective regimes. Untangling these cloud–climate controls in ways suitable for ongoing model development demands long-term, multi-scale, multi-sensor observations that often require challenging instrument deployments to capture cloud and precipitation properties in remote and under-sampled global regimes (e.g., Louf et al., 2019).
As home to the largest tropical rainforest on the planet, the Amazon Basin experiences prolific and diverse cloud conditions that vary according to pronounced changes in seasonal regimes. However, these clouds, regimes, and their associated convective intensity are interconnected, with cloud properties (coverage, depth, precipitation) strongly influenced by (and influencing, via feedbacks) seasonal shifts in the thermodynamic forcing, as well as larger-scale atmospheric Hadley and Walker circulation variability (e.g., Fu et al., 1999; Machado et al., 2004; Misra, 2008). Recently, the ongoing struggle of GCMs and weather prediction models to represent aerosols, clouds, and their interactions over this expansive tropical area motivated the 2-year U.S. Department of Energy's (DOE) Atmospheric Radiation Measurement's (ARM) Observations and Modeling of the Green Ocean Amazon (GoAmazon2014/5) campaign (e.g., Martin et al., 2016, 2017). As part of this effort, ARM deployed its mobile facility (AMF; e.g., Miller et al., 2014) downstream of Manaus, Brazil, in the central Amazon. The facility enabled the capture of the thermodynamic state, aerosol, cloud, and precipitation properties in this location through the deployment of multiple surface state and atmospheric profiling facilities (e.g., Mather and Voyles, 2013).
We classify the primary thermodynamic regimes that are associated with the cloud observations over Manaus using a k-means cluster analysis applied to the morning radiosonde launches collected during the GoAmazon2014/5 campaign. This is done to isolate the potential controls of large-scale conditions on convective regimes. Conceptually, this technique follows previous tropical clustering efforts such as by Pope et al. (2009a, b), who examined the variability found in Northern Australian monsoonal seasons. Their motivations were to promote objective methods to identify key monsoonal changes and establish cloud–precipitation regimes to evaluate the representation of these processes in global models (e.g., May and Ballinger, 2007). A similar opportunity is expected for Amazon studies, hinted at by several recent efforts (Marengo et al., 2017; Wright et al., 2017; Sena et al., 2018) that illustrate the complex cloud processes and the possible changing nature of yearly transitions from dry and rainy seasons in the Amazon. The clustering approach may also yield an improved understanding of the relationship between the intraseasonal variability and the different Amazon convective regimes (Betts et al., 2002; Ghate and Kollias, 2016), as well as new insights into shallow to deep cloud transitions and model treatments therein (e.g., Khairoutdinov and Randall, 2006; Wu et al., 2009; Hohenegger and Stevens, 2013; Zhuang et al., 2017, 2018; Mechem and Giangrande, 2018; Chakraborty et al., 2018, 2020). Moreover, there is a continuing need to identify particular seasonal, environmental, and aerosol controls on Amazon convection and its intensity (Greco et al., 1990; Williams et al., 2002; Alcântara et al., 2011; Fan et al., 2018; Wu and Lee, 2019; Rehbein et al., 2019).
The proposed regimes are projected onto the large-scale synoptic patterns, forcing datasets, and remote-sensing cloud and precipitation observations for the GoAmazon2014/5 campaign. Although there are limitations when drawing conclusions from any 2-year campaign dataset, these efforts are used to assess possible controls and convective cloud predictors as related to (i) the interpretation and consistency of these radiosonde clusters with previous wet/dry seasonal definitions for the Amazon, (ii) bulk regime relationships to particular cloud presence/absence, (iii) the precipitation properties for these regimes to include diurnal cycles, and (iv) the propensity for regimes to promote extremes in precipitation such as null-event days or mesoscale convective systems (MCSs; Houze, 2004; Wang et al., 2019, 2020). The GoAmazon2014/5 datasets are briefly described in Sect. 2. The clustering algorithm, displays of the regimes according to thermodynamic variability, and additional methodology sensitivity testing are described in Sects. 2 and 3. Section 3 also explores the relationships between these regimes and overarching synoptic patterns, as well as area-averaged and observationally constrained vertical profiles (e.g., horizontal moisture convergence) often used to force single-column models (SCMs). Summaries of cloud properties associated with these regimes are found in Sect. 4. This includes a discussion on the propensity for the regimes to promote precipitation and the likelihood of MCS events being initiated near the campaign facilities. Finally, key findings for this study are summarized in Sect. 5.
Datasets for this study were collected by the U.S. DOE ARM facility during its Observations and Modeling of the Green Ocean Amazon 2014–2015 campaign near Manaus, Brazil, from January 2014 through December 2015 (herein, GoAmazon2014/5 or MAO; Martin et al., 2016, 2017; Giangrande et al., 2017). The primary datasets were from the routine ARM radiosonde launches during the campaign at the main AMF field site downwind of the city of Manaus, Brazil, and near Manacapuru, Brazil. These radiosondes provide the thermodynamic quantities of interest and act as the basis for regime clustering methods (Sect. 2.2).
2.1 ARM GoAmazon2014/5 products and datasets
Details of ARM radiosondes and their preprocessing and convective parameter estimates follow previous ARM studies (e.g., Jensen et al., 2015). The quantities of interest for this study include estimates of the convective available potential energy (CAPE); the convective inhibition (CIN); the relative humidity (RH) at low (surface to 3 km), middle (3 to 6 km), and high levels (above 6 km) of the atmosphere; the 0–5 km wind shear; the level of free convection (LFC); the lifting condensation level (LCL); and the 0–3 km environmental lapse rate (ELR). Our CAPE calculations follow a traditional parcel theory approach (condensation/evaporation of water vapor only, assuming irreversible parcel ascent in a virtual potential temperature framework; e.g., Bryan and Fritsch, 2002). The originating parcels for CAPE and CIN estimates are defined by the level of the maximum virtual temperature in the lowest kilometer (below 700 hPa). Thus, the standard calculations for CAPE and CIN represent the most buoyant parcel in the boundary layer such that the reported values are comparable to the most unstable CAPE and CIN (herein, MUCAPE and MUCIN). Mixed-layer CAPE and CIN estimates (mean parcel properties over the lowest 500 m, which we take to be representative of the mixed layer) were also computed for comparison.
Cloud properties were collected by collocated instruments at the MAO site, with additional information provided by observationally constrained reanalysis datasets. For precipitation properties, surveillance S-band (3 GHz) radar observations were available to within 70 km of the MAO site as collected by the System for the Protection of Amazonia (SIPAM) radar located on the southern end of Manaus (e.g., Ponta Pelada airport; Martin et al., 2016). These radar data were calibrated against satellite measurements and subsequently gridded to a 2 km × 2 km horizontal grid at 2 km a.g.l. (e.g., Schumacher and Funk, 2018).
Cluster routines incorporate only the morning (12:00 UTC, 08:00 local time) radiosondes that are launched in clear conditions. Clear conditions are defined as those having no rainfall at the MAO site according to rain gauge measurements to within an hour of launch time. Confirmation of precipitation-free conditions was also performed using SIPAM observations and manual checks for contaminated radiosondes. A more restrictive precipitation constraint (i.e., no rainfall at the gauge site between 09:00 and 12:00 UTC) did not result in an appreciable change in the results that follow. A motivation for using the morning radiosonde was to capture pre-convective cloud conditions prior to the daily transition from clear skies to shallow cumulus to deep convection, given previous studies on the diurnal precipitation cycle for Manaus which peaks after local noon (e.g., Adams et al., 2013; Tanaka et al., 2014; Giangrande et al., 2017). Additional concerns are that earlier (06:00 UTC) or later (18:00 UTC) radiosonde launches are not representative of the pre-convective environment and are more susceptible to existing clouds, overnight fog (e.g., Anber et al., 2015), precipitation, and/or cold pool contamination. In total, 607 daily radiosondes from the campaign (out of 696 radiosondes at 12:00 UTC in total) met these criteria, with 27 d removed due to missing radiosondes. Of the days flagged as contaminated or missing at 12:00 UTC, approximately 30–40 d were associated with radar-designated MCSs passing over MAO (Sect. 4).
Time–height (column) cloud properties are provided by a hybrid cloud radar–radar wind profiler (RWP) product developed during GoAmazon2014/5 (Giangrande et al., 2017; Feng and Giangrande, 2018). The product combines the ARM multi-sensor (e.g., cloud radar, lidar, ceilometer, radiometer) Active Remote Sensing of CLouds (ARSCL; Clothiaux et al., 2000) cloud-boundary designations with collocated 1290 MHz ultrahigh frequency (UHF) RWP measurements (e.g., Giangrande, 2018; Wang et al., 2018), and gauge observations. The RWP improves the ARSCL cloud-boundary estimates of cloud echo top by sampling deeper precipitating clouds that otherwise attenuate or extinguish the cloud radar beam. A simple cloud-type classification is performed following McFarlane et al. (2013) and Burleyson et al. (2015). Observed clouds are classified into seven categories according to the height of the cloud and cloud thickness (Table S1 in the Supplement). These seven cloud categories are shallow, congestus, deep convection, altocumulus, altostratus, cirrostratus/anvil, and cirrus.
Large-scale synoptic perspectives on the regimes are obtained using reanalysis fields from ERA5 (Hersbach and Dee, 2016) and the ARM variational analysis product (VARANAL). VARANAL is derived from the European Centre for Medium-Range Weather Forecasts (ECMWF) analysis fields and ARM observations during GoAmazon2014/15 using the constrained variational analysis method of Zhang and Lin (1997). The product is available at 3 h intervals on a regular vertical grid of 25 hPa over a domain of ∼110 km radius around the MAO site (Xie et al., 2014; Tang et al., 2001). The product is also constrained by the domain mean precipitation as observed by the SIPAM radar. Additional details on these products during GoAmazon2014/5 are found in Tang et al. (2016).
2.2 The k-means clustering methods
Regime classification is accomplished by applying an open-source, Scikit-learn, k-means algorithm to input radiosonde observations (toolkit from Pedregosa et al., 2011). The choice of k-means solutions over other configurations is done for simplicity and is consistent with previous radiosonde applications. While the sensitivity of proposed regime designations to different clustering approaches is not the subject of this study, applying alternate configurations did not alter relative clusters or composite interpretations.
One property of k-means clustering is that the number of clusters needs to be prescribed. One expectation from the Amazon convective literature (e.g., Williams et al., 2002) is that three to four regimes account for the bulk seasonal thermodynamic variability: (i) a wet season regime typically defined as December through April, (ii) a dry season regime from June through September, and (iii) one or two transitional regimes associated with the months leading into the wet and dry regimes. However, calendar definitions of the regimes vary in the literature (e.g., Zhuang et al., 2017), which may cause additional confusion when interpreting the findings across studies. From sensitivity testing (see Sect. 2.3), we establish the number of clusters at five. Radiosonde temperature, dew point temperature, and zonal/meridional wind information are the input at 20 equally spaced levels from 1000 to 200 hPa, similar to previous applications over Northern Australia (Pope et al., 2009a, b). This input resolution is coarser than the resolution of both the ARM radiosondes (∼2 hPa) and that of the 25 hPa VARANAL resolution. Additional tests (not shown) indicate that, for this particular case, the k-means solutions are insensitive to improvements in the input radiosonde resolution (to the 2 hPa level) or the input ordering of the data. Although the results for this study present cluster solutions that do not use standardized inputs (e.g., scaling all inputs to have a similar range and standard deviation), it is common practice in recent studies to scale inputs. Subsequent sections will comment on potential changes in cluster results when scaled inputs are substituted.
Figure 1 shows the cluster classification according to calendar-based Amazon definitions for the wet, dry, and transitional seasons. The dry season months (Fig. 1c) are predominantly associated with regimes 1–3, while the traditional Amazon wet season months (Fig. 1b) are associated with regimes 4 and 5 with negligible contributions from the remaining regimes. The ambiguous transitional season (here reflecting the months of May, October, and November) indicates contributions from all regimes though skewed towards regimes 4 and 5.
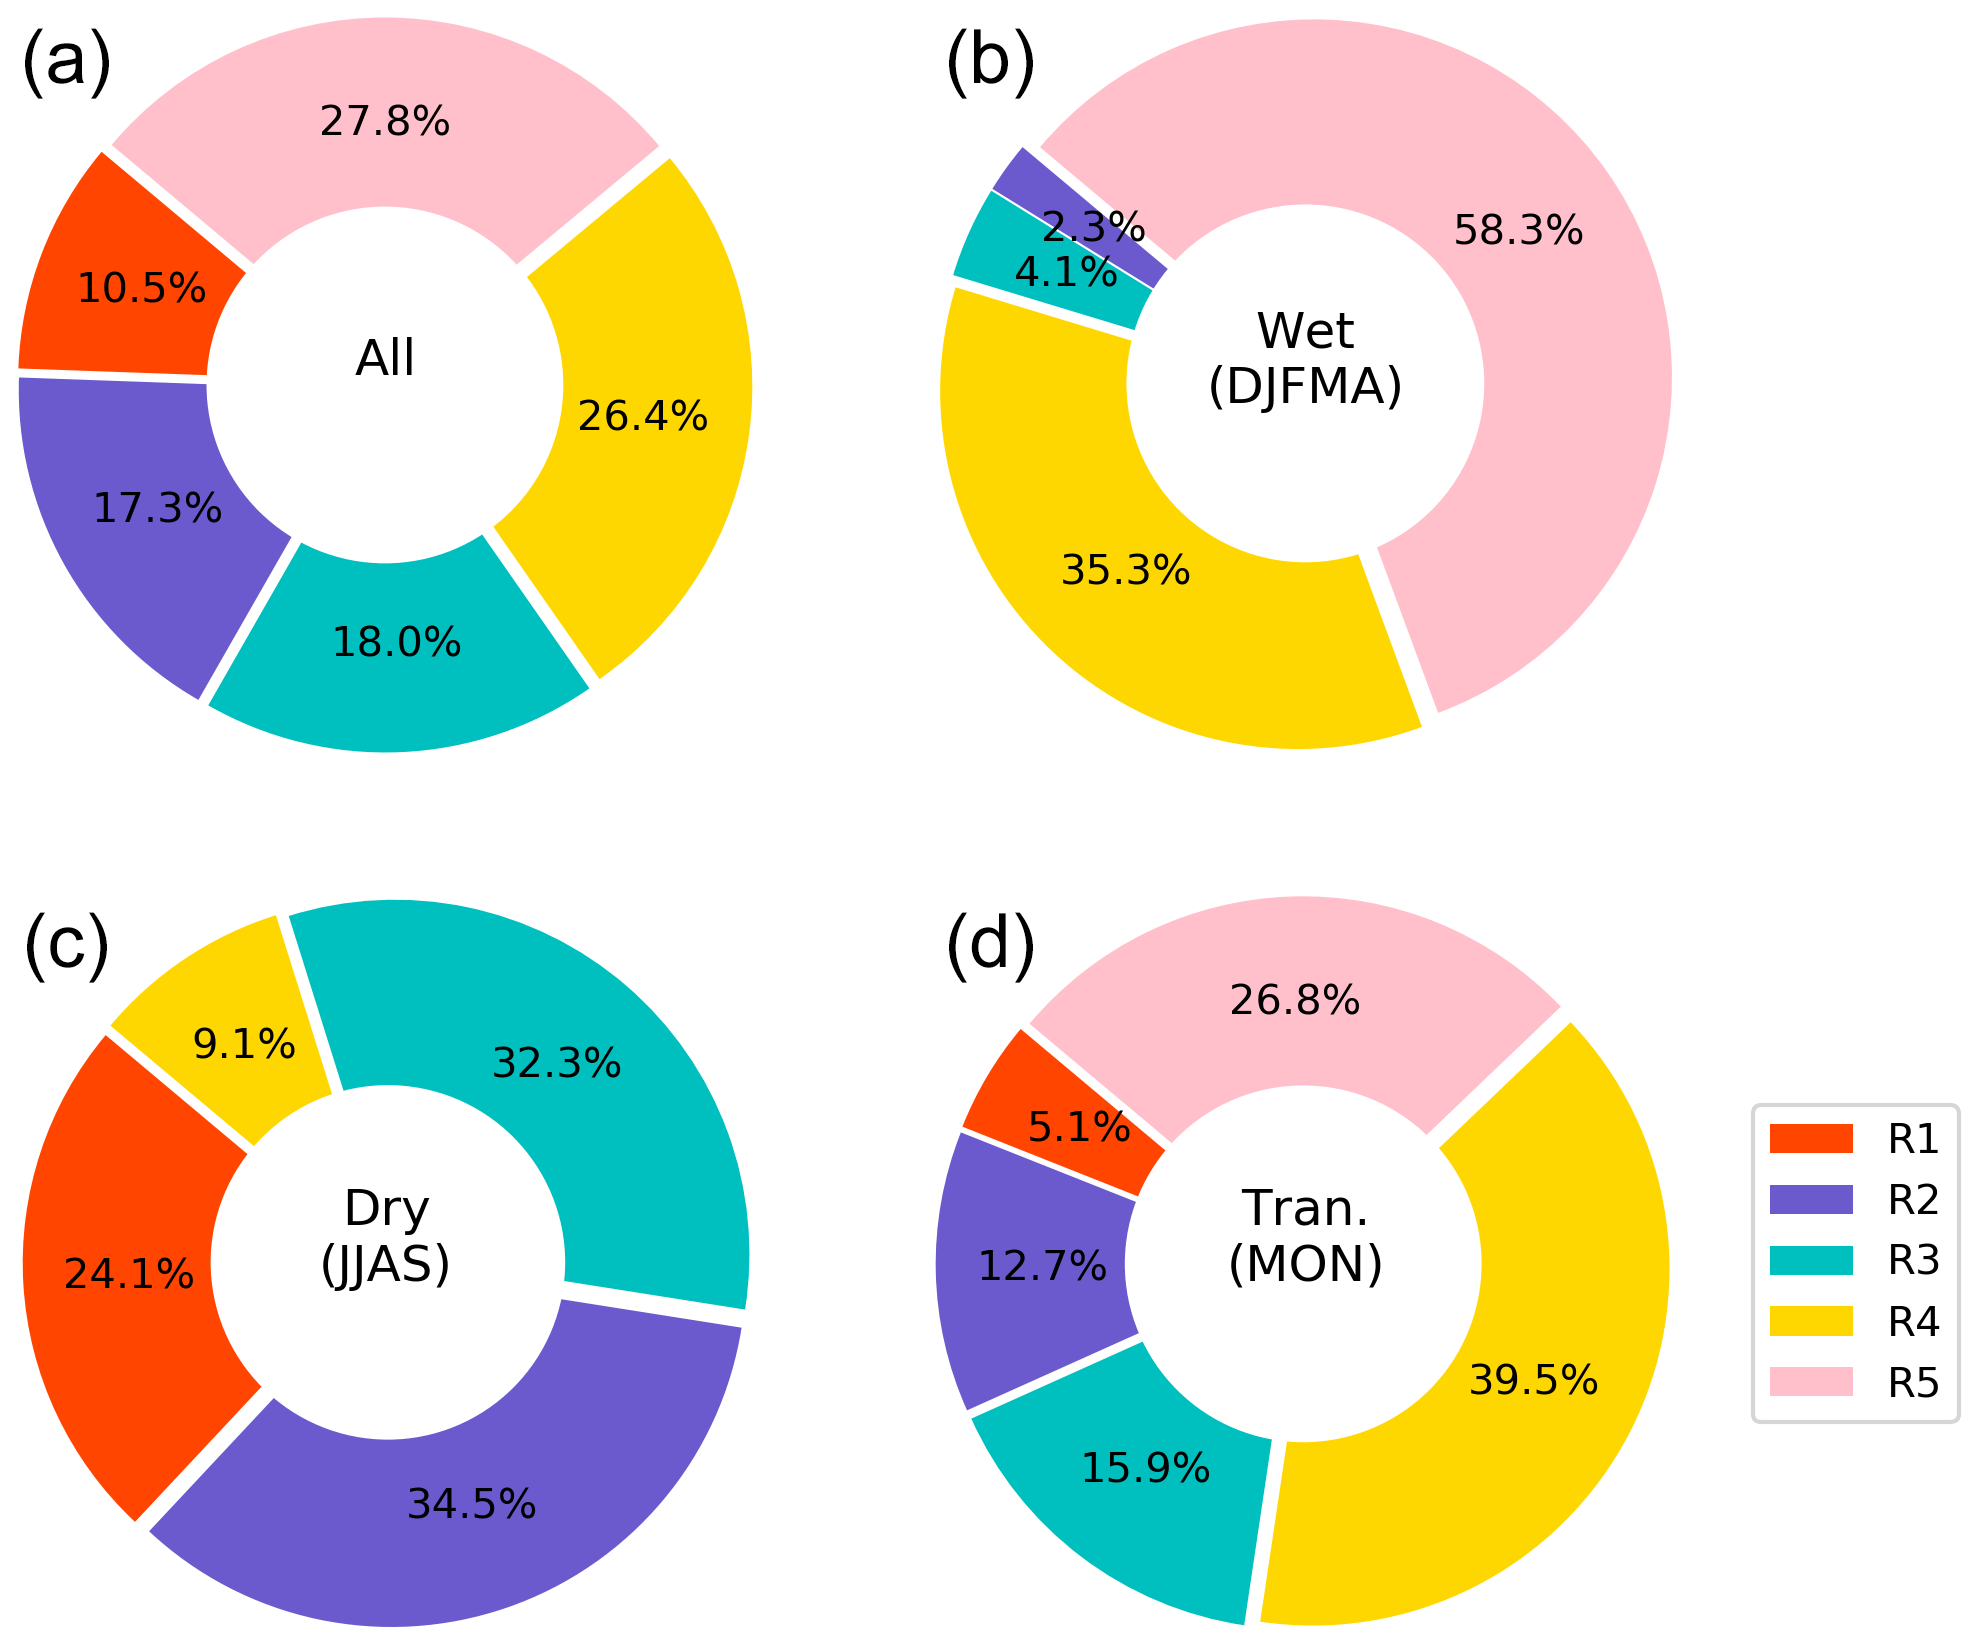
Figure 1Breakdowns for the frequency to observe regime clusters (regimes 1 through 5 marked as R1 through R5) for the GoAmazon2014/5 radiosonde dataset (12:00 UTC), as well as breakdowns for wet season (December, January, February, March, April), dry season (June, July, August, September), and transitional season (May, October, November) radiosondes.
In Fig. 2, we plot the time series of regime designations throughout the campaign (Fig. 2a), with the associated monthly breakdowns for the clusters (Fig. 2b). Qualitatively, the temporal coherence of the individual clusters in the five-regime solution provides initial confidence in the appropriateness of this regime breakdown. Instances of regimes 4 and 5 are aligned with classic transitional and wet season periods, respectively, with regime 4 periods adjacent to regime 5 and not sporadically distributed within other regimes. The remaining clusters are interwoven within Amazon drier months. The observed cycling between these dry clusters is of immediate interest as this variability may be indicative of intraseasonal synoptic pattern phases in the dry season.
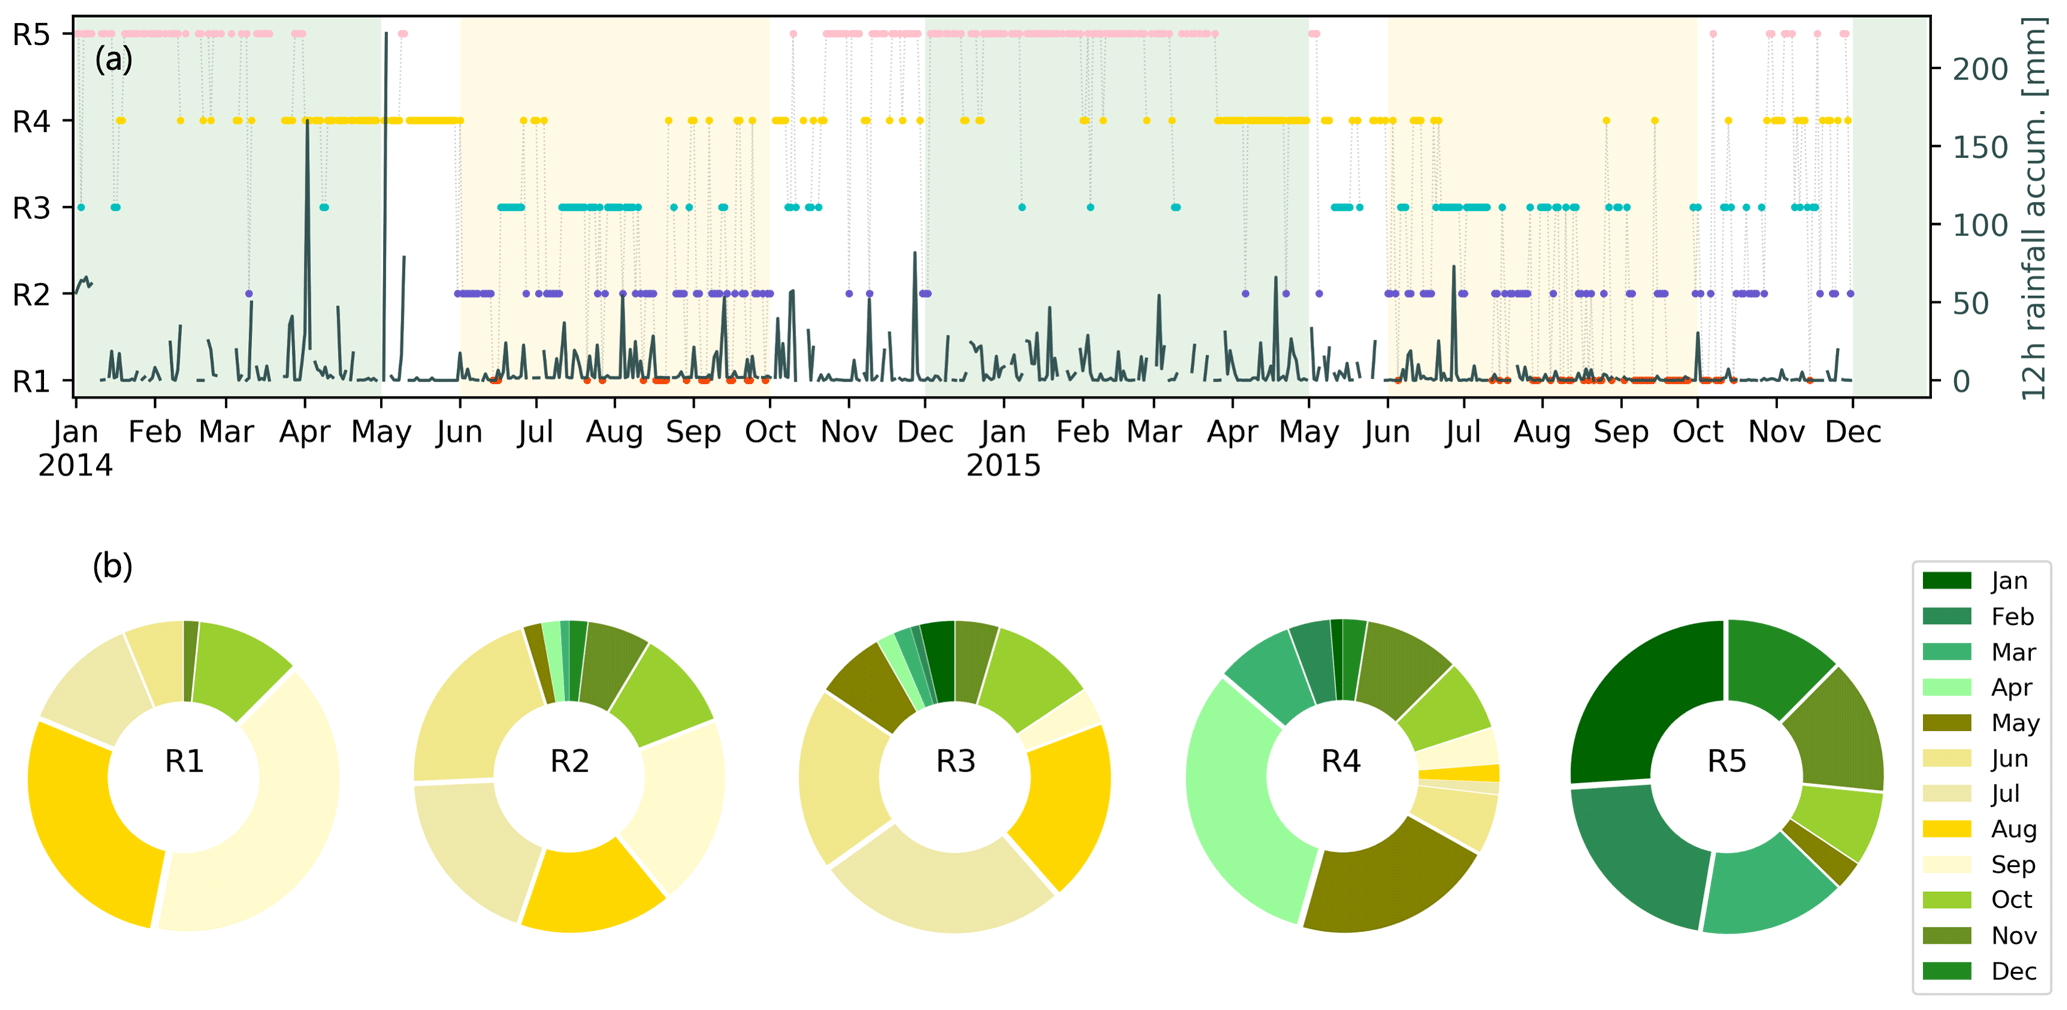
Figure 2(a) Time series for Amazon regime cluster results (color coded as in Fig. 1) with corresponding 12 h (12:00–00:00 UTC) rainfall accumulation (from the MAO rain gauge). The green shading indicates the wet seasons, and the yellow shading indicates the dry seasons according to the calendar definition. (b) Relative breakdown for the frequency of each regime according to month.
The specifics of the GoAmazon2014/5 campaign and its particular representativeness in the context of historical Amazon records should be considered when assessing cluster appropriateness. As summarized by Marengo et al. (2017), the climatological wet season onset for Manaus based on rainfall records is typically mid-November (e.g., Liebmann and Marengo, 2001). Their efforts indicate that traditional rainfall-based criteria and additional wet season onset measures such as outgoing longwave radiation indicators (e.g., Kousky, 1988) imply that the 2014–2015 wet season onset date occurred much later in the season (e.g., end of January 2015). One explanation for the late onset, offered by Marengo et al. (2017), was that precipitation – the obvious indicator for wet season onset – was heavily influenced by the strengthening of the Madden–Julian Oscillation (MJO; Madden and Julian, 1994) and associated influences on Amazon rainfall. Based on cluster outcomes in Fig. 2, we did not identify a prolonged cluster arguably associated with a presumed wet season condition (e.g., regime 5) until early December 2014. This coherent shift in the frequency of radiosonde regime 5 designations coincides with an extended changeover in the upper-level winds, as also shown in campaign thermodynamic summary plots (e.g., Fig. 2 from Giangrande et al., 2017). Nevertheless, we record multiple instances of regime 5 as early as November 2014, coinciding with a pronounced dry to wet seasonal shift towards a deep-layer profile moisture (RH; see also Fig. 2, Giangrande et al., 2017). As before, the motivation for the k-means cluster method is not to pinpoint an exact rainy season onset date (e.g., first appearance of a given cluster) but rather to identify atmospheric regimes that may provide guidance towards subsets of attendant environmental conditions conducive to different bulk cloud properties.
2.3 Additional k-means cluster sensitivity considerations
Establishing the number of clusters within k-means methods requires sensitivity testing. Having too few clusters tends to overgeneralize and produce overly large intra-cluster variability; having too many clusters leads to difficulties in interpretation because there may be no physically meaningful distinction between clusters. Similar to justifications proposed by Pope et al. (2009a, b), we are interested in regimes associated with significant radiosonde variability and therein potential relationships to cloud variability. One criterion Pope et al. (2009a, b) recommended was that each cluster account for no less than 10 % of the dataset. When adopting this approach, Amazon solutions having more than five clusters generated additional clusters that accounted for less than 10 % of the days.
When considering a six-cluster solution (Fig. S1 in the Supplement), the solution further subdivided the three drier regime clusters into four. However, the distinct separation between our wet (regime 5) and transitional (regime 4) clusters showed little difference when the number of clusters was increased from five to six. To be discussed in Sect. 3, the wet and transitional regime separations predominantly differ from each other in their zonal/meridional wind structures. This does not suggest that there are not specific differences depending on whether the transition is wet to dry or dry to wet, only that these differences are not as pronounced as the drier intraseasonal shifts. In contrast, the four-cluster solution meets our basic criterion for determining the number of clusters (Fig. S2). However, with only four clusters, the regime 4 and 5 clusters are combined into a single, deep-moisture profile regime. We demonstrate in later sections that the five-regime clustering is able to delineate useful details in convective transitions and organization compared to the four-regime solution. Because of this, the authors settle on the five-cluster solution as it maintains a separate transitional regime that the authors believe is consistent with the literature.
3.1 Composite regime thermodynamic profiles and parameter displays
In Fig. 3, we plot the composite radiosondes for all five regimes classified in the previous section. Shaded regions provide reference for composite radiosonde MUCAPE (red shading) and MUCIN (blue shading). Values reported on these images are the median values of the MUCAPE and MUCIN calculated for each individual sounding. The probability density plots in Fig. 4 report the median values, distribution, quartiles, and 10th and 90th percentile extremes for the convective parameters of interest calculated from the radiosondes. Differences in MUCAPE and MUCIN across the regimes are largely driven by differences in the mid- to upper-level moisture and dew point temperature rather than temperature, a result consistent with the understanding that horizontal temperature gradients over the tropics are small and that variability in tropical convection is predominantly associated with horizontal moisture gradients (weak temperature gradient approximation; Sobel et al., 2001). For all regimes, the standard deviations for MUCAPE and MUCIN parameters are similar (1100 and −15 J kg−1, respectively). For other fields, the standard deviations vary with regime, with greater variability in the traditional dry season time frames than in the wet season. For example, standard deviation for wind shear is 4–6 m s−1 in the drier regimes and regime 4 versus 2–4 m s−1 in the wetter regime 5 conditions. For mixed-layer CIN, median regime values become less negative (from −85 J kg−1 for regime 1 to −33 J kg−1 for regime 5); however, the relative distribution and regime rankings are similar. When considering mixed-layer CAPE distributions, the values estimated for regime 1 (the highest MUCAPE regime) are noticeably smaller than the other regimes (median values dropping to 550 J kg−1), whereas the remaining regimes all have similar median mixed-layer CAPE values of approximately 1000 J kg−1 (similar relative rankings otherwise). This discrepancy in mixed-layer CAPE and more prohibitive mixed-layer CIN may explain the absence of deep convection under regime 1 conditions (Sect. 4).
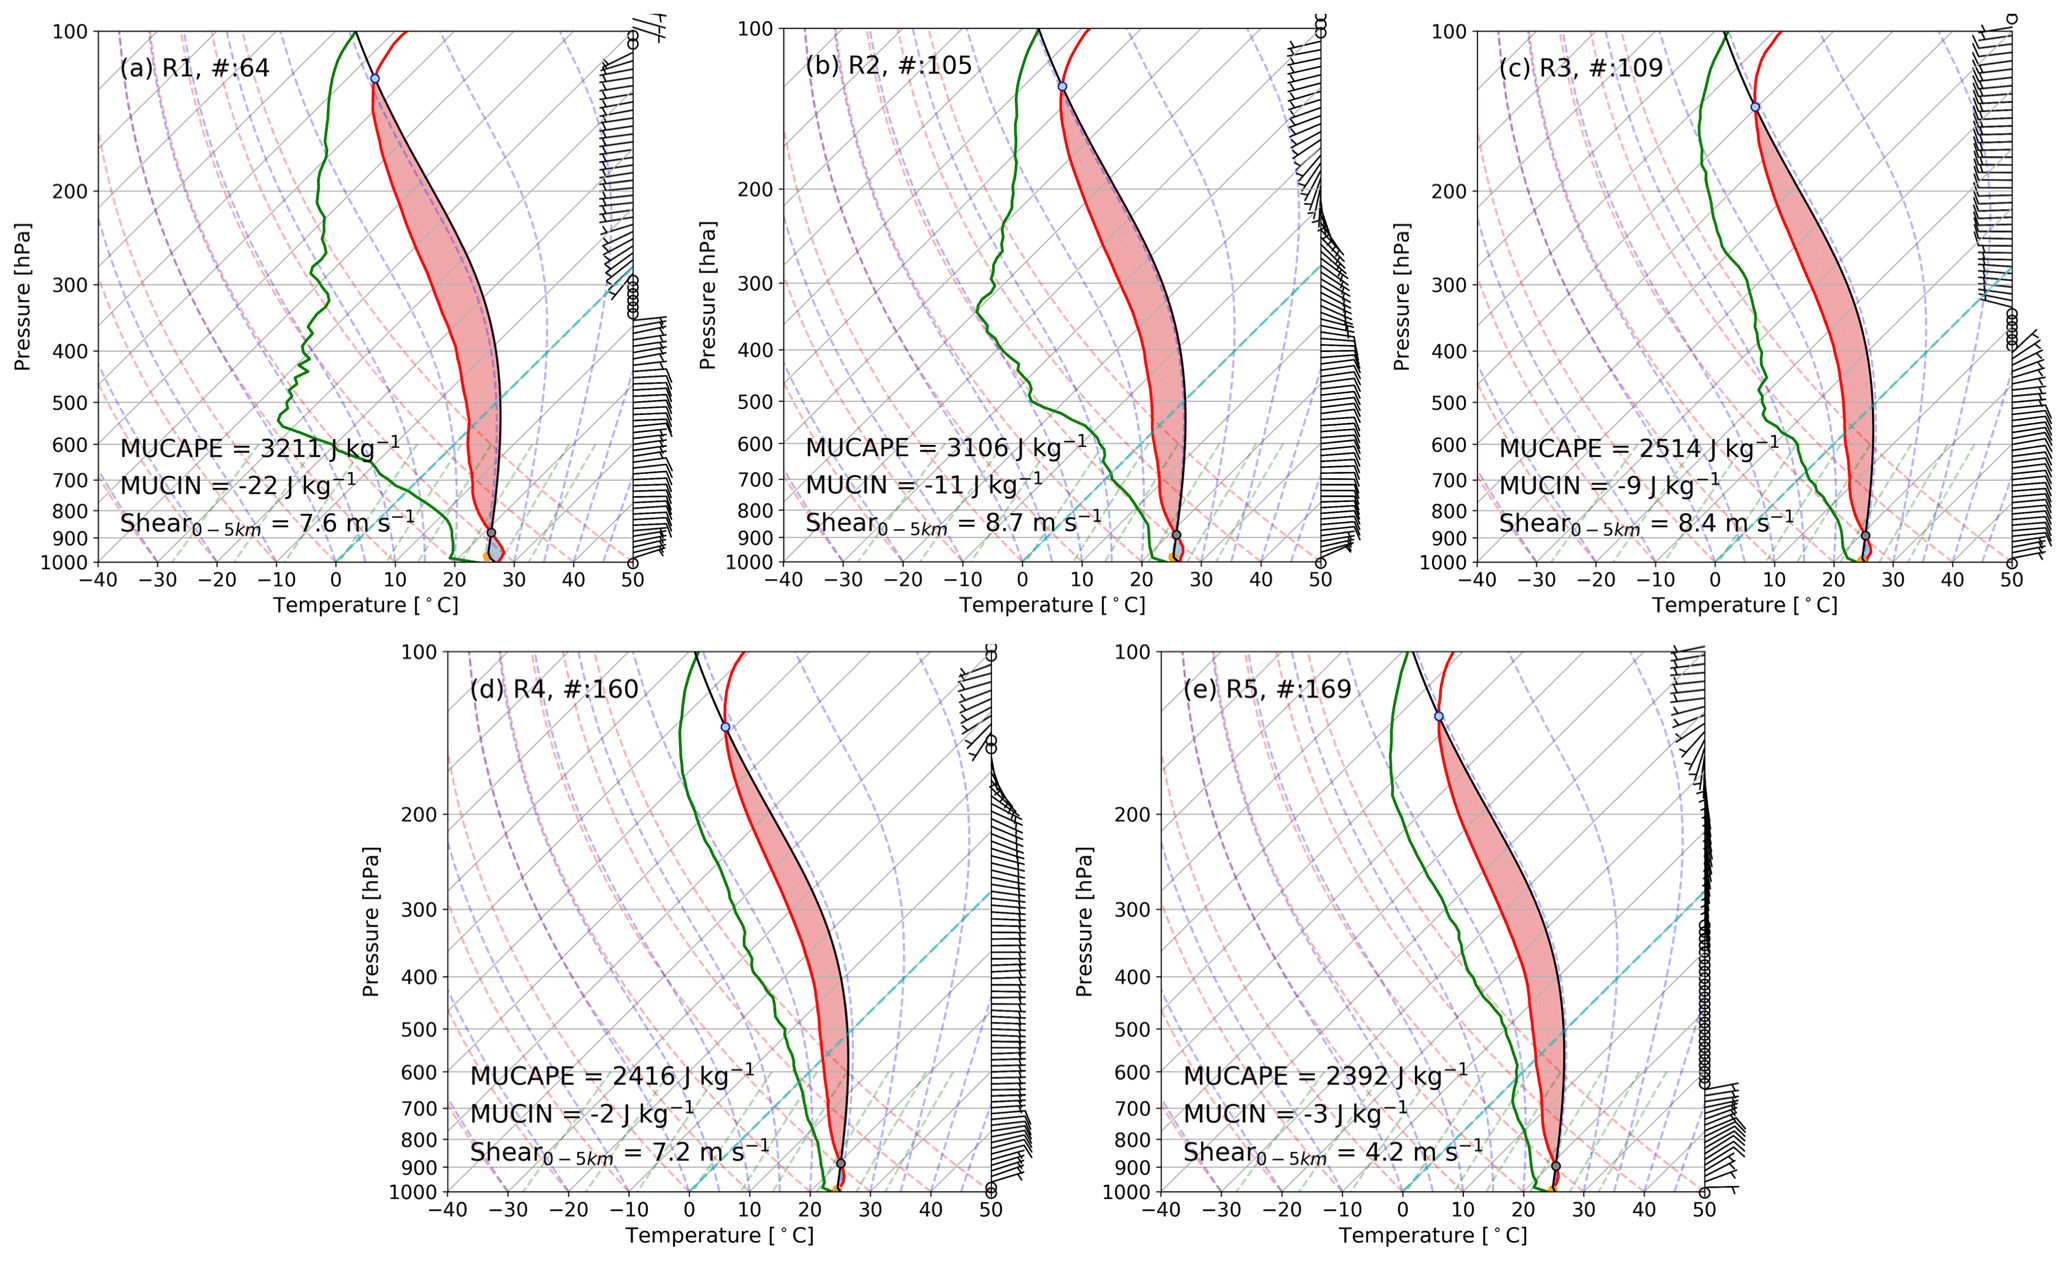
Figure 3Composite 12:00 UTC radiosondes for each regime. MUCAPE, MUCIN, and wind shear (surface to 5 km) parameters report regime median values.
Temporal patterns for regime 5 align with calendar wet season definitions and deeper moisture conditions. As visible in Figs. 3 and 4, regime 5 is associated with reduced values for MUCAPE but favorable (less negative) values for MUCIN to promote frequent convection (e.g., Giangrande et al., 2016). Regime 5 also records the lowest LFC and LCL heights and reduced distribution variability therein. Where regime breakdowns differ from traditional Amazon ideas is with these methods which more frequently define wet to dry season months such as April through June as transitional regime 4 (Fig. 3b) periods. As suggested by Fig. 4f, the most significant difference we observe between the regime 4 and 5 composites is associated with profile winds, which includes increased lower-level wind shear in regime 4. A separation for wet and transitional regimes according to wind shifts is consistent with ideas of transpiration or shallow convection preconditioning an eventual wet season onset (e.g., Wright et al., 2017), e.g., favorable moisture conditions precede deeper cloud formation prior to regional-scale wind shifts which lead to wet season onset. However, this explanation would not apply to the reciprocal wet to dry transitional periods. Nevertheless, this dry to wet transition may bear some resemblance to the moistening and associated cumulus and congestus that occur as the MJO over the tropical western Pacific transitions from suppressed to active conditions (e.g., Johnson et al., 1999; Benedict and Randall, 2007; Mechem and Oberthaler, 2013; Zermeño–Díaz et al., 2015). Finally, while the differences in bulk wind shear are interesting between regimes 4 and 5, the magnitude of these differences is modest (to within 5 m s−1). However, differences in mean shear within regime 4 may be indicative of differences in updraft structure (upright versus tilted), convective cold pool circulations, and overall organization (e.g., Rotunno et al., 1988; Parker and Johnson, 2000; Weisman and Rotunno, 2004).
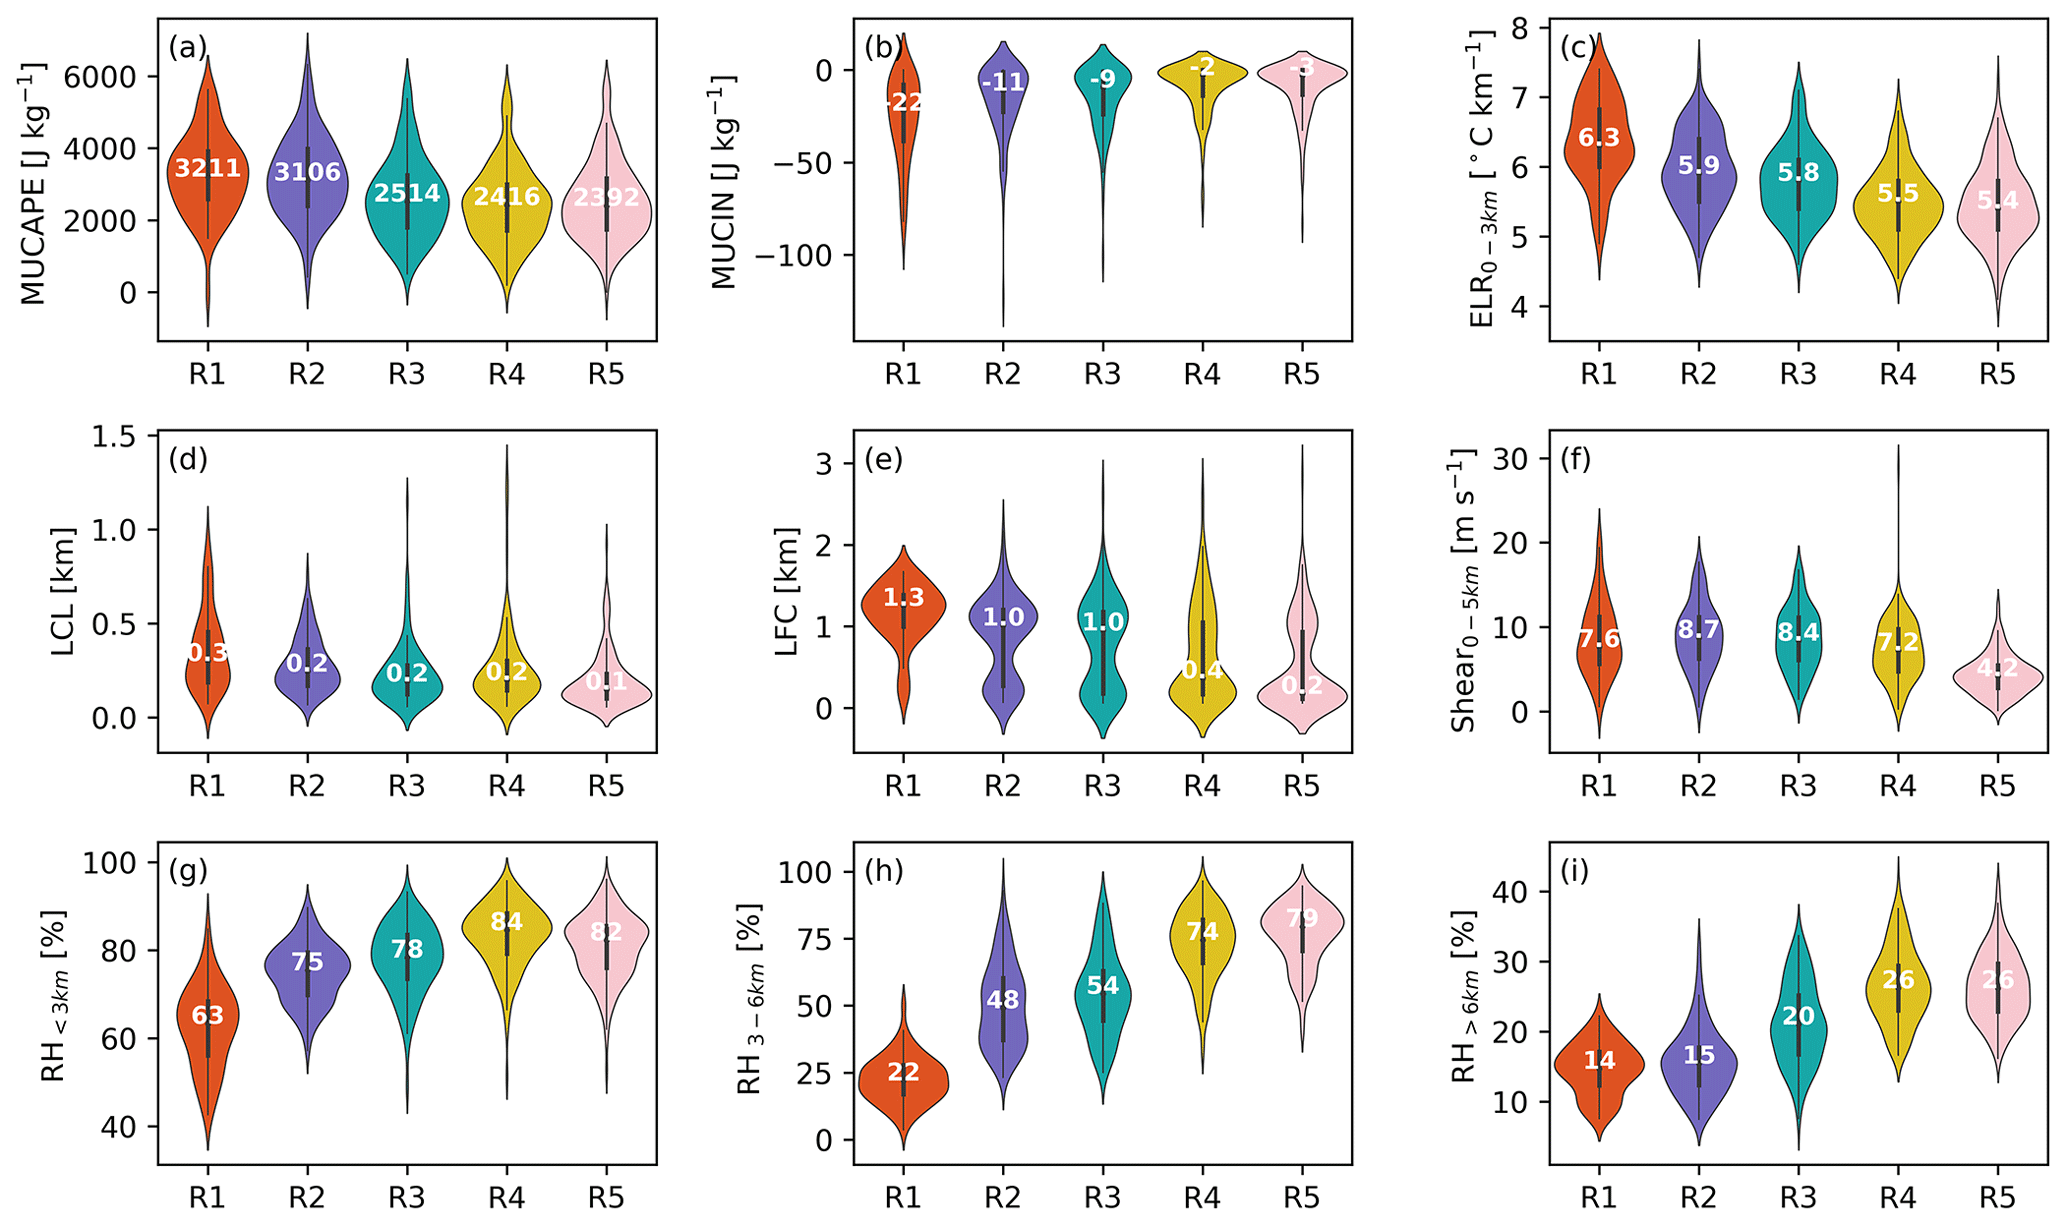
Figure 4Shaded probability density plots for select thermodynamic quantities of interest estimated from the 12:00 UTC radiosondes in each Amazon regime. The median values for each regime distribution are reported on each violin (white text). The interior black box shows the interquartile range and the thin black lines reflect the 95 % confidence interval.
Previous Amazon studies suggest that the dry to wet season transitional periods (e.g., September through November) are more conducive to storm electrification than wet to dry transitional periods (e.g., Williams et al., 2002). Our clusters do not distinguish differences between these periods (here dry season is defined traditionally from June through September). Although the separations for regimes 1 (extreme dry) and 5 (extreme wet) are robust in our input tests, when k-means methods use standardized inputs, this change realigns five-cluster solutions towards pre- and post-dry-season states (Fig. S3). While the authors did not pursue cluster solutions using standardized inputs for our primary examples, one suggestion is that standardized wind-field inputs (to yield the same variability as the temperature and/or moisture fields) may help differentiate transitional periods. In our Supplement images, we provide composite properties for before (March through May) and after (September through November) the dry season regime 4 instances (Fig. S4). Current regime 4 solutions exhibit enhanced MUCAPE for soundings collected during dry to wet periods that suggest those times as being more conducive for vigorous updrafts (median MUCAPE values greater by ∼700 J kg−1).
The remaining clusters are associated with months traditionally classified as the Amazon dry season. Shifts between the three drier clusters are attributed to radiosonde mid- to upper-level moisture, with only minor controls associated with shifts in winds. Regime 1 is the least frequently observed for the Amazon campaign but the most significant outlier in terms of thermodynamic parameters (e.g., Fig. 4). Regime 1 is also associated with the driest overall profile conditions (at low and mid-levels), the lowest mixed-layer CAPE, the highest LFC, and the most prohibitive MUCIN conditions. Regime 3 favors humid conditions at the low to mid-levels when compared to regimes 1 and 2, as well as larger values of mid- to upper-level humidity. The enhanced humidity at low and mid-levels in Regime 3 may aid in the initiation and maintenance of deep convection, while enhanced upper-level humidity may promote saturated layers and ice-phase microphysical processes associated with stratiform precipitation. As widespread stratiform precipitation and MCSs have been reported also within the dry season (e.g., Wang et al., 2018, 2019), Sect. 4 explores which dry season regime or regimes favor MCS.
3.2 Large-scale synoptic conditions projected onto these regimes
In Fig. 5, we plot the means of the 1000 hPa geopotential height and wind field from the ERA5 (taken to represent the composite large-scale synoptic patterns) projected onto each regime. Additional composites at the 200, 500, and 850 hPa levels are found in the Supplement (Figs. S5–S7). For the wet regime (regime 5), the composites show land–ocean contrasts, and composites carry strong impressions of the Chaco low over the continent (and/or Bolivian high at the upper levels). Signatures of the Bolivian high are present in the deep layer of the prevailing southerly winds over the MAO site and are exclusive to regime 5 (Fig. 3e). Unlike other composites, regime 5 also suggests 1000 hPa flows providing moisture convergence into the Amazon Basin originating from the tropical belt (northern tropical Atlantic; e.g., Drumond et al., 2014) and their associated calm or weak westerly low-level wind components over the MAO site. Although the 12:00 UTC regime thermodynamic profiles did not indicate a pronounced difference between regime 4 and 5 moisture characteristics, ERA5 composites suggest that regime 4 conditions are associated with different sources of moisture, with 1000 hPa winds over the Amazon Basin shifting towards drier, easterly, zonal 1000 hPa flows. We speculate that the regime 4 to regime 5 shift visible in the large-scale composites may be associated with the positioning and strength of the South Atlantic Convergence Zone (SACZ) and its influences on the Amazon Basin during the wet season (e.g., Carvalho et al., 2004). Drier season regimes have transitioned to southerly, low-level flows, which is suggestive of drier, colder air reaching the central Amazon. These patterns vary according to the positioning and strength of offshore features that, in turn, funnel increasingly drier, colder air from the southeast (e.g., tropical South Atlantic; Drumond et al., 2014).
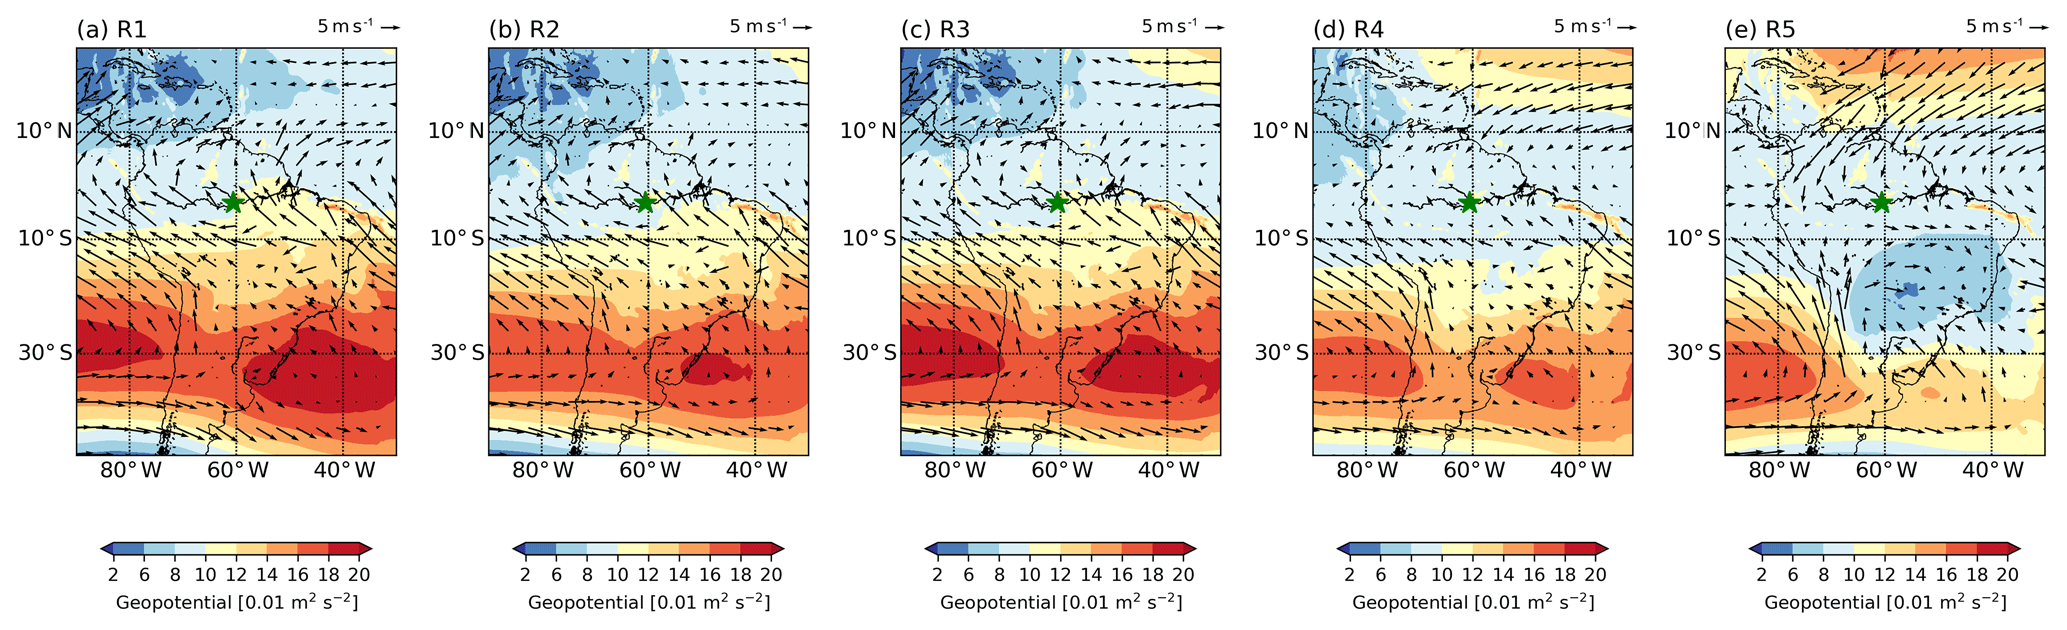
Figure 5Composite large-scale synoptic patterns (geopotential heights in color – 0.01 m2 s−2 – and horizontal winds) projected onto each regime from ERA5 for the 1000 hPa level. The green star indicates the ARM MAO site.
GoAmazon2014/5 datasets recorded one complete transition from the dry season to the wet season. In Fig. 6, we plot the composite 1000 hPa patterns associated with regime 5, with each panel corresponding to a different monthly composite between October and January. Noting that October contained few instances of regime 5 conditions, composite ERA5 maps suggest large-scale trends and flow patterns were reminiscent of regime 4 (e.g., transitional) composites (Fig. 5d) with weak indications of a continental surface low pressure or of moisture inbound from southward latitudes. December composite patterns, in contrast, better reflect prevalent regime 5 composite behaviors (e.g., Fig. 5e) that by January shift towards a westerly, low-level flow and are associated with low pressure and the SACZ. Westerly shifts in the central Amazon rainy seasons have been previously discussed as promoting a moist troposphere and frequent (albeit not necessarily more intense) convection compared to easterly flow regimes near the beginning of the rainy season (e.g., Betts et al., 2002; Cifelli et al., 2002; Peterson et al., 2002).

Figure 6Composite, monthly, large-scale synoptic patterns at 1000 hPa (following Fig. 5) and radiosondes associated with regime 5. Plots correspond left to right to (a) October, (b) November, (c) December, and (d) January.
To further explore attendant large-scale conditions and regime transitions, in Fig. 7 we plot composite daily projections of horizontal moisture advection and vertical velocity from the VARANAL product. Estimated horizontal advection of moisture (e.g., , where V is horizontal wind vector and q is the water vapor mixing ratio; Fig. 7a–e, green shading) is highest (positive) at the lower levels for the regime 4 and 5 clusters and maximized at the lowest levels below 700 hPa around the 12:00 UTC radiosonde launch time (dashed line). Note that the large-scale vertical velocity w (Fig. 7f–j) is constrained by the domain mean precipitation (assimilated SIPAM observations), with the strength of vertical motion adjusted by the diabatic heating derived from the SIPAM-estimated precipitation rates (e.g., Xie et al., 2014). Regimes with higher precipitation rates will indicate stronger ascending motion associated with greater diabatic heating during the afternoon precipitation periods. Interestingly, the large-scale w patterns during the morning hours are similar across regimes 2 through 5. Similarly, each regime indicates large-scale subsidence above 600 hPa that peaks around radiosonde launch time. However, regime 1 is an outlier and suggests substantial large-scale subsidence (above 600 hPa) and weak lower-level ascent around the morning radiosonde.
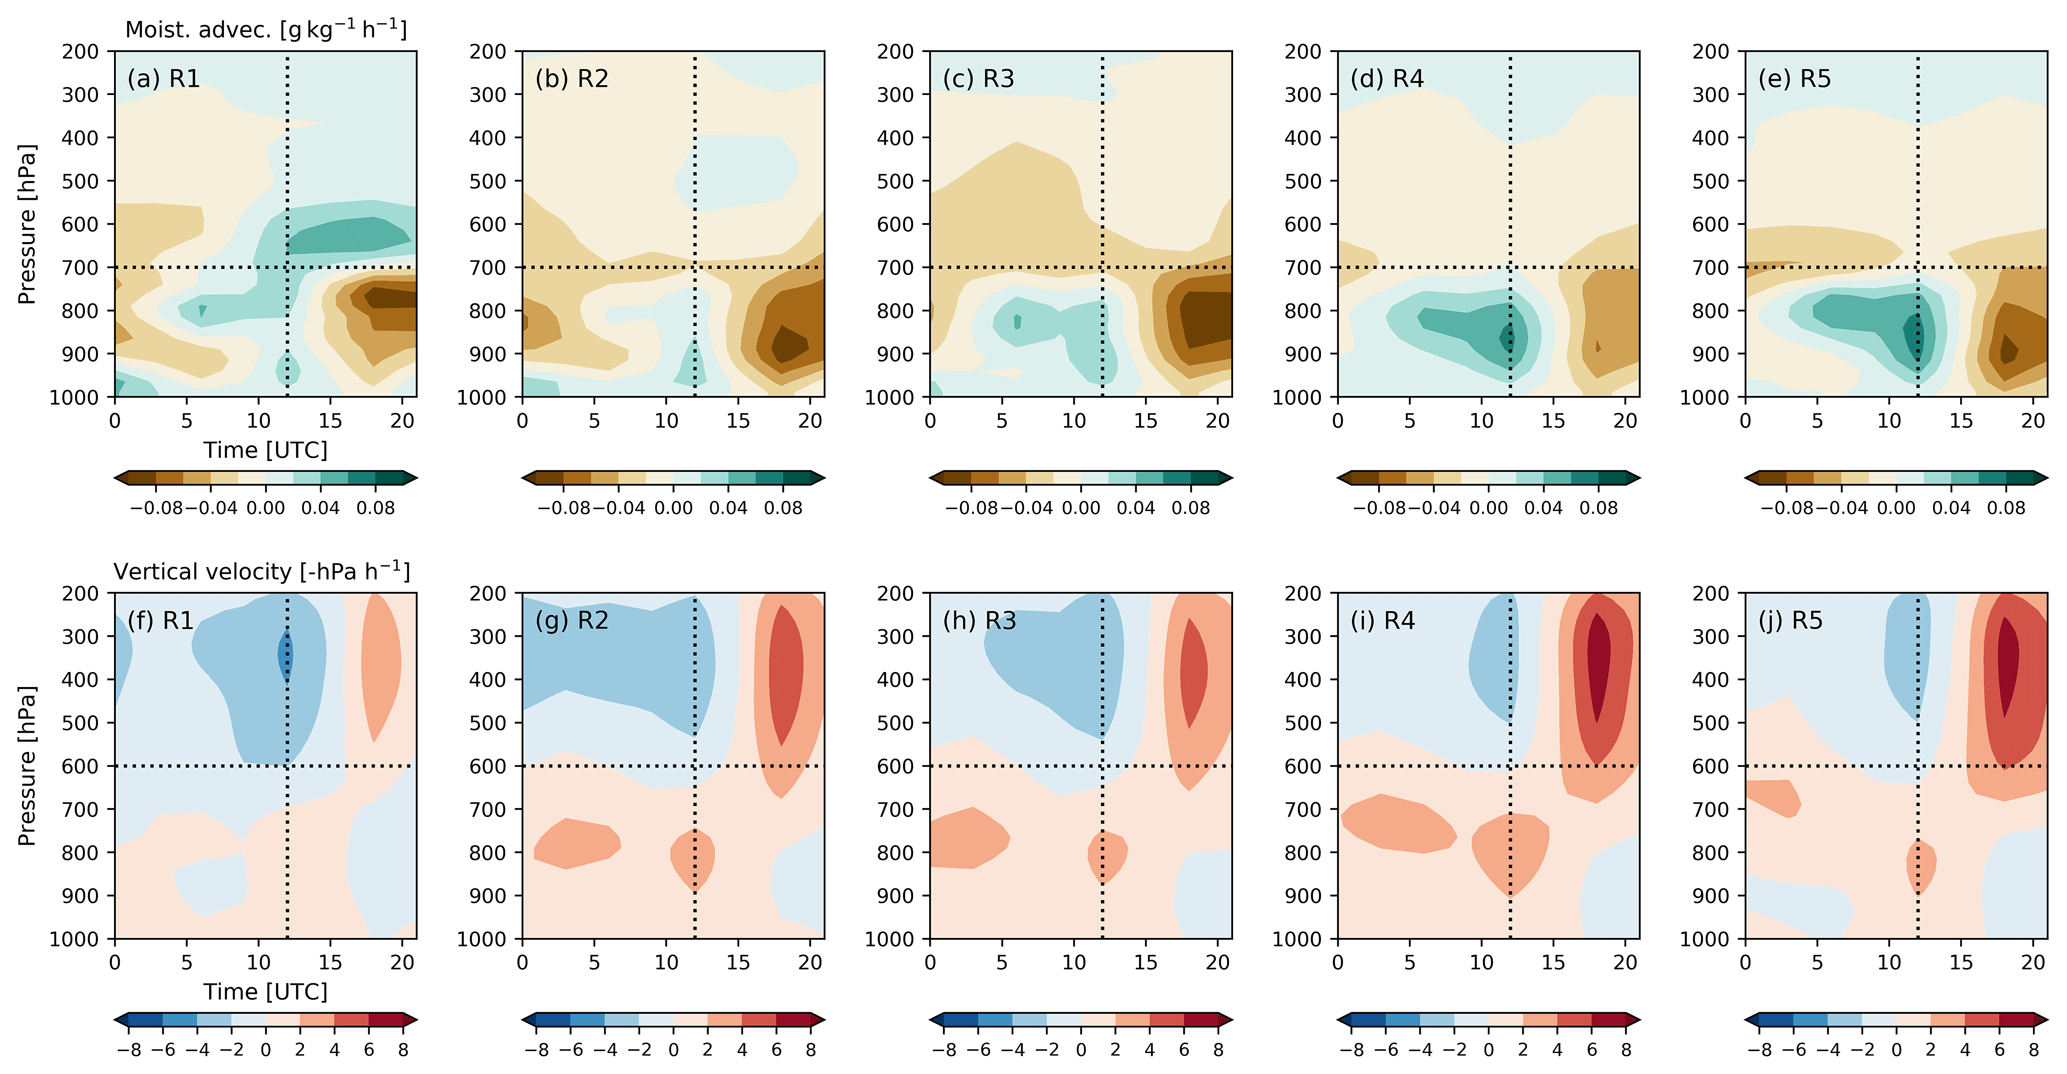
Figure 7Composite diurnal (UTC) large-scale SCM variational forcing dataset (VARANAL) fields for (a–e) regime breakdowns of the horizontal moisture advection (green signifies positive moisture advection) and (f–j) large-scale background vertical velocity (red signifies upward vertical motion). 12:00 UTC columns and 600 hPa (f–j) and 700 hPa (a–e) levels are highlighted as dotted lines.
Finally, in Fig. 8 we isolate the variational analysis profiles corresponding to the pre-convective radiosonde launches by plotting median profiles and 10th/90th percentile values at 12:00 UTC. Regimes 4 and 5 share similar characteristics and enhanced moisture advection (lower levels) and larger-scale w in the mean and extremes (90th percentile). Regime 4 also displays stronger upward motions from near the surface to 650 hPa and stronger extremes in w from ∼750 hPa upward. Since 12:00 UTC is prior to significant domain mean precipitation (Sect. 4.2), these enhancements in regime 4 motions are not influenced by precipitation constraints. Similarly, moist regimes lack the extreme negative (dry) moisture advection (10th percentile properties) found in regimes 1–3.
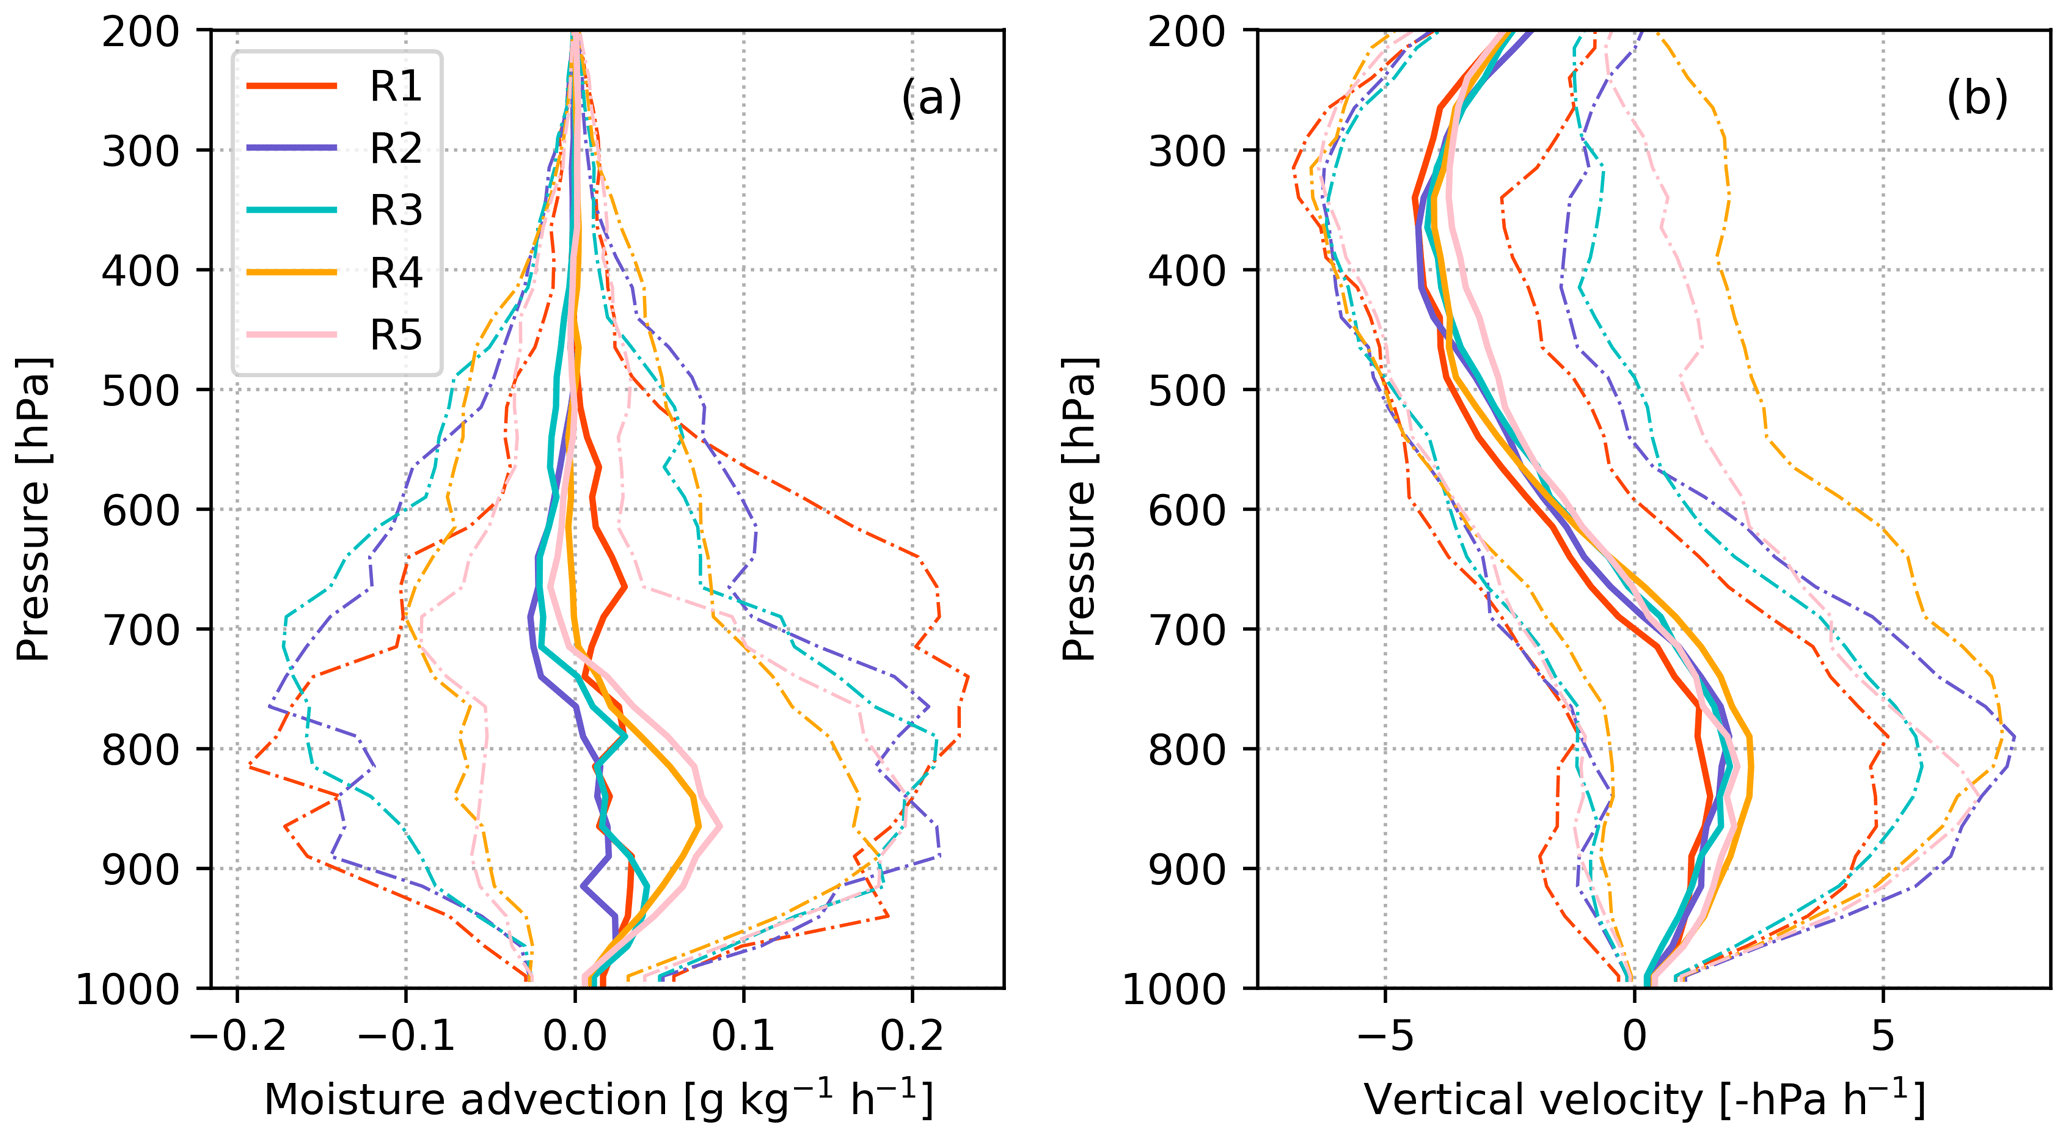
Figure 8Median profiles (thick solid lines) of (a) horizontal moisture advection and (b) large-scale background vertical velocity (positive values signify upward motion) for each regime at 12:00 UTC. The 10th and 90th percentile ranges for the variational analysis fields are represented by the dashed–dotted lines.
4.1 Cloud frequency
Cumulative cloud frequency and diurnal summaries are plotted in Fig. 9. Note, the “all” examples in Fig. 9f and g represent the summary dataset behaviors that include all days including those having precipitation at 12:00 UTC. The characteristics are in line with monthly breakdowns previously available for the GoAmazon2014/5 campaign as reported by Collow et al. (2016). In Fig. 10, we plot the frequency of specific cloud types for the periods from 12:00 UTC (radiosonde launch) to 00:00 UTC to include the relative frequency of null conditions over the site. For the frequency plots in Fig. 10, multiple cloud layers can be identified in the same column; therefore, individual cloud types and null conditions do not add up to 100 %.
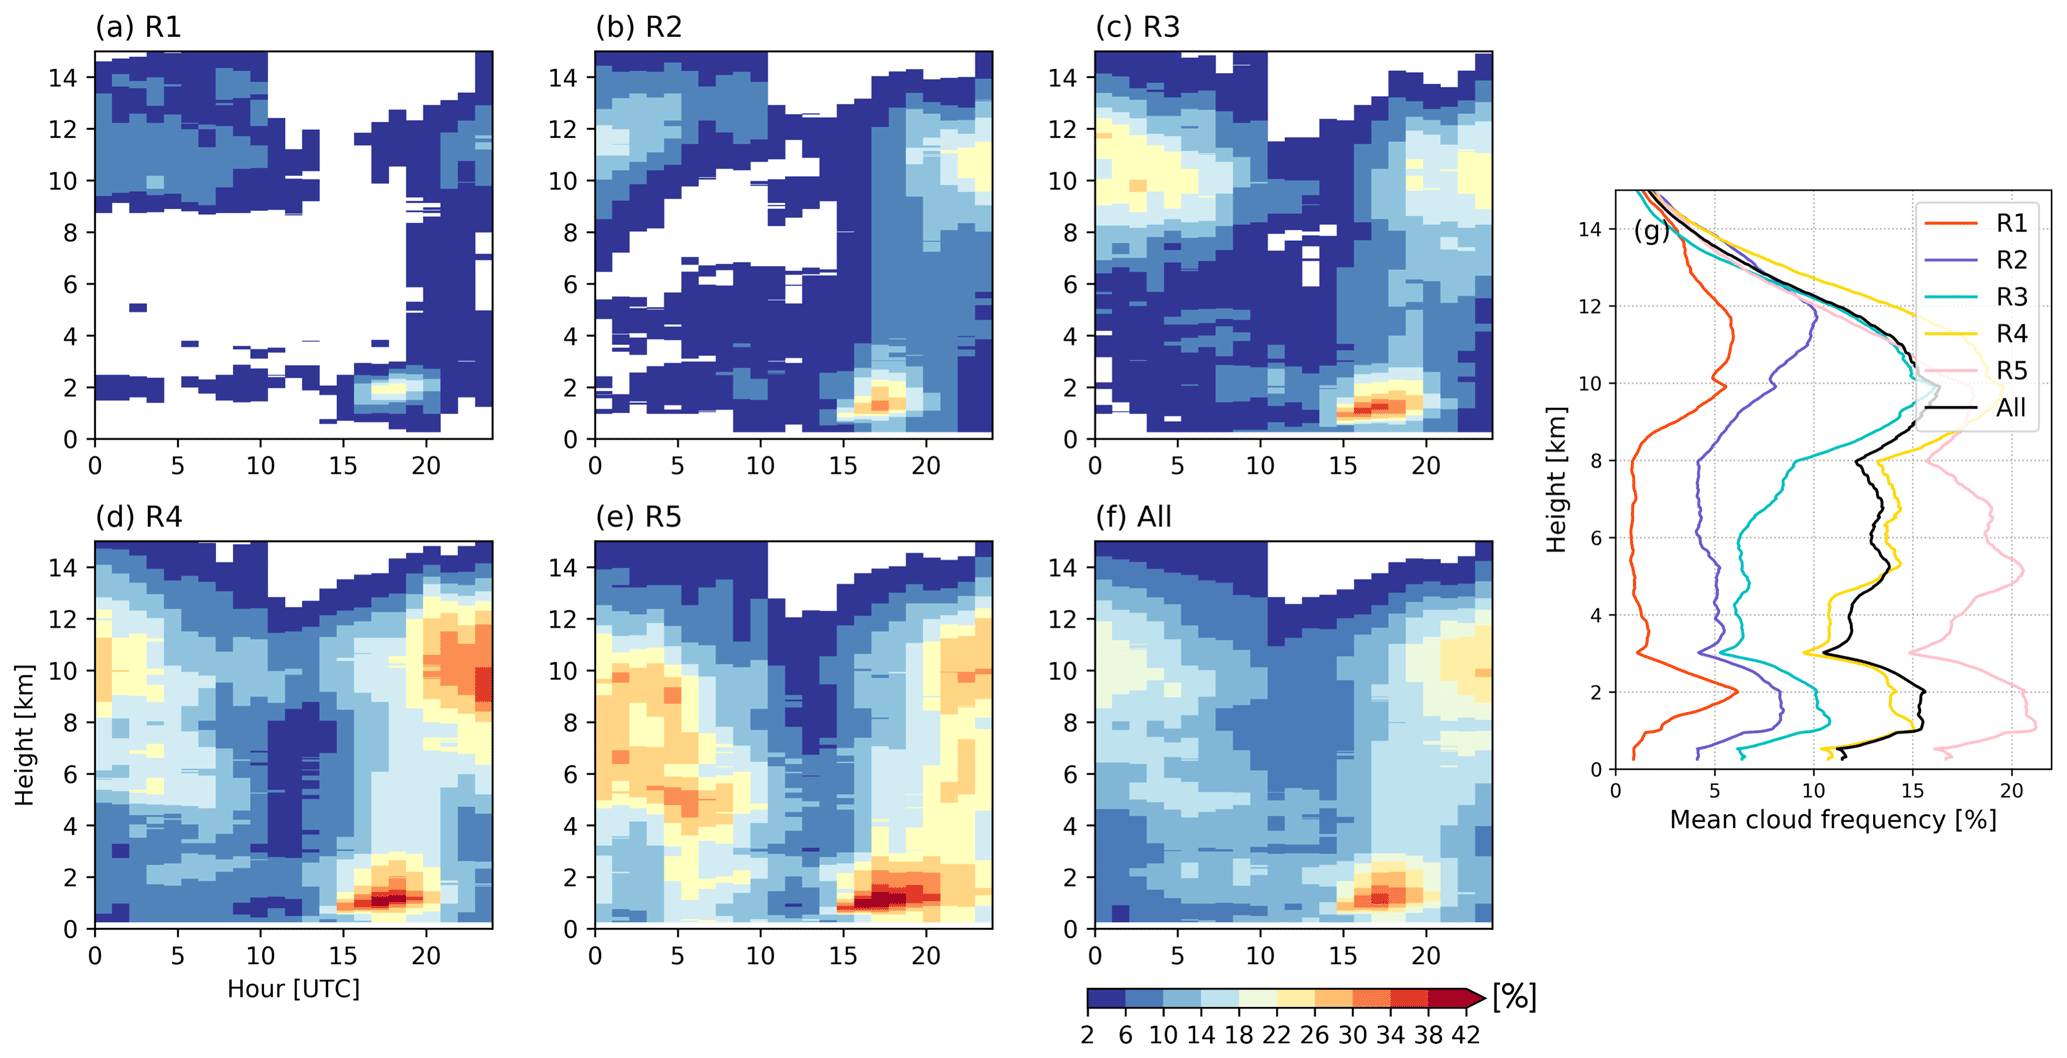
Figure 9The diurnal cycle of hourly mean cloud frequency (when cloud coverage >2 %) as a function of height for each regime (a–f) according to multi-instrument cloud profiling retrieval. The mean 1 h cloud frequency profiles are shown in (g).
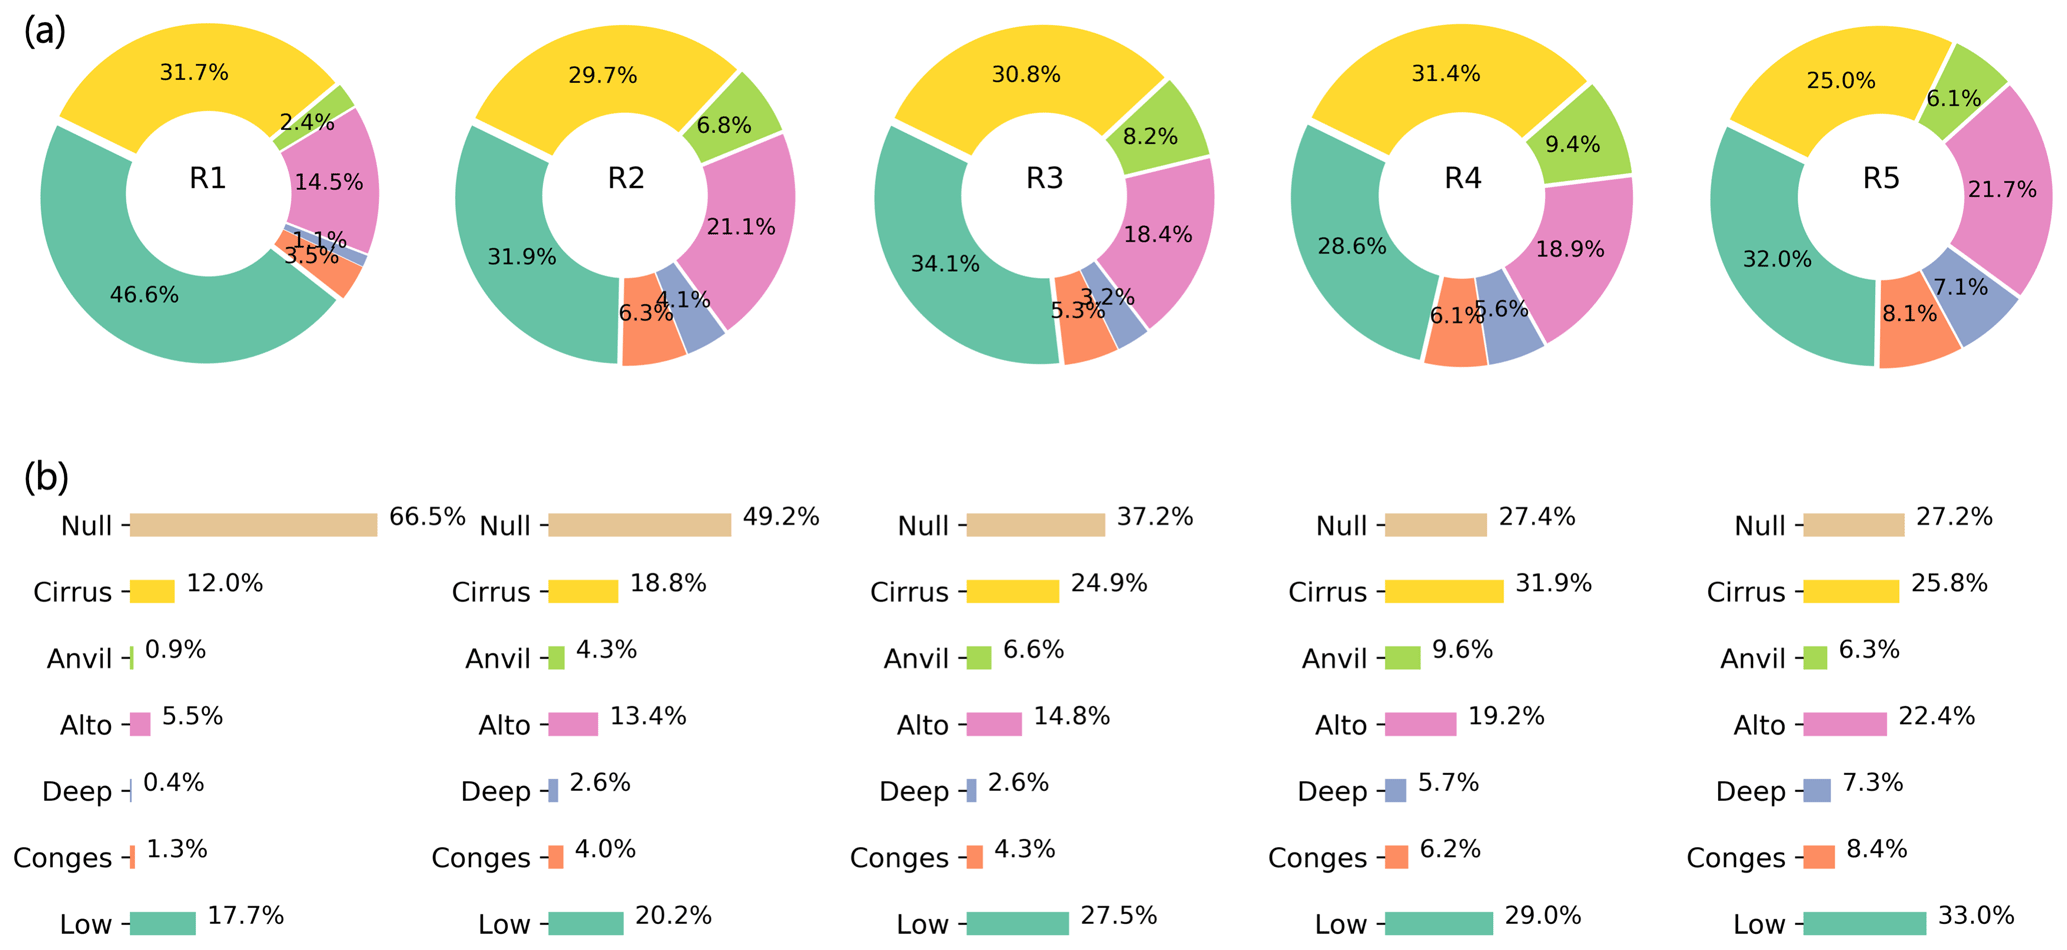
Figure 10(a) Relative frequency of occurrence for specific cloud types in the column above the MAO site for regime periods between 12:00 and 00:00 UTC and (b) percentages when compared to cloud-free conditions.
Cloud properties in Figs. 9 and 10 indicate regime 1 is least favorable for cloud coverage (total or daytime hours following the radiosondes). This is consistent with the least favorable 12:00 UTC convective parameters, moisture advection, and subsidence, as discussed in previous sections, as well as GoAmazon2014/5 dry season studies on precipitation controls (e.g., Ghate and Kollias, 2016). During GoAmazon2014/5, regime 1 was the only regime for which a majority of the daytime hours over the site was not populated with clouds (e.g., Fig. 10b). When clouds were present, the most frequent cloud type was shallow cumulus. Upper-level cirrus clouds occupy a substantial fraction of the cloud observations in all regimes and are the second-most frequent clouds observed for regime 1 conditions. Presumably, the prevalence of cirrus in regime 1 is attributable to cirrus being generated remotely and then being advected over the site. Interestingly, Fig. 9 suggests there is an absence of cirrus and other cloud types in the periods around the 12:00 UTC radiosonde launch. This provides confidence that the 12:00 UTC radiosondes used as the basis of regime classifications are not contaminated by clouds. All regimes suggest large-scale subsidence at upper levels around 12:00 UTC (e.g., Fig. 7), which may explain the absence of cirrus.
The drier cluster cloud summaries in Figs. 9 and 10 indicate increasing cloudiness from regimes 1 to 3, with cloud frequency positively associated with reduced MUCIN (lower MUCAPE) and higher column RH. Dry season cloud frequency (regimes 1–3), including mid- (congestus) to upper-level (anvil, including widespread/deep stratiform shields) cloud frequency, is significantly lower than that observed for regimes 4 and 5 (Fig. 9g). Among the drier regimes, regime 3 conditions are most conducive to clouds, although the relative cloud frequency as plotted in Fig. 10 is similarly scaled to the cloud types in regime 2. Moreover, diurnal cycles indicate that relative contributions from congestus are mostly absent from regimes 1 to 3 in the mid-morning to afternoon periods (e.g., bimodal), and the increase in frequency between regimes 2 and 3 is attributed to enhanced shallow (echo tops <3 km) and deeper (isolated) convection (echo tops >8 km). There is weak evidence of overnight precipitating clouds during the dry season (e.g., Ghate and Kollias, 2016), which is observed during the relatively moist regime 3.
MAO clouds are most frequently observed during the moist regimes (regimes 4 and 5), with increases in frequency attributed to contributions from all cloud types. Regime 5 indicates the highest frequency for shallow to mid-level clouds (e.g., shallow, congestus, and alto) and the highest frequency overall, as shown in Fig. 9g. Diurnal plots suggest a gradual daytime shallow to deep cloud transition for regimes 4 and 5, consistent with previous arguments for increased water vapor in the lower troposphere as the primary factor responsible for triggering this transition (e.g., Ghate and Kollias, 2016). Interestingly, the bulk timing of this transition is potentially contingent on the regime as this is apparently occurring later in the day according to regime 5 composites. One explanation for the delayed timing is that this transition may be slowed by the reduced incident solar radiation associated with more frequent shallow clouds under regime 5 or wet season conditions (e.g., Zhuang et al., 2017). Variations in shallow to deep timing are also consistent with differences in surface energy balance partitioning, which is a strong function of soil moisture (e.g., Findell and Eltahir, 2003a, b; Jones and Brunsell, 2009). Higher soil moisture values in the wet regime favor a partitioning of the surface net radiation toward more latent than sensible heat flux (i.e., smaller Bowen ratio). This partitioning leads to a wetter boundary layer but weaker generation of turbulent boundary-layer growth that should foster a slower transition. Even in a tropical rainforest, the importance of moisture availability has been shown to have a large impact on the Bowen ratio (Gerken et al., 2018), suggesting this as a possible mechanism for modulating the onset of deep convection.
Regime 5 indicates a trimodal distribution of convective clouds, as observed in previous tropical studies (e.g., Johnson et al., 1999). Over the tropical oceans, the congestus mode is associated with a mid-level stable layer near the melting (0 ∘C) level (e.g., Johnson et al., 1999; Jensen and Del Genio, 2006). This is thought to arise from radiative interactions accompanying intrusions of dry air from poleward latitudes (e.g., Mapes and Zuidema, 1996; Redelsperger et al., 2002; Pakula and Stephens, 2009) or melting processes in organized stratiform precipitation (Mapes and Houze, 1995), although recent findings argue that the melting mechanism is not essential for creating the stable layer (Nuijens and Emanuel, 2018). How these two possible mechanisms explain the presence of the congestus mode across the different Amazon regimes is not obvious. Regimes 1 and 2 are characterized by intrusions of dry air from poleward latitudes, yet they exhibit the lowest frequency of congestus. This indicates that other factors are strongly suppressing the vertical development of congestus and cumulonimbus. The higher frequency for congestus during regimes 4 and 5 is accompanied by a greater incidence of organized convection (Sect. 4.3); this suggests the possibility of the stratiform-cooling mechanism. To complicate matters, only the composite soundings for regimes 2 and 5 (as shown in Fig. 3) exhibit indications of a mid-level stable layer (∼ 700–550 hPa).
Finally, the bulk cloud characteristics as shown in Fig. 10 are similar between regimes 4 and 5 during the morning to afternoon hours. However, an important shift in cloud properties in regime 5 is observed during the pre-radiosonde (overnight) periods, with regime 5 associated with more frequent congestus. From such depictions, it is unclear whether this shift in overnight cloudiness in regime 5 is associated with more frequent or resilient congestus or possible contributions from MCSs. As discussed below, MCSs and/or radar-based indicators for widespread precipitation are more frequent for regime 4. This argues that the increase should be attributed to additional and/or more resilient congestus, and this explanation is consistent with the modest upper (anvil) peak for regime 4 and prominent congestus peak observed in regime 5.
4.2 Differences in precipitation behaviors across regimes
Model evaluation often benefits from precipitation constraints that include comparisons to the diurnal cycle and other precipitation properties. In Fig. 11, we plot the diurnal cycle of precipitation from the domain mean precipitation rate used to constrain the 3-hourly VARANAL products, which is contingent on the regime events having measurable precipitation. As in Fig. 9, a summary campaign behavior (all; Fig. 9f and g) that includes contributions from days having precipitation at 12:00 UTC is also included. For these breakdowns, precipitation rate (mm h−1) is based on SIPAM estimates for the domain within the 110 km radius of the MAO site. The dotted lines in Fig. 11 correspond to the domain mean values, and the shading indicates a 1σ standard deviation for regime events. These standard deviations indicate the event-to-event variability; however, precipitation rates estimated by radar may carry at minimum a 30 % uncertainty (e.g., bias or fractional root mean square error) owing to miscalibration or other factors (e.g., Xie et al., 2014; Giangrande et al., 2014). Note that the SIPAM rainfall estimates used in VARANAL assume a single radar–rainfall relationship based on disdrometer measurements collected under wet season conditions. This choice implies that the dry season rainfall rates are likely overestimated according to previous Amazon disdrometer studies performed for MAO during wet and dry season precipitation (e.g., Wang et al., 2018).
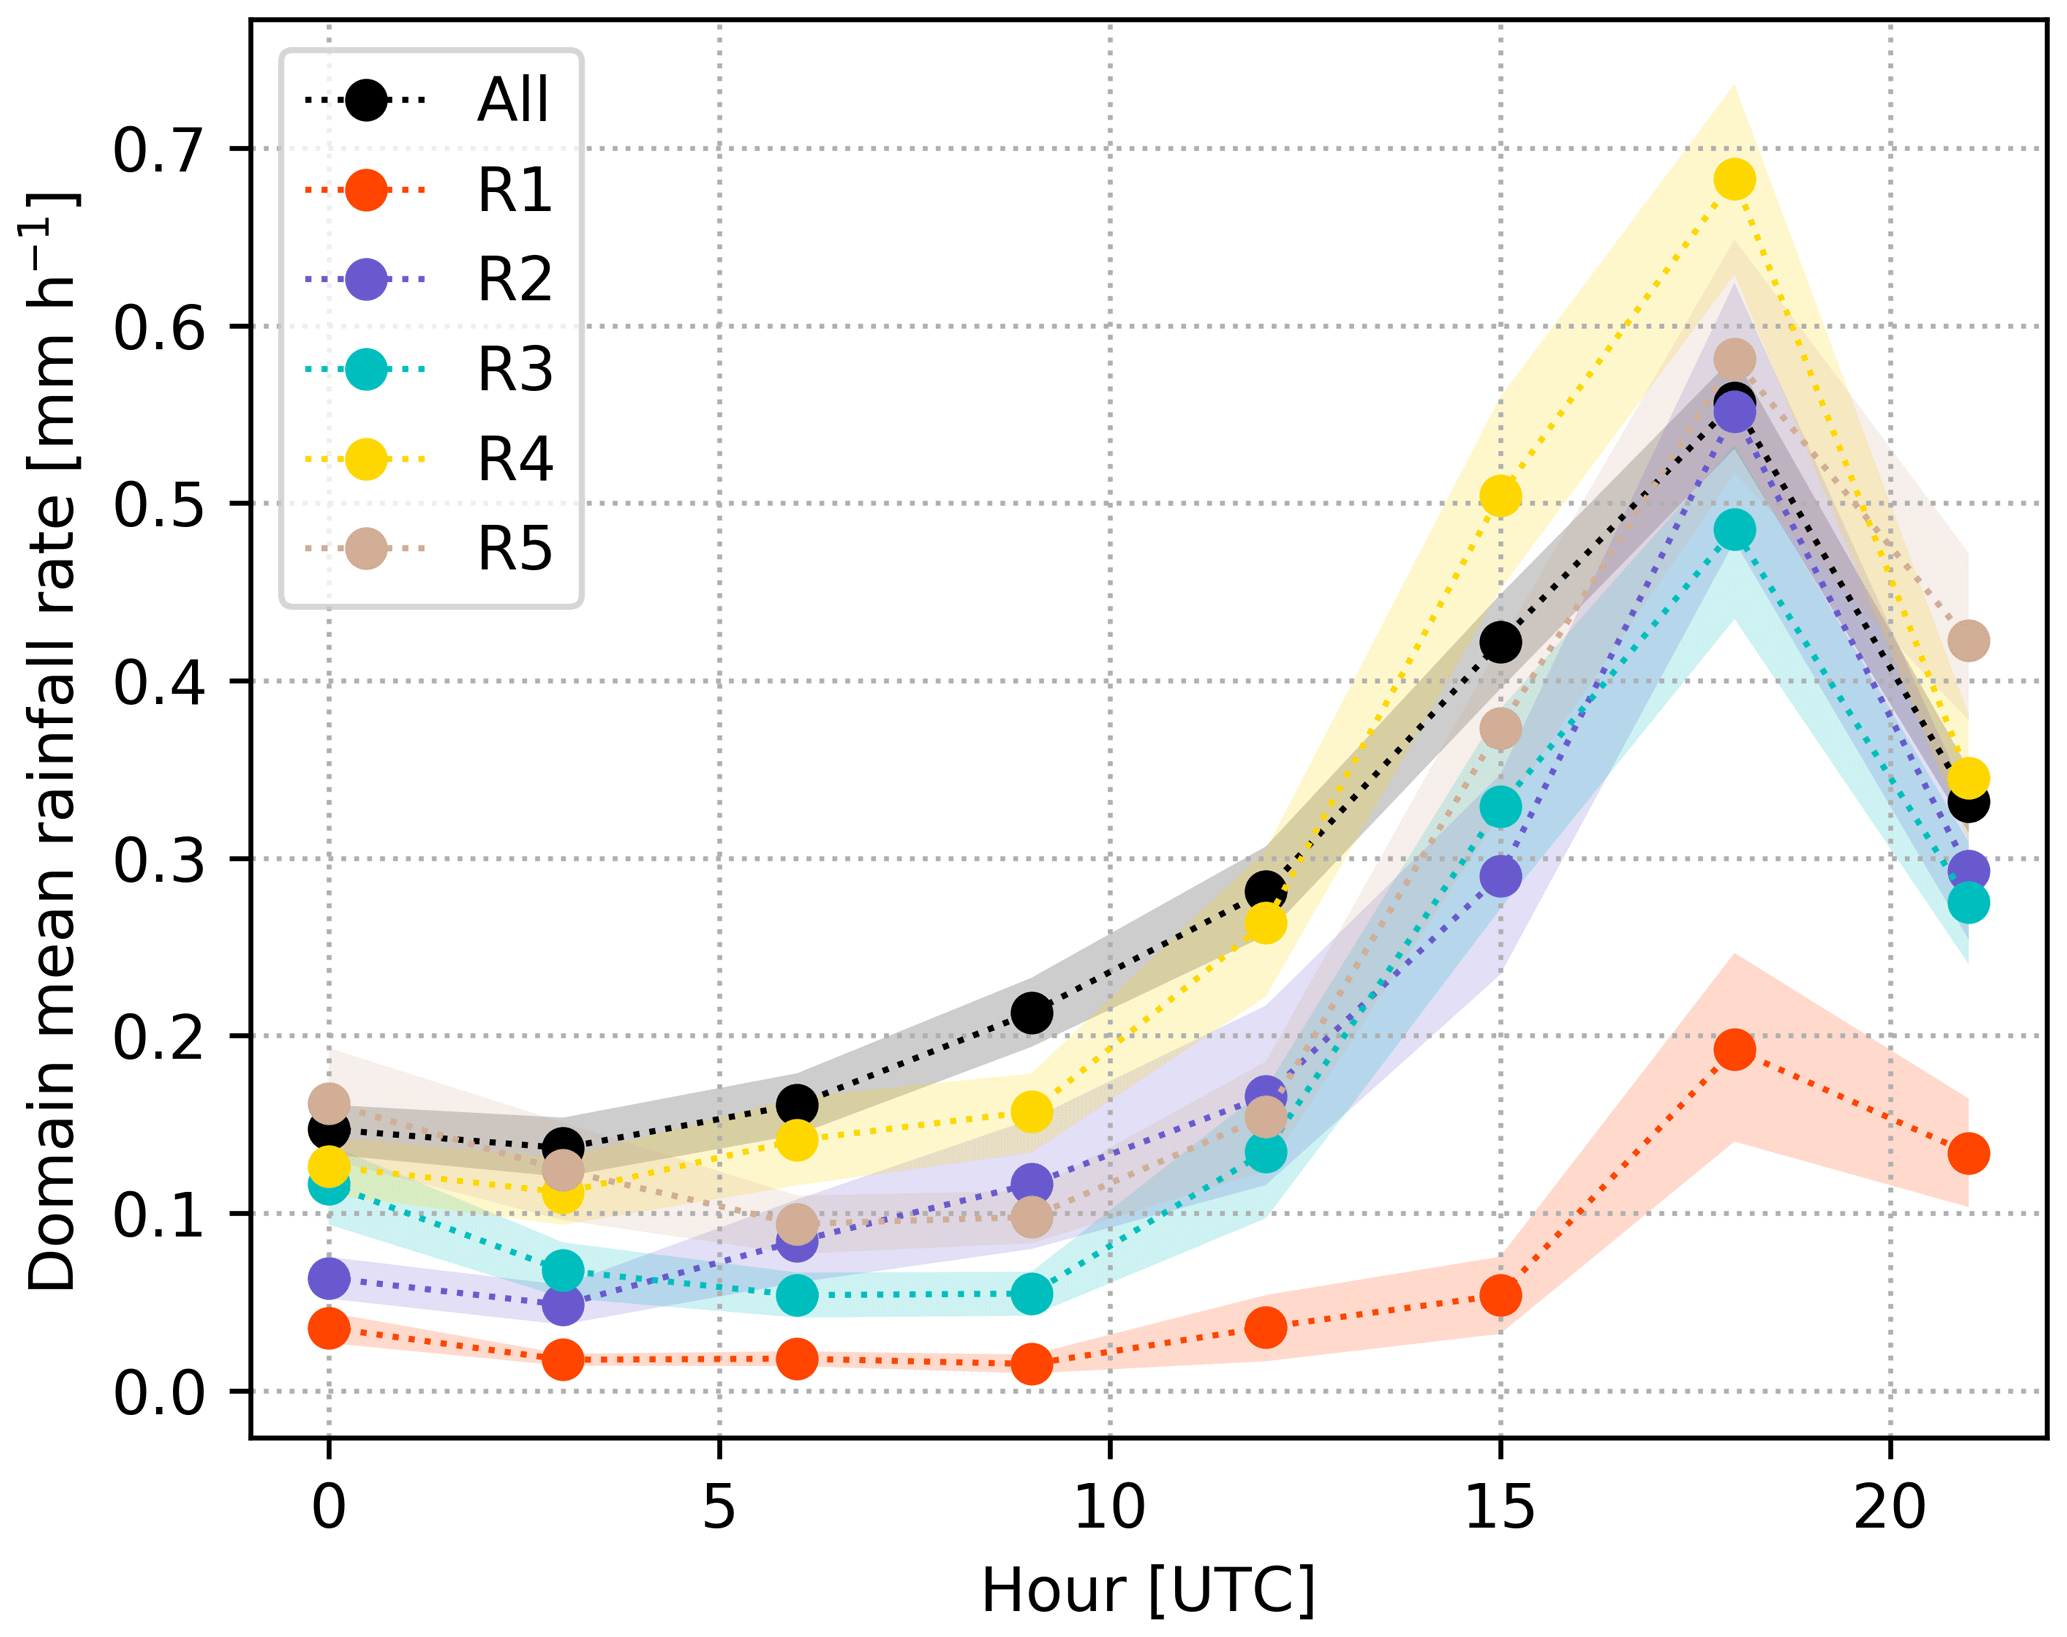
Figure 11Domain mean precipitation rate (for events with measurable precipitation) from the SIPAM radar to within a 110 km radius of the MAO site. The dotted lines report the dataset mean values, and the shading is 1σ standard deviation.
For radar-derived precipitation rates over the VARANAL domain, as in Fig. 11, the MAO location favors a pronounced daytime diurnal cycle, with peaks occurring after local noon (e.g., 18:00 UTC). The well-behaved diurnal cycle is consistent with climatologies over land from the Tropical Rainfall Measurement Mission (TRMM; Nesbitt and Zipser, 2003; Yang and Smith, 2006; Hirose et al., 2008), but this behavior may be fortuitous since complex land surface cover, topography, and river and sea breeze controls influence precipitation measurements in other parts of the Amazon Basin and potentially mask a well-defined diurnal cycle (e.g., Adams et al., 2015; Burleyson et al., 2016; Machado et al., 2018). The cloudiest times over the MAO column do not perfectly align with domain mean precipitation properties, but the times with the most frequent clouds we observe in Figs. 9 and 11 are typically near 18:00 UTC. Still, there are important shifts between various regimes. For example, regime 5 domain mean precipitation from 21:00 UTC into the overnight hours skews higher than the other regimes and is associated with increased MAO column cloudiness (e.g., Fig. 9e). Overall, moist regimes favor more intense rainfall rates, with the highest rainfall rates observed in regime 4, followed by regime 5. Although fewer clouds, smaller total convective area, and lower domain rainfall rates are observed during the drier season, the individual convective events (updrafts, precipitation) can be quite strong (Giangrande et al., 2016; Machado et al., 2018). This is evident from the relatively high domain mean rainfall rates that are observed in regimes 2 and 3 for days when precipitation is recorded.
In Fig. 12, we plot distributions of the maximum daily radar echo area after 12:00 UTC (i.e., largest continuous area from any single radar scan, one assigned per day), occupied by various thresholds for the reflectivity factor, as proxies for deep convective core area coverage (Z>40 dBZ) and widespread rainfall area coverage (Z>20 dBZ). Thus, this measurement is a daily reference for the largest individual cell (any time) and not a measurement for the total convective area occupied by cells. Previous studies, including Giangrande et al. (2016) and Machado et al. (2018), have indicated that rainy seasons favor larger total convective area coverage. In terms of allowance for singular deeper convective cores (Fig. 12a), it is not surprising that regime 4 (e.g., transitional) is associated with the largest convective cells based on higher expectations for MCS. In terms of convective core properties associated with Z>40 dBZ behaviors, multiple drier season distributions share comparable behaviors with regime 5. This is consistent with suggestions that the dry season also promotes isolated, intense convection.
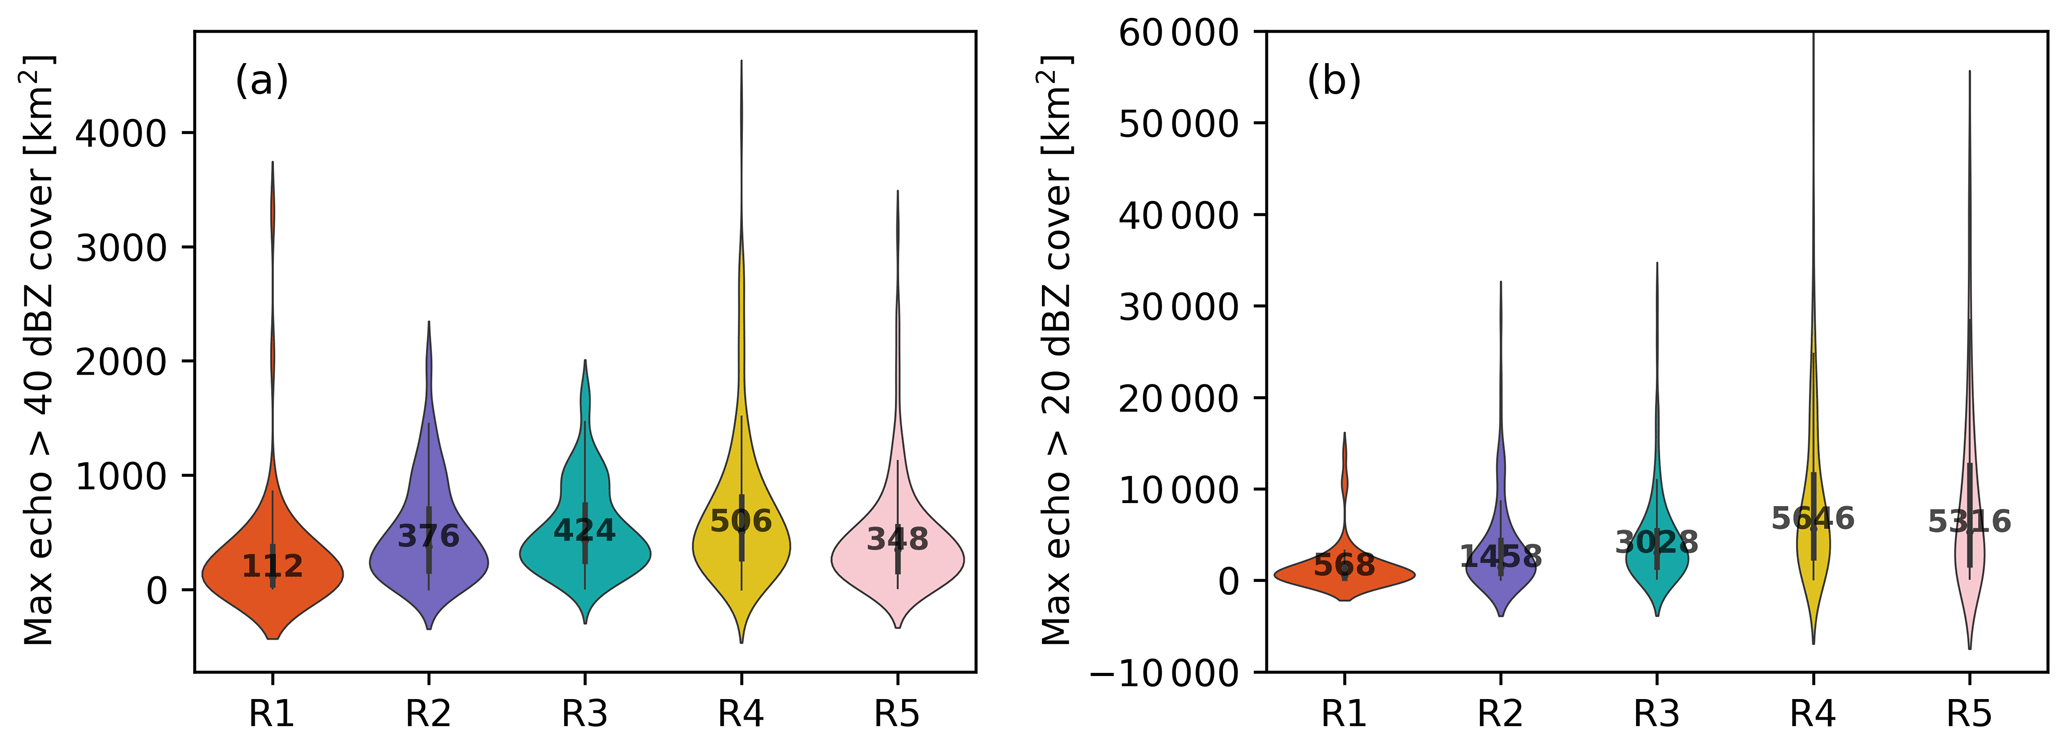
Figure 12As in Fig. 4, the maximum contiguous 2 km Constant Altitude Plan Position Indicator (CAPPI) radar echo coverage (km2) for any radar scan within a regime day that is occupied by radar echoes exceeding an intensity of (a) Z>40 dBZ or (b) Z>20 dBZ for the hours between 12:00 and 00:00 UTC of that day.
Regimes 4 and 5, in contrast, favor a substantially wider distribution of widespread precipitation coverage, as shown in Fig. 12b, when compared to the drier regimes. An increase in widespread precipitation coverage (Z>20 dBZ) is consistent with the arguments for more ubiquitous weak convection and/or MCS having trailing stratiform anvils (e.g., Romatschke and Houze, 2010). Interestingly, this may be interpreted as weaker cells or precipitation winning out over less frequent but stronger cells. This is suggested as being responsible for the reduced domain mean precipitation rates compared to regime 2 (Fig. 11 reflects only contributions from precipitation events). This view would also be consistent with regime 3 being associated with additional congestus and/or periphery stratiform precipitation, enabled through reduced MUCIN and greater humidity above 600 hPa.
4.3 Radar-based null event or MCS event frequency
In addition to compositing clouds by regime, we explore a simple Bayesian approach to query the likelihood a particular regime promotes different precipitation modes, information that is highly useful for convective parameterization and predictive efforts. If convection is initiated for a given regime, what is the likelihood that the convection is nonprecipitating, is isolated, or develops into a widespread precipitation event? In Fig. 13, we break down the likelihood that precipitation events observed during GoAmazon2014/5 fall under nonprecipitating (NULL), isolated precipitating convection (ISO), or wide deeper convective (WDC) events. Among those WDC events, we identify those events having mature-stage MCS characteristics (i.e., MCS is a subset of the WDC events). For this study, NULL events are defined by a minimum area of Z>20 dBZ that is less than 200 km2. For mature MCS definitions, we follow the guidelines established in Houze et al. (2015) and Feng et al. (2018), where MCS is defined as having a continuous 40 dBZ radar echo area exceeding 1000 km2 with a continuous shield of 20 dBZ radar echo areas exceeding 10 000 km2. WDC events are defined as the precipitation events having a continuous, widespread shield of 20 dBZ echo exceeding 10 000 km2. For simplicity, ISO events are defined as the remaining events that did not fall within NULL or WDC categories (i.e., NULL + ISO + WDC = total events). For the analysis in Fig. 13, 595 of the 607 rain-free radiosonde days were also observed well by SIPAM.

Figure 13The same as in the previous frequency plots but for the percentage of (a) NULL, (b) isolated, (c) wide deep convection (WDC), and (d) MCS days associated with each regime cluster.
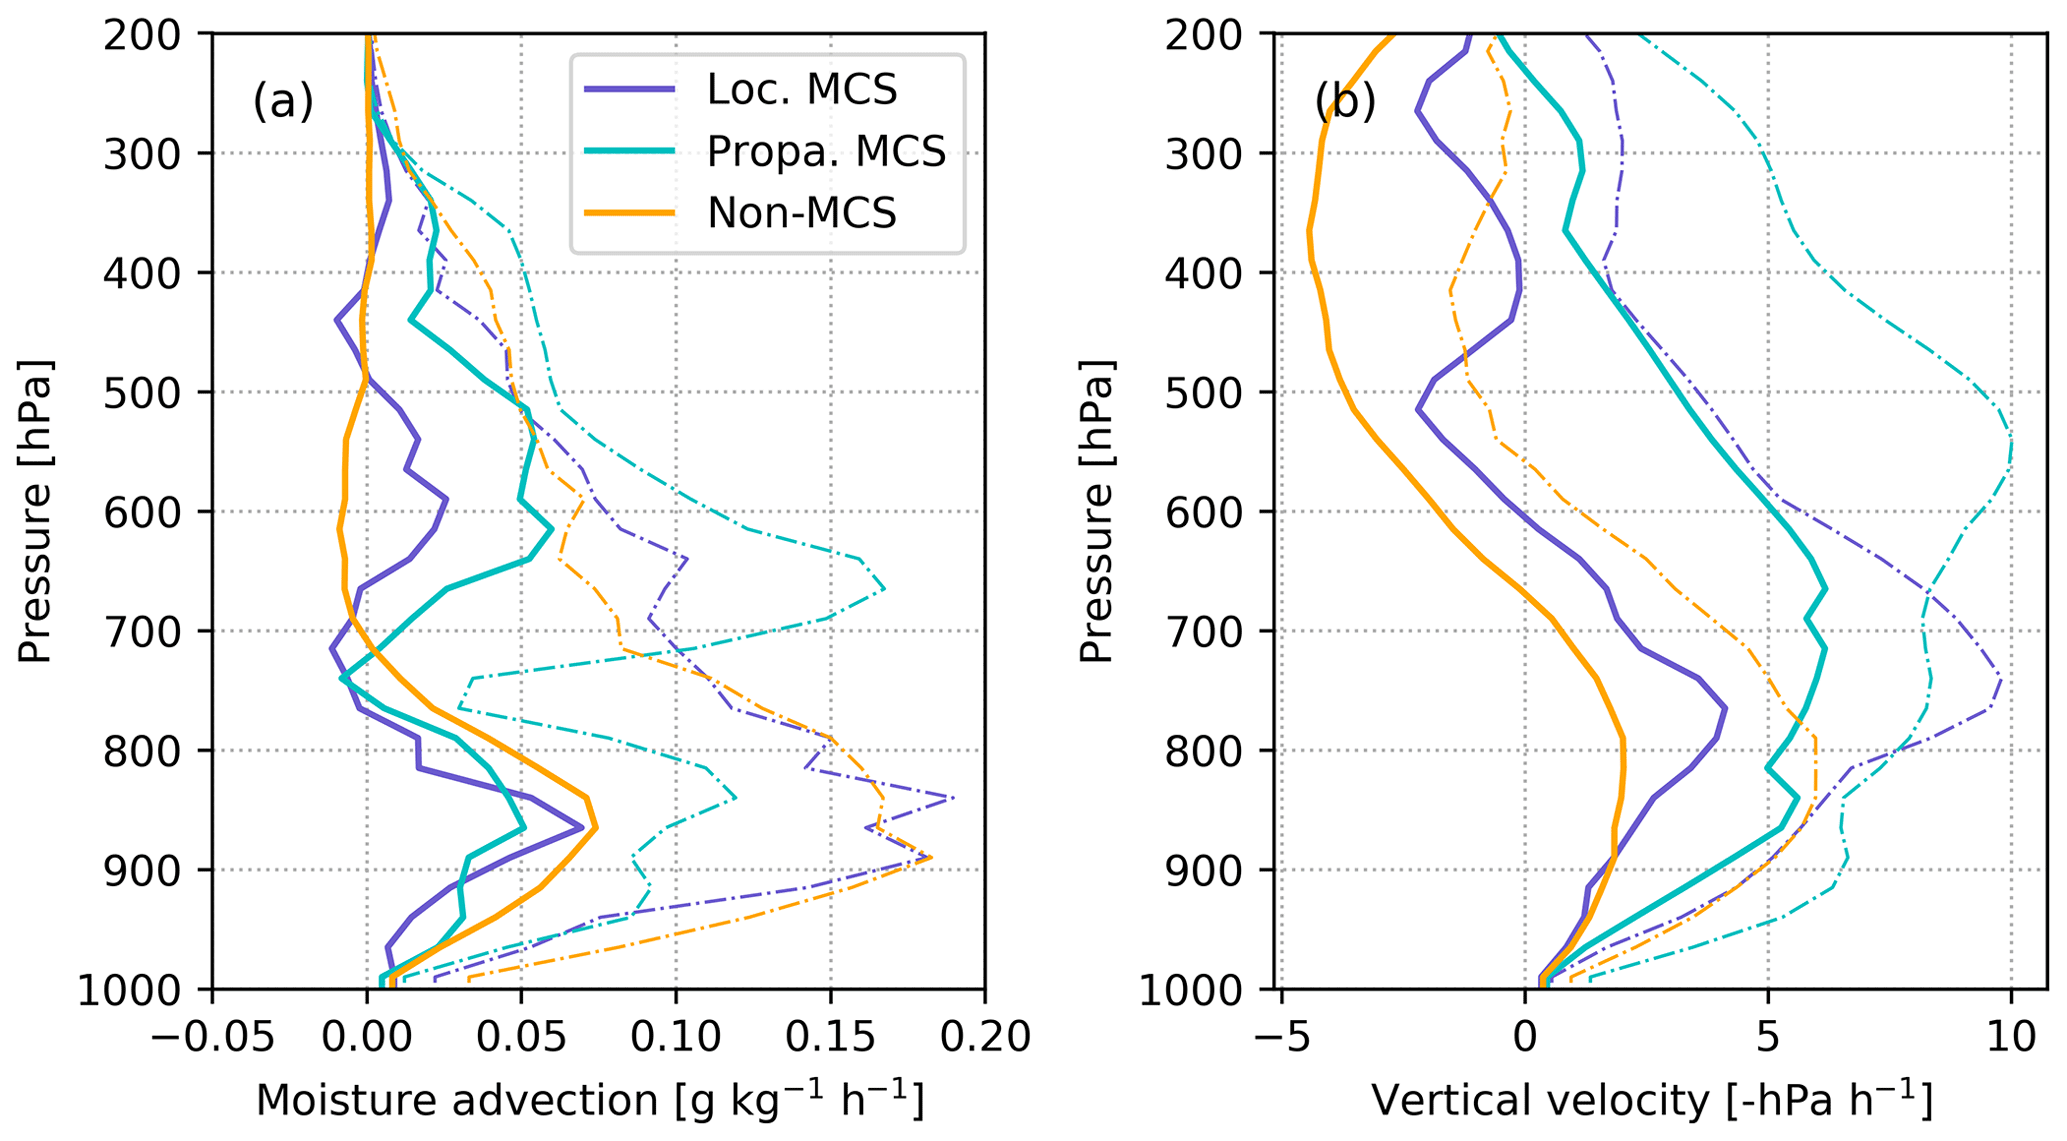
Figure 14Variational forcing profiles at 12:00 UTC for non-MCS, local MCS, and propagating MCS cases with rain rate less than 1.5 mm h−1. Profiles correspond to the regime 4 conditions. Solid lines are median profile values and dashed lines are the 95th percentile values.
Overall, NULL precipitation days are rare, accounting for less than 4 % of our 2-year record (as shown in Fig. 13; Table S2). NULL events were predominantly designated during the driest regimes, with regimes 1 and 2 accounting for 20 of the 23 (87 %) instances. WDC events account for approximately 21 % of the dataset and are commonly observed for regimes 4 and 5 (approximately 81 %). Subsampling those WDC events, radar-based MCS events are relatively uncommon, accounting for approximately 8 % of the dataset. As we plot in Fig. 13, the majority of these MCS events was observed during the moist regimes (regimes 4 and 5 accounting for >70 % of the events), with approximately half of all MCSs observed during regime 4. For completeness, the number of MCSs during GoAmazon2014/5 was approximately double those reported, but we have chosen to ignore radar-based MCSs that produced rainfall over the MAO site at the time of the radiosonde launch. Additional manual inspection of the WDC events also reveals that one-third of WDC events shared MCS-like characteristics but fell short of study thresholds. Thus, potentially 20 % of the campaign period was associated with MCS, although only half are considered for our analysis. Similarly, MCS designations are arbitrary, and we anticipate inconsistencies between this accounting and satellite tracking (e.g., Rehbein et al., 2019). One final consideration is that MCSs do not need to be initiated locally (e.g., within the SIPAM radar domain of ∼500 km) to meet our radar-based definitions. We have inspected radar and satellite observations for 44 of the 47 MCS events to manually identify MCSs from our criteria that were initiated at distances >500 km upstream and then propagated over the site. Table S2 identifies two MCS categories, “propagating” and “local”, as reminiscent of previous Amazon studies (e.g., Greco et al., 1990). By our breakdowns, MCSs during the drier season are predominantly propagating events, while moist regimes include contributions from both MCS categories.
As the regime most associated with mature MCS events, in Figs. S8 and S9 we plot composite radiosonde and parameter distributions (MUCAPE, MUCIN) for regime 4: non-MCS, local (13 events), and propagating (7 events) events. In Fig. 14, we plot a similar MCS breakdown for 12:00 UTC horizontal moisture advection and w from VARANAL. Overall, we do not observe any obvious difference between the composite properties among MCS and non-MCS events within regime 4. Similarities between MCS and non-MCS events are also reflected in the 12:00 UTC variational forcing composites shown in Fig. 14, with local MCS and non-MCS events reflecting comparable mean conditions. Propagating MCS events are less representative of composite behaviors and suggest weaker thermodynamic conditions with the most favorable large-scale controls. However, these large-scale moisture and velocity enhancements are modest (e.g., vertical velocity increase of 2.5–5 hPa h−1).
To provide information on the potential controls for clouds experienced over the Amazon Basin, a cluster analysis was performed on routine radiosondes launched during GoAmazon2014/5. This effort follows similar applications of k-means cluster methods that attempt to objectively disentangle larger-scale cloud and precipitation controls from traditional calendar-driven wet/dry season definitions. We identified five primary thermodynamic regimes and explored these states in the context of traditional Amazon definitions, composite large-scale synoptic patterns, and model forcing datasets. Column and scanning radar observations were projected onto these states, highlighting the propensities for each state to promote different cloud types, frequencies, and changes to precipitation. Emphasis was placed on intra-regime conditions associated with organized convection in the transitional regime (regime 4) most favorable to MCS. Although caution is recommended when considering the findings established over a limited, 2-year GoAmazon2014/5 deployment, a summary of our key findings are as follows.
The k-means clustering of the 12:00 UTC radiosonde datasets yields five primary clusters. The three drier regimes relate different states of mid- to upper-level moisture associated with the strength of similar large-scale features that advect colder/drier air into the Amazon Basin. The wet to transitional clusters exhibit similar deep moisture thermodynamic profiles, with regime 5 associated with evidence of moisture advection into the Amazon Basin from the tropical belt.
GoAmazon2014/5 cloud frequencies, cloud types, and precipitation properties for the five regimes correspond well to bulk changes in the large-scale vertical air motion, moisture advection, local radiosonde thermodynamic composite profile, and convective parameter shifts. Most regimes favor frequent clouds and intense precipitation during the early afternoon hours (after 16:00 UTC), with precipitation following a single-peak diurnal cycle. These results are consistent with cumulative dataset results from the GoAmazon2014/5 deployment (e.g., Collow et al., 2016; Ghate and Kollias, 2016; Zhuang et al., 2017).
The moist regimes were associated with modest MUCAPE, reduced MUCIN, and higher humidity at all levels. The latter two controls are those suggested as being the most favorable in the Amazon for more frequent clouds, deeper convection, and widespread stratiform precipitation. These results are consistent with previous studies on the propensity for stronger updrafts during dry or dry to wet transitional seasons (e.g., Williams et al., 2002; Giangrande et al., 2016; Wang et al., 2019).
Regimes 4 and 5 suggest prominent shallow to deep cloud transitioning (with trimodal cloud profile behaviors observed in regime 5) with the timing of these transitions potentially contingent on the regime. This later daytime transitioning in regime 5 may suggest the transition has been slowed by the reduced incident solar radiation (more frequent shallow clouds in regime 5) or the higher soil moisture values (i.e., smaller Bowen ratio). This transition timing aligns with previous Amazon findings from Zhuang et al. (2017) for wet and transitional season conditions.
The drier regimes reflect reduced column cloud frequency, bimodal instead of trimodal distributions in vertical profiles of cloud frequency, an absence of mid-level cloud contributions, shallow to deep transition signatures, and rainfall properties attributed to weak or isolated (infrequent) deep convection. Although convection is frequently observed during all regimes, dry season regimes exhibit less frequent clouds and rare NULL precipitation events.
When precipitation is observed, SIPAM radar designations indicate that most convection is in isolated, deeper convective cells. Organized convection was relatively frequent over MAO during this 2-year GoAmazon2014/5 deployment (e.g., Rehbein et al., 2019), with approximately 10 %–20 % of the convection observed over MAO associated with MCS. These MCSs were most frequently observed under moist profile conditions (regimes 4 and 5) and over the 12:00 to 00:00 UTC period, with the best-defined MCSs observed during regime 4 GoAmazon2014/5 periods. Approximately half of the well-defined MCSs that passed over MAO fell outside of the typical diurnal cycle and/or were not associated with regime classifications.
When considering regime 4 favorability for deep convective events, it is suggested that intra-regime (pre- and post-dry-season months) variability may account for shifts in favorability for enhanced storm updrafts and/or electrification. However, this study did not identify shifts in composite thermodynamic profiles or convective parameter distributions between MCS and non-MCS conditions. Additional checks of the large-scale synoptic patterns and forcing datasets under MCS and non-MCS conditions indicate that propagating MCSs may favor an enhancement in the large-scale upward vertical motion (2.5–5 hPa h−1) and moisture tendencies during pre-convective windows that offset weaker local thermodynamic environments. However, these factors were arguably less important when compared to overall regime 4 proclivity for MCS.
All ARM data (https://doi.org/10.5439/1025128, Coulter et al., 2009), including VARANAL (https://doi.org/10.5439/1273323, Tang et al., 2001), ARSCL (https://doi.org/10.5439/1027282, Giangrande and Johnson, 2003), SONDE (https://doi.org/10.5439/1021460, Holdridge et al., 1994), and other PI datasets used in this study, can be downloaded at http://www.arm.gov (last access: 25 June 2020) and are associated with several value-added product (VAP) streams and GoAmazon2014/5 PI datasets. Python machine-learning codes were provided by Scikit-learn from Pedregosa et al. (2011). Radiosonde visuals were supported by the Python package MetPy from May et al. (2020, https://doi.org/10.5065/D6WW7G29). ERA5 reanalysis products (production) are available at https://www.ecmwf.int/en/newsletter/147/news/era5-reanalysis-production (last access: 29 April 2019) from from Hersbach and Dee (2016).
The supplement related to this article is available online at: https://doi.org/10.5194/acp-20-7489-2020-supplement.
SEG, DW, and DBM designed the research, SEG and DW performed the research, and SEG and DBM wrote the paper.
The authors declare that they have no conflict of interest.
This article is part of the special issue Observations and Modeling of the Green Ocean Amazon (GoAmazon2014/5) (ACP/AMT/GI/GMD inter-journal SI). It is not associated with a conference.
This study was supported by the U.S. Department of Energy (DOE) Atmospheric System Research (ASR) program and the Climate Model Development and Validation (CMDV) program. Co-author David B. Mechem was funded by the U.S. Department of Energy's Atmospheric Systems Research grant DE-SC0016522. The authors are grateful to Luiz Machado (INPE), Ernani de Lima Nascimento (UFSM), Jiwen Fan (PNNL), and Andreas Prein (NCAR) for their comments and discussion. The authors would also wish to thank our three reviewers, David K. Adams (UNAM), Alan K. Betts (Atmospheric Research), and Yizhou Zhuang (UCLA), who provided their time and thoughtful suggestions towards significantly improving this paper.
This research has been supported by the U.S. Department of Energy (grant nos. DE‐SC0012704 and DE-SC0016522).
This paper was edited by Maria Assuncao Silva Dias and reviewed by David Adams, Yizhou Zhuang, and Alan K. Betts.
Adams, D. K., Gutman, S., Holub, K., and Pereira, D.: GNSS Observations of Deep Convective timescales in the Amazon, 2013, Geophys. Res. Lett., 40, 1–6, https://doi.org/10.1002/grl.50573, 2013.
Adams, D. K., Fernandes, R. M., Holub, K. L., Gutman, S. I., Barbosa, H. M., Machado, L. A., Calheiros, A. J., Bennett, R. A., Kursinski, E. R., Sapucci, L. F., DeMets, C., Chagas, G. F., Arellano, A., Filizola, N., Amorim Rocha, A. A., Silva, R. A., Assunção, L. M., Cirino, G. G., Pauliquevis, T., Portela, B. T., Sá, A., de Sousa, J. M., and Tanaka, L. M.: The Amazon Dense GNSS Meteorological Network: A New Approach for Examining Water Vapor and Deep Convection Interactions in the Tropics, B. Am. Meteorol. Soc., 96, 2151–2165, https://doi.org/10.1175/BAMS-D-13-00171.1, 2015.
Alcântara, C. R., Silva Dias, M. A. F., Souza, E. P., and Cohen, J. C. P.: Verification of the role of the low level jets in Amazon squall lines, Atmos. Res., 100, 36–44, https://doi.org/10.1016/j.atmosres.2010.12.023, 2011.
Anber, U., Gentine, P., Wang, S. G., and Sobel, A. H.: Fog and rain in the Amazon, P. Natl. Acad. Sci. USA, 112, 11473–11477, 2015.
Benedict, J. J. and Randall, D. A.: Observed characteristics of the MJO relative to maximum rainfall, J. Atmos. Sci., 64, 2332–2354, https://doi.org/10.1175/JAS3968.1, 2007.
Betts, A. K., Fuentes, J. D., Garstang, M., and Ball, J. H.: Surface diurnal cycle and boundary layer structure over Rondonia during the rainy season, J. Geophys. Res., 107, 8065, https://doi.org/10.1029/2001jd000356, 2002.
Bryan, G. H. and Fritsch, J. M.: A Benchmark Simulation for Moist Nonhydrostatic Numerical Models, Mon. Weather Rev., 130, 2917–2928, 2002.
Burleyson, C. D., Long, C. N., and Comstock, J. M.: Quantifying Diurnal Cloud Radiative Effects by Cloud Type in the Tropical Western Pacific, J. Appl. Meteorol. Clim., 54, 1297–1312, 2015.
Burleyson, C. D., Feng, Z., Hagos, S. M., Fast, J., Machado, L. A. T., and Martin, S. T.: Spatial Variability of the Back-ground Diurnal Cycle of Deep Convection around the GoAmazon2014/5 Field Campaign Sites, J. Appl. Meteorol. Clim., 55, 1579–1598, https://doi.org/10.1175/JAMC-D-15-0229.1, 2016.
Carvalho, L. M. V., Jones, C., and Liebmann, B.: The South Atlantic Convergence Zone: Intensity, Form, Persistence, and Relationships with Intraseasonal to Interannual Activity and Extreme Rainfall, J. Climate, 17, 88–108, 2004.
Chakraborty, S., Schiro, K. A., Fu, R., and Neelin, J. D.: On the role of aerosols, humidity, and vertical wind shear in the transition of shallow-to-deep convection at the Green Ocean Amazon 2014/5 site, Atmos. Chem. Phys., 18, 11135–11148, https://doi.org/10.5194/acp-18-11135-2018, 2018.
Chakraborty, S., Jiang, J. H., Su, H., and Fu, R.: Deep convective evolution from shallow clouds over the Amazon and Congo rainforests, J. Geophys. Res.-Atmos., 125, e2019JD030962, https://doi.org/10.1029/2019JD030962, 2020.
Cifelli, R., Petersen, W. A., Carey, L. D., Rutledge, S. A., and da Silva Dias, M. A. F.: Radar observations of the kinematic, microphysical, and precipitation characteristics of two MCSs in TRMM LBA. J. Geophys. Res., 107, 8077, https://doi.org/10.1029/2000JD000264, 2002.
Clothiaux, E. E., Ackerman, T. P., Mace, G. G., Moran, K. P., Marchand, R. T., Miller, M. A., and Martner, B. E.: Objective determination of cloud heights and radar reflectivities using a combination of active remote sensors at the ARM CART sites, J. Appl. Meteorol., 39, 645–665, https://doi.org/10.1175/1520-0450(2000)039<0645:ODOCHA>2.0.CO;2, 2000.
Collow, A. B. M., Miller, M. A., and Trabachino, L. C.: Cloudiness over the Amazon rainforest: Meteorology and thermodynamics, J. Geophys. Res.-Atmos., 121, 7990–8005, https://doi.org/10.1002/2016JD024848, 2016.
Coulter, R., Martin, T., and Muradyan, P.: Atmospheric Radiation Measurement (ARM): Climate Research Facility, Updated hourly, Radar Wind Profiler (1290RWP-PRECIPMOM), Atmospheric Radiation Measurement (ARM) Climate Research Facility Data Archive, Oak Ridge, Tenn, https://doi.org/10.5439/1025128 (last access: 1 April 2019), 2009.
Del Genio, A. D.: Representing the sensitivity of convective cloud systems to tropospheric humidity in general circulation models, Surv. Geophys., 33, 637–656, https://doi.org/10.1007/s10712-011-9148-9, 2012.
Drumond, A., Marengo, J., Ambrizzi, T., Nieto, R., Moreira, L., and Gimeno, L.: The role of the Amazon Basin moisture in the atmospheric branch of the hydrological cycle: a Lagrangian analysis, Hydrol. Earth Syst. Sci., 18, 2577–2598, https://doi.org/10.5194/hess-18-2577-2014, 2014
Fan, J., Rosenfeld, D., Zhang, Y., Giangrande, S. E., Li, Z., Machado, L., Martin, S. T., Yang, Y., Wang, J., Artaxo, P., Barbosa, H., Braga, R. C., Comstock, J. M., Feng, Z., Gao, W., Gomes, H. B., Mei, F., Pöhlker, C., Pöhlker, M. L., Pöschl, U., and de Souza, R. A. F.: Substantial convection and precipitation enhancements by ultrafine aerosol particles, Science, 359, 411–418, https://doi.org/10.1126/science.aan8461, 2018.
Feng, Z. and Giangrande, S.: Merged RWP-WACR-ARSCL Cloud Mask and Cloud Type, USA, https://doi.org/10.5439/1462693, 2018.
Feng, Z., Leung, L. R., Houze Jr., R. A., Hagos, S., Hardin, J., Yang, Q., Han, B., and Fan, J.: Structure and evolution of mesoscale convective systems: Sensitivity to cloud microphysics in convection-permitting simulations over the United States, J. Adv. Model. Earth Sy., 10, 1470–1494, https://doi.org/10.1029/2018MS001305, 2018.
Findell, K. L. and Eltahir, E. A.: Atmospheric controls on soil moisture-boundary layer interactions. Part I: Framework development, J. Hydrometeorol., 4, 552–569, 2003a.
Findell, K. L. and Eltahir, E. A.: Atmospheric controls on soil moisture-boundary layer interactions. Part II: Feedbacks within the continental United States, J. Hydrometeorol., 4, 570–583, 2003b.
Fu, R., Zhu, B., and Dickinson, R.: How do the atmosphere and land surface influence the seasonal changes of convection in tropical Amazon?, J. Climate, 12, 1306–1321, 1999.
Gerken, T., Ruddell, B. L., Fuentes, J. D., Araúdo, A., Brunsell, N. A., Maia, J., Manzi, A., Mercer, J., dos Santos, R. N., von Randow, C., and Stoy, P. C.: Investigating the mechanism responsible for the lack of surface energy balance closure in a central Amazonian tropical rainforest, Agr. Forest Meteorol., 255, 92–103, https://doi.org/10.1016/j.agrformet.2017.03.023, 2018.
Ghate, V. P. and Kollias, P.: On the Controls of Daytime Precipitation in the Amazonian Dry Season, J. Hydrometeorol., 17, 3079–3097, https://doi.org/10.1175/JHM-D-16-0101.1, 2016.
Giangrande, S.: Calibrated Radar Wind Profiler Precipitation Observations and Vertical Velocity Retrievals, USA, https://doi.org/10.5439/1440997, 2018.
Giangrande, S. and Johnson, K.: Atmospheric Radiation Measurement (ARM) user facility, updated hourly, Active Remote Sensing of CLouds (ARSCL1CLOTH), ARM Mobile Facility (MAO) Manacapuru, Amazonas, Brazil, AMF1 (M1), ARM Data Center, https://doi.org/10.5439/1027282 (last access: 1 April 2019), 2003.
Giangrande, S. E., Collis, S., Theisen, A. K., and Tokay, A.: Precipitation Estimation from the ARM Distributed Radar Network during the MC3E Campaign, J. Appl. Meteor. Clim., 53, 2130–2147, https://doi.org/10.1175/JAMC-D-13-0321.1, 2014.
Giangrande, S. E., Toto, T., Jensen, M. P., Bartholomew, M. J.,Feng, Z., Protat, A., Williams, C. R., Schumacher, C., and Machado, L.: Convective cloud vertical velocity and mass-flux characteristics from radar wind profiler observations during GoAmazon2014/5, J. Geophys. Res.-Atmos., 121, 12891–12913, https://doi.org/10.1002/2016JD025303, 2016.
Giangrande, S. E., Feng, Z., Jensen, M. P., Comstock, J. M., Johnson, K. L., Toto, T., Wang, M., Burleyson, C., Bharadwaj, N., Mei, F., Machado, L. A. T., Manzi, A. O., Xie, S., Tang, S., Silva Dias, M. A. F., de Souza, R. A. F., Schumacher, C., and Martin, S. T.: Cloud characteristics, thermodynamic controls and radiative impacts during the Observations and Modeling of the Green Ocean Amazon (GoAmazon2014/5) experiment, Atmos. Chem. Phys., 17, 14519–14541, https://doi.org/10.5194/acp-17-14519-2017, 2017.
Greco, S., Swap, R., Garstang, M., Ulanski, S., Shipham, M., Harriss, R. C., Talbot, R., Andreae, M. O., and Artaxo, P.: Rainfall and surface kinematic conditions over central Amazonia during ABLE 2B, J. Geophys. Res.-Atmos., 95, 17001–17014, https://doi.org/10.1029/JD095iD10p17001, 1990.
Hersbach, H. and Dee, D.: ERA5 reanalysis is in production, ECMWF Newsletter, Vol. 147, p. 7, available at: https://www.ecmwf.int/en/newsletter/147/news/era5-reanalysis-production (last access: 14 November 2018), 2016.
Hirose, M., Oki, R., Shimizu, S., Kachi, M., and Higashiuwatoko, T.: Finescale diurnal rainfall statistics refined from eight years of TRMM PR data, J. Appl. Meteorol. Clim., 47, 544–561, 2008.
Hohenegger, C. and Stevens, B.: Preconditioning deep convection with cumulus convection, J. Atmos. Sci., 70, 448–464, https://doi.org/10.1175/JAS-D-12-089.1, 2013.
Holdridge, D., Ritsche, M., Coulter, R., Kyrouac, J., and Keeler, E.: Atmospheric Radiation Measurement (ARM) user facility, updated hourly, Balloon-Borne Sounding System (SONDEWNPN), ARM Mobile Facility (MAO) Manacapuru, Amazonas, Brazil, AMF1 (M1), ARM Data Center, https://doi.org/10.5439/1021460 (last access: 1 April 2019), 1994.
Houze, R. A.: Mesoscale convective systems, Rev. Geophys., 42, RG4003, https://doi.org/10.1029/2004RG000150, 2004.
Houze Jr., R. A., Rasmussen, K. L., Zuluaga, M. D., and Brodzik, S. R.: The variable nature of convection in the tropics and subtropics: A legacy of 16 years of the Tropical Rainfall Measuring Mission satellite. Rev. Geophys., 53, 994–1021, https://doi.org/10.1002/2015RG000488, 2015.
Jensen, M. P. and Del Genio, A. D.: Factors limiting convective cloud-top height at the ARM Nauru island climate research facility, J. Climate, 19, 2105–2117, 2006.
Jensen, M. P., Toto, T., Troyan, D., Ciesielski, P. E., Holdridge, D., Kyrouac, J., Schatz, J., Zhang, Y., and Xie, S.: The Midlatitude Continental Convective Clouds Experiment (MC3E) sounding network: operations, processing and analysis, Atmos. Meas. Tech., 8, 421–434, https://doi.org/10.5194/amt-8-421-2015, 2015.
Johnson, R. H., Rickenbach, T. M., Rutledge, S. A., Ciesielski, P. E., and Schubert, W. H.: Trimodal Characteristics of Tropical Convection, J. Climate, 12, 2397–2418, 1999.
Jones, A. R. and Brunsell, N. A.: Energy balance partitioning and net radiation controls on soil moisture-precipitation feedbacks, Earth Interact., 13, 1–25, 2009.
Khairoutdinov, M. and Randall, D.: High-resolution simulation of shallow-to-deep convection transition over land, J. Atmos. Sci., 63, 3421–3436, 2006.
Klein, S. A. and Del Genio, A. D.: ARM's Support for GCM Improvement: A White Paper, U.S. Department of Energy, DOE/SC-ARM/P-06-012, Washington, D.C., 2006.
Kousky, V. E.: Pentad outgoing longwave radiation climatology for the South America sector, Revista Brasilera de Meteorología, 3, 217–231, 1988.
Liebmann, B. and Marengo, J.: Interannual Variability of the Rainy Season and Rainfall in the Brazilian Amazon Basin, J. Climate, 14, 4308–4318, 2001.
Louf, V., Jakob, C., Protat, A., Bergemann, M., and Narsey, S.: The relationship of cloud number and size with their large-scale environment in deep tropical convection, Geophys. Res. Lett., 46, 9203–9212, 2019.
Machado, L. A. T., Laurent, H., Dessay, N., and Miranda, I.: Sea-sonal and diurnal variability of precipitation over Amazon and its impact on convection over the Amazonia: A comparison of different vegetation types and large scale forcing, Theor. Appl. Climatol., 78, 61–77, https://doi.org/10.1007/s00704-004-0044-9, 2004.
Machado, L. A. T., Calheiros, A. J. P., Biscaro, T., Giangrande, S., Silva Dias, M. A. F., Cecchini, M. A., Albrecht, R., Andreae, M. O., Araujo, W. F., Artaxo, P., Borrmann, S., Braga, R., Burleyson, C., Eichholz, C. W., Fan, J., Feng, Z., Fisch, G. F., Jensen, M. P., Martin, S. T., Pöschl, U., Pöhlker, C., Pöhlker, M. L., Ribaud, J.-F., Rosenfeld, D., Saraiva, J. M. B., Schumacher, C., Thalman, R., Walter, D., and Wendisch, M.: Overview: Precipitation characteristics and sensitivities to environmental conditions during GoAmazon2014/5 and ACRIDICON-CHUVA, Atmos. Chem. Phys., 18, 6461–6482, https://doi.org/10.5194/acp-18-6461-2018, 2018.
Madden, R. A. and Julian, P. R.: Observations of the 40–50 day tropical oscillation: a review, Mon. Weather Rev., 122, 814–837, 1994.
Mapes, B. E. and Houze Jr., R. A.: Diabatic divergence profiles in western Pacific mesoscale convective systems, J. Atmos. Sci., 52, 1807–1828, 1995.
Mapes, B. E. and Zuidema, P.: Radiative–dynamical consequences of dry tongues in the tropical troposphere, J. Atmos. Sci., 53, 620–638, 1996.
Marengo, J. A., Fisch, G. F., Alves, L. M., Sousa, N. V., Fu, R., and Zhuang, Y.: Meteorological context of the onset and end of the rainy season in Central Amazonia during the GoAmazon2014/5, Atmos. Chem. Phys., 17, 7671–7681, https://doi.org/10.5194/acp-17-7671-2017, 2017.
Martin, S. T., Artaxo, P., Machado, L. A. T., Manzi, A. O., Souza, R. A. F., Schumacher, C., Wang, J., Andreae, M. O., Barbosa, H. M. J., Fan, J., Fisch, G., Goldstein, A. H., Guenther, A., Jimenez, J. L., Pöschl, U., Silva Dias, M. A., Smith, J. N., and Wendisch, M.: Introduction: Observations and Modeling of the Green Ocean Amazon (GoAmazon2014/5), Atmos. Chem. Phys., 16, 4785–4797, https://doi.org/10.5194/acp-16-4785-2016, 2016.
Martin, S. T., Artaxo, P., Machado, L., Manzi, A. O., Souza, R. A., Schumacher, C., Wang, J., Biscaro, T., Brito, J., Calheiros, A., Jardine, K., Medeiros, A., Portela, B., de Sá, S. S., Adachi, K., Aiken, A. C., Albrecht, R., Alexander, L., Andreae, M. O., Barbosa, H. M., Buseck, P., Chand, D., Comstock, J. M., Day, D. A., Dubey, M., Fan, J., Fast, J., Fisch, G., Fortner, E., Giangrande, S., Gilles, M., Goldstein, A. H., Guenther, A., Hubbe, J., Jensen, M., Jimenez, J. L., Keutsch, F. N., Kim, S., Kuang, C., Laskin, A., McKinney, K., Mei, F., Miller, M., Nascimento, R., Pauliquevis, T., Pekour, M., Peres, J., Petäjä, T., Pöhlker, C., Pöschl, U., Rizzo, L., Schmid, B., Shilling, J. E., Dias, M. A., Smith, J. N., Tomlinson, J. M., Tóta, J., and Wendisch, M.: The Green Ocean Amazon Experiment (GoAmazon2014/5) Observes Pollution Affecting Gases, Aerosols, Clouds, and Rainfall over the Rain Forest, B. Am. Meteorol. Soc., 98, 981–997, 2017.
Mather, J. H. and Voyles, J. W.: The Arm Climate Research Facility:A Review of Structure and Capabilities, B. Am. Meteorol. Soc., 94, 377–392, 2013.
May, P. T. and Ballinger, A.: The Statistical Characteristics of Convective Cells in a Monsoon Regime (Darwin, Northern Australia), Mon. Weather Rev., 135, 82–92, https://doi.org/10.1175/MWR3273.1, 2007
May, R. M., Arms, S. C., Marsh, P., Bruning, E., Leeman, J. R., Goebbert, K., Thielen, J. E., and Bruick, Z.: MetPy: A Python Package for Meteorological Data. Version 0.12.1.post2, Unidata, https://doi.org/10.5065/D6WW7G29 (available at: https://github.com/Unidata/MetPy, last access: 21 April 2020), 2020.
McFarlane, S. A., Long, C. N., and Flaherty, J.: A climatology of surface cloud radiative effects at the ARM tropical western Pacific sites, J. Appl. Meteorol. Clim., 52, 996–1013, https://doi.org/10.1175/Jamc-D-12-0189.1, 2013.
Mechem, D. B. and Oberthaler, A. J.: Numerical simulation of tropical cumulus congestus during TOGA COARE, J. Adv. Model. Earth Sy., 5, 623–637, https://doi.org/10.1002/jame.20043, 2013.
Mechem, D. B. and Giangrande, S. E.: The challenge of identifying controls on cloud properties and precipitation onset for cumulus congestus sampled during MC3E, J. Geophys. Res.-Atmos., 123, 3126–3144, https://doi.org/10.1002/2017JD027457, 2018.
Miller, M. A., Nitschke, K., Ackerman, T. P., Ferrell, W. R., Hickmon, N., and Ivey, M.: The ARM Mobile Facilities, Meteorol. Monogr., 57, 9.1–9.15, https://doi.org/10.1175/AMSMONOGRAPHS-D-15-0051.1, 2016.
Misra, V.: Coupled air, sea, and land interactions of the South American monsoon, J. Climate, 21, 6389–6403, https://doi.org/10.1175/2008JCLI2497.1, 2008.
Nesbitt, S. W. and Zipser, E. J.: The diurnal cycle of rainfall and convective intensity according to three years of TRMM measurements, J. Climate, 16, 1456–1475, 2003.
Nuijens, L. and Emanuel, K.: Congestus modes in circulating equilibria of the tropical atmosphere in a two-column model, Q. J. Roy. Meteor. Soc., 144, 2676–2692, https://doi.org/10.1002/qj.3385, 2018.
Pakula, L. and Stephens, G. L.: The role of radiation in influencing tropical cloud distributions in a radiative–convective equilibrium cloud-resolving model, J. Atmos. Sci., 66, 62–76, 2009.
Parker, M. D. and Johnson, R. H.: Organizational modes of midlatitude mesoscale convective systems, Mon. Weather Rev., 128, 3413–3436, https://doi.org/10.1175/1520-0493(2001)129<3413:OMOMMC>2.0.CO;2, 2000.
Peterson, W. A., Nesbitt, S. W., Blakeslee, R. J., Cifelli, R., Hein, P., and Rutledge, S. A.: TRMM observations of intraseasonal variability in convective regimes over the Amazon, J. Climate, 15, 1278–1294, 2002.
Pope, M., Jakob, C., and Reeder, M.: Objective classification of tropical mesoscale convective systems, J. Climate, 22, 5797–5808, 2009a.
Pope, M., Jakob, C., and Reeder, M. J.: Regimes of the North Australian Wet Season, J. Climate, 22, 6699–6715, https://doi.org/10.1175/2009JCLI3057.1, 2009b.
Redelsperger, J.-L., Parsons, D. B., and Guichard, F.: Recovery processes and factors limiting cloud-top height following the arrival of a dry intrusion observed during TOGA COARE, J. Atmos. Sci., 59, 2438–2457, 2002.
Rehbein, A., Ambrizzi, T., Mechoso, C. R., Espinosa, S. A. I., and Myers, T. A.: Mesoscale convective systems over the Amazon basin: The GoAmazon2014/5 program, Int. J. Climatol., 39, 5599–5618, https://doi.org/10.1002/joc.6173, 2019.
Romatschke, U. and Houze Jr., R. A.: Extreme summer convection in South America, J. Climate, 23, 3761–3791, 2010.
Rotunno, R., Klemp, J. B., and Weisman, M. L.: A theory for strong, long-lived squall lines, J. Atmos. Sci., 45, 463–485, 1988.
Schumacher, C. and Funk, A.: GoAmazon2014/5 Rain Rates from the SIPAM Manaus S-band Radar, USA, https://doi.org/10.5439/1459578, 2018.
Pedregosa, F., Varoquaux, G., Gramfort, A., Michel, V., Thirion, B., Grisel, O., Blondel, M., Prettenhofer, P., Weiss, R., Dubourg, V., Vanderplas, J., Passos, A., Cournapeau, D., Brucher, M., Perrot, M., and Duchesnay, É.: Scikit-learn: Machine Learning in Python, J. Mach. Learn. Res., 12, 2825–2830, 2011.
Sena, E. T., Dias, M. A., Carvalho, L. M., and Dias, P. L.: Reduced Wet-Season Length Detected by Satellite Retrievals of Cloudiness over Brazilian Amazonia: A New Methodology, J. Climate, 31, 9941–9964, https://doi.org/10.1175/JCLI-D-17-0702.1, 2018.
Sobel, A. H., Nilsson, J., and Polvani, L. M.: The weak temperature gradient approximation and balanced tropical waves, J. Atmos. Sci., 58, 3650–3665, 2001.
Tanaka, L. M. d. S., Satyamurty, P., and Machado, L. A. T.: Diurnal variation of precipitation in central Amazon Basin, Int. J. Climatol., 34, 3574–3584, https://doi.org/10.1002/joc.3929, 2014.
Tang, S., Xie, S., and Zhang, Y.: Atmospheric Radiation Measurement (ARM), Climate Research Facility, updated monthly, SCM-Forcing DATA from variational analysis (VARANAL), 2014-01-01 to 2015-12-31, 3.21297 S 60.5981 W, ARM Mobile Facility (MAO) Manacapuru, Amazonas, Brazil, AMF1 (M1), Atmospheric Radiation Measurement (ARM) Climate Research Facility Data Archive, OakRidge, Tennessee, USA, Data https://doi.org/10.5439/1273323 (last access: 22 July 2016), 2001.
Tang, S., Xie, S., Zhang, Y., Zhang, M., Schumacher, C., Upton, H., Jensen, M. P., Johnson, K. L., Wang, M., Ahlgrimm, M., Feng, Z., Minnis, P., and Thieman, M.: Large-scale vertical velocity, diabatic heating and drying profiles associated with seasonal and diurnal variations of convective systems observed in the GoAmazon2014/5 experiment, Atmos. Chem. Phys., 16, 14249–14264, https://doi.org/10.5194/acp-16-14249-2016, 2016.
Wang, D., Giangrande, S. E., Bartholomew, M. J., Hardin, J., Feng, Z., Thalman, R., and Machado, L. A. T.: The Green Ocean: precipitation insights from the GoAmazon2014/5 experiment, Atmos. Chem. Phys., 18, 9121–9145, https://doi.org/10.5194/acp-18-9121-2018, 2018.
Wang, D., Giangrande, S. E., Schiro, K., Jensen, M. P., and Houze, R. A.: The characteristics of tropical and midlatitude mesoscale convective systems as revealed by radar wind profilers, J. Geophys. Res.-Atmos., 124, 4601–4619, https://doi.org/10.1029/2018JD030087, 2019.
Wang, D., Giangrande, S. E., Feng, Z., Hardin, J. C., and Prein, A. F.: Updraft and Downdraft Core Size and Intensity as Revealed by Radar Wind Profilers: MCS Observations and Idealized Model Comparisons, J. Geophys. Res.-Atmos., 125, e2019JD031774, https://doi.org/10.1029/2019JD031774, 2020.
Weisman, M. L. and Rotunno, R.: A Theory for Strong Long-Lived Squall Lines, J. Atmos. Sci., 61, 361–382, https://doi.org/10.1175/1520-0469(2004)061<0361:ATFSLS>2.0.CO;2, 2004.
Williams, E., Rosenfeld, D., Madden, N., Gerlach, J., Gears, N.,Atkinson, L., Dunnemann, N., Frostrom, G., Antonio, M., Bi-azon, B., Camargo, R., Franca, H., Gomes, A., Lima, M., Machado, R., Manhaes, S., Nachtigall, L., Piva, H., Quintil-iano, W., Machado, L., Artaxo, P., Roberts, G., Renno, N.,Blakeslee, R., Bailey, J., Boccippio, D., Betts, A., Wolff, D.,Roy, B., Halverson, J., Rickenbach, T., Fuentes, J., and Avelino, E.: Contrasting convective regimes over the Amazon: Implications for cloud electrification, J. Geophys. Res., 107, 8082, https://doi.org/10.1029/2001JD000380, 2002.
Wright, J. S., Fu, R., Worden, J. R., Chakraborty, S., Clinton, N. E., Risi, C., Sun, Y., and Yin, L.: Rainforest-initiated wet season onset over the southern Amazon, P. Natl. Acad. Sci. USA, 114, 8481–8486, https://doi.org/10.1073/pnas.1621516114, 2017.
Wu, C.-M., Stevens, B., and Arakawa, A.: What controls the transition from shallow to deep convection?, J. Atmos. Sci., 66, 1793–1806, https://doi.org/10.1175/2008JAS2945.1, 2009.
Wu, M. and Lee, J.-E.: Thresholds for Atmospheric Convection in Amazonian Rainforests, Geophys. Res. Lett., 46, 10024–10033, https://doi.org/10.1029/2019GL082909, 2019.
Xie, S., Zhang, Y., Giangrande, S. E., Jensen, M. P., Mc-Coy, R., and Zhang, M.: Interactions between cumulus convection and its environment as revealed by the MC3E sounding array, J. Geophys. Res.-Atmos., 119, 11784–11808, https://doi.org/10.1002/2014JD022011, 2014.
Yang, S. and Smith, E. A.: Mechanisms for diurnal variability of global tropical rainfall observed from TRMM. J. Climate, 19, 5190–5226, 2006.
Zermeño–Díaz, D. M., Zhang, C., Kollias, P., and Kalesse, H.: The role of shallow cloud moistening in MJO and non-MJO convective events over the ARM Manus site. J. Atmos. Sci., 72, 4797–4820, https://doi.org/10.1175/JAS-D-14-0322.1, 2015.
Zhang, M. and Lin, J.: Constrained Variational Analysis of Sounding Data Based on Column-Integrated Budgets of Mass, Heat, Moisture, and Momentum: Approach and Application to ARM Measurements, J. Atmos. Sci., 54, 1503–1524, 1997.
Zhuang, Y., Fu, R., Marengo, J. A., and Wang, H.: Seasonal variation of shallow-to-deep convection transition and its link to the environmental conditions over the Central Amazon, J. Geophys. Res.-Atmos., 122, 2649–2666, https://doi.org/10.1002/2016JD025993, 2017.
Zhuang, Y., Fu, R., and Wang, H.: How Do Environmental Conditions Influence Vertical Buoyancy Structure and Shallow-to-Deep Convection Transition across Different Climate Regimes?, J. Atmos. Sci., 75, 1909–1932, https://doi.org/10.1175/JAS-D-17-0284.1, 2018.
- Abstract
- Copyright statement
- Introduction
- GoAmazon2014/5 dataset and processing methods
- Thermodynamic and large-scale interpretation of Amazon regime clusters
- Regime cloud and precipitation summaries and likelihood for precipitation extremes
- Summary
- Code and data availability
- Author contributions
- Competing interests
- Special issue statement
- Acknowledgements
- Financial support
- Review statement
- References
- Supplement