the Creative Commons Attribution 4.0 License.
the Creative Commons Attribution 4.0 License.
 | 22 Jun 2020
Reducing uncertainties in satellite estimates of aerosol–cloud interactions over the subtropical ocean by integrating vertically resolved aerosol observations
David Painemal
Fu-Lung Chang
Richard Ferrare
Sharon Burton
Zhujun Li
William L. Smith Jr.
Patrick Minnis
Marian Clayton
Satellite quantification of aerosol effects on clouds relies on aerosol optical depth (AOD) as a proxy for aerosol concentration or cloud condensation nuclei (CCN). However, the lack of error characterization of satellite-based results hampers their use for the evaluation and improvement of global climate models. We show that the use of AOD for assessing aerosol–cloud interactions (ACIs) is inadequate over vast oceanic areas in the subtropics. Instead, we postulate that a more physical approach that consists of matching vertically resolved aerosol data from the Cloud-Aerosol Lidar and Infrared Pathfinder Satellite Observations (CALIPSO) satellite at the cloud-layer height with Moderate Resolution Imaging Spectroradiometer (MODIS) Aqua cloud retrievals reduces uncertainties in satellite-based ACI estimates. Combined aerosol extinction coefficients (σ) below cloud top (σBC) from the Cloud-Aerosol Lidar with Orthogonal Polarization (CALIOP) and cloud droplet number concentrations (Nd) from MODIS Aqua yield high correlations across a broad range of σBC values, with σBC quartile correlations ≥0.78. In contrast, CALIOP-based AOD yields correlations with MODIS Nd of 0.54–0.62 for the two lower AOD quartiles. Moreover, σBC explains 41 % of the spatial variance in MODIS Nd, whereas AOD only explains 17 %, primarily caused by the lack of spatial covariability in the eastern Pacific. Compared with σBC, near-surface σ weakly correlates in space with MODIS Nd, accounting for a 16 % variance. It is concluded that the linear regression calculated from ln(Nd)–ln(σBC) (the standard method for quantifying ACIs) is more physically meaningful than that derived from the Nd–AOD pair.
- Article
(4333 KB) - Full-text XML
- BibTeX
- EndNote


The anthropogenic forcing by aerosols remains one of the most elusive aspects of climate change. Its uncertainty is largely attributed to our lack of understanding of the ways that low clouds, especially marine boundary layer clouds in the subtropics, respond to perturbations in tropospheric aerosols (Boucher et al., 2013). Uncertainty in simulating the aerosol effects on clouds (aerosol indirect effects) is evinced in the large spread of state-of-the-art climate models (e.g., Quaas et al., 2009). In addition, models tend to overestimate the strength of aerosol–cloud interactions (ACIs) relative to those derived from satellites (Quaas et al., 2009). Satellite studies of ACIs typically rely on vertically integrated aerosol properties, namely aerosol optical depth (AOD) or the MODIS aerosol index (AI, the product of daytime Level 3 Ångström exponent and AOD at 550 nm), retrieved over clear-sky scenes. These observations can then be used to quantify the ACIs in terms of fractional change in cloud microphysics relative to fractional changes in aerosol properties (Feingold et al., 2003):
where “c” in Eq. (1) is a cloud microphysical parameter such as cloud effective radius (re), cloud optical thickness, cloud droplet number concentration (Nd), or a metric for the precipitation rate. Since the increase in Nd caused by an increase in cloud condensation nuclei is the fundamental process that leads to the different aerosol–cloud feedbacks, the ACI expressed in terms of c=Nd offers a more direct link to the underlying physics of the aerosol indirect effect. The ACI also allows for a simple way of evaluating models with in situ and satellite observations (e.g., Quaas et al., 2009). However, modeling work by Stier (2016) suggests that the usability of AOD and the aerosol index might be limited as a CCN proxy given the inability of a vertically integrated quantity to resolve the aerosol properties in the boundary layer, where the aerosol-droplet activation typically occurs. The importance of counting on vertically resolved observations was further addressed by Shinozuka et al. (2015), who found better correlations between the concurrent airborne 0.55 µm dry aerosol extinction coefficient and CCN than that for the AOD–CCN pair. In addition to issues attributed to the physical representation of AOD and the aerosol index (AI), their applicability to ACI studies is hindered by retrieval uncertainties attributed to plausible clear-sky contamination, 3-D radiative transfer effects, and aerosol swelling near the cloud edges (e.g., Christensen et al., 2017; Várnai and Marshak, 2018). In sum, the suitability of using satellite-based ACI calculations to evaluate climate models remains uncertain.
Unlike passive satellite sensors, the Cloud-Aerosol Lidar with Orthogonal Polarization (CALIOP) on the Cloud-Aerosol Lidar and Infrared Pathfinder Satellite Observations (CALIPSO) satellite was designed to retrieve aerosol properties with an unprecedented high vertical resolution (Winker et al., 2010). This allows better isolation of the aerosols situated near the cloud layer, and thus more likely to interact with the cloud, from the rest of the atmospheric column. Moreover, CALIOP's better cloud screening, with aerosol retrievals insensitive to 3-D radiative transfer effects, should result in improved aerosol-indirect-effect estimates relative to those determined from passive sensors' measurements alone. Earlier studies over the southeastern Atlantic demonstrated the value of combining the aerosol layer detection capability of CALIOP with passive sensor data from other A-Train satellites (e.g., Costantino and Bréon, 2013; Painemal et al., 2014). To our knowledge, the quantitative use of the vertically resolved CALIOP aerosol extinction coefficient for ACI studies is nearly non-existent in the literature. In this study, we evaluate the use of the CALIOP aerosol extinction coefficient for ACI identification. Specifically, we analyze the benefit of using the near-surface, within-cloud, and above-cloud aerosol extinction coefficient relative to the standard AOD approach. As our interest is to evaluate the value of exploiting the vertically resolved information, we use aerosol extinction coefficient retrievals constrained with a CALIOP-based AOD estimated using the Synergized Optical Depth of Aerosols (SODA) algorithm (Josset et al., 2008, 2015; Painemal et al., 2019). This approach is selected because (a) it enables us to compare vertically resolved CALIOP retrievals against an AOD product (SODA) that is more consistent with other remote-sensing and satellite AODs than the standard CALIOP product (Painemal et al., 2019) and (b) by using both the aerosol extinction coefficient and AOD derived from CALIOP, we can focus on the physical interpretation of the results rather than disentangling instruments and algorithm differences when using two dissimilar aerosol products. Lastly, low-cloud droplet number concentration (Nd) derived from Moderate Resolution Imaging Spectroradiometer (MODIS) Aqua (Grosvenor et al., 2018) is used to quantify aerosol–cloud covariability using different aerosol proxies.
2.1 Dataset
Daytime aerosol retrievals are taken from a new aerosol extinction coefficient (σ) dataset derived from CALIPSO attenuated backscatter and SODA AOD (Painemal et al., 2019). The SODA algorithm estimates AOD by combining surface ocean return from CALIPSO–CALIOP and the CloudSat's Cloud Profiling Radar, and, thus, no additional assumptions about the aerosol type and optical properties are required (Josset et al., 2015). In short, σ is estimated from the lidar equation constrained with SODA AOD by applying the Fernald–Klett iterative algorithm (Fernald, 1984). The CALIOP-S retrievals employed here are estimated at 1 km along-track resolution assuming a constant extinction-to-backscatter ratio (lidar ratio) with height, and cloudless 1 km pixels (according to CALIPSO Vertical Feature Mask version 4) are used in this study. The dataset is self-consistent in the sense that the vertically integrated extinction coefficient is equivalent to CALIOP–SODA AOD. In addition, using the CALIOP–SODA extinction yields excellent agreement with airborne high-spectral-resolution lidar retrievals, with SODA AOD showing a better agreement with MODIS AOD than the standard CALIOP version 4 (v4) product (Painemal et al., 2019). We use CALIOP-S instead of the standard CALIOP v4 product because CALIOP-S does not depend on an aerosol classification scheme, enabling retrievals in occasions when CALIOP v4 does not retrieve properties due to the impossibility of classifying tenuous aerosol layers. CALIOP-S is also advantageous as its 1 km along-track resolution is consistent with that of MODIS, whereas CALIPSO v4 aerosol retrievals are estimated at 5, 20, or 80 km spatial resolution depending on the strength of the aerosol signal. While CALIOP-S agrees better with in situ data than CALIOP v4 over the tropical western Atlantic (Painemal et al., 2019), it is expected that CALIOP v4 would yield results similar to those presented here, given the high correlation between both datasets; however, this will require further analysis beyond the scope of this paper.
Daytime MODIS Aqua retrievals of cloud effective radius (re) and cloud optical depth (τ) at 1 km resolution (at nadir) are estimated using the Clouds and Earth's Radiant Energy System (CERES) Edition 4.0 algorithms (Minnis et al., 2011, 2020). CERES–MODIS re and τ are estimated, respectively, from MODIS 0.64 and 3.79 µm bands, with the latter being less sensitive to three-dimensional radiative effects and biases due to subpixel inhomogeneity than the more widely used 2.1 µm re (Zhang and Platnick, 2011; Painemal et al., 2013). The cloud microphysical variable used in this study is the cloud droplet number concentration Nd, which is estimated using the adiabatic formulation (Painemal and Zuidema, 2011; Grosvenor et al., 2018) as
where ρw is the liquid water density and k is the cubic ratio between the volume mean radius and the effective radius, assumed constant at 0.8 (Martin et al., 1994). The adiabatic lapse rate of condensation (Γ; Albrecht et al., 1990) was calculated using CERES–MODIS cloud-top temperature and pressure. The reader is referred to Grosvenor et al. (2018) for a thorough review on the satellite-based Nd formulation in Eq. (2). For this study, we used 9 months of available collocated CALIOP and MODIS retrievals: April, May, and September 2010 and May to October 2013. The use of boreal spring and summer months should help reduce any role of annual cycle in explaining MODIS–CALIOP correlations.
2.2 Matching method
The first step in the analysis is to develop a method for combining cloud and aerosol retrievals, which is summarized in Fig. 1 and described as follows. For each 1 km CALIOP–SODA retrieval, we select 10 MODIS pixels east and 10 pixels west of the CALIPSO ground track. This configuration considers the fact that aerosol and cloud retrievals cannot be simultaneously retrieved over the same pixel. We further reduce the dataset complexity by averaging CALIOP-S retrievals to achieve a 5 km resolution along the CALIPSO track. Similarly, we average MODIS retrievals every 5 pixels × 5 pixels (km). That is, for each 5 km CALIOP-S retrieval, two contiguous 5 km×5 km averaged MODIS grids are collocated east and west of the 5 km CALIOP-S point (Fig. 1a). Lastly, the collocated aerosol–cloud pair is defined as the 5 km CALIOP-S and 5 km×5 km MODIS retrievals (two grids east and west of CALIOP-S) averaged over 25 km along-track segments (domain of Fig. 1a).
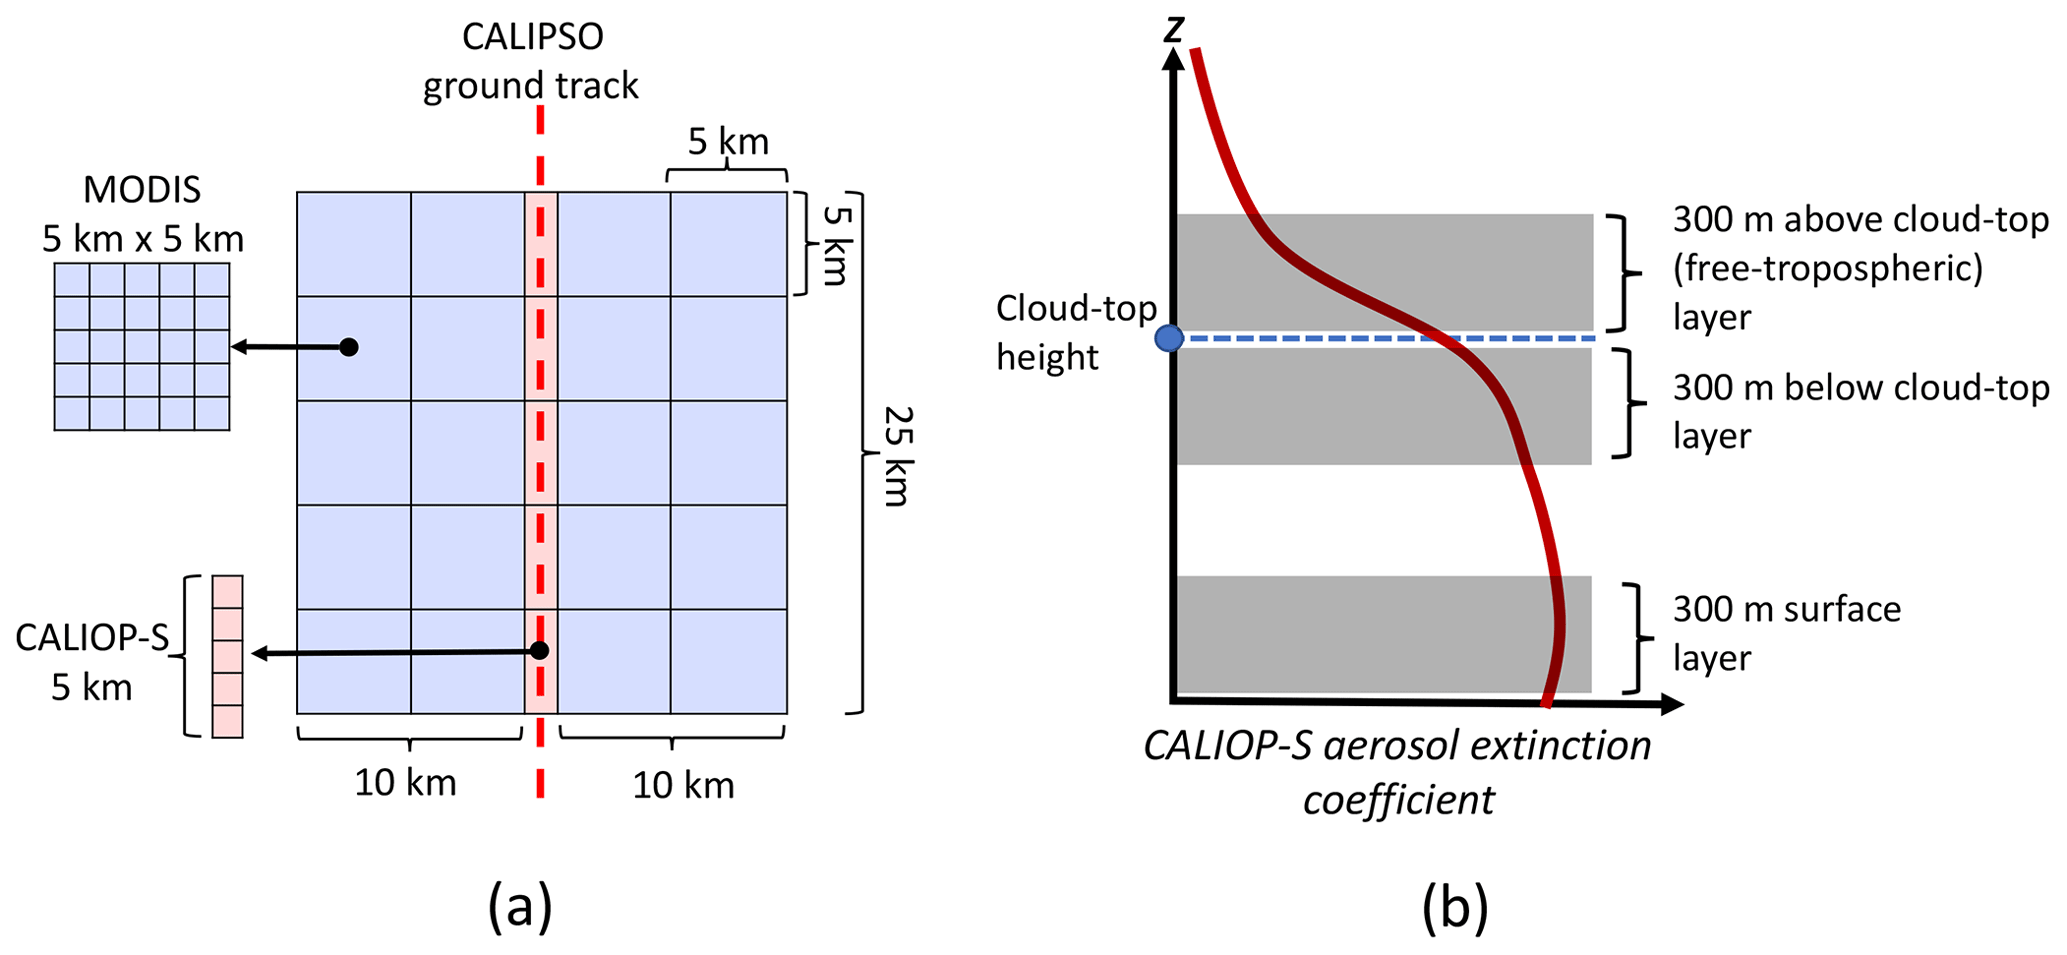
Figure 1(a) Horizontal view of the matching configuration along a 25 km CALIPSO track. Light blue indicates MODIS cloud retrievals, and light red indicates CALIOP-S pixels. (b) Idealized aerosol extinction profile (red) and the location of the 300 m layers used to calculate near-surface, below-cloud-top, and above-cloud-top aerosol extinction coefficient.
The calculation of the near-surface, below-cloud-top, and above-cloud-top aerosol extinction coefficient is summarized in Fig. 1b. First, cloud-top height identification is achieved by means of the CALIOP 333 m cloud-layer product (333 and 30 m, horizontal and vertical resolution, respectively) spatially averaged to 25 km resolution (along track). Next, below- and above-cloud-top σ values are independently calculated as the 300 m averaged layers 60 m below and above cloud-top height. Near-surface σ is estimated for a 300 m depth layer located at 60 m above the surface. The 60 m gap is intended to minimize possible uncertainties in the cloud-top identification and surface contamination.
2.3 Constraining the influence of cloud cover
The extended practice of matching cloudy (cloud retrievals) and neighboring cloudless (aerosol retrievals) pixels for climate research applications raises the question of whether artifacts in aerosol and cloud retrievals, especially in highly inhomogeneous partially cloudy regions, can inadvertently introduce biases in the ACI calculations. While ways for reducing uncertainties in passive AOD for pixels in the vicinity of clouds have been proposed recently (e.g., Christensen et al., 2017), methods applicable to satellite-based ACI studies are lacking. The objective of this section is to describe a method intended to minimize aerosol–cloud correlations primarily modulated by cloud cover via mechanisms not related to microphysical interactions and possibly associated with retrieval biases. Using the configuration in Fig. 1a, we first attempt to reduce cloud retrieval uncertainties near the cloud edges by limiting the analysis to 25 km averaged samples constructed from MODIS 5 km×5 km Nd (Fig. 1a) with the 5 km×5 km cloud fraction exceeding 0.9 (90 %). The comparison of all-sky (no cloud fraction screening) and cloudy Nd (with the CF screening applied to 5 km×5 km grids) as a function of the 25 km MODIS cloud fraction (Fig. 2) reveals that all-sky Nd dramatically increases with the cloud fraction (CF; black line) from 15 to 90 cm−3, but a weaker dependence is observed for cloudy Nd (red line). This is consistent with an expected negative bias in Nd (Eq. 2) for scenes with reduced cloud cover caused by a positive bias in re and negative bias in τ relative to τ and re retrievals in spatially inhomogeneous scenes (Painemal et al., 2013).
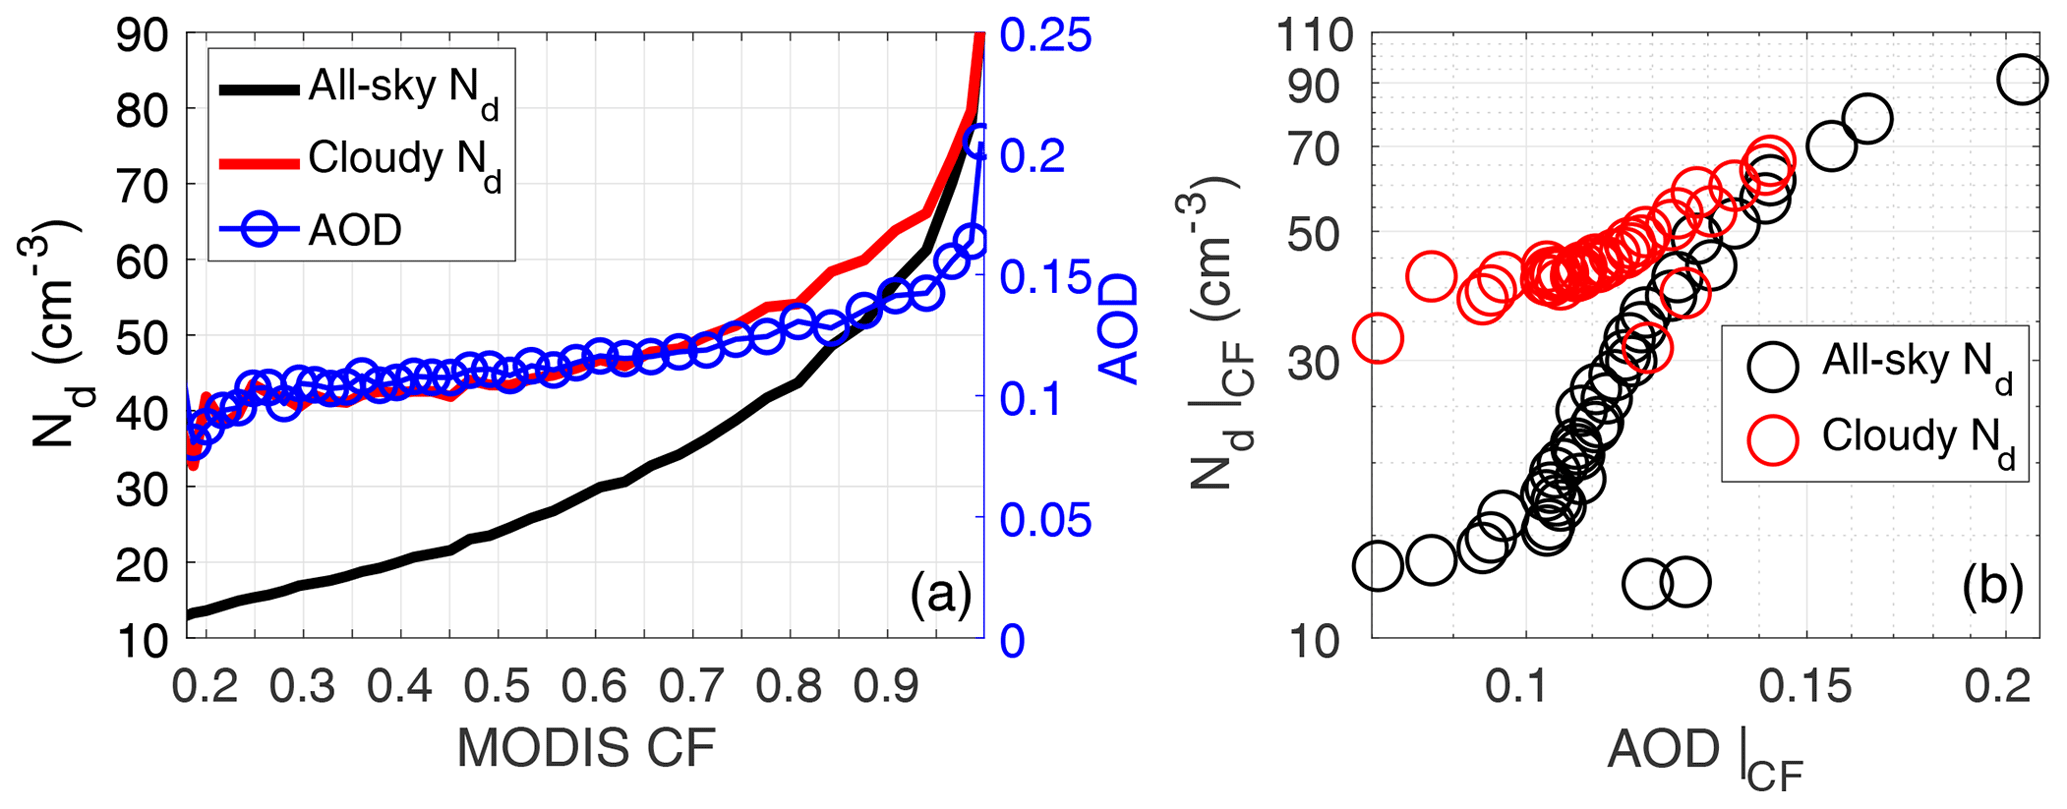
Figure 2(a) The 25 km CALIOP-S AOD and MODIS Nd binned as a function of 25 km MODIS cloud fraction. Cloudy Nd refers to 25 km Nd calculated using 5 km×5 km blocks (Fig. 1a) with cloud fraction exceeding 0.9. (b) Variation in CALIOP-S AOD and MODIS Nd binned as a function of MODIS CF (|CF) from Fig. 4a. Red circles represent cloudy Nd and CALIOP-S AOD with 25 km MODIS CF<0.95. Black circles represent binned Nd and AOD irrespective of their 5 km×5 km and 5 km cloud fraction, respectively.
In terms of AOD, we found that 25 km CALIOP-S AOD increases with the 25 km MODIS CF at a rather low rate for CF<0.95 with an increment of less than 0.04, and a rapid increase thereafter to reach a maximum of 0.21, similar to the results in Loeb and Manalo-Smith (2005). In addition, changes in CALIOP-S AOD vary with CALIOP CF in a much narrower range (from 0.10 to 0.12; not shown). The AOD increase for high values of MODIS CF is interpreted as the enhanced swelling of aerosols embedded in regions with extensive cloud cover (Várnai and Marshak, 2018). Figure 2b depicts how AOD and Nd covary when the data are binned as a function of CF (|CF) for 50 cloud fraction bins containing identical number of samples. All-sky Nd increases with AOD (black circles) over a Nd range of almost 80 cm−3. Interestingly, the AOD–Nd scatterplot for cloudy Nd and AOD for scenes with MODIS CF<0.95 (red circles) yields a weaker dependence, with a Nd magnitude of 20 cm−3 (after ignoring two outliers). Based on this analysis, we minimize the potential modulation of cloud cover by only using MODIS cloud retrievals with MODIS CF>0.9 over a 5 km×5 km grid and aerosol retrievals embedded in 25 km segments with MODIS CF<0.95.
3.1 AOD and vertical structure
We first show the median CALIOP–SODA (CALIOP-S) aerosol extinction profiles for four ranges of cloud-top height (CTH), which is in turn used as a surrogate for the boundary layer height (Fig. 3a). As expected, σ decreases with increasing height, with a more pronounced reduction in the free troposphere. It is worth noting that even though the mean AOD for each profile is approximately 0.10, σ for the layer below the cloud top varies substantially. For instance, the profile for the shallowest boundary layer (black) yields σ between 0.05 and 0.08 km−1 below cloud top, whereas σ is less than 0.01 km−1 near the cloud layer for high clouds with CTH>2.2 km (magenta). The relationship between the below-cloud-top aerosol extinction coefficient (σBC) and AOD is depicted in detail in Fig. 3b. AOD changes with σBC are well characterized by a linear fit for AOD>0.1; however, for σBC (AOD) less than 0.1 km−1 (0.1), AOD changes slowly with σBC, as determined by the AOD–σBC slope. This gradual gradient is mainly attributed to the scattered AOD–σBC relationship (r=0.27) for σBC<0.1 km−1, suggesting that AOD poorly represents the aerosol optical properties in the boundary layer aerosols for relatively pristine environments. While it has been documented that biases in ACIs can be caused by instrument detectability limitations in pristine environments (Ma et al., 2018), the results here suggest that the AOD weak covariability with boundary layer aerosols is also an important factor that needs to be taken into account. The weak correlation for σBC<0.1 km−1 gives rise to an apparent non-linear variation in AOD with σBC. Overall, these results anticipate a dissimilar dependence of Nd on AOD and σBC, as is demonstrated in the following analysis.
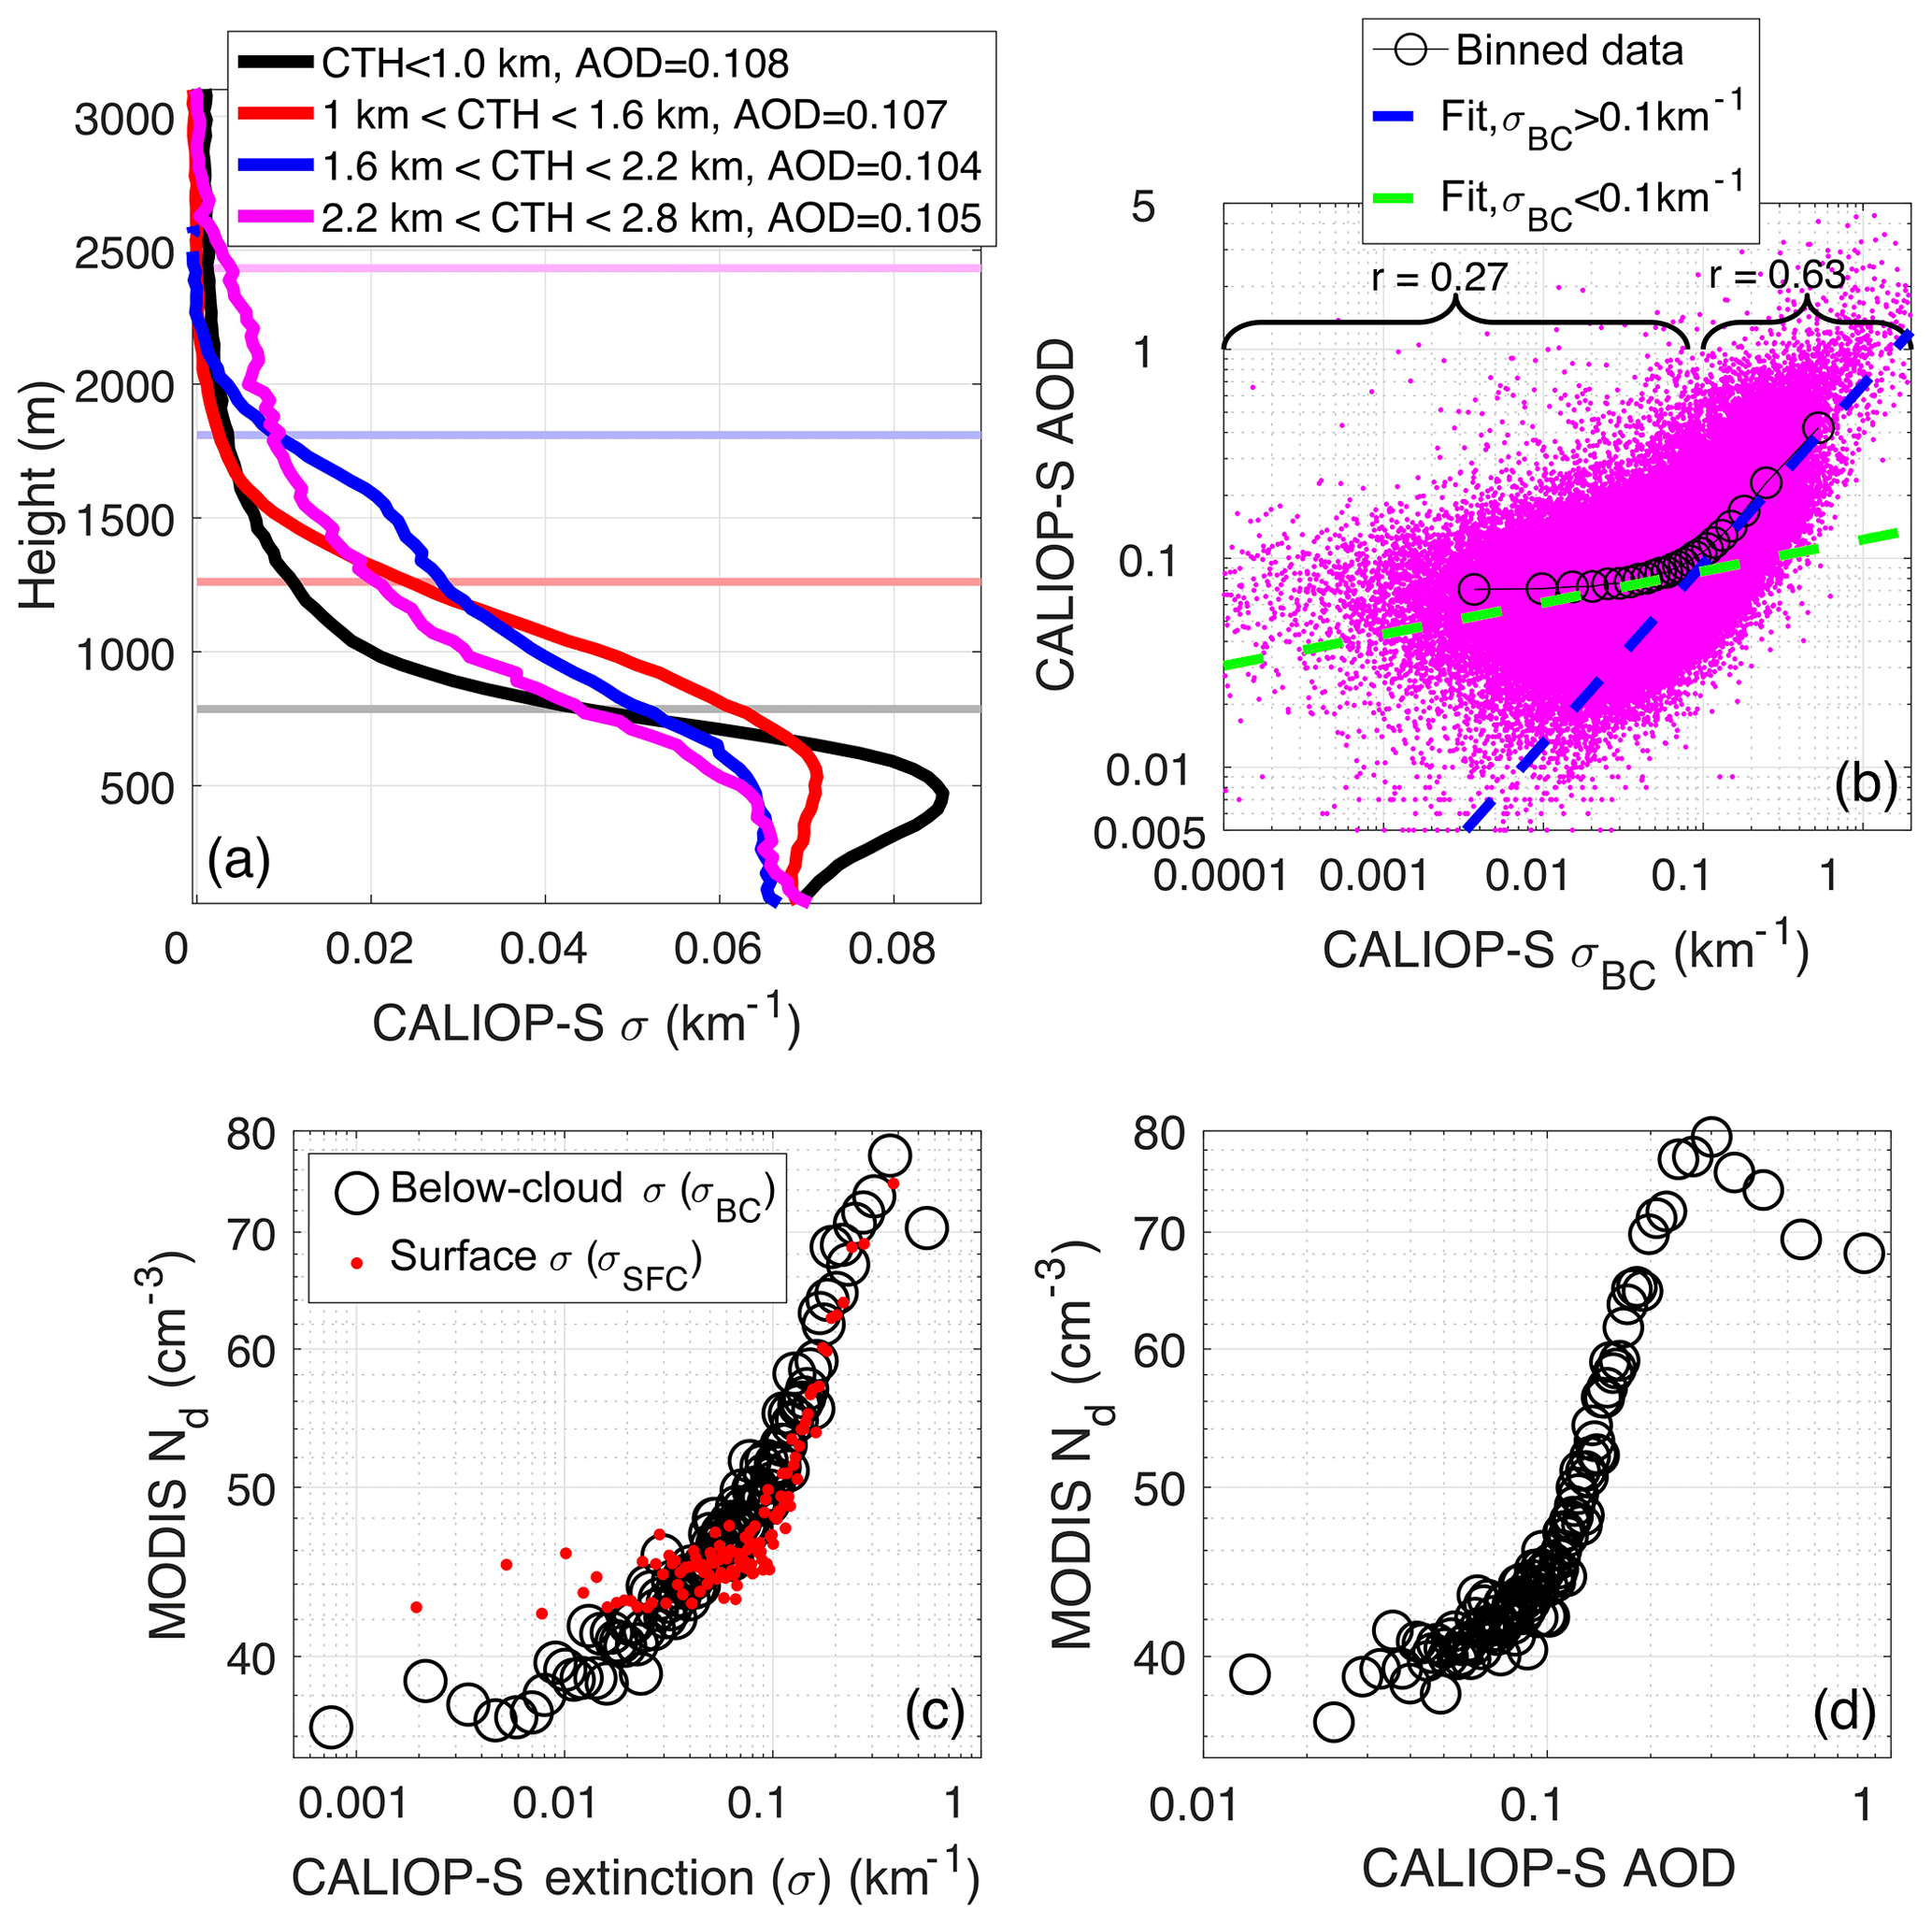
Figure 3(a) Median vertical profiles of aerosol extinction coefficient for different cloud-top heights (CTHs), with the horizontal lines (light color) representing the median CTH for each group. (b) Relationship between AOD and σBC, binned data (black circle), and linear correlation coefficients and regressions for CALIOP-S σBC greater and less than 0.1 km−1 (dashed blue and green lines, respectively). Mean MODIS Nd binned as a function of (c) σBC (black circles) and σSFC (red dots) and (d) AOD. Data are taken over the subtropical ocean (35∘ S–35∘ N).
3.2 Dependence of MODIS Nd on different CALIOP-S aerosol proxies
The dependencies of MODIS Nd on different CALIOP-S aerosol variables are summarized in Fig. 3c and d, with Nd binned as a function of a CALIOP-S retrieval using an equal-frequency binning. MODIS Nd exhibits a nearly linear relationship with CALIOP-S σBC, especially for Nd>40 cm−3 (Fig. 3; black circles), whereas MODIS Nd varies linearly with AOD for the 0.1–0.3 range and shows an anticorrelation for AOD>0.3. Opposite-sign correlations between satellite AOD (AI) and cloud effective radius for AOD>0.2 have also been observed by Bréon et al. (2002). For AOD < 0.1, Nd shows little change with AOD, in agreement with the modest sensitivity of AOD to variations in σBC depicted in Fig. 3b. We also analyze near-surface σ (σSFC) as a way to assess ground-based observations for investigating ACIs (e.g., McComiskey et al., 2009; Liu and Li, 2018). In general, a narrower range of binned Nd values as a function of σSFC is found than that for σBC (Fig. 3c; red dots). To further confirm the reduced covariability between Nd and AOD and σSFC relative to σBC, we computed the standard linear correlation coefficient (r) and found that Nd–AOD r values for the two lowest AOD quartiles (AOD≤0.092) are 0.62 and 0.54, whereas Nd–σBCr further decreases for σSFC to statistically insignificant values for the lower quartiles (0.32 and 0.06). In contrast, σBC yields the highest r, with values of 0.78 and 0.90 (σBC≤0.058 km−1). Lastly, the monotonic increase in Nd with σBC indicates that the AOD–Nd anticorrelation observed for AOD>0.3 in Fig. 3d is not indicative of aerosol–cloud microphysical processes.
Mean MODIS Nd and aerosol fields gridded every are depicted in Fig. 4. The MODIS Nd features a spatial pattern documented in other studies (Fig. 4a; e.g., Bennartz and Rausch, 2017) and characterized by high values over the eastern Pacific, eastern Atlantic, and northwestern Pacific. The corresponding CALIOP-S AOD map (Fig. 4b) depicts maxima off the western coasts of Africa and over the Arabian Sea, associated with dust and biomass-burning aerosols (Kaufman et al., 2005; Omar et al., 2009; Jickells et al., 2005), whereas AOD remains below 0.1 for vast subtropical areas. As a consistency check, we show in Fig. 5 the map of MODIS AOD at 0.55 µm for the period of study, which agrees well with its CALIOP-S counterpart. The spatial r between the MODIS Nd and CALIOP-S AOD maps is 0.41 (17 % explained variance), primarily contributed by the covariability between AOD and Nd over the southeastern Atlantic. Unlike AOD, CALIOP-S σBC produces a local maximum over the northeastern Pacific and a subtle increase along a narrow coastal band off the western coast of South America, consistent with westward gradients in MODIS Nd (Fig. 4c). In addition, the region with high σBC over the southeastern Atlantic extends further south relative to that for AOD, in better agreement with MODIS Nd. The improved spatial consistency between CALIOP-S σBC and MODIS Nd leads to r=0.64, equivalent to an explained variance of 41 %. σSFC spatially correlates at r=0.40, similar to its AOD counterpart (Fig. 4b, color). Lastly, above-cloud σ (contours), with maxima over the eastern Atlantic, has a negligible spatial correlation with MODIS Nd (r=0.05), showing the lack of a physical link between free-tropospheric aerosols and Nd. Spatial covariability between aerosol concentration and Nd has been verified over the eastern Pacific with in situ observations, and manifested in a concurrent westward decrease in CCN and Nd (e.g., Bretherton et al., 2010, 2019; Painemal et al. 2015), in agreement with CALIOP-S σBC and MODIS Nd documented here. Although these spatial correlations are promising, such analysis is an oversimplification, as the processes that determine the Nd budget are highly complex and dependent on multiple factors that cannot be accounted for by satellite observations only. It is, nevertheless, the goal of this study to explore ways of improving the characterization of aerosol–cloud interactions within the limitations of the current satellite observations.
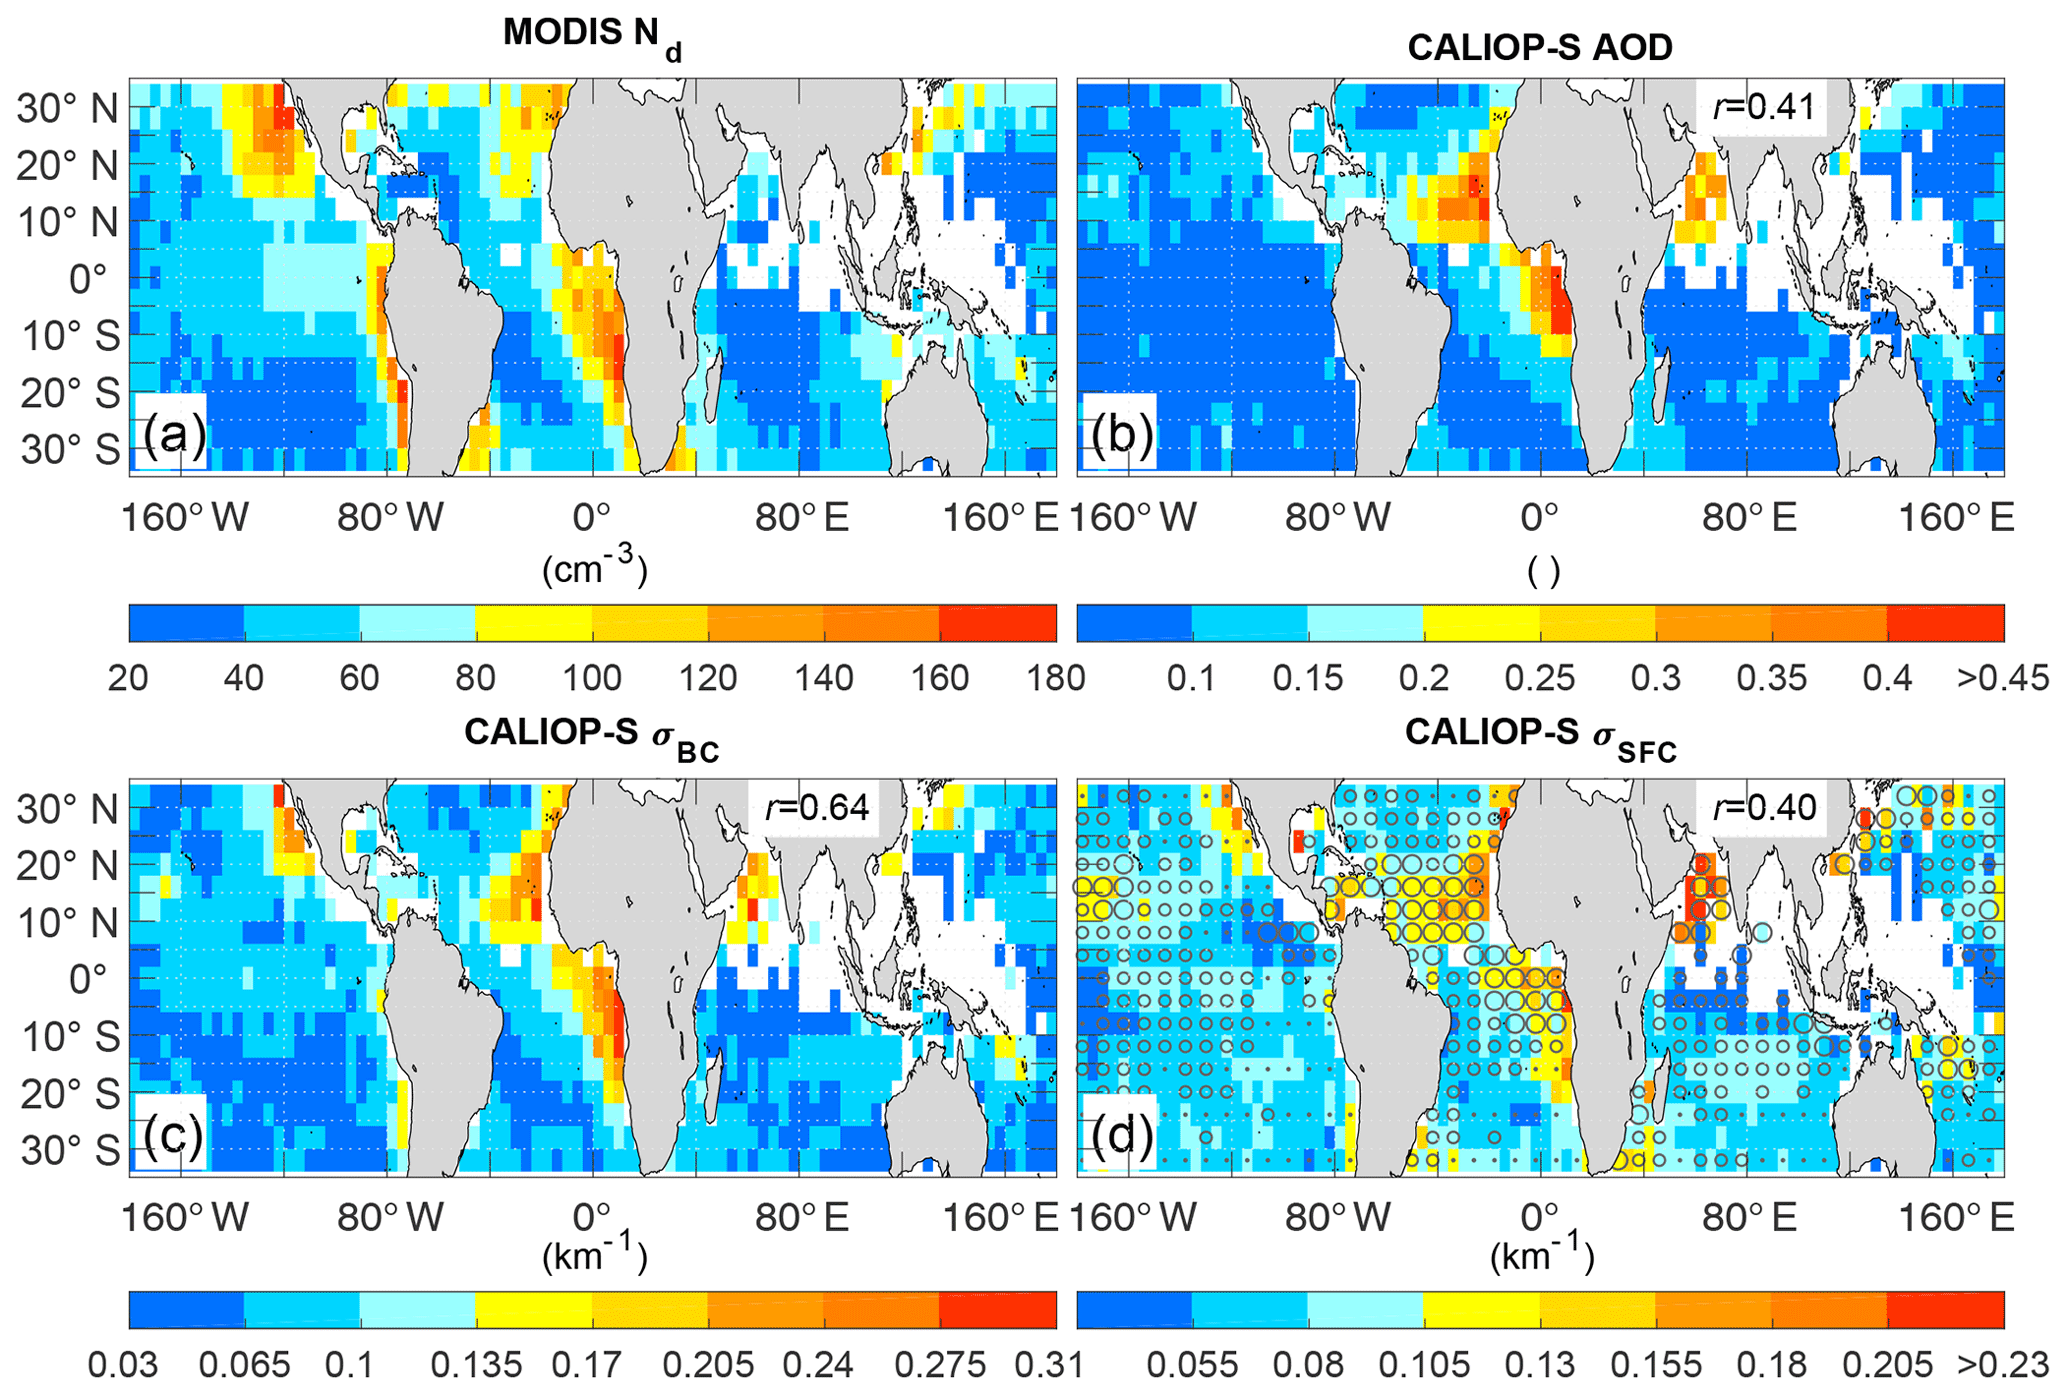
Figure 4The maps derived from 9 months of data (Methods): (a) MODIS Nd, (b) CALIOP-S AOD, (c) σBC, and (d) σSFC (colors) and above-cloud aerosol extinctions (symbols – dots, small, and large circles denote the following ranges: 0–0.015, 0.015–0.03, and 0.03–0.45 km−1). White areas correspond to regions with fewer than 25 samples (10 % of the observed maximum). The spatial linear correlation coefficient (r) between MODIS Nd and the specific CALIOP-S map is also included.
3.3 Aerosol–cloud interaction over the eastern Pacific and Atlantic
We took a closer look at the eastern Pacific and Atlantic, given their dominant albedo susceptibility to changes in cloud microphysics (Painemal, 2018). Eastern Pacific and Atlantic aerosol–cloud relationships (Fig. 6a and b) are similar to those in Fig. 3 in that Nd variations with σBC are more linear than the relationship between Nd and AOD. The weak Nd–AOD correlation for low AOD, particularly for AOD<0.1, is evinced again, with r at 0.51 and 0.55 for the eastern Atlantic and Pacific, respectively (Fig. 6b). In contrast, r for σBC exceeds 0.90 for AOD<0.1, and a simple linear regression captures the aerosol–cloud dependence (Fig. 6a, blue lines). We test the robustness of the aerosol–cloud correlations by minimizing the covariability driven by drizzle (Wood et al., 2012). For this purpose, samples with a drizzle rate of more than 1 mm d−1, according to the parameterization in Comstock et al. (2004), are removed from the analysis. This threshold reduces the mean precipitation rate from an estimated 2.26 to 0.28 mm d−1 (light drizzle according to Wood, 2012). The drizzle removal leads to an overall increase in MODIS Nd, and more so over the eastern Pacific, yielding nearly identical Nd variations with CALIOP-S retrievals between the Pacific and Atlantic regimes (Fig. 6c and d). In addition, the Nd–σBC correlation remains high (r≥0.80) for AOD<0.1, whereas Nd–AOD r is less than 0.38 for AOD<0.1. These results suggest that drizzle strengthens the Nd–aerosol relationship; however, aerosols still modulate Nd after moderate and heavy precipitation is removed from the analysis.
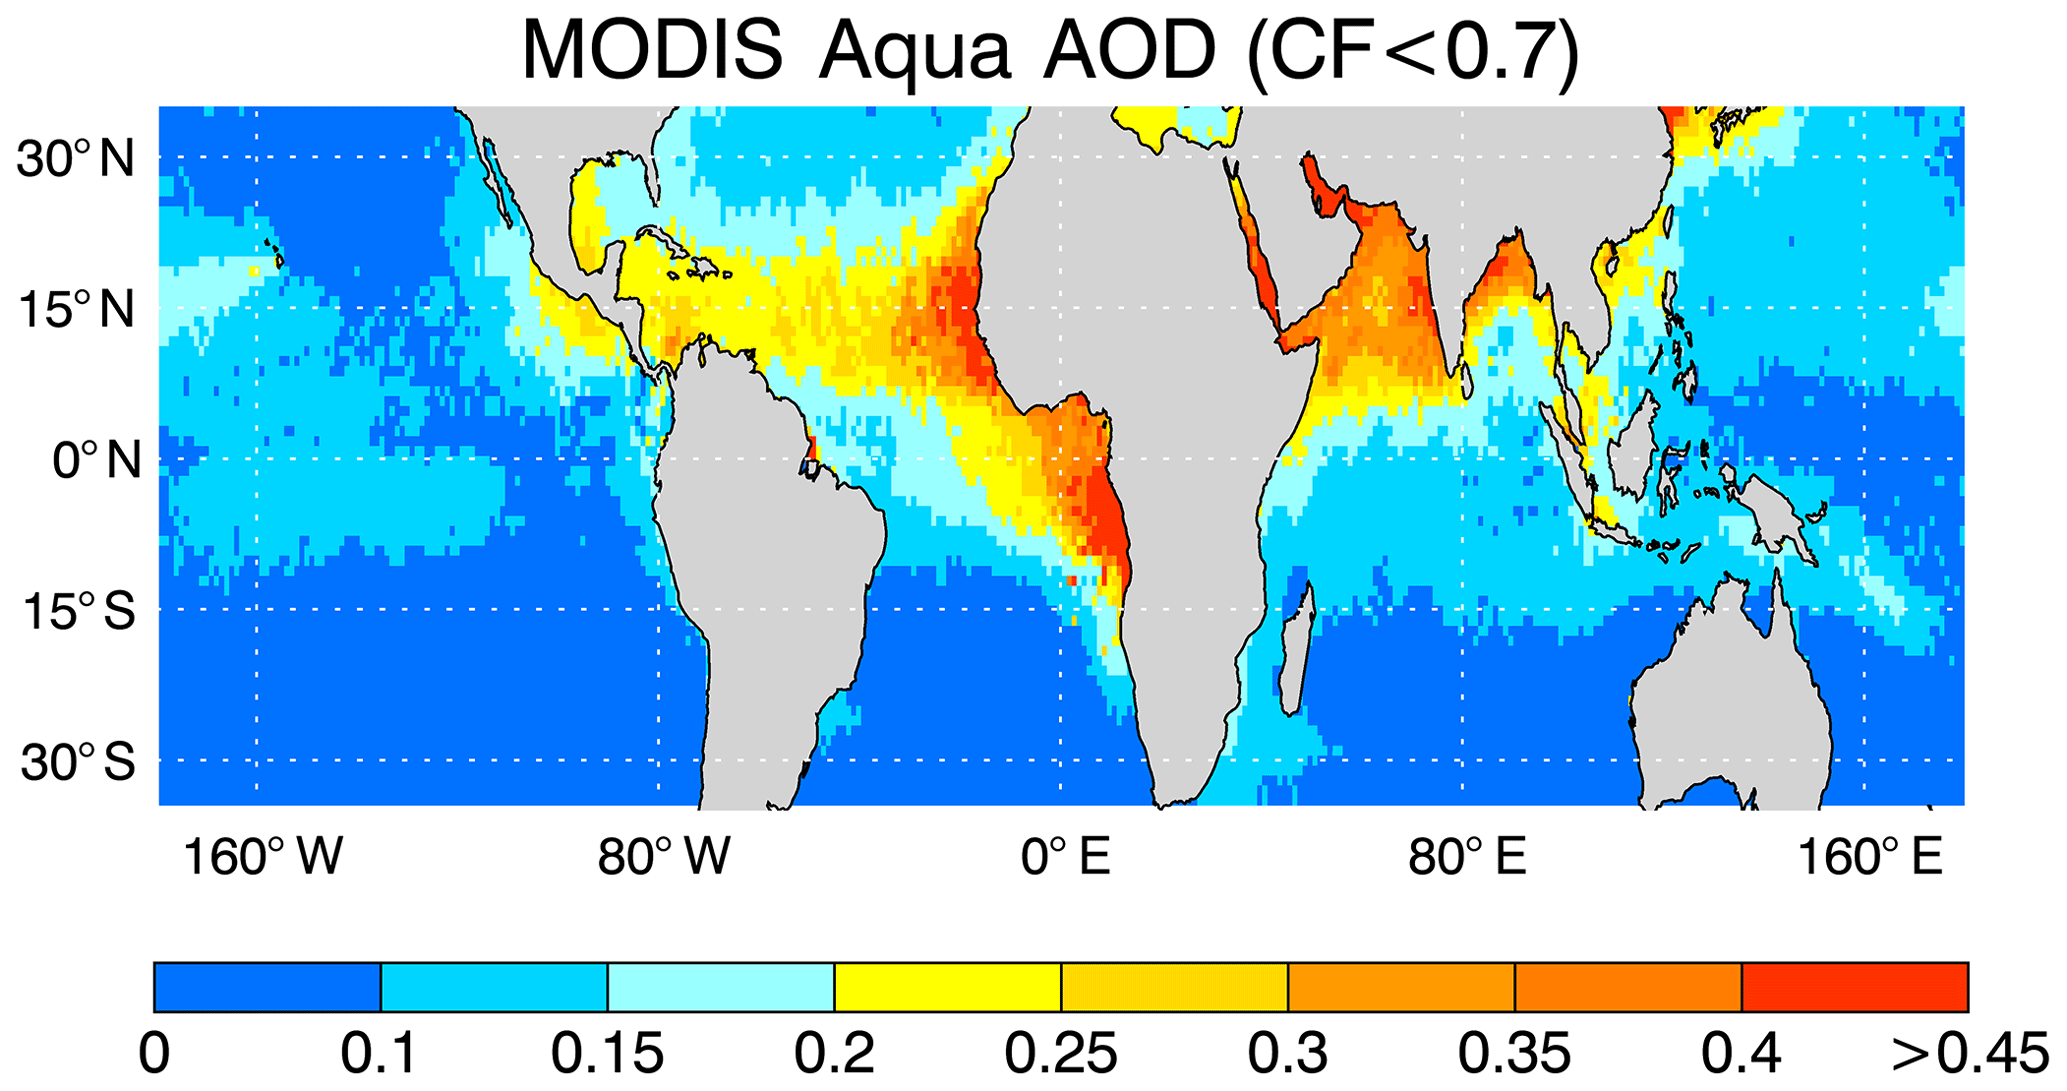
Figure 5Mean MODIS Aqua 0.55 µm AOD for the period of study based on MODIS Collection 6 Level 3 product (MYD08_D3). Potential aerosol biases and swelling are reduced by removing 1∘ grids with cloud fraction (Collection 6) exceeding 0.7. The spatial pattern is nearly identical for the map without filtering (not shown).

Figure 6MODIS Nd binned as a function of (a) σBC and (b) AOD over the eastern (E) Pacific (20–35∘ N, 150–110∘ W; 10–30∘ S, 110–70∘ W) and Atlantic (20–35∘ N, 50–15∘ W; 0–30∘ S, 15∘ W–15∘ E) regions, defined by the boxes in Fig. 1. Panels (c) and (d) as in (a) and (b) after removing drizzling samples. Linear regression (logarithmic scale) are depicted in blue.
While CCN–AOD relationships have been inferred from ground-based observations, the statistics primarily relate near-surface CCN with remote-sensing quantities under the specific environmental conditions of the ground-based sites. These limitations are circumvented in Stier (2016) by evaluating cloud-base CCN and AOD simulated by a global climate model. Stier (2016) found that the simulated AOD explains 25 % of the cloud-base CCN variance over most of the globe. In this regard, our analysis provides the first extensive observational evidence of Stier (2016) over the subtropical ocean in that AOD explains a modest variance in the aerosol optical properties near the cloud layer in the boundary layer. While we used Nd instead of CCN, this study also reveals that CALIOP–SODA AOD explains a spatial variance of less than 20 % over the region where Stier (2016) reported weak CCN–AOD correlations. Even though we found the highest spatial correlation between MODIS Nd and the vertically resolved aerosol extinction coefficient at the cloud level, close attention needs to be paid to the relationship between CCN and σBC (e.g., Shinozuka et al., 2015), which depends on aerosol type, hygroscopicity, and aerosol size distribution, among other factors. For instance, the lack of spatial covariation in the 0–10∘ N band over the Atlantic Ocean is caused by the dominant presence of dust, which is a weakly hygroscopic species (Koehler et al., 2009). Moreover, accounting for the aerosol humidification factor in optical retrievals (Gasso et al., 2000) will be key to more closely linking aerosol extinction to CCN. The CALIOP-S aerosol index (AI) was not calculated due to uncertainties in the 1064 nm retrievals. However, as AI strongly depends on AOD, similar issues should be expected for AI as well. Indeed, ACI statistics estimated from AI are typically similar to those for AOD (Chen et al., 2014). Moreover, Aqua MODIS-based AI (derived from Collection 6.1 Level 3 daytime AOD at 550 nm and Ångström exponent computed from AOD at 550 and 860 nm) in Fig. 7 for the same period of study reveals a spatial pattern poorly correlated with Nd, especially over the eastern Pacific, despite an AI decrease over the tropical North Atlantic, where dust is the main aerosol species.
Concerning AOD, two aspects call into question its adequacy for ACI studies: (a) the reduced spatial correlation with Nd, especially over the eastern Pacific, and (b) the non-linear variations in Nd with AOD, caused by the modest changes of Nd for AOD<0.1, further suggesting that the ACI estimation via the AOD–Nd linear fit is less physically meaningful than commonly thought. The lack of linearity and low AOD–Nd correlation for AOD<0.1 are associated with a reduced ability of AOD to capture aerosol variability in the boundary layer (Fig. 3b). Thus, the apparently weak sensitivity of Nd to AOD for pristine environments (Gryspeerdt et al., 2016) is a remote-sensing artifact rather than a real cloud microphysical behavior. For more polluted conditions, AOD correlates better with Nd, implying that AOD could still be a useful CCN proxy for specific polluted conditions. Similarly, using near-surface σ does not offer a significant improvement, at least in the subtropics. This possibly reflects the reduced covariation between near-surface aerosol concentration and that below cloud base in decoupled atmospheric boundary layers (Painemal et al., 2017) in addition to the plausible σ enhancement contributed by large sea salt particles near the surface. Given the limited dataset used in this study, the computation of statistically robust ACI maps is left for future work, as this will require the use of the full CALIOP data record. However, the consequences of using AOD are evident from Fig. 6a and b for the low aerosol values. Fractional Nd variations (relative to the mean) between the median and the lowest aerosol bins (Fig. 6) are 9.0 % (eastern Pacific) and 7.8 % (eastern Atlantic). In contrast, the equivalent Nd fractional changes for σBC are between 31.3 % and 31.54 % for the below-the-median aerosol range. That is, the computed Nd fractional change as a function of σBC is more than 3 times greater than that for AOD. Keeping in mind that changes in the below-cloud aerosol extinction coefficient are associated with even smaller AOD variations (e.g., Fig. 3a and b), this simple susceptibility calculation suggests that computed changes in both Nd and shortwave fluxes (see Eq. 3 in Gryspeerdt et al., 2017) due to changes in AOD would substantially underestimate the actual ACI radiative forcing for pristine conditions.
Another key aspect for reducing uncertainties in satellite estimates is to develop methods that can minimize biases in partially cloudy scenes. For instance, when the spatial correlation analysis in Fig. 4 was repeated with unscreened cloud and aerosol retrievals (not shown), spatial r for Nd–AOD and Nd–σBC were weaker (0.26 and 0.48) than those estimated from the screened dataset (0.41 and 0.61). The analysis also suggests that the use of Level 3 products, with 1∘ spatial resolution, for estimating aerosol–cloud interaction relationships will likely be biased due to the additive effect of subpixel variability and 3-D radiative effects in cloud retrievals and aerosol swelling in regions with high cloud cover.
Readily available AOD values from ground-based sensors and satellites have become the most commonly used variable for quantifying aerosol–cloud interactions. Despite a general positive correlation between AOD and CCN (Andreae, 2009) for a broad range of pollution conditions, the relationship is weaker over the ocean (Stier, 2016). Here, we show for the first time that CALIOP-based aerosol extinction coefficient retrievals are central to reducing uncertainties in observationally based estimates of aerosol indirect effects. Below-cloud-top CALIOP-S aerosol extinction is the retrieval that yields the strongest correlation with MODIS Nd compared with the AOD, near-surface, and above-cloud-top aerosol extinction coefficient. The fact that the log(Nd)–log(CCN) relationship over the ocean is also linear when estimated from in situ observations (Twohy et al., 2005; Painemal and Zuidema, 2013; Painemal et al., 2017) lends confidence to the results presented here. While our analysis shows that precipitation strengthens the dependence of Nd on σBC, it also reveals that the σBC–Nd correlation remains high for non-precipitating and lightly drizzling samples. We note that precipitation retrievals from CloudSat have not been utilized here, and, thus, the full evaluation of precipitation susceptibility is left for future work. However, since several satellite-based ACI metrics also rely on AOD (Sorooshian et al., 2010), the results of our study should be applicable to other aspects of the aerosol indirect effect quantified from satellite observations. Given the extensive use of AOD-based results for evaluating ACIs in climate models, caution needs to be exercised before interpreting linear regressions between AOD and cloud microphysics as meaningful quantification of the cloud response to aerosols. In light of the results presented here, it would be informative to assess the extent to which the aerosol extinction coefficient can be combined with climate models to quantify the ACI radiative forcing since pre-industrial conditions as in Gryspeerdt et al. (2017), but expressing ACIs in terms of σBC instead of MODIS AI. Unfortunately, given the remaining challenges in simulating the aerosol vertical structure in climate models (e.g., Koffi et al., 2016), it is uncertain that the simulated relationships between CCN, AOD, aerosol extinction, and vertical variability can be used to analyze the advantages and disadvantages of using a specific CCN proxy.
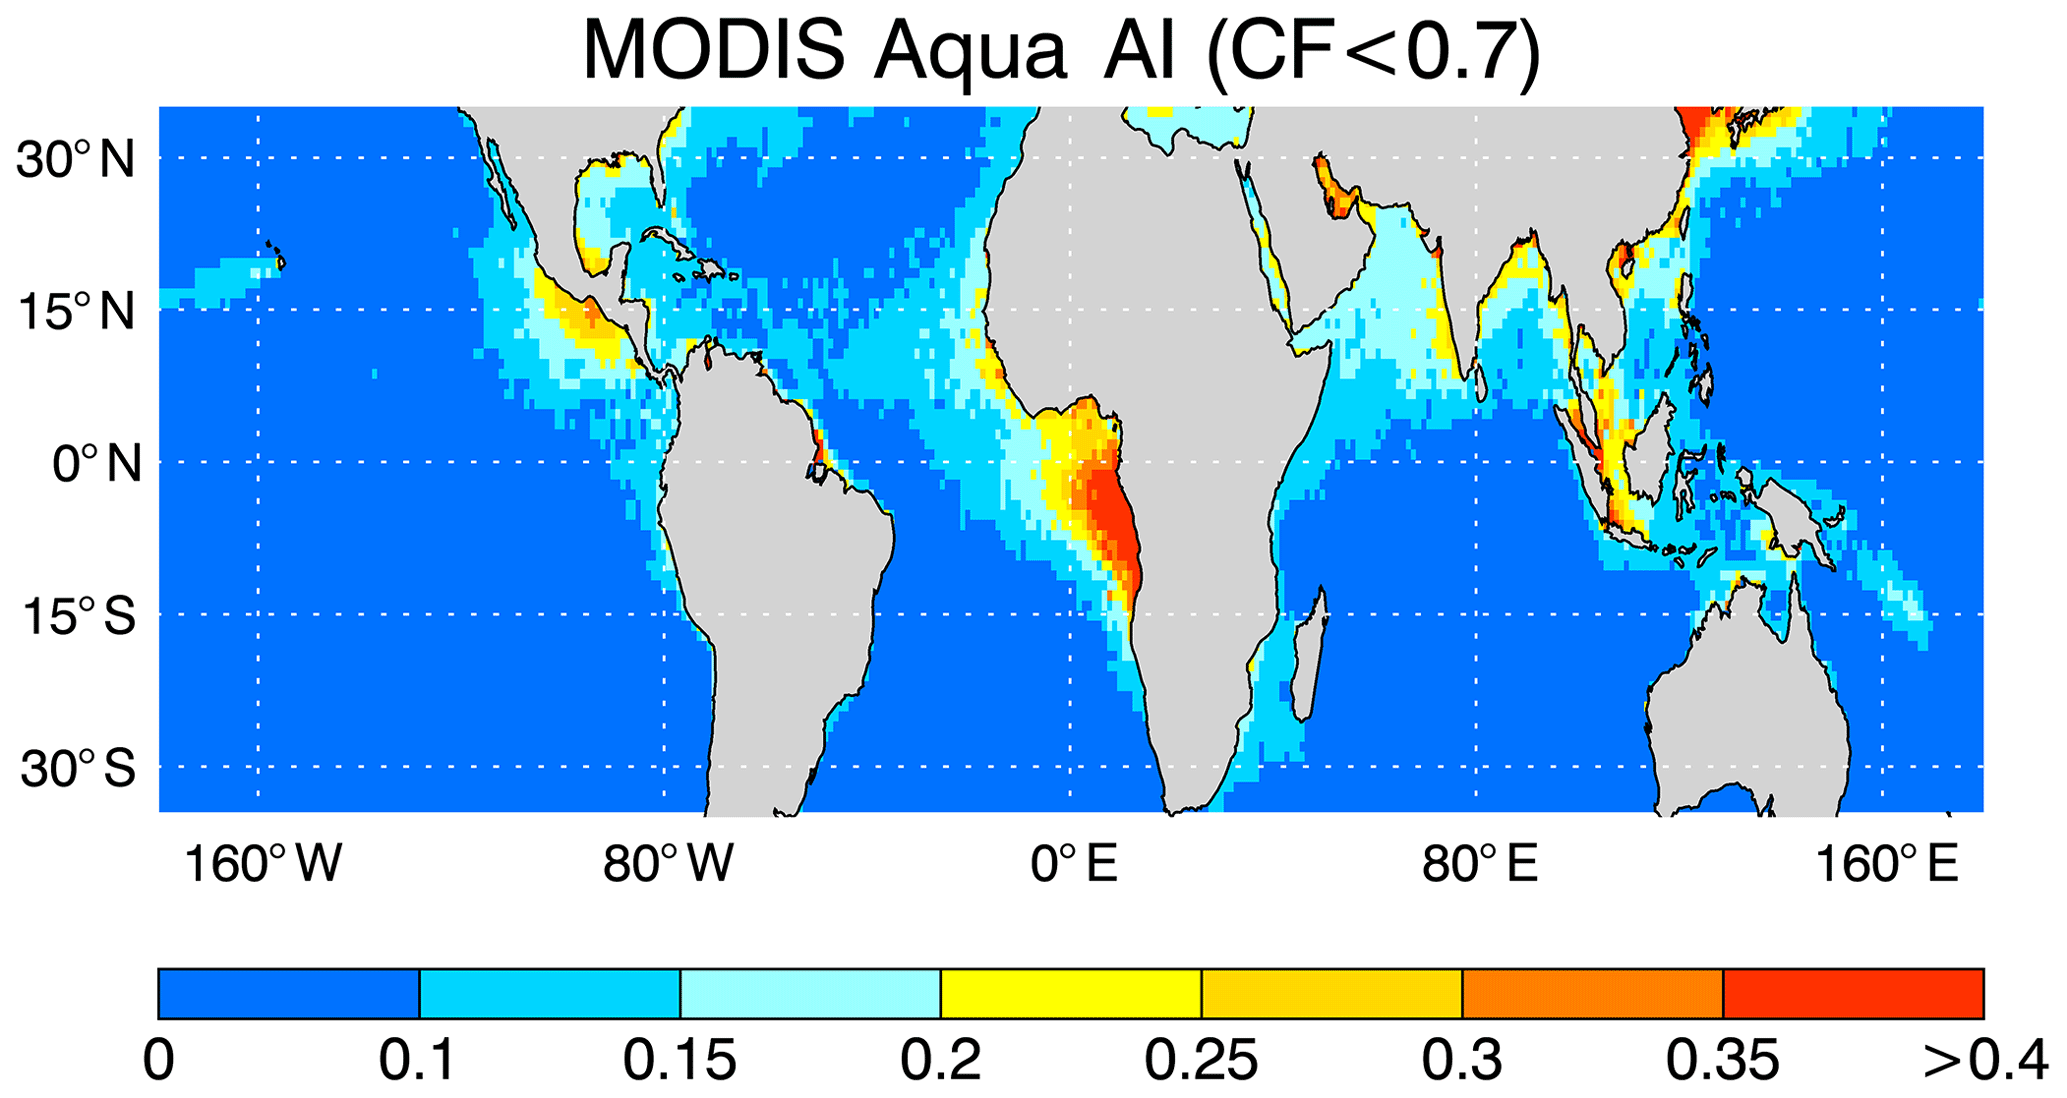
Figure 7As Fig. 5 but for aerosol index derived from MODIS Aqua AOD and Ångström exponent.
Moving beyond the AOD paradigm is crucial to providing a trustworthy benchmark that can be applied to the evaluation of climate models. As demonstrated here, CALIOP is central in advancing toward this goal; thus, future efforts should be oriented to exploit the nearly 12 years of CALIPSO measurements collocated with the A-Train satellite constellation. Lastly, coordinated field campaigns that explore the link between CCN, the aerosol extinction coefficient, and cloud microphysics using in situ and remotely sensed observations will be essential for developing new approaches for estimating ACIs and quantifying uncertainties in satellite-based assessments. A promising strategy has been adopted by the Aerosol Cloud meTeorology Interactions oVer the western ATlantic Experiment (ACTIVATE). ACTIVATE deployment of two airplanes flying in formation will allow for the collocation of in situ and remotely sensed aerosol and cloud properties with unprecedented spatial resolution (Sorooshian et al., 2019). The proper characterization of aerosols using diverse sensors will be fundamental for helping reconcile different ACI estimates and providing a more physically reliable benchmark for the evaluation of climate models.
The SODA aerosol optical depth is developed at the AERIS/ICARE data and services center (http://www.icare.univ-lille1.fr/projects/soda, last access: 27 December 2017; Josset et al., 2015) in Lille (France) in the frame of the CALIPSO mission and supported by CNES. CALIPSO v4 cloud products are available at https://www-calipso.larc.nasa.gov (last access: 18 October 2018; Liu et al., 2019), and CERES–MODIS cloud products are available at https://ceres.larc.nasa.gov/order_data.php (last access: 11 May 2020; Minnis et al., 2011, 2020. Pixel-level data available upon request). CALIOP–SODA aerosol extinction coefficients and lidar ratios are available via SFTP at ftp://calipso_soda@xfr999.larc.nasa.gov (last access: 11 September 2019; Painemal et al., 2019) (further instructions provided upon request).
DP designed the study and wrote the paper, with contributions of all the co-authors. F-LC created the matched MODIS–CALIOP–SODA dataset, and MC produced the CALIOP–SODA aerosol retrievals.
The authors declare that they have no conflict of interest.
This work was funded by the CloudSat and CALIPSO Science Team Recompete Program NASA award no. NNH16CY04C. William L. Smith and Patrick Minnis acknowledge the support of the CERES program.
This research has been supported by NASA (grant no. NNH16CY04C).
This paper was edited by Nikos Hatzianastassiou and reviewed by two anonymous referees.
Albrecht, B. A., Fairall, C. W., Thomson, D. W., White, A. B., Snider, J. B., and Schubert, W. H.: Surface-based remote sensing of the observed and the adiabatic liquid water content of stratocumulus clouds, Geophys. Res. Lett., 17, 89–92, 1990.
Andreae, M. O.: Correlation between cloud condensation nuclei concentration and aerosol optical thickness in remote and polluted regions, Atmos. Chem. Phys., 9, 543–556, https://doi.org/10.5194/acp-9-543-2009, 2009.
Bennartz, R. and Rausch, J.: Global and regional estimates of warm cloud droplet number concentration based on 13 years of AQUA-MODIS observations, Atmos. Chem. Phys., 17, 9815–9836, https://doi.org/10.5194/acp-17-9815-2017, 2017.
Boucher, O., Randall, D., Artaxo, P., Bretherton, C., Feingold, G., Forster, P., Kerminen, V.-M., Kondo, Y., Liao, H., Lohmann, U., Rasch, P., Satheesh, S. K., Sherwood, S., Stevens, B., and Zhang, X. Y.: Clouds and aerosols. In Climate Change 2013: The Physical Science Basis. Contribution of Working Group I to the Fifth Assessment Report of the Intergovernmental Panel on Climate Change, edited by: Stocker, T. F., Qin, D., Plattner, G.-K., Tignor, M., Allen, S. K., Doschung, J., Nauels, A., Xia, Y., Bex, V., and Midgley, P. M., Cambridge University Press, 571–657, https://doi.org/10.1017/CBO9781107415324.016, 2013.
Bréon, F.-M., Tanré, D., and Generoso, S.: Aerosol effect on cloud droplet size monitored from satellite, Science, 295, 834–838, 2002.
Bretherton, C. S., Wood, R., George, R. C., Leon, D., Allen, G., and Zheng, X.: Southeast Pacific stratocumulus clouds, precipitation and boundary layer structure sampled along 20∘ S during VOCALS-REx, Atmos. Chem. Phys., 10, 10639–10654, https://doi.org/10.5194/acp-10-10639-2010, 2010.
Bretherton, C. S., McCoy, I. L., Mohrmann, J., Wood, R., Ghate, V., Gettelman, A., Bardeen, C. G., Albrecht, B. A., and Zuidema P.: Cloud, Aerosol, and Boundary Layer Structure across the Northeast Pacific Stratocumulus–Cumulus Transition as Observed during CSET, Mon. Wea. Rev., 147, 2083–2103, 2019.
Chen, Y.-C., Christensen, M. W., Stephens, G. L., and Seinfeld, J. H.: Satellite-based estimate of global aerosol-cloud radiative forcing by marine warm clouds, Nat. Geosci., 7, 643–646, 2014.
Christensen, M. W., Neubauer, D., Poulsen, C. A., Thomas, G. E., McGarragh, G. R., Povey, A. C., Proud, S. R., and Grainger, R. G.: Unveiling aerosol–cloud interactions – Part 1: Cloud contamination in satellite products enhances the aerosol indirect forcing estimate, Atmos. Chem. Phys., 17, 13151–13164, https://doi.org/10.5194/acp-17-13151-2017, 2017.
Comstock, K. K., Wood, R., Yuter, S. E., and Bretherton, C. S.: Reflectivity and rain rate in and below drizzling stratocumulus, Q. J. Roy. Meteorol. Soc., 130, 2891–2918, https://doi.org/10.1256/qj.03.187, 2004.
Costantino, L. and Bréon, F.-M.: Aerosol indirect effect on warm clouds over South-East Atlantic, from co-located MODIS and CALIPSO observations, Atmos. Chem. Phys., 13, 69–88, https://doi.org/10.5194/acp-13-69-2013, 2013.
Feingold, G., Eberhard, W. L., Veron, D. E., and Previdi, M.: First measurements of the Twomey indirect effect using ground-based remote sensors, Geophys. Res. Lett., 30, 1287, https://doi.org/10.1029/2002GL016633, 2003.
Fernald, F. G.: Analysis of atmospheric lidar observations: Some comments, Appl. Opt., 23, 652–653, https://doi.org/10.1364/AO.23.000652, 1984.
Gasso, S., Hegg, D., Covert, D., Collins, D., Noone, K., Öström, E., Schmid, B., Russell, P., Livingston, J., Durkee, P., and Jonsson, H.: Influence of humidity on the aerosol scattering coefficient and its effect on the upwelling radiance during ACE-2, Tellus B, 52, 546–567, 2000.
Grosvenor, D. P., Sourdeval, O., Zuidema, P., Ackerman, A., Alexandrov, M. D., Bennartz, R., Boers, R., Cairns, B., Chiu, J. C., Christensen, M., Deneke, H., Diamond, M., Feingold, G., Fridlind, A., Hünerbein, A., Knist, C., Kollias, P., Marshak, A., McCoy, D., Merk, D., Painemal, D., Rausch, J., Rosenfeld, D., Russchenberg, H., Seifert, P., Sinclair, K., Stier, P., van Diedenhoven, B., Wendisch, M., Werner, F., Wood, R., Zhang, Z., and Quaas, J.: Remote sensing of droplet number concentration in warm clouds: A review of the current state of knowledge and perspectives, Rev. Geophys., 56, 409–453, 2018.
Gryspeerdt, E., Quaas, J., and Bellouin, N.: Constraining the aerosol influence on cloud fraction, J. Geophys. Res.-Atmos., 121, 3566–3583, https://doi.org/10.1002/2015JD023744, 2016.
Gryspeerdt, E., Quaas, J., Ferrachat, S., Gettelman, A., Ghan, S., Lohmann, U., Morrison, H., Neubauer, D., Partridge, D. G., Stier, P., Takemura, T., Wang, H., Wang, M., and Zhang, K.: Constraining the instantaneous aerosol influence on cloud albedo, P. Natl. Acad. Sci. USA, 114, 4899–4904, 2017.
Jickells, T. D., An, Z. S., Andersen, K. K., Baker, A. R., Bergametti, G., Brooks, N., Cao, J. J., Boyd, P. W., Duce, R. A., Hunter, K. A., Kawahata, H., Kubilay, N., laRoche, J., Liss, P. S., Mahowald, N., Prospero, J. M., Ridgwell, A. J., Tegen, I., and Torres, R.: Global iron connections between dust, ocean biogeochemistry and climate, Science, 308, 67–71, https://doi.org/10.1126/science.1105959, 2005.
Josset, D., Pelon, J., Protat, A., and Flamant, C.: New approach to determine aerosol optical depth from combined CALIPSO and CloudSat ocean surface echoes, Geophys. Res. Lett., 35, L10805, https://doi.org/10.1029/2008GL033442, 2008
Josset, D., Hou, W., Pelon, J., Hu, Y., Tanelli, S., Ferrare, R., Burton, S., and Pascal, N.: Ocean and polarization observations from active remote sensing: atmospheric and ocean science applications, Proc. SPIE 9459, Ocean Sensing and Monitoring VII, 94590N, https://doi.org/10.1117/12.2181544, 2015.
Kaufman, Y. J., Koren, I., Remer, L. A., Rosenfeld, D., and Rudich, Y.: The effect of smoke, dust, and pollution aerosol on shallow cloud development over the Atlantic Ocean, P. Natl. Acad. Sci. USA, 102, 11207–11212, https://doi.org/10.1073/pnas.0505191102, 2005.
Koehler, K. A., Kreidenweis, S. M., DeMott, P. J., Petters, M. D., Prenni, A. J., and Carrico, C. M.: Hygroscopicity and cloud droplet activation of mineral dust aerosol, Geophys. Res. Lett., 36, L08805, https://doi.org/10.1029/2009GL037348, 2009.
Koffi, B., Schulz, M., Bréon, F.-M., Dentener, F., Steensen, B. M., Griesfeller, J., Winker, D., Balkanski, Y., Bauer, S. E., Bellouin, N., Berntsen, T., Bian, H., Chin, M., Diehl, T., Easter, R., Ghan, S., Hauglustaine, D. A., Iversen, T., Kirkevåg, A., Liu, X., Lohmann, U., Myhre, G., Rasch, P., Seland, O., Skeie, R. B., Steenrod, S. D., Stier, P., Tackett, J., Takemura, T., Tsigaridis, K., Vuolo, M. R., Yoon, J., and Zhang, K.: Evaluation of the aerosol vertical distribution in global aerosol models through comparison against CALIOP measurements: AeroCom phase II results, J. Geophys. Res.-Atmos., 121, 7254–7283, https://doi.org/10.1002/2015JD024639, 2016.
Liu, J. and Li, Z.: First surface-based estimation of the aerosol indirect effect over a site in southeastern China, Adv. Atmos. Sci., 35, 169–181, 2018.
Liu, Z., Kar, J., Zeng, S., Tackett, J., Vaughan, M., Avery, M., Pelon, J., Getzewich, B., Lee, K.-P., Magill, B., Omar, A., Lucker, P., Trepte, C., and Winker, D.: Discriminating between clouds and aerosols in the CALIOP version 4.1 data products, Atmos. Meas. Tech., 12, 703–734, https://doi.org/10.5194/amt-12-703-2019, 2019.
Loeb, N. G. and Manalo-Smith, N.: Top-of-Atmosphere Direct Radiative Effect of Aerosols over Global Oceans from Merged CERES and MODIS Observations, J. Climate, 18, 3506–3526, 2005.
Ma, P.-L., Rasch, P. J., Chepfer, H., Winker, D. M., and Ghan, S. J.: Observational constraint on cloud susceptibility weakened by aerosol retrieval limitations, Nat. Commun, 9, 2640, 2018.
Martin, G. M., Johnson, D. W., and Spice, A.: The measurement and parameterization of effective radius of droplets in warm stratocumulus clouds, J. Atmos. Sci., 51, 1823–1842, 1994.
McComiskey, A., Feingold, G., Frisch, A. S., Turner, D. D., Miller, M. A., Chiu, J. C., Min, Q., and Ogren, J. A.: An assessment of aerosol-cloud interactions in marine stratus clouds based on surface remote sensing, J. Geophys. Res., 114, D09203, https://doi.org/10.1029/2008JD011006, 2009.
Minnis, P., Sun-Mack, S., Young, D. F., Heck, P. W., Garber, D. P. , Chen, Y., Spangenberg, D. A., Arduini, R. F., Trepte, Q. Z., Smith, W. L., Ayers, J. K., Gibson, S. C., Miller, W. F., Hong, G., Chakrapani, V., Takano, Y., Liou, K. N., Xie, Y., and Yang, P.: CERES edition-2 cloud property retrievals using TRMM VIRS and Terra and Aqua MODIS data. Part I: Algorithms, IEEE Trans. Geosci. Remote Sens., 49, 4374–4400, 2011.
Minnis, P., Sun-Mack, S., Yost, C. R., Chen, Y., Smith Jr., W. L., Heck P.W., Arduini, R. F., Bedka, S. T., Yi Y., Hong, G., Jin, Z., Painemal, D., Palikonda, R., Scarino, B., Spangenberg, D. A., Smith, R. A., Trepte, Q. Z., Yang, P., and Xie, Y.: CERES MODIS cloud product retrievals for Edition 4, Part I: Algorithm changes to CERES MODIS, IEEE Trans. Geosci. Remote Sens., under review, 2020.
Omar, A. H., Winker, D. M., Kittaka, C., Vaughan, M. A., Liu, Z., Hu, Y., Trepte, C. R., Rogers, R. R., Ferrare, R. A., Lee, K. P., Kuehn, R. E., and Hostetler, C. A.: The CALIPSO Automated Aerosol Classification and Lidar Ratio Selection Algorithm, J. Atmos. Ocean. Technol., 26, 1994–2014, https://doi.org/10.1175/2009JTECHA1231.1, 2009.
Painemal, D.: Global estimates of changes in shortwave low-cloud albedo and fluxes due to variations in cloud droplet number concentration derived from CERES-MODIS satellite sensors, Geophys. Res. Lett., 45, 9288–9296, https://doi.org/10.1029/2018GL078880, 2018.
Painemal, D. and Zuidema, P.: Assessment of MODIS cloud effective radius and optical thickness retrievals over the Southeast Pacific with VOCALS-REx in situ measurements, J. Geophys. Res., 116, D24206, https://doi.org/10.1029/2011JD016155, 2011.
Painemal, D. and Zuidema, P.: The first aerosol indirect effect quantified through airborne remote sensing during VOCALS-REx, Atmos. Chem. Phys., 13, 917–931, https://doi.org/10.5194/acp-13-917-2013, 2013.
Painemal, D., Minnis, P., and Sun-Mack, S.: The impact of horizontal heterogeneities, cloud fraction, and liquid water path on warm cloud effective radii from CERES-like Aqua MODIS retrievals, Atmos. Chem. Phys., 13, 9997–10003, https://doi.org/10.5194/acp-13-9997-2013, 2013.
Painemal, D., Kato, S., and Minnis, P.: Boundary layer regulation in the southeast Atlantic cloud microphysics during the biomass burning season as seen by the A-train satellite constellation, J. Geophys. Res.-Atmos., 119, 11288–11302, https://doi.org/10.1002/2014JD022182, 2014.
Painemal, D., Minnis, P., and Nordeen, M.: Aerosol variability, synoptic-scale processes, and their link to the cloud microphysics over the northeast Pacific during MAGIC, J. Geophys. Res.-Atmos., 120, 5122–5139, https://doi.org/10.1002/2015JD023175, 2015.
Painemal, D., Chiu, J.-Y. C., Minnis, P., Yost, C., Zhou, X., Cadeddu, M., Eloranta, E., Lewis, E. R., Ferrare, R., and Kollias, P.: Aerosol and cloud microphysics covariability in the northeast Pacific boundary layer estimated with ship-based and satellite remote sensing observations, J. Geophys. Res.-Atmos., 122, 2403–2418, https://doi.org/10.1002/2016JD025771, 2017.
Painemal, D., Clayton, M., Ferrare, R., Burton, S., Josset, D., and Vaughan, M.: Novel aerosol extinction coefficients and lidar ratios over the ocean from CALIPSO–CloudSat: evaluation and global statistics, Atmos. Meas. Tech., 12, 2201–2217, https://doi.org/10.5194/amt-12-2201-2019, 2019.
Quaas, J., Ming, Y., Menon, S., Takemura, T., Wang, M., Penner, J. E., Gettelman, A., Lohmann, U., Bellouin, N., Boucher, O., Sayer, A. M., Thomas, G. E., McComiskey, A., Feingold, G., Hoose, C., Kristjánsson, J. E., Liu, X., Balkanski, Y., Donner, L. J., Ginoux, P. A., Stier, P., Grandey, B., Feichter, J., Sednev, I., Bauer, S. E., Koch, D., Grainger, R. G., Kirkevåg, A., Iversen, T., Seland, Ø., Easter, R., Ghan, S. J., Rasch, P. J., Morrison, H., Lamarque, J.-F., Iacono, M. J., Kinne, S., and Schulz, M.: Aerosol indirect effects – general circulation model intercomparison and evaluation with satellite data, Atmos. Chem. Phys., 9, 8697–8717, https://doi.org/10.5194/acp-9-8697-2009, 2009.
Shinozuka, Y., Clarke, A. D., Nenes, A., Jefferson, A., Wood, R., McNaughton, C. S., Ström, J., Tunved, P., Redemann, J., Thornhill, K. L., Moore, R. H., Lathem, T. L., Lin, J. J., and Yoon, Y. J.: The relationship between cloud condensation nuclei (CCN) concentration and light extinction of dried particles: indications of underlying aerosol processes and implications for satellite-based CCN estimates, Atmos. Chem. Phys., 15, 7585–7604, https://doi.org/10.5194/acp-15-7585-2015, 2015.
Sorooshian, A., Feingold, G., Lebsock, M. D., Jiang, H., and Stephens, G. L.: Deconstructing the precipitation susceptibility construct: Improving methodology for aerosol-cloud precipitation studies, J. Geophys. Res., 115, D17201, https://doi.org/10.1029/2009JD013426, 2010.
Sorooshian, A., Anderson, B., Bauer, S. E., Braun, R. A., Cairns, B., Crosbie, E., Dadashazar, H., Diskin, G., Ferrare, R., Flagan, R. C., Hair, J., Hostetler, C., Jonsson, H. H., Kleb, M. M., Liu, H., MacDonald, A. B., McComiskey, A., Moore, R., Painemal, D., Russell, L. M., Seinfeld, J. H., Shook, M., Smith Jr., W. L., Thornhill, K., Tselioudis, G., Wang, H., Zeng, X., Zhang, B., Ziemba, L., and Zuidema, P.: Aerosol–cloud–meteorology interaction airborne field investigations: Using lessons learned from the U.S. West Coast in the design of ACTIVATE off the U.S. East Coast, B. Am. Meteorol. Soc., 100, 1511–1528, 2019.
Stier, P.: Limitations of passive remote sensing to constrain global cloud condensation nuclei, Atmos. Chem. Phys., 16, 6595–6607, https://doi.org/10.5194/acp-16-6595-2016, 2016.
Twohy, C. H., Petters, M. D., Snider, J. R., Stevens, B., Tahnk, W., Wetzel, M., Russell, L., and Burnet, F.: Evaluation of the aerosol indirect effect in marine stratocumulus clouds: Droplet number, size, liquid water path, and radiative impact, J. Geophys. Res., 110, D08203, https://doi.org/10.1029/2004JD005116, 2005.
Várnai, T. and Marshak, A.: Satellite observations of cloud-related variations in aerosol properties, Atmosphere, 1–17, https://doi.org/10.3390/atmos9110430, 2018.
Winker, D. M., Pelon, J., Coakley, J. A., Ackerman, S. A., Charlson, R. J., Colarco, P. R., Flamant, P., Fu, Q., Hoff, R. M., Kittaka, C., Kubar, T. L., Le Treut, H., Mccormick, M. P., Mégie, G., Poole, L., Powell, K., Trepte, C., Vaughan, M. A., and Wielicki, B. A.: The CALIPSO Mission, B. Am. Meteorol. Soc., 91, 1211–1230, https://doi.org/10.1175/2010BAMS3009.1, 2010.
Wood, R.: Stratocumulus Clouds, Mon. Weather Rev., 140, 2373–2423, 2012.
Wood, R., Leon, D., Lebsock, M., Snider, J., and Clarke, A. D.: Precipitation driving of droplet concentration variability in marine low clouds, J. Geophys. Res., 117, D19210, https://doi.org/10.1029/2012JD018305, 2012.
Zhang, Z. and Platnick, S.: An assessment of differences between cloud effective particle radius retrievals for marine water clouds from three MODIS spectral bands, J. Geophys. Res., 116, D20215, https://doi.org/10.1029/2011JD016216, 2011.