the Creative Commons Attribution 4.0 License.
the Creative Commons Attribution 4.0 License.
 | 08 Jun 2020
Condensation/immersion mode ice-nucleating particles in a boreal environment
Mikhail Paramonov
Saskia Drossaart van Dusseldorp
Ellen Gute
Jonathan P. D. Abbatt
Paavo Heikkilä
Jorma Keskinen
Xuemeng Chen
Krista Luoma
Liine Heikkinen
Liqing Hao
Tuukka Petäjä
Ice-nucleating particle (INP) measurements were performed in the boreal environment of southern Finland at the Station for Measuring Ecosystem–Atmosphere Relations (SMEAR II) in the winter–spring of 2018. Measurements with the Portable Ice Nucleation Chamber (PINC) were conducted at 242 K and 105 % relative humidity with respect to water. The median INP number concentration [INP] during a 6-week measurement period was 13 L−1. The [INP] spanned 3 orders of magnitude and showed a general increase from mid-February until early April. No single dominant local or regional sources of INPs in the boreal environment of southern Finland could be identified. Rather, it is hypothesised that the INPs detected at SMEAR II are a result of long-range transport and dilution of INPs sourced far from the measurement site. Despite high variability, the measured [INP] values fall within the range expected for the [INP] measured elsewhere under similar thermodynamic conditions. The [INP] did not correlate with any of the examined parameters during the entire field campaign, indicating that no one single parameter can be used to predict the [INP] at the measurement location during the examined time period. The absence of a correlation across the entire field campaign also suggests that a variety of particles act as INPs at different times, although it was indirectly determined that ambient INPs are most likely within the size range of 0.1–0.5 µm in diameter on average. On shorter timescales, several particle species correlated well with the [INP]. Depending on the meteorological conditions, black carbon (BC), supermicron biological particles and sub-0.1 µm particles, most likely nanoscale biological fragments such as ice-nucleating macromolecules (INMs), correlated with the INP signal. However, an increase in the concentration of any of these particle species may not necessarily lead to the increase in the [INP]; the reasons for this remain unknown. Limitations of the instrumental set-up and the necessity for future field INP studies are addressed.
- Article
(2170 KB) - Full-text XML
- BibTeX
- EndNote


Atmospheric aerosol particles play an important role in the global climate by influencing the Earth's hydrological cycle, energy and radiation balance. Due to their importance, aerosol–cloud interactions have been a subject of intense research over the last several decades (e.g. Twomey, 1974; Lohmann and Feichter, 2005; DeMott et al., 2010; Kerminen et al., 2012). Nevertheless, the exact quantification of aerosol effects on the changing cloud properties and the ability to predict future climate based on expected changes in the global aerosol burden have been challenging (Boucher et al., 2013).
Ubiquitous in the atmosphere, aerosol particles are responsible for the formation of liquid and ice clouds due to their respective roles as cloud condensation nuclei (CCN) and ice-nucleating particles (INPs). Both have received a lot of attention in recent years, with a multitude of studies attempting to quantify the importance of aerosols in the aerosol–cloud–climate system. The warm cloud regime, i.e. the formation of liquid droplets on CCN, is understood fairly well (Andreae, 2009, and references therein; Paramonov et al., 2015); however, establishing the exact connection between CCN and the cloud droplet number concentration has remained challenging (Moore et al., 2013). At the same time, the cold and mixed-phase cloud regimes, i.e. the formation of ice crystals on INPs, present many open questions (DeMott et al., 2011; Kanji et al., 2017). Ice crystals in the atmosphere can form homogeneously, i.e. by freezing of pure water drops in the absence of any insoluble foreign substances. Such a process requires temperatures below −37 ∘C (e.g. Murray et al., 2010). In the temperature range between −37 and 0 ∘C, ice can form heterogeneously, i.e. when the freezing is aided by an INP. Heterogeneous ice nucleation has four known mechanisms: deposition nucleation, condensation freezing, immersion freezing and contact freezing (Vali, 1985; Vali et al., 2015); however, the significance and prevalence of each individual mechanism in atmospheric ice nucleation are still under debate. More recently it has also been shown that pore condensation and freezing could be an alternative to deposition nucleation (Marcolli, 2014; David et al., 2019).
The difficulty in understanding ice nucleation (IN) processes in the atmosphere is associated with the rarity of ambient INPs (DeMott et al., 2010), spatiotemporal variability of particle species known to be good INPs (Boose et al., 2016b; Welti et al., 2018), elusiveness of exact particle properties leading to atmospheric ice nucleation (Knopf et al., 2014; Paramonov et al., 2018) and secondary ice production mechanisms (Hallett and Mossop, 1974; Field et al., 2017). Atmospheric INP number concentrations [INP], while increasing with decreasing temperature, reach maximum values of 1000–10 000 L−1 (DeMott et al., 2010), which is orders of magnitude lower than CCN number concentrations or total aerosol particle number concentrations (Paramonov et al., 2015). At warmer sub-zero temperatures, where the nucleation rate is low and at which the first ice nucleation events take place, [INP] values are extremely small, e.g. L−1 (Petters and Wright, 2015). Such low concentrations make it difficult to identify these particles and assess their atmospheric relevance. INP activity under different atmospheric conditions has been investigated for several particle species, such as mineral dust (e.g. Cantrell and Heymsfield, 2005), biological aerosols (e.g. Després et al., 2012, and references therein), black carbon (BC; e.g. DeMott, 1990) and marine organic aerosol (e.g. Ladino et al., 2016; McCluskey et al., 2017). Even for these well-known INP species, their exact properties responsible for ice nucleation, i.e. active sites, are not well understood (Kanji et al., 2017). It is generally agreed that larger particles make better INPs (Mason et al., 2016). This is especially true for insoluble particle such as mineral dust (Hartmann et al., 2016), and it is due to the increased probability of IN-active sites on a larger surface (Archuleta et al., 2005). Biological particles, such as bacteria, fungal spores and pollen, have also been shown to be effective INPs (e.g. Hartmann et al., 2013; O'Sullivan et al., 2015). These particles can be small, less than 1 µm in diameter (Kanji et al., 2017), although it is understood that these nanoscale biological fragments are typically attached to a larger carrier particle (e.g. Augustin-Bauditz et al., 2016). The role of BC as an INP in the mixed-phase cloud regime remains uncertain, as some studies point out its potential atmospheric relevance (McCluskey et al., 2014), whereas others indicate that BC does not result in any significant heterogeneous ice nucleation (Mahrt et al., 2018; Vergara-Temprado et al., 2018).
Previous studies have alluded to ambient INPs not being of any particular chemical composition or predisposition to ice nucleation at all (Knopf et al., 2014; Paramonov et al., 2018). Additionally, even if the [INP] is accurately determined, there is a disconnect, often of orders of magnitude, between the INP number concentration and the ice crystal number concentration (ICNC; Cantrell and Heymsfield, 2005). Several secondary ice production mechanisms are known to contribute to elevated ICNC compared with the [INP]; however, exactly how the ICNC will respond to changes in the [INP], if at all, remains unresolved. Despite these uncertainties, it has been shown that ice is present in significant amounts in various cloud types around the globe (Lau and Wu, 2003; Sporre et al., 2014), and ice most certainly plays a nontrivial role in cloud radiative properties and their response to phase changes (e.g. Lohmann, 2002).
In order to probe the INP number concentration in various environments, a multitude of field measurements have taken place over the last decade, utilising the latest technological developments, with an overview of these measurement endeavours presented in Kanji et al. (2017). The studies have shown that the ambient [INP] varies by 10 orders of magnitude across all sub-freezing temperatures, and, as expected from the classical nucleation theory (CNT; aufm Kampe and Weickmann, 1951), a decrease in temperature leads to an increase in the [INP]. Despite the wide range of ambient [INP] values and types, at any given temperature [INP] typically varies by ∼4 orders of magnitude, reaching values as high as >103 L−1 at temperatures just above homogeneous freezing. This somewhat restricted range of ambient [INP] values coupled with the increasing knowledge of INP properties has led to the development of parameterisations used to estimate ambient [INP] (Richardson et al., 2007; DeMott et al., 2010; Tobo et al., 2013). Therefore, field studies serve as both a basis for and a validation of these parameterisations.
Among the environments that have been selected for previous INP field studies, boreal forest stands out as having insufficient data on INP properties and processes. Boreal forest covers 7 %–8 % of the total continental area, and it spreads across North America, Asia and northern Europe between 50 and 70∘ N with local variation (Olson et al., 1983). However, the majority of ambient INP field measurements have focused on areas with significant concentrations of known INP species, e.g. desert outflow regions (e.g. Boose et al., 2016b; Welti et al., 2018) and the Southern Ocean (McCluskey et al., 2018). Therefore, the questions of what types of particles act as INPs and how they affect cloud properties in the boreal environment remain open. In order to bridge this gap in the knowledge of IN processes and characteristics in the boreal forest, a field campaign took place in southern Finland in winter–spring 2018. The objectives of the campaign included the quantification of the [INP] in condensation/immersion freezing modes under mixed-phase cloud conditions, the comparison to previously published data from other locations around the globe, and the probing of the predictive capacity of physical and chemical properties on the [INP] using correlations.
2.1 Measurement location
The ice nucleation measurements presented in this study took place in Hyytiälä, southern Finland, the location of the Station for Measuring Ecosystem–Atmosphere Relations (SMEAR II) (61∘50′50.685′′ N, 24∘17′41.206′′ E; 181 m a.m.s.l.). SMEAR II is a comprehensive measurement station with a multitude of continuous online and offline measurements of various gas, aerosol, soil, meteorological and radiation parameters (Hari and Kulmala, 2005). The station is located in a boreal coniferous forest surrounded mostly by Scots pine. The nearest city of Tampere (population of 220 000) is located 50 km south-west of the station; therefore, the station is considered to be a rural background site. SMEAR II experiences both continental and maritime air masses, although particle number concentrations are typically low (Sogacheva et al., 2005).
The measurement campaign lasted from 19 February until 2 April 2018 and took place as part of the HyICE-2018 measurement activities performed by several national and international research groups.
2.2 Instrumentation and set-up
2.2.1 General set-up
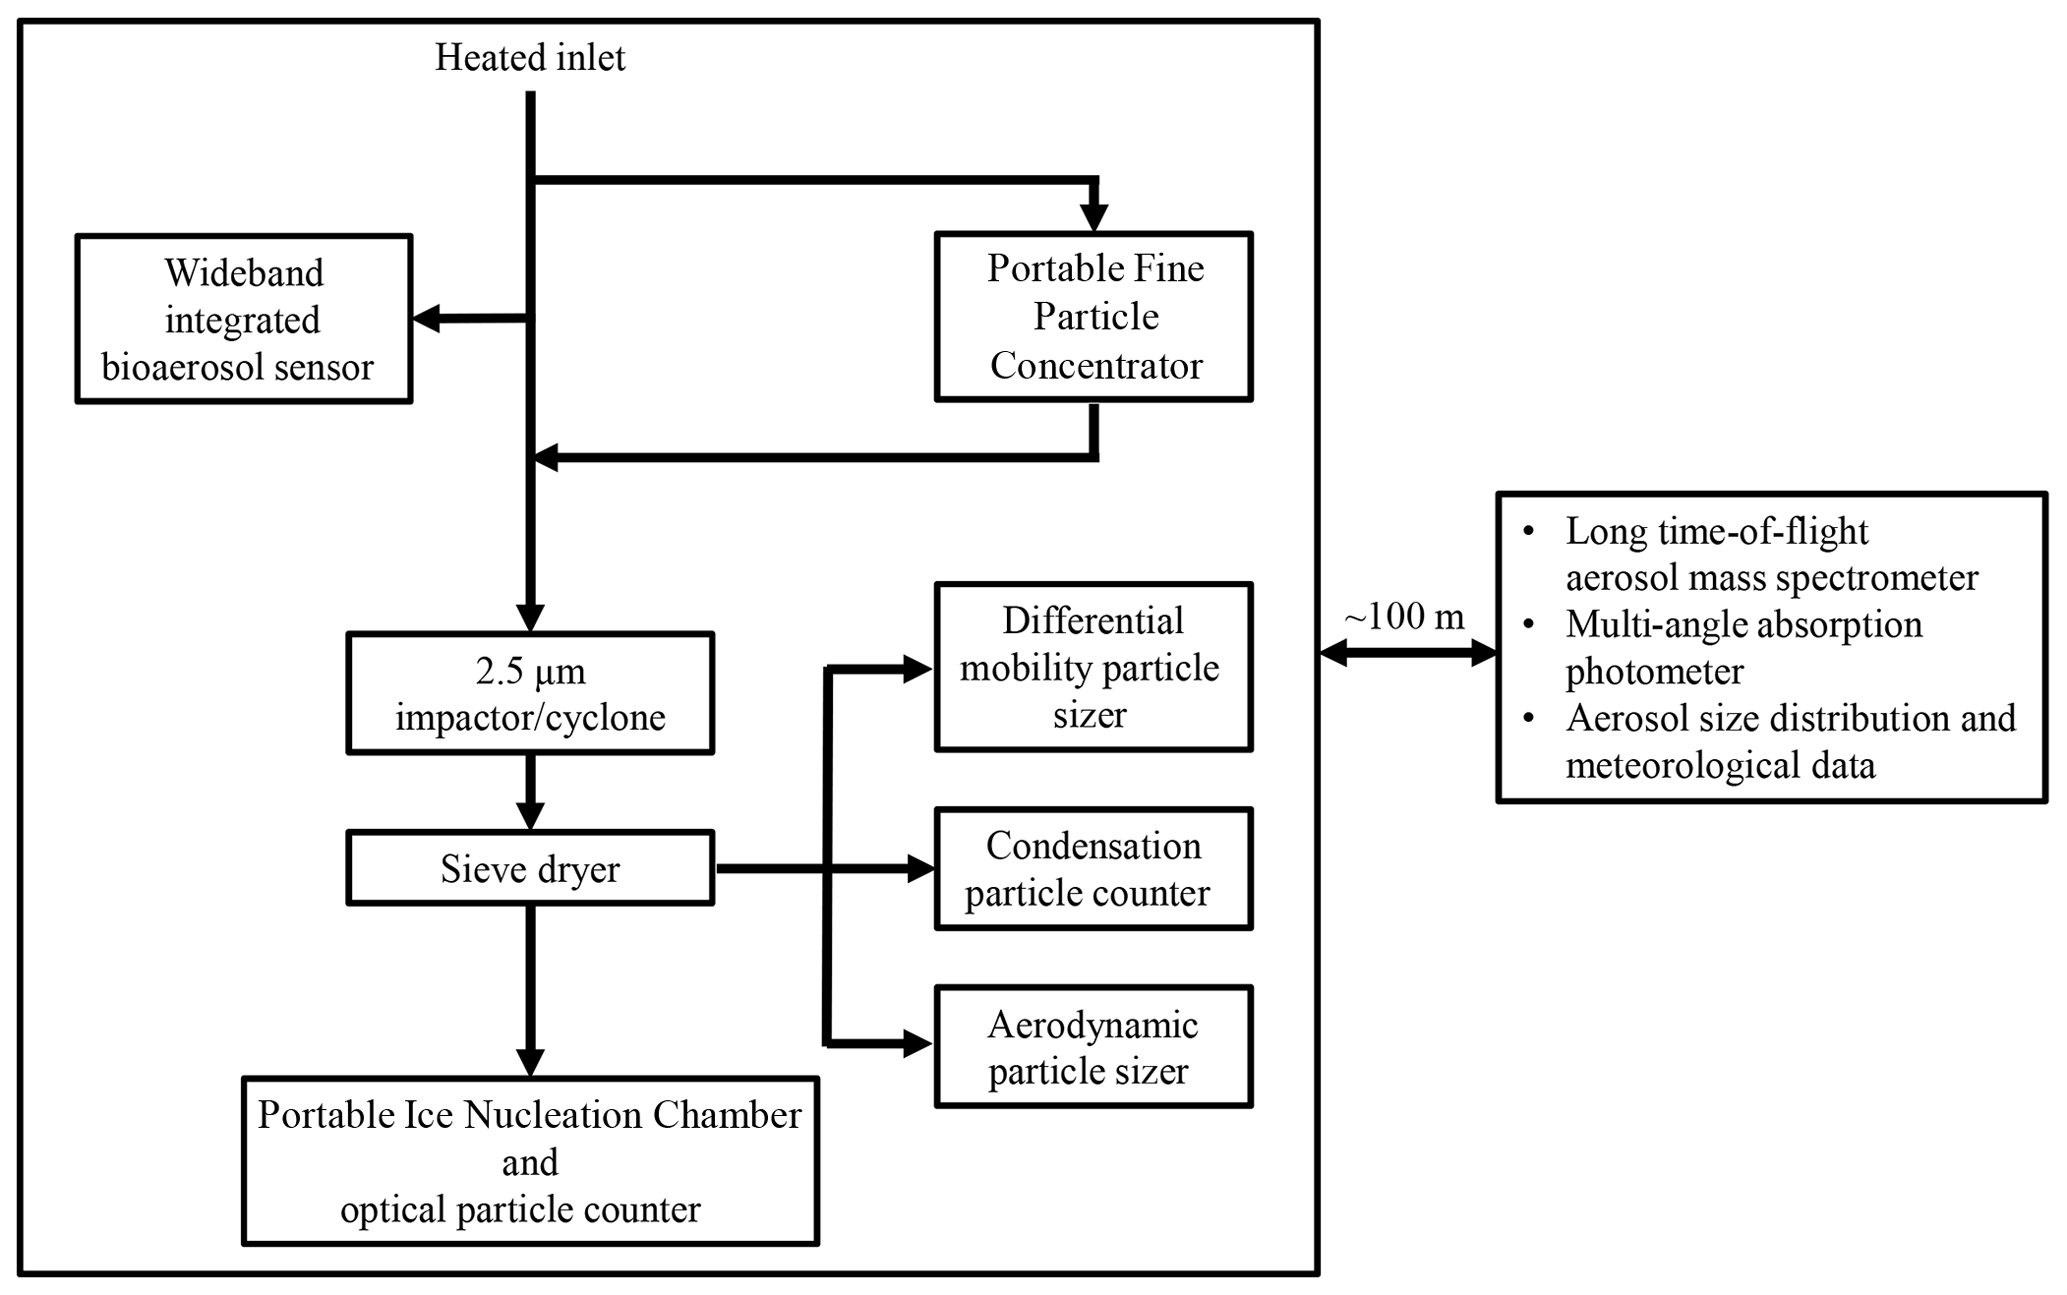
The basic instrumental set-up can be seen in Fig. 1. Ambient air was drawn through a vertical ∼2 m tall inlet mounted outside of the building. The inlet was heated to 25–30 ∘C and sampled ambient air with a flow rate of 250 L min−1. The inlet was heated in order to evaporate droplets and ice crystals entering the measurement set-up as well as to avoid the potential condensation of water vapour on the inner surfaces of the tubing and instruments. The sample flow then entered the Portable Fine Particle Concentrator (PFPC), described by Gute et al. (2019) and based on the design by Sioutas et al. (1995). The PFPC efficiently concentrates aerosol particles up to a factor of 21±5 when operated at low altitude and in a horizontal configuration, with a size-dependent enrichment factor where larger particles are concentrated more efficiently than smaller ones (Gute et al., 2019). In this study the size-dependent concentration factor was determined for ambient particles of various sizes by measuring the total particle number size distribution before and after the PFPC. The PFPC was used in order to improve the signal-to-noise ratio and to allow for a longer duration of INP measurements. The output flow of the PFPC is ∼10 L min−1. For non-concentrated measurements, the PFPC was bypassed, and ambient air was sampled directly through the heated inlet. Since large particles entering the measurement set-up can be mistaken for ice crystals, an impactor with a cut-off size of 2.5 µm was installed inside the PFPC, and a cyclone with a similar cut-off size was used for ambient measurements. This set-up was operated until 20 March when the impactor was removed; thereafter, both the concentrated and non-concentrated air passed through the same cyclone. As seen in Fig. 1, the sample flow passed through a molecular sieve dryer in order to reduce the relative humidity. The flow was then split in four parts: a condensation particle counter (CPC, TSI model 3010) used 1 L min−1 to determine the total number of particles entering the measurement set-up; an aerodynamic particle sizer (APS, TSI model 3321) used 1 L min−1 to determine the size distribution of particles in the size range of 0.5–20 µm in aerodynamic diameter; a differential mobility analyser (DMA) connected to a CPC (TSI model 3772) used 1 L min−1 to determine the size distribution of aerosol particles in the size range of 0.01–0.5 µm in electrical mobility diameter; and another 1 L min−1 was used for the INP measurements by the Portable Ice Nucleation Chamber (PINC) and an optical particle counter (OPC, Lighthouse Remote 5104).
2.2.2 PINC
PINC is a continuous flow diffusion chamber (CFDC) type of instrument (Rogers, 1988) used for online INP measurements. It has been used for both laboratory (e.g. Kanji et al., 2013; Paramonov et al., 2018) and field studies (e.g. Boose et al., 2016b). The main chamber of PINC consists of two parallel walls coated with a thin layer of ice. The temperature of both walls can be controlled in such a manner that a temperature gradient can be established between the walls while maintaining the desired temperature close to the centreline of the chamber. The ice on the walls and the applied temperature gradient result in a water vapour supersaturation between the walls, with a maximum close to the centreline of the chamber. When the temperature of both walls is the same, the relative humidity with respect to ice (RHi) is 100 % and the chamber environment is subsaturated with respect to water. As the temperature gradient is applied, the relative humidity with respect to water (RHw) can increase to over 100 %. Thus, PINC allows one to perform an RH scan at a constant temperature in both sub- and supersaturated conditions with respect to water. The RHw of 100 % also delineates what is considered to be the boundary between deposition nucleation (RHw<100 %) and condensation/immersion freezing regimes (RHw>100 %), although a more accurate differentiation between these regimes is not possible. The sample flow of 1 L min−1 is guided by two particle-free sheath flows, which are 4.5 L min−1 each. As aerosol particles travel close to the centreline of the chamber in a quasi-laminar flow, some particles activate as INPs, some activate as CCN and some remain unactivated. The total residence time (i.e. the time for activation and growth) of particles inside the chamber is nominally 7 s. In order to avoid miscounting liquid droplets for ice crystals, an evaporation section follows the main chamber. In this section the walls are held at the same temperature; therefore, RHi is 100 % and RHw is below 100 %. Under these conditions droplets evaporate and ice crystals are preserved. An OPC downstream of PINC measures the size distribution of all particles exiting the chamber. Based on the diffusional growth calculations (Rogers and Yau, 1989), a size threshold of ∼3.5 µm was determined, beyond which all particles are assumed to be ice crystals. The number of particles above this size is then considered to be the INP number concentration, [INP]. The temperature uncertainty in the laminar flow of PINC is ±0.4 K, which is equivalent to the RHw uncertainty of ±2 % (Chou et al., 2011).
PINC is an online instrument that measures the [INP] in real time. However, the duration of its operation and the limit of detection (LOD) are limited by the quality of ice on the walls, which deteriorates over time, especially at high RHw. Large ice crystals and frost particles can fall off the walls and be erroneously miscounted as activated INPs. The concentration of these internally produced ice crystals is commonly referred to as the background signal, and it is measured by redirecting the main sample flow through a high-efficiency particulate air (HEPA) filter. The LOD of PINC is calculated as the error of the background concentration. At some point, normally after 4 to 5 h of measurements, the background signal becomes higher than the sample signal. At this point the ice needs to be melted, the chamber needs to be purged and the walls need to be re-iced. One icing cycle, which typically lasts 4 to 5 h, is hereafter referred to as an experiment. One or two experiments per day were conducted throughout the campaign, always between 10:00:00 and 23:00:00 local time (UTC+2).
For the duration of the entire measurement campaign PINC was measuring the [INP] at a temperature of −31 ∘C (242 K) and at an RHw of 105 %, i.e. in condensation/immersion freezing mode. The chosen measurement conditions are to simulate mixed-phase cloud conditions and to ensure that all IN-active particles are exposed to droplet activation conditions (DeMott et al., 2015). The measurement conditions also allowed for a significant fraction of particles to activate into ice crystals and the ability to compare the measured data to previously published results (Boose et al., 2016a, b).
2.2.3 Long time-of-flight aerosol mass spectrometer (L-ToF-AMS)
Starting on 2 March, the ambient aerosol chemical composition was measured with a long time-of-flight aerosol mass spectrometer (L-ToF-AMS) that is built upon the same characteristics as the high-resolution ToF-AMS described in DeCarlo et al. (2006). However, the time-of-flight chamber in the L-ToF-AMS is longer, enabling the resolution to approach 8000 M∕ΔM, which helps with separating and identifying different peaks located close to each other in the mass spectrum. Due to the small sampling flow rate of the instrument, an overflow of 3 L min−1 was used to avoid losses in the inlet line. The sampling line also included a Nafion dryer with 4 L min−1 dry air flushing in order to keep the RH below 30 %. The L-ToF-AMS was operating ∼100 m away from the main INP measurement location. The low size for 100 % transmission efficiency of the L-ToF-AMS is about 45 nm in electrical mobility (Liu et al., 2007). A PM2.5 cyclone was mounted upstream of the inlet line to avoid clogging of the instrument critical orifice (diameter of 100 µm). The L-ToF-AMS ionisation efficiency (IE) was calibrated using atomised, dried and size-selected 300 nm ammonium nitrate particles. A CPC (TSI 3772) was used as the reference instrument. The IE calibration was performed at the beginning of the AMS measurements. The AMS data were analysed using a standard ToF-AMS data analysis toolkit (Squirrel V1.61B and PIKA1.21B). For mass concentration calculation, the default relative ionisation efficiency (RIE) values of 1.1, 1.2, 1.3 and 1.4 for nitrate, sulfate, chloride and organics, respectively, were applied. The RIE for ammonium was 3.7 and was determined from IE calibration. A composition-dependent collection efficiency (CE) was applied based on the principle proposed by Middlebrook et al. (2012).
2.2.4 The wideband integrated bioaerosol sensor (WIBS)
Starting on 11 March, the wideband integrated bioaerosol sensor (WIBS-NEO; DMT) was installed directly downstream of the heated inlet in order to measure the concentration of biological fluorescent particles above 0.5 µm in diameter in the ambient air. WIBS excites the particles with a laser and records the emission from fluorescent particles in the wavelength range from 0.31 to 0.65 µm (Toprak and Schnaiter, 2013).
2.2.5 Additional instrumentation
Besides the instruments described above, which were deployed specifically during the field campaign, several other datasets have been used to complement the ice nucleation measurements. Most of these data are measured continuously at the SMEAR II station and are freely available via the AVAA open research data portal (https://avaa.tdata.fi/web/avaa/etusivu, last access: 24 July 2018; Junninen et al., 2009). The auxiliary datasets used include meteorological data from SMEAR II (temperature, T; pressure, P; relative humidity, RH; wind speed, WS; wind direction; and cloud base height), aerosol particle size distributions in the size range between 0.002 and 20 µm measured by the local differential mobility particle sizer (DMPS) and APS, total aerosol particle number concentration measured by the local CPC (Ntot), and the black carbon (BC) concentration measured by the multi-angle absorption photometer (MAAP). It should be noted, however, that most of these data were not measured directly at the same location as the INP measurements – rather within a ∼100 m vicinity.
2.2.6 Trajectory analysis
In an attempt to identify potential sources of the measured [INP] in the boreal environment of southern Finland, a trajectory analysis was performed using the HYSPLIT_4 (HYbrid Single-Particle Lagrangian Integrated Trajectory) trajectory model (Draxler and Hess, 1998; Heinzerling, 2004). Each 48 h back trajectory was calculated with the arrival time corresponding to the mid-point of the [INP] measurement time. Trajectories were calculated for an arrival height of 100 m a.g.l. (above ground level), which is the arrival height closest to the ground and represents the boundary layer conditions at SMEAR II well. Sensitivity tests conducted with trajectory arrival heights of 200 and 500 m a.g.l. did not reveal any differences.
2.3 Data treatment
As mentioned in the previous section, the measurement signal in PINC can be significantly affected by the background signal, i.e. ice crystals and frost particles produced internally by the iced walls. To account for the background signal, background measurements are taken before and after each sample measurement. The two background signal data points are linearly interpolated across the ambient sample measurement time and subtracted from the corresponding ambient signal. PINC records a data point every 12 s, and a single background-corrected [INP] data point can fall into one of the three following categories:
-
[INP] can be above the LOD,
-
[INP] can be positive and below the LOD, or
-
[INP] can be negative.
Normally, only [INP] values that are above the LOD are reported, i.e. [INP]excl<LOD. However, since atmospheric INP number concentrations are typically low (DeMott et al., 2010), this method of reporting the [INP] is biased towards high values and would omit potentially significant low INP number concentrations. In order to better represent ambient [INP] and include [INP] values below the LOD, an approach suggested by Boose et al. (2016a) and Lacher et al. (2017) was adopted. In this approach, the [INP] values falling into category 2 () are given the benefit of the doubt and are assumed to hold. [INP] values falling into category 3 ([INP]<0) are replaced with the minimum possible detectable value during the sampling time. This value was calculated by dividing one INP ([INP]=1) by the total volume of air sampled during the sample period. INP concentrations calculated using this approached are denoted as [INP]incl<LOD. In order to account for the high variability of the background and sample signals, INP number concentrations are typically reported as 20 min averages. A background measurement before and after each 20 min sample measurement is taken for 10 min. During the last several days of the campaign, the time of each sample and background measurement was reduced to 15 and 7.5 min respectively.
From 24 February until 21 March, the PFPC was used in order to increase the signal-to-noise ratio and to allow for longer INP measurements. At the beginning of each experiment a concentrated measurement point [INP]conc was taken first. This was followed by an ambient measurement point [INP]amb when PFPC was bypassed. These first two measurement points were then used to calculate an enrichment factor (EF) for each experiment:
[INP]conc was measured for the remainder of each experiment, and the EF was then used to back-calculate [INP]amb. The use of an EF assumes that no major changes in air masses and aerosol size distributions took place during each experiment when the EF was measured and applied to the [INP]conc data. Towards the end of the campaign an improved icing procedure and a fairly high [INP]amb signal allowed for measurements without the concentrator. During the last several days of the campaign only [INP]amb was measured.
It has been reported in published literature that deviations of particles from the laminar flow are possible in CFDC-type ice nucleation chambers (DeMott et al., 2015; Garimella et al., 2017). In such cases, a fraction of aerosol particles outside of the lamina experiences RHw conditions below those intended. This leads to the particles outside of the laminar flow not activating into ice crystals or water droplets and a consequent underestimation of the [INP]. Correction factors of 3 (DeMott et al., 2015) and 1.4–9.5 (Garimella et al., 2017) have been suggested in order to account for the particle deviations outside of the laminar flow. Correction factor tests with PINC were performed in a laboratory setting prior to the field measurements in order to determine the correction factor that is specific to PINC and to the field measurement conditions (T of −31 ∘C and RHw of 105 %). The correction factor was determined to be 1.142, and all measured and reported INP concentrations have been multiplied by this correction factor. The details of the correction factor tests can be found in Drossaart van Dusseldorp (2018).
INP measurements with PINC took place between 21 February and 1 April 2018. Weather conditions throughout the campaign can be generally described as winter conditions, with snow on the ground present the entire time. The average temperature during the campaign was −7.6 ∘C, with lows down to −23 ∘C at the beginning of the campaign and highs up to 4 ∘C towards the end of the campaign. Until 12 March, meteorological conditions were dominated by high-pressure systems, with winds normally from the northerly, north-easterly, easterly and south-easterly sectors. Low-pressure systems with winds normally from the south-westerly, westerly, north-westerly and northerly sectors dominated after 12 March. The median total particle number concentration throughout the campaign was 1996 cm−3, with the 5th and 95th percentiles being 591 and 5554 cm−3 respectively. Of the total 40 measurement days, new particle formation was observed on half of those days (Dal Maso et al., 2005). A total of 59 experiments were conducted with PINC, and 393 [INP] values were measured throughout the campaign.
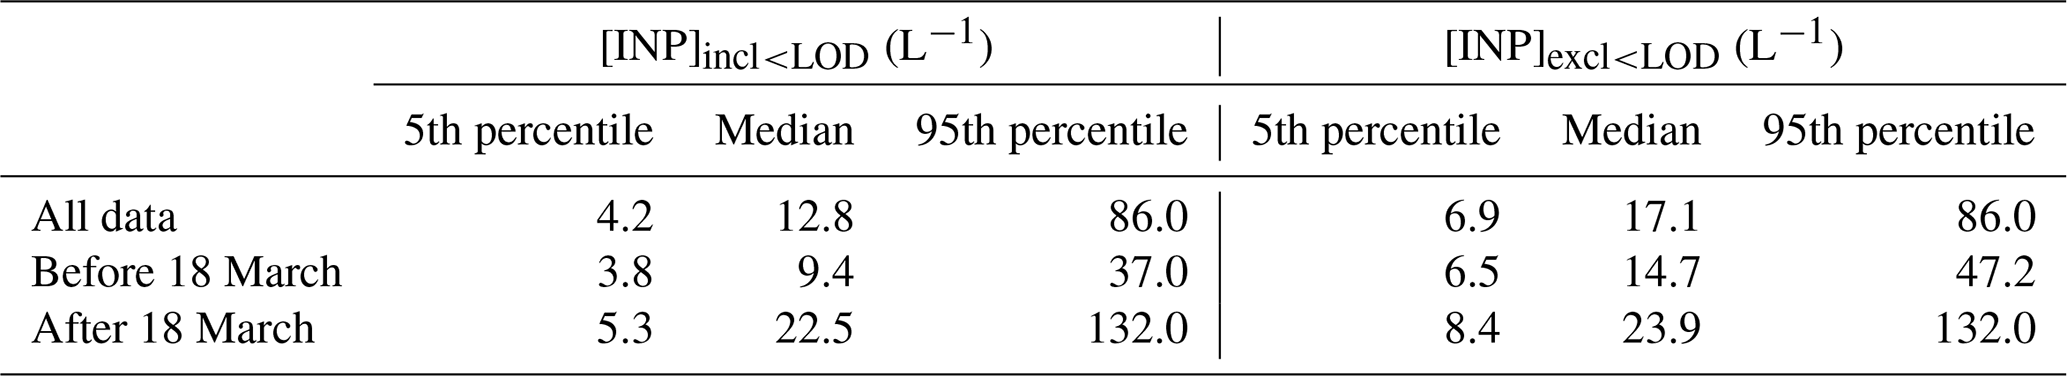
Table 1Median, 5th and 95th percentile values of the INP number concentration calculated by including or excluding values below the LOD.
3.1 INP number concentration
3.1.1 Data treatment
As mentioned in Sect. 2, the average [INP] values can be calculated including or excluding values below the LOD. Table 1 presents INP number concentrations calculated using both methods. As expected, the median [INP]excl<LOD is higher than the median [INP]incl<LOD with values of 17.1 and 12.8 L−1 respectively. A two-sample t test revealed no significant difference between the two datasets at a 5 % significance level. This indicates that the exclusion of data points below the LOD across the whole field campaign does not lead to a significant overestimation of the [INP], and either data treatment method is appropriate. However, Table 1 also shows the results before and after 18 March. The date of 18 March was chosen due to a 3 d break in measurements. It can be seen that before 18 March the difference between [INP]excl<LOD and [INP]incl<LOD is larger and is significant at a 5 % significance level. This is a direct consequence of [INP] values being generally lower before 18 March and, therefore, more values falling below the LOD. On the contrary, after 18 March INP concentrations were generally higher, fewer values fell below the LOD, and the inclusion or exclusion of values below the LOD did not lead to a significant difference. Logically, the exclusion of values below the LOD becomes more important as more values fall below the LOD, and across all measurements presented here, i.e. at the median [INP] above 10 L−1, the chosen data treatment is not crucial. However, Boose et al. (2016a) reported that even at median [INP] values as low as 2.2 L−1, measured with PINC at Jungfraujoch during the winter of 2014 under similar T and RH conditions, the difference between including or excluding data points below the LOD was also small. In an attempt to accurately represent ambient INP number concentrations and due to the lack of a statistically significant difference between the datasets, the following discussion focuses solely on [INP]incl<LOD.
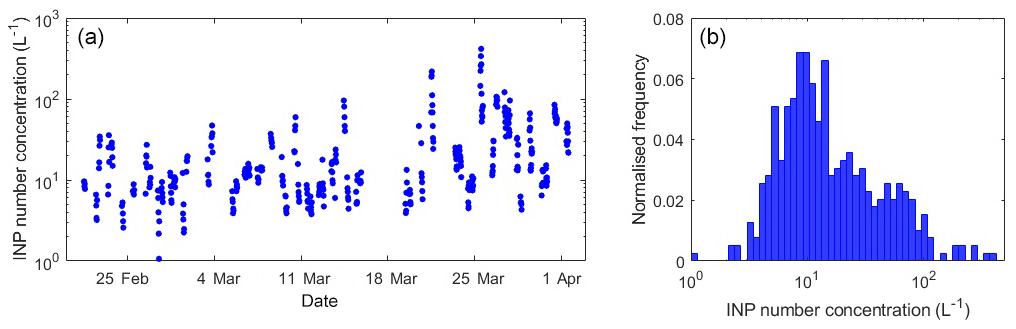
Figure 2The [INP] time series throughout the whole campaign (a) and its normalised frequency distribution (b).
3.1.2 General information
As mentioned in the previous paragraph, the median [INP]incl<LOD during the entire campaign was 12.8 L−1, and the time series of the INP number concentration during the campaign can be seen in Fig. 2a. The INP number concentration shows a general increase throughout the campaign, which is also seen in Table 1. The median [INP] after 18 March was more than 2 times higher than before 18 March with values of 22.5 and 9.4 L−1 respectively. Overall, the [INP] varied by 3 orders of magnitude throughout the campaign, with the smallest value of 1 L−1 measured on 27 February, and the highest value of 416 L−1 measured on 25 March. Neither a diurnal profile nor a significant difference between daytime and nighttime [INP] values was found.
Figure 2b shows the normalised frequency distribution of all [INP]incl<LOD values, with the distribution being nearly lognormal. This has been seen in previous INP studies (Maruyama, 1961; Isaac and Douglas, 1971; Radke et al., 1976; Welti et al., 2018) and has been attributed to successive random dilutions (Ott, 1990). It can, therefore, be said that the ambient INP concentrations measured in the boreal environment are a result of random dilution during transport, and that there are no single dominant local sources of INPs at the measurement location. Similar to the conclusions drawn by Welti et al. (2018) for Cabo Verde, the measured INP concentrations in the boreal environment are representative of the background conditions influenced mostly by long-range transport. However, the postulated absence of local sources still does not answer the question of where the measured INPs come from and what their composition is.
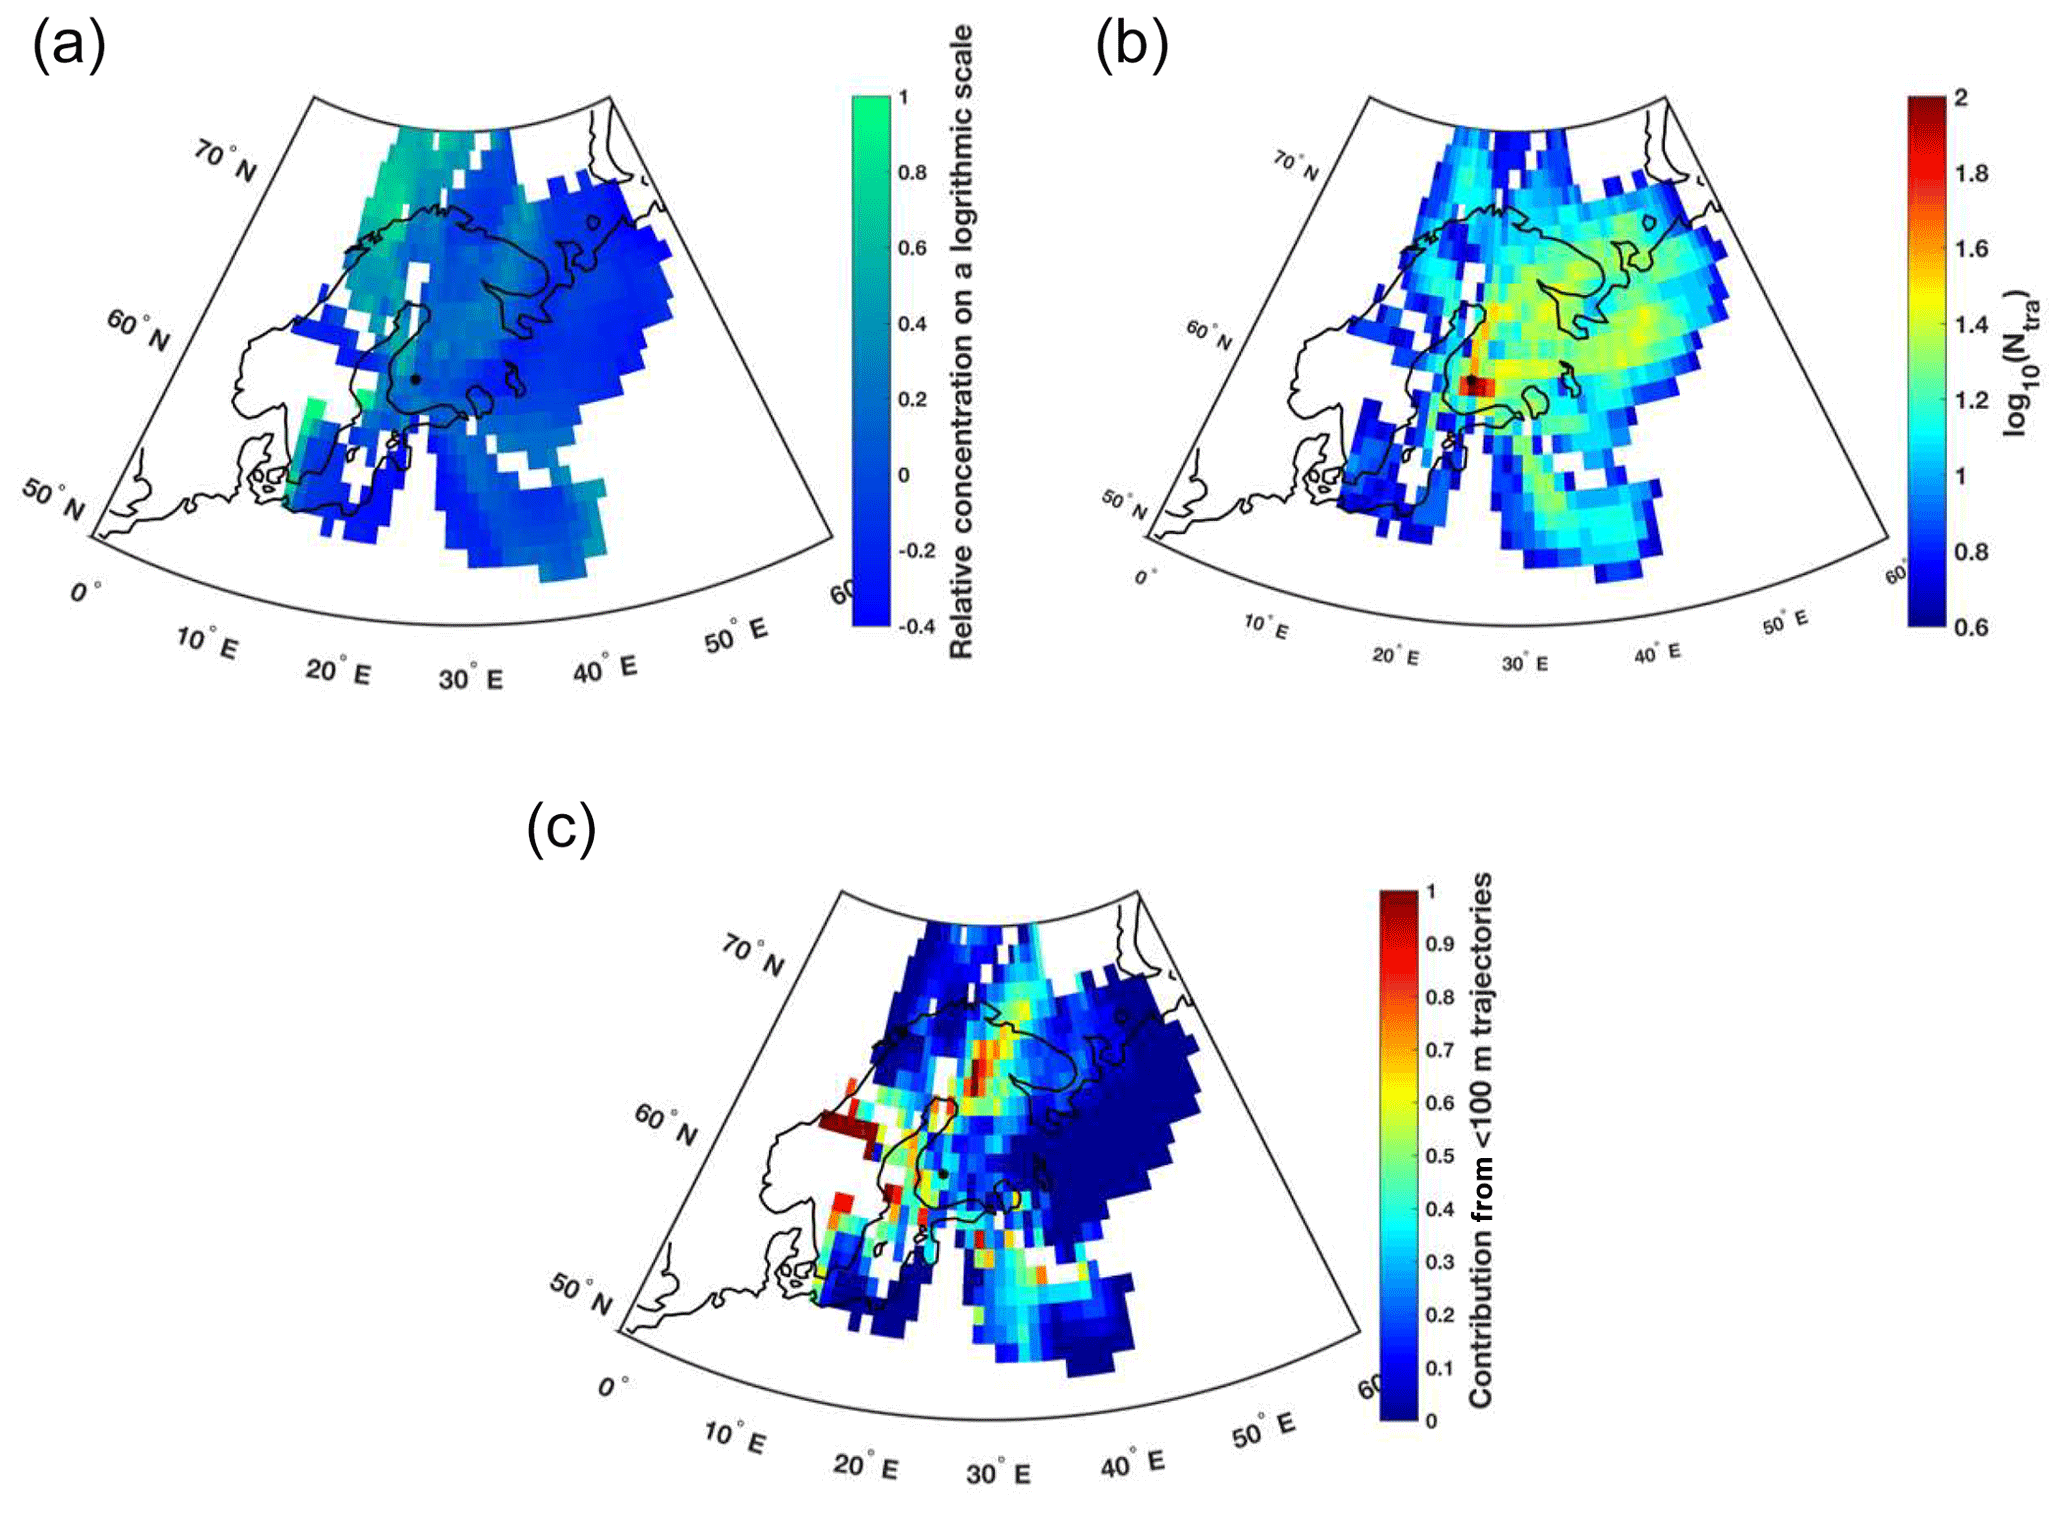
Figure 3(a) Trajectory-based frequency plot of the [INP] across the entire campaign. The concentration fields are shown on a logarithmic scale, and the colour bar indicates the deviation from the measured median INP number concentration of 12.8 L−1 (zero on the colour bar). (b) Number of trajectories passing through each grid cell. (c) Fraction of trajectories shown in panel (b) that pass at an elevation of <100 m a.g.l. In all panels, the grid size is 1∘ × 1∘, and only those grid cells with at least five trajectories passing through them are shown. The location of the Hyytiälä Forestry Field Station is marked using a black dot.
The results of the trajectory analysis are seen in Fig. 3. Figure 3a shows some spatial variability in the trajectory-based concentration values. It can be seen that air masses originating from the east and south of the measurement location are typically associated with low INP concentrations at the measurement site (blue colours). At the same time, elevated [INP] values are expected in air masses originating from northern sectors, i.e. north-east towards the Kola Peninsula and north-west above the Norwegian Sea (green colours). In order to assess the potential importance and significance of these source regions, Fig. 3b shows the number of trajectories passing through each grid cell, and Fig. 3c shows the fraction of trajectories in each grid cell that pass at an elevation of <100 m a.g.l. It can be seen that both source areas mentioned above have a considerable number of trajectories originating in these regions, demonstrating some statistical robustness of the observed elevated trajectory-based INP concentration values. At the same time, however, Fig. 3c shows that almost none of the trajectories passing these potential source regions are in contact with the ground surface, rendering the potential marine source of the Norwegian Sea and the boreal forest source north-east of Hyytiälä improbable. It must be concluded that on a regional scale across a 6-week measurement campaign no specific source region of INPs can be singled out. This means that (1) the elevated [INP] seen in Fig. 2a could originate from different areas, and (2) there is a likelihood of long-range transport of INPs to the boreal environment in southern Finland from areas outside of those depicted on the maps in Fig. 3.
3.1.3 Comparison to previous field studies
Comparing the [INP] values presented here to values measured elsewhere with similar instrumental set-ups, it can be said that the [INP] in a boreal environment is similar to that measured in other regions of the world. Boose et al. (2016b) measured [INP] with PINC under similar conditions at the Izaña observatory in Tenerife, Spain and reported mean values of 229 and 23 L−1 for the summers of 2013 and 2014 respectively. It should be noted, however, that [INP] values at Izaña are frequently affected by Saharan dust events, a phenomenon unlikely to have a significant impact on the [INP] in the boreal environment of southern Finland (Sogacheva et al., 2005). While the [INP] values at Hyytiälä and Izaña can be considered comparable in magnitude, the sources of [INP] are different; this topic is addressed in more detail later in the paper. PINC measurements at the high Alpine station Jungfraujoch in the winter of 2014 resulted in a median [INP] value of 2.2 L−1 (Boose et al., 2016a), which is lower than those reported here. Similar can be said of measurements at Jungfraujoch performed with the Horizontal Ice Nucleation Chamber (HINC) in the winters of 2015 and 2016 (Lacher et al., 2017). The study reported median [INP] values below 5 L−1 for both winters. Immersion mode measurements of the [INP] at 243 K performed at the coastal marine boundary layer in Western Canada reported mean [INP] values of 3–15 L−1 (Mason et al., 2015), i.e. similar to those measured in the boreal environment in this study. This is despite differences in the sampling methods, given that particles smaller than 2.5 µm were sampled in our study, whereas particles up to 10 µm were sampled by Mason et al. (2015). The INP number concentrations measured at a similar temperature in the Amazon rainforest (∼10 L−1; Prenni et al., 2009) and in a ponderosa pine forest in Colorado (∼10–50 L−1; Tobo et al., 2013) also agree well with those measured in the boreal environment. Most recently, Welti et al. (2018) reported on the [INP] measured in the subtropical maritime boundary layer in the Cabo Verde islands with the Spectrometer for Ice Nuclei (SPIN) chamber under similar measurement conditions. The study reported a wide range of [INP] values at 241 K, spanning from 100 to 103 L−1. While the [INP] values measured in Hyytiälä compare well to some of the previously published results from other locations, it is assumed that INP sources in various environments may be different, contributing varying fractions to the total INP number. Since the boreal environment of southern Finland is unlikely to be significantly influenced by mineral dust, it then becomes even more important to identify potential sources of INPs at the SMEAR II location. It has to be reiterated that the [INP] measured in the boreal environment was not notably different from the [INP] measured in other parts of the world using similar measurement set-ups. The data collected at SMEAR II further add to the notion that INPs seem to be distributed rather uniformly around the globe, and that in the absence of local sources one can expect [INP] values to fall within a certain defined range regardless of the measurement location (Kanji et al., 2017; Lacher et al., 2018).
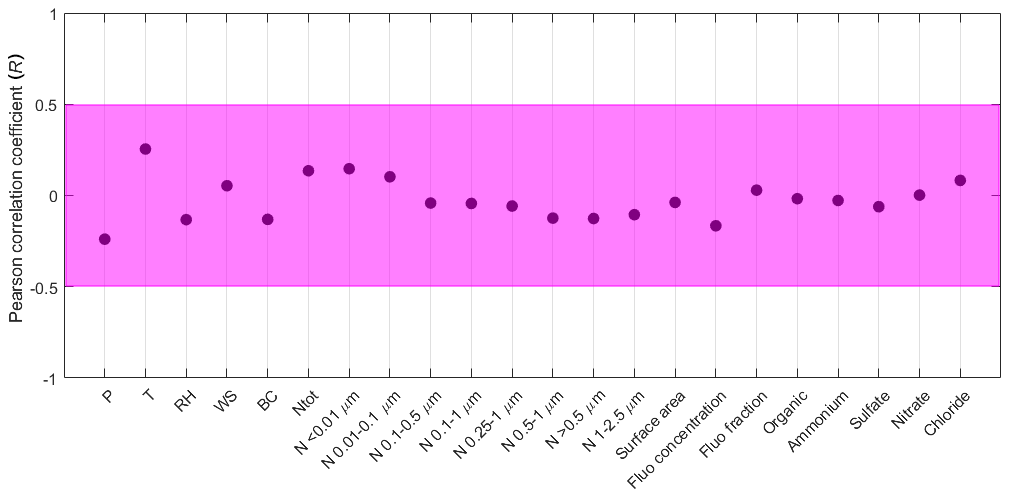
Figure 4Pearson correlation coefficients of the linear correlation between the entire time series of the [INP] and various meteorological and particle parameters. Magenta shading denotes the area of weak, if any, correlation ().
3.1.4 INP characterisation
In order to infer a predictive capacity of [INP], various meteorological and particle data have been used. Figure 4 depicts the Pearson correlation coefficients (R) of the linear correlation between the entire time series of measured [INP] and these various parameters. As seen in Fig. 4, all R values fall inside the shaded area (), indicating a weak correlation or no correlation at all. This means that across the 6-week measurement campaign, no specific parameter can be used to predict even up to 50 % of the observed [INP]. The absence of any significant correlation has several important implications. First, it suggests that none of the existing parameterisations used to estimate the ambient [INP] would reproduce the [INP] measured in the boreal environment in this study. This is true for parameterisations based on particle size (Richardson et al., 2007; DeMott et al., 2010) and those including the number of fluorescent biological active particles (FBAPs; Tobo et al., 2013). It seems as though other external parameters, those beyond particle size and the biological fraction, may be important for the observed temporal variability in the [INP] in the boreal environment during the measurement time. Second, it also indicates that a variety of particle types may act as INPs at different times. Since the campaign lasted for 6 weeks, any such changes in the INP identity would disappear when averaged over the entire measurement period. This issue is addressed in the following section. Third, the point-to-point variability in the [INP] values highlights the necessity for the high time resolution of ambient [INP] measurements. During the campaign the [INP] values were measured with 25–30 min intervals or even longer, and the [INP] on any given day varied by as much as 1 order of magnitude. For example, on 26 March the lowest and highest [INP] values measured 8 h apart were 11 and 106 L−1 respectively. Such variability would not be visible if INP measurements were conducted over several hours with, for example, a high-volume filter sampler.
As mentioned in Sect. 2, the PFPC was deployed during the first month of the campaign, and it may potentially provide some insight into the physical characteristics of the sampled ambient INPs. While the PFPC was in use, each icing cycle of PINC resulted in one INP enrichment factor (EF), and a total of 38 EF values were collected during the campaign. Similar to what was reported by Lacher et al. (2018), EF values varied between 5 and 35, and, with the PFPC particle enrichment being size dependent (Gute et al., 2019), the variability in the EF reflects the variability of air masses and, thus, the potential size range of particles active as INPs. As mentioned previously, total aerosol concentration factors were determined for the PFPC on several occasions during the campaign, and comparing EF values to these concentration factors can potentially shed light on the size of measured INPs. The median EF during the campaign was 13, and the total aerosol concentration factor of 13 corresponds to the particle mobility diameter of ∼300 nm. This may be an early indication that INPs were mostly around 300 nm in diameter on average during the measurement campaign. In fact, particles of this size range have previously been identified in ice crystal residuals (Mertes et al., 2007; Kupiszewski et al., 2016). Additionally, EF values correlate best with particles in the size range between 100 and 500 nm (R=0.61), strengthening the possibility that ambient INPs in the boreal environment are likely in this size range.
One important aspect needs to be addressed when correlating ambient INP number concentrations with particle physical and chemical properties. Activated fraction (AF) values, calculated as a ratio of the [INP] to the total number of particles entering the measurement set-up, span 3 orders of magnitude, with a median value of . This median value indicates that, on average, only 1 in 105 ambient aerosol particles acted as an INP. On 25 March, a day with a particularly elevated [INP], AF values increased to , meaning that 1 in 104 particles acted as an INP. At the same time measurements with WIBS and L-ToF-AMS were performed in bulk, i.e. sampling the entire aerosol population. Therefore, the absence of correlations between the [INP] and particle chemical properties is completely unsurprising. It is to be expected that an instrument measuring in bulk would not be able to characterise 1 in 104 particles. The same can be said of the reasons why the [INP] does not exhibit significant correlations with any of the particle size channels despite indications that ambient INPs may be in the 100–500 nm size range. Not every 300 nm particle will act as an INP, and, since their exact identity remains unknown, one is to expect the absence of correlation between the [INP] and the total number of particles in the 100–500 nm size range. This has important implications for future ambient INP measurements with CFDCs. If the INP physical and chemical properties are of interest, one needs to capture the activated INPs, i.e. ice crystals, at the exit of the chamber for further offline analysis. Such an endeavour can be performed, for instance, with a pumped counterflow virtual impactor (PCVI; e.g. Corbin et al., 2012).
3.2 Special case studies
As mentioned in the previous sections, the campaign lasted for 6 weeks, and the measurement location experienced various weather conditions and air masses over this time period. Therefore, if one is to assume that different particles act as INPs at different times, the predictive capacity of the [INP] over the entire duration of the field campaign would not be possible due to averaging. In order to investigate further, the focus is placed on shorter time periods, characterised by particular weather conditions.
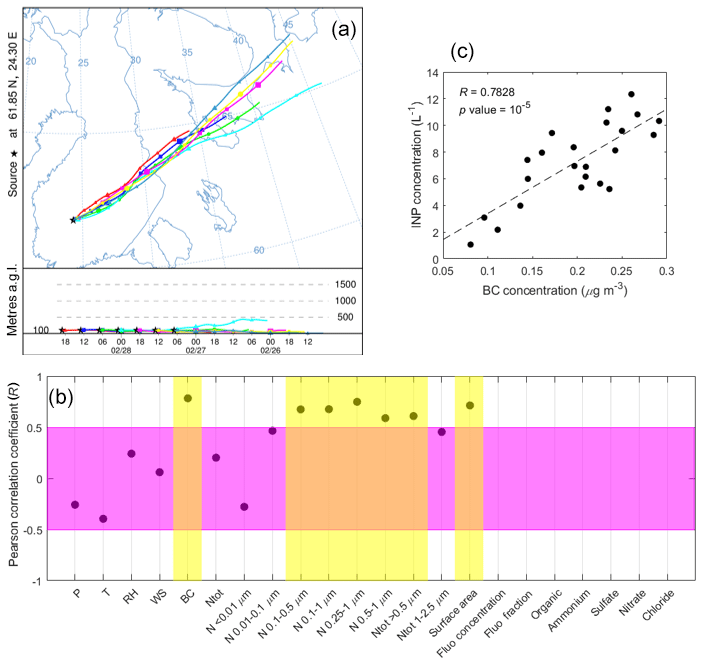
Figure 5All results shown for 27–28 February 2018. (a) Backward trajectories calculated using the HYSPLIT model, extending 48 h back in time. (b) Pearson correlation coefficients of the linear correlation between the [INP] and various meteorological and particle parameters. Magenta shading denotes the area of weak, if any, correlation (). Yellow shading denotes parameters for which the correlation with the corresponding [INP] is better than weak (R>0.5) and statistically significant at the 95 % confidence interval (p value <0.05). Neither WIBS nor L-ToF-AMS had begun operating during this time period. (c) The [INP] as a function of the BC concentration.
3.2.1 27–28 February 2018
This time period clearly stood out due to its particularly stable winter conditions. These 2 d were characterised by the presence of a high-pressure system, with the highest P and lowest T during the entire campaign. The winds were exclusively from the north-easterly sector, and the sky was totally clear. The 48 h trajectory analysis revealed that air masses were indeed arriving from the north-east during this time period, from as far afield as the Kanin Peninsula (Fig. 5a). The air masses arriving at Hyytiälä during this time period were in contact with the ground during the entire 48 h prior to arrival. The total particle number concentrations were elevated, with a median of 3526 cm−3, whereas the [INP] values were lower than the campaign median, with a median value of 7.4 L−1. A total of 23 [INP] data points were measured during this time period.
Figure 5b presents the Pearson correlation coefficients of the linear correlation between the [INP] and various parameters on 27 and 28 February. Immediately visible in the figure is that certain parameters exhibit moderate or strong, statistically significant correlations with the [INP]. The [INP] positively correlates with BC (Fig. 5c) as well as with various particle size channels, mostly below 1 µm in diameter, and total particle surface area. This situation raises the questions of whether BC is able to act as an INP under our measurement conditions during the examined time period and where this BC may be coming from or if BC is simply an air mass feature. The trajectories in Fig. 5a show that air masses arriving in Hyytiälä were in contact with the surface before their arrival, with at least the prior 24 h spent above the land surface. This means that aerosol particle properties, including those of INPs, in the arriving air masses were likely influenced by the surface emissions of the boreal forest. The contact of air masses with the ground is also reflected in the elevated total aerosol particle number. BC is emitted into the atmosphere during biomass combustion, and BC particles typically exhibit sizes in the accumulation mode, i.e. below 1 µm in diameter (Reid and Hobbs, 1998). This notion supports the presence of moderate correlations of the [INP] with both BC and the total aerosol particle number in sizes below 1 µm in diameter. The source of trajectories and their contact with the ground may suggest that BC originates from the wood burning and heating of households and saunas in the north-western Russia and eastern Finland during particularly cold weather conditions. This notion has been indirectly supported by Lewis et al. (2008) and Virkkula et al. (2011), who reported that the high aerosol light absorption at SMEAR II in February and March is likely associated with biomass burning. Despite the short day length, the cloudless conditions may result in the freshly emitted BC being subject to photochemical oxidation, leading to an increase in its ability to act as CCN (Li et al., 2018). Soot is generally regarded as an inefficient INP under mixed-phase cloud conditions (Friedman et al., 2011; Chou et al., 2013; Mahrt et al., 2018). However, biomass burning has been shown to produce INPs active above water saturation at 243 K (Prenni et al., 2012) and warmer temperatures (McCluskey et al., 2014), supporting the possibility of IN-active biomass burning particles originating from wood burning and heating during the examined time period. Additionally, the absence of any other IN-active species may also lead to a clear correlation of BC with the [INP], corroborating the results presented by Thomson et al. (2018). The role of BC as INPs active under mixed-phase cloud conditions needs to be investigated further.
To conclude, it should be noted that in this case BC may simply be an air mass feature or a tracer for some other unknown INP species, the characteristics of which are not seen in any of the examined variables beyond that of particle size. It is not possible to explicitly say whether it is BC or some other particle species acting as an INP during this measurement period. Additionally, the absolute concentration of BC during these 2 d is similar to the overall average BC concentration. The reasons why BC correlates with the [INP] only during this time period and not others remain unknown.

Figure 6All results shown for 9–11 March 2018. (a) Backward trajectories calculated using the HYSPLIT model, extending 48 h back in time. (b) Pearson correlation coefficients of the linear correlation between the [INP] and various meteorological and particle parameters. Magenta shading denotes the area of weak, if any, correlation (). Yellow shading denotes parameters for which the correlation with the corresponding [INP] is better than weak (R>0.5) and statistically significant at the 95 % confidence interval (p value <0.05). (c) The [INP] as a function of total particle surface area.
3.2.2 9–11 March 2018
In contrast to the previously described time period, these 3 d were characterised by the presence of a low-pressure system, with the air temperature steady at ∼ −1.5 ∘C and ambient RH always at or close to 100 %. Winds were predominantly from the southern sector, with fully cloudy conditions and a cloud base height of 100–200 m a.g.l. The 48 h trajectory analysis showed that air masses were arriving from the south-south-east during this time period (Fig. 6a). Earlier in this time period the air masses originated in western Russia, while those arriving in the afternoon of 11 March were coming from Estonia. In all cases, however, the air masses originated mostly above the continental land mass and were in contact with the ground for most of the time prior to their arrival at the measurement site. Both total particle number concentrations and the [INP] were slightly below average, with median values of 1455 cm−3 and 6.6 L−1 respectively. A total of 36 [INP] data points were measured during this time period.
Figure 6b shows that the [INP] exhibits a moderate and statistically significant linear correlation with total aerosol numbers at larger particle sizes. Most notably, the [INP] correlates best with the number of particles between 1 and 2.5 µm in diameter and the total particle surface area (Fig. 6c). This supports the general notion that larger, supermicron particles are better INPs (e.g. Kanji et al., 2011), although it does not explain why the observed correlation exists only for this certain time period and not for the entire dataset. The [INP] also exhibits a positive correlation with the fluorescent concentration as well as with organics, ammonium and sulfate as measured by the L-ToF-AMS. Biological fluorescent particles have previously been identified as important INPs during field studies in both marine locations (Mason et al., 2015) and forested sites (Tobo et al., 2013). It has also been reported that a high ambient relative humidity, which is the case during this time period, could trigger the release of biological particles into the atmosphere (Wright et al., 2014). Therefore, it can be said that significant linear correlations of the [INP] with supermicron and fluorescent particles as well as with organics, accompanied by very high ambient RH raise the question of whether biological particles released by the surrounding forest could act as INPs. It should be noted, however, that of the 36 [INP] data points during this time period, only 12 have corresponding WIBS concentration measurements. The observed correlation of the [INP] with ammonium and sulfate, while unexpected, may be explained by the ability of ammonium sulfate to increase particle water uptake (Rose et al., 2008), potentially leading to aerosol particles becoming better INPs in the immersion mode. The puzzling aspect of this time period that remains unresolved is the fact that despite the potential release of biological aerosol and the particles' increase in CCN and INP activity due to ammonium sulfate, the absolute [INP] concentration during this time period is lower than average. It should also be noted here that correlation of the [INP] with the fluorescent particle concentration does not imply that INPs are necessarily fluorescent. Similar to the previous case, fluorescent particles may simply be a feature of the present air mass or a tracer for some other IN-active particle species. However, it is possible that fluorescent particles do contribute to the INP population, as seen in previous studies where INP residuals sampled from the atmosphere exhibited an increased fluorescent fraction compared with background measurements (Boose et al., 2016b).
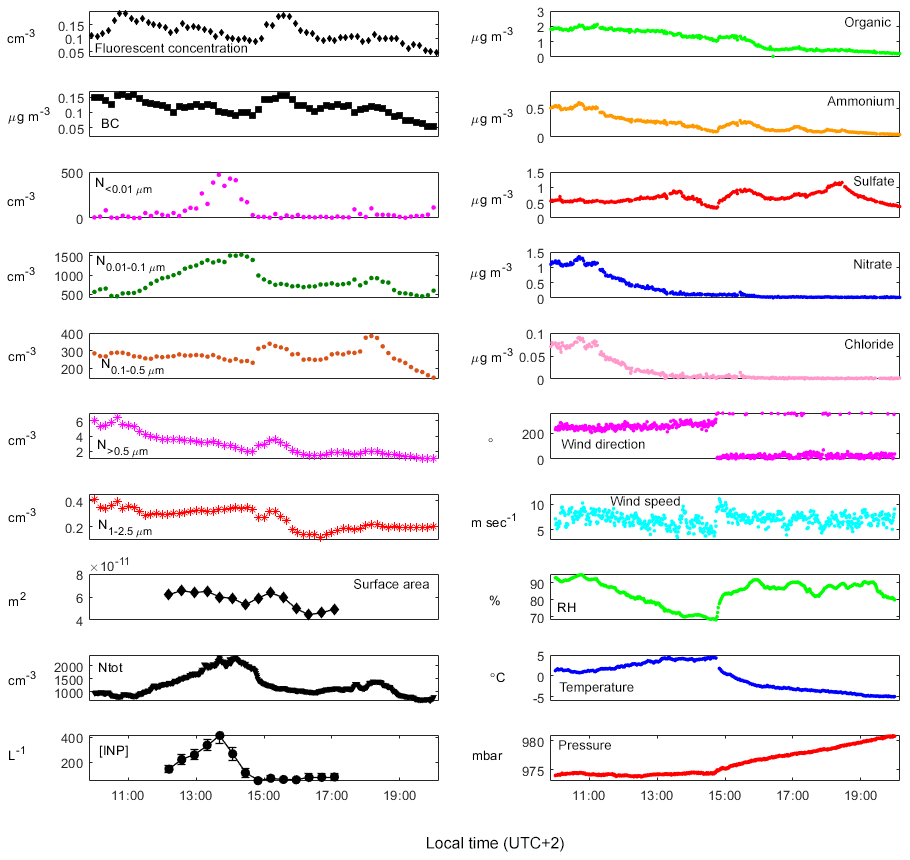
Figure 7Time series of the [INP] and other parameters on 25 March 2018. Each panel is labelled with the parameter it shows, and the corresponding units are located adjacent to the relevant axis.
3.2.3 25 March 2018
The date of 25 March stood out from the entire campaign as the day with the highest measured INP number concentration. During this day a total of 14 consecutive [INP] values were measured, each over a 15 min period. The lowest and highest [INP] values on 25 March were 52 and 416 L−1 respectively, meaning that the day was characterised by unusually high [INP] compared with the campaign average. Times series of the [INP] and a multitude of other parameters can be seen in Fig. 7. When the meteorological conditions are examined, it becomes clear that a significant change in weather occurred just before 15:00:00 LT. A cold front passed in the middle of the afternoon, with a warm low-pressure system with above-zero temperatures and winds from the south-east being replaced by a high-pressure system with low, sub-zero temperatures and northerly winds. The time series of the [INP] show a gradual increase in the early afternoon, with a peak [INP] value of 416 L−1 around 14:00:00 LT, approximately an hour before the frontal passage. The INP number concentration then starts decreasing, reaching its minimum value of 52 L−1 around the exact time of the frontal passage. The [INP] then remained relatively low and stable for the rest of the day. It must be immediately noted that none of the chemical groups measured by the L-ToF-AMS exhibited any changes due to the cold front passage (Fig. 7). The same can be said of the concentrations of BC and fluorescent biological particles. When the total ambient aerosol population is examined, only the concentration of particles below 100 nm in diameter responded to a change in weather, similar to that of the [INP]. Moreover, when the correlation of the [INP] with particles of the smallest sizes on 25 March is examined (not shown), the Pearson correlation coefficients (R values) were above 0.75 for the correlation of the [INP] with both particles below 0.01 µm and particles in the 0.01–0.1 µm size range. The absence of a correlation with mass spectrometry groups and biological fluorescent particles then becomes obvious, as WIBS only measures particles over 0.5 µm in diameter, and the low size for 100 % transmission efficiency of the L-ToF-AMS is about 0.045 µm with most of the smaller particles likely being lost in the transmission lens. Thus, it is not possible to speculate about the chemical composition of these sub-0.1 µm particles that exhibited a strong correlation with the [INP] on this particular day.
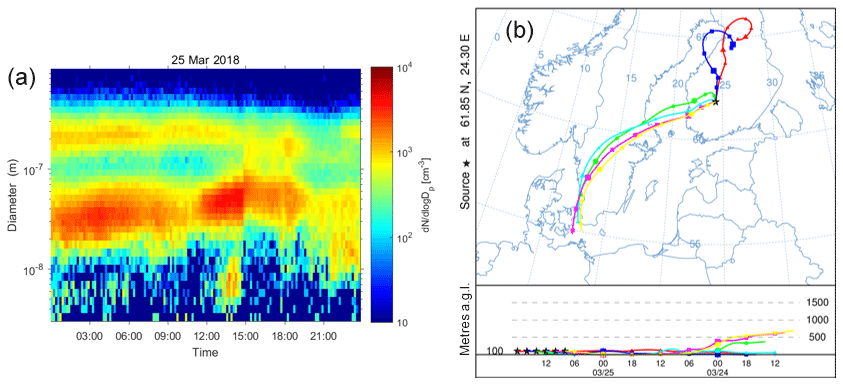
Figure 8(a) Time series of the particle number size distribution as measured by the local DMPS. (b) Backward trajectories calculated using the HYSPLIT model, extending 48 h back in time. Both panels depict 25 March 2018.
The new particle formation (NPF) analysis revealed that 25 March 2018 is classified as “undefined”, meaning that the day could not be classified as either an event or a non-event (Dal Maso et al., 2005). Figure 8a shows the time series of the particle number size distribution as measured by the local DMPS. The figure reveals that there is a growing Aitken mode visible between 13:00:00 and 15:00:00 LT. Nucleation mode particles are also present; however, the concentration of Aitken mode particles starts increasing earlier in the day than the concentration of sub-0.01 µm particles (Fig. 7). This indicates that NPF is not a likely source of sub-0.1 µm particles on this day. The particle size distribution then undergoes a dramatic change around 15:00:00 LT due to the frontal passage, with the number of Aitken mode particles dramatically decreasing. Figure 8b shows the origins of the air masses arriving at the measurement site on 25 March. As expected, air masses arriving before the frontal passage originated in the south-west, as far afield as Denmark and southern Sweden. After the frontal passage, air masses originated in central Finland. In both cases, air masses were in contact with the ground for most of the time prior to their arrival. Despite a significant change in weather and air mass origin, none of the ambient particle physical and chemical properties, except number concentration of particles below 0.1 µm in diameter, changed as a result of the frontal passage. The source of the sub-0.1 µm particles visible in Fig. 8a just prior to the frontal passage remains uncertain. As mentioned above, local NPF is not likely a source of these particles. And even if it were, freshly formed organic aerosol, especially at such small sizes, is unlikely to exhibit such increased ice nucleation activity under the RH and T conditions being sampled by PINC (Möhler et al., 2008; Kanji et al., 2017). At the same time, long-range transport is also unlikely, as the Aitken mode particles only appeared around noon local time despite the fact that the air mass origin was stable for many hours prior to the frontal passage.
One possible identity of these sub-0.1 µm particles could be that of nanoscale biological fragments, such as ice-nucleating macromolecules INMs. INMs and other nanoscale biological fragments have previously been observed to be IN-active (e.g. Govindarajan and Lindow, 1988; Hartmann et al., 2013; O'Sullivan et al., 2015), and these fragments can be as small as 0.01 µm in size (Kanji et al., 2017). Sources of these sub-0.1 µm biological particles can be pollen (Pummer et al., 2012), fungal spores (Fröhlich-Nowoisky et al., 2015) and soil dust (O'Sullivan et al., 2015), although it needs to be mentioned that on 25 March the ground at the measurement site was still covered with snow, rendering soil dust an unlikely source of INMs. Similarly, it may be unreasonable to expect high pollen and fungal activity at the measurement location in March given the meteorological conditions during the examined day (Fig. 7). However, Fig. 7 shows that ambient temperature was above freezing and increasing prior to the arrival of the cold front, and the speculation here is that the above-zero temperatures would trigger at least some biological activity in the boreal forest, which could potentially result in the emission of the sub-0.1 µm biological fragments. In fact, 25 March had the highest ambient temperature during the entire campaign, making this hypothesis plausible. Given the available observations, the highest measured [INP] during the campaign correlated best with the concentration of sub-0.1 µm particles. Active INPs in the sub-0.1 µm range have been reported to be from biological particle fragments (Després et al., 2012; Pummer et al., 2012, 2015). There are three questions that remain unanswered within the realm of the current hypothesis. First, in the early afternoon hours of 25 March, the total concentration of particles below 100 nm in diameter was approximately 2000 cm−3, which is very similar to the median total particle number concentration across all sizes of 1996 cm−3 during the campaign. Assuming no NPF, ∼2000 cm−3 of sub-0.1 µm particles is significant, and it is unknown whether the biological activity of the surrounding boreal forest in the sub-5 ∘C temperature regime could be responsible for such a high concentration. Although, as mentioned above, 25 March was indeed the warmest day during the entire campaign. Second, and similar to other special cases examined, it remains unknown why the correlation of [INP] with sub-0.1 µm biological fragments is only visible on this day and not during other periods or during the entire campaign. This question would have been answered if the release of these biological fragments from biota and the increased [INP] had been observed during other warmer periods with temperatures above 4 ∘C; however, 25 March was the only day during the campaign when this temperature was exceeded. Third, and also similar to other special cases examined, a significant correlation between the [INP] and the concentration of sub-0.1 µm particles does not imply that sub-0.1 µm particles are INPs; instead, they may be a tracer of some IN-active particle species or an air mass feature.
The median INP number concentration measured at 242 K and 105 % RHw during a 6-week measurement campaign in southern Finland was 13 L−1. The measured [INP] spanned 3 orders of magnitude and showed a general increase from mid-February until early April. No statistically significant difference was found between the [INP] with values below the LOD excluded or included, indicating the insignificance of the chosen data treatment method of PINC ambient measurements at [INP] >10 L−1. No persistent local or regional sources of INPs in the boreal environment of southern Finland could be identified. Instead, it is postulated that the INPs at SMEAR II are a result of the long-range transport and dilution of INPs sourced far from the measurement site. Despite high variability, the measured [INP] values fall within the range expected for INP number concentrations measured elsewhere under similar thermodynamic conditions. The [INP] did not correlate with any of the examined parameters during the entire field campaign, indicating that no specific parameter could be used to predict the INP number concentration at the measurement location during the examined time period. The absence of a correlation across the entire field campaign also suggests that a variety of particles were acting as INPs at different times, although it was indirectly determined that ambient INPs are most likely in the size range of 0.1–0.5 µm in diameter on average. This result highlighted the necessity for the high time resolution of INP measurements, as any measurements averaged across several hours would erase the variability in the INP identity. On shorter timescales, several particle species correlated well with the [INP]. Depending on the meteorological conditions, BC and supermicron biological particles correlated with the INP signal. However, an increase in BC or supermicron biological particles may not necessarily lead to an increase in the [INP] – the reasons for which remain unknown. On the day with the highest [INP], sub-0.1 µm particles, most likely nanoscale biological fragments such as INMs, were found to exhibit a significant correlation with the elevated INP number concentrations. The reasons why certain particle types correlated with the [INP] during certain conditions and not during others and why none of the particle species mentioned above correlated with the [INP] across the entire campaign remain unknown.
The main results summarised above present several important questions and conclusions for future ambient INP studies. First and foremost, a running theme throughout the paper is the inability to identify physical and chemical properties of ambient INPs despite the complexity of the instrumental set-up and a multitude of additional instrumentation deployed during the campaign. Unfortunately, the current instrumental set-up coupled with the rarity of ambient INPs rendered any speculations about INP identity inconclusive. This could have been foreseen, as INPs are very rare, and all additional instrumentation measured aerosol properties in bulk. If future INP field studies aim to explicitly identify the physical and chemical properties of INPs, a single-particle analysis of ice crystal residuals must be carried out, similar to the works of Mertes et al. (2007), Richardson et al. (2007), Corbin et al. (2012) and Schmidt et al. (2017). Moreover, in order to establish the particle properties responsible for its ability to act as INP, the physics and chemistry of the total aerosol population must be examined as well. The second important question that needs to be addressed as a result of this work is the necessity of future INP measurements. As mentioned earlier, the measured [INP] values fell within the range expected from previous field studies in different environments around the globe (Kanji et al., 2017). While it may be important to quantify the [INP] in various environments around the world, the [INP] values themselves present little information about their potential interactions with clouds and the resulting ice crystal number concentration. This notion is further supported by the fact that aerosol properties on the ground are quite likely different from those found at altitudes where examined thermodynamic conditions may actually be met. Therefore, it needs to be said that INP measurements similar to those presented here are of limited use in the studies of aerosol–cloud interactions. Future ambient INP studies need to explicitly focus on the physical and chemical properties of the INPs and whether they are different from the rest of the aerosol population. Additionally, future studies should aim to assess whether the explicit physics and chemistry of INPs can be and need to be parameterised in order to understand aerosol–cloud interactions on the global scale.
The data discussed and presented in this publication are available at https://doi.org/10.3929/ethz-b-000397022 (Paramonov et al., 2020).
MP planned and executed the measurement campaign, analysed the data and wrote the paper. SDvD participated in the measurement campaign and conducted preliminary data analysis. EG and JPDA provided the PFPC and additional instrumentation for its characterisation. PH deployed the WIBS and prepared and analysed its data. JK made research plans and provided a working environment for and financial support to PH. XC carried out the HYSPLIT trajectory analysis and prepared the related figures. KL provided the BC data and helped with their interpretation. LiiH and LiqH deployed the L-ToF-AMS, prepared and analysed its data, helped with its interpretation and wrote the description of the L-ToF-AMS in Sect. 2 of this paper. TP provided access to SMEAR II. ZAK oversaw the project and helped with the campaign design and preparations as well as with data interpretation. All co-authors commented on the paper.
The authors declare that they have no conflict of interest.
This project has received funding from the European Union's Horizon 2020 research and innovation programme (under the Marie Sklodowska-Curie grant agreement no. 751470, “ATM-METFIN”, and grant agreement no 654109). The research leading to these results has also received funding from the European Union Seventh Framework Programme (FP7/2007-2013; grant agreement no. 262254). Xuemeng Chen received funding from the European Regional Development Fund (project MOBTT42). Paavo Heikkilä and Jorma Keskinen received funding from the Arctic Academy Programme “ARKTIKO” of the Academy of Finland (project grant no. 286558 “ICINA”). Ellen Gute and Jonathan P. D. Abbatt were supported by NSERC (grant no. RGPIN-2017-05972), and Ellen Gute received support from the University of Toronto Centre for Global Change Science Graduate Student Research Award. Liqing Hao was funded by the European Research Council (starting grant no. 335478). Liine Heikkinen received funding from an ERC starting grant (project COALA).
Olga Garmash and Zoé Brasseur are thanked for their help with the L-ToF-AMS measurements. The authors are grateful to Pasi Aalto and Petri Keronen for the timely provision of DMPS/APS and meteorological data respectively. Simo Hakala is acknowledged for his help with the new particle formation classification. Zoé Brasseur and Jonathan Duplissy are both acknowledged for their involvement with the campaign activities. Furthermore, the authors would like to gratefully acknowledge the staff of the Hyytiälä Forestry Field Station; their expertise, hard work and willingness to help have made the campaign a great success! Larissa Lacher, Robert David, Fabian Mahrt and Dimitri Castarède are all sincerely thanked for the helpful discussions and their continuous encouragement. Ulrike Lohmann is acknowledged for her support and guidance.
This research has been supported by the European Union's Horizon 2020 research and innovation programme (under the Marie Sklodowska-Curie grant agreement grant no. 751470, “ATM-METFIN”, and grant agreement no 654109) and the European Union Seventh Framework Programme (FP7/2007-2013, grant agreement no. 262254).
This paper was edited by Allan Bertram and reviewed by two anonymous referees.
Andreae, M. O.: Correlation between cloud condensation nuclei concentration and aerosol optical thickness in remote and polluted regions, Atmos. Chem. Phys., 9, 543–556, https://doi.org/10.5194/acp-9-543-2009, 2009.
Archuleta, C. M., DeMott, P. J., and Kreidenweis, S. M.: Ice nucleation by surrogates for atmospheric mineral dust and mineral dust/sulfate particles at cirrus temperatures, Atmos. Chem. Phys., 5, 2617–2634, https://doi.org/10.5194/acp-5-2617-2005, 2005.
aufm Kampe, H. J. and Weickmann, H. K.: The effectiveness of natural and artificial aerosols as freezing nuclei, J. Meteor., 8, 283–288, https://doi.org/10.1175/1520-0469(1951)008<0283:TEONAA>2.0.CO;2, 1951.
Augustin-Bauditz, S., Wex, H., Denjean, C., Hartmann, S., Schneider, J., Schmidt, S., Ebert, M., and Stratmann, F.: Laboratory-generated mixtures of mineral dust particles with biological substances: characterization of the particle mixing state and immersion freezing behavior, Atmos. Chem. Phys., 16, 5531–5543, https://doi.org/10.5194/acp-16-5531-2016, 2016.
Boose, Y., Kanji, Z. A., Kohn, M., Sierau, B., Zipori, A., Crawford, I., Lloyd, G., Bukowiecki, N., Herrmann, E., Kupiszewski, P., Steinbacher, M., and Lohmann, U.: Ice nucleating particle measurements at 241 K during winter months at 3580 MSL in the Swiss Alps, J. Atmos. Sci., 73, 2203–2228, https://doi.org/10.1175/JAS-D-15-0236.1, 2016a.
Boose, Y., Sierau, B., García, M. I., Rodríguez, S., Alastuey, A., Linke, C., Schnaiter, M., Kupiszewski, P., Kanji, Z. A., and Lohmann, U.: Ice nucleating particles in the Saharan Air Layer, Atmos. Chem. Phys., 16, 9067–9087, https://doi.org/10.5194/acp-16-9067-2016, 2016b.
Boucher, O., Randall, D., Artaxo, P., Bretherton, C., Feingold, G., Forster, P., Kerminen, V.-M., Kondo, Y., Liao, H., Lohmann, U., Rasch, P., Satheesh, S. K., Sherwood, S., Stevens, B., and Zhang, X. Y.: Clouds and aerosols, in: Climate Change 2013: The Physical Science Basis, Contribution of Working Group I to the Fifth Assessment Report of the Intergovernmental Panel on Climate Change, edited by: Stocker, T. F., Qin, D., Plattner, G.-K., Tignor, M., Allen, S. K., Boschung, J., Nauels, A., Xia, Y., Bex, V., and Midgley, P. M., Cambridge University Press, Cambridge, UK and New York, NY, USA, 571–657, 2013.
Cantrell, W. and Heymsfield, A.: Production of ice in tropospheric clouds: A review, B. Am. Meteorol. Soc., 86, 795–807, 2005.
Chou, C., Stetzer, O., Weingartner, E., Jurányi, Z., Kanji, Z. A., and Lohmann, U.: Ice nuclei properties within a Saharan dust event at the Jungfraujoch in the Swiss Alps, Atmos. Chem. Phys., 11, 4725–4738, https://doi.org/10.5194/acp-11-4725-2011, 2011.
Chou, C., Kanji, Z. A., Stetzer, O., Tritscher, T., Chirico, R., Heringa, M. F., Weingartner, E., Prévôt, A. S. H., Baltensperger, U., and Lohmann, U.: Effect of photochemical ageing on the ice nucleation properties of diesel and wood burning particles, Atmos. Chem. Phys., 13, 761–772, https://doi.org/10.5194/acp-13-761-2013, 2013.
Corbin, J. C., Rehbein, P. J. G., Evans, G. J., and Abbatt, J. P. D.: Combustion particles as ice nuclei in an urban environment: Evidence from single-particle mass spectrometry, Atmos. Environ., 51, 286–292, https://doi.org/10.1016/j.atmosenv.2012.01.007, 2012.
Dal Maso, M., Kulmala, M., Riipinen, I., Wagner, R., Hussein, T., Aalto, P. P., and Lehtinen, K. E. J.: Formation and growth of fresh atmospheric aerosols: eight years of aerosol size distribution data from SMEAR II, Hyytiälä, Finland, Boreal Environ. Res., 10, 323–336, 2005.
David, R. O., Marcolli, C., Fahrni, J., Qiu, Y., Perez Sirkin, Y. A., Molinero, V., Mahrt, F., Brühweiler, D., Lohmann, U., and Kanji, Z. A.: Pore condensation and freezing is responsible for ice formation below water saturation for porous particles, P. Natl. Acad. Sci. USA, 116, 8184–8189, https://doi.org/10.1073/pnas.1813647116, 2019.
DeCarlo, P. F., Kimmel, J. R., Trimborn, A., Northway, M. J., Jayne, J. T., Aiken, A. C., Gonin, M., Fuhrer, K., Horvath, T., Docherty, K. S., Worsnop, D. R., and Jimenez, J. L.: Field-deployable, high-resolution, time-of-flight aerosol mass spectrometer, Anal. Chem., 78, 8281–8289, 2006.
DeMott, P. J.: An exploratory study of ice nucleation by soot aerosols, J. Appl. Meteor., 29, 1072–1079, 1990.
DeMott, P. J., Prenni, A. J., Liu, X., Kreidenweis, S. M., Petters, M. D., Twohy, C. H., Richardson, M. S., Eidhammer, T., and Rodgers, D. C.: Predicting global atmospheric ice nuclei distributions and their impacts on climate, P. Natl. Acad. Sci. USA, 107, 11217–11222, 2010.
DeMott, P. J., Möhler, O., Stetzer, O., Vali, G., Levin, Z., Petters, M. D., Murakami, M., Leisner, T., Bundke, U., Klein, H., Kanji, Z. A., Cotton, R., Jones, H., Benz, S., Brinkmann, M., Rzesanke, D., Saathoff, H., Nicolet, M., Saito, A., Nillius, B., Bingemer, H., Abbatt, J., Ardon, K., Ganor, E., Georgakopoulos, D. G., and Saunders, C.: Resurgence in ice nuclei measurement research, B. Am. Meteorol. Soc., 92, 1623–1635, 2011.
DeMott, P. J., Prenni, A. J., McMeeking, G. R., Sullivan, R. C., Petters, M. D., Tobo, Y., Niemand, M., Möhler, O., Snider, J. R., Wang, Z., and Kreidenweis, S. M.: Integrating laboratory and field data to quantify the immersion freezing ice nucleation activity of mineral dust particles, Atmos. Chem. Phys., 15, 393–409, https://doi.org/10.5194/acp-15-393-2015, 2015.
Després, V. R., Huffman, J. A., Burrows, S. M., Hoose, C., Safatov, A. S., Buryak, G., Fröhlich-Nowoisky, J., Elbert, W., Andreae, M. O., Pöschl, U., and Jaenicke, R.: Primary biological aerosol particles in the atmosphere: a review, Tellus B, 64, 15598, https://doi.org/10.3402/tellusb.v64i0.15598, 2012.
Draxler, R. R. and Hess, G. D.: An Overview of the HYSPLIT 4 Modelling System for Trajectories, Dispersion and Deposition, Austr. Met. Mag., 47, 295–308, 1998.
Drossaart van Dusseldorp, S.: Ice nucleating particles in a boreal environment, MSc thesis, ETH Zurich, Switzerland, 28 pp., 2018.
Field, P. R., Lawson, R. P., Brown, P. R. A., Lloyd, G., Westbrook, C., Moisseev, D., Miltenberger, A., Nenes, A., Blyth, A., Choularton, T., Connolly, P., Buehl, J., Crosier, J., Cui, Z., Dearden, C., DeMott, P., Flossmann, A., Heymsfield, A., Huang, Y., Kalesse, H., Kanji, Z. A., Korolev, A., Kirchgaessner, A., Lasher-Trapp, S., Leisner, T., McFarquhar, G., Phillips, V., Stith, J., and Sullivan, S.: Secondary ice production: Current state of the science and recommendations for the future, Meteor. Mon., 58, 7.1–7.20, https://doi.org/10.1175/AMSMONOGRAPHS-D-16-0014.1, 2017.
Friedman, B., Kulkarni, G., Beranek, J., Zelenyuk, A., Thornton, J. A., and Cziczo, D. J.: Ice nucleation and droplet formation by bare and coated soot particles, J. Geophys. Res.-Atmos., 116, D17203, https://doi.org/10.1029/2011jd015999, 2011.
Fröhlich-Nowoisky, J., Hill, T. C. J., Pummer, B. G., Yordanova, P., Franc, G. D., and Pöschl, U.: Ice nucleation activity in the widespread soil fungus Mortierella alpina, Biogeosciences, 12, 1057–1071, https://doi.org/10.5194/bg-12-1057-2015, 2015.
Garimella, S., Rothenberg, D. A., Wolf, M. J., David, R. O., Kanji, Z. A., Wang, C., Rösch, M., and Cziczo, D. J.: Uncertainty in counting ice nucleating particles with continuous flow diffusion chambers, Atmos. Chem. Phys., 17, 10855–10864, https://doi.org/10.5194/acp-17-10855-2017, 2017.
Govindarajan, A. G. and Lindow, S. E.: Size of bacterial ice nucleation sites measured in situ by radiation inactivation analysis, P. Natl. Acad. Sci. USA, 85, 1334–1338, 1988.
Gute, E., Lacher, L., Kanji, Z. A., Kohl, R., Curtius, J., Weber, D., Bingemer, H., Clemen, H.-C., Schneider, J., Gysel-Beer, M., Ferguson, S. T., and Abbatt, J. P. D.: Field evaluation of a Portable Fine Particle Concentrator (PFPC) for ice nucleating particle measurements, Aerosol Sci. Technol., 53, 1067–1078, https://doi.org/10.1080/02786826.2019.1626346, 2019.
Hallett, J. and Mossop, S. C.: Production of secondary ice particles during the riming process, Nature, 249, 26–28, 1974.
Hari, P. and Kulmala, M.: Station for Measuring Ecosystem–Atmosphere Relations (SMEAR II), Boreal Environ. Res., 10, 315–322, 2005.
Hartmann, S., Augustin, S., Clauss, T., Wex, H., Šantl-Temkiv, T., Voigtländer, J., Niedermeier, D., and Stratmann, F.: Immersion freezing of ice nucleation active protein complexes, Atmos. Chem. Phys., 13, 5751–5766, https://doi.org/10.5194/acp-13-5751-2013, 2013.
Hartmann, S., Wex, H., Clauss, T., Augustin-Bauditz, S., Nieder-meier, D., Rösch, M., and Stratmann, F.: Immersion freezing of kaolinite: Scaling with particle surface area, J. Atmos. Sci., 73, 263–278, https://doi.org/10.1175/JAS-D-15-0057.1, 2016.
Heinzerling, D.: Automation of HYSPLIT trajectory generation and subsequent analyses, Washington University, Research for Undergraduates Program 2004, 2004.
Isaac, G. A. and Douglas, R.: Frequency distributions of ice nucleus concentrations, J. Rech. Atmos., 5, 1–4, 1971.
Junninen, H., Lauri, A., Keronen, P., Aalto, P., Hiltunen, V., Hari, P., and Kulmala, M.: Smart-SMEAR: on-line data exploration and visualization tool for SMEAR stations, Boreal Environ. Res., 14, 447–457, 2009.
Kanji, Z. A., DeMott, P. J., Möhler, O., and Abbatt, J. P. D.: Results from the University of Toronto continuous flow diffusion chamber at ICIS 2007: instrument intercomparison and ice onsets for different aerosol types, Atmos. Chem. Phys., 11, 31–41, https://doi.org/10.5194/acp-11-31-2011, 2011.
Kanji, Z. A., Welti, A., Chou, C., Stetzer, O., and Lohmann, U.: Laboratory studies of immersion and deposition mode ice nucleation of ozone aged mineral dust particles, Atmos. Chem. Phys., 13, 9097–9118, https://doi.org/10.5194/acp-13-9097-2013, 2013.
Kanji, Z. A., Ladino, L. A., Wex, H., Boose, Y., Burkert-Kohn, M., Cziczo, D. J., and Krämer, M.: Overview of ice nucleating particles, Meteor. Mon., 58, 1.1–1.33, https://doi.org/10.1175/AMSMONOGRAPHS-D-16-0006.1, 2017.
Kerminen, V.-M., Paramonov, M., Anttila, T., Riipinen, I., Fountoukis, C., Korhonen, H., Asmi, E., Laakso, L., Lihavainen, H., Swietlicki, E., Svenningsson, B., Asmi, A., Pandis, S. N., Kulmala, M., and Petäjä, T.: Cloud condensation nuclei production associated with atmospheric nucleation: a synthesis based on existing literature and new results, Atmos. Chem. Phys., 12, 12037–12059, https://doi.org/10.5194/acp-12-12037-2012, 2012.
Knopf, D. A., Alpert, P. A., Wang, B., O'Brien, R. E., Kelly, S. T., Laskin, A., Gilles, M. K., and Moffet, R. C.: Microspectroscopic imaging and characterization of individually identified ice nucleating particles from a case field study, J. Geophys. Res.-Atmos., 119, 10365–10381, https://doi.org/10.1002/2014JD021866, 2014.
Kupiszewski, P., Zanatta, M., Mertes, S., Vochezer, P., Lloyd, G., Schneider, J., Schenk, L., Schnaiter, M., Baltensperger, U., Weingartner, E., and Gysel, M.: Ice residual properties in mixed-phase clouds at the high-alpine Jungfraujoch site, J. Geophys. Res.-Atmos., 121, 12343–12362, https://doi.org/10.1002/2016JD024894, 2016.
Lacher, L., Lohmann, U., Boose, Y., Zipori, A., Herrmann, E., Bukowiecki, N., Steinbacher, M., and Kanji, Z. A.: The Horizontal Ice Nucleation Chamber (HINC): INP measurements at conditions relevant for mixed-phase clouds at the High Altitude Research Station Jungfraujoch, Atmos. Chem. Phys., 17, 15199–15224, https://doi.org/10.5194/acp-17-15199-2017, 2017.
Lacher, L., DeMott, P. J., Levin, E. J. T., Suski, K. J., Boose, Y., Zipori, A., Herrmann, E., Bukowiecki, N., Steinbacher, M., Gute, E., Abbat, J. P. D., Lohmann, U., and Kanji, Z. A.: Background free-tropospheric ice nucleating particle concentrations at mixed-phase cloud conditions, J. Geophys. Res.-Atmos., 123, 10506–10525, https://doi.org/10.1029/2018JD028338, 2018.
Ladino, L. A., Yakobi-Hancock, J. D., Kilthau, W. P., Mason, R. H., Si, M., Li, J., Miller, L. A., Schiller, C. L., Huffman, J. A., Aller, J. Y., Knopf, D. A., Bertram, A. K., and Abbatt, J. P. D.: Addressing the ice nucleating abilities of marine aerosol: A combination of deposition mode laboratory and field measurements, Atmos. Environ., 132, 1–10, https://doi.org/10.1016/j.atmosenv.2016.02.028, 2016.
Lau, K. M. and Wu, H. T.: Warm rain processes over tropical oceans and climate implications, Geophys. Res. Lett., 30, 2290, https://doi.org/10.1029/2003GL018567, 2003.
Lewis, K., Arnott, W. P., Moosmüller, H., and Wold, C. E.: Strong spectral variation of biomass smoke light absorption and single scattering albedo observed with a novel dual-wavelength photoacoustic instrument, J. Geophys. Res., 113, D16203, https://doi.org/10.1029/2007JD009699, 2008.
Li, M., Bao, F., Zhang, Y., Song, W., Chen, C., and Zhao, J.: Role of elemental carbon in the photochemical aging of soot, P. Natl. Acad. Sci. USA, 115, 7717–7722, 2018.
Liu, P. S. K., Deng, R., Smith, K. A., Williams, L. R., Jayne, J. T., Canagaratna, M. R., Moore, K., Onasch, T. B., Worsnop, D. R., and Deshler, T.: Transmission efficiency of an aerodynamic focusing lens system: Comparison of model calculations and laboratory measurements for the Aerodyne Aerosol Mass Spectrometer, Aerosol Sci. Technol., 41, 721–733, 2007.
Lohmann, U.: A glaciation indirect aerosol effect caused by soot aerosols, Geophys. Res. Lett., 29, 1052, https://doi.org/10.1029/2001GL014357, 2002.
Lohmann, U. and Feichter, J.: Global indirect aerosol effects: a review, Atmos. Chem. Phys., 5, 715–737, https://doi.org/10.5194/acp-5-715-2005, 2005.
Mahrt, F., Marcolli, C., David, R. O., Grönquist, P., Barthazy Meier, E. J., Lohmann, U., and Kanji, Z. A.: Ice nucleation abilities of soot particles determined with the Horizontal Ice Nucleation Chamber, Atmos. Chem. Phys., 18, 13363–13392, https://doi.org/10.5194/acp-18-13363-2018, 2018.
Marcolli, C.: Deposition nucleation viewed as homogeneous or immersion freezing in pores and cavities, Atmos. Chem. Phys., 14, 2071–2104, https://doi.org/10.5194/acp-14-2071-2014, 2014.
Maruyama, H.: On the Annual Variation of Concentration and the Origin of Ice Nuclei in the Atmosphere, Papers in Meteor. and Geophys., XII, 216–246, 1961.
Mason, R. H., Si, M., Li, J., Chou, C., Dickie, R., Toom-Sauntry, D., Pöhlker, C., Yakobi-Hancock, J. D., Ladino, L. A., Jones, K., Leaitch, W. R., Schiller, C. L., Abbatt, J. P. D., Huffman, J. A., and Bertram, A. K.: Ice nucleating particles at a coastal marine boundary layer site: correlations with aerosol type and meteorological conditions, Atmos. Chem. Phys., 15, 12547–12566, https://doi.org/10.5194/acp-15-12547-2015, 2015.
Mason, R. H., Si, M., Chou, C., Irish, V. E., Dickie, R., Elizondo, P., Wong, R., Brintnell, M., Elsasser, M., Lassar, W. M., Pierce, K. M., Leaitch, W. R., MacDonald, A. M., Platt, A., Toom-Sauntry, D., Sarda-Estève, R., Schiller, C. L., Suski, K. J., Hill, T. C. J., Abbatt, J. P. D., Huffman, J. A., DeMott, P. J., and Bertram, A. K.: Size-resolved measurements of ice-nucleating particles at six locations in North America and one in Europe, Atmos. Chem. Phys., 16, 1637–1651, https://doi.org/10.5194/acp-16-1637-2016, 2016.
McCluskey, C. S., DeMott, P. J., Prenni, A. J., Levin, E. J. T., McMeeking, G. R., Sullivan, A. P., Hill, T. C. J., Nakao, S., Carrico, C. M., and Kreidenweis, S. M.: Characteristics of atmospheric ice nucleating particles associated with biomass burning in the US: Prescribed burns and wildfires, J. Geophys. Res.-Atmos., 119, 10458–10470, https://doi.org/10.1002/2014JD021980, 2014.
McCluskey, C. S., Hill, T. C. J., Malfatti, F., Sultana, C. M., Lee, C., Santander, M. V., Beall, C. M., Moore, K. A., Cornwell, G. C., Collins, D. B., Prather, K. A., Jayarathne, T., Stone, E. A., Azam, F., Kreidenweis, S. M., and DeMott, P. J.: A dynamic link between ice nucleating particles released in nascent sea spray aerosol and oceanic biological activity during two mesocosm experiments, J. Atmos. Sci., 74, 151–166, 2017.
McCluskey, C. S., Hill, T. C. J., Humphries, R. S., Rauker, A. M., Moreau, S., Strutton, P. G., Chambers, S. D., Williams, A. G., McRobert, I., Ward, J., Keywood, M. D., Harnwell, J., Ponsonby, W., Loh, Z. M., Krummel, P. B., Protat, A., Kreidenweis, S. M., and DeMott, P. J.: Observations of ice nucleating particles over Southern Ocean waters, Geophys. Res. Lett., 45, 11989–11997, https://doi.org/10.1029/2018GL079981, 2018.
Mertes, S., Verheggen, B., Walter, S., Connolly, P., Ebert, M., Schneider, J., Bower, K. N., Cozic, J., Weinbruch, S., Baltensperger, U., and Weingartner, E.: Counterflow virtual impactor based collection of small ice particles in mixed-phase clouds for the physico-chemical characterization of tropospheric ice nuclei: Sampler description and first case study, Aerosol Sci. Technol., 41, 848–864, https://doi.org/10.1080/02786820701501881, 2007.
Middlebrook, A. M., Bahreini, R., Jimenez, J. L., and Canagaratna, M. R.: Evaluation of composition-dependent collection efficiencies for the Aerodyne aerosol mass spectrometer using field data, Aerosol Sci. Technol., 46, 258–271, https://doi.org/10.1080/02786826.2011.620041, 2012.
Möhler, O., Benz, S., Saathoff, H., Schnaiter, M., Wagner, R., Schneider, J., Walter, S., Ebert, V., and Wagner, S.: The effect of organic coating on the heterogeneous ice nucleation efficiency of mineral dust aerosols, Environ. Res. Lett., 3, 025007, https://doi.org/10.1088/1748-9326/3/2/025007, 2008.
Moore, R. H., Karydis, V. A., Capps, S. L., Lathem, T. L., and Nenes, A.: Droplet number uncertainties associated with CCN: an assessment using observations and a global model adjoint, Atmos. Chem. Phys., 13, 4235–4251, https://doi.org/10.5194/acp-13-4235-2013, 2013.
Murray, B. J., Broadley, S. L., Wilson, T. W., Bull, S. J., Wills, R. H., Christenson, H. K., and Murray, E. J.: Kinetics of the homogeneous freezing of water, Phys. Chem. Chem. Phys., 12, 10380–10387, https://doi.org/10.1039/C003297B, 2010.
Olson, J. S., Watts, J. A., and Allison, L. J.: Carbon in live vegetation of major world ecosystems, Report ORNL-5862, Oak Ridge National Laboratory, Oak Ridge, Tenn., USA, 1983.
O'Sullivan, D., Murray, B. J., Ross, J. F., Whale, T. F., Price, H. C., Atkinson, J. D., Umo, N. S., and Webb, M. E.: The relevance of nanoscale biological fragments for ice nucleation in clouds, Sci. Rep.-UK, 5, 8082, https://doi.org/10.1038/srep08082, 2015.
Ott, W.: A Physical Explanation of the Lognormality of Pollutant Concentrations, J. Air Waste Manag. Assoc., 40, 1378–1383, https://doi.org/10.1080/10473289.1990.10466789, 1990.
Paramonov, M., Kerminen, V.-M., Gysel, M., Aalto, P. P., Andreae, M. O., Asmi, E., Baltensperger, U., Bougiatioti, A., Brus, D., Frank, G. P., Good, N., Gunthe, S. S., Hao, L., Irwin, M., Jaatinen, A., Jurányi, Z., King, S. M., Kortelainen, A., Kristensson, A., Lihavainen, H., Kulmala, M., Lohmann, U., Martin, S. T., McFiggans, G., Mihalopoulos, N., Nenes, A., O'Dowd, C. D., Ovadnevaite, J., Petäjä, T., Pöschl, U., Roberts, G. C., Rose, D., Svenningsson, B., Swietlicki, E., Weingartner, E., Whitehead, J., Wiedensohler, A., Wittbom, C., and Sierau, B.: A synthesis of cloud condensation nuclei counter (CCNC) measurements within the EUCAARI network, Atmos. Chem. Phys., 15, 12211–12229, https://doi.org/10.5194/acp-15-12211-2015, 2015.
Paramonov, M., David, R. O., Kretzschmar, R., and Kanji, Z. A.: A laboratory investigation of the ice nucleation efficiency of three types of mineral and soil dust, Atmos. Chem. Phys., 18, 16515–16536, https://doi.org/10.5194/acp-18-16515-2018, 2018.
Paramonov, M., Drossaart van Dusseldorp, S., Gute, E., Abbatt, J. P. D., Heikkilä, P., Keskinen, J., Chen, X., Luoma, K., Heikkinen, L., Hao, L., Petäjä, T., and Kanji, Z. A.: Condensation/immersion mode ice nucleating particles in a boreal environment, ETH Zürich, https://doi.org/10.3929/ethz-b-000397022, 2020.
Petters, M. D. and Wright, T. P.: Revisiting ice nucleation from precipitation samples, Geophys. Res. Lett., 42, 8758–8766, 2015.
Prenni, A. J., Petters, M. D., Kreidenweis, S. M., Heald, C. L., Martin, S. T., Artaxo, P., Garland, R. M., Wollny, A. G., and Pöschl, U.: Relative roles of biogenic emissions and Saharan dust as ice nuclei in the Amazon basin, Nat. Geosci., 2, 402–405, https://doi.org/10.1038/NGEO517, 2009.
Prenni, A. J., DeMott, P. J., Sullivan, A. P., Sullivan, R. C., Kreidenweis, S. M., and Rogers, D. C.: Biomass burning as a potential source for atmospheric ice nuclei: Western wildfires and prescribed burns, Geophys. Res. Lett., 39, L11805, https://doi.org/10.1029/2012gl051915, 2012.
Pummer, B. G., Bauer, H., Bernardi, J., Bleicher, S., and Grothe, H.: Suspendable macromolecules are responsible for ice nucleation activity of birch and conifer pollen, Atmos. Chem. Phys., 12, 2541–2550, https://doi.org/10.5194/acp-12-2541-2012, 2012.
Pummer, B. G., Budke, C., Augustin-Bauditz, S., Niedermeier, D., Felgitsch, L., Kampf, C. J., Huber, R. G., Liedl, K. R., Loerting, T., Moschen, T., Schauperl, M., Tollinger, M., Morris, C. E., Wex, H., Grothe, H., Pöschl, U., Koop, T., and Fröhlich-Nowoisky, J.: Ice nucleation by water-soluble macromolecules, Atmos. Chem. Phys., 15, 4077–4091, https://doi.org/10.5194/acp-15-4077-2015, 2015.
Radke, L. F., Hobbs, P. V., and Pinnons, J. E.: Observations of Cloud Condensation Nuclei, Sodium-Containing Particles, Ice Nuclei and the Light-Scattering Coefficient Near Barrow, Alaska, J. Appl. Meteorol., 15, 982–995, https://doi.org/10.1175/1520-0450(1976)015<0982:OOCCNS>2.0.CO;2, 1976.
Reid, J. S. and Hobbs, P. V.: Physical and optical properties of smoke from individual biomass fires in Brazil, J. Geophys. Res., 103, 32013–32031, 1998.
Richardson, M. S., DeMott, P. J., Kreidenweis, S. M., Cziczo, D. J., Dunlea, E. J., Jimenez, J. L., Thomson, D. S., Ashbaugh, L. L., Borys, R. D., Westphal, D. L., Casuccio, G. S., and Lersch, T. L.: Measurements of heterogeneous ice nuclei in the western United States in springtime and their relation to aerosol characteristics, J. Geophys. Res., 112, D02209, https://doi.org/10.1029/2006JD007500, 2007.
Rogers, D.: Development of a continuous flow thermal gradient diffusion chamber for ice nucleation studies, Atmos. Res., 22, 149–181, 1988.
Rogers, R. R. and Yau, M. K.: A short course in cloud physics, Pergamon Press, Oxford, New York, 1989.
Rose, D., Gunthe, S. S., Mikhailov, E., Frank, G. P., Dusek, U., Andreae, M. O., and Pöschl, U.: Calibration and measurement uncertainties of a continuous-flow cloud condensation nuclei counter (DMT-CCNC): CCN activation of ammonium sulfate and sodium chloride aerosol particles in theory and experiment, Atmos. Chem. Phys., 8, 1153–1179, https://doi.org/10.5194/acp-8-1153-2008, 2008.
Schmidt, S., Schneider, J., Klimach, T., Mertes, S., Schenk, L. P., Kupiszewski, P., Curtius, J., and Borrmann, S.: Online single particle analysis of ice particle residuals from mountain-top mixed-phase clouds using laboratory derived particle type assignment, Atmos. Chem. Phys., 17, 575–594, https://doi.org/10.5194/acp-17-575-2017, 2017.
Sioutas, C., Koutrakis, P., Ferguson, S. T., and Burton, R. M.: Development and Evaluation of a Prototype Ambient Particle Concentrator for Inhalation Exposure Studies, Inhal. Toxicol., 7, 633–644, 1995.
Sogacheva, L., Dal Maso, M., Kerminen, V.-M., and Kulmala, M.: Probability of nucleation events and aerosol particle concentration in different air mass types arriving at Hyytiälä, southern Finland, based on back trajectories analysis, Boreal Environ. Res., 10, 479–491, 2005.
Sporre, M. K., Swietlicki, E., Glantz, P., and Kulmala, M.: A long-term satellite study of aerosol effects on convective clouds in Nordic background air, Atmos. Chem. Phys., 14, 2203–2217, https://doi.org/10.5194/acp-14-2203-2014, 2014.
Thomson, E. S., Weber, D., Bingemer, H. G., Tuomi, J., Ebert, M., and Pettersson, J. B. C.: Intensification of ice nucleation observed in ocean ship emissions, Sci. Rep.-UK, 8, 1111, https://doi.org/10.1038/s41598-018-19297-y, 2018.
Tobo, Y., Prenni, A. J., DeMott, P. J., Huffman, J. A., McCluskey, C. S., Tian, G., Pöhlker, C., Pöschl, U., and Kreidenweis, S. M.: Biological aerosol particles as a key determinant of ice nuclei populations in a forest ecosystem, J. Geophys. Res.-Atmos., 118, 10100–10110, https://doi.org/10.1002/jgrd.50801, 2013.
Toprak, E. and Schnaiter, M.: Fluorescent biological aerosol particles measured with the Waveband Integrated Bioaerosol Sensor WIBS-4: laboratory tests combined with a one year field study, Atmos. Chem. Phys., 13, 225–243, https://doi.org/10.5194/acp-13-225-2013, 2013.
Twomey, S.: Pollution and planetary albedo, Atmos. Environ., 8, 1251–1256, https://doi.org/10.1016/0004-6981(74)90004-3, 1974.
Vali, G.: Nucleation terminology, B. Am. Meteorol. Soc., 66, 1426–1427, 1985.
Vali, G., DeMott, P. J., Möhler, O., and Whale, T. F.: Technical Note: A proposal for ice nucleation terminology, Atmos. Chem. Phys., 15, 10263–10270, https://doi.org/10.5194/acp-15-10263-2015, 2015.
Vergara-Temprado, J., Holden, M. A., Orton, T. R., O'Sullivan, D., Umo, N. S., Browse, J., Reddington, C., Baeza-Romero, M. T., Jones, J. M., Lea-Langton, A., Williams, A., Carslaw, K. S., and Murray, B. J.: Is black carbon an unimportant ice-nucleating particle in mixed-phase clouds?, J. Geophys. Res.-Atmos., 123, 4273–4283, https://doi.org/10.1002/2017JD027831, 2018.
Virkkula, A., Backman, J., Aalto, P. P., Hulkkonen, M., Riuttanen, L., Nieminen, T., dal Maso, M., Sogacheva, L., de Leeuw, G., and Kulmala, M.: Seasonal cycle, size dependencies, and source analyses of aerosol optical properties at the SMEAR II measurement station in Hyytiälä, Finland, Atmos. Chem. Phys., 11, 4445–4468, https://doi.org/10.5194/acp-11-4445-2011, 2011.
Welti, A., Müller, K., Fleming, Z. L., and Stratmann, F.: Concentration and variability of ice nuclei in the subtropical maritime boundary layer, Atmos. Chem. Phys., 18, 5307–5320, https://doi.org/10.5194/acp-18-5307-2018, 2018.
Wright, T. P., Hader, J. D., McMeeking G. R., and Petters, M. D.: High relative humidity as a trigger for widespread release of ice nuclei, Aerosol Sci. Technol., 48, i–v, https://doi.org/10.1080/02786826.2014.968244, 2014.