the Creative Commons Attribution 4.0 License.
the Creative Commons Attribution 4.0 License.
Spatial–temporal variations and process analysis of O3 pollution in Hangzhou during the G20 summit
Zhi-Zhen Ni
Kun Luo
Xiang Gao
Fei Jiang
Cheng Huang
Jian-Ren Fan
Joshua S. Fu
Chang-Hong Chen
Serious urban ozone (O3) pollution was observed during the campaign of 2016 G20 summit in Hangzhou, China, while other pollutants had been significantly reduced by the short-term emission control measures. To understand the underlying mechanism, the Weather Research Forecast with Chemistry (WRF-Chem) model is used to investigate the spatial and temporal O3 variations in Hangzhou from 24 August to 6 September 2016. The model is first successfully evaluated and validated for local and regional meteorological and chemical parameters by using the ground and upper-air level observed data. High ozone concentrations, temporally during most of the daytime emission control period and spatially from the surface to the top of the planetary boundary layer, are captured in Hangzhou and even the whole Yangtze River Delta region. Various atmospheric processes are further analyzed to determine the influential factors of local ozone formation through the integrated process rate method. Interesting horizontal and vertical advection circulations of O3 are observed during several short periods, and the effects of these processes are nearly canceled out. As a result, ozone pollution is mainly attributed to the local photochemical reactions that are not obviously influenced by the emission reduction measures. The ratio of reduction of Volatile Organic Compounds (VOCs) to that of NOx is a critical parameter that needs to be carefully considered for future alleviation of ozone formation. In addition, the vertical diffusion from the upper-air background O3 also plays an important role in shaping the surface ozone concentration. These results provide insight into urban O3 formation in Hangzhou and support the Model Intercomparison Study Asia Phase III (MICS-Asia Phase III).
- Article
(6554 KB) - Full-text XML
-
Supplement
(1027 KB) - BibTeX
- EndNote
Tropospheric ozone (O3) is generated by a series of photochemical reactions involving volatile organic compounds (VOCs), nitrogen oxide (NOx) and carbon monoxide (CO) (Wang et al., 2006). As a primary component of photochemical smog, ground-level O3 pollution causes detrimental effects on human health (Ha et al., 2014; Kheirbek et al., 2013) and the ecosystem (Landry et al., 2013; Teixeira et al., 2011). However, O3 pollution is a challenging problem worldwide. O3 levels in cities in the United States and Europe are increasing more than those in the rural areas of these regions, where peak values gradually decreased during 1990–2010 (Paoletti et al., 2014). Nagashima et al. (2017) reported that long-term (1980–2005) trends of increase in surface O3 over Japan may be primarily attributed to the continental transport, which has also contributed to photochemical O3 production. Urban O3 pollution events have also been observed in developing countries, such as Thailand (Zhang and Kim Oanh, 2002) and India (Calfapietra et al., 2016).
Many field monitoring and modeling studies have investigated the photochemical characteristics of near-surface O3 pollution (Tang et al., 2009, 2012; Wang et al., 2013, 2014), the photochemistry of O3 and its precursors (Xie et al., 2014), the interactions between O3 and PM2.5 (Shi et al., 2015), and urban O3 formation (Tie et al., 2013). It is clear that in addition to anthropogenic emissions of O3 precursors, uncontrollable physical and chemical processes involved in meteorological phenomena significantly modulate changes in O3 concentration (Xue et al., 2014). In the Yangtze River Delta (YRD) region of China, high O3 concentrations have been observed (Gao et al., 2016; Jiang et al., 2012). Synoptic patterns related to tropical cyclones may be one reason for such high O3 concentrations (Huang et al., 2005). Jiang et al. (2015) reported that enhanced stratosphere–troposphere exchange (STE) driven by a tropical cyclone abruptly increased O3 concentrations (21–42 ppb) in southeastern China from 12 to 14 June 2014, which has been highlighted as another contributor to near-surface O3 concentrations under certain conditions (Lin et al., 2012, 2015). However, the complex dynamics in atmospheric processes related to O3 formation are so difficult to identify that the O3 pollution characteristics and underlying causes are not yet well understood.
Hangzhou, the capital of Zhejiang Province, is located in the center of the Yangtze River Delta, which is one of the most developed areas in China. Resulting from local emissions (Wu et al., 2014; Hu et al., 2015) and transboundary transport of aerosol and trace gases (Liu et al., 2015; Ni et al., 2018; Zhang et al., 2018), air pollution in Hangzhou has become serious in recent years. In 2016, Hangzhou hosted the G20 (Group of 20 Finance Ministers and Central Bank Governors) summit from 4 to 6 September. To improve air quality for this event, 14 d temporally strict air pollution alleviation measures had been taken to reduce air pollutant emissions in Hangzhou and surrounding areas from 24 August to 6 September 2016. The emission control scheme includes a coal-fired power plant capacity 50 % reduction from 24 August, followed by an “odd–even” on-road vehicle restriction from 28 August and further emergent VOC reduction from industrial sectors from 1 to 6 September (Ji et al., 2018; H. Li et al., 2019; Ni et al., 2019; Wu et al., 2019). These short-term measures provide a valuable opportunity to investigate the response of air quality to the emission reduction, understand the formation mechanisms of air pollution, and explore effective policies for long-term air pollution control on the local or regional scale.
The effects of emission control on air pollutants during this G20 Summit have been investigated by several studies using field observations and numerical models. It is demonstrated that almost all major air pollutants, including SO2, NOx (H. Li et al., 2019; Wu et al., 2019), fine particles (Ji et al., 2018; H. Li et al., 2019; Yu et al., 2018; Wu et al., 2019) and VOCs (Zheng et al., 2019) were significantly reduced during the 14 d control period except O3. Su et al. (2017) monitored the vertical profiles of ozone concentration in the lower troposphere of Hangzhou during the control period by using an ozone lidar. It was found that the ozone concentrations peaked near the top of the planetary boundary layer, and the temporary measures had no immediate effect on ozone pollution. Wu et al. (2019) investigated the variation in air pollution in Hangzhou and its surrounding areas during the G20 summit by using monitoring data from five sites and reported that the air quality had been greatly improved by the implementation of the emission control. However, the average O3 concentration was increased by 19 % compared to the same periods of the 5 preceding years. This unique response of ozone pollution to control measures is not well understood and is of great research interest for better control of ozone pollution in the future.
To this end, a regional air quality model, within the framework of the Model Intercomparison Study Asia Phase III (J. Li et al., 2019), is used to investigate the spatial–temporal characteristics of ozone pollution in Hangzhou during the G20 Summit in the present work. Process analysis is conducted to understand the chemical and physical factors that contribute to O3 abundance. It is found that the serious ozone pollution occurred, mainly resulting from the local photochemical reactions that are not under good control under the emission reduction measures. The rest of this paper is organized as follows. Section 2 outlines the methodology and configuration of the model system. Section 3 presents the model evaluation. Section 4 shows the spatial–temporal characteristics of ozone pollution and the analysis of related atmospheric processes. Section 5 discusses the underlying causes of O3 pollution. Finally, a summary is given.
2.1 Regional chemistry modeling system
To investigate the interactions among emissions, meteorological phenomena and chemical phenomena, the Weather Research Forecast with Chemistry model (WRF-Chem) is used in the present study. WRF-Chem is a regional online-coupled air quality model that can simultaneously simulate air quality components and meteorological components by using identical transport schemes, grid structures and physical schemes (Grell et al., 2005). The two following model domains are designed: an outer domain (horizontal resolution: 30 km) covering eastern China (20.0–44.5∘ N, 99.0–126.5∘ E) and an inner domain (horizontal resolution: 6 km) covering the YRD region (27.6–32.7∘ N, 116.9–122.4∘ E), as shown in Fig. 1. The Lambert conformal conic projection is applied, with the domain center at 34∘ N, 111∘ E. A total of 31 vertical layers are used, with the model top set at 50 hPa. The simulation period is from 17 August to 6 September 2016, and the first-week simulation is used to spin up the model. Hourly model outputs for 24 August to 6 September are used in the analysis. The gas mechanism CBMZ (Chemical Bond Mechanism Version Z) (Zaveri and Peters, 1999) is used for model simulations. For additional details regarding the model parameterization schemes, please refer to previous studies (e.g., Ni et al., 2018).
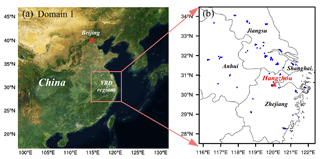
Figure 1Double-nested simulation domains. (a) Domain 1 is 30 km in eastern China with 102∘ (W–E) × 111∘ (S–N) × 31 (vertical layers) grids. (b) Domain 2 is 6 km in the Yangtze River Delta (YRD) region with 100∘ (W–E) × 115∘ (S–N) × 31 (vertical layers) grids. Blue dots denote the air quality monitoring sites. The copyright of the background map belongs to ©Google Maps.
The meteorological boundary and initial conditions are determined from the global objective final analysis (FNL) data of the National Centers for Environmental Prediction (Kalnay et al., 1996). The FNL data are mapped to domain 1 (eastern China), and the grid-nudging method (Stauffer et al., 1991) is used to reduce the meteorological integral errors. The chemical initial and boundary conditions are dynamically downscaled from the simulation results of the model for ozone and related chemical tracers, version 4 (MOZART4) (Emmons et al., 2010).
The 2016 Multi-resolution Emission Inventory for China (MEIC, ; http://www.meicmodel.org/, last access: 6 May 2020) is used for the outer domain (Fig. 1a) with a spatial resolution of 30 km (M. Li et al., 2017), including species of SO2, NOx, CO, NH3, PM2.5 and VOCs from the power, industrial, residential, transportation and agricultural sectors. Inventories of finer anthropogenic emissions for the YRD region over the year 2014 compiled by Shanghai Academy of Environmental Sciences are used for the inner domain (Fig. 1b). These inventories have been well documented in previous studies (Huang et al., 2011; Li et al., 2011; Liu et al., 2018). The fine-emission inventories include major sectors, such as large point sources, industrial sources, mobile sources and residential sources. The anthropogenic emissions over the YRD region are mainly located over the industrial and urban areas along the Yangtze River, as well as over Hangzhou Bay. In this study, the emission inventories for the two domains are projected into horizontal and vertical grids as hourly emissions, with temporal and vertical profiles obtained from Wang et al. (2011). VOCs emissions are categorized into modeled species, according to von Schneidemesser et al. (2016). In addition, biogenic emissions are generated offline using the Model of Emission of Gases and Aerosols from Nature (MEGAN) (Guenther et al., 2006). Dust emissions are calculated online from surface features and meteorological fields by using the Air Force Weather Agency and Atmospheric and Environmental Research scheme (Jones et al., 2011). Other emissions, such as those from biomass burning, aviation and sailing ships, accounting for very small fraction during this period, are therefore not considered here. However, it is worth noting that these base inventories have been modified in the simulation to reflect the realistic emissions according to the control measures taken in the period presented in the Introduction.
3.1 Atmospheric processes analysis
To understand the underlying mechanism of O3 formation, individual physical and chemical processes of O3 formation are investigated by using the integrated process rate (IPR) analysis in the WRF-Chem model (Jeffries and Tonnesen, 1994). The IPR analysis differentiates changes in pollutant concentrations from individual atmospheric processes, which quantitatively elucidates the contributions of each process, mainly including advection, diffusion, emission, deposition, clouds process, and aerosol and gaseous chemistry. The IPR analysis has been widely applied and demonstrated to be an effective tool for investigating the relative importance of individual processes and interpreting O3 concentrations (Gonçalves et al., 2009; Tang et al., 2017; Shu et al., 2016). In the present work, we consider gas chemistry, vertical diffusion, and horizontal and vertical advection as the main atmospheric processes for O3 formation. Other processes, such as cloud process and horizontal diffusion, play minor roles and are thus not considered.
3.2 Evaluation metrics
To increase the confidence in interpretations of model results, model outputs should first be evaluated based on observations. Accordingly, the model results derived from domain 2 are compared with hourly surface observational data obtained from 96 air quality monitoring sites in the YRD region (blue dots, Fig. 1b) in this study. These observational data are downloaded from http://www.pm25.in/ (last access: 6 May 2020), and O3 and its precursor NO2 are evaluated in terms of statistical measures, namely the mean fractional bias (MFB), the mean fractional error (MFE) and the correlation coefficient (R), following the recommendation of the US Environmental Protection Agency (US EPA, 2007). Additionally, the meteorological parameters are evaluated based on the observational data, including temperature at 2 m (T2), relative humidity at 2 m (RH2), 10 m wind speed (WS10) and direction (WD10), from the Meteorological Assimilation Data Ingest System (https://madis.noaa.gov/, last access: 6 May 2020). Following the study of Zhang et al. (2014), commonly used mean bias (MB), gross error (GE) and root-mean-square error (RMSE) are calculated as the statistical indicators. All used statistical indicators are summarized in Table 1.
Table 1Discrete statistical indicators used in the model evaluation.
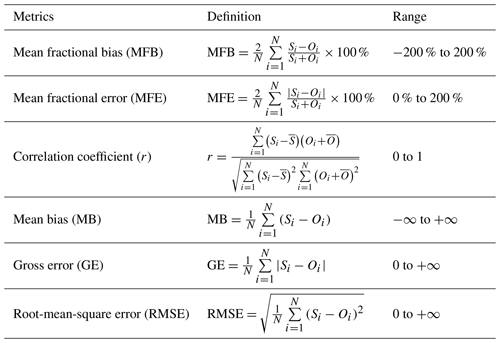
N is the number of samples. Si and Oi are values of simulations and observations at time or location i, respectively.
Besides the above evaluation of single-point-based time series results, the vertical spatial distribution of modeled O3 in Hangzhou is also evaluated by comparisons with observed differential absorption lidar (DIAL) data (Su et al., 2017). In the DIAL technique, the mean gas concentration over a certain range interval is determined by analyzing the lidar backscatter signals for laser wavelengths tuned to “on” (λon) and “off” (λoff) in a molecular absorption peak of the gas under investigation (Browell et al., 1998). In the DIAL data of O3, the vertical height available is from 0.3 to 3 km due to the limitations of the signal-to-noise ratio and detection range.
4.1 Model performance
We first evaluate the overall performance of WRF-Chem for the YRD region by incorporating data from the 96 air quality monitoring sites. Specifically, the maximum daily 8 h (MDA8) ozone and daily mean NO2 concentrations at the surface are used. The spatial distributions of MFB and MFE for O3 and NO2 are illustrated in Fig. 2. In general, the model-simulated air pollutant concentrations agree well with the observations, with MFB and MFE at most of the sites meeting the benchmarks (MFB<15 %; MFE<35 %) (US EPA, 2007). A scatter plot of MFB and MFE is shown in Fig. 3, further demonstrating the capability of the present model to reproduce the observations, which is also supported by the high correlation between the model and observations (Fig. 3c, d).
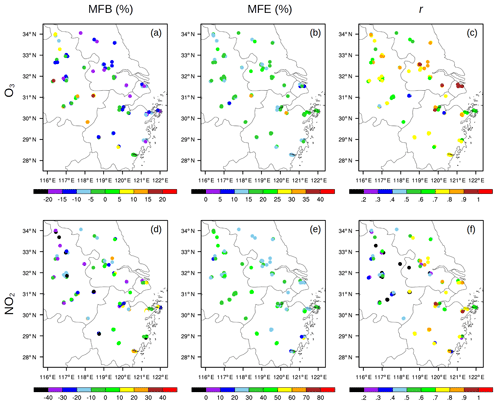
Figure 2Comparison of modeled air pollutant concentrations against measurements at 96 monitoring sites over YRD region during 24 August–6 September 2016: mean fractional bias (MFB), mean fractional error (MFE), and Pearson's correlation coefficient (r) of O3 (a–c) and NO2 (d–f).
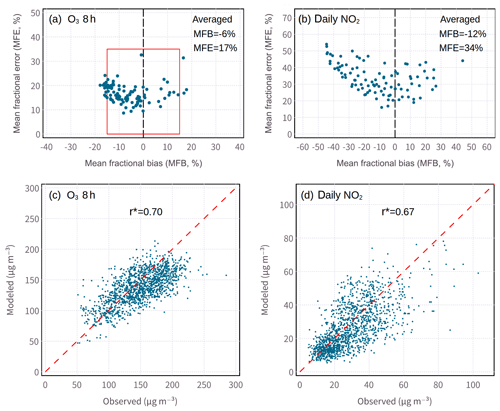
Figure 3Comparisons of modeled and observed concentrations of the air pollutants from 96 air quality monitoring sites across the YRD from 24 August to 6 September 2016 (1344 pairs). Scatter plots for MFB and MFE of (a) O3 and (b) NO2. Performance goals (red box) for O3 are the benchmarks. Scatter plots for daily observed and modeled (c) O3 and (d) NO2.
After the above overall evaluation of the present model in the whole YRD region, the site of Hangzhou will be focused on for further analysis. The time series of hourly simulated and observed air pollutants (O3, Fig. 4a; NO2, Fig. 4b) and meteorological factors (T2, Fig. 4c; RH2, Fig. 4d; WS10, Fig. 4e; and WD10, Fig. 4f) at Hangzhou are presented in Fig. 4. It is found that all modeled data are statistically significantly correlated with the observed data at the 95 % level. The MFB and MFE for both O3 and NO2 are well below the benchmarks (MFB and MFE: 15 %/35 %; US EPA, 2007), and the observed diurnal variations are well reproduced. For meteorological parameters, ∘C, GE≤2.0 ∘C), 10 m wind speed (MB≤0.5 m s−1, RMSE≤2.0 m s−1) and 10 m wind direction (∘, GE≤30∘). McNally (2009) suggested a relaxed benchmark for 2 m temperature ( ∘C). In this study, the 10 m wind speed and wind direction (Fig. 3e, f) results are well within the benchmarks. The GE of 2 m air temperature (1.9 ∘C; Fig. 3c) also satisfies the criteria, but the MB is slightly higher (−1.6 ∘C), which has also been noted in a previous study (Zhang et al., 2014). These comparisons further demonstrate that the present model is able to correctly predict the time series of both meteorological parameters and air pollutants of O3 and NO2 in Hangzhou.
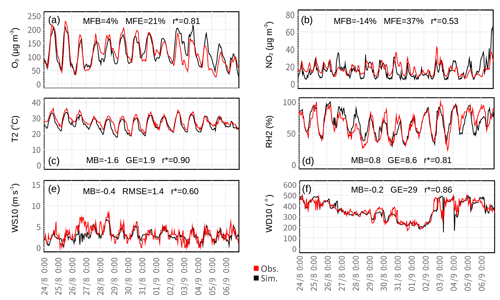
Figure 4Modeled air pollutants and meteorological parameters compared with measurements at the Hangzhou monitoring site from 24 August to 6 September 2016. Surface concentrations of (a) O3 and (b) NO2, (c) temperature at 2 m (T2), (d) relative humidity at 2 m (RH2), (e) wind speed at 10 m (WS10), and (f) wind direction at 10 m (WD10).
To further evaluate the capability of the model to predict the vertical structure of ozone concentration, the vertical distribution of the modeled O3 in Hangzhou from 24 August to 6 September 2016 is qualitatively compared with the DIAL data, as shown in Fig. 5. It is interesting to find that the present model can successfully predict the spatial–temporal distribution of ozone in Hangzhou. All observed major features of ozone are well captured by the model. This gives us high confidence and lays a solid foundation for further exploring the pollution characteristics and influencing factors of ozone in Hangzhou during the G20 summit.

Figure 5Vertical comparison of hourly (a) observed (from differential absorption lidar) and (b) simulated O3 concentrations (ppb) in Hangzhou from 24 August to 6 September 2016. Purple regions in (a) denote invalid data with a low signal-to-noise ratio. To facilitate direct comparison, the dashed red line is added to indicate the ozone level recorded for the same time periods (starting from 12:00 LST, 24 August) and vertical heights (0.3–3 km) in the observations and simulation results.
4.2 Spatial–temporal variations of O3 pollution
To discuss spatial–temporal characteristics of O3 pollution in Hangzhou, the whole emission control period can be divided into three stages according to the reduction intensity of the measures. The period from 24 to 27 August 2016 was the first stage (S1), during which industrial and construction emission controls were implemented. During the second stage (S2, 28–31 August), traffic restrictions were further added. The third stage (S3) from 1 to 6 September 2016 was when the emergent VOCs control was further implemented. Figure 4a and b in the above section also present the temporal evolution of O3 and its precursor NO2 in Hangzhou during the emission control period of G20 summit. It is evident that NO2 has been significantly reduced by the emission control measures and that the concentration is well below the national Level II standard of 200 µg m−3. However, the concentration of O3 remains at high levels for the whole 14 d, with 7 d of MDA8 above and 4 d close to the national Level II standard (GB-3095–2012) of 160 µg m−3. This serious O3 pollution indicates that the emission control measures seem to have no obvious effect on ozone, which is consistent with previous observations (Su et al., 2017; Wu et al., 2019). The diurnal variation in O3 is similar for the three stages, with a peak value at around 16:00 LST (local sidereal time) and a valley value at the time around 08:00 LST each day. However, the variation magnitude in Stage 2 is obviously lower than those of other stages, which will be further discussed later.
Figure 5 also clearly shows this diurnal variation in O3 at ground level. However, nocturnal O3-rich mass is observed during certain periods in the upper air (approximately 1 km), such as 25 and 31 August and 3 September, which makes an n-shaped distribution pattern of O3 in the upper air. This kind of spatial distribution of ozone will promote vertical exchange of O3 in the area. In general, high concentrations of O3 appear vertically up to the top of the planetary boundary layer (PBL, approximately <2 km), suggesting the ozone pollution is not a local phenomenon but is instead a regional phenomenon in the whole low-level (from surface to close to the PBL height) region.
Considering that the synoptic circulation is closely related to regional O3 abundance, four representative surface weather charts obtained from the Korea Meteorological Administration are presented in Fig. 6. In the early stage, strong and uniform high-pressure fields covered vast regions of southeastern China, and a tropical cyclone moved northeast over the East China Sea (Fig. 6a). In the middle stage (Fig. 6b), the tropical cyclone approached the YRD region, bringing strong north wind fields to this area. As a result, the long narrow rain band arrived in Hangzhou (red triangle) on 27 August 2016. In the later stage (Fig. 6c), the cyclone continuously moved and eventually hit the land, and the tropical high in the YRD region recovered gradually. Finally, the cyclone faded, and a rainstorm appeared over most of the YRD region (Fig. 6d).
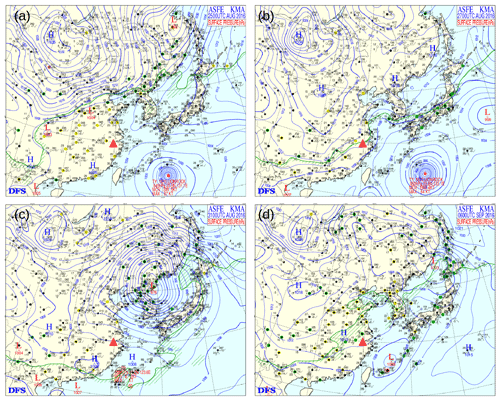
Figure 6Synoptic circulation in East Asia during the 2016 G20 summit. Weather charts for four representative periods at 08:00 LST (local sidereal time) on (a) 25 August, (b) 27 August, (c) 31 August and (d) 6 September 2016. H denotes a high-pressure system. L denotes a low-pressure system. The red triangle denotes the location of Hangzhou.
The typical hourly vertical and horizontal O3 distributions in the YRD region are further presented in Fig. 7. The wind fields are also included for better understanding. For stagnation days with weak wind fields and strong radiation before or after the tropical cyclone, meteorological conditions are unfavorable for pollutant dispersion. As a result, O3 pollution is more regional and intense, with an hourly peak O3 concentration of 250 µg m−3 that appeared within the planetary boundary layer in the whole YRD region, as shown in Fig. 7a and c. In these conditions, photochemical reactions dominate the ozone formation and accumulation. This phenomenon is consistent with the satellite-derived tropospheric O3 distribution in the area (Su et al., 2017) and is also supported by the observed ozone data from the 96 sites in the YRD region, as shown in Fig. 3c. During the 14 d emission control period of G20 summit, 52 % of the observed ozone samples from the 96 sites are above the China's national Level II standard (160 µg m−3), suggesting that regional ozone pollution appears in the YRD region during the study period. As the cyclone approached on 27 August, a large belt of O3 mass appeared in the upwind direction and moved toward Hangzhou under a prevailing north wind field (Fig. 7b). Regional pollutant transport may play an important role under this condition. However, because of the rain and cooling effects from the cyclone, the ozone concentration is relatively low in the whole YRD region.
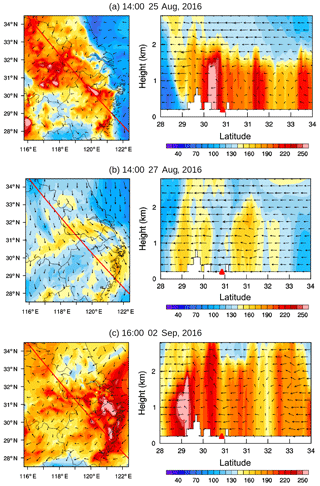
Figure 7Surface and low-level O3 distributions (µg m−3) and wind fields (vectors, m s−1) for representative episodes: (a) stagnant weather before the tropical cyclone, (b) pollutant transport when the tropical cyclone approached and (c) stagnant weather after the cyclone. The red line denotes the cross section line of low-level O3 distributions. The red triangle denotes the location of Hangzhou.
4.3 Process analysis of O3 formation
To further investigate the underlying mechanism of O3 pollution, hourly variations in the change rate of low-level O3 resulting from different physical and chemical processes are presented in Fig. 8. It is evident that gas chemistry is the dominant factor for the strong generation of abundant O3 in the entire planetary boundary layer (<2 km) in the daytime but causes a small amount of depletion of O3 at near-surface height (<0.3 km) at nighttime (Fig. 8a). High concentrations of O3 diffuse from the upper layer downward to the ground through vertical diffusion during the whole study period, which is obvious in the daytime (Fig. 8b). However, this effect is relatively weak compared to other processes. Horizontal and vertical advection seem to play more important roles in shaping the near-surface O3, as indicated in Fig. 8c and d. Several interesting dynamic O3 circulations are observed between the near-surface and upper-air regions and indicated by the dashed boxes. During the periods of 24 to 26 August and 31 August to 2 September 2016, the O3-rich mass in the lower layer (<1 km) traveled to Hangzhou through horizontal advection and was then transported upward to the higher layer through vertical advection. At this higher layer, the mass subsequently travels away from Hangzhou to other places through horizontal advection in a circular manner. This phenomenon might be associated with the urban heat island circulation (Lai and Cheng, 2009). However, during the period of 3–6 September 2016, a similar circulation phenomenon is observed, but the flow direction is reversed. The O3-rich mass travels downward to the ground through vertical advection and is then transported to surrounding regions through horizontal advection. This downward circulation is also related to the meteorological conditions after the cyclone. In addition, the horizontal and vertical advection of O3 took on a chaotic status during 27–30 August 2016, suggesting that complicated variable meteorological conditions happened at the time. This is also the reason for the lower magnitude of diurnal variation in Stage 2.
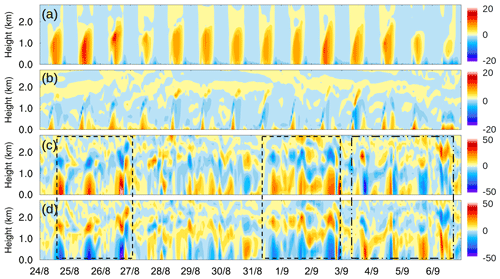
Figure 8Hourly variations in the change rate of low-level O3 (ppb h−1) that resulted from (a) gas chemistry, (b) vertical diffusion, (c) horizontal advection and (d) vertical advection in Hangzhou.
Figure 9 shows the daytime mean change rate of simulated O3 at ground level resulted from various atmospheric processes and the correlation of gas chemistry generation and observed maximum for daily 8 h concentration of O3. As a whole, the main sources of local surface ozone in Hangzhou are from gas chemistry, vertical diffusion and horizontal advection, with mean production rates of 1.9, 3.3 and 6.7 ppb h−1, respectively, from 24 August to 6 September 2016, and the major sink is vertical advection. However, during some days, such as 5–6 September, gas chemistry consumes O3 while vertical advection increases it. In general, strong net horizontal and vertical advection of O3 are observed for most days of the period, except for 27–28 August, during which the strongest cold northwesterly winds (Fig. 4e) occurred and made the net advection of O3 negligible. Similar to Fig. 8, dynamic O3 circulations are observed for the periods of 24–26 August, 31 August to 2 September and 5–6 September. Specifically, the circular direction is reversed during 5–6 September, and the net gas chemistry is to consume ozone due to weak solar radiation during the day, as shown in Fig. 10.
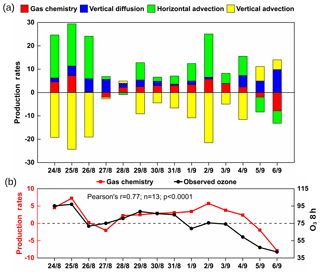
Figure 9(a) Daytime mean (08:00–17:00 LST) change rate of simulated surface O3 (ppb h−1; left y axis) resulting from gas chemistry, vertical diffusion, and horizontal and vertical advection in Hangzhou. (b) Correlation of daytime mean gas chemistry generation (ppb h−1; left y axis) and observed surface-level maximum for daily 8 h concentration of O3 (ppb; right y axis) in Hangzhou. China's national Level II standard is approximately 75 ppb (160 µg m−3).
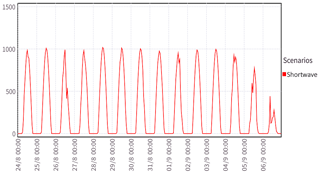
Figure 10Simulated hourly downward shortwave flux at the ground surface in Hangzhou (W m−2) during 24 August to 6 September 2016.
In addition, the variation trend of the daytime mean production rate of gas chemistry is consistent with the observed MDA8 concentration, and the local chemical generation has large positive correlation (Pearson's r=0.77) with the observed MDA8 concentrations (Fig. 8b). This indicates a trade-off effect among vertical diffusion, horizontal advection and vertical advection. High O3 concentrations (i.e., MDA8 on 25 August 2016: 98 ppb) are always accompanied by strong radiation and prolific generation of gas chemical reactions. It is also interesting to find that vertical diffusion may partially compensate for gas chemistry when the chemical reaction rate is relatively low or negative. For example, during 26–27 August and 5–6 September, the vertical diffusion rates are higher than the chemical production rates. The low O3 episode during these periods may result from local chemical consumption.
The above results demonstrate that high ozone concentrations are observed, temporally during most of the daytime emission control period of G20 summit and spatially in Hangzhou and even the whole YRD region, from the surface to the top of the planetary boundary layer. Strong horizontal and vertical advection appear, but they form circulations due to special meteorological conditions, thus their effects almost cancel each other out. As a result, the serious ozone pollution in Hangzhou mainly results from the local photochemical reactions. When the photochemical reactions are weak, the vertical diffusion from the upper-air notable background O3 further compensates for the local surface ozone concentration. Therefore, it is of great importance to understand why the strict emission control measures have no obvious effect on the local photochemical reactions of ozone generation.
Chemical generation of O3 is the net effect of photochemical generation and titration consumption. VOC oxidation (Jenkin et al., 1997; Sillman, 1999) in photochemical reactions provides critical oxidants (i.e., RO2) that efficiently convert NO to NO2, resulting in further accumulation of O3 (Wang et al., 2017). The chemical generation of O3 is controlled by NOx and VOCs, depending on which substance is lacking in the reactions. As a consequence, there are two sensitivity regimes of O3 production, namely the NOx-limited and VOC-limited regimes. Previous studies have shown that the sensitivity pattern of surface O3 formation in Hangzhou is dominated by the VOC-limited regime (Yan et al., 2016; K. Li et al., 2017; Su et al., 2017). In this regime, if the regional reduction of VOCs is much higher than that of NOx, the O3 concentration can be reduced. However, if the regional reduction of VOCs is much lower than that of NOx, the inhibitory effect of NOx on O3 generation will be weakened, and the O3 concentration will increase remarkably. According to the studies of Su et al. (2017), Zheng et al. (2019) and Wu et al. (2019), it can be deduced that NOx has been significantly reduced by about 60%, at least 2 times the reduction of VOCs in Hangzhou. The influence of stringent emission control measures on VOCs is not as immediate an effect as that on NOx, which is associated with the fact that there was a large amount of biogenic VOC emission in Hangzhou and surrounding regions (Liu et al., 2018; Wu et al., 2020). In fact, the average temperature during the study period is as high as around 31 ∘C (Fig. 4c), which facilitates the biogenic VOC emissions and photochemical reactions. As a result, the photochemical generation of O3 was not under control and high concentrations of ozone appeared. However, it is worth noting that after the emergent VOCs control measures had been implemented in the area during the third stage, the net generation rate of O3 gradually reduced since 2 September 2016, leading to a period of relatively low ozone concentration together with other meteorological effects. These discussions imply that to alleviate ozone pollution, the ratio of reduction of VOCs to that of NOx is the key parameter based on the sensitivity analysis. As the biogenic VOCs are important sources of total VOCs in the YRD region, it is necessary to balance the reduction of NOx to make the ratio within the effective regime in the future.
To understand the unique response of ozone to short-term emission control measures during the G20 summit in Hangzhou, the spatial–temporal characteristics and process analysis of O3 pollution are investigated by using the WRF-Chem model. Statistical evaluations of meteorological and chemical parameters suggest that the model system is able to reasonably predict the observed data for both the ground and upper-air levels in Model Intercomparison Study Asia Phase III (MICS-Asia III). High ozone concentrations are observed, temporally during most of the daytime emission control period of the G20 summit and spatially in Hangzhou and even the whole YRD region, from the surface to the top of the planetary boundary layer. Horizontal and vertical advection circulations are captured in Hangzhou, with horizontal advection the source and vertical advection the sink of the surface O3 in Hangzhou. Consequently, serious ozone pollution mainly results from the local photochemical reactions that are not under good control by the emission reduction measures. As the surface O3 formation in Hangzhou is dominated by the VOC-limited regime, the significant reduction of NOx compared to that of VOCs is unfavorable to chemical generation of O3. The ratio of reduction of VOCs to that of NOx based on the sensitivity analysis is a critical parameter for reduction of ozone formation from photochemical reactions. In addition, it is found that the vertical diffusion from the upper-air notable background O3 also plays an important role in shaping the surface ozone concentration when the photochemical reactions are weak.
Modeled and observed concentrations of the air pollutants from 96 air quality monitoring sites can be accessed in the Supplement (valuation_data.csv).
Other key data associated with color map are not provided because the model output data is so large (nearly 90 GB) that we have to make the plots through programming directly from model output data.
The supplement related to this article is available online at: https://doi.org/10.5194/acp-20-5963-2020-supplement.
ZZN contributed to the data curation, investigation, and writing of the original draft. KL contributed to the methodology and resources, and supervised the review and editing of the text. YG contributed to the formal analysis and methodology and reviewed and edited the text. XG contributed to the data curation and resources. FJ contributed to the methodology and review and edited the text. CH contributed to the data curation and formal analysis. JRF contributed to the resources and supervision of the study. JSF contributed to the review and editing of the text. CHChen contributed to the formal analysis.
The authors declare that they have no conflict of interest.
This article is part of the special issue “Regional assessment of air pollution and climate change over East and Southeast Asia: results from MICS-Asia Phase III”. It is not associated with a conference.
We would like to thank the US National Oceanic and Atmospheric Administration for its technical support in WRF-Chem modeling. High-resolution emission inventories were provided by the Institute of Environmental Science, Shanghai, China, and the official documents of emission control policies were obtained from the Hangzhou Environmental Monitoring Center.
This research has been supported by the Ministry of Environmental Protection of China (grant no. 201409008-4) and the Zhejiang Provincial Key Science and Technology Project for Social Development (grant no. 2014C03025).
This paper was edited by Gregory R. Carmichael and reviewed by two anonymous referees.
Browell, E. V., Ismail, S., and Grant, W. B.: Differential absorption lidar (DIAL) measurements from air and space, Appl. Phys. B-Lasers O., 67, 399–410, https://doi.org/10.1007/s003400050523, 1998.
Calfapietra, C., Morani, A., Sgrigna, G., Di Giovanni, S., Muzzini, V., Pallozzi, E., Guidolotti, G., Nowak, D., and Fares, S.: Removal of Ozone by Urban and Peri-Urban Forests: Evidence from Laboratory, Field, and Modeling Approaches, J. Environ. Qual., 45, 224–233, https://doi.org/10.2134/jeq2015.01.0061, 2016.
Emmons, L. K., Walters, S., Hess, P. G., Lamarque, J.-F., Pfister, G. G., Fillmore, D., Granier, C., Guenther, A., Kinnison, D., Laepple, T., Orlando, J., Tie, X., Tyndall, G., Wiedinmyer, C., Baughcum, S. L., and Kloster, S.: Description and evaluation of the Model for Ozone and Related chemical Tracers, version 4 (MOZART-4), Geosci. Model Dev., 3, 43–67, https://doi.org/10.5194/gmd-3-43-2010, 2010.
Gao, J., Zhu, B., Xiao, H., Kang, H., Hou, X., and Shao, P.: A case study of surface ozone source apportionment during a high concentration episode, under frequent shifting wind conditions over the Yangtze River Delta, China, Sci. Total Environ., 544, 853–863, https://doi.org/10.1016/j.scitotenv.2015.12.039, 2016.
Gonçalves, M., Jiménez-Guerrero, P., and Baldasano, J. M.: Contribution of atmospheric processes affecting the dynamics of air pollution in South-Western Europe during a typical summertime photochemical episode, Atmos. Chem. Phys., 9, 849–864, https://doi.org/10.5194/acp-9-849-2009, 2009.
Grell, G. A., Peckham, S. E., Schmitz, R., McKeen, S. A., Frost, G., Skamarock, W. C., and Eder, B.: Fully coupled “online” chemistry within the WRF model, Atmos. Environ., 39, 6957–6975, https://doi.org/10.1016/j.atmosenv.2005.04.027, 2005.
Guenther, A., Karl, T., Harley, P., Wiedinmyer, C., Palmer, P. I., and Geron, C.: Estimates of global terrestrial isoprene emissions using MEGAN (Model of Emissions of Gases and Aerosols from Nature), Atmos. Chem. Phys., 6, 3181–3210, https://doi.org/10.5194/acp-6-3181-2006, 2006.
Ha, S., Hu, H., Roussos-Ross, D., Haidong, K., Roth, J., and Xu, X.: The effects of air pollution on adverse birth outcomes, Environ. Res., 134, 198–204, https://doi.org/10.1016/j.envres.2014.08.002, 2014.
Huang, C., Chen, C. H., Li, L., Cheng, Z., Wang, H. L., Huang, H. Y., Streets, D. G., Wang, Y. J., Zhang, G. F., and Chen, Y. R.: Emission inventory of anthropogenic air pollutants and VOC species in the Yangtze River Delta region, China, Atmos. Chem. Phys., 11, 4105–4120, https://doi.org/10.5194/acp-11-4105-2011, 2011.
Huang, J. P., Fung, J. C. H., Lau, A. K. H., and Qin, Y.: Numerical simulation and process analysis of typhoon-related ozone episodes in Hong Kong, J. Geophys. Res., 110, D05301, https://doi.org/10.1029/2004JD004914, 2005.
Hu, S. W., Wu, X. F., Luo, K., Gao, X., and Fan, J. R.: Source apportionment of air pollution in Hangzhou city based on CMAQ, Energy Eng., 7, 40–44, 2015.
Jeffries, H. E. and Tonnesen, S.: A comparison of two photochemical reaction mechanisms using mass balance and process analysis, Atmos. Environ., 28, 2991–3003, 1994.
Jenkin, M. E., Saunders, S. M., and Pilling, M. J.: The tropospheric degradation of volatile organic compounds: A protocol for mechanism development, Atmos. Environ., 31, 81–104, https://doi.org/10.1016/S1352-2310(96)00105-7, 1997.
Ji, Y., Qin, X., Wang, B., Xu, J., Shen, J., Chen, J., Huang, K., Deng, C., Yan, R., Xu, K., and Zhang, T.: Counteractive effects of regional transport and emission control on the formation of fine particles: a case study during the Hangzhou G20 summit, Atmos. Chem. Phys., 18, 13581–13600, https://doi.org/10.5194/acp-18-13581-2018, 2018.
Jiang, F., Zhou, P., Liu, Q., Wang, T., Zhuang, B., and Wang, X.: Modeling tropospheric ozone formation over East China in springtime, J. Atmos. Chem., 69, 303–319, https://doi.org/10.1007/s10874-012-9244-3, 2012.
Jiang, Y. C., Zhao, T. L., Liu, J., Xu, X. D., Tan, C. H., Cheng, X. H., Bi, X. Y., Gan, J. B., You, J. F., and Zhao, S. Z.: Why does surface ozone peak before a typhoon landing in southeast China?, Atmos. Chem. Phys., 15, 13331–13338, https://doi.org/10.5194/acp-15-13331-2015, 2015.
Jones, S. L., Creighton, G. A., Kuchera, E. L., and Rentschler, S. A.: Adapting WRF-CHEM GOCART for Fine-Scale Dust Forecasting, AGU Fall Meeting Abstracts, NH53A-1258, p. 6., 2011.
Kalnay, E., Kanamitsu, M., Kistler, R., Collins, W., Deaven, D., Gandin, L., Iredell, M., Saha, S., White, G., Woollen, J., Zhu, Y., Chelliah, M., Ebisuzaki, W., Higgins, W., Janowiak, J., Mo, K. C., Ropelewski, C., Wang, J., Leetmaa, A., Reynolds, R., Jenne, R., and Joseph, D.: The NCEP/NCAR 40-Year Reanalysis Project, B. Am. Meteorol. Soc., 77, 437–472, https://doi.org/10.1175/1520-0477(1996)077<0437:TNYRP>2.0.CO;2, 1996.
Kheirbek, I., Wheeler, K., Walters, S., Kass, D., and Matte, T.: PM2.5 and ozone health impacts and disparities in New York City: Sensitivity to spatial and temporal resolution, Air Qual. Atmos. Hlth., 6, 473–486, https://doi.org/10.1007/s11869-012-0185-4, 2013.
Lai, L. W. and Cheng, W. L.: Air quality influenced by urban heat island coupled with synoptic weather patterns, Sci. Total Environ., 407, 2724–2733, https://doi.org/10.1016/j.scitotenv.2008.12.002, 2009.
Landry, J. S., Neilson, E. T., Kurz, W. A., and Percy, K. E.: The impact of tropospheric ozone on landscape-level merchantable biomass and ecosystem carbon in Canadian forests, Eur. J. Forest Res., 132, 71–81, https://doi.org/10.1007/s10342-012-0656-z, 2013.
Li, H., Wang, D., Cui, L., Gao,Y., Huo, J., Wang, X., Zhang, Z., Tan, Y., Huang, Y., Cao, J., Chow, J. C., Lee, S.-C., and Fu, Q.: Characteristics of atmospheric PM2.5 composition during the implementation of stringent pollution control measures in shanghai for the 2016 G20 summit, Sci. Total Environ., 648, 1121–1129, 2019.
Li, J., Nagashima, T., Kong, L., Ge, B., Yamaji, K., Fu, J. S., Wang, X., Fan, Q., Itahashi, S., Lee, H.-J., Kim, C.-H., Lin, C.-Y., Zhang, M., Tao, Z., Kajino, M., Liao, H., Li, M., Woo, J.-H., Kurokawa, J., Wang, Z., Wu, Q., Akimoto, H., Carmichael, G. R., and Wang, Z.: Model evaluation and intercomparison of surface-level ozone and relevant species in East Asia in the context of MICS-Asia Phase III – Part 1: Overview, Atmos. Chem. Phys., 19, 12993–13015, https://doi.org/10.5194/acp-19-12993-2019, 2019.
Li, K., Chen, L., Ying, F., White, S. J., Jang, C., Wu, X., Gao, X., Hong, S., Shen, J., Azzi, M., and Cen, K.: Meteorological and chemical impacts on ozone formation: A case study in Hangzhou, China, Atmos. Res., 196, 40–52, 2017.
Li, L., Chen, C. H., Fu, J. S., Huang, C., Streets, D. G., Huang, H. Y., Zhang, G. F., Wang, Y. J., Jang, C. J., Wang, H. L., Chen, Y. R., and Fu, J. M.: Air quality and emissions in the Yangtze River Delta, China, Atmos. Chem. Phys., 11, 1621–1639, https://doi.org/10.5194/acp-11-1621-2011, 2011.
Li, M., Zhang, Q., Kurokawa, J.-I., Woo, J.-H., He, K., Lu, Z., Ohara, T., Song, Y., Streets, D. G., Carmichael, G. R., Cheng, Y., Hong, C., Huo, H., Jiang, X., Kang, S., Liu, F., Su, H., and Zheng, B.: MIX: a mosaic Asian anthropogenic emission inventory under the international collaboration framework of the MICS-Asia and HTAP, Atmos. Chem. Phys., 17, 935–963, https://doi.org/10.5194/acp-17-935-2017, 2017.
Lin, M., Fiore, A. M., Cooper, O. R., Horowitz, L. W., Langford, A. O., Levy, H., Johnson, B. J., Naik, V., Oltmans, S. J., and Senff, C. J.: Springtime high surface ozone events over the western United States: Quantifying the role of stratospheric intrusions, J. Geophys. Res., 117, D00V22, https://doi.org/10.1029/2012JD018151, 2012.
Lin, M., Fiore, A. M., Horowitz, L. W., Langford, A. O., Oltmans, S. J., Tarasick, D., and Rieder, H. E.: Climate variability modulates western US ozone air quality in spring via deep stratospheric intrusions, Nat. Commun., 6, 7105, https://doi.org/10.1038/ncomms8105, 2015.
Liu, H., Ma, W., Qian, J., Cai, J., Ye, X., Li, J., and Wang, X.: Effect of urbanization on the urban meteorology and air pollution in Hangzhou, J. Meteorol. Res., 29, 950–965, 2015.
Liu, Y., Li, L., An, J., Huang, L., Yan, R., Huang, C., Wang, H., Wang, Q., Wang, M., and Zhang, W.: Estimation of biogenic VOC emissions and its impact on ozone formation over the Yangtze River Delta region, China, Atmos. Environ., 186, 113–128, https://doi.org/10.1016/j.atmosenv.2018.05.027, 2018.
McNally, D.: 12 km MM5 performance goals, presentation to the Ad-hov Meteorology Group, Alpine Geophysics, LLC, Arvada, CO, USA, 2009.
Nagashima, T., Sudo, K., Akimoto, H., Kurokawa, J., and Ohara, T.: Long-term change in the source contribution to surface ozone over Japan, Atmos. Chem. Phys., 17, 8231–8246, https://doi.org/10.5194/acp-17-8231-2017, 2017.
Ni, Z. Z., Luo, K., Zhang, J. X., Feng, R., Zheng, H. X., Zhu, H. R., Wang, J. F., Fan, J. R., Gao, X., and Cen, K. F.: Assessment of winter air pollution episodes using long-range transport modeling in Hangzhou, Environ. Pollut., 236, 550–561, 2018.
Ni, Z. Z., Luo, K., Gao, X., Gao, Y., Fan, J. R., Fu, J. S., and Cen, C.: Exploring the stratospheric source of ozone pollution over China during the 2016 Group of Twenty summit, Atmos. Pollut. Res., 10, 1267–1275, https://doi.org/10.1016/j.apr.2019.02.010, 2019.
Paoletti, E., De Marco, A., Beddows, D. C. S., Harrison, R. M., and Manning, W. J.: Ozone levels in European and USA cities are increasing more than at rural sites, while peak values are decreasing, Environ. Pollut., 192, 295–299, https://doi.org/10.1016/j.envpol.2014.04.040, 2014.
Shi, C., Wang, S., Liu, R., Zhou, R., Li, D., Wang, W., Li, Z., Cheng, T., and Zhou, B.: A study of aerosol optical properties during ozone pollution episodes in 2013 over Shanghai, China, Atmos. Res., 153, 235–249, https://doi.org/10.1016/j.atmosres.2014.09.002, 2015.
Shu, L., Xie, M., Wang, T., Gao, D., Chen, P., Han, Y., Li, S., Zhuang, B., and Li, M.: Integrated studies of a regional ozone pollution synthetically affected by subtropical high and typhoon system in the Yangtze River Delta region, China, Atmos. Chem. Phys., 16, 15801–15819, https://doi.org/10.5194/acp-16-15801-2016, 2016.
Sillman, S.: The relation between ozone, NOx and hydrocarbons in urban and polluted rural environments, Atmos. Environ., 33, 1821–1845, https://doi.org/10.1016/S1352-2310(98)00345-8, 1999.
Stauffer, D. R., Seaman, N. L., and Binkowski, F. S.: Use of Four-Dimensional Data Assimilation in a Limited-Area Mesoscale Model Part II: Effects of Data Assimilation within the Planetary Boundary Layer, Mon. Weather Rev., https://doi.org/10.1175/1520-0493(1991)119<0734:UOFDDA>2.0.CO;2, 1991.
Su, W., Liu, C., Hu, Q., Fan, G., Xie, Z., Huang, X., Zhang, T., Chen, Z., Dong, Y., Ji, X., Liu, H., Wang, Z., and Liu, J.: Characterization of ozone in the lower troposphere during the 2016 G20 conference in Hangzhou, Scientific Reports, 7, 17368, https://doi.org/10.1038/s41598-017-17646-x, 2017.
Tang, G., Li, X., Wang, Y., Xin, J., and Ren, X.: Surface ozone trend details and interpretations in Beijing, 2001–2006, Atmos. Chem. Phys., 9, 8813–8823, https://doi.org/10.5194/acp-9-8813-2009, 2009.
Tang, G., Wang, Y., Li, X., Ji, D., Hsu, S., and Gao, X.: Spatial-temporal variations in surface ozone in Northern China as observed during 2009–2010 and possible implications for future air quality control strategies, Atmos. Chem. Phys., 12, 2757–2776, https://doi.org/10.5194/acp-12-2757-2012, 2012.
Tang, G., Zhu, X., Xin, J., Hu, B., Song, T., Sun, Y., Wang, L., Cheng, M., Li, X., Wang, Y., Zhang, J., Chao, N., Kong, L., and Li, X.: Modelling study of boundary-layer ozone over northern China – Part I: Ozone budget in summer, Atmos. Res., 187, 128–137, https://doi.org/10.1016/j.atmosres.2016.10.017, 2017.
Teixeira, E., Fischer, G., van Velthuizen, H., van Dingenen, R., Dentener, F., Mills, G., Walter, C., and Ewert, F.: Limited potential of crop management for mitigating surface ozone impacts on global food supply, Atmos. Environ., 45, 2569–2576, https://doi.org/10.1016/j.atmosenv.2011.02.002, 2011.
Tie, X., Geng, F., Guenther, A., Cao, J., Greenberg, J., Zhang, R., Apel, E., Li, G., Weinheimer, A., Chen, J., and Cai, C.: Megacity impacts on regional ozone formation: observations and WRF-Chem modeling for the MIRAGE-Shanghai field campaign, Atmos. Chem. Phys., 13, 5655–5669, https://doi.org/10.5194/acp-13-5655-2013, 2013.
US EPA: Guidance on the Use of Models and Other Analyses for Demonstrating Attainment of Air Quality Goals for Ozone, PM2.5 and Regional Haze, EPA-454/B-07-002, US EPA, NC, USA, 2007.
von Schneidemesser, E., Coates, J., Denier van der Gon, H. A. C., Visschedijk, A. J. H., and Butler, T. M.: Variation of the NMVOC speciation in the solvent sector and the sensitivity of modelled tropospheric ozone, Atmos. Environ., 135, 59–72, https://doi.org/10.1016/j.atmosenv.2016.03.057, 2016.
Wang, S., Xing, J., Chatani, S., Hao, J., Klimont, Z., Cofala, J., and Amann, M.: Verification of anthropogenic emissions of China by satellite and ground observations, Atmos. Environ., 45, 6347–6358, https://doi.org/10.1016/j.atmosenv.2011.08.054, 2011.
Wang, T., Xue, L., Brimblecombe, P., Lam, Y. F., Li, L., and Zhang, L.: Ozone pollution in China: A review of concentrations, meteorological influences, chemical precursors, and effects, Sci. Total Environ., 575, 1582–1596, https://doi.org/10.1016/j.scitotenv.2016.10.081, 2017.
Wang, T. J., Lam, K. S., Xie, M., Wang, X. M., Carmichael, G., and Li, Y. S.: Integrated studies of a photochemical smog episode in Hong Kong and regional transport in the Pearl River Delta of China, Tellus B, 58, 31–40, https://doi.org/10.1111/j.1600-0889.2005.00172.x, 2006.
Wang, Y., Hu, B., Tang, G., Ji, D., Zhang, H., Bai, J., Wang, X., and Wang, Y.: Characteristics of ozone and its precursors in Northern China: A comparative study of three sites, Atmos. Res., 132–133, 450–459, https://doi.org/10.1016/j.atmosres.2013.04.005, 2013.
Wang, Y. H., Hu, B., Ji, D. S., Liu, Z. R., Tang, G. Q., Xin, J. Y., Zhang, H. X., Song, T., Wang, L. L., Gao, W. K., Wang, X. K., and Wang, Y. S.: Ozone weekend effects in the Beijing–Tianjin–Hebei metropolitan area, China, Atmos. Chem. Phys., 14, 2419–2429, https://doi.org/10.5194/acp-14-2419-2014, 2014.
Wu, K., Kang, P., Tie, X., Gu, S., Zhang, X., Wen, X., Kong, L., Wang, S., Chen, Y., Pan, W., and Wang, Z.: Evolution and Assessment of the Atmospheric Composition in Hangzhou and its Surrounding Areas during the G20 Summit, Aerosol Air Qual. Res., 19, 2757–2769, https://doi.org/10.4209/aaqr.2018.12.0481, 2019.
Wu, K., Yang, X., Chen, D., Gu, S., Lu, Y., Jiang, Q., Wang, K., Ou, Y., Qian, Y., Shao, P., and Lu, S.: Estimation of biogenic VOC emissions and their corresponding impact on ozone and secondary organic aerosol formation in China, Atmos. Res., 231, 104656, https://doi.org/10.1016/j.atmosres.2019.104656, 2020.
Wu, L., Shen, J. D., Feng, Y. C., Bi, X. H., Jiao, L., and Liu, S. X.: Source apportionment of particulate matters in different size bins during hazy and non-hazy episodes in Hangzhou City, Research of Environmental Sciences, 27, 373–381, 2014.
Xie, M., Zhu, K., Wang, T., Yang, H., Zhuang, B., Li, S., Li, M., Zhu, X., and Ouyang, Y.: Application of photochemical indicators to evaluate ozone nonlinear chemistry and pollution control countermeasure in China, Atmos. Environ., 99, 466–473, https://doi.org/10.1016/j.atmosenv.2014.10.013, 2014.
Xue, L. K., Wang, T., Gao, J., Ding, A. J., Zhou, X. H., Blake, D. R., Wang, X. F., Saunders, S. M., Fan, S. J., Zuo, H. C., Zhang, Q. Z., and Wang, W. X.: Ground-level ozone in four Chinese cities: precursors, regional transport and heterogeneous processes, Atmos. Chem. Phys., 14, 13175–13188, https://doi.org/10.5194/acp-14-13175-2014, 2014.
Yan, R. S., Li, L., An, J. Y., Lu, Q., Wang, S., Zhu, Y., Jang, C. J., and Fu, J. S.: Establishment and application of nonlinear response surface model of ozone in the Yangtze river delta region during summertime, Acta Scientiae Circumstantiae, 36, 1383–1392, 2016.
Yu, H., Dai, W., Ren, L., Liu, D., Yan, X., Xiao, H., He, J., and Xu, H.: The Effect of Emission Control on the Submicron Particulate Matter Size Distribution in Hangzhou during the 2016 G20 Summit, Aerosol Air Qual. Res., 18, 2038–2046, https://doi.org/10.4209/aaqr.2018.01.0014, 2018.
Zaveri, R. A. and Peters, L. K.: A new lumped structure photochemical mechanism for large-scale applications, J. Geophys. Res., 104, 30387–30415, 1999.
Zhang, B. N. and Kim Oanh, N. T.: Photochemical smog pollution in the Bangkok Metropolitan Region of Thailand in relation to O3 precursor concentrations and meteorological conditions, Atmos. Environ., 36, 4211–4222, https://doi.org/10.1016/S1352-2310(02)00348-5, 2002.
Zhang, G., Xu, H., Qi, B., Du, R., Gui, K., Wang, H., Jiang, W., Liang, L., and Xu, W.: Characterization of atmospheric trace gases and particulate matter in Hangzhou, China, Atmos. Chem. Phys., 18, 1705–1728, https://doi.org/10.5194/acp-18-1705-2018, 2018.
Zhang, H., Chen, G., Hu, J., Chen, S. H., Wiedinmyer, C., Kleeman, M., and Ying, Q.: Evaluation of a seven-year air quality simulation using the Weather Research and Forecasting (WRF)/Community Multiscale Air Quality (CMAQ) models in the eastern United States, Sci. Total Environ., 473–474, 275–285, https://doi.org/10.1016/j.scitotenv.2013.11.121, 2014.
Zheng, S., Xu, X., Zhang, Y., Wang, L., Yang, Y., Jin, S., and Yang, X.: Characteristics and sources of VOCs in urban and suburban environments in Shanghai, China, during the 2016 G20 summit, Atmos. Pollut. Res., 10, 1766–1779, 2019.


