the Creative Commons Attribution 4.0 License.
the Creative Commons Attribution 4.0 License.
 | 18 May 2020
Integrated impacts of synoptic forcing and aerosol radiative effect on boundary layer and pollution in the Beijing–Tianjin–Hebei region, China
Yucong Miao
Xiaoye Zhang
Shuhua Liu
Rapid urbanization and industrialization have led to deterioration of air quality in the Beijing–Tianjin–Hebei (BTH) region due to high loadings of PM2.5. Heavy aerosol pollution frequently occurs in winter, in close relation to the planetary boundary layer (PBL) meteorology. To unravel the physical processes that influence PBL structure and aerosol pollution in BTH, this study combined long-term observational data analyses, synoptic pattern classification, and meteorology–chemistry coupled simulations. During the winter of 2017 and 2018, Beijing and Tangshan often experienced heavy PM2.5 pollution simultaneously, accompanied by strong thermal inversion aloft. These concurrences of pollution in different cities were primarily regulated by the large-scale synoptic conditions. Using principal component analysis with geopotential height fields at the 850 hPa level during winter, two typical synoptic patterns associated with heavy pollution in BTH were identified. One pattern is characterized by a southeast-to-north pressure gradient across BTH, and the other is associated with high pressure in eastern China. Both synoptic types feature warmer air temperature at 1000 m a.g.l., which could suppress the development of the PBL. Under these unfavorable synoptic conditions, aerosols can modulate PBL structure through the radiative effect, which was examined using numerical simulations. The aerosol radiative effect can significantly lower the daytime boundary layer height through cooling the surface layer and heating the upper part of the PBL, leading to the deterioration of air quality. This PBL–aerosol feedback is sensitive to the aerosol vertical structure, which is more effective when the synoptic pattern can distribute more aerosols to the upper PBL.
- Article
(4538 KB) - Full-text XML
-
Supplement
(805 KB) - BibTeX
- EndNote


The Beijing–Tianjin–Hebei (BTH) region is the national capital region of China and covers an area of ∼217 156 km2 on the North China Plain. During the last few decades, BTH has experienced prosperous economic growth and intensive urban expansion and has become one of most developed and populous regions in China. Along with the tremendous development, pollution events with massive amounts of PM2.5 (airborne particles with aerodynamic diameter less than 2.5 µm) frequently occur in BTH, due primarily to high emissions of pollutants (Cheng et al., 2016; Geng et al., 2017; Zhang et al., 2013).
The fate of emitted pollutants is largely governed by the planetary boundary layer (PBL) (Garratt, 1994; Miao and Liu, 2019; Oke, 2002; Stull, 1988), which is the region of the lower troposphere and strongly influences the vertical exchanges of heat, moisture, and matter between the surface and free troposphere (Baklanov et al., 2011; Miao et al., 2019a; Stull, 1988). In the vertical dimension, the intensity of thermal buoyancy is controlled by the thermal stratification and the strength of mechanical turbulence is determined by the surface roughness and the PBL wind. Together these thermal and mechanical PBL processes determine the vertical dispersion and dilution of pollutants and the air replacement from upper levels (Miao et al., 2019a; Oke, 2002; Stull, 1988). Thereby, the depth of the PBL, also known as the boundary layer height (BLH), has been extensively utilized to characterize the atmospheric environmental capacity and the dilution volume of pollutants (Stull, 1988; Seidel et al., 2010; Hu et al., 2014; Miao et al., 2015).

Figure 1(a) Map of terrain height in the simulation domain; the approximate location of the Beijing–Tianjin–Hebei (BTH) region is denoted by the black rectangle. (b) The locations of surface meteorological stations and air quality monitoring stations in Beijing (BJ) and Tangshan (TS) are marked by the black dots and the red crosses, respectively. The sounding sites are denoted by the green triangles.
Through observational experiments and numerical simulations, the connections between PBL characteristics and aerosol pollution in BTH have been investigated (e.g., Miao et al., 2019b; Quan et al., 2013; H. Wang et al., 2018; Ye et al., 2016; Zhong et al., 2017, 2018). The heavy PM2.5 pollution events in BTH typically occur under stagnant situations with shallow PBL (Ye et al., 2016; Zhong et al., 2017, 2018). On a seasonal basis, the heaviest aerosol pollution in BTH occurs in winter, which is not only ascribed to the seasonal changes in emissions and precipitation but also the shifts in the BLH (Miao et al., 2015, 2018b). With mountains and seas surrounding it (Fig. 1), the PBL process, structure, and pollution level in BTH are usually impacted by the geographical forcings (Chen et al., 2009; Hu et al., 2014, 2016; Miao et al., 2015, 2016, 2017b). Due to the blocking effects of mountains, the momentum exchanging processes between the PBL and the upper free troposphere could be repressed dynamically (Miao et al., 2018; X. Wang et al., 2018). Moreover, the local thermal gradient between the mountains and plains or land and sea can bring on closed circulation systems and modify the near-surface winds and thermal inversion intensity, leading to the recirculation and accumulation of pollutants (Chen et al., 2009; Miao et al., 2015, 2017b, 2019a).
In addition to these local-scale surface factors and processes (e.g., friction, thermally induced wind systems, heat fluxes), the large-scale synoptic pattern (e.g., transient systems, thermal advection) plays a role in supplying the foremost driving for the day-to-day variations in BLH and pollution (Hu et al., 2014; Miao et al., 2019b; Stull, 1988; Zhang et al., 2016). Based on the 850 hPa geopotential height (GH) data from 1980 to 2013, Zhang et al. (2016) elucidated the potential linkages between East Asian Monsoon, synoptic condition, and air pollution in the North China Plain. They found that the stagnant weather condition with southerly and westerly winds would worsen the air quality in the North China Plain, and the occurrence of stagnant conditions was relevant to the inter-annual and inter-decadal variability of monsoon. The regional transport of pollutants induced by the large-scale synoptic condition is critical to the air quality (Zhang et al., 2019). Although previous studies have recognized the importance of synoptic pattern and PBL meteorology for the aerosol pollution in BTH, most of them focused on the short-term episodes or a specific city (e.g., Miao et al., 2019b; Quan et al., 2013; Tie et al., 2015; Wang et al., 2019; Zhong et al., 2017). More investigations are warranted concerning (1) the typical synoptic patterns and (2) their impacts on the PBL characteristics and vertical distribution of aerosols in BTH. These aspects are yet to be clearly known, partly due to the absence of continuous PBL observations. In this study, the link among synoptic condition, PBL structure, and aerosol pollution in BTH will be examined using long-term radiosonde measurements collected in Beijing and Tangshan (Fig. 1b): one close to the mountains and the other adjacent to the Bohai Sea.
On the other hand, during the heavy pollution events, the light-absorbing aerosols can cause the upper layer of the PBL to be relatively warm (Ding et al., 2016), and the massive aerosols can intensify the PBL stability through scattering the solar radiation, which can lower the BLH and deteriorate the pollution (Miao et al., 2019a; Quan et al., 2013; Sun et al., 2019; Wang et al., 2019; Zhong et al., 2017, 2018). For instance, the unfavorable PBL meteorology and the feedback of aerosol were together found to be responsible for ∼84 % of the explosive growth of PM2.5 concentration in Beijing during December 2016 (Zhong et al., 2017). The radiative effect of black carbon on PBL is quite sensitive to the vertical distribution of aerosols, which is also modulated by the synoptic pattern (Z. Wang et al., 2018). Considering that the large-scale synoptic forcing is the first-order meteorological driving factor for the pollution formation and dissipation, it would be necessary to examine the impacts of aerosol radiative effect on BLH on the basis of synoptic analyses. Thus, this study will objectively classify the synoptic patterns over BTH during the winter of 2017 to 2018 and will then evaluate the integrated impacts of aerosol radiative effect on PBL structure under typical synoptic conditions using the meteorology–chemistry coupled simulations. The combination of large-scale synoptic analyses and numerical simulations allows us to understand the complicated meteorology–aerosol interaction in BTH within an integrated framework.
2.1 Data and synoptic classification
The aerosol pollution levels in BTH are indicated by the hourly measurements of PM2.5 mass concentration from 2017 to 2018 in Beijing and Tangshan (Fig. 1b). For each studied city, there are three PM2.5 monitoring sites (illustrated by red crosses in Fig. 1b) carried out by the China National Environmental Monitoring Center (CNEMC). Aside from this, the radiosonde measurements in Beijing and Tangshan were collected to elucidate the complex associations between PBL meteorology and aerosol pollution. The sounding stations (illustrated by green triangles in Fig. 1b) are equipped with the L-band radiosonde system (Miao and Liu, 2019), which can provide the vertical profiles of pressure, moisture, air temperature, and wind with a fine resolution (∼10 m). The sounding balloons are conventionally launched at 08:00 and 20:00 Beijing time (BJT) each day. In addition, the surface meteorological observations (illustrated by black dots in Fig. 1b) were also obtained.

Figure 2Time series of observed PM2.5 concentration from 1 November to 31 December in 2017 in (a) Beijing and Tangshan. (b, c) Vertical structure of potential temperature (PT) derived from the sounding data at 20:00 BJT. Four heavy pollution episodes with maximum daily PM2.5 concentrations greater than 100 µg m−3 in both Beijing and Tangshan are marked by the grey shading in Fig. 2a.
To unravel the predominant synoptic conditions related to the heavy aerosol pollution in BTH, the 850 hPa geopotential height (GH) fields were analyzed, which were extracted from the National Centers for Environmental Prediction (NCEP) global Final (FNL) reanalysis. The studied region was centered over BTH, covering an area of 29–49∘ N in latitude and 106–126∘ E in longitude (Fig. 1a); this is also the region used in the meteorology–chemical coupled simulations. Using T-mode principal component analysis (T-PCA) (Huth, 1996; Miao et al., 2017a; Philipp et al., 2014), the dominant synoptic patterns in BTH were objectively classified. T-PCA has been widely applied to analyze regional air pollution from the synoptic perspective and has been demonstrated to be a dependable approach to ravel out the influences of large-scale atmospheric forcing (e.g., Miao et al., 2017a; Stefan et al., 2010; Zhang et al., 2012). Considering that the heavy PM2.5 pollution events primarily occurred during winter (Miao et al., 2018), the daily GH fields in the winter months (January, February, November, December) of 2017 and 2018 were classified in this study. In total, 240 daily GH fields were classified.

Figure 3The 850 hPa geopotential height (GH) fields and wind vector fields for the seven classified patterns. The occurrence frequency of each synoptic pattern is also given.
2.2 Meteorology–chemistry coupled simulations
After identifying the typical polluted synoptic pattern, a typical pollution episode that occurred from 26 to 31 December in 2017 was selected and simulated using the Weather Research and Forecasting model coupled with Chemistry (WRF-Chem) (Grell et al., 2005). The model domain was centered over BTH and covered most of mainland China with a horizontal resolution of 17.5 km (Fig. 1a). The model top was set to the 10 hPa level, and 33 vertical layers were configured below the top. To resolve the PBL structure, 15 vertical layers were set below 2 km a.g.l. For the simulation of chemical processes, the RADM2-MADE/SORGAM chemical mechanism (Ackermann et al., 1998; Schell et al., 2001; Stockwell et al., 1990) was used with the Multi-resolution Emission Inventory for China (MEIC) of 2016, which is the most updated and extensively utilized anthropogenic emission data. The physics parameterization schemes used in this work included the Noah land surface scheme (Chen and Dudhia, 2001), the Mellor–Yamada PBL scheme (Nakanishi and Niino, 2006), the WRF Single-Moment 5 class (WSM5) scheme (Hong et al., 2004), the Betts–Miller–Janjić cumulus scheme (Janjić, 1994), and the updated rapid radiation scheme considering the aerosol radiative effect (Iacono et al., 2008). The initial and boundary conditions (IBCs) of meteorological parameters were configured using NCEP-FNL reanalysis, and the IBCs of chemical variables were derived from the global model output (http://www.acom.ucar.edu/wrf-chem/mozart.shtml, last access: 5 October 2019).
The simulations using abovementioned configurations are referred to as the BASE runs, and numerical experiments that turned off the aerosol radiative option were conducted to evaluate the impacts of aerosol radiative effect. These sensitivity experiments are regarded as the EXP runs hereafter. According to the common strategy for the Air Quality Model Evaluation International Initiative (AQMEII), the selected pollution episodes were simulated as a sequence of 4 d time slices (Forkel et al., 2015), including Slice 1 (20:00 BJT 24 December to 23:00 BJT 28 December) and Slice 2 (20:00 BJT 27 December to 23:00 BJT 31 December). The first 24 h simulations of each time slice were considered the spin-up period, and the chemical initial state of each time slice is adopted from the final state of the previous time slice if available.
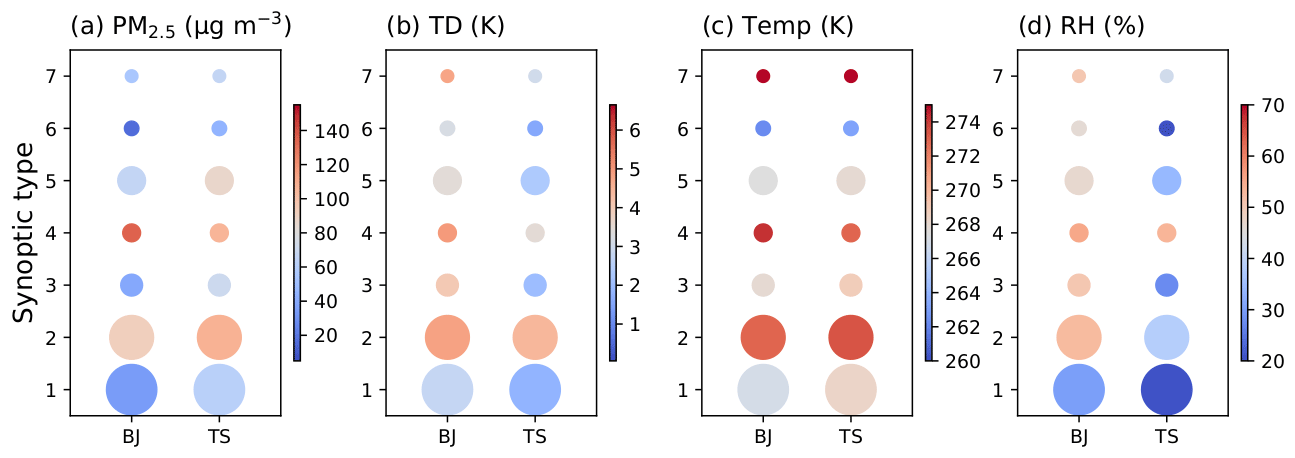
Figure 4(a) Average PM2.5 concentrations under different synoptic conditions in Beijing and Tangshan, associated (b) thermal differences (TDs) in PT between 100 and 1000 m, (c) temperature at 1000 m, and (d) relative humidity (RH) at 200 m. The TD equals PT at 1000 m minus PT at 100 m. The size of the circle represents the occurrence frequency of each synoptic type. All of the meteorological variables shown are derived from the radiosonde data.
3.1 Linkages between synoptic condition, thermal stability and PM2.5 pollution
The time series of daily PM2.5 concentrations in Beijing and Tangshan from 1 November to 31 December in 2017 are shown in Fig. 2a, demonstrating several heavy pollution episodes in BTH. It is worth noting that Beijing and Tangshan often experienced heavy pollution simultaneously. When comparing the observed potential temperature (PT) profiles in Beijing and Tangshan (Fig. 2b–c), it is clear that the quick increase (decrease) of PM2.5 concentrations is usually accompanied by the warming (cooling) of the atmosphere above 1000 m a.g.l. The warming of upper air could also be observed from the vertical profiles of temperature and was often accompanied by high relative humidity within the PBL (Fig. S1 in the Supplement). The concurrence of warming aloft and increased PM2.5 concentration not only occurred from November to December in 2017 but also in other winter months during 2017 and 2018 (Figs. S2–S4). Given that the distance between Beijing and Tangshan is around 150 km, the synchronous change in aerosol concentrations and the concurrence of strong thermal inversion aloft must be relevant to certain large-scale synoptic patterns (Miao et al., 2018). Therefore, it would be necessary to investigate the PM2.5 pollution and its influencing factors from the point of view of the synoptic condition.
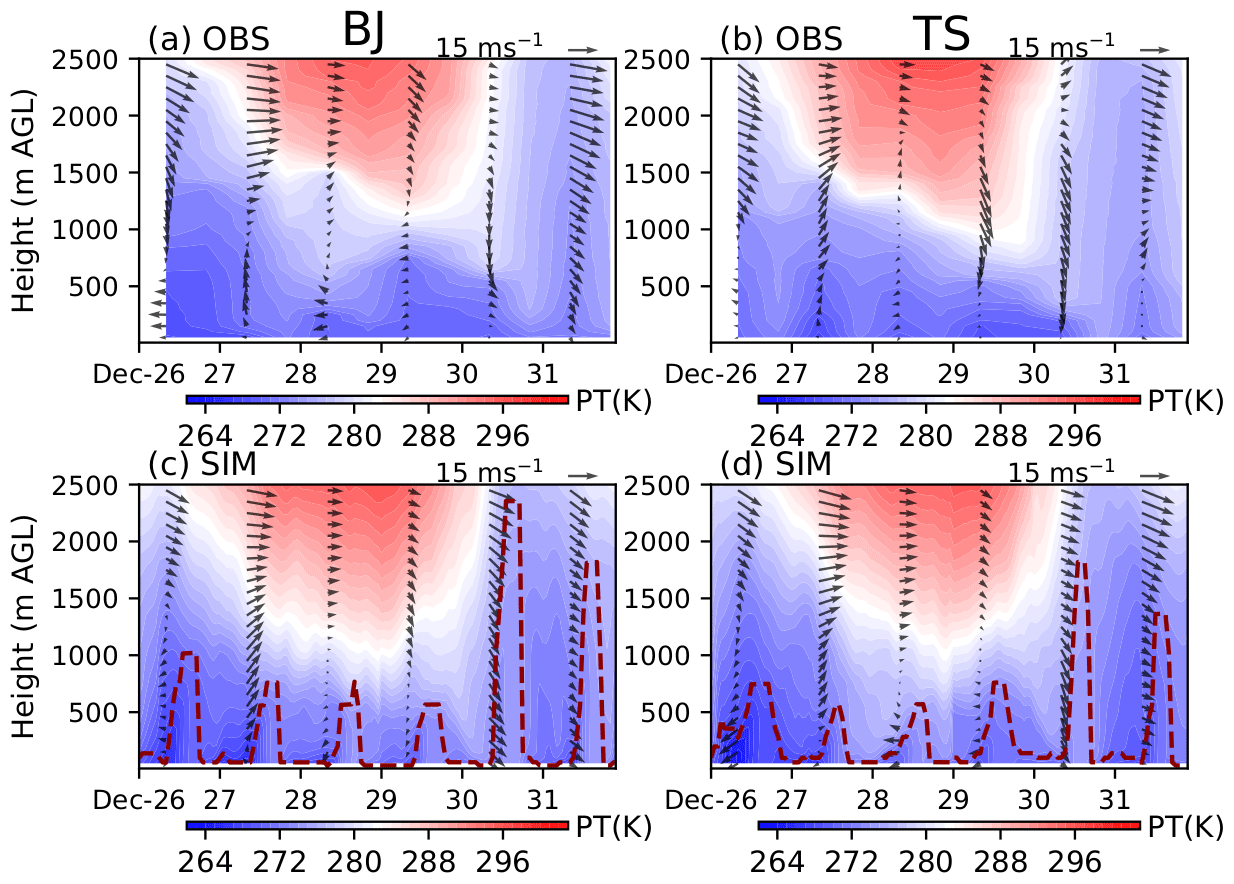
Figure 5Vertical structure of (a, b) observed and (c, d) simulated PT and horizontal winds in Beijing and Tangshan from 26 to 31 December in 2017. The simulated profiles are derived from the BASE run, and the boundary layer height (BLH) is denoted by the dashed red lines in (c, d).
Based on the 850 hPa daily GH fields in winter from 2017 to 2018, the synoptic conditions were classified using T-PCA (Fig. 3). There are two dominant synoptic patterns, i.e., type 1 and type 2, which account for ∼70 % of the total. Synoptic type 1 occurs most frequently (39.6 %). There is a strong southwest-to-northeast pressure gradient across BTH, supporting strong northwesterly prevailing winds at the 850 hPa level (Fig. 3a). The average daily PM2.5 concentrations in Beijing and Tangshan under type 1 are 34 and 62 µg m−3, respectively (Fig. 4a). Under synoptic type 2, which has a southeast-to-north pressure gradient across BTH at the 850 hPa level, it is the westerly winds that are dominant over BTH (Fig. 3b). The occurrence frequency of type 2 is 30 %, ranking second among all the identified synoptic types. The average daily PM2.5 concentrations in Beijing and Tangshan under the type 2 are significantly higher than those under type 1 (Fig. 4a), which are 92 and 108 µg m−3, respectively. Except for these two dominant types, the occurrence rate of the other five synoptic types is 30.4 % in total. Among these five lower-occurrence types, it is worth noting that synoptic type 4 has the highest average PM2.5 concentrations (135 µg m−3 in Beijing and 106 µg m−3 in Tangshan), though its occurrence frequency is merely 5.0 % (Figs. 3d and 4a). Under synoptic type 4, influenced by a high pressure in eastern China at the 850 hPa level (Fig. 3d), the southerly prevailing winds can cause regional transport of pollutants to Beijing and Tangshan (Miao et al., 2017a; Zhang et al., 2019). To understand the connection between synoptic pattern and PBL structure, the thermal stabilities between 100 and 1000 m a.g.l. are compared (Fig. 4b). Stronger thermal stabilities are observed under type 2 and type 4, associated with the warmer air temperature at 1000 m a.g.l. (Fig. 4b–c), suppressing the development of the PBL (Miao et al., 2017a; Hu et al., 2014). Additionally, moister air could be observed within the PBL under these two types (Fig. 4d), favoring the formation of secondary inorganic aerosols (Zhong et al., 2017 and 2018). Thus, among all the identified patterns, synoptic types 2 and 4 are regarded as the representative polluted patterns. In the next section, a pollution episode associated with type 2 and type 4 will be investigated.
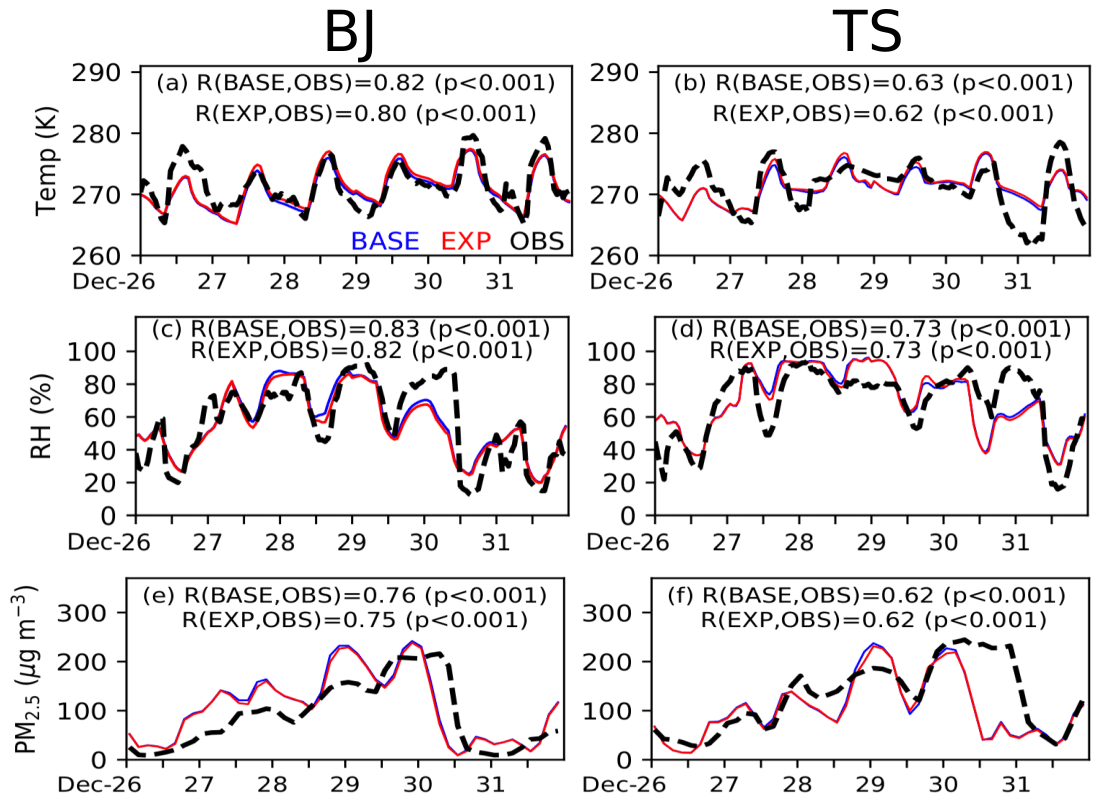
Figure 6Time series of observed and simulated (a, b) 2 m temperature, (c, d) 2 m RH, and (e, f) PM2.5 concentration in (a, c, e) Beijing and (b, d, f) Tangshan from 26 to 31 December in 2017. The simulations of the BASE run are denoted with blue lines, and those of the EXP run are denoted in red lines. The correlation coefficients (R) between the observations and simulations are also given for each panel.
3.2 Integrated impacts of synoptic pattern and aerosol radiative effect during the selected episode
To understand the complicated processes leading to the heavy pollution under synoptic type 2 and type 4, a pollution episode that occurred at the end of 2017 was selected and simulated using WRF-Chem. Figure 5 presents the vertical structure of simulated PT in Beijing and Tangshan during the episode. Comparing the observed PT profiles, the warmings of atmosphere aloft from 27 to 29 December in both Beijing and Tangshan were well simulated, with correlation coefficients of 0.91 (p<0.001) in Beijing and 0.94 (p<0.001) in Tangshan. The changes in wind profile in Beijing and Tangshan were also accurately reproduced, with correlation coefficients greater than 0.64 for both the zonal and meridional winds. In Fig. 6, the simulated near-surface temperature, relative humidity, and PM2.5 concentration are validated against the observations. Although discrepancies exist, the simulated temperature, humidity, and PM2.5 all demonstrate rationally good agreement with the observations. Aside from this, comparing the simulations with an aerosol radiative effect to those without one, the former presents higher PM2.5 concentrations, lower temperatures, and higher humidities, resulting in higher correlation coefficients with observations (Fig. 6). Overall, the good model performances (Figs. 5–6) provide a solid basis to utilize the simulation results to elucidate the physical mechanisms underlying the pollution episode.
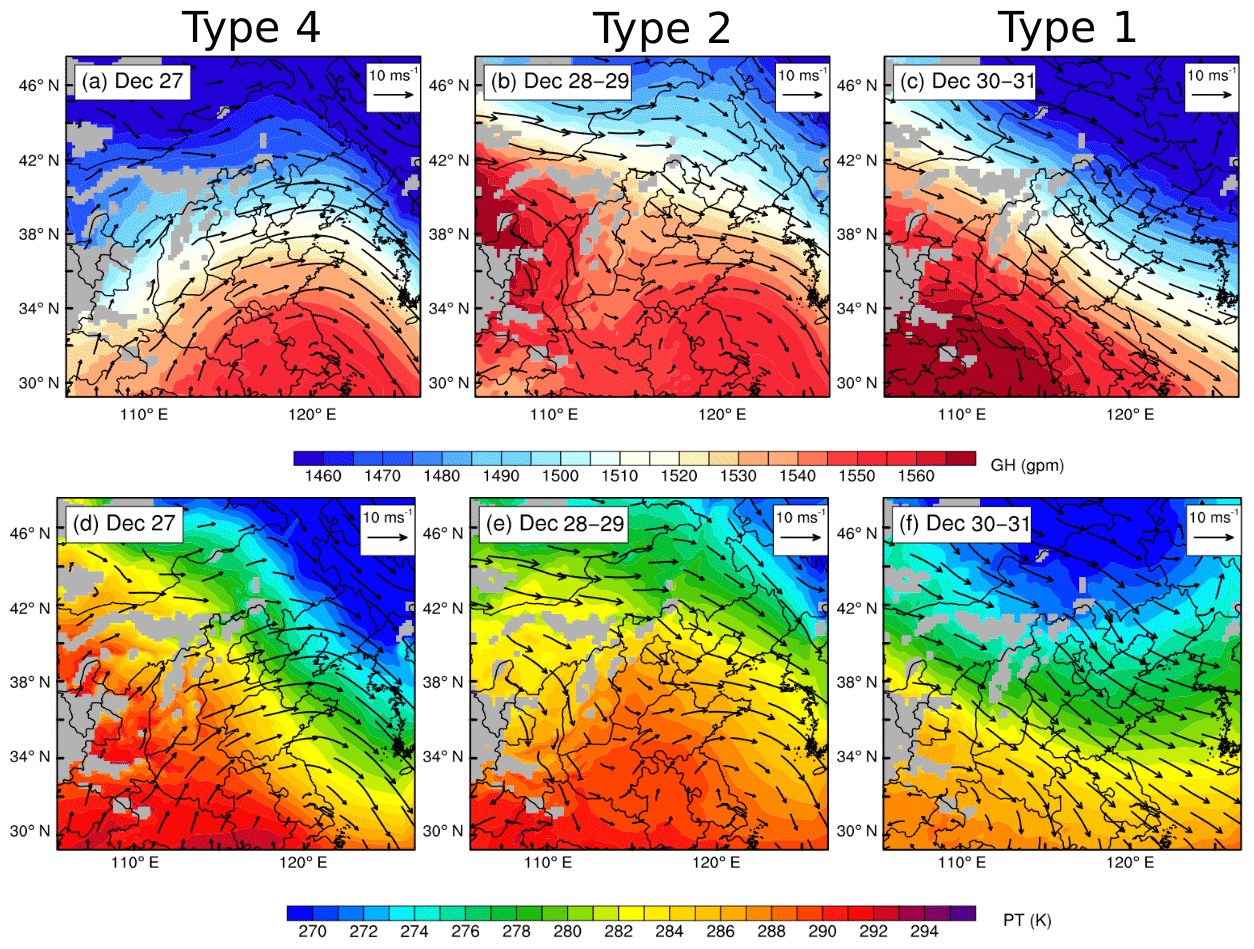
Figure 7Simulated 850 hPa (a–c) GH and (d–f) PT fields on 27, 28–29, and 30–31 December, overlaid with the wind vectors. The regions with terrain higher than the 850 hPa level are marked by the grey shading.
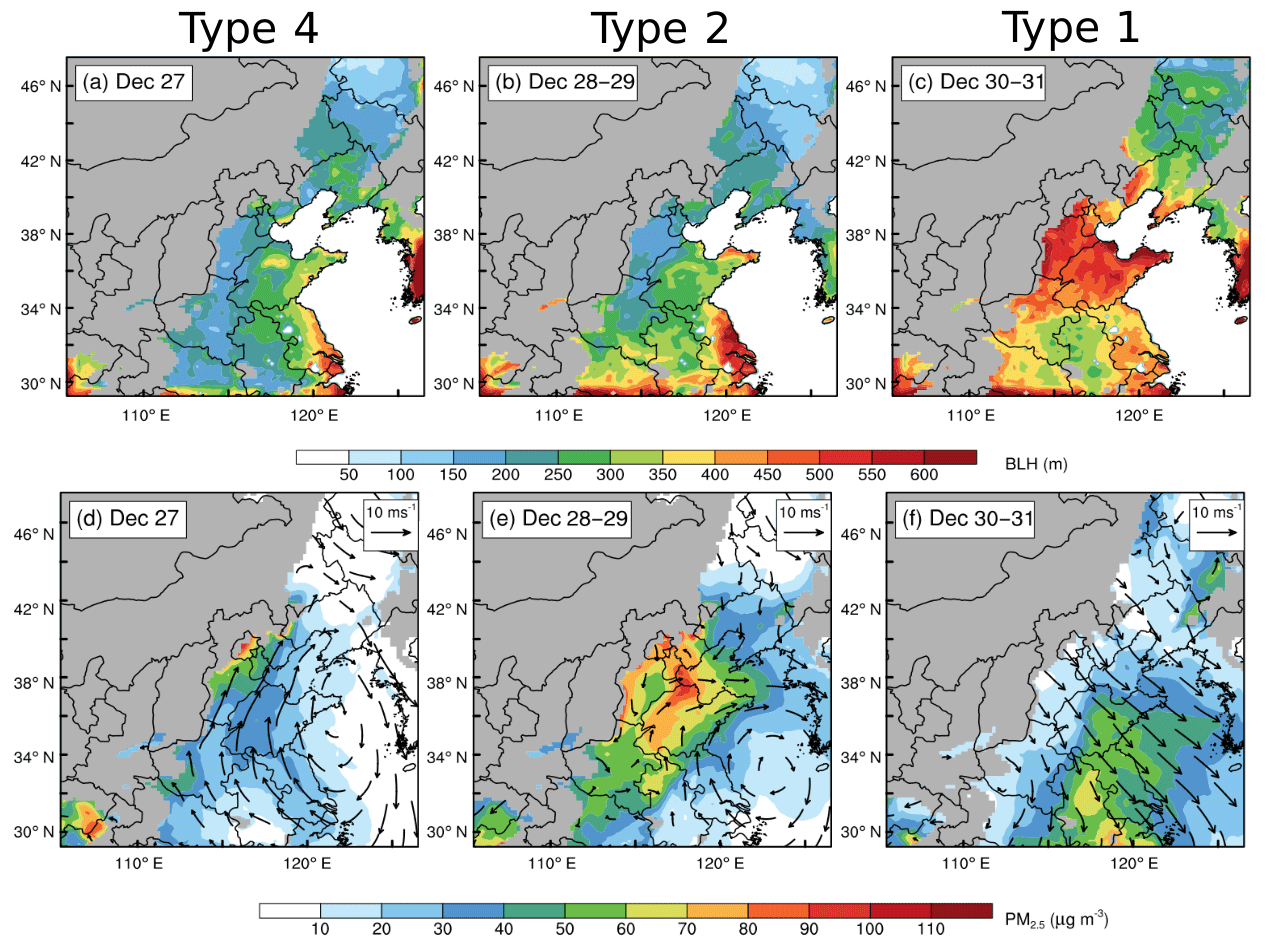
Figure 8Spatial patterns of simulated (a–c) BLH and (d–f) 900 hPa PM2.5 concentration and wind vectors over the plains of BTH from 27 to 31 December in 2017. The mountainous regions are denoted by the grey shading.
Based on the model output, the BLH is estimated as the height where the PT first surpasses the minimum PT below by 1.5 K (Nielsen-Gammon et al., 2008; Seidel et al., 2010). The same BLH derivation method has been widely employed in previous PBL studies (e.g., Hu et al., 2014; Miao and Liu, 2019; Nielsen-Gammon et al., 2008), which can explicitly manifest the influences of thermal stability. Figure 5 shows the time series of simulated BLH in Beijing and Tangshan. The warmings of upper air can suppress the daytime BLH on 27 December under synoptic type 4 and on 28–29 December under synoptic type 2 (Figs. 5 and 7a–b). On 27 December, influenced by the southwesterly winds, the warmer air mass could be brought to BTH (Fig. 7d), enhancing the thermal stability and restraining the growth of the PBL (Fig. 8a). The southwesterly prevailing winds can transport the pollutants emitted from upstream plain regions to BTH and further worsen the air quality (Figs. 8d and 9a). Following this, the synoptic condition transitioned to type 2 on 28–29 December, and the strong thermal inversion and shallow PBL situation in BTH could last until the outbreak of cold advection on 30 December (Figs. 6, 7 and 8). As shown in Fig. 8a–c, the average BLH in BTH was suppressed to less than 250 m under synoptic type 4 and type 2 from 27 to 29 December and then increased to 500 m from 30 to 31 December. As a result, massive aerosols were accumulated in the plains of BTH from 27 to 29 December (Figs. 8e and 9b).
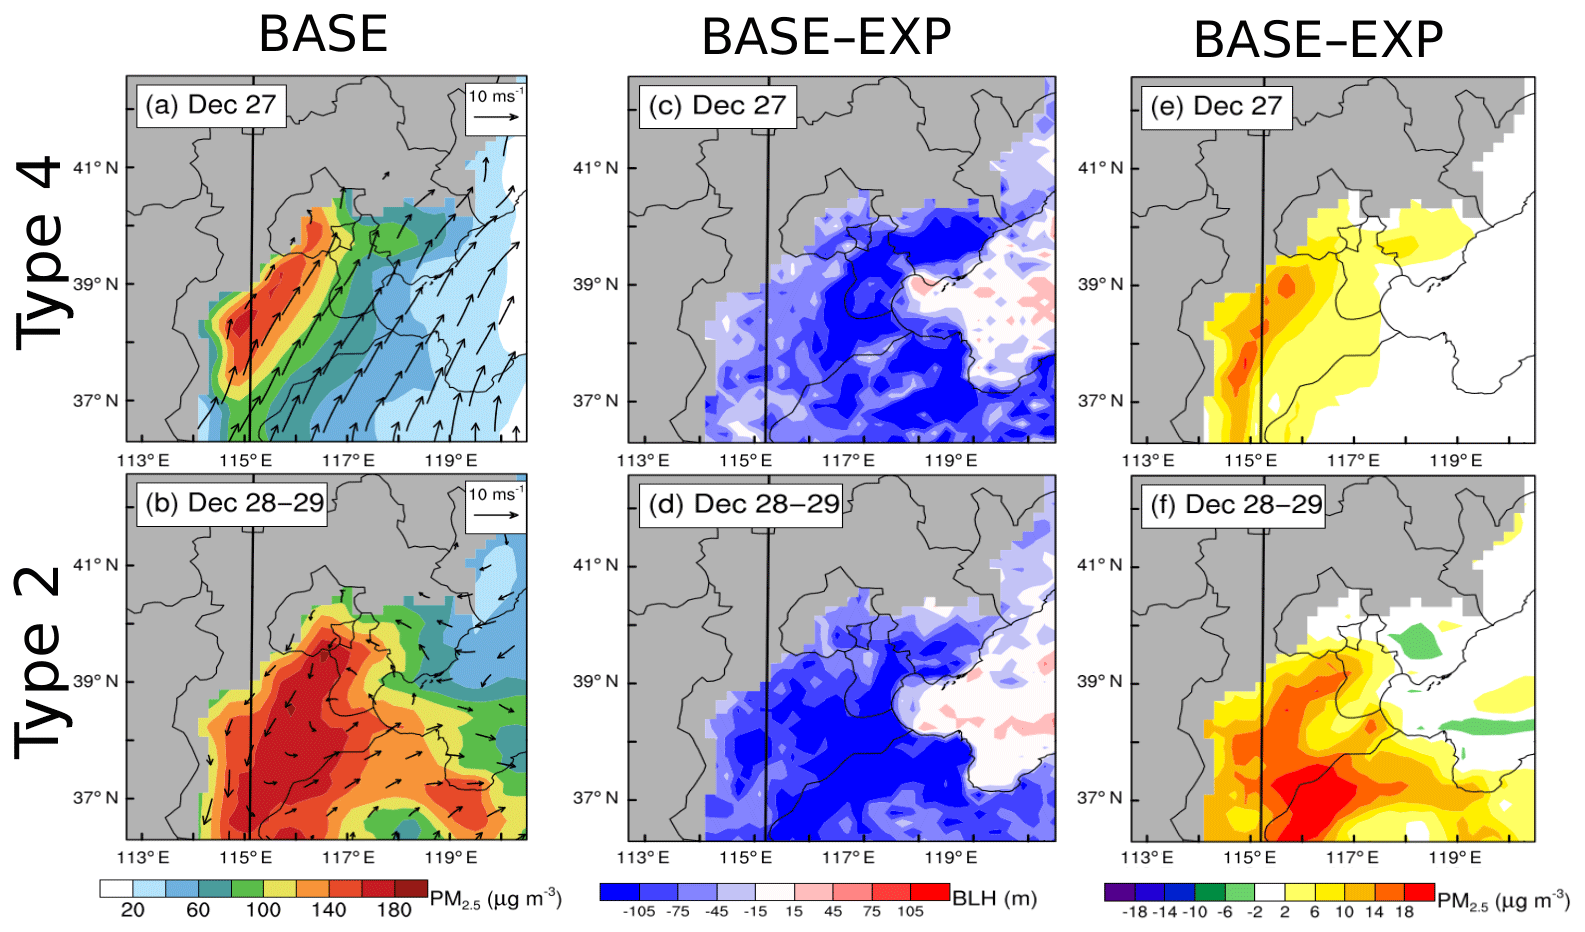
Figure 9Spatial distribution of simulated (a, b) near-surface PM2.5 concentration, wind, and the perturbations induced by the aerosol radiative effect on (c, d) BLH and (e, f) PM2.5 in the plains of BTH from 09:00 to 16:00 BJT on (a, c, e) 27 December and (b, d, f) 28–29 December. The black line in Fig. 9a indicates the locations of vertical sections shown in Fig. 10.
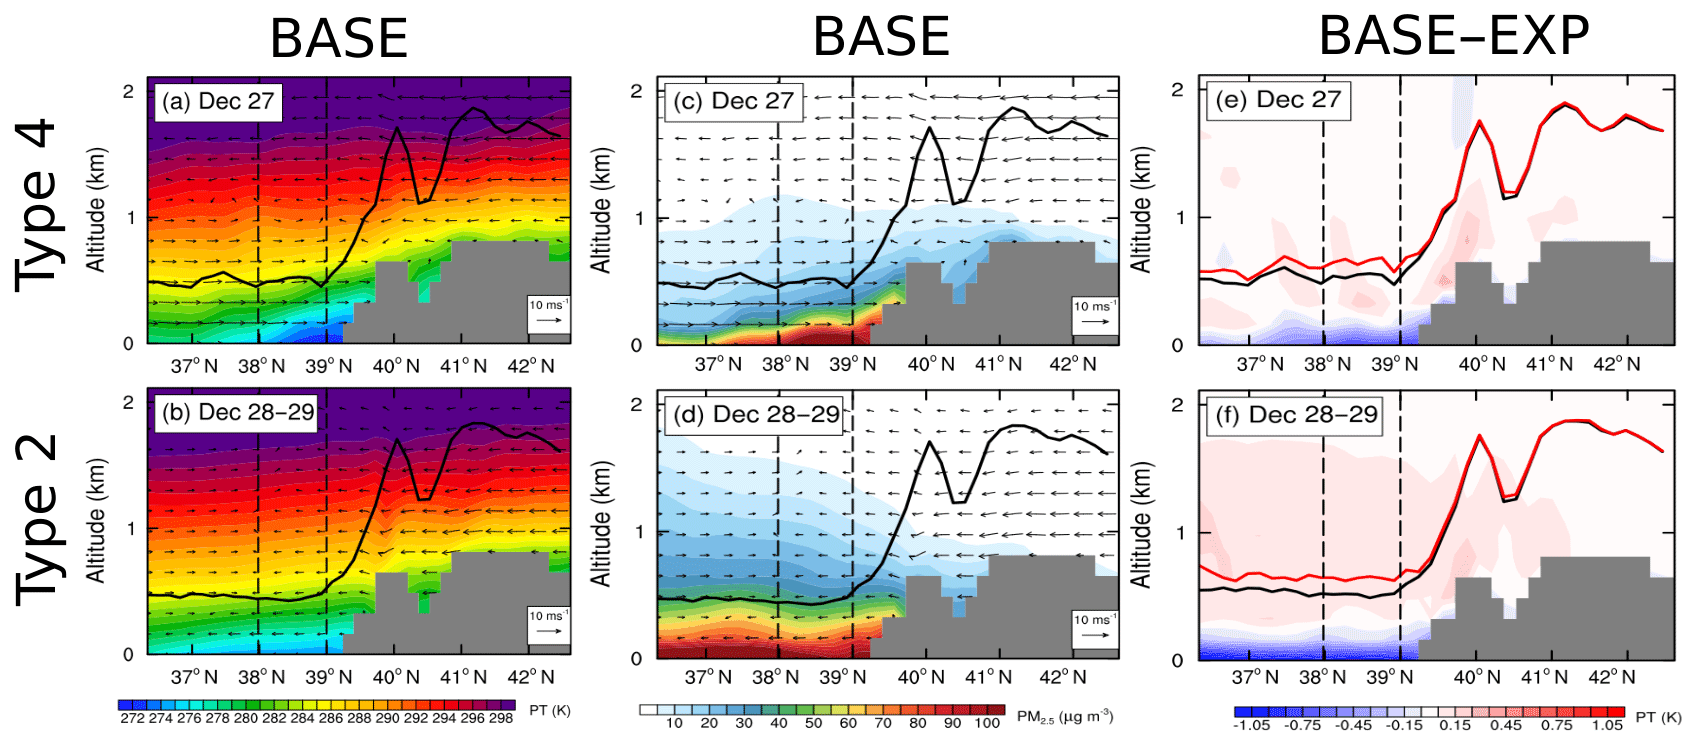
Figure 10Vertical cross sections of simulated (a, b) PT, (c, d) PM2.5 concentration, and (e, f) concentration perturbations induced by the aerosol radiative effect from 09:00 to 16:00 BJT on (a, c, e) 27 December and (b, d, f) 28–29 December . The locations of cross sections are indicated by the black lines in Fig. 9. In (e, f), the BLH of the BASE run is denoted by the black lines and the BLH of the EXP run is denoted by the red lines. Note that the vertical velocity is multiplied by a factor of 10 when plotting the wind vectors. The dashed vertical lines indicate the regions used to derive the profiles of PT and PM2.5 concentration shown in Fig. 11.
During those heavily polluted days, the suspended aerosols may also modify the PBL structure in BTH to some extent (Gao et al., 2015; Z. Wang et al., 2018; Miao et al., 2019a; Zhong et al., 2018). As the aerosols reduce the solar radiation reaching the ground, the development of the PBL could be suppressed, particularly during the daytime. As shown in Fig. 9c–d, the aerosol radiative effect can impose significant negative perturbations on the daytime BLH. On average, the daytime BLH in the plains decreased by 84 m (15 %) on 27 December and 93 m (18 %) on 28–29 December and increased the ground-level PM2.5 concentrations by 4.3 and 9.0 µg m−3, respectively (Fig. 9e–f). The feedback on PM2.5 was more prominent in the regions with higher concentrations, where the ground-level PM2.5 concentration could increase by 20 µg m−3 during the daytime (Fig. 9e–f). Comparing the induced BLH perturbations on 27 December with those on 28–29 December, the decrease in BLH was more significant on 28–29 December, which may be caused by the larger amount of aerosols suspended within the PBL on 28–29 December (Fig. 9a–b).
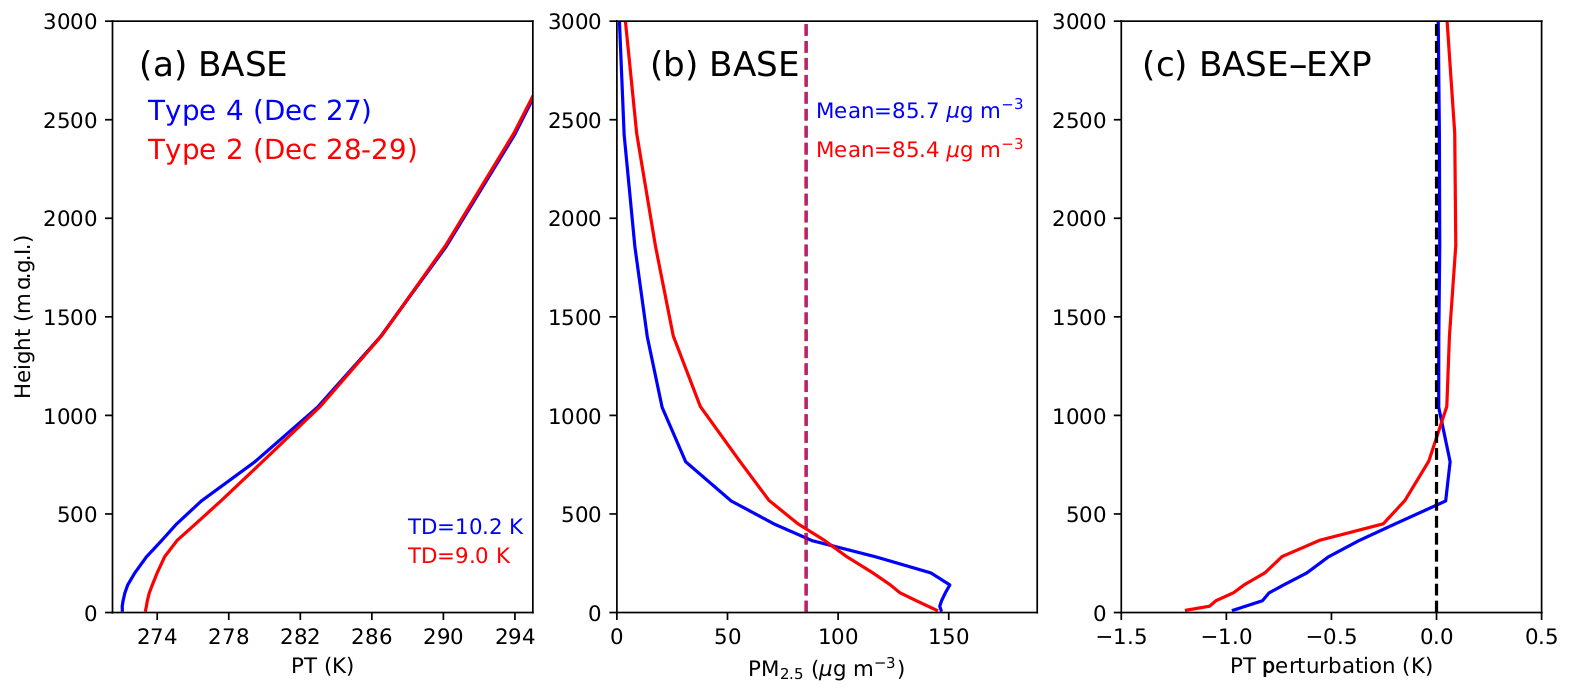
Figure 11Average vertical profiles of simulated (a) PT, (b) PM2.5 concentration, and (c) PT perturbations induced by the aerosol radiative effect from 09:00 to 16:00 BJT on 27 December (in blue) and 28–29 December (in red), derived from the simulations between 38 and 39∘ N along the cross section shown in Fig. 10. In (a) the TD is calculated as the PT difference between 100 and 1000 m. In (b), the dashed lines indicate the mean PM2.5 concentrations below 3000 m a.g.l. on 27 December (in blue) and 28–29 December (in red).
On the other hand, the synoptic condition can also modulate the sensitivity of PBL–aerosol feedback through influencing the vertical distribution of aerosols (Z. Wang et al., 2018). To elucidate the link among synoptic types and aerosol vertical structures, we examined a south-to-north cross section of PT and PM2.5 cutting through the most polluted region in BTH (Fig. 10). Influenced by the southerly warm advection under synoptic type 4, the lower troposphere had a stronger thermal stratification on 27 December than on 28–29 December under synoptic type 2 (Figs. 10a–b and 11a), leading to more aerosols in the lower PBL on 27 December (Fig. 10c–d). By contrast, the aerosols can be distributed more evenly in the vertical direction on 28–29 December under synoptic type 2. Figure 11b presents the average vertical profiles of PM2.5 concentration along the cross section between 38 and 39∘ N, in which the total amounts of PM2.5 were almost the same on 27 and 28–29 December, but they were distributed distinctly. With more aerosols at the upper levels under synoptic type 2 on 28–29 December, the daytime aerosol radiative feedback on the PBL thermal structure was enhanced (Figs. 10e–f and 11c). Since solar radiation is more intense at the upper levels, the elevated aerosol layer can absorb more solar radiation and strengthen the thermal stratification more effectively (Z. Wang et al., 2018; Huang et al., 2018). Thus, compared with synoptic type 4, type 2 can be more conducive for aerosol radiative feedback.
To elucidate the link among synoptic forcing, PBL structure, and aerosol pollution in BTH, this study combined long-term observational data analyses, synoptic classification, and meteorology–chemistry coupled simulations. On the basis of the wintertime PM2.5 measurements and radiosonde data in Beijing and Tangshan from 2017 to 2018, the relationships between PBL structure and aerosol pollution were examined. It was found that both cities often experienced high PM2.5 concentrations simultaneously, which was typically accompanied by strong thermal inversion aloft. The concurrence of heavy pollution in Beijing and Tangshan was regulated by the large-scale synoptic forcings. Using T-PCA with the 850 hPa daily GH fields during winter, two typical synoptic patterns relevant to the heavy pollution in Beijing and Tangshan were identified. One is characterized by a southeast-to-north pressure gradient across BTH at the 850 hPa level, leading to westerly prevailing winds over BTH. The other is associated with the high pressure in eastern China and southerly prevailing winds over BTH. These two types both feature warmer air temperatures at 1000 m a.g.l., which can significantly suppress the development of the PBL.
Under these unfavorable synoptic conditions, the aerosols suspended in the atmosphere can modulate the PBL structure. A pollution episode at the end of 2017 associated with these typical synoptic types was simulated using the WRF-Chem by turning the aerosol radiative option on and off. The simulation results indicated that the aerosol radiative effect can significantly lower the daytime BLH by cooling the surface layer and heating the upper part of the PBL. Therefore, more aerosols could be accumulated in the lower portion of the PBL. These PBL–aerosol feedbacks are sensitive to the aerosol vertical structure, and this effect is greater when the synoptic pattern can distribute more aerosols to the upper PBL. Finally, although this study highlights the important roles of multi-scale physical processes in relation to the aerosol pollution in BTH, the chemical mechanisms and processes should also not be deemphasized.
The reanalysis data can be downloaded from https://rda.ucar.edu/datasets/ds083.2/ (National Center for Atmospheric Research, 2019). The meteorological data in BTH are available from the China Meteorological Administration (http://data.cma.cn/, China Meteorological Administration, 2019), and the PM2.5 data can be obtained from the CNEMC (http://www.cnemc.cn/, China National Environmental Monitoring Center, 2019). The model data are available by request (chehz@cma.gov.cn).
The supplement related to this article is available online at: https://doi.org/10.5194/acp-20-5899-2020-supplement.
Development of the ideas and concepts behind this work was performed by all the authors. Model execution, data analysis, and paper preparation were performed by YM and HC with feedback and advice from XZ and SL.
The authors declare that they have no conflict of interest.
The authors would like to acknowledge the Tsinghua University for the support of emission data.
This research has been supported by the National Natural Science Foundation of China (grant nos. 41705002 and 41825011), the Beijing Natural Science Foundation (grant no. 8192054), and the Atmospheric Pollution Control of the Prime Minister (grant no. DQGG0106).
This paper was edited by Jianping Huang and reviewed by two anonymous referees.
Ackermann, I. J., Hass, H., Memmesheimer, M., Ebel, A., Binkowski, F. S., and Shankar, U.: Modal aerosol dynamics model for Europe, Atmos. Environ., 32, 2981–2999, https://doi.org/10.1016/S1352-2310(98)00006-5, 1998.
Baklanov, A. A., Grisogono, B., Bornstein, R., Mahrt, L., Zilitinkevich, S. S., Taylor, P., Larsen, S. E., Rotach, M. W., and Fernando, H. J. S.: The nature, theory, and modeling of atmospheric planetary boundary layers, B. Am. Meteorol. Soc., 92, 123–128, https://doi.org/10.1175/2010BAMS2797.1, 2011.
Chen, F. and Dudhia, J.: Coupling an Advanced Land Surface–Hydrology Model with the Penn State–NCAR MM5 Modeling System, Part I: Model Implementation and Sensitivity, Mon. Weather Rev., 129, 569–585, https://doi.org/10.1175/1520-0493(2001)129<0587:CAALSH>2.0.CO;2, 2001.
Chen, Y., Zhao, C., Zhang, Q., Deng, Z., Huang, M., and Ma, X.: Aircraft study of Mountain Chimney effect of Beijing, China, J. Geophys. Res.-Atmos., 114, 1–10, https://doi.org/10.1029/2008JD010610, 2009.
Cheng, Z., Luo, L., Wang, S., Wang, Y., Sharma, S., Shimadera, H., Wang, X., Bressi, M., de Miranda, R. M., Jiang, J., Zhou, W., Fajardo, O., Yan, N., and Hao, J.: Status and characteristics of ambient PM2.5 pollution in global megacities, Environ. Int., 89, 212–221, https://doi.org/10.1016/j.envint.2016.02.003, 2016.
China Meteorological Administration: The meteorological data in BTH, available at: http://data.cma.cn/, last access: 21 August 2019.
China National Environmental Monitoring Center: PM2.5 data, available at: http://www.cnemc.cn, last access: 1 September 2019.
Ding, A. J., Huang, X., Nie, W., Sun, J. N., Kerminen, V.-M., Petäjä, T., Su, H., Cheng, Y. F., Yang, X.-Q., Wang, M. H., Chi, X. G., Wang, J. P., Virkkula, A., Guo, W. D., Yuan, J., Wang, S. Y., Zhang, R. J., Wu, Y. F., Song, Y., Zhu, T., Zilitinkevich, S., Kulmala, M., and Fu, C. B.: Black carbon enhances haze pollution in megacities in China, Geophys. Res. Lett., 43, 1–7, https://doi.org/10.1002/2016GL067745, 2016.
Forkel, R., Balzarini, A., Baró, R., Bianconi, R., Curci, G., Jiménez-Guerrero, P., Hirtl, M., Honzak, L., Lorenz, C., Im, U., Pérez, J. L., Pirovano, G., San José, R., Tuccella, P., Werhahn, J., and Žabkar, R.: Analysis of the WRF-Chem contributions to AQMEII phase2 with respect to aerosol radiative feedbacks on meteorology and pollutant distributions, Atmos. Environ., 115, 630–645, https://doi.org/10.1016/j.atmosenv.2014.10.056, 2015.
Garratt, J.: Review: the atmospheric boundary layer, Earth-Sci. Rev., 37, 89–134, https://doi.org/10.1016/0012-8252(94)90026-4, 1994.
Gao, Y., Zhang, M., Liu, Z., Wang, L., Wang, P., Xia, X., Tao, M., and Zhu, L.: Modeling the feedback between aerosol and meteorological variables in the atmospheric boundary layer during a severe fog-haze event over the North China Plain, Atmos. Chem. Phys., 15, 4279–4295, https://doi.org/10.5194/acp-15-4279-2015, 2015.
Geng, G., Zhang, Q., Tong, D., Li, M., Zheng, Y., Wang, S., and He, K.: Chemical composition of ambient PM2.5 over China and relationship to precursor emissions during 2005–2012, Atmos. Chem. Phys., 17, 9187–9203, https://doi.org/10.5194/acp-17-9187-2017, 2017.
Grell, G. A., Peckham, S. E., Schmitz, R., McKeen, S. A., Frost, G., Skamarock, W. C., and Eder, B.: Fully coupled “online” chemistry within the WRF model, Atmos. Environ., 39, 6957–6975, https://doi.org/10.1016/j.atmosenv.2005.04.027, 2005.
Hong, S.-Y., Dudhia, J., and Chen, S.-H.: A Revised Approach to Ice Microphysical Processes for the Bulk Parameterization of Clouds and Precipitation, Mon. Weather Rev., 132, 103–120, https://doi.org/10.1175/1520-0493(2004)132<0103:ARATIM>2.0.CO;2, 2004.
Hu, X.-M., Ma, Z., Lin, W., Zhang, H., Hu, J., Wang, Y., Xu, X., Fuentes, J. D., and Xue, M.: Impact of the Loess Plateau on the atmospheric boundary layer structure and air quality in the North China Plain: A case study, Sci. Total Environ., 499, 228–237, https://doi.org/10.1016/j.scitotenv.2014.08.053, 2014.
Hu, X.-M., Li, X., Xue, M., Wu, D., and Fuentes, J. D.: The Formation of Barrier Winds East of the Loess Plateau and Their Effects on Dispersion Conditions in the North China Plains, Bound.-Lay. Meteorol., 1–19, https://doi.org/10.1007/s10546-016-0159-4, 2016.
Huang, X., Wang, Z., and Ding, A.: Impact of Aerosol-PBL Interaction on Haze Pollution: Multiyear Observational Evidences in North China, Geophys. Res. Lett., 45, 8596–8603, 2018.
Huth, R.: An intercomparision of computer-assited circulation classificaiton methods, Int. J. Climatol., 16, 893–922, https://doi.org/10.1002/(SICI)1097-0088(199608)16:8<893::AID-JOC51>3.0.CO;2-Q, 1996.
Iacono, M. J., Delamere, J. S., Mlawer, E. J., Shephard, M. W., Clough, S. A., and Collins, W. D.: Radiative forcing by long-lived greenhouse gases: Calculations with the AER radiative transfer models, J. Geophys. Res., 113, D13103, https://doi.org/10.1029/2008JD009944, 2008.
Janjić, Z. I.: The Step-Mountain Eta Coordinate Model: Further Developments of the Convection, Viscous Sublayer, and Turbulence Closure Schemes, Mon. Weather Rev., 122, 927–945, https://doi.org/10.1175/1520-0493(1994)122<0927:TSMECM>2.0.CO;2, 1994.
Miao, Y. and Liu, S.: Linkages between aerosol pollution and planetary boundary layer structure in China, Sci. Total Environ., 650, 288–296, https://doi.org/10.1016/J.SCITOTENV.2018.09.032, 2019.
Miao, Y., Hu, X.-M., Liu, S., Qian, T., Xue, M., Zheng, Y., and Wang, S.: Seasonal variation of local atmospheric circulations and boundary layer structure in the Beijing-Tianjin-Hebei region and implications for air quality, J. Adv. Model. Earth Syst., 7, 1602–1626, https://doi.org/10.1002/2015MS000522, 2015.
Miao, Y., Liu, S., Zheng, Y., and Wang, S.: Modeling the feedback between aerosol and boundary layer processes: a case study in Beijing, China, Environ. Sci. Pollut. R., 23, 3342–3357, https://doi.org/10.1007/s11356-015-5562-8, 2016.
Miao, Y., Guo, J., Liu, S., Liu, H., Li, Z., Zhang, W., and Zhai, P.: Classification of summertime synoptic patterns in Beijing and their associations with boundary layer structure affecting aerosol pollution, Atmos. Chem. Phys., 17, 3097–3110, https://doi.org/10.5194/acp-17-3097-2017, 2017a.
Miao, Y., Guo, J., Liu, S., Liu, H., Zhang, G., Yan, Y., and He, J.: Relay transport of aerosols to Beijing-Tianjin-Hebei region by multi-scale atmospheric circulations, Atmos. Environ., 165, 35–45, https://doi.org/10.1016/j.atmosenv.2017.06.032, 2017b.
Miao, Y., Liu, S., Guo, J., Huang, S., Yan, Y., and Lou, M.: Unraveling the relationships between boundary layer height and PM2.5 pollution in China based on four-year radiosonde measurements, Environ. Pollut., 243, 1186–1195, https://doi.org/10.1016/j.envpol.2018.09.070, 2018.
Miao, Y., Li, J., Miao, S., Che, H., Wang, Y., Zhang, X., Zhu, R., and Liu, S.: Interaction Between Planetary Boundary Layer and PM2.5 Pollution in Megacities in China: a Review, Curr. Pollut. Rep., 5, 261–271, https://doi.org/10.1007/s40726-019-00124-5, 2019a.
Miao, Y., Liu, S., and Huang, S.: Synoptic pattern and planetary boundary layer structure associated with aerosol pollution during winter in Beijing, China, Sci. Total Environ., 682, 464–474, https://doi.org/10.1016/j.scitotenv.2019.05.199, 2019b.
Nakanishi, M. and Niino, H.: An improved Mellor-Yamada Level-3 model: Its numerical stability and application to a regional prediction of advection fog, Bound.-Lay. Meteorol., 119, 397–407, https://doi.org/10.1007/s10546-005-9030-8, 2006.
National Center for Atmospheric Research: Data Engineering and Curation Section of the Computational and Information Systems Laboratory, Boulder, Colorado, available at: https://rda.ucar.edu/datasets/ds083.2/, last access: 9 September 2019.
Nielsen-Gammon, J. W., Powell, C. L., Mahoney, M. J., Angevine, W. M., Senff, C., White, A., Berkowitz, C., Doran, C., and Knupp, K.: Multisensor estimation of mixing heights over a coastal city, J. Appl. Meteorol. Climatol., 47, 27–43, https://doi.org/10.1175/2007JAMC1503.1, 2008.
Oke, T. R.: Boundary Layer Climates, Routledge, 304–330, 2002.
Philipp, A., Beck, C., Huth, R., and Jacobeit, J.: Development and comparison of circulation type classifications using the COST 733 dataset and software, Int. J. Climatol., 36, 2673–2691, https://doi.org/10.1002/joc.3920, 2014.
Quan, J., Gao, Y., Zhang, Q., Tie, X., Cao, J., Han, S., Meng, J., Chen, P., and Zhao, D.: Evolution of planetary boundary layer under different weather conditions, and its impact on aerosol concentrations, Particuology, 11, 34–40, https://doi.org/10.1016/j.partic.2012.04.005, 2013.
Seidel, D. J., Ao, C. O., and Li, K.: Estimating climatological planetary boundary layer heights from radiosonde observations: Comparison of methods and uncertainty analysis, J. Geophys. Res., 115, D16113, https://doi.org/10.1029/2009JD013680, 2010.
Stefan, S., Necula, C., and Georgescu, F.: Analysis of long-range transport of particulate matters in connection with air circulation over Central and Eastern part of Europe, Phys. Chem. Earth, 35, 523–529, https://doi.org/10.1016/j.pce.2009.12.008, 2010.
Schell, B., Ackermann, I. J., Hass, H., Binkowski, F. S., and Ebel, A.: Modeling the formation of secondary organic aerosol within a comprehensive air quality model system, J. Geophys. Res.-Atmos., 106, 28275–28293, https://doi.org/10.1029/2001JD000384, 2001.
Stockwell, W. R., Middleton, P., Chang, J. S., and Tang, X.: The second generation regional acid deposition model chemical mechanism for regional air quality modeling, J. Geophys. Res., 95, 16343, https://doi.org/10.1029/JD095iD10p16343, 1990.
Stull, R. B.: An Introduction to Boundary Layer Meteorology, edited by: Stull, R. B., Springer Netherlands, Dordrecht, 670 pp., 1988.
Sun, T., Che, H., Qi, B., Wang, Y., Dong, Y., Xia, X., Wang, H., Gui, K., Zheng, Y., Zhao, H., Ma, Q., Du, R., and Zhang, X.: Characterization of vertical distribution and radiative forcing of ambient aerosol over the Yangtze River Delta during 2013–2015, Sci. Total Environ., 650, 1846–1857, https://doi.org/10.1016/j.scitotenv.2018.09.262, 2019.
Tie, X., Zhang, Q., He, H., Cao, J., Han, S., Gao, Y., Li, X., and Jia, X. C.: A budget analysis of the formation of haze in Beijing, Atmos. Environ., 100, 25–36, https://doi.org/10.1016/j.atmosenv.2014.10.038, 2015.
Wang, H., Peng, Y., Zhang, X., Liu, H., Zhang, M., Che, H., Cheng, Y., and Zheng, Y.: Contributions to the explosive growth of PM2.5 mass due to aerosol-radiation feedback and decrease in turbulent diffusion during a red alert heavy haze in Beijing-Tianjin-Hebei, China, Atmos. Chem. Phys., 18, 17717–17733, https://doi.org/10.5194/acp-18-17717-2018, 2018.
Wang, L., Wang, H., Liu, J., Gao, Z., Yang, Y., Zhang, X., Li, Y., and Huang, M.: Impacts of the near-surface urban boundary layer structure on PM2.5 concentrations in Beijing during winter, Sci. Total Environ., 669, 493–504, https://doi.org/10.1016/j.scitotenv.2019.03.097, 2019.
Wang, X., Dickinson, R. E., Su, L., Zhou, C., and Wang, K.: PM2.5 Pollution in China and How It Has Been Exacerbated by Terrain and Meteorological Conditions, Bull. Am. Meteorol. Soc., 99, 105–119, https://doi.org/10.1175/BAMS-D-16-0301.1, 2018.
Wang, Z., Huang, X., and Ding, A.: Dome effect of black carbon and its key influencing factors: a one-dimensional modelling study, Atmos. Chem. Phys., 18, 2821–2834, https://doi.org/10.5194/acp-18-2821-2018, 2018.
Ye, X., Song, Y., Cai, X., and Zhang, H.: Study on the synoptic flow patterns and boundary layer process of the severe haze events over the North China Plain in January 2013, Atmos. Environ., 124, 129–145, https://doi.org/10.1016/j.atmosenv.2015.06.011, 2016.
Zhang, C., Liu, C., Hu, Q., Cai, Z., Su, W., Xia, C., Zhu, Y., Wang., S., and Liu, J.: Satellite UV-Vis spectroscopy: implications for air quality trends and their driving forces in China during 2005–2017, Light Sci. Appl., 8, 100, https://doi.org/10.1038/s41377-019-0210-6, 2019.
Zhang, J. P., Zhu, T., Zhang, Q. H., Li, C. C., Shu, H. L., Ying, Y., Dai, Z. P., Wang, X., Liu, X. Y., Liang, A. M., Shen, H. X., and Yi, B. Q.: The impact of circulation patterns on regional transport pathways and air quality over Beijing and its surroundings, Atmos. Chem. Phys., 12, 5031–5053, https://doi.org/10.5194/acp-12-5031-2012, 2012.
Zhang, R., Jing, J., Tao, J., Hsu, S.-C., Wang, G., Cao, J., Lee, C. S. L., Zhu, L., Chen, Z., Zhao, Y., and Shen, Z.: Chemical characterization and source apportionment of PM2.5 in Beijing: seasonal perspective, Atmos. Chem. Phys., 13, 7053–7074, https://doi.org/10.5194/acp-13-7053-2013, 2013.
Zhong, J., Zhang, X., Wang, Y., Sun, J., Zhang, Y., Wang, J., Tan, K., Shen, X., Che, H., Zhang, L., Zhang, Z., Qi, X., Zhao, H., Ren, S., and Li, Y.: Relative contributions of boundary-layer meteorological factors to the explosive growth of PM2.5 during the red-alert heavy pollution episodes in Beijing in December 2016, J. Meteorol. Res., 31, 809–819, https://doi.org/10.1007/s13351-017-7088-0, 2017.
Zhong, J., Zhang, X., Dong, Y., Wang, Y., Liu, C., Wang, J., Zhang, Y., and Che, H.: Feedback effects of boundary-layer meteorological factors on cumulative explosive growth of PM2.5 during winter heavy pollution episodes in Beijing from 2013 to 2016, Atmos. Chem. Phys., 18, 247–258, https://doi.org/10.5194/acp-18-247-2018, 2018.
Zhang, Y., Ding, A., Mao, H., Nie, W., Zhou, D., Liu, L., Huang, X., and Fu, C.: Impact of synoptic weather patterns and inter-decadal climate variability on air quality in the North China Plain during 1980–2013, Atmos. Environ., 124, 119–128, 2016.