the Creative Commons Attribution 4.0 License.
the Creative Commons Attribution 4.0 License.
 | 17 Jan 2020
Atmospheric ammonia variability and link with particulate matter formation: a case study over the Paris area
Camille Viatte
Tianze Wang
Martin Van Damme
Enrico Dammers
Frederik Meleux
Lieven Clarisse
Mark W. Shephard
Simon Whitburn
Pierre François Coheur
Karen E. Cady-Pereira
Cathy Clerbaux
The Paris megacity experiences frequent particulate matter (i.e.PM2.5, particulate matter with a diameter less than 2.5 µm) pollution episodes in spring (March–April). At this time of the year, large numbers of the particles consist of ammonium sulfate and nitrate which are formed from ammonia (NH3) released during fertilizer spreading practices and transported from the surrounding areas to Paris. There is still limited knowledge of the emission sources around Paris, their magnitude, and their seasonality.
Using space-borne NH3 observation records of 10 years (2008–2017) and 5 years (2013–2017) provided by the Infrared Atmospheric Sounding Interferometer (IASI) and the Cross-Track Infrared Sounder (CrIS) instrument, regional patterns of NH3 variabilities (seasonal and interannual) are derived. Observations reveal identical high seasonal variability with three major NH3 hotspots found from March to August. The high interannual variability is discussed with respect to atmospheric total precipitation and temperature.
A detailed analysis of the seasonal cycle is performed using both IASI and CrIS instrument data, together with outputs from the CHIMERE atmospheric model. For 2014 and 2015, the CHIMERE model shows coefficients of determination of 0.58 and 0.18 when compared to IASI and CrIS, respectively. With respect to spatial variability, the CHIMERE monthly NH3 concentrations in spring show a slight underrepresentation over Belgium and the United Kingdom and an overrepresentation in agricultural areas in the French Brittany–Pays de la Loire and Plateau du Jura region, as well as in northern Switzerland. In addition, PM2.5 concentrations derived from the CHIMERE model have been evaluated against surface measurements from the Airparif network over Paris, with which agreement was found (r2 = 0.56) with however an underestimation during spring pollution events.
Using HYSPLIT cluster analysis of back trajectories, we show that NH3 total columns measured in spring over Paris are enhanced when air masses originate from the north-east (e.g. the Netherlands and Belgium), highlighting the importance of long-range transport in the NH3 budget over Paris. Variability in NH3 in the north-east region is likely to impact NH3 concentrations in the Parisian region since the cross-correlation function is above 0.3 (at lag = 0 and 1 d).
Finally, we quantify the key meteorological parameters driving the specific conditions important for the formation of PM2.5 from NH3 in the Île-de-France region in spring. Data-driven results based on surface PM2.5 measurements from the Airparif network and IASI NH3 measurements show that a combination of the factors such as a low boundary layer of ∼500 m, a relatively low temperature of 5 ∘C, a high relative humidity of 70 %, and wind from the north-east contributes to a positive PM2.5 and NH3 correlation.
- Article
(8054 KB) - Full-text XML
-
Supplement
(684 KB) - BibTeX
- EndNote


Ammonia (NH3) is an atmospheric pollutant and one of the main sources of reactive nitrogen in the atmosphere which is involved in numerous biogeochemical exchanges impacting all ecosystems (Sutton et al., 2013). The global budget of reactive N has dramatically increased since the preindustrial era (Holland et al., 2005; Battye et al., 2017), causing major environmental damage such as ecosystem and species extinction (Isbell et al., 2013; Hernandez et al., 2016), as well as soil and water eutrophication and acidification (Rockström et al., 2009). NH3 is a precursor of ammonium salts which can form up to 50 % of the mass of particulate matter (PM) (Behera et al., 2013). Large cities such as Paris (which is the most populated area in the European Union, with 10.5 million people when its larger metropolitan regions are included) typically experience strong PM pollution episodes in spring. These particles are known to be harmful to human health (Pope III et al., 2009), inducing 2000 deaths per year in the Paris megacity (Corso et al., 2016) and impacting the radiative budget of the Earth (Myhre et al., 2013).
Because of their impact on the environment, public health, and climate change, NH3 emissions are regulated in several countries in the world. However, NH3 emissions from European countries have increased by 2 % over the period 2014–2016 (National Emission Ceilings Directive reporting status, 2018) even though the Gothenburg Protocol set a reduction on NH3 emissions of 6 % by 2020. In France, where 94 % of NH3 emissions come from the agriculture sector (CITEPA, 2018) as a result of extensive fertilizer use to increase crop yields (Erisman et al., 2008), policies have been implemented with the aim of reducing NH3 emissions by 13 % in 2030 relative to 2005 (CEIP, 2016). However NH3 emissions are projected to increase in the future globally with increased population and food demand (van Vuuren et al., 2011), and NH3 volatilization will be enhanced with climate change (Sutton et al., 2013).
Once in the atmosphere, NH3 is rapidly removed by wet and dry deposition and reactions with atmospheric sulfuric and nitric acid, leading to a relatively short lifetime between a few hours and few days (Galloway et al., 2003). Release of NH3 into the atmosphere depends on (i) agriculture practices such as the following: spreading season, fertilizer form (urea, ammonium nitrate), fertilizer application methods, crops, and soil conditions such as pH (Hamaoui-Laguel et al., 2014); (ii) meteorological conditions (i.e. wind, temperature, and precipitation). Interannual variability in PM formation over urban areas is poorly understood since it also depends on many factors such as atmospheric humidity and temperature, which govern the phase equilibrium of secondary aerosols (Fuzzi et al., 2015). The variety of factors influencing NH3 volatilization and PM formation illustrates the complexity of predicting their concentrations in the atmosphere (Behera et al., 2013).
Atmospheric chemical transport models have difficulty representing both NH3 and PM2.5 distributions due to the challenge of reproducing NH3 temporal variability (Pinder et al., 2006; Fortems-Cheiney et al., 2016), long-range transport of pollutants (Moran et al., 2014), and secondary aerosol formation in the atmosphere (Petetin et al., 2016). The GEOS-Chem chemical transport model (Bey et al., 2001) was found to underestimate the observed NH3 concentrations in most regions of the globe (Zhu et al., 2013; Li et al., 2017). Heald et al. (2012) compared the IASI observations with the GEOS-Chem model and showed that NH3 is likely underestimated in California, leading to a local underestimate of ammonium nitrate aerosol. Similarly, the French CHIMERE model (Menut et al., 2013) underestimates the NH3 surface concentrations and emissions over Paris (Petetin et al., 2016; Fortems-Cheiney et al., 2016) because of the misrepresentation of agricultural emissions in terms of intensity and distribution (both spatial and temporal). Often ground and aircraft-based observations are used to provide a detailed representation of the atmospheric state that can be used to evaluate and improve the model simulations; however, these observations can be spatially sparse and/or over short sampling periods, especially globally. Additionally, more recently available (within the last 10 years) sun-synchronous satellite-based infrared sensors have been providing NH3 observations globally with a spatial resolution of ∼15 km approximately twice a day. These satellite observations have a limited amount of independent vertical information, but they do capture the spatiotemporal variabilities needed to help address these issues and improve model simulations, especially in remote locations (Skjøth et al., 2011; Kranenburg et al., 2016).
Aside from the Tropospheric Emission Spectrometer (TES, Beer et al., 2008), now decommissioned but the first to demonstrate the capability of thermal infrared instruments to monitor lower tropospheric NH3, three missions are currently able to measure NH3, including the Atmospheric InfraRed Sounder (AIRS, Warner et al., 2016), the Cross-track Infrared Sounder (CrIS, Shephard and Cady-Pereira, 2015), and the Infrared Atmospheric Sounding Interferometer (IASI, Clarisse et al., 2009). Recent studies have shown the increased capacity of space-borne instruments to derive spatial and seasonal distributions of NH3 concentrations globally (Clarisse et al., 2009; Shephard et al., 2011; and Van Damme et al., 2014a, 2015a), regionally (Beer et al., 2008; Clarisse et al., 2010; and Van Damme et al., 2014b), and locally (Van Damme et al., 2018) as well as identify trends in NH3 (Warner et al., 2017).
Representative measurements of NH3 concentrations and spatiotemporal variabilities are needed to address the link between NH3 and PM2.5 formation and improve model simulations. This has been attempted previously in some cities around the world, such as in Shanghai (Ye et al., 2011), Houston (Gong et al., 2013), Santiago (Chile) (Toro et al., 2014), and Beijing (Zhao et al., 2016) for instance. However, although the Paris megacity is repeatedly shrouded by particulate pollution episodes, many studies are limited to the Paris megacity and performed over a relatively short time frame during field campaigns, such as the following: NH3 measurements from May 2010 to February 2011 (Petetin et al., 2016); nitrate, sulfate, and ammonium aerosol measurements in July 2009 (Zhang et al., 2013); or atmospheric values based on numerical simulations (Skyllakou et al., 2014). Our study uses a data-driven regional approach and considers a longer time period in order to study the seasonal and interannual variabilities in NH3 and its impact on PM2.5 formation over the Paris megacity. Specifically in this paper we study concentrations and spatiotemporal variability in atmospheric NH3 from the agricultural sector to gain insights on the effect of NH3 on megacity air quality using the following: (1) long-term satellite observations derived from IASI (10 years from 2008 to 2017) and CrIS (5 years from 2013 to 2017) at the regional scale (400 km radius circle around the Paris city centre); (2) spatiotemporal patterns of the CHIMERE model evaluated against the IASI and CrIS datasets for 2014 and 2015; and (3) analysis of the main meteorological parameters that favour the formation of secondary PM2.5 from NH3 in the Paris megacity.
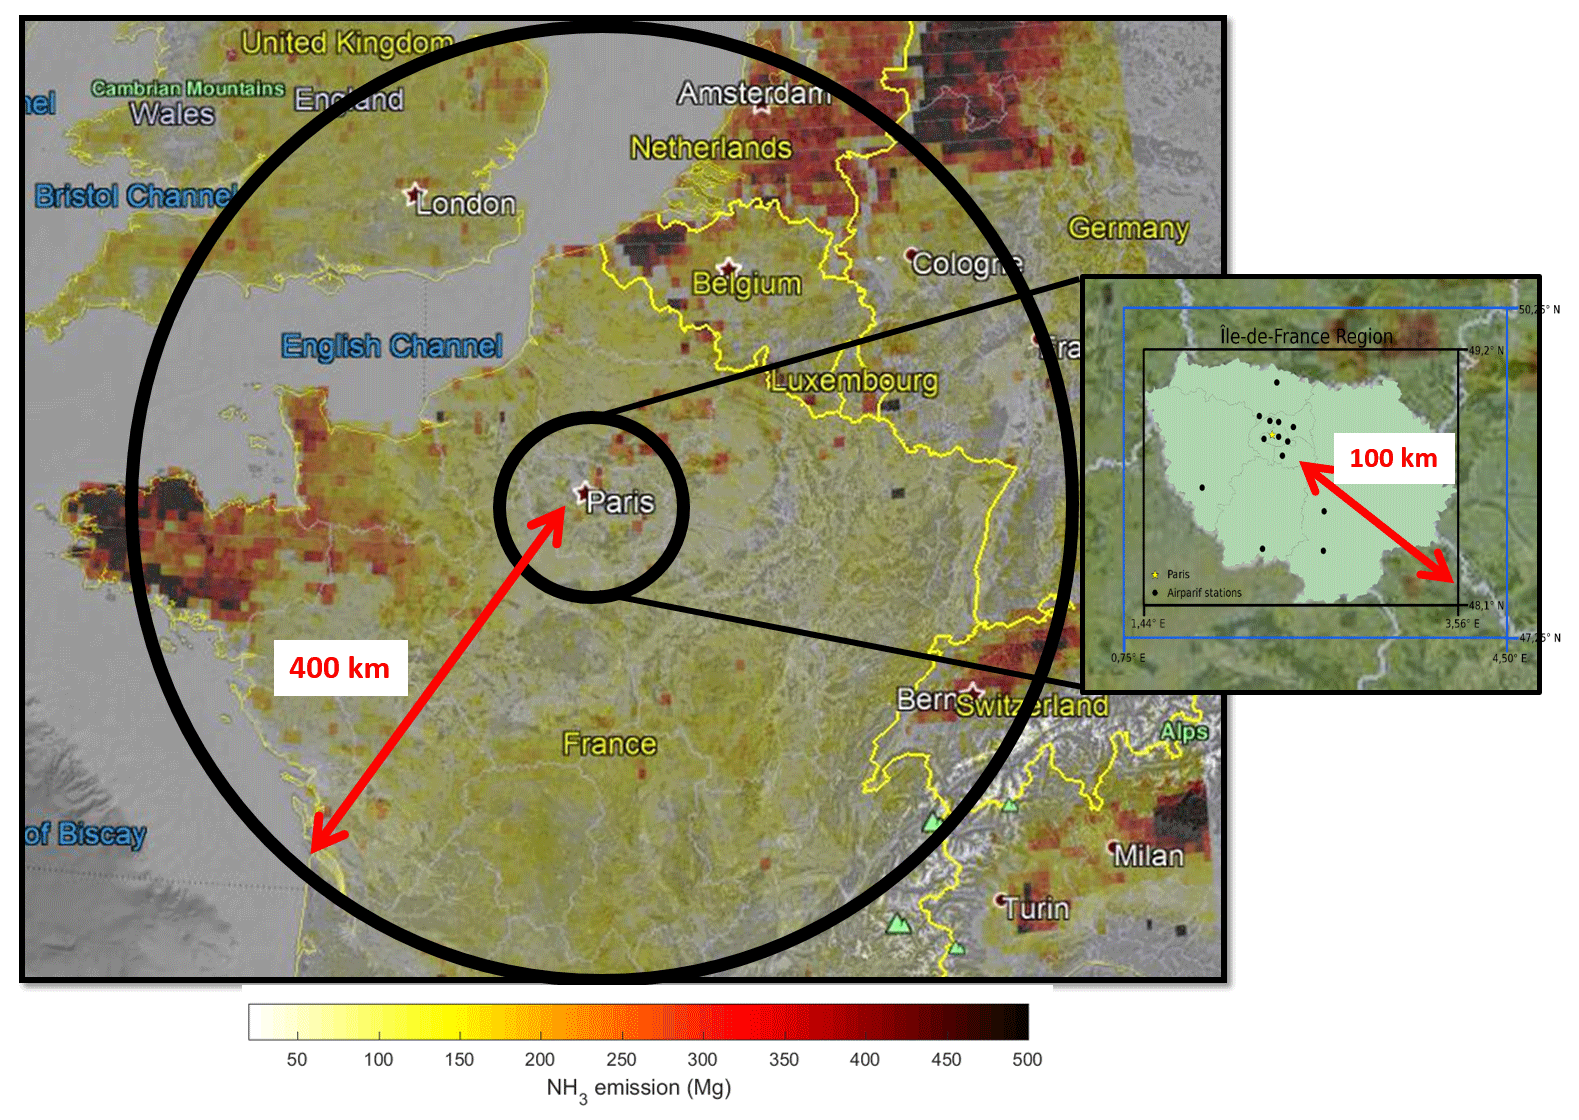
Figure 1Region of analysis: 400 km radius circle around the Paris megacity and 100 km around Paris. The latter is representative of the Île-de-France (IdF) region where the Airparif PM observational network is located. Black points are the locations of the Airparif stations measuring hourly PM2.5 concentration at the surface. The black (blue) box delimitates the IdF region in which the IASI NH3 (ECMWF) data have been considered. The overlay represents NH3 emissions (in megagrams per year and per cell of ) derived from the EMEP inventory for 2015. Map provided by Google Earth V7.3.2.5776, US Dept. of State Geographer, ©Google, 2019, Image Landsat/Copernicus, Data SIO, NOAA, US, Navy, NGA, and GEBCO.
2.1 Region of analysis
The domain of analysis covers a circular area around the Paris city centre with a 400 km radius (larger circle in Fig. 1), enabling the study of temporal and spatial variabilities in NH3 emission sources likely to affect air quality in the Paris megacity. It has been selected for two reasons. First, it includes main regions known for their high NH3 emissions, which can be transported and affect air quality over the Parisian region (Île-de-France (IdF); smaller circle in Fig. 1). Emission regions in the Netherlands, northern Germany, north-western Belgium, and the Brittany region in France are highlighted in darker colours in Fig. 1 (emissions values are from the European Monitoring and Evaluation Programme (EMEP) in 2015). Second, this area corresponds to the transport of 24 h back trajectories from Paris generated from the HYSPLIT model for 1 year, ensuring that NH3 can indeed be efficiently transported from the emitting sources within the selected domain to the IdF region.
Table 1Instrument specifications for the IASI and CrIS satellite instruments.
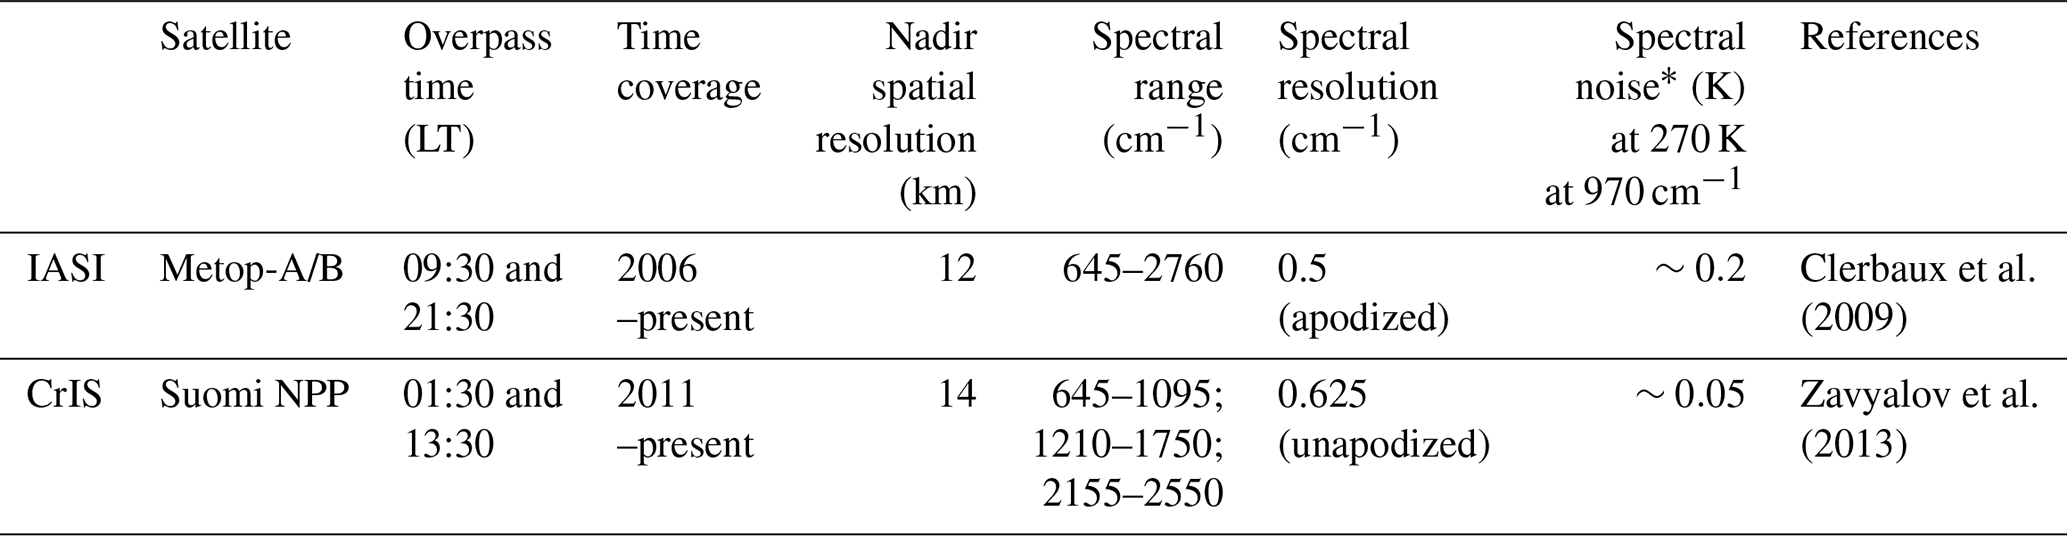
∗ Spectral noise comparison values in main ammonia spectral region (∼970 cm−1) obtained from Zavyalov et al. (2013).
2.2 Satellite observations of ammonia
For this study we used the available data from IASI and CrIS which are both Fourier transform spectrometers to evaluate the current capacity to observe NH3 concentrations from space and study its variability around IdF. Technical information is summarized in Table 1.
2.2.1 Infrared Atmospheric Sounding Interferometer (IASI)
IASI is a nadir-viewing spectrometer operated by EUMETSAT (European Organisation for the Exploitation of Meteorological Satellites) and launched onboard the Metop-A and Metop-B satellites, since October 2006 and September 2012, respectively. These satellites are on similar polar orbits with Equator crossing times at 09:30 (21:30) local mean solar time for the descending (ascending) orbit. IASI measures the thermal infrared radiation of the Earth–atmosphere system in the spectral range from 645 to 2760 cm−1 with a spectral resolution 0.5 cm−1 (apodized). The satellite swath is an area with a width of 2200 km composed of off-nadir measurements up to 48.3∘ on both sides of the track. At nadir, the IASI field of view is composed of 4×4 pixels each with a 12 km diameter (Clerbaux et al., 2009).
The NH3 total columns used here are derived from IASI observations using an artificial neural network (NN) reanalysed with ERA-interim data (ANNI-NH3-v2.1R, Van Damme et al., 2017). This dataset is consistent in time and suitable for investigating interannual variability, which is one purpose of this study. Note that we have considered only morning measurements (09:30 LT) here since the evening ones (21:30 LT) are associated with larger relative errors (Van Damme et al., 2017). IASI retrievals provide a robust error estimate for each IASI-NH3 observation, allowing us to take the variable sensitivity into account when comparing the IASI dataset with independent measurements. Finally, no filter on relative errors of the IASI datasets has been applied, following recommendations from Van Damme et al. (2017), and outliers for which concentrations exceed 10 standard deviations above the mean in the domain of study have been removed.
Over the studied area, Metop-A and Metop-B have an overpass time difference ranging from only a few seconds to 67 min, depending on the viewing geometry of the satellite scans; the average difference is 26 min for the 1325 d of common measurements. Monthly maps for the 10 years of observations between 2008 and 2017 are obtained by averaging Metop-A and Metop-B observations (the two instruments are considered jointly for their period of common operation from March 2013 to 2017), with more than 105 pixels on average over the domain of analysis. The number of available NH3 columns depends not only on the satellite overpass time but also on the state of the atmosphere being remotely sensed (e.g. thermal contrast and cloud cover). IASI NH3 has been evaluated using the LOTOS-EUROS model over Europe (Van Damme et al., 2014b) and ground-based and airborne measurements (Van Damme et al., 2015b), which show consistency between the IASI NH3 and available datasets. When comparing IASI NH3 (the previous IASI NN version) with ground-based Fourier transform infrared (FTIR) observations, a correlation of 0.8 and a slope of 0.73, with a mean relative difference of %, and an underestimation by IASI ranging from 10 % to 50 % have been found (Dammers et al., 2016).
2.2.2 Cross-track Infrared Sounder (CrIS)
The CrIS instrument (Zavyalov et al., 2013) is a Fourier transform spectrometer operated by the Joint Polar Satellite System (JPSS) programme on the Suomi National Polar-orbiting Partnership (NPP) satellite, launched on 28 October 2011. CrIS is in a sun-synchronous orbit with a mean local daytime (LT) overpass time of 13:30 (01:30) in the ascending (descending) node. CrIS measures the atmospheric composition over three wavelength bands in the infrared region (645–1095; 1210–1750; and 2155–2550 cm−1). NH3 retrievals are performed from the 645–1095 cm−1 band with a spectral resolution of 0.625 cm−1. The CrIS instrument scans a 2200 km swath width (∘). At nadir, the CrIS field of view consists of a 3×3 array of circular pixels each with a 14 km diameter.
The CrIS Fast Physical Retrieval (CRPR) (Shephard and Cady-Pereira., 2015) uses an optimal estimation approach (Rodgers, 2000) that minimizes the difference between the CrIS-measured atmospheric spectra and a very fast optimal spectral sampling (OSS) (Moncet et al., 2008) forward-model simulated spectrum to retrieve atmospheric profiles of ammonia volume mixing ratios. This physical approach provides direct estimates of the retrieval errors and the vertical sensitivity (averaging kernels) of the satellite observations, which is important as they vary from profile to profile, depending on the atmospheric state. To account for any a priori information used in the retrieval (i.e. the observation operator) in air quality model comparisons and data assimilation into models, the CRPR provides the retrieved error covariance and averaging kernels. CrIS has been shown to retrieve ammonia surface concentrations values down to ∼0.2–0.3 ppbv under favourable conditions (Kharol, et al., 2018). CrIS comparisons with ground-based FTIR observations show a correlation of 0.77 with a low CrIS bias of +2 % in the total column (Dammers et al., 2017). Initial evaluation against surface observations from the Ammonia Monitoring Network (AMoN) shows that even with the inherent sampling differences between the two surface observations they compare well, with a correlation of 0.76 and an overall mean CrIS–AMoN difference of % (Kharol et al., 2018).
For this study, a CrIS quality flag of 4 has been used, ensuring that retrievals provide some information from the measurement (degrees of freedom of the signal (DOFS) ≥0.1). In addition, outliers for which concentrations exceed 10 standard deviations above the mean have been removed.
2.3 Modelling NH3 from the CHIMERE model
The CHIMERE runs used in this study were obtained from the framework of the Copernicus Atmospheric Monitoring Service (CAMS, https://atmosphere.copernicus.eu/; last access: 10 January 2020) and its annual task devoted to the production of regional reanalysis over Europe. The hindcasts for the years 2014 and 2015 (raw simulation without data assimilation) were produced over Europe with a horizontal resolution of 0.1∘ per 0.1∘ and nine vertical levels stretched from the surface up to 500 hPa (∼5000 m). The data input to feed CHIMERE (Menut et al., 2013; Mailler et al., 2017) were the Integrated Forecasting System (IFS) meteorological data from the European Centre for Medium-Range Weather Forecasts (ECMWF) and the annual emission inventory provided by the Netherlands Organisation for Applied Scientific Research (TNO) (Kuenen et al., 2014) for 2011. These annual emissions are then distributed in hourly data to feed CHIMERE using seasonal, weekly, and hourly factors. Fire emissions come from the Global Fire Assimilation System (GFAS, Kaiser et al., 2012).
The model computes hourly concentrations for more than 180 species, including regulated pollutants such as ozone, PM10, and NH3. The processes influencing NH3 concentrations taken into consideration in CHIMERE are dry deposition (following Wesely et al., 1989) and wet deposition due to in-cloud processes and precipitation. The gas-particulate phase equilibrium is computed with the ISOROPPIA module (Nenes et al., 1998), which is a thermodynamic equilibrium model for , , and . It simulates the NH4NO3 contribution to particulate matter, which is especially large during March–April pollution episodes (Petit et al., 2017).
These datasets were evaluated over Europe for several pollutants before being used for air quality studies (http://policy.atmosphere.copernicus.eu/Reports.html; last access: 10 January 2020).
The model NH3 profiles were integrated vertically along the 9 km model layers to provide a column that can be compared to that of the satellite measurements. Concretely, this makes a reasonable assumption that all of the NH3 is located within this 0–5 km layer (see e.g. Fig. 1 in Whitburn et al., 2016).
To evaluate the capacity of the model to reproduce NH3 variability in space and time at the regional scale and its impact on air quality at the local scale, comparisons were performed in 2014 and 2015 for the following reasons. At the regional scale (over the 400 km radius around Paris), NH3 total columns derived from IASI in 2014 and 2015 are highly variable in spring, reaching 10 % higher in March and 50 % lower in May than the 10-year average. Since ammonia emission variability in France depends on seasonal timing of fertilizer applications (Ramanantenasoa et al., 2018), this period is crucial for assessing the model capacity. Second, the IdF region (100 km radius around Paris) also experienced high NH3 and PM2.5 events in spring 2014 and 2015 (Fig. S1 in the Supplement). Thus, these years serve as a benchmark for evaluating the model in terms of NH3 variability and PM2.5 formation at local and regional scales.
2.4 Relative scales and coincidence criteria for dataset comparisons
Direct quantitative comparisons of satellite NH3 products are difficult because of the different overpass times and ground footprint sizes of the two space borne instruments, which are not compatible with the high variability in NH3 in space and time. Therefore, the evaluation of satellite observations is often made with the use of in situ measurements performed at surface and onboard aircrafts (Nowak et al., 2012; Van Damme et al., 2015b) or with ground-based remote-sounding FTIR (Dammers et al., 2016, 2017).
The purpose of comparing CrIS and IASI here is to qualitatively assess the spatiotemporal patterns of the NH3 sources derived from the two datasets and use these regional observations to evaluate the CHIMERE model in the domain of analysis at the local time for their respective overpasses, 09:30 and 13:30 LT. CHIMERE outputs, in terms of NH3 concentrations, have already been compared to the IASI observations at the regional scale (Europe; Fortems-Cheiney et al., 2016) and surface measurements at the local scale (Paris, Petetin et al., 2016) but have never been evaluated against the CrIS observations.
One aspect that needs to be considered when comparing concentration amounts inferred from infrared satellite observations is the importance of the algorithm and the a priori information used in the retrieval, especially for NH3 which has limited vertical information. Some differences between the IASI and CrIS observations might arise due to instrument measurement differences (e.g. sensitivity), sampling period differences (e.g. overpass times of morning/evening vs. middle of day/night), and retrieval algorithm differences, but they have both been validated and shown to capture well the spatiotemporal variations in lower tropospheric ammonia. Since the purpose of our study is not to quantitatively compare IASI and CrIS NH3 data, but rather to use these independent datasets to assess NH3 source patterns over the domain and qualitatively evaluate the CHIMERE model in terms of NH3 concentrations and variabilities, a standardization procedure was applied to their retrieved absolute NH3 columns. We computed “standardized columns” for each independent dataset (IASI, CrIS, and CHIMERE, separately) for 2014 and 2015 over the domain of study in such a way that the corresponding values have a standard deviation of 1 and a mean of 0, as in Wilks (2011).
The standardized columns have been computed following Eq. (1):
where , , Xdata corresponds to NH3 columns derived from a dataset (IASI, CrIS, or CHIMERE), and is the corresponding standardized dataset.
In addition to comparing CHIMERE outputs with satellite data/columns, spatial and temporal coincidence criteria have been applied. To compare satellite observations, all CrIS pixels located within a 25 km radius circle from the centre of the IASI ground pixels have been considered within the same day of measurements. A spatial criterion of 25 km has been chosen because it optimizes the number of pairs involved in the statistics and improves the correlations. As for the comparisons between the model and the observations, all CHIMERE outputs located within the same grid box as the satellite observations and within 1 h from its measurement have been selected.
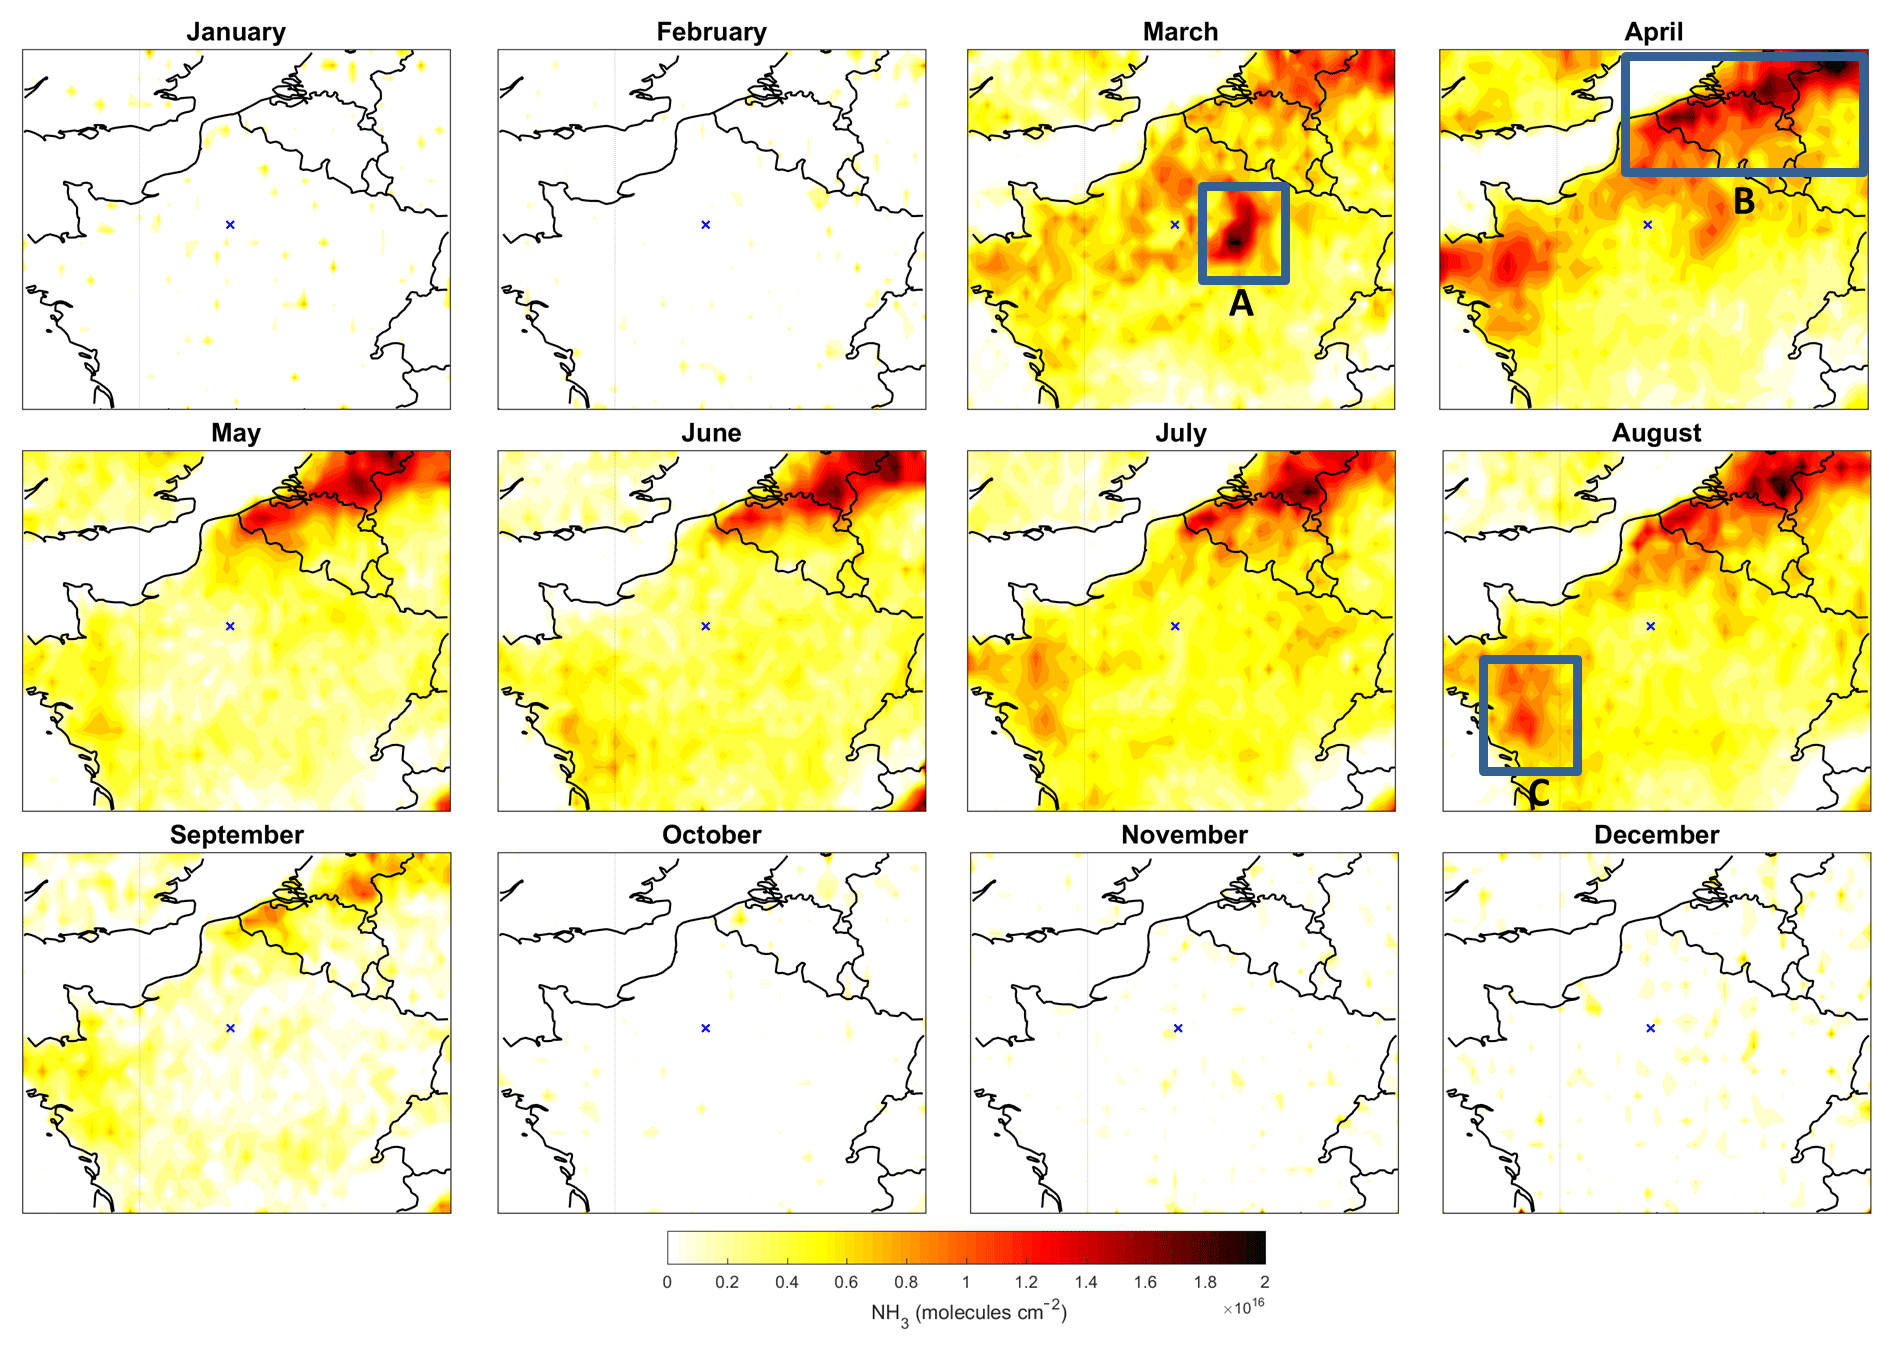
Figure 2Monthly means of NH3 total columns (molecules cm−2) derived from 10 years (2008–2017) of IASI NH3-retrieved columns. The blue cross indicates the location of Paris.
3.1 NH3 regional observations derived from IASI (10 years) and CrIS (5 years)
3.1.1 Seasonal variabilities
First the seasonal variability was investigated over the IdF area. On a monthly basis, the 10- and 5-year-averaged regional NH3 total column distributions derived from IASI and CrIS were found to exhibit a high seasonality over the domain (Figs. 2 and 3). Note that the distributions in Figs. 2 and 3 have been obtained by averaging satellite NH3 observations in grid boxes. Both satellite datasets exhibit the same variability over the domain even if the time period is different (10 years versus 5 years) and the sampling hour differs (∼ 09:30 versus ∼ 13:30 LT). It should be noted that CrIS and IASI NH3 columns present small differences in terms of NH3 total columns in low concentration regimes in the domain of study.
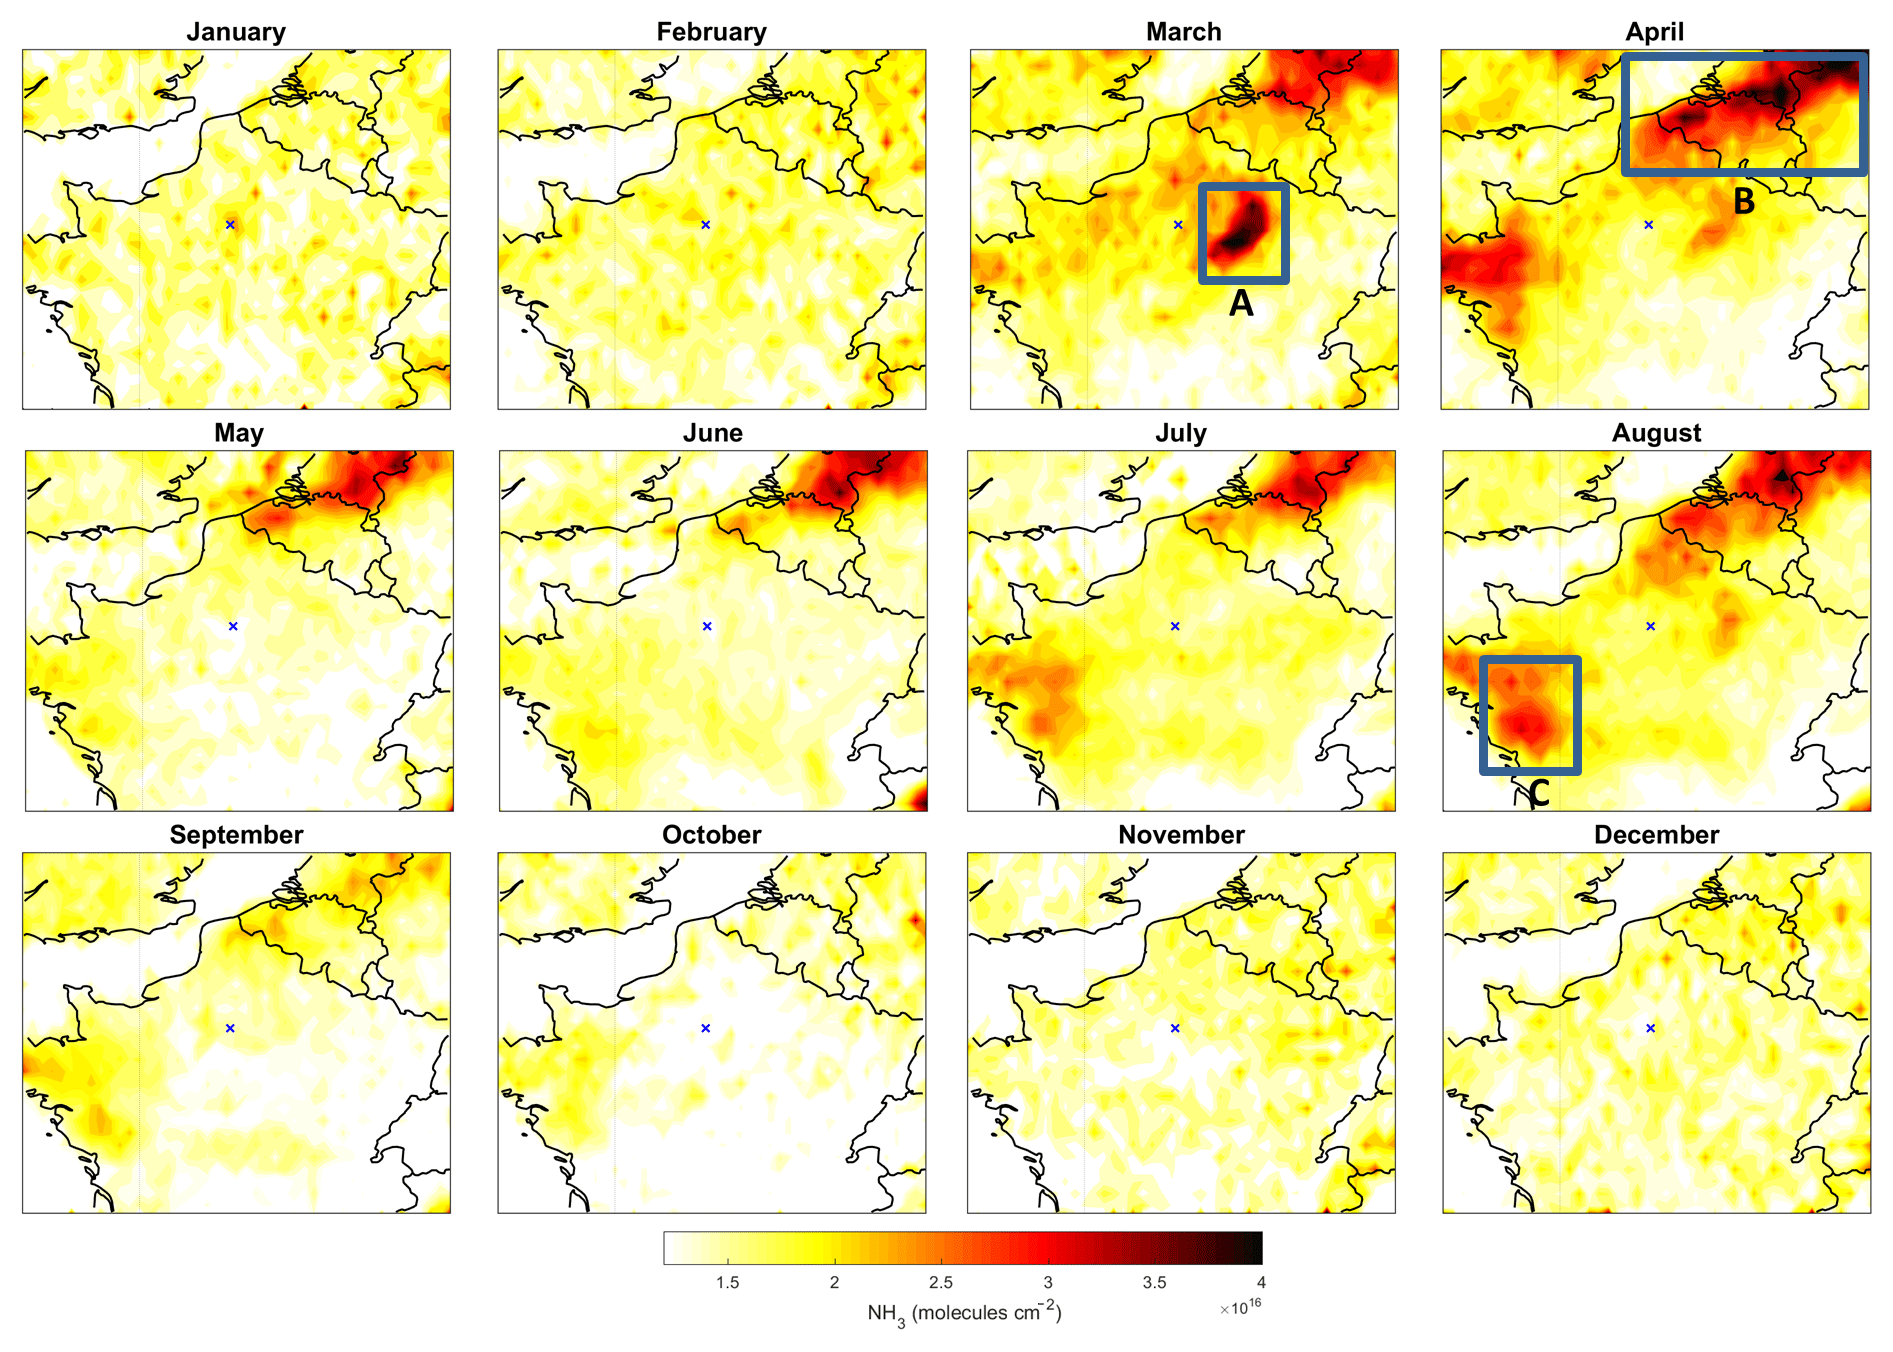
Figure 3Monthly means of NH3 total columns (molecules cm−2) derived from 5 years (2013–2017) of CrIS NH3-retrieved columns. The blue cross indicates the location of Paris.
In Figs. 2 and 3, high NH3 concentrations (up to 2×10¹⁶ molecules cm−2) can be observed from March to August at different locations of the domain:
-
the French Champagne-Ardennes region in March and April (box A in Figs. 2 and 3),
-
the northern part of the domain corresponding to the Netherlands and northern Belgium from April to August (box B in Figs. 2 and 3), and
-
the Brittany–Pays de la Loire region (western France) mainly in April and August but still persistent from March to August (box C in Figs. 2 and 3).
The observed seasonality is mainly related to agricultural practices (fertilizer application period varying as function of the crop types and type of livestock) and changes in temperatures, with higher temperatures favouring volatilization. This likely explains the high concentrations in July and August.
In the Champagne-Ardennes region, hotspot areas do not correspond to vineyards but rather to field vegetables and root crops (https://agriculture.gouv.fr/overview-french-agricultural-diversity; last access: 10 January 2020; AGRESTE, Service Central d'Enquêtes et d'Études Statistiques; http://agreste.agriculture.gouv.fr/IMG/pdf/R4215A15.pdf; last access: 10 January 2020). This is a main region of mineral fertilization used by the sugar industry in France (Ramanantenasoa et al., 2018). Hamaoui-Laguel et al. (2014) and Fortems-Cheiney et al. (2016) have previously noted that NH3 emissions in this region, mainly due to fertilization of barley, sugar beet, and potato starch in early March, were higher than what was reported in the EMEP inventory.
NH3 concentrations are high from April to August in the northern part of the domain, which is known for its animal farming (Eurostat, 2014, http://ec.europa.eu/eurostat/statistics-explained/index.php?title=File:Livestock_density_by_NUTS_2_regions,_EU-28,_2013.png; last access: 10 January 2020, Van Damme et al., 2014a; Scarlat et al., 2018 – their Fig. 2).
In the Pays de la Loire region, NH3 concentrations are high in April and August and remain relatively high from March to September. Hotspots are found in areas of livestock farming, mainly poultry (Robinson et al., 2014; their Fig. 2c), which might explain the high and relatively constant NH3 concentrations over warmer periods in this region.
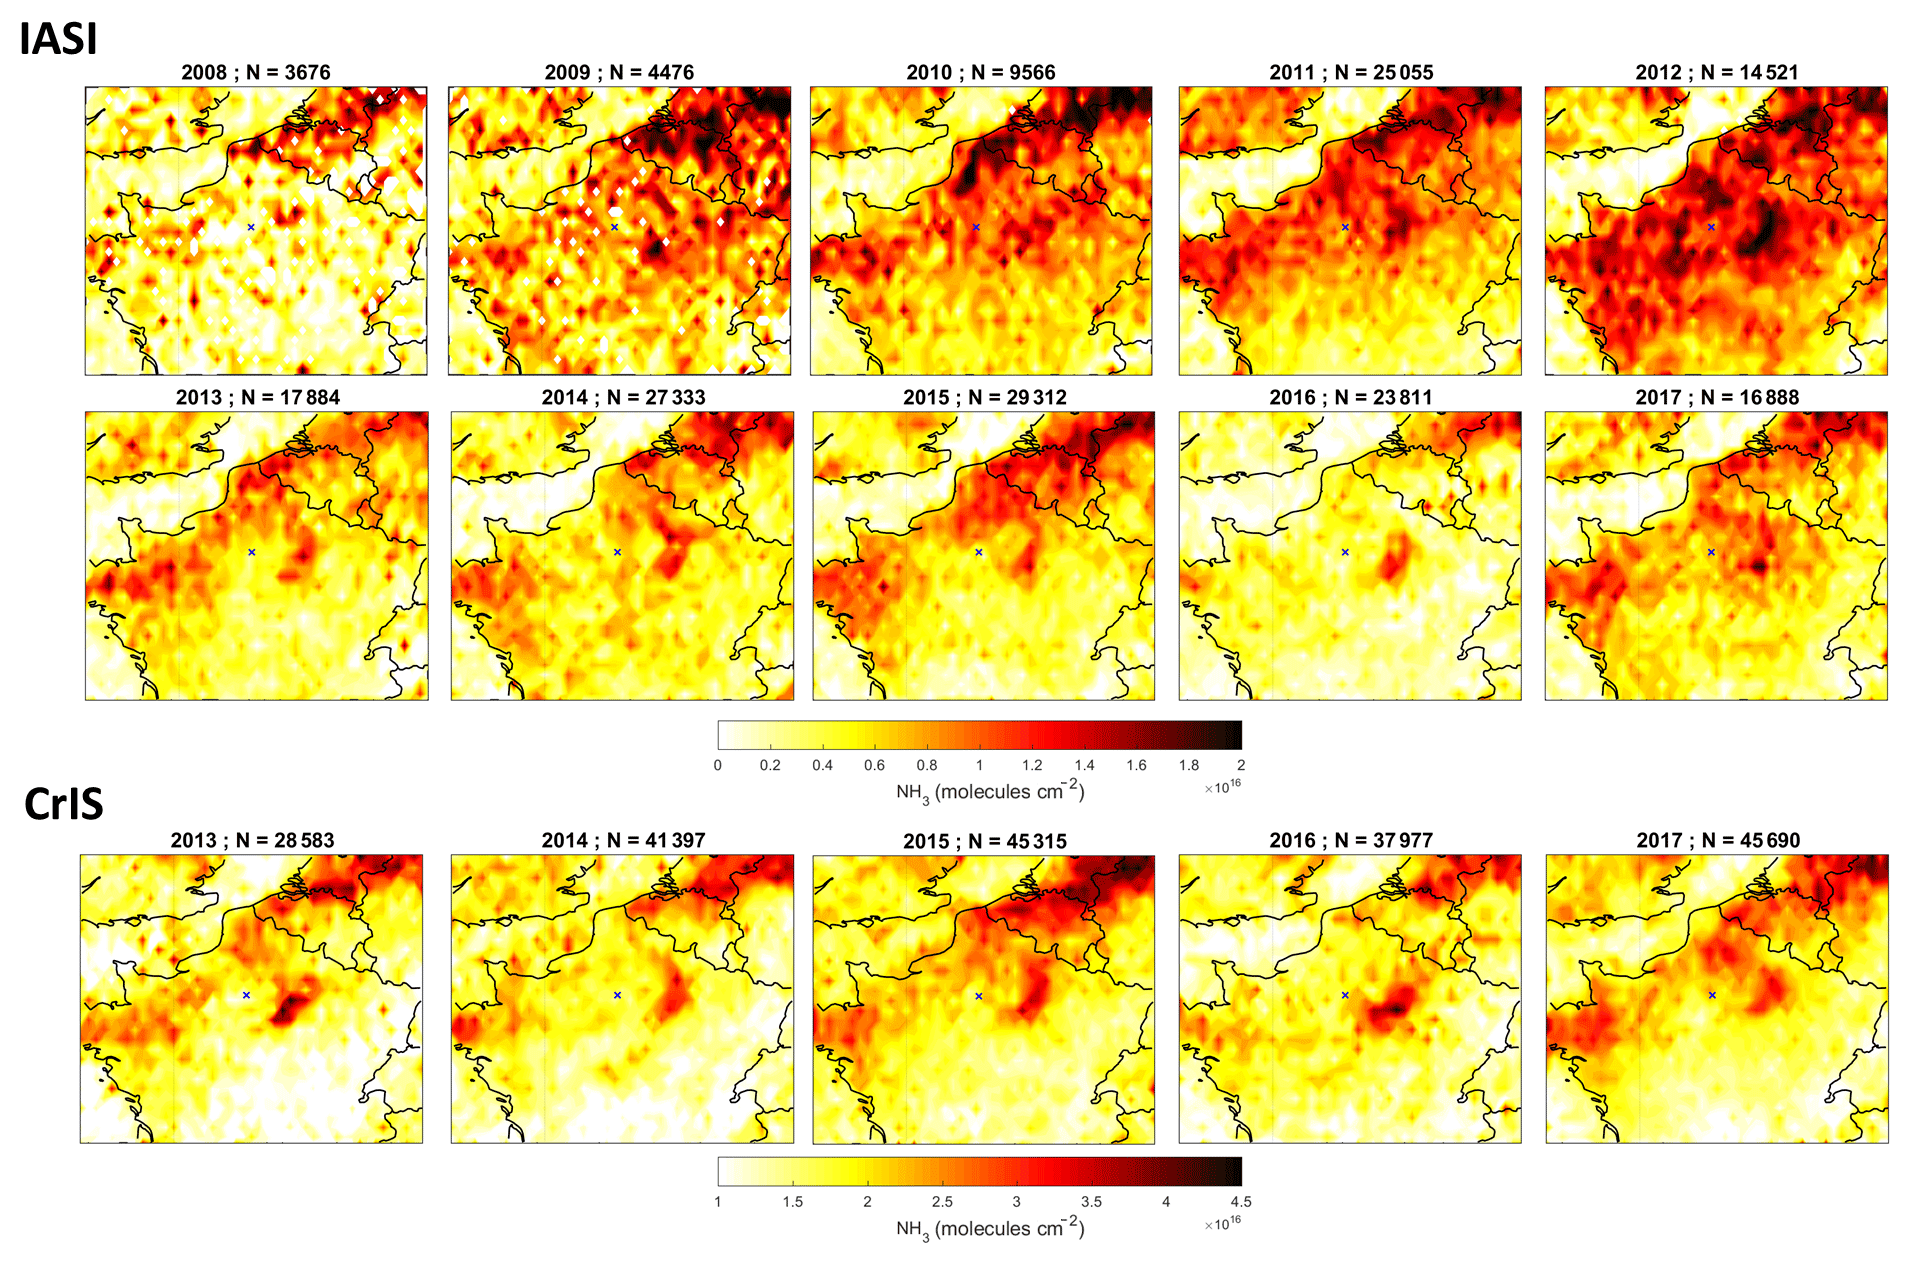
Figure 4Maps of monthly mean NH3 total columns (molecules cm−2) in the March–April period derived from IASI observations from 2008 to 2017 and CrIS observations from 2013 to 2017.
3.1.2 Interannual variabilities
As can be seen in Figs. 2 and 3, NH3 concentrations are enhanced between March and August in the domain. In this section, interannual variabilities are discussed regarding meteorological conditions and agricultural practices during this time period.
Interannual variability in NH3 is higher in spring than in summer; e.g. in June the variance is 8 times lower than in the other months. To illustrate the interannual variability in spring, maps of monthly mean NH3 total columns derived from the March–April period of IASI observations (2008–2017 time period) and CrIS observations (2013–2017 time period) are shown in Fig. 4. Both satellite distributions exhibit the same interannual variability from 2013 to 2017, with higher NH3 concentrations in 2015 over the northern part of the domain than in the other years. NH3 concentrations derived from IASI observations in 2011 are 150 % higher in spring (March and April) compared to 2016 (Fig. 4). It has been recently shown that spatial variability in NH3 emissions in France is due to fertilizer use and type and pedoclimatic conditions and that temporal variability depends on seasonal timing of fertilizer applications (Ramanantenasoa et al., 2018). In addition, interannual variabilities in NH3 concentrations over the United States are dominated by meteorological conditions (Schiferl et al., 2016). Thus, interannual variability in observed NH3 total columns is likely to be driven by meteorological conditions and specific agricultural constrains (crop type and phenological stage for instance).
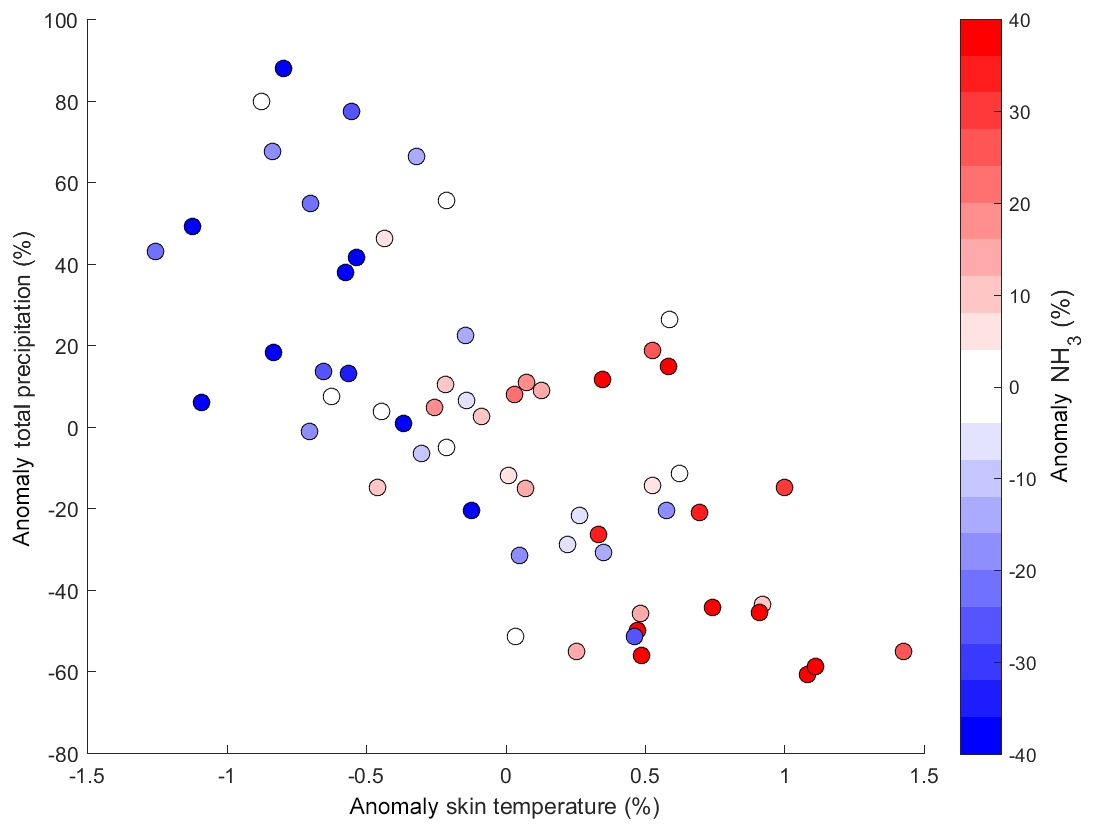
Figure 5Scatter plot of monthly mean anomaly (relative to the 10-year monthly average from 2008 to 2017) of total precipitation versus skin temperature derived from ECMWF data from March to August in the domain and colour coded by the NH3 total columns anomaly derived from IASI observations.
To investigate the impact of meteorological conditions on atmospheric NH3 variability, we computed the monthly mean anomalies of total precipitation versus skin temperature derived from ECMWF ERA-interim data (Dee et al., 2011), colour coded by NH3 total columns anomalies derived from IASI observations, as shown in Fig. 5. Monthly mean anomaly is calculated with respect to the 10-year average data (in %). In this figure, monthly NH3 total columns are at least 10 % higher (positive anomalies, red dots) when skin temperatures are higher and total precipitation are lower than the 10-year average. In contrast, negative monthly NH3 total columns anomalies (blue dots in Fig. 5) are associated with higher total precipitation and lower skin temperatures than the 10-year average. To further examine the analyses, Fig. S2 in the Supplement shows bar plots of monthly mean NH3 total columns derived from IASI observations, total precipitation, and skin temperature derived from ECMWF data from March to August, plotted in different colours for the different years of measurements from 2008 to 2017. NH3 total columns are larger by more than 300 % in March–April 2012 compared to 2013 (Fig. S2a). Total precipitation is higher (0.4 mm compared to 1 mm in Fig. S2b) and skin temperature is lower (281 compared to 288 K in Fig. S2c) in March 2013 than in March 2012 on average over the domain. Overall, total precipitation is anti-correlated with NH3 concentrations in the atmosphere ( from March to May for all years; not shown here) likely because of (a) the wet deposition importance in the atmospheric NH3 removal and (b) the absence of fertilization during rainy periods. Skin temperature is relatively correlated with NH3 concentrations (R=0.30 from March to May for all years) since higher temperature increases volatilization of NH3 from the surface to the atmosphere.
In addition, theNH3 concentration reaches a maximum in March 2011 whereas it peaks later in April for 2012 (Fig. S2a). Spring is a fertilizer application period that depends on many agricultural and meteorological constrains. When the temperatures are relatively lower as in the case of 2012 (Fig. S2b), fertilizer spreading may occur sooner because the phenological growth stage might be more advanced. The fertilizing process period also varies as a function of the sowing date, which depends on agricultural practices and crop types; corn is fertilized in early spring whereas rapeseed is fertilized in late spring.
Overall, our results suggest that variability in meteorological factors (precipitation and temperature) and farming practices (fertilizer and manure applications) may play an important role in driving the large interannual variability in NH3 columns observed by IASI and CrIS in the domain of study.
3.2 Comparisons of NH3 columns derived from IASI, CrIS, and CHIMERE for 2014 and 2015
To discuss the representation of agricultural emissions in the models in terms of intensity and both spatial and temporal distributions, regional satellite observations derived from IASI and CrIS have been compared to the CHIMERE model in the region of analysis.
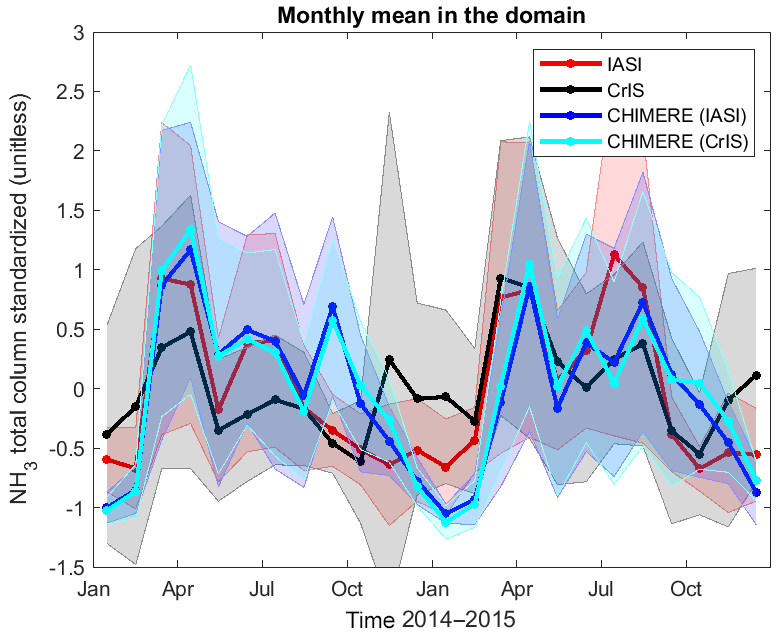
Figure 6Standardized monthly mean concentrations derived from IASI (red), CrIS (black), CHIMERE sampled at IASI overpass time and space (blue), and CHIMERE sampled at CrIS overpass time and space (cyan) for 2014 and 2015. Shaded areas correspond to the 1σ standard deviation around each mean.
3.2.1 Annual cycle
Standardized monthly mean concentrations derived from IASI, CrIS, and CHIMERE for 2014 and 2015 are shown in Fig. 6.
As can be seen from the plot, the three datasets exhibit similar patterns in terms of seasonality; all are enhanced in March–April and summer and show a decrease in May. However two major differences can be noted.
First, CrIS standardized NH3 columns are higher in winter (November, December, and January) compared to the other dataset, which can be also be seen in Fig. 3. This could be attributed to a higher number of outliers, given the larger standard deviation (shaded areas in Fig. 6), and no attempt to account for potential non-detections when concentrations fall below the instrument detection limits. For these months, NH3 levels are low and undetectable by satellite observations (Figs. 2 and 3) so these high values could be interpreted as observational noise. The detection limit depends on the instrument characteristics and atmospheric state, with an IASI minimum detection limit of ∼2–3 ppbv (∼4–6×10¹⁵ molecules cm−2) (Clarisse et al., 2010) and a CrIS minimum detection limit of ∼0.5–1.0 ppbv (∼1–2×10¹⁵ molecules cm−2) (Shephard and Cady-Pereira, 2015; Kharol et al., 2018). Note that values below detection limits have not been filtered out from the IASI dataset whereas the quality flag used to discard CrIS's retrievals associated with DOFS ≥0.1 (Sect. 2.2.2) favours larger observed columns. Consequently, the normalized seasonal cycle amplitude derived from CrIS data is weaker than the IASI-derived one.
Second, CHIMERE standardized NH3 columns are enhanced in September 2014, which is not supported by the observations. It has been recently shown that CHIMERE overestimated NH3 emissions in autumn over Europe (Couvidat et al., 2018). Generally, the amplitude of the modelled seasonal cycle exceeds the measured ones, which could be explained by higher concentrations measured in winter due to the observational noise and lower emissions. This is a different finding than in Schiferl et al. (2016) since they restricted IASI high relative errors when comparing it to the GEOS-Chem model over the United States, which inherently favours larger columns and thus leads to weakening of the observed seasonal cycle.
Over the whole period, the coefficient of determination (r2) between the standardized monthly mean NH3 columns derived from IASI (CrIS) observations and the CHIMERE model is 0.58 (0.18) for the annual cycles of 2014 and 2015, with low associated p values (p<0.1) reflecting the significance level of each fit (not shown here). If we only consider months with high NH3 in the domain from March to August, the correlation between the observational datasets and the model results is weaker, with r2 values between IASI (CrIS) and CHIMERE of 0.29 (0.14), and not significant (p>0.1) for CrIS, as shown in Fig. 7. Since annual total emissions are the same for the 2 years and simply disaggregated with a monthly profile in the model, the correlations reveal that the seasonal cycle is likely to be reproduced by the model. In addition, year-to-year variability can be seen in the model, with lower concentrations in March 2015 compared to 2014 for instance, despite constant emissions in the 2-year simulation. This interannual variability is likely to be attributed to changes in meteorological conditions. However, values of r2 lower than 0.6 (0.2) indicate that the CHIMERE model only reproduces at most half (20 %) of the monthly temporal NH3 variabilities observed by IASI (CrIS) in the domain.
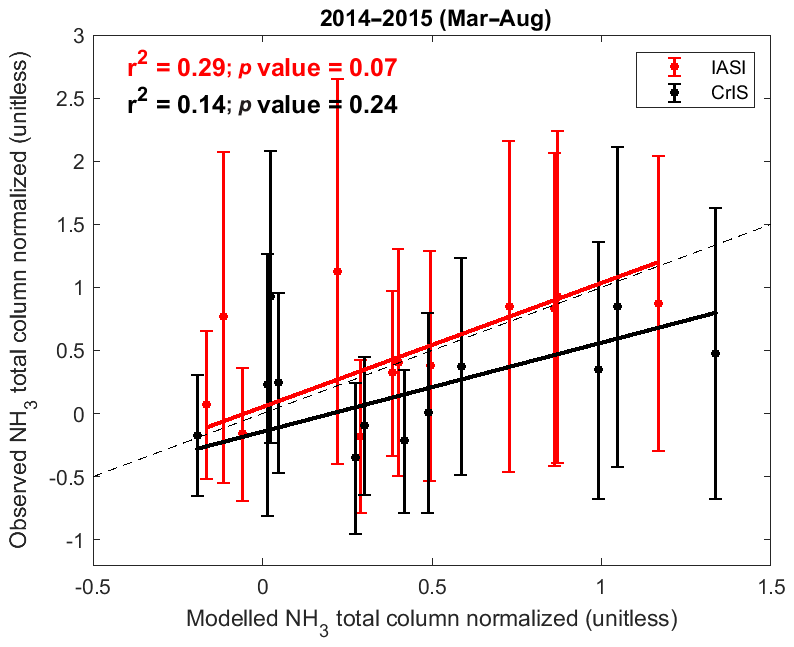
Figure 7Correlation plots between monthly means of NH3 standardized concentrations derived from satellite observations (IASI in red and CrIS in black) and the CHIMERE outputs for March to August in 2014 and 2015. The 1:1 line is represented by the dashed line. Error bars represent the 1σ standard deviation around the monthly means.
3.2.2 Spatial variability in NH3 in spring
The IASI and CrIS regional maps have been compared to the CHIMERE model for the March–April period in 2014 and 2015 to evaluate the capacity of the model to reproduce the spatial distribution of episodic emissions from fertilizer spreading practices in spring, as well as their interannual variability. Satellite NH3 measurements in spring have been gridded at a spatial resolution, and the associated CHIMERE maps have been computed following the coincident criteria described in Sect. 2.4 at the same spatial resolution (Figs. 8 and 9).
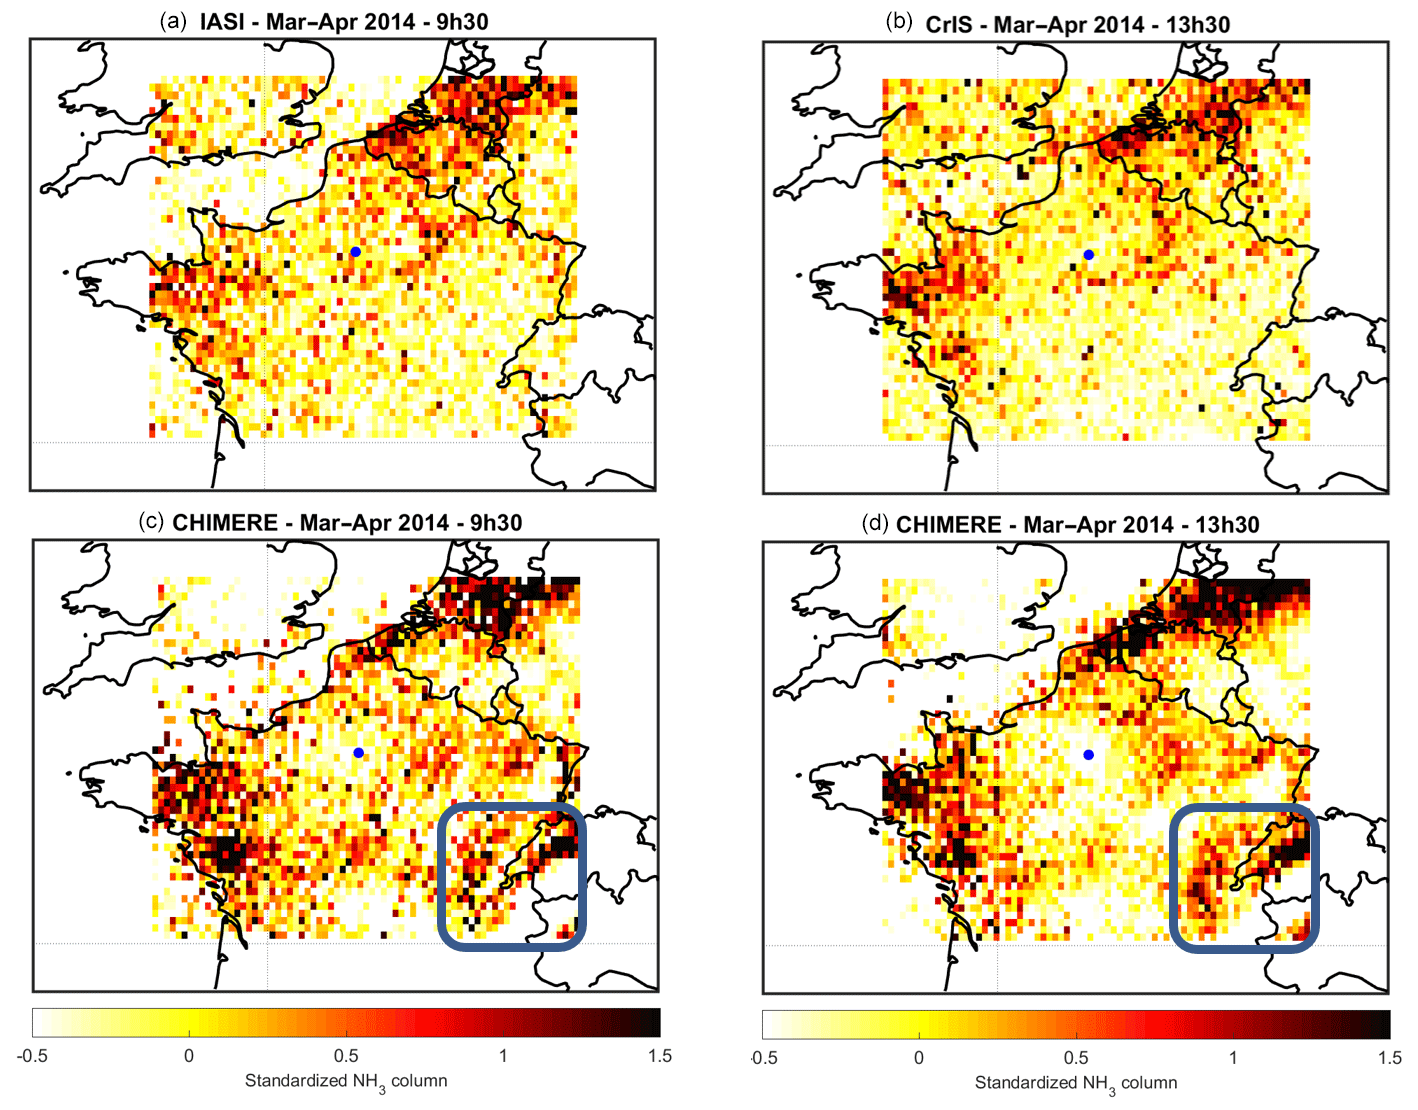
Figure 8Standardized NH3 column derived from the satellite instruments,(a) IASI and (b) CrIS, and the corresponding NH3 column derived from the CHIMERE model (coincident with (c) IASI and (d) CrIS) for March–April 2014. Blue dots indicate the location of Paris. Same as Fig. 7 but for March–April 2015.
It can be noted that the spatial distribution of NH3 observed in spring by both satellite instruments are in good agreement, even though their overpass time is different (∼4 h apart). This was already shown in the interannual variability agreement seen in Fig. 4. In spring 2014, IASI and CrIS both reveal three main regions of enhanced NH3 concentrations (the northern part of the domain, Champagne-Ardennes, and Brittany–Pays de la Loire) already identified by the 10 and 5 years of IASI and CrIS observation maps (boxes A, B, and C in Figs. 2 and 3). In 2015, concentrations of NH3 in the northern part of the domain are higher than in 2014, as indicated by both IASI and CrIS observations (Fig. 9a, b). Overall, satellite observations are able to capture similar spatial distributions of high NH3 concentrations in spring and their evolution in time.
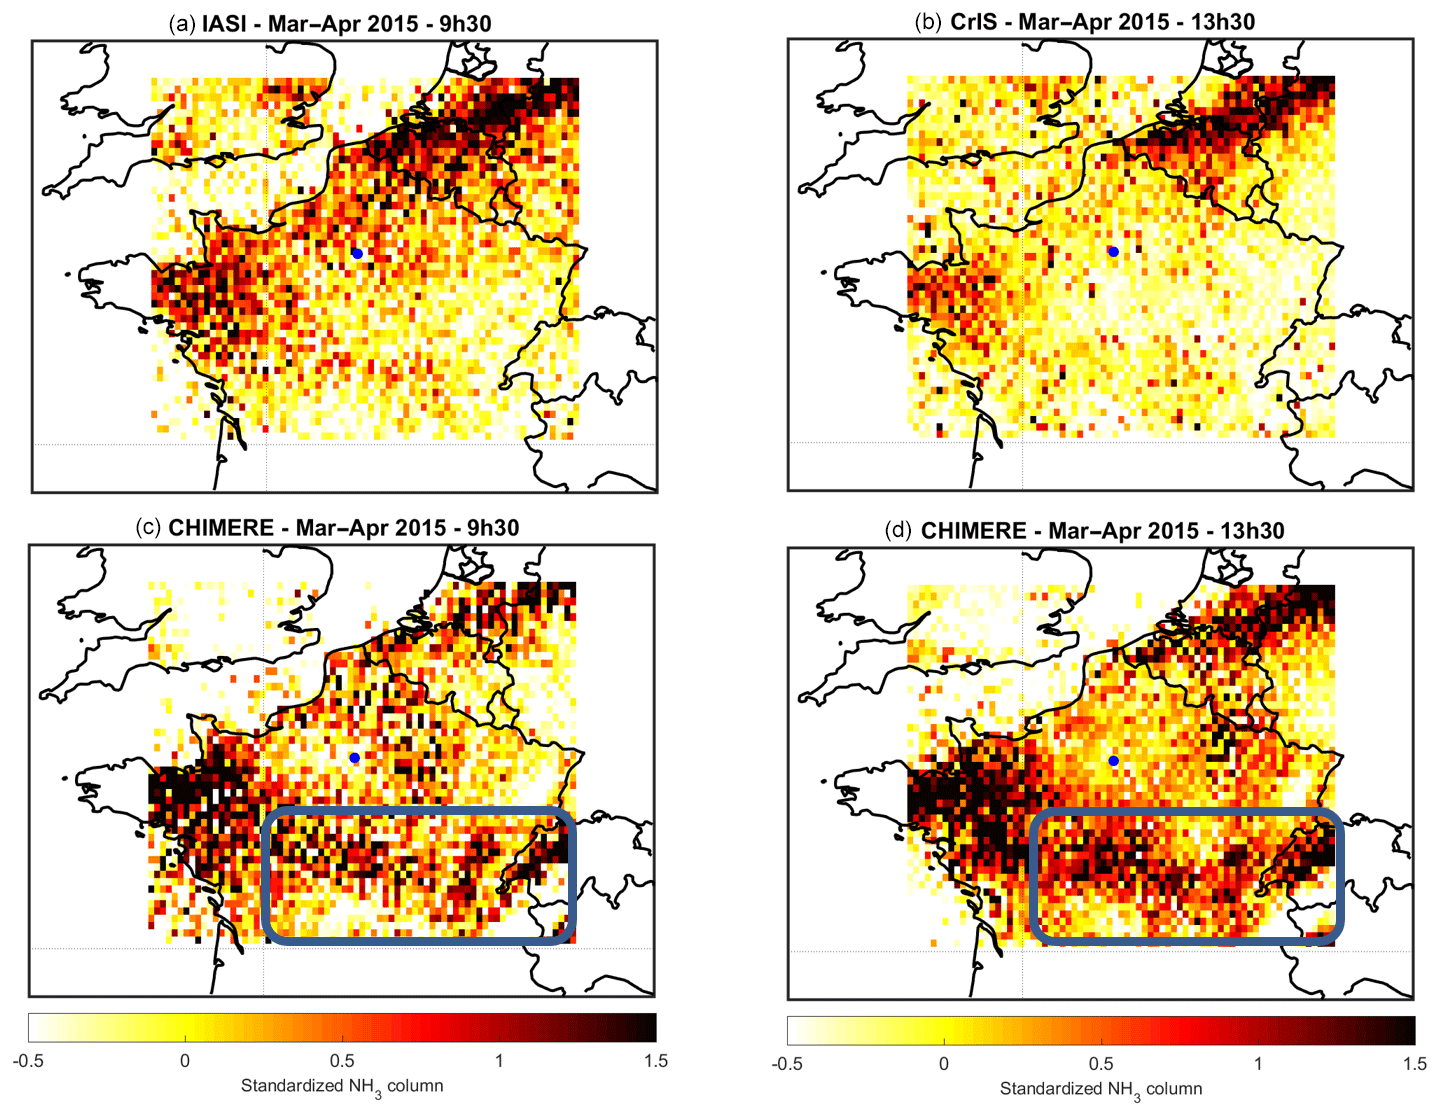
Figure 9Same as Fig. 8 but for March–April 2015.
In spring 2014, the CHIMERE model reproduces the high concentrations in the three regions of the domain identified in Figs. 2 and 3. Additional NH3 hotspots in the south-eastern part of the domain including the Po Valley, Switzerland, and the wine region between Besançon and Lyon (blue box in Fig. 8) are indicated by the CHIMERE model. NH3 emissions in this last region are comparable to the average agricultural plains over France. Only dispersion conditions related to wind speed and boundary layer height can explain high NH3 concentrations over this area.
In spring 2015, satellite observations and the CHIMERE model outputs exhibit very similar patterns in terms of high NH3 distributions, with however higher NH3 concentrations indicated by the model in the southern part of the domain (blue box in Fig. 9).

Figure 10Cluster analysis of 24 h backward trajectories arriving in spring in Paris (from 15 February to 15 May for the 2013–2016 period) using HYSPLIT-4 model obtained from the NOAA Air Resources Laboratory. Mean trajectories of the eight clusters are shown in different colours, associated with the NH3 concentrations measured by IASI in the IdF region (in molecules cm−2).
Finally, the (model-observations) differences between the standardized NH3 column derived from the satellite instruments in spring 2014–2015 and the corresponding NH3 columns derived from the CHIMERE model are shown in Fig. 2 of the Supplement. One can see that very similar patterns are presented when comparing the model to independent satellite observations from IASI and CrIS; the modelled NH3 concentrations are systematically lower for both years over Belgium and the United Kingdom and higher in the southern part of the domain (green square in Fig. S3), including the Pays de la Loire region (box C in Figs. 2 and 3), and the south-eastern part of the domain (over the northern Switzerland and the Plateau du Jura region, between the cities of Besançon and Lyon; blue box in Fig. 8). Reasons for enhanced NH3 columns derived from the model in this latter region are not clear yet. An explanation could be that the temporal distribution of the emissions is misrepresented in the model since the modelled concentrations are enhanced in April whereas the two satellite observations are enhanced earlier in March for both years. It is worth noting that there are no EMEP stations measuring surface NH3 concentrations in these regions. As for the Brittany–Pays de la Loire region, it has already been shown that the LOTOS-EUROS atmospheric model (Schaap et al., 2008) using similar chemistry schemes and NH3 emissions shows higher columns each year in this area (Van Damme et al., 2014b).
3.3 Comparisons of PM2.5 concentrations in IdF derived from the Airparif network and CHIMERE for 2014 and 2015
To evaluate the capacity of the model to reproduce PM2.5 concentrations over the Parisian region, comparisons between the Airparif measurements network and the CHIMERE outputs were performed for 2014 and 2015 (Fig. 11). For those years, concentrations of PM2.5 are measured hourly from the surface at 13 Airparif stations distributed over the IdF region (black dots in Fig. 1). To compare these measurements with the CHIMERE model, we have extracted the hourly surface PM2.5 outputs in the IdF region, i.e. within a 50 km radius circle from Paris.
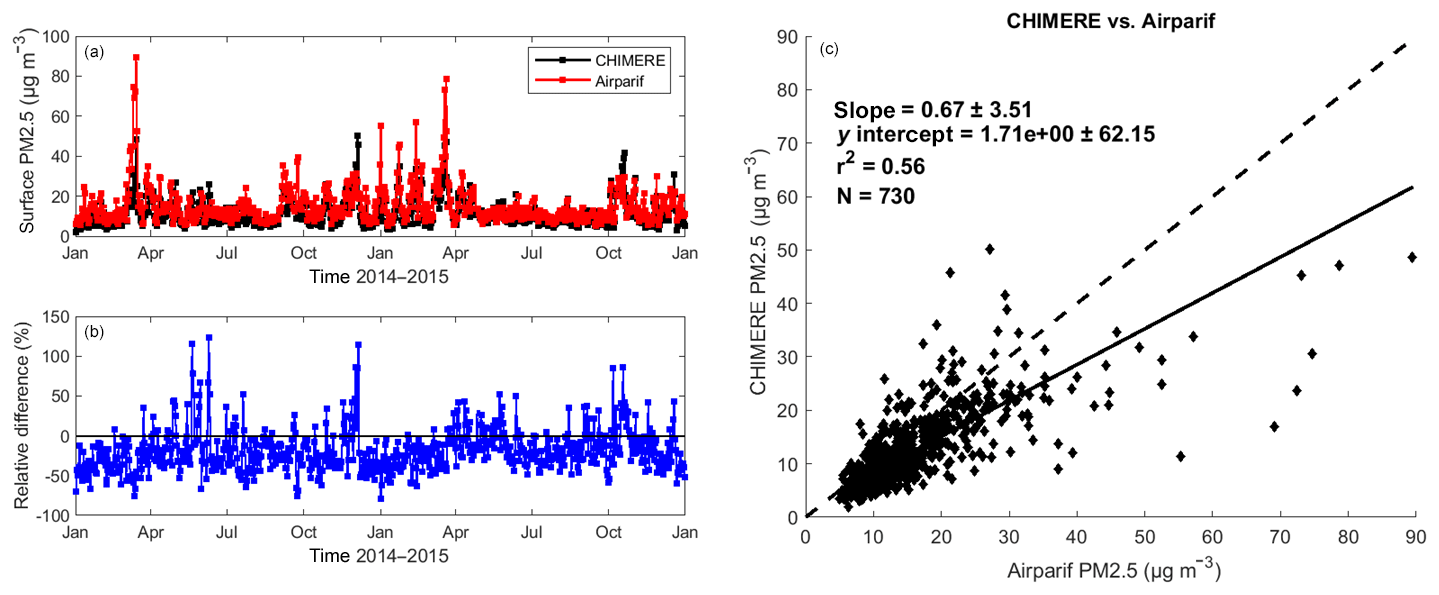
Figure 11Comparison between PM2.5 concentrations derived from the Airparif network and the CHIMERE model outputs. (a, b) Time series of the daily mean PM2.5 concentrations (in µg m−3) observed at the surface with the Airparif network (red) and calculated with the CHIMERE model (black), associated with relative differences (in %) calculated as model observations for 2014 and 2015. (c) Correlation plots between daily mean PM2.5 concentrations derived from the CHIMERE model versus the Airparif network.
Results of the comparison are shown in Fig. 11. Day-to-day variability in PM2.5 concentrations at the surface is well represented by the CHIMERE model with however differences during pollution events in March/April and in December for both years. The model may underestimate PM2.5 concentrations in spring due to unknown PM2.5 formation processes but overestimate them in winter, which could be due to uncertainties in NH3 emissions from wood burning processes. Overall, good agreement is found between the measurements and the model in terms of PM2.5 concentrations over the IdF region, given the values r2 = 0.56 (associated with p<0.05) and slope = 0.67±3.51, with a slight underestimation of the CHIMERE model, given a normalized mean bias (calculated as model-observations versus observations) of −18 % over 2014 and 2015.
3.4 Conditions for PM formation in the Paris megacity
To investigate the impact of intensive agriculture practices on the Paris megacity air quality, we need to better understand the role of NH3 in the formation of PM2.5. This process depends, among other factors, on specific meteorological conditions such as atmospheric temperature and humidity that alter the gas-particle partitioning. The link between high NH3 concentrations inducing PM2.5 formation in the Paris megacity is known (Petetin et al., 2016; Zhang et al., 2013), but quantification of such phenomena is difficult due the lack of long-term NH3 monitoring in the IdF region. PM2.5 is however measured hourly at several locations in Paris by the Airparif network (https://www.airparif.asso.fr/; last access: 10 January 2020; Fig. 1). Using the 10 years of IASI observations, observational evidence of PM2.5 formation in the IdF region (100 km around Paris; black box in Fig. 1) is represented in Fig. S4. Simultaneous enhancements in March of PM2.5 measured at the surface and NH3 columns derived from the IASI observations over the IdF region are clearly visible. However, high concentrations of NH3 observed in summer are not associated with high PM2.5 concentrations. This reflects the complexity of the PM2.5 formation depending on various factors, such as NH3 emissions, atmospheric chemistry (acidic content of the atmosphere), transport, and specific meteorological conditions involved in the gas to solid phase conversion between NH3 and ammonium salts.
To evaluate the impact of long-range transport on NH3 levels observed over the Parisian region (IdF) in spring, back trajectory analysis was performed. In total two hundred and thirty-one 24 h back trajectories ending in Paris (period from 15 February to 15 May for the years 2013 to 2016) were classified into eight clusters using HYSPLIT (https://ready.arl.noaa.gov/HYSPLIT.php; last access: 10 January 2020). Figure 10 shows the mean trajectories for each cluster associated with the average NH3 total columns measured by IASI over the IdF region. In this figure, higher NH3 columns are found under the influence of air masses transported from the northern part of the domain (over Belgium and the Netherlands, clusters 4 and 5) and the Brittany region (cluster 8), which are the major regions in the domain with sources of NH3 in spring, as previously identified (Figs. 2 and 3). Indeed, NH3 columns over the Netherlands are significantly correlated (at the 95 % confidence level) with NH3 columns measured over IdF since the cross-correlation function is 0.37 at lag = 0 and above 0.3 at lag = ±1 d over the whole time period (2008–2016 in Fig. S5). Clusters 2 and 3 (Fig. 10) are associated with intermediate NH3 levels since air masses moved slowly transporting NH3-rich air from rural regions near IdF (such as the Champagne-Ardennes region; box A in Figs. 2 and 3) to Paris. Finally, low NH3 concentrations are measured when air masses originating from ocean regions pass through continental areas with minor NH3 sources in spring (clusters 1, 6, and 7 in Fig. 10). This reflects the importance of long-range transport in the NH3 budget observed over the Paris megacity in spring.
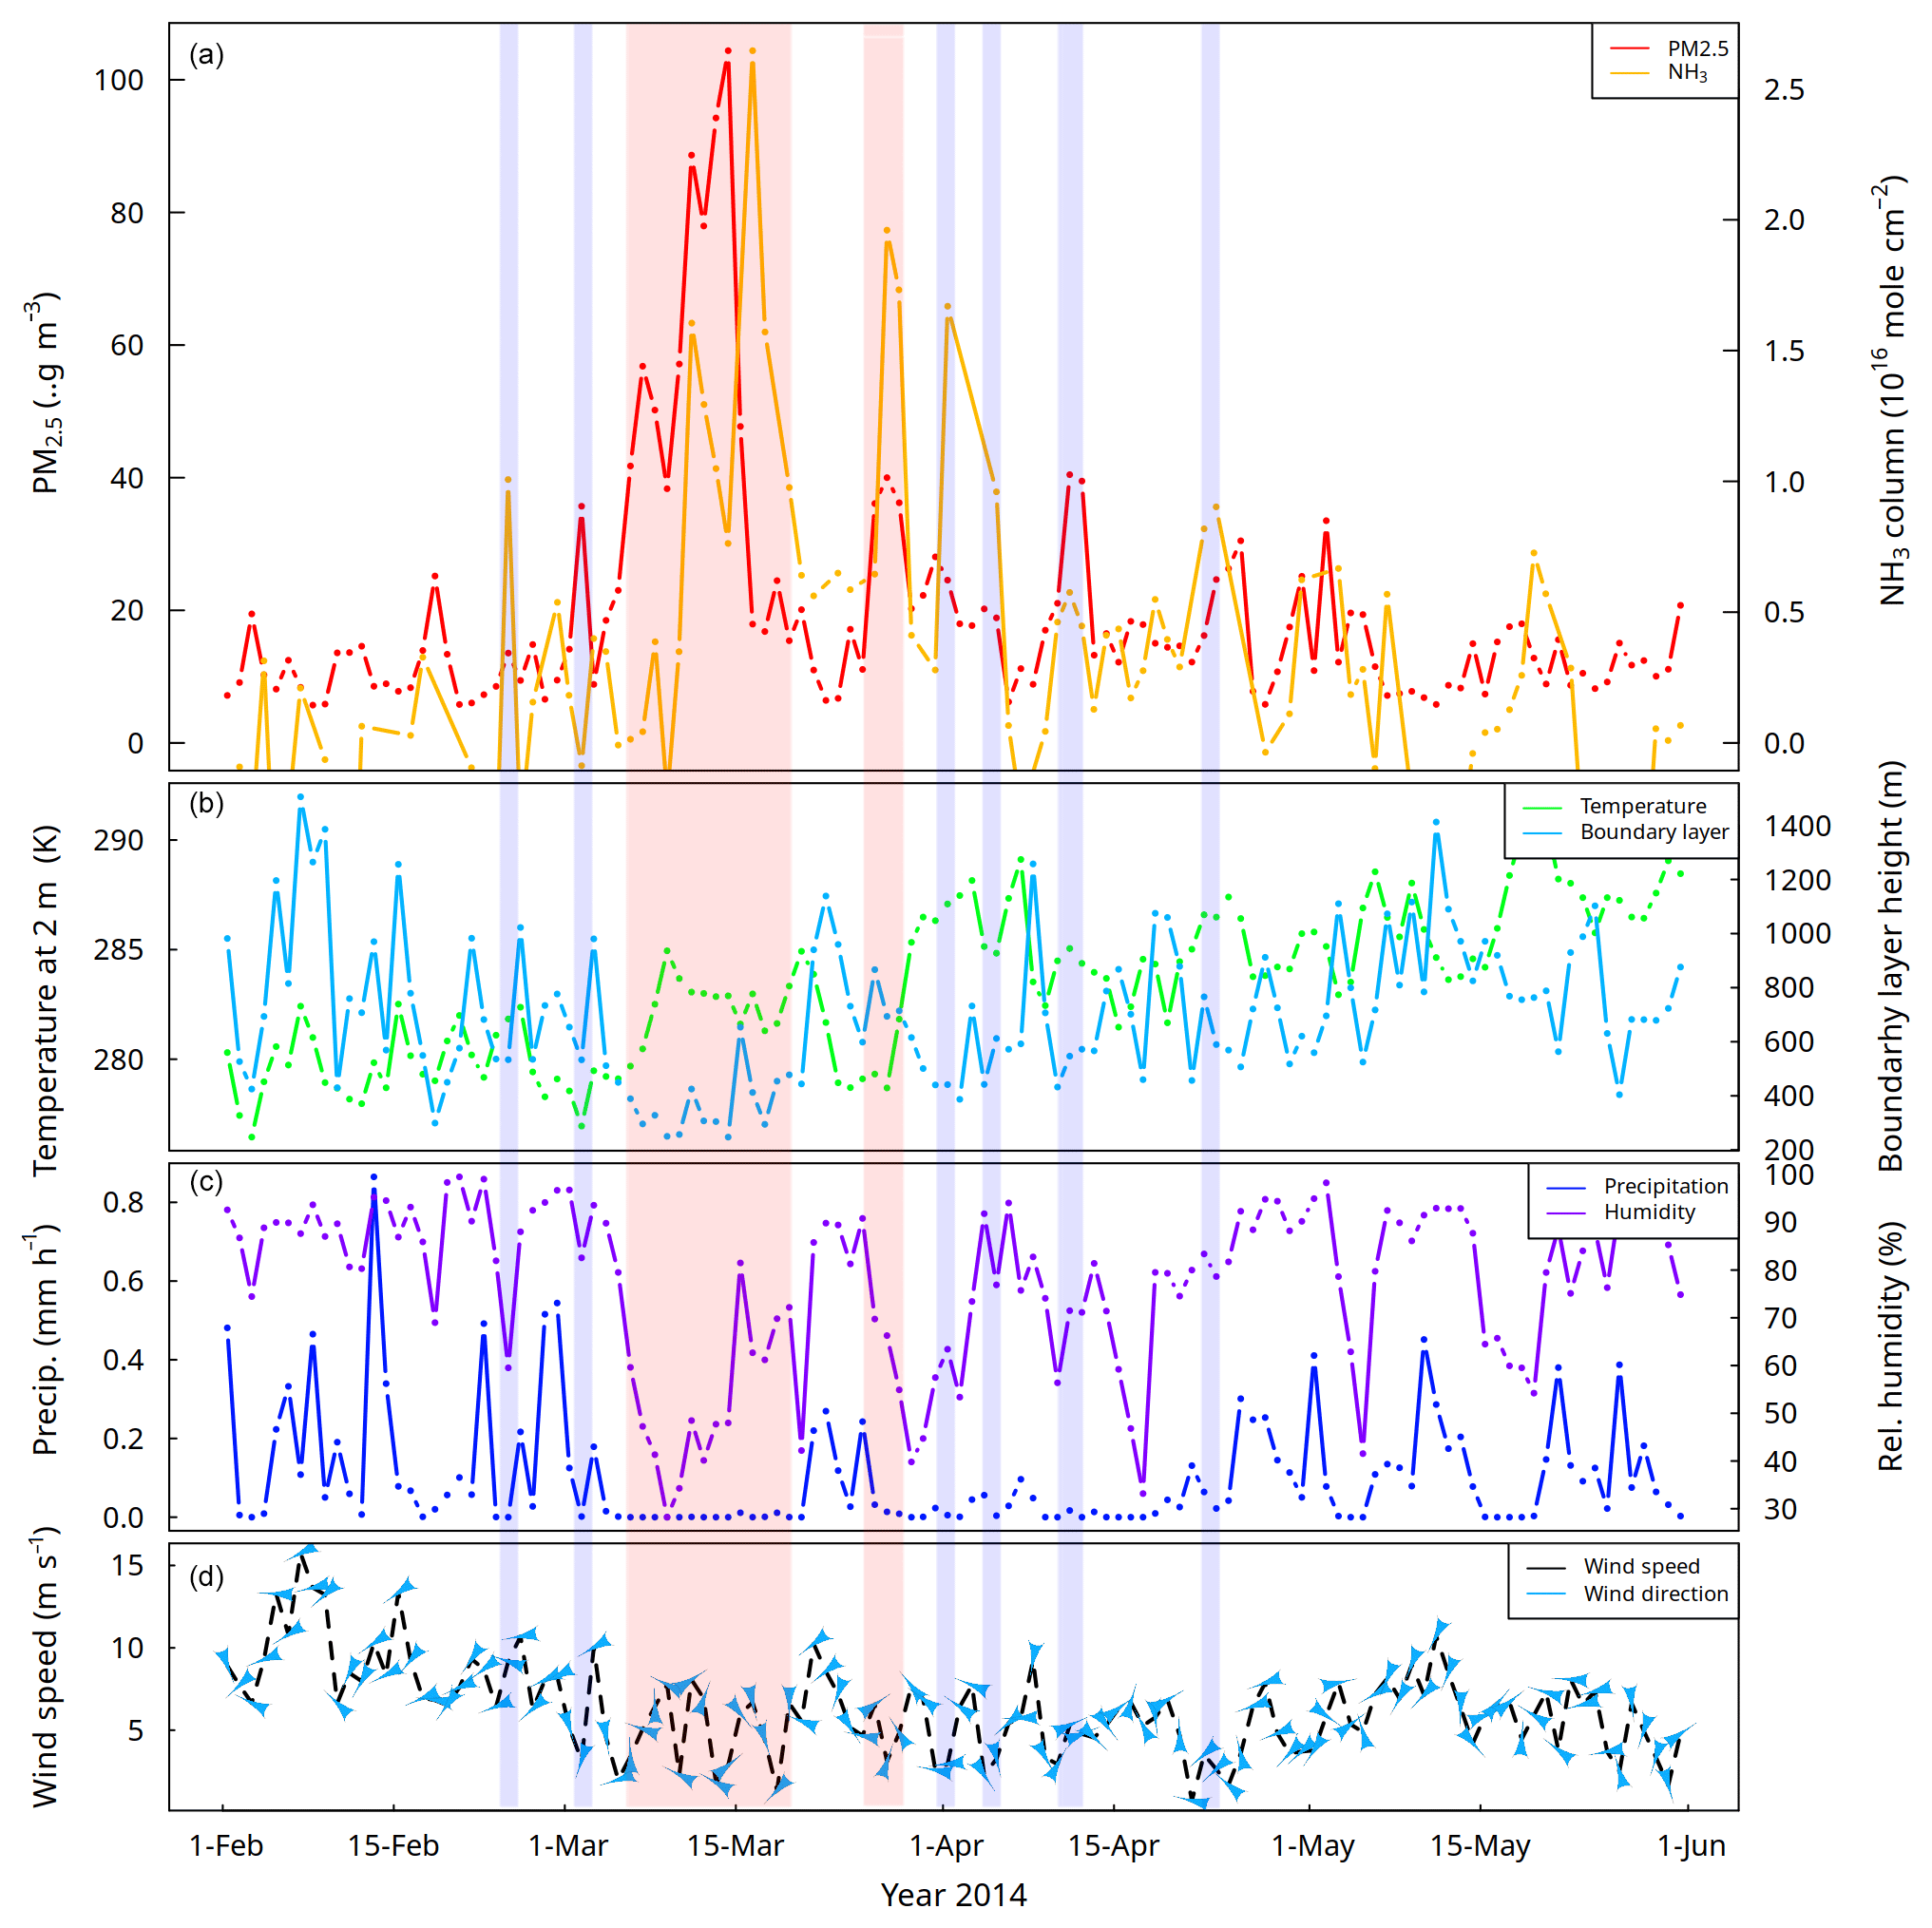
Figure 12Average concentrations of NH3 total columns derived from IASI observations (in molecules cm−2; orange; a) and PM2.5 derived from the Airparif network selected within 2 h from the IASI overpass (in µg m−3; red; a) for 2014 as an example. Periods of simultaneous (independent) enhancements of NH3 and PM concentrations are represented with red (blue) areas, i.e. in case A (case B). Temperature at 2 m (in kelvin; green; b), boundary layer height (in metres; blue; b), precipitation (in metres; dark blue; c), relative humidity (in percent; purple; c), and (d) wind speed and direction derived from the ECMWF ERA-5 data.
To quantitatively assess the influence of meteorological parameters on the formation of PM2.5 from NH3 in the IdF region, time series of NH3 total columns, PM2.5 surface concentrations, and five meteorological parameters (temperature at 2 m, boundary layer height, total precipitation, relative humidity, and wind field) derived from ECMWF ERA-5 data (Dee et al., 2011, Copernicus Climate Change Service (C3S, 2017) were analysed. To compute daily and monthly means, IASI NH3 total columns have been averaged over IdF (black box in Fig. 1), PM2.5 concentrations measured between 09:00 and 11:00 LT have been averaged over the 14 stations (dark points in Fig. 1), and ECMWF data have been averaged over a 300 km region around Paris (the blue box in Fig. 1). Figure 12 shows all these parameters for spring 2014.
We have flagged pollution episodes in both time series (PM2.5 and NH3) by selecting data 1σ (standard deviation) above the mean of the datasets from 2013 to 2016. This time period was selected to have the most IASI observations (combining Metop-A and Metop-B) in the IdF region. Then, two cases were defined to study the temporal correlation between NH3 and PM2.5, described as follows: case A in which both NH3 and PM2.5 pollution episodes appear simultaneously, i.e. within the same day or 2 d apart (shaded in red in Fig. 12); case B in which pollution episodes appear at least 3 d apart (shaded in blue in Fig. 12). In Fig. 12, a strong relationship between peaks of NH3, PM2.5, and meteorological parameters can be seen. For example, between 3 and 19 March 2014 (case A), the boundary layer height is exceptionally low (456 m compared to 760 m on average), the temperature is relatively low (280 compared to 282 K on average), and there is no precipitation (0.01 compared to 0.11 mm h−1 on average). Note that peaks of maximum NH3 observed in IdF on 11 and 12 March are associated with air masses coming from the northern part of the domain (clusters 4 and 5 in Fig. 10). In contrast, for case B in which the appearance of peaks of NH3 and PM2.5 is not simultaneous, meteorological conditions are different; the boundary layer is thicker (908 m on 23 April 2014) or the temperature is higher (285 K on 11 April 2014).
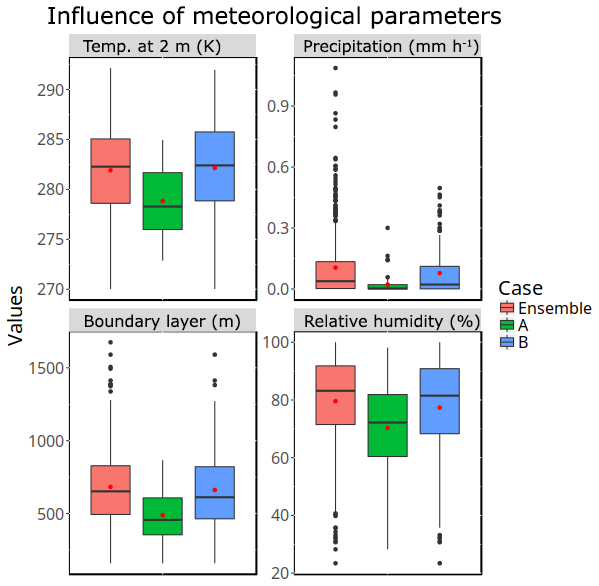
Figure 13Statistical distributions of meteorological parameters corresponding to case A (in which both NH3 and PM2.5 pollution episodes appear simultaneously, i.e. within the same day or 2 d apart), case B (in which pollution episodes appear at least 3 d apart), and all observations derived from 2013 to 2016. The number of observations (days) are 63 in case A, 154 in case B, and 481 for the ensemble. The medians and the quartiles are presented by centre lines and borders of the boxes, respectively. The mean values are indicated by red points, and the extreme values (i.e. those beyond Q1−1.5 IQR and Q3 + 1.5 IQR) are indicated by black points. The IQR is the “interquartile range”, and it equals Q3−Q1 where Q3 and Q1 are the 75th and 25th percentiles. Setting the thresholds at Q1−1.5 × IQR and Q3 + 1.5 × IQR is a common practice to determine outliers.
To further investigate the influence of meteorological parameters on pollution episodes in the IdF region, a detailed analysis has been made for the study period. Figure 13 shows the statistical distribution of meteorological parameters corresponding to case A, case B, and all observations. It should be noted that for the study period the boundary layer height is significantly (p<0.01) lower in case A (550±205 m) than in case B (751±276 m) and precipitation is absent in case A (0.019 mm h−1) compared to case B (0.085 mm h−1). The temperature at 2 m also differs between the two cases (case A: 278±3 K; case B: 282±4 K), but the humidity is almost the same (70 % ± 17 % versus 75 % ± 18 %). Results also suggest that simultaneous enhancements of NH3 and PM2.5 over Paris (cases A) are mainly associated with wind fields dominantly coming from the north-east part of the domain (Fig. S6). Thus the combination of the following four meteorological parameters, low surface temperatures (5 ∘C), thin boundary layers (∼500 m), almost no precipitation, and north-east wind, favours simultaneous appearances of NH3 and PM2.5 in Paris (i.e. case A) . In addition, the Wilcoxon–Mann–Whitney test (Wilks, 2011, not shown here) indicates that each single parameter has no significant influence on the NH3−PM2.5 correlation. Therefore only a combination of these different parameters has an impact on secondary aerosol formation from NH3.
An explanation of these findings might be that anticyclonic conditions (in the low planetary boundary layer), preventing pollutant dispersions in the lower atmosphere (Salmond and McKendry, 2005), along with moderate north-east wind fields allow NH3 plumes to be transported from rural to urban regions (Petit et al., 2015). In addition, thanks to relatively low atmospheric temperatures and a moderate relative humidity, conversion of gas-phase NH3 to ammonium salts is accentuated via optimal phase equilibrium (Watson et al., 1994; Nenes et al., 1998). Finally, with an absence of rain, ammonium salts are stabilized in the aerosols.
Our observations are in agreement with previous studies (Bessagnet et al., 2016; Wang et al., 2015), which have shown that the formation of ammonium salt needs a specific humidity of 60 %–70 %, mainly because it corresponds to the deliquescence point of NH4NO3 in ambient air. This is in agreement with our results since the mean relative humidity in case A is 70 %. Our results also support the idea that a relatively low atmospheric temperature favours PM2.5 formation in particular since the phase equilibrium leads to NH4NO3 decomposition above 30 ∘C.
This study focuses on seasonal and interannual variabilities in NH3 concentrations in a 400 km radius circle area around Paris to assess the evolution of major NH3 agricultural sources and its key role in the formation of the secondary aerosols that affect air quality over the Paris megacity.
Thanks to 10 and 5 years of regional NH3 observations derived from IASI and CrIS, three main regions of high NH3 occurring between March and August were identified. Observed interannual variabilities in NH3 concentrations have been discussed with respect to total precipitation and atmospheric temperature, showing that total precipitation is anti-correlated with high NH3 concentrations, and mild temperature in late winter might cause early fertilizer spreading due to an advanced phenological growth stage.
To evaluate our knowledge of agricultural emissions in terms of intensity and both spatial and temporal distributions, coincident CHIMERE model outputs have been compared to satellite observations from IASI and CrIS for 2014 and 2015. The annual cycle is well reproduced by the model, but it is only able to reproduce half of the observed atmospheric NH3 variability. Focusing on spring periods (March–April 2014 and 2015) of episodic NH3 emissions, the two independent satellite observations derived from IASI and CrIS show very similar spatial distributions of high NH3 concentrations, as well as their evolution in time. The comparison between CHIMERE NH3 columns and coincident satellite observations highlights the same difference in spatial patterns with a systematic underestimation of NH3 concentrations from the model over Belgium and an overestimation in the southern part of the domain (French Brittany–Pays de la Loire and Plateau du Jura regions, as well as northern Switzerland).
Focusing on the Île-de-France (IdF; 100 km around Paris) region, we found that air masses originating from NH3-rich areas, mainly in the northern part of the domain over Belgium and the Netherlands, increase the observed NH3 total columns measured by IASI over the urban area of Paris. In this region, we also found that the CHIMERE model is able to reproduce the day-to-day variability in PM2.5 concentrations (r2 = 0.56), with however an underestimation during spring pollution events, which could be due to unknown secondary aerosol formation processes.
To assess the link between NH3 and PM2.5 over the Parisian (IdF) region, the main meteorological parameters driving the optimal conditions involved in the PM2.5 formation have been identified. The results show that relatively a low temperature and thin boundary layer, coupled with almost no precipitation and wind coming from the north-east, favour PM2.5 formation with the presence of atmospheric NH3 in the IdF region. Based on a more observational approach over a large timescale, this work is in agreement with previous studies.
This study highlights the need for a better representative NH3 monitoring to improve the numerical simulation of spatial and temporal NH3 variabilities, especially at fine scales. In order to compare IASI and CrIS data in absolute values (comparisons of the derived columns instead of the standardized ones), it would be recommended to derive both datasets using the same retrieval algorithm. Thus, by combining these datasets bi-daily NH3 total columns in absolute values at the regional scale would be provided. This would help with inferring variability in top-down NH3 emissions. Complementarily, long-term quantification of the NH3 diurnal cycle inside Paris would improve comparisons, with local PM2.5 needed to understand secondary aerosols formations. For this purpose, ongoing activity consists of the deployment of a mini-DOAS instrument (Volten et al., 2012) used for long-term and continuous monitoring of atmospheric NH3 concentrations in the centre of Paris from the QUALAIR platform (https://www.ipsl.fr/en/Our-research/Atmospheric-chemistry-and-air-quality/Tropospheric-chemistry/QUALAIR; last access: 10 January 2020). Finally, the geostationary-orbit sounder IRS-MTG (Stuhlmann et al., 2005), to be launched after 2022, will provide NH3 columns at a very high sampling rate (every 0.5 h over Europe) with an unprecedented spatial resolution (pixel size of 4 km).
The near-real-time IASI NH3 (ANNI NH3-v2.1R) data used in this study are freely available through the Aeris database https://iasi.aeris-data.fr/nh3r-i/ (Van Damme et al., 2017) (last access: 3 December 2019). The CrIS data and CHIMERE outputs are currently available upon request. All MATLAB codes used to create any of the figures and/or to create the underlying data are available on request.
The supplement related to this article is available online at: https://doi.org/10.5194/acp-20-577-2020-supplement.
CV wrote the paper with contributions from all coauthors. CV and CC designed the study. MV, LC, and SW performed IASI retrievals and ED, MWS, and KEC performed the CrIS retrievals. FM ran the CHIMERE simulations. CV and TW analysed the data with guidance from CC and PFC. All authors discussed the results and contributed to the final paper.
The authors declare that they have no conflict of interest.
IASI is a joint mission of EUMETSAT and the Centre National d'Etudes Spatiales (CNES, France). This work was supported by the CNES. It is based on observations with IASI onboard Metop. The IASI Level 1C data are distributed in near real time by EUMETSAT through the EUMETCast system distribution. The authors acknowledge the Aeris data infrastructure (http://iasi.aeris-data.fr/NH3/; last access: 10 January 2020) for providing access to the IASI level 1C data and level 2 NH3 data used in this study. The French scientists are grateful to CNES (TOSCA) and the Centre National de la Recherche Scientifique (CNRS) for financial support. The research in Belgium is also funded by the Belgian Federal Office for Scientific, Technical and Cultural Affairs and the European Space Agency (ESA Prodex IASI Flow project). The CrIS Fast Physical Retrieval (CFPR) NH3 data are provided through a joint collaboration between Environment and Climate Change Canada (ECCC) and Atmospheric and Environmental Research (AER), Inc. (USA). The level 1 and level 2 input data for CFPR were obtained from the University of Wisconsin–Madison Space Science and Engineering Center (SSEC) and the NOAA Comprehensive Large Array-data Stewardship System (CLASS) (Liu et al., 2014), with special thanks to Axel Graumann (NOAA).
This paper was edited by Jayanarayanan Kuttippurath and reviewed by two anonymous referees.
Battye, W., Aneja, V. P., and Schlesinger W. H.: Is nitrogen the next carbon?, Earth's Future, 5, 894–904, https://doi.org/10.1002/2017EF000592, 2017.
Beer, R., Shephard, M. W., Kulawik, S. S., Clough, S. A., Eldering, A., Bowman, K. W., Sander, S. P., Fisher, B. M., Payne, V. H., Luo, M., Osterman, G. B., and Worden, J. R.: First satellite observations of lower tropospheric ammonia and methanol, Geophys. Res. Lett., 35, L09801, https://doi.org/10.1029/2008GL033642, 2008.
Behera, S. N., Sharma, M., Aneja, V. P., and Balasubramanian, R.: Ammonia in the atmosphere: a revieon emission sources, atmospheric chemistry and deposition on terrestrial bodies, Environ. Sci. Pollut. Res. Int., 20, 8092–8131, https://doi.org/10.1007/s11356-013-2051-9, 2013.
Bessagnet, B., Meleux, F., Favez, O., Beauchamp, M., Colette, A., Couvidat, F., Rouïl, L., and Menut, L.: Le rôle de l'agriculture sur les concentrations en particules dans l'atmosphère et l'apport de la modélisation (the role of agriculture on the concentrations of particles in the atmosphere and supply modeling), Pollution atmosphérique, climat, santé, Société, 229, 154–165, 2016.
Bey, I., Jacob, D. J., Yantosca, R. M., Logan, J. A., Field, B., Fiore, A. M., Li, Q., Liu, H., Mickley, L. J., and Schultz, M.: Global modeling of tropospheric chemistry with assimilated meteorology: Model description and evaluation, J. Geophys. Res., 106, 23073–23096, 2001.
CEIP: Centre on Emission Inventories and Projections, “EMEP officially reported emission data”, available at: http://www.ceip.at/ms/ceip_home1/ceip_home/webdab_emepdatabase/reported_emissiondata/, last access: July 2018.
CITEPA: Centre Interprofessionnel Technique d'Etudes de la Pollution Atmosphérique, Format SECTEN, available at: https://www.citepa.org/fr/air-et-climat/polluants/aep-item/ammoniac, last access: April 2018.
Clarisse, L., Clerbaux, C., Dentener, F., Hurtmans, D., and Coheur, P.-F.: Global ammonia distribution derived from infrared satellite observations, Nat. Geosci., 2, 479–483, https://doi.org/10.1038/ngeo551, 2009.
Clarisse, L., Shephard, M., Dentener, F., Hurtmans, D., Cady-Pereira, K., Karagulian, F., Van Damme, M., Clerbaux, C., and Coheur, P.-F.: Satellite monitoring of ammonia: A case study of the San Joaquin Valley, J. Geophys. Res., 115, D13302, https://doi.org/10.1029/2009JD013291, 2010.
Clerbaux, C., Boynard, A., Clarisse, L., George, M., Hadji-Lazaro, J., Herbin, H., Hurtmans, D., Pommier, M., Razavi, A., Turquety, S., Wespes, C., and Coheur, P.-F.: Monitoring of atmospheric composition using the thermal infrared IASI/MetOp sounder, Atmos. Chem. Phys., 9, 6041–6054, https://doi.org/10.5194/acp-9-6041-2009, 2009.
Copernicus Climate Change Service (C3S): ERA5: Fifth generation of ECMWF atmospheric reanalyses of the global climate, Copernicus Climate Change Service Climate Data Store (CDS), available at: https://cds.climate.copernicus.eu/cdsapp/#!/home (last access: 10 January 2020), 2017.
Couvidat, F., Bessagnet, B., Garcia-Vivanco, M., Real, E., Menut, L., and Colette, A.: Development of an inorganic and organic aerosol model (CHIMERE 2017β v1.0): seasonal and spatial evaluation over Europe, Geosci. Model Dev., 11, 165–194, https://doi.org/10.5194/gmd-11-165-2018, 2018.
Corso, M., Medina, S., and Tillier, C.: Quelle est la part des pics de pollution dans les effets à court terme de la pollution de l'air sur la santé dans les villes de France? Saint-Maurice: Santé publique France, ISBN 979-10-289-0259-9, 2016.
Dammers, E., Palm, M., Van Damme, M., Vigouroux, C., Smale, D., Conway, S., Toon, G. C., Jones, N., Nussbaumer, E., Warneke, T., Petri, C., Clarisse, L., Clerbaux, C., Hermans, C., Lutsch, E., Strong, K., Hannigan, J. W., Nakajima, H., Morino, I., Herrera, B., Stremme, W., Grutter, M., Schaap, M., Wichink Kruit, R. J., Notholt, J., Coheur, P.-F., and Erisman, J. W.: An evaluation of IASI-NH3 with ground-based Fourier transform infrared spectroscopy measurements, Atmos. Chem. Phys., 16, 10351–10368, https://doi.org/10.5194/acp-16-10351-2016, 2016.
Dammers, E., Shephard, M. W., Palm, M., Cady-Pereira, K., Capps, S., Lutsch, E., Strong, K., Hannigan, J. W., Ortega, I., Toon, G. C., Stremme, W., Grutter, M., Jones, N., Smale, D., Siemons, J., Hrpcek, K., Tremblay, D., Schaap, M., Notholt, J., and Erisman, J. W.: Validation of the CrIS fast physical NH3 retrieval with ground-based FTIR, Atmos. Meas. Tech., 10, 2645–2667, https://doi.org/10.5194/amt-10-2645-2017, 2017.
Dee, D. P., Uppala, S. M., Simmons, A. J., Berrisford, P., Poli, P., Kobayashi, S., Andrae, U., Balmaseda, M. A., Balsamo, G., Bauer, P., Bechtold, P., Beljaars, A. C. M., van de Berg, L., Bidlot, J., Bormann, N., Delsol, C., Dragani, R., Fuentes, M., Geer, A. J., Haimberger, L., Healy, S. B., Hersbach, H., Hólm, E. V., Isaksen, L., Kållberg, P., Köhler, M., Matricardi, M., McNally, A. P., Monge-Sanz, B. M., Morcrette, J.-J., Park, B.-K., Peubey, C., de Rosnay, P., Tavolato, C., Thépaut, J.-N., and Vitart, F.: The ERA-Interim reanalysis: configuration and performance of the data assimilation system, Q. J. Roy. Meteor. Soc., 137, 553–597, https://doi.org/10.1002/qj.828, 2011.
Erisman, J. W., Sutton, M. A., Galloway, J. N., Klimont, Z., and Winiwarter, W.: How a century of ammonia synthesis changed the world, Nat. Geosci., 1, 636–639, https://doi.org/10.1038/ngeo325, 2008.
Fortems-Cheiney, A., Dufour, G., Hamaoui-Laguel, L., Foret, G., Siour, G., Van Damme, M., Meleux, F., Coheur, P.-F., Clerbaux, C., Clarisse, L., Favez, O., Wallasch, M., and Beekmann, M.: Unaccounted variability in NH3 agricultural sources detected by IASI contributing to European spring haze episode, Geophys. Res. Lett., 43, 5475–5482, https://doi.org/10.1002/2016GL069361, 2016.
Fuzzi, S., Baltensperger, U., Carslaw, K., Decesari, S., Denier van der Gon, H., Facchini, M. C., Fowler, D., Koren, I., Langford, B., Lohmann, U., Nemitz, E., Pandis, S., Riipinen, I., Rudich, Y., Schaap, M., Slowik, J. G., Spracklen, D. V., Vignati, E., Wild, M., Williams, M., and Gilardoni, S.: Particulate matter, air quality and climate: lessons learned and future needs, Atmos. Chem. Phys., 15, 8217–8299, https://doi.org/10.5194/acp-15-8217-2015, 2015.
Galloway, J. N., Aber, J. D., Erisman, J. W., Seitzinger, S. P., Howarth, R. W., Cowling, E. B., and Cosby, B. J.: The Nitrogen Cascade, Bioscience, 53, 341–356, https://doi.org/10.1641/0006-3568(2003)053[0341:TNC]2.0.CO;2, 2003.
Gong, L., Lewicki, R., Griffin, R. J., Tittel, F.K., Lonsdale, C. R., Stevens, R. G., Pierce, J. R., Malloy, Q. G. J., Travis, S. A., Bobmanuel, L. M., Lefer, B. L., and Flynn, J. H.: Role of atmospheric ammonia in particulate matter formation in Houston during summertime, Atmos. Environ, 77, 893–900, https://doi.org/10.1016/j.atmosenv.2013.04.079, 2013.
Hamaoui-Laguel, L., Meleux, F., Beekmann, M., Bessagnet, B., Génermont, S., Cellier, P., and Létinois, L.: Improving ammonia emissions in air quality modelling for France, Atmos. Environ., 92, 584–595, https://doi.org/10.1016/j.atmosenv.2012.08.002, 2014.
Heald, C. L., Collett Jr., J. L., Lee, T., Benedict, K. B., Schwandner, F. M., Li, Y., Clarisse, L., Hurtmans, D. R., Van Damme, M., Clerbaux, C., Coheur, P.-F., Philip, S., Martin, R. V., and Pye, H. O. T.: Atmospheric ammonia and particulate inorganic nitrogen over the United States, Atmos. Chem. Phys., 12, 10295–10312, https://doi.org/10.5194/acp-12-10295-2012, 2012.
Hernández, D. L., Vallano, D. M., Zavaleta, E. S., Tzankova, Z., Pasari, J. R., Weiss, S., Selmants, P. C., and Morozumi, C.: Nitrogen Pollution Is Linked to US Listed Species Declines, Bioscience, 66, 213–222, https://doi.org/10.1093/biosci/biw003, 2016.
Holland, E. A., Bertman, S. B., Carroll, M. A., Guenther, A. B., Shepson, P. B., Sparks, J. P., and Lee-Taylor, J.: U.S. Nitrogen Science Plan Focuses Collaborative Efforts, EOS T. Am. Geophys. Un., 86, 253–260, 2005.
Isbell, F., Reich, P. B., Tilman, D., Hobbie, S. E., Polasky, S., and Binder S.: Nutrient enrichment, biodiversity loss, and consequent declines in ecosystem productivity, P. Natl. Acad. Sci. USA, 110, 11911–11916, https://doi.org/10.1073/pnas.1310880110, 2013.
Kaiser, J. W., Heil, A., Andreae, M. O., Benedetti, A., Chubarova, N., Jones, L., Morcrette, J.-J., Razinger, M., Schultz, M. G., Suttie, M., and van der Werf, G. R.: Biomass burning emissions estimated with a global fire assimilation system based on observed fire radiative power, Biogeosciences, 9, 527–554, https://doi.org/10.5194/bg-9-527-2012, 2012.
Kharol, S. K., Shephard, M. W., McLinden, C. A., Zhang, L., Sioris, C. E., O'Brien, J. M., Vet, R., Cady-Pereira, K. E., Hare, E., Siemons, J., and Krotkov, N. A..: Dry deposition of reactive nitrogen from satellite observations of ammonia and nitrogen dioxide over North America, Geophys. Res. Lett., 45, 1157–1166, https://doi.org/10.1002/2017GL075832, 2018.
Kranenburg, R., Hendriks, C., Kuenen, J., and Schaap, M.: Improved Modelling of Ammonia by Using Manure Transport Data, in: International Technical Meeting on Air Pollution Modelling and its Application, Springer, 483–486 2016.
Kuenen, J. J. P., Visschedijk, A. J. H., Jozwicka, M., and Denier van der Gon, H. A. C.: TNO-MACC_II emission inventory; a multi-year (2003–2009) consistent high-resolution European emission inventory for air quality modelling, Atmos. Chem. Phys., 14, 10963–10976, https://doi.org/10.5194/acp-14-10963-2014, 2014.
Li, Y., Thompson, T. M., Van Damme, M., Chen, X., Benedict, K. B., Shao, Y., Day, D., Boris, A., Sullivan, A. P., Ham, J., Whitburn, S., Clarisse, L., Coheur, P.-F., and Collett Jr., J. L.: Temporal and spatial variability of ammonia in urban and agricultural regions of northern Colorado, United States, Atmos. Chem. Phys., 17, 6197–6213, https://doi.org/10.5194/acp-17-6197-2017, 2017.
Mailler, S., Menut, L., Khvorostyanov, D., Valari, M., Couvidat, F., Siour, G., Turquety, S., Briant, R., Tuccella, P., Bessagnet, B., Colette, A., Létinois, L., Markakis, K., and Meleux, F.: CHIMERE-2017: from urban to hemispheric chemistry-transport modeling, Geosci. Model Dev., 10, 2397–2423, https://doi.org/10.5194/gmd-10-2397-2017, 2017.
Menut, L., Bessagnet, B., Khvorostyanov, D., Beekmann, M., Blond, N., Colette, A., Coll, I., Curci, G., Foret, G., Hodzic, A., Mailler, S., Meleux, F., Monge, J.-L., Pison, I., Siour, G., Turquety, S., Valari, M., Vautard, R., and Vivanco, M. G.: CHIMERE 2013: a model for regional atmospheric composition modelling, Geosci. Model Dev., 6, 981–1028, https://doi.org/10.5194/gmd-6-981-2013, 2013.
Moran, M. D., Dastoor, A., and Morneau, G.: Long-Range Transport of Air Pollutants and Regional and Global Air Quality Modelling, edited by: Taylor, E. and McMillan, A., Air Quality Management, Springer, Dordrecht, 215–220, https://doi.org/10.1007/978-94-007-5577-2_4, 2014.
Moncet, J.-L., Uymin, G., Lipton, A. E., and Snell, H. E.: Infrared radiance modeling by optimal spectral sampling, J. Atmos. Sci., 65, 3917–3934, https://doi.org/10.1175/2008JAS2711.1, 2008.
Myhre, G., Samset, B. H., Schulz, M., Balkanski, Y., Bauer, S., Berntsen, T. K., Bian, H., Bellouin, N., Chin, M., Diehl, T., Easter, R. C., Feichter, J., Ghan, S. J., Hauglustaine, D., Iversen, T., Kinne, S., Kirkevåg, A., Lamarque, J.-F., Lin, G., Liu, X., Lund, M. T., Luo, G., Ma, X., van Noije, T., Penner, J. E., Rasch, P. J., Ruiz, A., Seland, Ø., Skeie, R. B., Stier, P., Takemura, T., Tsigaridis, K., Wang, P., Wang, Z., Xu, L., Yu, H., Yu, F., Yoon, J.-H., Zhang, K., Zhang, H., and Zhou, C.: Radiative forcing of the direct aerosol effect from AeroCom Phase II simulations, Atmos. Chem. Phys., 13, 1853–1877, https://doi.org/10.5194/acp-13-1853-2013, 2013.
National Emission Ceilings Directive (NEC) reporting status: available at: https://www.eea.europa.eu/themes/air/national-emission-ceilings/nec-directive-reporting-status-2018 (last access: 10 January 2020), 2018.
Nenes, A., Pandis, S. N., and Pilinis, C.: ISORROPIA: A New Thermodynamic Equilibrium Model for Multiphase Multicomponent Inorganic Aerosols, Aquat. Geoch., 4, 123–152, 1998.
Nenes, A., Pandis, S. N., and Pilinis, C.: ISORROPIA: A New Thermodynamic Equilibrium Model for Multiphase Multicomponent Inorganic Aerosols, Aquat. Geoch., 4, 123–152, 1998.
Nowak, J. B., Neuman, J. A., Bahreini, R., Middlebrook, A. M., Holloway, J. S., McKeen, S. A., Parrish, D. D., Ryerson, T. B., and Trainer, M.: Ammonia sources in the California South Coast Air Basin and their impact on ammonium nitrate formation, Geophys. Res. Lett., 39, L07804, https://doi.org/10.1029/2012GL051197, 2012.
Petetin, H., Sciare, J., Bressi, M., Gros, V., Rosso, A., Sanchez, O., Sarda-Estève, R., Petit, J.-E., and Beekmann, M.: Assessing the ammonium nitrate formation regime in the Paris megacity and its representation in the CHIMERE model, Atmos. Chem. Phys., 16, 10419–10440, https://doi.org/10.5194/acp-16-10419-2016, 2016.
Petit, J.-E., Favez, O., Sciare, J., Crenn, V., Sarda-Estève, R., Bonnaire, N., Močnik, G., Dupont, J.-C., Haeffelin, M., and Leoz-Garziandia, E.: Two years of near real-time chemical composition of submicron aerosols in the region of Paris using an Aerosol Chemical Speciation Monitor (ACSM) and a multi-wavelength Aethalometer, Atmos. Chem. Phys., 15, 2985–3005, https://doi.org/10.5194/acp-15-2985-2015, 2015.
Petit, J.-E., Amodeo, T., Meleux, F., Bessagnet, B., Menut, L., Grenier, D., Pellan, Y., Ockler, A., Rocq, B., Gros, V., Sciare, J., and Favez, O.: Characterising an intense PM pollution episode in March 2015 in France from multi-site approach and near real time data: Climatology, variabilities, geographical origins and model evaluation, Atmos. Environ., 155, 68–84, https://doi.org/10.1016/j.atmosenv.2017.02.012, 2017.
Pinder, R. W., Adams, P. J., Pandis, S. N., and Gilliland, A. B.: Temporally resolved ammonia emission inventories: current estimates, evaluation tools, and measurement needs, J. Geophys. Res., 111, D16310, https://doi.org/10.1029/2005JD006603, 2006.
Pope III, C. A., Ezzati M., and Dockery, D. W.: Fine-particulate air pollution and life expectancy in the United States, New England J. Med., 360, 376–386, 2009.
Ramanantenasoa, M. M. J., Gilliot, J.-M., Mignolet, C., Bedos, C., Mathias, E., Eglin, T., Makowski, D., and Génermont, S.: A new framework to estimate spatio-temporal ammonia emissions due to nitrogen fertilization in France, Sci. Tot. Environ., 645, 205–219, https://doi.org/10.1016/j.scitotenv.2018.06.202, 2018.
Robinson, T. P, Wint, G. R. W., Conchedda, G., Van Boeckel, T. P., Ercoli, V., Palamara, E.,Cinardi, G., D'Aietti, L., Hay, S., and Gilbert, M.: Mapping the global distribution of livestock, Plos One, 9, e96084, https://doi.org/10.1371/journal.pone.0096084, 2014.
Rockström, J., Steffen, W., Noone, K., Persson, A., Chapin Iii, F. S., Lambin, E. F., Lenton, T. M., Scheffer, M., Folke, C., Schellnhuber, H. J., Nykvist, B., de Wit, C. A., Hughes, T., van der Leeuw, S., Rodhe, H., Sörlin, S., Snyder, P. K., Costanza, R., Svedin, U., Falkenmark, M., Karlberg, L., Corell, R. W., Fabry, V. J., Hansen, J., Walker, B., Liverman, D., Richardson, K., Crutzen, P., and Foley, J. A.: Planetary boundaries: Exploring the safe operating space for humanity, Ecol. Soc., 14, http://www.ecologyandsociety.org/vol14/iss2/art32/, 2009.
Rodgers, C. D.: Inverse Methods for Atmospheric Sounding: Theory and Practice, Vol. 2 of Series on Atmospheric, Oceanic and Planetary Physics, edited by: Taylor, F. W., World Scientific, 1:11, 2000.
Salmond, J. A. and McKendry, I. G.: A Review of Turbulence in the Very Stable Nocturnal Boundary Layer and Its Implications for Air Quality, Prog. Phys. Geog., 29, 171–188, 2005.
Scarlat, N., Fahl, F., Dallemand, J.-F., Monforti, F., and Motola, V.: A spatial analysis of biogas potential from manure in Europe, Renew. Sustain. Energy Rev., 94, 915–930, https://doi.org/10.1016/j.rser.2018.06.035, 2018.
Schaap, M., Timmermans, R., Roemer, M., Boersen, G., Builtjes, P., Sauter, F., Velders, G., and Beck, J.: The LOTOS-EUROS model: Description, validation and latest developments, Int. J. Environ. Pollut., 32, 270–290, https://doi.org/10.1504/IJEP.2008.017106, 2008.
Schiferl, L. D., Heald, C. L., Van Damme, M., Clarisse, L., Clerbaux, C., Coheur, P.-F., Nowak, J. B., Neuman, J. A., Herndon, S. C., Roscioli, J. R., and Eilerman, S. J.: Interannual variability of ammonia concentrations over the United States: sources and implications, Atmos. Chem. Phys., 16, 12305–12328, https://doi.org/10.5194/acp-16-12305-2016, 2016.
Shephard, M. W. and Cady-Pereira, K. E.: Cross-track Infrared Sounder (CrIS) satellite observations of tropospheric ammonia, Atmos. Meas. Tech., 8, 1323–1336, https://doi.org/10.5194/amt-8-1323-2015, 2015.
Shephard, M. W., Cady-Pereira, K. E., Luo, M., Henze, D. K., Pinder, R. W., Walker, J. T., Rinsland, C. P., Bash, J. O., Zhu, L., Payne, V. H., and Clarisse, L.: TES ammonia retrieval strategy and global observations of the spatial and seasonal variability of ammonia, Atmos. Chem. Phys., 11, 10743–10763, https://doi.org/10.5194/acp-11-10743-2011, 2011.
Skjøth, C. A., Geels, C., Berge, H., Gyldenkærne, S., Fagerli, H., Ellermann, T., Frohn, L. M., Christensen, J., Hansen, K. M., Hansen, K., and Hertel, O.: Spatial and temporal variations in ammonia emissions – a freely accessible model code for Europe, Atmos. Chem. Phys., 11, 5221–5236, https://doi.org/10.5194/acp-11-5221-2011, 2011.
Skyllakou, K., Murphy, B. N., Megaritis, A. G., Fountoukis, C., and Pandis, S. N.: Contributions of local and regional sources to fine PM in the megacity of Paris, Atmos. Chem. Phys., 14, 2343–2352, https://doi.org/10.5194/acp-14-2343-2014, 2014.
Sutton, M. A., Bleeker, A., Howard, C., Bekunda, M., Grizzetti, B., de Vries, W., van Grinsven, H., Abrol, Y., Adhya, T., BillenG. and. Davidson, E., Datta, A., Diaz, R., Erisman, J., Liu, X., Oenema, O., Palm, C., Raghuram, N., Reis, S., Scholz, R., Sims, T., Westhoek, H., Zhang, F., with contributions from Ayyappan, S., Bouwman, A., Bustamante, M., Fowler, D., Galloway, J., Gavito, M., Garnier, J., Greenwood, S., Hellums, D., Holland, M., Hoysall, C., Jaramillo, V., Klimont, Z., Ometto, J., Pathak, H., Plocq Fichelet, V., Powlson, D., Ramakrishna, K., Roy, A., Sanders, K., Sharma, C., Singh, B., Singh, U., Yan, X., and Zhang, Y.: Our Nutrient World: The challenge to produce more food and energy with less pollution. Global Overview of Nutrient Management, Centre for Ecology & Hydrology on behalf of the Global Partnership on Nutrient Management and the International Nitrogen Initiative, 114 pp., 2013.
Stuhlmann, R., Rodriguez, A., Tjemkes, S., Grandell, J., Arriaga, A., Bézy, J.-L., Aminou, D., and Bensi, P.: Plans for EUMETSAT's Third Generation Meteosat (MTG) Geostationary Satellite Program, Adv. Space Res., 36, 975–981, 2005.
Toro, R. A., Canales, M., Flocchini, R. G., Morales, R. G. E., and Leiva, G, M. A.: Urban atmospheric ammonia in Santiago City, Chile, Aerosol Air Qual. Res., 14, 33–44, https://doi.org/10.4209/aaqr.2012.07.0189, 2014.
Van Damme, M., Clarisse, L., Heald, C. L., Hurtmans, D., Ngadi, Y., Clerbaux, C., Dolman, A. J., Erisman, J. W., and Coheur, P. F.: Global distributions, time series and error characterization of atmospheric ammonia (NH3) from IASI satellite observations, Atmos. Chem. Phys., 14, 2905–2922, https://doi.org/10.5194/acp-14-2905-2014, 2014a.
Van Damme, M., Wichink Kruit, R. J., Schaap, M., Clarisse, L., Clerbaux, C., Coheur, P.-F., Dammers, E., Dolman, A. J., and Erisman, J. W.: Evaluating four years of atmospheric ammonia (NH3) over Europe using IASI satellite observations and LOTOS-EUROS model results, J. Geophys. Res.-Atmos., 119, 9549–9566, 2014b.
Van Damme, M., Erisman, J. W., Clarisse, L., Dammers, E., Whitburn, S., Clerbaux, C., Dolman, A. J., and Coheur, P.-F.: Worldwide spatiotemporal atmospheric ammonia (NH3) columns variability revealed by satellite, Geophys. Res. Lett., 42, 8660–8668, 2015a.
Van Damme, M., Clarisse, L., Dammers, E., Liu, X., Nowak, J. B., Clerbaux, C., Flechard, C. R., Galy-Lacaux, C., Xu, W., Neuman, J. A., Tang, Y. S., Sutton, M. A., Erisman, J. W., and Coheur, P. F.: Towards validation of ammonia (NH3) measurements from the IASI satellite, Atmos. Meas. Tech., 8, 1575–1591, https://doi.org/10.5194/amt-8-1575-2015, 2015b.
Van Damme, M., Whitburn, S., Clarisse, L., Clerbaux, C., Hurtmans, D., and Coheur, P.-F.: Version 2 of the IASI NH3 neural network retrieval algorithm: near-real-time and reanalysed datasets, Atmos. Meas. Tech., 10, 4905–4914, https://doi.org/10.5194/amt-10-4905-2017, 2017.
Van Damme, M., Clarisse, L., Whitburn, S., Hadji-Lazaro J., Hurtmans, D., Clerbaux, C., and Coheur, P.-F.: Industrial and agricultural ammonia point sources exposed, Nature, 564, 99, https://doi.org/10.1038/s41586-018-0747-1, 2018.
van Vuuren, D. P., Edmonds, J., Kainuma, M., Riahi, K., Thomson, A., Hibbard, K., Hurtt, G. C., Kram, T., Krey, V., Lamarque, J. F., Masui, T., Meinshausen, M., Nakicenovic, N., Smith, J. S., and Rose, S. K.: The Representative Concentration Pathways: An overview, Clim. Change, 109, 5–31, https://doi.org/10.1007/s10584-011-0148-z, 2011.
Volten, H., Bergwerff, J. B., Haaima, M., Lolkema, D. E., Berkhout, A. J. C., van der Hoff, G. R., Potma, C. J. M., Wichink Kruit, R. J., van Pul, W. A. J., and Swart, D. P. J.: Two instruments based on differential optical absorption spectroscopy (DOAS) to measure accurate ammonia concentrations in the atmosphere, Atmos. Meas. Tech., 5, 413–427, https://doi.org/10.5194/amt-5-413-2012, 2012.
Wang, S., Nan, J., Shi, C., Fu, Q., Gao, G., Wang, D., Cui, H., Saiz-Lopez A., and Zhou, B.: Atmospheric ammonia and its impacts on regional air quality over the megacity of Shanghai, China, Sci. Rep., 5, 15842, https://doi.org/10.1038/srep15842, 2015.
Warner, J. X., Dickerson, R. R., Wei, Z., Strow, L. L., Wang, Y., and Liang, Q.: Increased atmospheric ammonia over the world's major agricultural areas detected from space, Geophys. Res. Lett., 2875–2884, https://doi.org/10.1002/2016GL072305, 2017.
Warner, J. X., Wei, Z., Strow, L. L., Dickerson, R. R., and Nowak, J. B.: The global tropospheric ammonia distribution as seen in the 13-year AIRS measurement record, Atmos. Chem. Phys., 16, 5467–5479, https://doi.org/10.5194/acp-16-5467-2016, 2016.
Watson, J. G., Chow, J. C., Lurmann, F. W., and Musarra, S. P.: Ammonium Nitrate, Nitric Acid, and Ammonia Equilibrium in Wintertime Phoenix, Arizona, Air Waste, 44, 405–412, 1994.
Wesely, M.: Parameterization of Surface Resistances to Gaseous Dry Deposition in Regional-Scale Numerical Models, Atmos. Environ., 23, 1293–1304, 1989.
Whitburn, S., Van Damme, M., Clarisse, L., Bauduin, S., Heald, C., Hadji-Lazaro, J., Hurtmans, D., Zondlo, M., Clerbaux, C., and Coheur, P.-F.: A flexible and robust neural network IASI-NH3 retrieval algorithm, J. Geophys. Res. Atmos., 121, 6581–6599, https://doi.org/10.1002/2016JD024828, 2016.
Wilks, D. S.: Statistical Methods in the Atmospheric Sciences, 3 Edn. Oxford, Waltham, MA, Academic Press, 697 pp., 2011.
Ye, X., Ma, Z., Zhang, J., Du, H., Chen, J., Chen, H., Yang, X., Gao, W., and Geng, F.: Important role of ammonia on haze formation in Shanghai, Environ. Res. Lett., 6, 024019, https://doi.org/10.1088/1748-9326/6/2/024019, 2011.
Zavyalov, V., Esplin, M., Scott, D., Esplin, B., Bingham, G., Hoffman, E., Lietzke, C., Predina, J., Frain, R., Suwinski, L., Han, Y., Major, C., Graham, B., and Phillips, L.: Noise performance of the CrIS instrument, J. Geophys. Res., 13108–13120, https://doi.org/10.1002/2013JD020457, 2013.
Zhang, Q. J., Beekmann, M., Drewnick, F., Freutel, F., Schneider, J., Crippa, M., Prevot, A. S. H., Baltensperger, U., Poulain, L., Wiedensohler, A., Sciare, J., Gros, V., Borbon, A., Colomb, A., Michoud, V., Doussin, J.-F., Denier van der Gon, H. A. C., Haeffelin, M., Dupont, J.-C., Siour, G., Petetin, H., Bessagnet, B., Pandis, S. N., Hodzic, A., Sanchez, O., Honoré, C., and Perrussel, O.: Formation of organic aerosol in the Paris region during the MEGAPOLI summer campaign: evaluation of the volatility-basis-set approach within the CHIMERE model, Atmos. Chem. Phys., 13, 5767–5790, https://doi.org/10.5194/acp-13-5767-2013, 2013.
Zhao, M., Wang, S., Tan, J., Hua, Y., Wu, D., and Hao, J.: Variation of urban atmospheric ammonia pollution and its relation with PM2.5 chemical property in winter of Beijing, China, Aerosol Air Qual. Res., 16, 1378–1389, https://doi.org/10.4209/aaqr.2015.12.0699, 2016.
Zhu, L., Henze, D. K., Cady-Pereira, K. E., Shephard, M. W., Luo, M., Pinder, R. W., Bash, J. O., and Jeong, G.: Constraining U.S. ammonia emissions using TES remote sensing observations and the GEOS-Chem adjoint model, J. Geophys. Res.-Atmos., 118, 3355–3368, https://doi.org/10.1002/jgrd.50166, 2013.