the Creative Commons Attribution 4.0 License.
the Creative Commons Attribution 4.0 License.
Fourier transform infrared time series of tropospheric HCN in eastern China: seasonality, interannual variability, and source attribution
Youwen Sun
Lin Zhang
Mathias Palm
Justus Notholt
Hao Yin
Corinne Vigouroux
Erik Lutsch
Wei Wang
Changong Shan
Thomas Blumenstock
Tomoo Nagahama
Isamu Morino
Emmanuel Mahieu
Kimberly Strong
Bavo Langerock
Martine De Mazière
Qihou Hu
Huifang Zhang
Christof Petri
Jianguo Liu
We analyzed seasonality and interannual variability of tropospheric hydrogen cyanide (HCN) columns in densely populated eastern China for the first time. The results were derived from solar absorption spectra recorded with a ground-based high-spectral-resolution Fourier transform infrared (FTIR) spectrometer in Hefei (31∘54′ N, 117∘10′ E) between 2015 and 2018. The tropospheric HCN columns over Hefei, China, showed significant seasonal variations with three monthly mean peaks throughout the year. The magnitude of the tropospheric HCN column peaked in May, September, and December. The tropospheric HCN column reached a maximum monthly mean of molecules cm−2 in May and a minimum monthly mean of molecules cm−2 in November. In most cases, the tropospheric HCN columns in Hefei (32∘ N) are higher than the FTIR observations in Ny-Ålesund (79∘ N), Kiruna (68∘ N), Bremen (53∘ N), Jungfraujoch (47∘ N), Toronto (44∘ N), Rikubetsu (43∘ N), Izana (28∘ N), Mauna Loa (20∘ N), La Reunion Maido (21∘ S), Lauder (45∘ S), and Arrival Heights (78∘ S) that are affiliated with the Network for Detection of Atmospheric Composition Change (NDACC). Enhancements of tropospheric HCN column were observed between September 2015 and July 2016 compared to the same period of measurements in other years. The magnitude of the enhancement ranges from 5 % to 46 % with an average of 22 %. Enhancement of tropospheric HCN (ΔHCN) is correlated with the concurrent enhancement of tropospheric CO (ΔCO), indicating that enhancements of tropospheric CO and HCN were due to the same sources. The GEOS-Chem tagged CO simulation, the global fire maps, and the potential source contribution function (PSCF) values calculated using back trajectories revealed that the seasonal maxima in May are largely due to the influence of biomass burning in Southeast Asia (SEAS) (41±13.1 %), Europe and boreal Asia (EUBA) (21±9.3 %), and Africa (AF) (22±4.7 %). The seasonal maxima in September are largely due to the influence of biomass burnings in EUBA (38±11.3 %), AF (26±6.7 %), SEAS (14±3.3 %), and North America (NA) (13.8±8.4 %). For the seasonal maxima in December, dominant contributions are from AF (36±7.1 %), EUBA (21±5.2 %), and NA (18.7±5.2 %). The tropospheric HCN enhancement between September 2015 and July 2016 at Hefei (32∘ N) was attributed to an elevated influence of biomass burnings in SEAS, EUBA, and Oceania (OCE) in this period. In particular, an elevated number of fires in OCE in the second half of 2015 dominated the tropospheric HCN enhancement between September and December 2015. An elevated number of fires in SEAS in the first half of 2016 dominated the tropospheric HCN enhancement between January and July 2016.
- Article
(13515 KB) - Full-text XML
-
Supplement
(456 KB) - BibTeX
- EndNote
Atmospheric hydrogen cyanide (HCN) is an extremely hazardous gas that threatens human health and terrestrial ecosystems (Andreae and Merlet, 2001; Akagi et al., 2011; Rinsland et al., 2002). Improved knowledge of the physical and chemical mechanisms which drive the observed HCN variability is of great significance because HCN plays an important role in the global nitrogen cycle (Andreae and Merlet, 2001; Li et al., 2003). It is well established that biomass burning is the major source of tropospheric HCN, and industrial emissions contribute additional minor sources of HCN (Bange and Williams, 2000; Holzinger et al., 1999; Lobert et al., 1990). Li et al. (2009) estimate a global source of HCN from biomass burning of 0.4–3.2 Tg N yr−1 and from burning domestic biofuel of 0.2 Tg N yr−1 (Li et al., 2009). Bertschi et al. (2003) estimate a global fossil fuel combustion source of 0.04 Tg N yr−1, negligibly small in comparison (Bertschi et al., 2003). The principle pathway for an HCN sink is ocean uptake, which accounts for 0.73 to 1.0 Tg N yr−1 (Li et al., 2009). Additional minor sinks of HCN are attributed to atmospheric reaction with hydroxyl radical (OH) and O(1D), as well as photolysis (Li et al., 2000; Nagahama and Suzuki, 2007). The lifetime of HCN is 2–5 months in the troposphere and several years in the stratosphere. Li et al. (2003, 2009), Lupu et al. (2009), Vigouroux et al. (2012), and Zeng et al. (2012) showed that the observed variability of HCN can be reproduced by the chemical model simulations where biomass burning and ocean uptake provide the main source and sink, respectively (Li et al., 2009, 2003; Lupu et al., 2009; Vigouroux et al., 2012; Zeng et al., 2012).
With the rapid economic growth in China over the past 3 decades, anthropogenic emissions have increased dramatically, raising concerns about worsening air quality in China (Tang et al., 2012; Chan, 2017; Xing et al., 2017; Wang et al., 2017). These emissions are from automobile exhaust, industrial processes, and biomass burning. Many researchers have evaluated regional emissions in various pollution regions (e.g., the Jing-Jin-Ji region, the Yangtze River Delta region, and the Pearl River Delta region; Fig. S1 in the Supplement), but the relative contribution of biomass burning, automobile exhaust, and industrial processes is seldom mentioned in the literature (Tang et al., 2012; Chan, 2017; Wang et al., 2017; Sun et al., 2018a; Xing et al., 2017). This is because both industrial emissions and biomass burning are major sources of the trace gases (e.g., carbon monoxide (CO), formaldehyde (HCHO), and carbon dioxide (CO2)) that were used to evaluate regional emissions in the literature, and it is hard to quantify their relative contribution under the complex pollution conditions in China (Chan et al., 2018; Tang et al., 2012; Wang et al., 2017; Xiaoyan et al., 2010; Xing et al., 2017). It has been proven that HCN is an unambiguous tracer of biomass burning emission due to its inactive chemical feature and long lifetime (Rinsland et al., 2002; Zhao et al., 2002). Therefore, measurements of HCN made in the polluted troposphere over eastern China at middle latitudes are particularly useful in determining the potential biomass burning sources that drive the observed tropospheric HCN seasonality and interannual variability in China.
Ground-based high-resolution Fourier transform spectroscopy (FTIR) measurements of trace gases made by Anhui Institute of Optics and Fine Mechanics, Chinese Academy of Sciences (AIOFM-CAS) at Hefei (31∘54′ N, 117∘10′ E; 30 m a.s.l., above sea level) are among the few multiyear time series of trace gases on the Asian continent (Sun et al., 2018a, b). These measurements are crucial to understanding global warming, regional pollution, and long-term transport. Both HCN and CO are regularly measured at Hefei (32∘ N) using the FTIR observations, where influences from biomass burning occurring at long distances or locally can be assessed.
In this study, we analyze the first multiyear measurements of tropospheric HCN in densely populated eastern China. In Sect. 2 the retrieval strategy to derive HCN from high-resolution FTIR spectrometry and the methods for a GEOS-Chem tagged CO simulation and potential source contribution function (PSCF) calculation are summarized. In Sect. 3 we present the seasonal and interannual variability of tropospheric HCN columns measured at Hefei (32∘ N), China, and comparisons with the measurements affiliated with the Network for Detection of Atmospheric Composition Change (NDACC, http://www.ndacc.org/, last access: 3 June 2019). The potential sources that drive the observed HCN variability are determined by using the GEOS-Chem tagged CO simulation, the global fire maps, and the PSCF analysis in Sect. 4. The work concludes with a summary in Sect. 5. This study aims to improve our understanding of regional biomass burning characteristics and transport and contributes to the evaluation of the global nitrogen cycle.
2.1 FTIR observations
2.1.1 Site description and instrumentation
The routine observations of atmospheric trace gases using a ground-based high-resolution FTIR spectrometer at Hefei (31∘54′ N, 117∘10′ E; 30 m a.s.l.) started in July 2014. The location of the Hefei site is shown alongside those of the NDACC FTIR stations selected for comparison in Fig. 1. Geographical source regions used in the standard GEOS-Chem tagged CO simulation are also marked in Fig. 1. A detailed description of the Hefei site can be found in Tian et al. (2017). We follow the NDACC requirements and plan to apply for acceptance to the NDACC in the future.
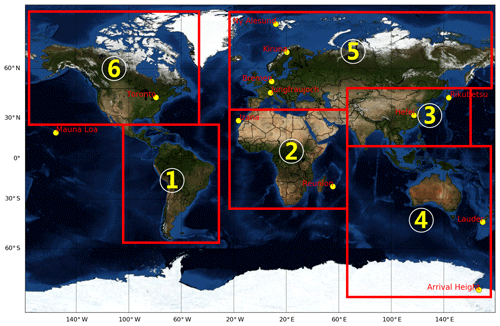
Figure 1The location of Hefei site alongside those of the NDACC FTIR stations (yellow dots) that are selected for comparison. Geographical source regions used in the standard GEOS-Chem tagged CO simulation are also shown. See Table 3 for latitude and longitude definitions.
A Bruker IFS 125 HR with a maximum optical path difference (OPD) of 900 cm is used to take the solar spectra (Tian et al., 2017). Defined as 0.9/OPD, this instrument can reach the highest spectral resolution of 0.001 cm−1. However, all midinfrared (MIR) spectra are recorded with a spectral resolution of 0.005 cm−1 to follow NDACC convention. This spectral resolution is sufficient to resolve the optical absorption structure of all gases in the atmosphere. The FTIR spectrometer covered a wide spectral range (about 600–4500 cm−1), but depending on the species, specific detectors and band-pass filters are applied (Sun et al., 2018a). In this study, the instrument is equipped with a KBr beam splitter, an InSb detector, and a filter centered at 2900 cm−1 for HCN measurements and a KBr beam splitter, an InSb detector, and a filter centered at 2400 cm−1 for CO measurements. The entrance field stop size ranging from 0.80 to 1.5 mm was employed to maximize the signal-to-noise ratio (SNR) consistent with the maximum frequency possible for the selected wave number range. The number of measurements within a day varies from 1 to 20. In total, there were 651 and 649 d of qualified measurements between 2015 and 2018 for CO and HCN, respectively.
2.1.2 Retrieval strategy
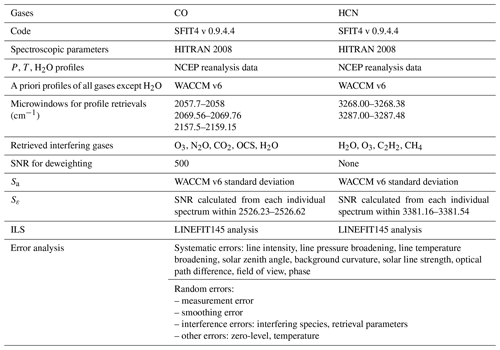
The SFIT4 (version 0.9.4.4) algorithm is used to retrieve the vertical profiles of CO and HCN (Viatte et al., 2014). Both CO and HCN are standard NDACC species, and we follow the NDACC recommendation for microwindows (MWs) selection and the interfering gas consideration (http://www.ndaccdemo.org/, last access: 23 May 2019). The retrieval inputs for CO and HCN are summarized in Table 1. Time series of tropospheric CO columns between 2014 and 2017 at Hefei (32∘ N) measured from the FTIR spectrometer have been reported in Sun et al. (2018a), and the detailed description of the CO profile retrieval can be found therein. Time series of tropospheric HCN columns at Hefei (32∘ N) are presented for the first time. Temperature and pressure profiles are extracted from National Centers for Environmental Protection (NCEP) 6-hourly reanalysis data (De Mazière et al., 2018), and all spectroscopic absorption parameters are prescribed from the HITRAN 2008 database (Rothman et al., 2009). The water vapor (H2O) a priori profile is interpolated from the NCEP 6-hourly reanalysis data, and a priori profiles of other gases are from the Whole Atmosphere Community Climate Model (WACCM) v6 specially run for NDACC.
Three MWs were used for CO: a strong line at 2057.7–2058 cm−1 and two weak lines at 2069.56–2069.76 cm−1 and 2157.5–2159.15 cm−1 (Sun et al., 2018a). For HCN, two MWs were used: 3268.00–3268.38 cm−1 and 3287.00–3287.48 cm−1 (Mahieu et al., 1997; Lutsch et al., 2016; Notholt et al., 2000). In order to minimize the cross absorption interference, profiles of ozone (O3) and nitrous oxide (N2O) and columns of H2O, carbonyl sulfide (OCS), and CO2 are simultaneously retrieved in addition to the CO profile. The profile of H2O and columns of O3, C2H2, and CH4 are simultaneously retrieved in addition to the HCN profile. No de-weighting SNR is used for HCN, and a deweighting SNR of 500 is used in the three MWs for CO.
The diagonal elements of a priori profile covariance matrices Sa are set to the standard deviation of the WACCM v6 specially run for NDACC, and its nondiagonal elements are set to zero. The diagonal elements of the measurement noise covariance matrices Sε are set to the inverse square of the SNR calculated from each individual spectrum, and its nondiagonal elements are set to zero. The measured instrument line shape (ILS) is included in the retrieval (Hase, 2012; Sun et al., 2018a).
2.1.3 Averaging kernels and error budget
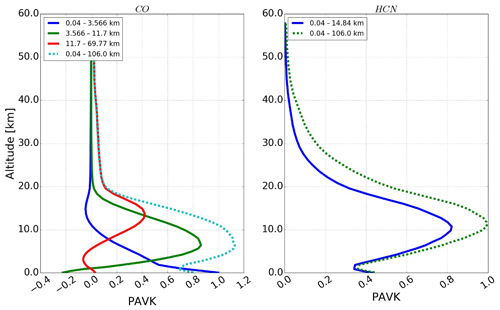
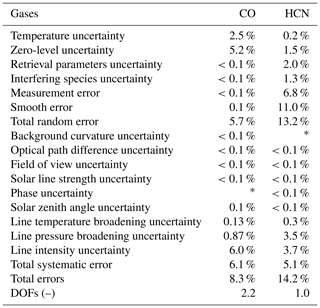
The partial-column averaging kernels of CO and HCN at selected layers are shown in Fig. 2. The CO averaging kernels have three maxima: at the surface, at 7 km, and at 14 km. The HCN averaging kernels have only one maxima, at 10 km. Both CO and HCN retrievals show good vertical sensitivity in the whole troposphere, where CO exhibits the best sensitivity with two maxima in the troposphere (Sun et al., 2018a). Typical degrees of freedom (DOFs) obtained at Hefei (32∘ N) over the total atmosphere for CO and HCN are about 2.8±0.3 (1σ) and 1.3±0.2 (1σ), respectively (Table 2). In this study, only partial columns of CO and HCN within a broad layer between the surface and 15 km are considered. The selected layer corresponds roughly to the total troposphere over eastern China, as the mean tropopause height calculated from NCEP reanalysis data is around 15 km over four seasons. The selected layer corresponds to 2.3±0.2 (1σ) and 1.0±0.1 (1σ) of DOFs for CO and HCN, respectively.
We calculated the error budget according to the formalism of Rodgers (2000) and separated all error items into systematic error or random error, depending on whether they are constant over consecutive measurements or vary randomly. Table 2 summarizes the random, the systematic, and the combined error budgets of tropospheric CO and HCN columns. The error items included in the error budgets are listed in Table 1. For CO, the major systematic error is line intensity uncertainty, and the major random errors are zero-level uncertainty and temperature uncertainty. For HCN, the major systematic errors are line intensity uncertainty and line pressure broadening uncertainty; the major random errors are smoothing error and measurement error. The total retrieval errors for tropospheric CO and HCN columns between the surface and 15 km are estimated to be 8.3 % and 14.2 %, respectively.
2.2 GEOS-Chem tagged simulation
A GEOS-Chem tagged CO simulation is used to interpret the influence of biomass burning sources on HCN tropospheric columns at Hefei (32∘ N) (Bey et al., 2001; Zhang et al., 2019). The GEOS-Chem simulation was designed according to Lutsch et al. (2019) and is described here. GEOS-Chem version 12.2.1 and the Goddard Earth Observing System Forward Processing (GEOS FP) product with assimilated meteorological data observations from the NASA Global Modeling and Assimilation Office (GMAO) were used. For driving the GEOS-Chem model, the GEOS FP meteorological data with a native horizontal resolution of 0.25∘ latitude × 0.3125∘ longitude were downgraded to 2∘ latitude × 2.5∘ longitude and a vertical resolution of 72 hybrid levels (extending from surface to 0.01 hPa). The temporal resolution of surface variables and boundary layer height are 1 h and other variables are 3 h.
A 1-year spin-up from July 2014 to July 2015 was used to initialize the simulation. Time steps of 1 h and 10 min for the chemical and transport operators, respectively, were used. Biomass burning emissions are from the Global Fire Assimilation System (GFAS) v1.2 (Kaiser et al., 2012; Di Giuseppe et al., 2018). GFASv1.2 emissions have a 0.1∘ × 0.1∘ horizontal resolution with 1-hourly temporal resolution. Global anthropogenic and biofuel emissions are from the Community Emissions Data System (CEDS) inventory (Hoesly et al., 2018). In particular, the latest Multi-resolution Emission Inventory for China (MEIC) is used to provide Chinese anthropogenic emissions (Li et al., 2017). Biogenic emissions of precursor volatile organic compounds (VOCs) are from the Model of Emissions of Gases and Aerosols from Nature (MEGANv2.1; Guenther et al., 2012), and biofuel emissions are from Yevich and Logan (2003). The OH fields were obtained from monthly mean OH concentrations archived from a previous full-chemistry simulation. GEOS-Chem releases surface emissions assuming a uniform distribution in the boundary layer, and boundary layer mixing is implemented using the nonlocal mixing scheme of Holtslag and Boville (1993). Biomass emissions are released by uniformly distributing emissions from the surface to the mean altitude of maximum injection based on the injection height information in GFAS v1.2 as described in Rémy et al. (2017).
The GEOS-Chem version 12.2.1 tagged CO simulation includes the improved secondary CO production scheme of Fisher et al. (2017), which assumes production rates of CO from CH4 and NMVOC (nonmethane volatile organic compounds) oxidation from a GEOS-Chem full-chemistry simulation. The tracers of anthropogenic, biomass burning, CH4, and NMVOC oxidations are implemented according to the standard GEOS-Chem tagged CO simulation (http://geos-chem.org/, last access: 8 April 2020). In this study, we only investigate the influence from the biomass burning sources. The regional definitions of all biomass burning tracers are shown in Fig. 1 and tabulated in Table 3.
2.3 Potential source contribution function
We used the potential source contribution function (PSCF) analysis method to identify air masses associated with high levels of air pollutants. The PSCF assumes that back trajectories arriving at times of higher concentrations likely point to the more significant pollution directions (Ashbaugh et al., 1985). The PSCF has been applied in many studies to locate air masses associated with high levels of air pollutants (Kaiser et al., 2007; Dimitriou and Kassomenos, 2015; Yin et al., 2017). In this study, PSCF values were calculated using back trajectories that were calculated by the Hybrid Single Particle Lagrangian Integrated Trajectory (HYSPLIT) model. The top of the model was set to 10 km. The PSCF values for the grid cells in the study domain were based on a count of the trajectory segment that terminated within each cell (Ashbaugh et al., 1985). The number of endpoints that fall in the ijth cell is designated nij. The number of endpoints for the same cell having arrival times at the sampling site corresponding to concentrations higher than an arbitrarily set criterion is defined to be mij. In this study, we calculated the PSCF values based on trajectories corresponding to concentrations that exceeded the monthly mean level of tropospheric HCN columns during measurement. The PSCF value for the ijth cell is then defined as
The unitless PSCF value can be interpreted as the conditional probability that the concentrations of a given analyte greater than the criterion level are related to the passage of air parcels through the ijth cell during transport to the receptor site. That is, cells with high PSCF values are associated with the arrival of air parcels at the receptor site whose concentrations of the analyte are higher than the criterion value. These cells are indicative of areas of “high-potential” contributions for the constituent.
Identical PSCFij values can be obtained from cells with very different counts of back-trajectory points (e.g., grid cell A with mij=400 and nij=800 and grid cell B with mij=4 and nij=8). In this extreme situation grid cell A has 100 times more air parcels passing through than grid cell B. Because of the sparse particle count in grid cell B, the PSCF values are more uncertain. To account for the uncertainty due to low values of nij, the PSCF values were scaled by a weighting function Wij (Polissar et al., 1999). The weighting function reduced the PSCF values when the total number of endpoints in a cell was less than approximately 3 times the average value of the end points per cell. In this case, Wij was set as follows:
where Nave represents the mean nij of all grid cells. The weighted PSCF values were obtained by multiplying the original PSCF values by the weighting factor.
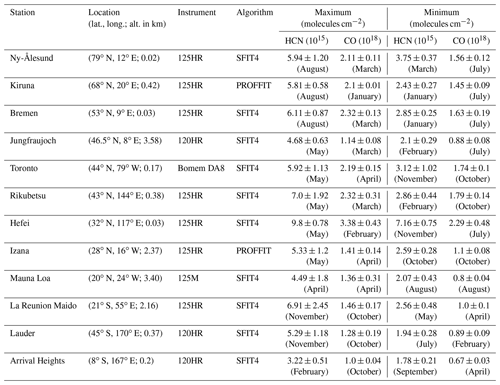
The new HCN data are compared with the concurrent measurements regularly measured at 11 NDACC stations to investigate the representativeness of the observation site at Hefei (32∘ N) in polluted eastern China. These NDACC stations cover a wide latitude range, from 77.8∘ S to 78.9∘ N, and a wide longitude range, from 79∘ W to 170∘ E (http://www.ndaccdemo.org/, last access: 19 July 2019). Most of these NDACC stations use the same instrument and retrieval algorithm as those at Hefei (32∘ N). Alternatively, the high-resolution spectrometers Bruker 125M, 120HR, and Bomem DA8 and the retrieval algorithm PROFFIT are used in other stations. It has been demonstrated that the profiles derived from these different instruments and algorithms are in excellent agreement (Hase et al., 2004; De Mazière et al., 2018). In addition, we show the time series of tropospheric CO columns, also measured with an FTIR spectrometer, because we will discuss the correlation between HCN and CO and quantify the influence of biomass burning sources on HCN columns at Hefei (32∘ N) by using a tagged CO simulation. The upper limit of 15 km is above the tropopause at most of the NDACC stations. For most NDACC stations, the surface–15 km layer is a mixture of troposphere and a part of stratosphere. However, we did not find major changes in the results of this study when choosing a lower upper limit such as 12 km. Thus we have chosen the same upper limits for all stations. The geolocations of all FTIR stations and their seasonal maximum, minimum, and variabilities are summarized in Table 4.
Table 4Tropospheric HCN and CO columns at Hefei (32∘ N), China, from 2015 to 2018 alongside those of the NDACC FTIR stations. All stations are organized as a function of decreasing latitude.
3.1 Seasonal variation
The monthly means of the tropospheric CO and HCN columns at the 12 FTIR stations are shown in Fig. 3. As commonly observed at Hefei (32∘ N), three monthly mean peaks are evident for tropospheric HCN and CO columns. The magnitude of the tropospheric HCN peaked at Hefei (32∘ N) in May, September, and December, while for tropospheric CO column, the magnitude peaked at Hefei (32∘ N) in February, September, and December. Note that the largest seasonal peak of HCN occurs in May, which is 3 months later than that of CO, which occurs in February, but the other two seasonal peaks for both species occur in the same months, i.e., in September and December, respectively. Otherwise, their seasonal cycles show similarities.
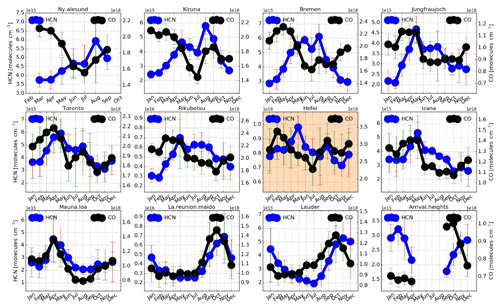
Figure 3Monthly means of the tropospheric CO and HCN columns in Ny-Ålesund, Kiruna, Bremen, Jungfraujoch, Toronto, Rikubetsu, Hefei, Izana, Mauna Loa, La Reunion Maido, Lauder, and Arrival Heights from 2015 to 2018. Vertical error bars represent 1σ within that month. All stations are organized as a function of decreasing latitude.
The tropospheric HCN and CO columns at Hefei (32∘ N) are higher than the NDACC FTIR observations (see Fig. S2). The tropospheric HCN column reached a maximum of molecules cm−2 in May and a minimum of molecules cm−2 in November. The tropospheric CO column reached a maximum of molecules cm−2 in February and a minimum of molecules cm−2 in July (Table 4). In comparison, the seasonal maxima and minima of tropospheric HCN columns at the selected NDACC FTIR stations varied from (3.22±0.51) to molecules cm−2 and (1.78±0.21) to molecules cm−2, respectively. The seasonal maxima and minima of tropospheric CO columns at the selected NDACC FTIR stations varied from (1.0±0.04) to molecules cm−2 and (0.67±0.03) to molecules cm−2, respectively (Table 4).
In the Northern Hemisphere, the phase of the seasonal maxima generally occurs in spring or summer for tropospheric HCN columns and in winter or spring for CO; in the Southern Hemisphere, the phase of the seasonal maxima for both tropospheric HCN and CO columns occurs in autumn or winter.
3.2 Interannual variability and enhancement
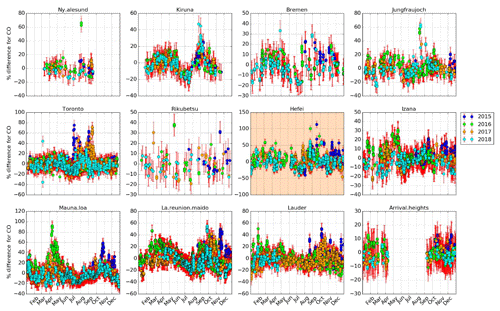
In order to study the interannual variability of HCN and CO, fractional differences in the tropospheric HCN and CO columns relative to their seasonal mean values represented by the cosine fitting at the 12 FTIR stations are shown in Figs. 4 and 5, respectively. Enhancements of both tropospheric HCN and CO columns between September 2015 and July 2016 at Hefei (32∘ N) were observed compared to the same period of measurements in other years. For HCN, the magnitude of the enhancement ranges from 5 % to 46 % with an average of 26 %. The significant enhancements occurred in December 2015 and May 2016 with peaks of 46 % and 38 %, respectively. By contrast, the magnitude of the enhancement in the tropospheric CO columns at Hefei (32∘ N) between September 2015 and July 2016 ranges from 4 % to 59 % with an average of 27 %. The tropospheric CO columns were elevated over their seasonal means by more than 20 % from March to April 2016. In addition, an enhancement magnitude of more than 40 % was occasionally observed in August and September for both HCN and CO at Hefei (32∘ N).
The enhancements of both tropospheric HCN and CO columns within the same period were also observed at the selected NDACC stations except Ny-Ålesund (79∘ N) and Kiruna (68∘ N). The winter enhancements were not shown over Ny-Ålesund (79∘ N) and Kiruna (68∘ N) because of the polar night in the Arctic, which interrupted the observations in winter. The magnitude of the enhancement in tropospheric HCN columns at the selected NDACC stations between September 2015 and July 2016 ranges from 3 % to 213 % as well as from 4 % to 62 % for CO.
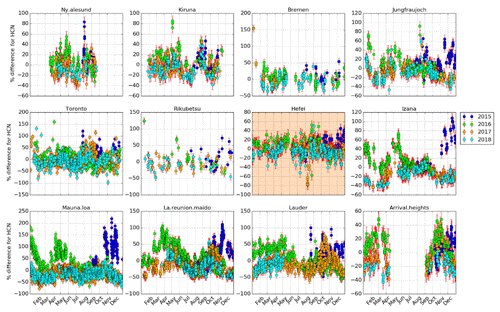
Figure 4Fractional difference in the partial columns (surface–15 km) of HCN from 2015 to 2018 at Ny-Ålesund, Kiruna, Bremen, Jungfraujoch, Toronto, Rikubetsu, Hefei, Izana, Mauna Loa, La Reunion Maido, Lauder, and Arrival Heights relative to their seasonal mean values. Vertical error bars represent the estimated retrieval errors. All stations are organized as a function of decreasing latitude.
3.3 Correlation with CO and enhancement ratios
The tropospheric HCN columns at the 12 FTIR stations from 2015 to 2018 have been plotted against the coincident CO partial columns (Fig. 6). In Fig. 7, the correlations between the tropospheric HCN and CO columns at Hefei (32∘ N) for all spectra recorded throughout the year (gray dots) and those recorded within the selected periods (green dots) are compared. We followed the least-squares procedure of York et al. (2004) to fit the coincident measurements using a linear regression and incorporated the errors in both ordinal and abscissa coordinates into the uncertainty estimation.
Biomass burning is the dominant source of HCN and industrial emissions only contribute additional minor sources (Bange and Williams, 2000; Holzinger et al., 1999; Lobert et al., 1990). In contrast, anthropogenic, biomass burning, CH4, and NMVOC oxidations are major sources of CO, and their contributions are season- and location-dependent. Therefore, the correlation between HCN and CO tropospheric columns is also season- and site-dependent. High correlation of these two species is supposed to be observed if biomass burning dominates the CO variability and vice versa. For the period of 2015 to 2018 in this study, moderate overall correlations between HCN and CO tropospheric columns were present at Jungfraujoch (47∘ N) and Rikubetsu (43∘ N), and negative overall correlations were present at Ny-Ålesund (79∘ N), Kiruna (68∘ N), Bremen (53∘ N), and Arrival Heights (78∘ S). However, high correlation of these two species was seen at Toronto (44∘ N), Hefei (32∘ N), Izana (28∘ N), Mauna Loa (20∘ N), La Reunion Maido (21∘ S), and Lauder (45∘ S) throughout the year. This was probably because the portion of the fire-affected seasonal measurements at these stations is larger than that at other stations (Fig. 6). For the measurements at Hefei (32∘ N), the high correlations between HCN and CO tropospheric columns deduced from the measurements without March and April (R=0.67, Fig. 7a), in May (R=0.69, Fig. 7b), in September (R=0.77, Fig. 7c), and in December (R=0.65, Fig. 7d) are consistent with those deduced from all measurements (R=0.70) (Table 5). However, the correlation slope for the May, September, and December tropospheric columns differ from the annual one, indicating different biomass burning sources in different periods.
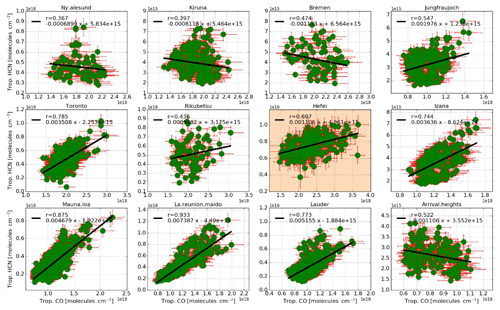
Figure 6Correlation plots of daily mean partial columns (surface–15 km) of HCN versus CO (molecules cm−2). The linear equation of the fit and the resulting correlation coefficient r are shown. The black line is a linear least-squares fit of respective data. All stations are organized as a function of decreasing latitude. Error bars represent the retrieval uncertainties.
For fire-affected measurements, the slope ΔHCN ∕ ΔCO, defined as the enhancement ratio (EnhRHCN), is an effective quantity to identify biomass burning emissions (Holzinger et al., 1999; Lutsch et al., 2016; Rinsland et al., 2002; Viatte et al., 2015; Vigouroux et al., 2012; Zhao et al., 2000). Depending on the burned biomaterials, fire type, the phase of the fire, and the travel time of the plumes, the reported EnhRHCN varied by 2 orders of magnitude. The mean EnhRHCN of at Hefei (32∘ N) falls between the wide range of the HCN ∕ CO ratios measured in the laboratory (0.4–7.1 × 10⁻³ in the work of Yokelson et al., 1997, and 0.4–2.6 × 10⁻³ in the work of Holzinger et al., 1999), and measured in the NDACC FTIR network (0.94–7.4 × 10⁻³) (Fig. 6). The mean EnhRHCN at Hefei (32∘ N) is close to that at Rikubetsu (43∘ N), indicating that these two Asian stations share similar biomass burning sources throughout the year. The mean EnhRHCN at Hefei (32∘ N) is lower than those measured at Jungfraujoch (47∘ N), Toronto (44∘ N), Izana (28∘ N), Mauna Loa (20∘ N), Lauder (45∘ S), and La Reunion Maido (21∘ S) because the emissions of crop residue burning, which dominates the HCN enhancements at Hefei (32∘ N), are lower than those of boreal or tropical forest burning, which account for the HCN enhancements at the aforementioned NDACC stations (Akagi et al., 2011, 2012; Rinsland et al., 2007; Vigouroux et al., 2012). On the other hand, the Hefei (32∘ N) site is located in a densely populated part of China; therefore emissions of fossil fuel combustion such as automobile exhaust and industrial processes could elevate the CO background level and hence lessen the EnhRHCN.
Table 5Correlation between HCN and CO tropospheric columns within each selected period at Hefei (32∘ N), China. N is the number of points, R is the correlation coefficient, and EnhRHCN is the enhancement ratio.

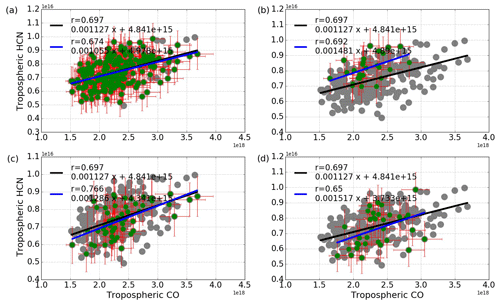
Figure 7Correlation plots of daily mean tropospheric columns of HCN versus CO (molecules cm−2) at Hefei (32∘ N). The gray dots represent all measurements and the green dots represent the measurements within the selected period: (a) measurements without March and April, (b) measurements in May, (c) measurements in September, and (d) measurements in December. The linear equation of the fit and the resulting correlation coefficient r are shown. The black line is a linear least-squares fit of the gray data and the blue line is for the green data. Error bars represent the retrieval uncertainties.
In order to determine what drives the seasonality and interannual variability of tropospheric HCN in eastern China, it is necessary to match the observed time series with actual biomass burning events and show that the generated plumes are capable of traveling to the observation site. We did this by using various independent data sets.
-
The 1-hourly instantaneous CO VMR (volume mixing ratio) profiles of the tracers listed in Table 3 were provided by a GEOS-Chem tagged CO simulation performed as described in Sect. 2.2.
-
The global fire atlas data were archived by the Fire Information for Resource Management System (FIRMS), which generates fire information from NASA's Moderate Resolution Imaging Spectroradiometer (MODIS) and NASA's Visible Infrared Imaging Radiometer Suite (VIIRS) (https://firms.modaps.eosdis.nasa.gov/download/, last access: 23 May 2019). We have only taken the number of fires with a retrieval confidence value of larger than 60 % into account.
-
Three-dimensional kinematic back trajectories at designated elevations were calculated by the Air Resources Laboratory's (ARL, http://ready.arl.noaa.gov/HYSPLIT.php, last access: 23 May 2019) Hybrid Single Particle Lagrangian Integrated Trajectory (HYSPLIT) model using Global Data Assimilation System (GDAS) meteorological fields (https://ready.arl.noaa.gov/gdas1.php, last access: 23 May 2019).
-
The PSCF values were calculated by MeteoInfo as described in Sect. 2.3 using HYSPLIT back trajectories (http://meteothink.org/index.html, last access: 17 December 2019).
4.1 Attribution for the seasonality
The GEOS-Chem tagged CO simulation provides a means of evaluating the contribution of CO from anthropogenic, biomass burning, and oxidation sources to the measured CO columns at Hefei (32∘ N). Source attribution is performed as follows. First, the GEOS-Chem CO VMR profiles of all tracers in the grid box containing the Hefei (32∘ N) site were linearly interpolated and regridded onto the FTIR vertical retrieval grid. This was necessary in order to account for the differences in the vertical levels of the model and the FTIR (Barret et al., 2003). Then, the interpolated GEOS-Chem CO profiles were smoothed by the FTIR CO averaging kernel according to Rodgers and Connor (2003). Finally, we compared the partial columns calculated from the smoothed GEOS-Chem CO profiles with the FTIR ones. Figure 8 shows the daily averaged GEOS-Chem and FTIR CO tropospheric columns (surface–15 km) for the simulation period from 2015 to 2018. The relative contribution of anthropogenic, biomass burning, and oxidation tracers is also shown. The GEOS-Chem and FTIR CO tropospheric columns are in good agreement.
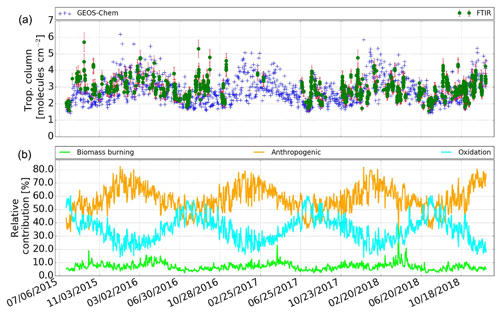
Figure 8Daily mean CO tropospheric column time series of FTIR and GEOS-Chem (a) from 2015 to 2018 at Hefei (32∘ N). Panel (b) shows the relative contribution (%) of the anthropogenic, biomass burning, and oxidation tracers in the GEOS-Chem simulation to the total CO tropospheric columns at Hefei (32∘ N).
The combination of the anthropogenic source and the oxidations of CH4 and NMVOCs is the greatest contribution to the tropospheric CO column at Hefei (32∘ N). The magnitude of this combination source varies from 80 % to 95 % throughout the year. In contrast, the magnitude of biomass burning sources varies from 5 % to 20 %. As shown in Fig. 9, the anthropogenic, biomass burning, and oxidation sources are all season-dependent due to the magnitude of the emissions and the influence of seasonally variable transport. The onset of the anthropogenic contribution begins in July with a maximum in December. In contrast to the anthropogenic influence, the onset of the oxidation contribution begins in January with a maximum in July as a result of maximum NMVOC emissions in Summer (Sun et al., 2018b). For the biomass burning contribution, two onsets were observed. One begins in January with a maximum in April, and the other one begins in July with a maximum in October.
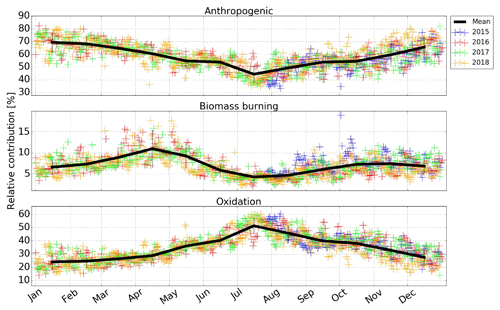
Figure 9Seasonality of the relative contribution (%) of the anthropogenic, biomass burning, and oxidation tracers in the GEOS-Chem simulation to the total CO tropospheric columns at Hefei (32∘ N).
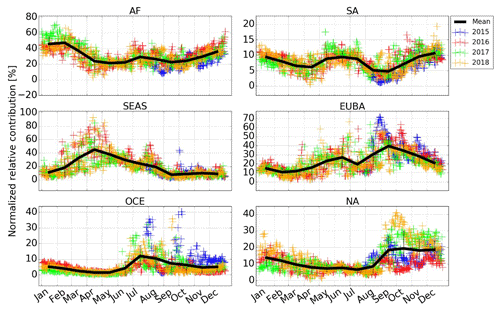
After normalizing each biomass burning tracer listed in Table 3 to the total biomass burning contribution, the normalized relative contribution of each individual biomass burning tracer to the total biomass-burning-associated CO tropospheric column was obtained in Fig. 10. The results show that the seasonal maxima in May are largely due to the influence of SEAS biomass burning (41±13.1 %). Moderate contributions from EUBA (21±9.3 %) and AF (22±4.7 %) and small contributions from South America (SA) (7.8±2.9 %), OCE (1.5±0.8 %), and NA (7.7±1.9 %) are also observed. The seasonal maxima in September are largely due to the influence of EUBA (38±11.3 %) and AF (26±6.7 %) biomass burnings. The remaining contributions are from SA (5.1±2.7 %), SEAS (14±3.3 %), OCE (8.9±7.4 %), and NA (13.8±8.4 %). For the seasonal maxima in December, contributions from AF, SA, SEAS, EUBA, OCE, and NA are 36±7.1 %, 11±1.9 %, 11±3.6 %, 21±5.2 %, 4.8±2.7 %, and 18.7±5.2 %, respectively.
4.2 Attribution for transport pathway
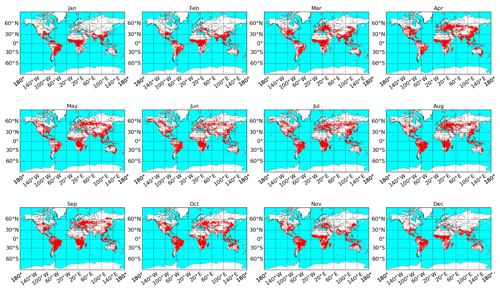
For each seasonal enhancement of the tropospheric HCN, the transport pathway is determined as follows. First, the GEOS-Chem tagged CO simulation is used to calculate the relative contribution of each biomass burning tracer (Fig. 10). For the tracer with a high contribution, the FIRMS global fire map is used to search for potential fire events occurring before the phase of tropospheric HCN enhancement within a 1-month period. Then, we generated an ensemble of HYSPLIT back trajectories with different travel times and arrival altitudes to judge whether these plumes are capable of traveling to the observation site. For example, for each intensive biomass burning event detected at a specific period, we generated 10 back trajectories at different arrival altitudes ranging from 1.5 to 12 km and modified the end time of these back trajectories within 1 d of the observed enhancement. If the back trajectories intersect a region where the FIRMS fire data indicate an intensive fire event and the travel duration is within a reasonable range, then this specific fire event could contribute to the observed enhancements at Hefei (32∘ N) in eastern China. The transport pathway for this enhancement is finally determined.
Figure 11 demonstrates travel trajectories of the plumes that occurred in AF, SEAS & OCE, EUBA, and NA and reached Hefei (32∘ N) through long-range transport. Figure 12 shows the PSCF values calculated using 13 d HYSPLIT back trajectories that are coincident with the FTIR measurement time. Eastern China, South Asia, central Asia, eastern Europe, and northern Africa had high PSCF weight values in both the first and the second half of the year. Large areas of Southeast Asian countries, including the Philippines, Malaysia, and Indonesia, as well as eastern North America were the additional regions with potentially high PSCF weight values in the second half of the year. Generally, trajectories with the same travel time in the second half of the year are longer than those in the first half year, resulting in broader areas with potentially high PSCF weight values.
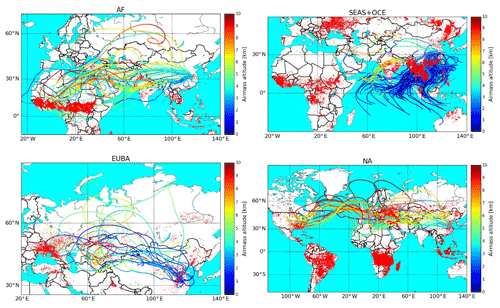
Figure 11Travel trajectories of the plumes occurred in AF, SEAS & OCE, EUBA, and NA that reached Hefei (32∘ N) through long-range transport. Travel times are 13, 7, 10, and 14 d, respectively. For clarity, only few trajectories are selected for demonstration. FIRMS fire numbers are shown with red dots for 13, 7, 10, and 14 d prior to the arrival time, respectively.
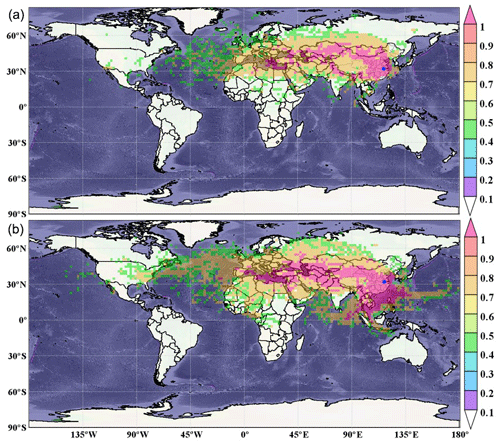
Figure 12Likely source areas of air mass associated with higher HCN concentrations at Hefei (32∘ N) in (a) the first half year and (b) the second half year, identified using PSCF.
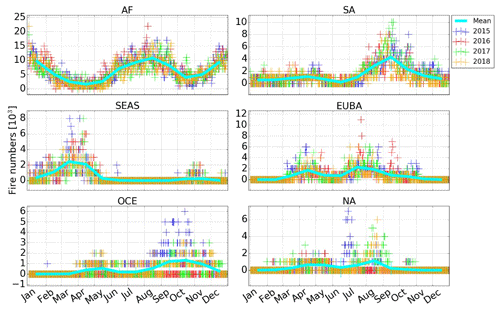
As shown in Figs. 13 and 14, the seasonal biomass burning typically occurs between July and September in southern Africa and between November and February in central Africa. These AF emissions can be transported to eastern China along with the southwestern wind, which contributed 25 %–45 % of the tropospheric HCN in these periods. The seasonal biomass burning typically occurs between March and May and between July and November in central Europe, and between June and September in Siberia. These EUBA emissions can be transported to eastern China along with the northwestern or northern wind, which contributed 27 %–40 % of the tropospheric HCN in these periods. The seasonal biomass burning typically occurs between March and May in India and the South Asia peninsula. Largely driven by deep convection followed by northward transport into the midlatitude westerlies (Liu et al., 2003), these emissions can be transported to eastern China and contributed to the tropospheric HCN peak in May. The seasonal biomass burning typically occurs between March and May, July and September, and November and December in the eastern part of China. All these emissions can be transported to the observation site at Hefei (32∘ N) under favorable meteorological conditions and thus contribute to all the seasonal tropospheric HCN peaks. The SEAS contribution (mainly China, India, and the South Asia peninsula) varies from 25 % to 80 % in March to August.
Additionally, a small to moderate portion of wildfire events in central SA, eastern NA, and Northern OCE in autumn or winter could be transported to the observation site through large-scale atmospheric circulation, which contributed 5 %–20 % of the tropospheric HCN in these periods.
4.3 Attribution for interannual variability
In Fig. 9, the biomass burning contribution was elevated by 5 %–15 % between September 2015 and July 2016, while no elevations were observed for anthropogenic and oxidation influence. As a result, enhancements of both tropospheric HCN and CO columns between September 2015 and July 2016 at Hefei (32∘ N) were attributed to an elevated influence of biomass burning. In Fig. 10, the relative contribution (%) of the SEAS, EUBA, and OCE biomass burning tracers to the total biomass-burning-associated CO tropospheric column was elevated by 5 %–20 %, 8 %–27 %, and 8 %–31 %, respectively, in the second half of 2015 compared to the same period in other years. The relative contribution (%) of the SEAS and OCE biomass burning tracers to the total biomass-burning-associated CO tropospheric column was elevated by 8 %–39 % and 2 %–7 %, respectively, in the first half of 2016 compared to the same period in other years.
The statistical results of the FIRMS fire atlas data in Fig. 14 show that the number of fires in the SEAS, EUBA, and OCE regions elevated by 21.89 %, 15.72 %, and 32.68 % between September 2015 and July 2016 compared to the same period in other years. The elevated number of fires in EUBA, SEAS, and OCE drove the enhancements of tropospheric HCN and CO columns between September 2015 and July 2016 at Hefei (32∘ N). In particular, the number of fires in OCE in the second half of 2015 was greatly elevated in comparison with the other years, acting as a dominant source of tropospheric HCN enhancement between September and December 2015. The number of fires elevated significantly in the SEAS region in the first half of 2016, which dominated the tropospheric HCN enhancement between January and July 2016.
Many studies have revealed that the El Niño–Southern Oscillation (ENSO) can cause large-scale variations in the convection, circulation, and air temperature of the global atmosphere–ocean system (Liu et al., 2017; Zhao et al., 2002), which could affect the distribution, frequency, and intensity of biomass burning emissions (Schaefer et al., 2018). Furthermore, ENSO could also alter the destruction processes of tropospheric species through their photochemical reactions with tropospheric OH (Zhao et al., 2002). Zhao et al. (2002) found that the abnormal enhancement of tropospheric CO and HCN observed in northern Japan in 1998 was associated with the 1997–1998 ENSO events (Zhao et al., 2002). There is a close correlation between ENSO and HCN columns at Lauder (45∘ S) (Zeng et al., 2012; Schaefer et al., 2018), and Schaefer et al. (2018) quantified a detectable ENSO influence on biomass burning of up to 51 %–55 % (Schaefer et al., 2018; Zeng et al., 2012). It is very likely that the elevated number of fires which caused significant enhancements between September 2015 and July 2016 for tropospheric CO and HCN columns at Hefei and most selected NDACC stations was related to the 2015–2016 ENSO events.
Compared to the northwestern part of China such as the Xinjiang province and the Tibet plateau, the densely populated eastern parts of China are more suitable for crop planting because of fertile soil and adequate water resources. Historically, Chinese farmers burned their crop residue (such as rice, corn, and wheat straws) after the harvest to fertilize the soil for the coming farming season. Postharvest crop residue is a fine fuel that burns directly in the field and mostly by flaming in many mechanized agricultural systems. In contrast, when crops are harvested by hand the residue is often burned in large piles that may smolder for weeks.
This seasonal crop residue burning season typically occurs in the spring and summer seasons and also occasionally occurs in the autumn and winter. Pollution gases, dust, and suspended particle matter resulting from crop residue burning emissions result in poor air quality that threatens human health and terrestrial ecosystems. The Chinese presidential decree included the prohibition of crop residue burning into the Law of the People's Republic of China on the Prevention and Control of Atmospheric Pollution in August 2015 (http://www.chinalaw.gov.cn, last access: 17 July 2019), and since then the crop residue burning events were banned throughout China. Therefore, we obtain a decrease in the number of fires in China since 2015.
The first multiyear measurements of HCN in the polluted troposphere in densely populated eastern China have been presented. Tropospheric HCN columns were derived from solar spectra recorded with a ground-based high-spectral-resolution Fourier transform infrared (FTIR) spectrometer at Hefei (31∘54′ N, 117∘10′ E) between 2015 and 2018. The seasonality and interannual variability of tropospheric HCN columns in eastern China have been investigated. The potential sources that drive the observed HCN seasonality and interannual variability were determined by using the GEOS-Chem tagged CO simulation, the global fire maps, and the PSCF (potential source contribution function) values calculated using HYSPLIT back trajectories.
The tropospheric HCN columns over eastern China showed significant seasonal variations with three monthly mean peaks throughout the year. The magnitude of the tropospheric HCN peaks in May, September, and December. The tropospheric HCN column reached a maximum monthly mean of molecules cm−2 in May and a minimum monthly mean of molecules cm−2 in November. In most cases, the tropospheric HCN columns at Hefei (32∘ N) are higher than the NDACC FTIR observations. Enhancements of the tropospheric HCN columns were observed between September 2015 and July 2016 compared to the same period of measurements in other years. The magnitude of the enhancement ranges from 5 % to 46 % with an average of 22 %. Enhancement of tropospheric HCN (ΔHCN) is correlated with the coincident enhancement of tropospheric CO (ΔCO), indicating that enhancements of tropospheric CO and HCN were due to the same sources.
The GEOS-Chem tagged CO simulation, the global fire maps, and the PSCF analysis revealed that the seasonal maxima in May are largely due to the influence of biomass burning in Southeast Asia (SEAS) (41±13.1 %), Europe and boreal Asia (EUBA) (21±9.3 %), and Africa (AF) (22±4.7 %). The seasonal maxima in September are largely due to the influence of biomass burnings in EUBA (38±11.3 %), AF (26±6.7 %), SEAS (14±3.3 %), and NA (13.8±8.4 %). For the seasonal maxima in December, dominant contributions are from AF (36±7.1 %), EUBA (21±5.2 %), and NA (18.7±5.2 %).
The enhancements of both tropospheric HCN and CO columns between September 2015 and July 2016 at Hefei (32∘ N) were attributed to an elevated influence of biomass burnings in SEAS, EUBA, and Oceania (OCE) in this period. In particular, an elevated number of fires in OCE in the second half of 2015 dominated the tropospheric HCN enhancement between September and December 2015. An elevated number of fires in SEAS in the first half of 2016 dominated the tropospheric HCN enhancement between January and July 2016.
Most high-resolution FTIR instruments are located in Europe and North America, whereas sites in Asia, Africa, and South America are very sparse. As one of few FTIR stations on the Asian continent, the long-term observations of trace gases at Hefei are crucial to understanding global warming, regional pollution, and long-term transport. They also contribute to the evaluation of satellite data and model simulations.
The CO and HCN measurements at the selected NDACC sites can be found at the NDACC data repository (ftp://ftp.cpc.ncep.noaa.gov/ndacc/, last access: 8 May 2020), and the CO and HCN measurements at Hefei are available on request.
The supplement related to this article is available online at: https://doi.org/10.5194/acp-20-5437-2020-supplement.
YS conceived the concept and prepared the paper with input from all coauthors. CL, WW, CS, HY, XX, MZ, and JL carried out the experiments. The rest of the authors contributed to this work by providing refined data or constructive comments.
The authors declare that they have no conflict of interest.
The processing and postprocessing environment for SFIT4 is provided by the National Center for Atmospheric Research (NCAR), Boulder, Colorado, USA. The NDACC network is acknowledged for supplying the SFIT software and the HCN and CO data. The LINEFIT code is provided by Frank Hase, Karlsruhe Institute of Technology (KIT), Institute for Meteorology and Climate Research (IMK-ASF), Germany. The MeteoInfo software is provided by Yaqiang Wang, Chinese Academy of Meteorological Sciences. The authors acknowledge the NOAA Air Resources Laboratory (ARL) for making the HYSPLIT transport and dispersion model available on the internet. The Mauna Loa (20∘ N) FTIR site is operated by the National Center for Atmospheric Research (NCAR), USA, and the Lauder (45∘ S) and Arrival Heights (78∘ S) sites are operated by the National Institute of Water & Atmospheric Research, New Zealand. The multidecadal monitoring program of ULiege at the Jungfraujoch station has been primarily supported by the FRS-FNRS and BELSPO (both in Brussels, Belgium) and by the GAW-CH program of MeteoSwiss. The International Foundation High Altitude Research Stations Jungfraujoch and Gornergrat (HFSJG, Bern, Switzerland) supported the facilities needed to perform the FTIR observations.
This work is jointly supported by the National High Technology Research and Development Program of China (grant nos. 2019YFC0214802, 2017YFC0210002, 2016YFC0203302, 2018YFC0213201, 2019YFC0214702, and 2016YFC0200404), the National Science Foundation of China (grant nos. 41877309, 41775025, 41575021, 51778596, 91544212, 41722501, and 51778596), the Sino-German Mobility Programme (grant no. M-0036), and the Outstanding Youth Science Foundation (grant no. 41722501).
This paper was edited by Gabriele Stiller and reviewed by two anonymous referees.
Akagi, S. K., Yokelson, R. J., Wiedinmyer, C., Alvarado, M. J., Reid, J. S., Karl, T., Crounse, J. D., and Wennberg, P. O.: Emission factors for open and domestic biomass burning for use in atmospheric models, Atmos. Chem. Phys., 11, 4039–4072, https://doi.org/10.5194/acp-11-4039-2011, 2011.
Akagi, S. K., Craven, J. S., Taylor, J. W., McMeeking, G. R., Yokelson, R. J., Burling, I. R., Urbanski, S. P., Wold, C. E., Seinfeld, J. H., Coe, H., Alvarado, M. J., and Weise, D. R.: Evolution of trace gases and particles emitted by a chaparral fire in California, Atmos. Chem. Phys., 12, 1397–1421, https://doi.org/10.5194/acp-12-1397-2012, 2012.
Andreae, M. O. and Merlet, P.: Emission of trace gases and aerosols from biomass burning, Global Biogeochem. Cy., 15, 955–966, https://doi.org/10.1029/2000gb001382, 2001.
Ashbaugh, L. L., Malm, W. C., and Sadeh, W. Z.: A residence time probability analysis of sulfur concentrations at Grand Canyon National Park, Atmos. Environ., 19, 1263–1270, 1985.
Bange, H. W. and Williams, J.: New Directions: Acetonitrile in atmospheric and biogeochemical cycles, Atmos. Environ., 34, 4959–4960, https://doi.org/10.1016/s1352-2310(00)00364-2, 2000.
Barret, B., De Mazière, M., and Mahieu, E.: Ground-based FTIR measurements of CO from the Jungfraujoch: characterisation and comparison with in situ surface and MOPITT data, Atmos. Chem. Phys., 3, 2217–2223, https://doi.org/10.5194/acp-3-2217-2003, 2003.
Bertschi, I., Yokelson, R. J., Ward, D. E., Babbitt, R. E., Susott, R. A., Goode, J. G., and Hao, W. M.: Trace gas and particle emissions from fires in large diameter and belowground biomass fuels, J. Geophys. Res.-Atmos., 108, 8472, https://doi.org/10.1029/2002jd002100, 2003.
Bey, I., Jacob, D. J., Yantosca, R. M., Logan, J. A., Field, B. D., Fiore, A. M., Li, Q., Liu, H. Y., Mickley, L. J., and Schultz, M. G.: Global modeling of tropospheric chemistry with assimilated meteorology: Model description and evaluation, J. Geophys. Res., 106, 23073–23095, https://doi.org/10.1029/2001jd000807, 2001.
Chan, K. L.: Biomass burning sources and their contributions to the local air quality in Hong Kong, Sci. Total Environ., 596, 212–221, https://doi.org/10.1016/j.scitotenv.2017.04.091, 2017.
Chan, K. L., Wiegner, M., Wenig, M., and Poehler, D.: Observations of tropospheric aerosols and NO2 in Hong Kong over 5 years using ground based MAX-DOAS, Sci. Total Environ., 619, 1545–1556, https://doi.org/10.1016/j.scitotenv.2017.10.153, 2018.
De Mazière, M., Thompson, A. M., Kurylo, M. J., Wild, J. D., Bernhard, G., Blumenstock, T., Braathen, G. O., Hannigan, J. W., Lambert, J.-C., Leblanc, T., McGee, T. J., Nedoluha, G., Petropavlovskikh, I., Seckmeyer, G., Simon, P. C., Steinbrecht, W., and Strahan, S. E.: The Network for the Detection of Atmospheric Composition Change (NDACC): history, status and perspectives, Atmos. Chem. Phys., 18, 4935–4964, https://doi.org/10.5194/acp-18-4935-2018, 2018.
Di Giuseppe, F., Rémy, S., Pappenberger, F., and Wetterhall, F.: Using the Fire Weather Index (FWI) to improve the estimation of fire emissions from fire radiative power (FRP) observations, Atmos. Chem. Phys., 18, 5359–5370, https://doi.org/10.5194/acp-18-5359-2018, 2018.
Dimitriou, K. and Kassomenos, P.: Three year study of tropospheric ozone with back trajectories at a metropolitan and a medium scale urban area in Greece, Sci. Total Environ., 502, 493–501, 2015.
Fisher, J. A., Murray, L. T., Jones, D. B. A., and Deutscher, N. M.: Improved method for linear carbon monoxide simulation and source attribution in atmospheric chemistry models illustrated using GEOS-Chem v9, Geosci. Model Dev., 10, 4129–4144, https://doi.org/10.5194/gmd-10-4129-2017, 2017.
Guenther, A. B., Jiang, X., Heald, C. L., Sakulyanontvittaya, T., Duhl, T., Emmons, L. K., and Wang, X.: The Model of Emissions of Gases and Aerosols from Nature version 2.1 (MEGAN2.1): an extended and updated framework for modeling biogenic emissions, Geosci. Model Dev., 5, 1471–1492, https://doi.org/10.5194/gmd-5-1471-2012, 2012.
Hase, F.: Improved instrumental line shape monitoring for the ground-based, high-resolution FTIR spectrometers of the Network for the Detection of Atmospheric Composition Change, Atmos. Meas. Tech., 5, 603–610, https://doi.org/10.5194/amt-5-603-2012, 2012.
Hase, F., Hannigan, J. W., Coffey, M. T., Goldman, A., Höpfner, M., Jones, N. B., Rinsland, C. P., and Wood, S. W.: Intercomparison of retrieval codes used for the analysis of high-resolution, ground-based FTIR measurements, J. Quant. Spectrosc. Ra., 87, 25–52, 2004.
Hoesly, R. M., Smith, S. J., Feng, L., Klimont, Z., Janssens-Maenhout, G., Pitkanen, T., Seibert, J. J., Vu, L., Andres, R. J., Bolt, R. M., Bond, T. C., Dawidowski, L., Kholod, N., Kurokawa, J.-I., Li, M., Liu, L., Lu, Z., Moura, M. C. P., O'Rourke, P. R., and Zhang, Q.: Historical (1750–2014) anthropogenic emissions of reactive gases and aerosols from the Community Emissions Data System (CEDS), Geosci. Model Dev., 11, 369–408, https://doi.org/10.5194/gmd-11-369-2018, 2018.
Holtslag, A. A. M. and Boville, B. A.: Local Versus Nonlocal Boundary-Layer Diffusion in a Global Climate Model, J. Climate, 6, 1825–1842, https://doi.org/10.1175/1520-0442(1993)006<1825:LVNBLD>2.0.CO;2, 1993.
Holzinger, R., Warneke, C., Hansel, A., Jordan, A., Lindinger, W., Scharffe, D. H., Schade, G., and Crutzen, P. J.: Biomass burning as a source of formaldehyde, acetaldehyde, methanol, acetone, acetonitrile, and hydrogen cyanide, Geophys. Res. Lett., 26, 1161–1164, https://doi.org/10.1029/1999gl900156, 1999.
Kaiser, A., Scheifinger, H., Spangl,W.,Weiss, A., Gilge, S., Fricke, W., Ries, L., Cemas, D., and Jesenovec, B.: Transport of nitrogen oxides, carbon monoxide and ozone to the alpine global atmosphere watch stations Jungfraujoch (Switzerland), Zugspitze and Hohenpeißenberg (Germany), Sonnblick (Austria) and Mt.Krvavec (Slovenia), Atmos. Environ., 41, 9273–9287, 2007.
Kaiser, J. W., Heil, A., Andreae, M. O., Benedetti, A., Chubarova, N., Jones, L., Morcrette, J.-J., Razinger, M., Schultz, M. G., Suttie, M., and van der Werf, G. R.: Biomass burning emissions estimated with a global fire assimilation system based on observed fire radiative power, Biogeosciences, 9, 527–554, https://doi.org/10.5194/bg-9-527-2012, 2012.
Li, M., Zhang, Q., Kurokawa, J.-I., Woo, J.-H., He, K., Lu, Z., Ohara, T., Song, Y., Streets, D. G., Carmichael, G. R., Cheng, Y., Hong, C., Huo, H., Jiang, X., Kang, S., Liu, F., Su, H., and Zheng, B.: MIX: a mosaic Asian anthropogenic emission inventory under the international collaboration framework of the MICS-Asia and HTAP, Atmos. Chem. Phys., 17, 935–963, https://doi.org/10.5194/acp-17-935-2017, 2017.
Li, Q., Palmer, P. I., Pumphrey, H. C., Bernath, P., and Mahieu, E.: What drives the observed variability of HCN in the troposphere and lower stratosphere?, Atmos. Chem. Phys., 9, 8531–8543, https://doi.org/10.5194/acp-9-8531-2009, 2009.
Li, Q. B., Jacob, D. J., Bey, I., Yantosca, R. M., Zhao, Y. J., Kondo, Y., and Notholt, J.: Atmospheric hydrogen cyanide (HCN): Biomass burning source, ocean sink?, Geophys. Res. Lett., 27, 357–360, https://doi.org/10.1029/1999gl010935, 2000.
Li, Q. B., Jacob, D. J., Yantosca, R. M., Heald, C. L., Singh, H. B., Koike, M., Zhao, Y. J., Sachse, G. W., and Streets, D. G.: A global three-dimensional model analysis of the atmospheric budgets of HCN and CH3CN: Constraints from aircraft and ground measurements, J. Geophys. Res.-Atmos., 108, 8827, https://doi.org/10.1029/2002jd003075, 2003.
Liu, H., Jacob, D., J., Bey, I., Yantosca, R., M., and Duncan, B., N.: Transport pathways for asian pollution outflow over the pacific: interannual and seasonal variations, J. Geophys. Res., 108, 8786, https://doi.org/10.1029/2002JD003102, 2003.
Liu, Y., Cobb, K. M., Song, H. M., Li, Q., Li, C. Y., Nakatsuka, T., An, Z. S., Zhou, W. J., Cai, Q. F., Li, J. B., Leavitt, S. W., Sun, C. F., Mei, R. C., Shen, C. C., Chan, M. H., Sun, J. Y., Yan, L. B., Lei, Y., Ma, Y. Y., Li, X. X., Chen, D. L., and Linderholm, H. W.: Recent enhancement of central Pacific El Nino variability relative to last eight centuries, Nat. Commun., 8, 15386, https://doi.org/10.1038/ncomms15386, 2017.
Lobert, J. M., Scharffe, D. H., Hao, W. M., and Crutzen, P. J.: Importance of biomass burning in the atmospheric budgets of nitrogen-containing gases, Nature, 346, 552–554, https://doi.org/10.1038/346552a0, 1990.
Lupu, A., Kaminski, J. W., Neary, L., McConnell, J. C., Toyota, K., Rinsland, C. P., Bernath, P. F., Walker, K. A., Boone, C. D., Nagahama, Y., and Suzuki, K.: Hydrogen cyanide in the upper troposphere: GEM-AQ simulation and comparison with ACE-FTS observations, Atmos. Chem. Phys., 9, 4301–4313, https://doi.org/10.5194/acp-9-4301-2009, 2009.
Lutsch, E., Dammers, E., Conway, S., and Strong, K.: Long-range transport of NH3, CO, HCN, and C2H6 from the 2014 Canadian Wildfires, Geophys. Res. Lett., 43, 8286–8297, https://doi.org/10.1002/2016gl070114, 2016.
Lutsch, E., Strong, K., Jones, D. B. A., Blumenstock, T., Conway, S., Fisher, J. A., Hannigan, J. W., Hase, F., Kasai, Y., Mahieu, E., Makarova, M., Morino, I., Nagahama, T., Notholt, J., Ortega, I., Palm, M., Poberovskii, A. V., Sussmann, R., and Warneke, T.: Detection and Attribution of Wildfire Pollution in the Arctic and Northern Mid-latitudes using a Network of FTIR Spectrometers and GEOS-Chem, Atmos. Chem. Phys. Discuss., https://doi.org/10.5194/acp-2019-881, in review, 2019.
Mahieu, E., Zander, R., Delbouille, L., Demoulin, P., Roland, G., and Servais, C.: Observed trends in total vertical column abundances of atmospheric gases from IR solar spectra recorded at the Jungfraujoch, J. Atmos. Chem., 28, 227–243, https://doi.org/10.1023/a:1005854926740, 1997.
Nagahama, Y. and Suzuki, K.: The influence of forest fires on CO, HCN, C2H6, and C2H2 over northern Japan measured by infrared solar spectroscopy, Atmos. Environ., 41, 9570–9579, https://doi.org/10.1016/j.atmosenv.2007.08.043, 2007.
Notholt, J., Toon, G. C., Rinsland, C. P., Pougatchev, N. S., Jones, N. B., Connor, B. J., Weller, R., Gautrois, M., and Schrems, O.: Latitudinal variations of trace gas concentrations in the free troposphere measured by solar absorption spectroscopy during a ship cruise, J. Geophys. Res.-Atmos., 105, 1337–1349, https://doi.org/10.1029/1999jd900940, 2000.
Polissar, A., Hopke, P., Paatero, P., Kaufmann, Y., Hall, D., Bodhaine, B., Dutton, E., and Harris, J.: The aerosol at Barrow, Alaska: long-term trends and source locations, Atmos. Environ., 33, 2441–2458, 1999.
Rémy, S., Veira, A., Paugam, R., Sofiev, M., Kaiser, J. W., Marenco, F., Burton, S. P., Benedetti, A., Engelen, R. J., Ferrare, R., and Hair, J. W.: Two global data sets of daily fire emission injection heights since 2003, Atmos. Chem. Phys., 17, 2921–2942, https://doi.org/10.5194/acp-17-2921-2017, 2017.
Rinsland, C. P., Jones, N. B., Connor, B. J., Wood, S. W., Goldman, A., Stephen, T. M., Murcray, F. J., Chiou, L. S., Zander, R., and Mahieu, E.: Multiyear infrared solar spectroscopic measurements of HCN, CO, C2H6, and C2H2 tropospheric columns above Lauder, New Zealand (45∘ S latitude), J. Geophys. Res.-Atmos., 107, 4185, https://doi.org/10.1029/2001jd001150, 2002.
Rinsland, C. P., Dufour, G., Boone, C. D., Bernath, P. F., Chiou, L., Coheur, P. F., Turquety, S., and Clerbaux, C.: Satellite boreal measurements over Alaska and Canada during June–July 2004: Simultaneous measurements of upper tropospheric CO, C2H6, HCN, CH3Cl, CH4, C2H2, CH3OH, HCOOH, OCS, and SF6 mixing ratios, Global Biogeochem. Cy., 21, Gb3008, https://doi.org/10.1029/2006gb002795, 2007.
Rodgers, C. D.: Inverse Methods for Atmospheric Sounding: Theory and Practice, Singapore, 2000.
Rodgers, C. D. and Connor, B. J.: Intercomparison of remote sounding instruments, J. Geophys. Res.-Atmos., 108, 4116, https://doi.org/10.1029/2002JD002299, 2003.
Rothman, L. S., Gordon, I. E., Barbe, A., Benner, D. C., Bernath, P. E., Birk, M., Boudon, V., Brown, L. R., Campargue, A., Champion, J. P., Chance, K., Coudert, L. H., Dana, V., Devi, V. M., Fally, S., Flaud, J. M., Gamache, R. R., Goldman, A., Jacquemart, D., Kleiner, I., Lacome, N., Lafferty, W. J., Mandin, J. Y., Massie, S. T., Mikhailenko, S. N., Miller, C. E., Moazzen-Ahmadi, N., Naumenko, O. V., Nikitin, A. V., Orphal, J., Perevalov, V. I., Perrin, A., Predoi-Cross, A., Rinsland, C. P., Rotger, M., Simeckova, M., Smith, M. A. H., Sung, K., Tashkun, S. A., Tennyson, J., Toth, R. A., Vandaele, A. C., and Vander Auwera, J.: The HITRAN 2008 molecular spectroscopic database, J. Quant. Spectrosc. Ra., 110, 533–572, https://doi.org/10.1016/j.jqsrt.2009.02.013, 2009.
Schaefer, H., Smale, D., Nichol, S. E., Bromley, T. M., Brailsford, G. W., Martin, R. J., Moss, R., Englund Michel, S., and White, J. W. C.: Limited impact of El Niño–Southern Oscillation on variability and growth rate of atmospheric methane, Biogeosciences, 15, 6371–6386, https://doi.org/10.5194/bg-15-6371-2018, 2018.
Sun, Y., Liu, C., Palm, M., Vigouroux, C., Notholt, J., Hu, Q., Jones, N., Wang, W., Su, W., Zhang, W., Shan, C., Tian, Y., Xu, X., De Mazière, M., Zhou, M., and Liu, J.: Ozone seasonal evolution and photochemical production regime in the polluted troposphere in eastern China derived from high-resolution Fourier transform spectrometry (FTS) observations, Atmos. Chem. Phys., 18, 14569–14583, https://doi.org/10.5194/acp-18-14569-2018, 2018a.
Sun, Y., Palm, M., Liu, C., Hase, F., Griffith, D., Weinzierl, C., Petri, C., Wang, W., and Notholt, J.: The influence of instrumental line shape degradation on NDACC gas retrievals: total column and profile, Atmos. Meas. Tech., 11, 2879–2896, https://doi.org/10.5194/amt-11-2879-2018, 2018b.
Tang, G., Wang, Y., Li, X., Ji, D., Hsu, S., and Gao, X.: Spatial-temporal variations in surface ozone in Northern China as observed during 2009–2010 and possible implications for future air quality control strategies, Atmos. Chem. Phys., 12, 2757–2776, https://doi.org/10.5194/acp-12-2757-2012, 2012.
Tian, Y., Sun, Y., Liu, C., Wang, W., Shan, C., Xu, X., and Hu, Q.: Characterisation of methane variability and trends from near-infrared solar spectra over Hefei, China, Atmos. Environ., 173, 198–209, https://doi.org/10.1016/j.atmosenv.2017.11.001, 2017.
Viatte, C., Strong, K., Walker, K. A., and Drummond, J. R.: Five years of CO, HCN, C2H6, C2H2, CH3OH, HCOOH and H2CO total columns measured in the Canadian high Arctic, Atmos. Meas. Tech., 7, 1547–1570, https://doi.org/10.5194/amt-7-1547-2014, 2014.
Viatte, C., Strong, K., Hannigan, J., Nussbaumer, E., Emmons, L. K., Conway, S., Paton-Walsh, C., Hartley, J., Benmergui, J., and Lin, J.: Identifying fire plumes in the Arctic with tropospheric FTIR measurements and transport models, Atmos. Chem. Phys., 15, 2227–2246, https://doi.org/10.5194/acp-15-2227-2015, 2015.
Vigouroux, C., Stavrakou, T., Whaley, C., Dils, B., Duflot, V., Hermans, C., Kumps, N., Metzger, J.-M., Scolas, F., Vanhaelewyn, G., Müller, J.-F., Jones, D. B. A., Li, Q., and De Mazière, M.: FTIR time-series of biomass burning products (HCN, C2H6, C2H2, CH3OH, and HCOOH) at Reunion Island (21∘ S, 55∘ E) and comparisons with model data, Atmos. Chem. Phys., 12, 10367–10385, https://doi.org/10.5194/acp-12-10367-2012, 2012.
Wang, T., Xue, L. K., Brimblecombe, P., Lam, Y. F., Li, L., and Zhang, L.: Ozone pollution in China: A review of concentrations, meteorological influences, chemical precursors, and effects, Sci. Total Environ., 575, 1582–1596, https://doi.org/10.1016/j.scitotenv.2016.10.081, 2017.
Xiaoyan, W., Huixiang, W., and Shaoli, W.: Ambient formaldehyde and its contributing factor to ozone and OH radical in a rural area, Atmos. Environ., 44, 2074–2078, https://doi.org/10.1016/j.atmosenv.2010.03.023, 2010.
Xing, C., Liu, C., Wang, S., Chan, K. L., Gao, Y., Huang, X., Su, W., Zhang, C., Dong, Y., Fan, G., Zhang, T., Chen, Z., Hu, Q., Su, H., Xie, Z., and Liu, J.: Observations of the vertical distributions of summertime atmospheric pollutants and the corresponding ozone production in Shanghai, China, Atmos. Chem. Phys., 17, 14275–14289, https://doi.org/10.5194/acp-17-14275-2017, 2017.
Yevich, R. and Logan, J. A.: An assessment of biofuel use and burning of agricultural waste in the developing world, Global Biogeochem. Cy., 17, 1095, https://doi.org/10.1029/2002GB001952, 2003.
Yin, X., Kang, S., de Foy, B., Cong, Z., Luo, J., Zhang, L., Ma, Y., Zhang, G., Rupakheti, D., and Zhang, Q.: Surface ozone at Nam Co in the inland Tibetan Plateau: variation, synthesis comparison and regional representativeness, Atmos. Chem. Phys., 17, 11293–11311, https://doi.org/10.5194/acp-17-11293-2017, 2017.
Yokelson, R. J., Susott, R., Ward, D. E., Reardon, J., and Griffith, D. W. T.: Emissions from smoldering combustion of biomass measured by open-path Fourier transform infrared spectroscopy, J. Geophys. Res.-Atmos., 102, 18865–18877, https://doi.org/10.1029/97jd00852, 1997.
York, D., Evensen, N. M., Martinez, M. L., and Delgado, J. D.: Unified equations for the slope, intercept, and standard errors of the best straight line, Am. J. Phys., 72, 367–375, https://doi.org/10.1119/1.1632486, 2004.
Zeng, G., Wood, S. W., Morgenstern, O., Jones, N. B., Robinson, J., and Smale, D.: Trends and variations in CO, C2H6, and HCN in the Southern Hemisphere point to the declining anthropogenic emissions of CO and C2H6, Atmos. Chem. Phys., 12, 7543–7555, https://doi.org/10.5194/acp-12-7543-2012, 2012.
Zhang, C., Liu, C., Hu, Q., Cai, Z., Su, W., Xia, C., Zhu, Y., Wang, S., and Liu, J.: Satellite UV-Vis spectroscopy: implications for air quality trends and their driving forces in China during 2005–2017, Light: Sci. Appl., 8, 100, https://doi.org/10.1038/s41377-019-0210-6, 2019.
Zhao, Y., Kondo, Y., Murcray, F. J., Liu, X., Koike, M., Irie, H., Strong, K., Suzuki, K., Sera, M., and Ikegami, Y.: Seasonal variations of HCN over northern Japan measured by ground-based infrared solar spectroscopy, Geophys. Res. Lett., 27, 2085–2088, https://doi.org/10.1029/1999gl011218, 2000.
Zhao, Y., Strong, K., Kondo, Y., Koike, M., Matsumi, Y., Irie, H., Rinsland, C. P., Jones, N. B., Suzuki, K., Nakajima, H., Nakane, H., and Murata, I.: Spectroscopic measurements of tropospheric CO, C2H6, C2H2, and HCN in northern Japan, J. Geophys. Res.-Atmos., 107, 4343, https://doi.org/10.1029/2001jd000748, 2002.


