the Creative Commons Attribution 4.0 License.
the Creative Commons Attribution 4.0 License.
 | 29 Apr 2020
High-resolution vertical distribution and sources of HONO and NO2 in the nocturnal boundary layer in urban Beijing, China
Fanhao Meng
Min Qin
Ke Tang
Wu Fang
Shuaixi Liang
Kaidi Ye
Pinhua Xie
Conghui Xie
Chunxiang Ye
Pingqing Fu
Jianguo Liu
Wenqing Liu
Nitrous acid (HONO), an important precursor of the hydroxyl radical (OH), plays a key role in atmospheric chemistry, but its sources are still debated. The production of HONO on aerosol surfaces or on ground surfaces in nocturnal atmospheres remains controversial. The vertical profile provides vertical information on HONO and NO2 to understand the nocturnal HONO production and loss. In this study, we report the first high-resolution (<2.5 m) nocturnal vertical profiles of HONO and NO2 measured from in situ instruments on a movable container that was lifted on the side wiring of a 325 m meteorological tower in Beijing, China. High-resolution vertical profiles revealed the negative gradients of HONO and NO2 in nocturnal boundary layers, and a shallow inversion layer affected the vertical distribution of HONO. The vertical distribution of HONO was consistent with stratification and layering in the nocturnal urban atmosphere below 250 m. The increase in the HONO ∕ NO2 ratio was observed throughout the column from the clean episode to the haze episode, and relatively constant HONO∕NO2 ratios in the residual layer were observed during the haze episode. Direct HONO emissions from traffic contributed 29.3 % ± 12.4 % to the ambient HONO concentrations at night. The ground surface dominates HONO production by heterogeneous uptake of NO2 during clean episodes. In contrast, the HONO production on aerosol surfaces (30–300 ppt) explained the observed HONO increases (15–368 ppt) in the residual layer, suggesting that the aerosol surface dominates HONO production aloft during haze episodes, while the surface production of HONO and direct emissions into the overlying air are minor contributors. Average dry deposition rates of 0.74±0.31 and 1.55±0.32 ppb h−1 were estimated during the clean and haze episodes, respectively, implying that significant quantities of HONO could be deposited to the ground surface at night. Our results highlight the ever-changing contributions of aerosol and ground surfaces in nocturnal HONO production at different pollution levels and encourage more vertical gradient observations to evaluate the contributions from varied HONO sources.
- Article
(1925 KB) - Full-text XML
-
Supplement
(1028 KB) - BibTeX
- EndNote


It is well known that the rapid photolysis of nitrous acid (HONO) (Reaction R1) after sunrise is the most important hydroxyl radical (OH) source. A total of 25 %–60 % of daytime OH production was accounted for due to HONO photolysis, according to previous reports (Lu et al., 2012; Ma et al., 2017; Tong et al., 2016; Su et al., 2008b; Huang et al., 2017; Spataro et al., 2013). OH initiates daytime photochemistry and promotes the formation of secondary products (including ozone, O3, and peroxyacetyl nitrate, PAN) and secondary aerosols (Alicke et al., 2002; Tang et al., 2015; Kleffmann, 2007; An et al., 2012). In addition, HONO as a nitrosating agent forms carcinogenic nitrosamines (Hanst et al., 1977; Pitts et al., 1978), and its health effects have attracted increasing amounts of concern (Sleiman et al., 2010; Bartolomei et al., 2015; Gómez Alvarez et al., 2014).
Despite the importance of HONO, the details of the formation processes of HONO in the atmosphere have been debated for decades. New state-of-the-art science instruments have observed much higher daytime HONO concentrations than simulated values from atmospheric chemical models in both rural and urban areas, implying missing HONO sources (Li et al., 2012, 2014; Wang et al., 2017; Oswald et al., 2015; Wong et al., 2012; Y. H. Liu et al., 2019; Karamchandani et al., 2015; Kleffmann, 2007; Mendez et al., 2017; Michoud et al., 2014, 2015; Tang et al., 2015; Vogel et al., 2003; Sörgel et al., 2011). Several homogeneous reaction mechanisms for HONO have been proposed, but the latter have been considered irrelevant under actual atmospheric conditions, including photolysis of ortho-substituted nitroaromatics (Bejan et al., 2006) and the reaction of photoexcited NO2 with H2O (Li et al., 2008). The heterogeneous reduction of NO2 with organic substrates is proposed to be another effective pathway to generate HONO (Brigante et al., 2008; Stemmler et al., 2006; George et al., 2005; Han et al., 2016, 2017). However, extrapolation of lab results to real surfaces remains challenging. The nocturnal production of HONO has been considered to be dominated by the NO2 heterogeneous reaction (Reaction R2). Although the heterogeneous reaction (Reaction R2) of HONO formation is of the first order in NO2, the mechanism for the conversion of NO2 on surfaces remains unclear (Finlayson-Pitts et al., 2003; Finlayson-Pitts, 2009).
A few studies have evaluated the relative importance of aerosol and ground surfaces in the nocturnal production of HONO via Reaction (R2). The heterogeneous reaction on ground surfaces has been suggested as the primary nocturnal HONO source based on vertical measurements and fluxes in HONO (Harrison and Kitto, 1994; Harrison et al., 1996; Laufs et al., 2017; Kleffmann et al., 2003; Su et al., 2008b; VandenBoer et al., 2013; Villena et al., 2011; Wong et al., 2011, 2013; Stutz et al., 2002; Ye et al., 2017; Zhang et al., 2009). However, other ground level studies have found significantly positive correlations between HONO ∕ NO2 and aerosol surface areas, which suggests that the aerosols play an important role in the heterogeneous conversion of NO2 to HONO (Reisinger, 2000; Cui et al., 2018; Zhang et al., 2018; Hou et al., 2016; Tong et al., 2016; An et al., 2012; Bao et al., 2018; Liu et al., 2014). Therefore, the primary reaction surfaces for the nighttime HONO formation are still controversial, and the role of the aerosols in the heterogeneous production of HONO remains an open question.
Vertical gradient observations provide evidence regarding surfaces and in situ HONO formation, which can help understanding of the nighttime HONO sources. Methods of long-path differential optical absorption spectroscopy (LP-DOAS) (Stutz et al., 2002; Wong et al., 2011, 2012), instruments mounted on a movable elevator of a tall tower or a fixed height on a building (Kleffmann et al., 2003; VandenBoer et al., 2013; Villena et al., 2011), and aircraft measurements (Zhang et al., 2009; Li et al., 2014; Ye et al., 2018) have been applied for HONO vertical gradient observations in Europe and the Americas. To determine the surface responsible for nocturnal HONO formation, Kleffmann et al. (2003) and Wong et al. (2011) measured the HONO vertical gradient between 10 and 190 m altitude in a semi-rural area in Germany and at three different height intervals (lower: 20–70 m, middle: 70–130 m, and upper: 130–300 m) in downtown Houston. Their consistent conclusion was that the reaction on the ground surfaces dominated the nocturnal formation of HONO. However, these types of measurements are limited by the measurement frequency or vertical resolution between the surface and the planetary boundary layer (PBL). VandenBoer et al. (2013) performed measurements of high-resolution vertical profiles (vertical resolution ∼ 10 m) of HONO on a 300 m tower. The total column observations of HONO also showed the ground as the dominant nocturnal surface on which HONO was generated from the heterogeneous reaction of NO2. The vertical information of HONO was interpreted in conjunction with a chemical model. The results suggested that a conservative surface reservoir that was formed by the deposition of HONO could be a significant fraction of the unknown daytime source. Furthermore, in an attempt to understand the importance of HONO photochemistry in the troposphere, HONO gradients were measured in the PBL and the lower free troposphere (FT) over a forested region in Michigan (Zhang et al., 2009). An evaluation of the relative importance of aerosol and ground surfaces for the heterogeneous production of HONO also suggested that the ground surface was a major HONO source in the lower boundary layer. In addition, a substantial amount of daytime HONO existed in the FT (∼8 ppt).
Beijing, as the largest and the most densely populated city in China, has suffered from severe haze pollution for several years due to rapid economic development and urbanization. Several ground-based observations of HONO have been conducted in urban and suburban areas of Beijing in recent years (Tong et al., 2016; Zhang et al., 2018; Hou et al., 2016; Wang et al., 2017; Lu et al., 2012; Hendrick et al., 2014). Higher levels of HONO have been observed (up to 9.71 ppb) in Beijing during winter (Spataro et al., 2013). Although few near-real-time HONO vertical gradients have been made, and they have suggested that the reaction at the ground surface is the most important nighttime HONO source (Kleffmann et al., 2003; VandenBoer et al., 2013; Wong et al., 2012; Zhang et al., 2009), the relative importance of aerosol and ground surface in the production of nocturnal HONO may be different in the Beijing region. First, as the primary precursor of nighttime HONO, NO2 has a much higher concentration during winter in Beijing due to the burning of fossil fuels and vehicle emissions. Second, the aerosol surface area has been reported to be 2 to 3 orders of magnitude higher than the typical background area (Cai et al., 2017; Liu et al., 2012; Zhang et al., 2015). High aerosol surface area levels favor aerosol surfaces for heterogeneous reactions (haze period: 3000 µm2 cm−3; Wang et al., 2018), which presumably makes aerosol surfaces more important in the production of nighttime HONO. Third, there is more stable nocturnal stratification during the haze period in winter in Beijing, which may have influenced the vertical distribution of HONO. The contribution of the surface production of HONO to HONO levels aloft may be overestimated.
In this study, the first high-resolution vertical profile measurements of HONO and NO2 in the megacity of Beijing at different pollution levels (following the transition from a clean episode to a haze episode) are reported. The vertical profiles of HONO and NO2 are measured at high vertical resolution (<2.5 m over 240 m height) between the surface, the nocturnal boundary layer, and the residual layer. Although the vertical profile measurements are rather limited in scope, including only four nights in December 2016, with limited ancillary data, this study is unique due to the high vertical resolution obtained and due to the continuous HONO and NO2 vertical measurements obtained at different stages of pollution. The vertical profiles are then interpreted to evaluate the aerosol and ground surfaces responsible for the nighttime HONO formation during different pollution periods. The vertical measurements and simultaneous observations at ground level are then used to identify and quantify nighttime HONO sources.
2.1 Measurement site
Vertical profile measurements were conducted from 7 to 12 December 2016 at the Tower Branch of the Institute of Atmospheric Physics (IAP), Chinese Academy of Sciences (39∘58′ N, 116∘23'′ ), as part of the “In-depth study of air pollution sources and processes within Beijing and its surrounding region (APHH-Beijing)” winter campaign. The site is a typical urban residential area located between the 3rd and 4th Ring Road in the north of Beijing. It is approximately 1 km from the 3rd Ring Road, 200 m from the Beijing–Tibet Expressway, and 50 m from the Beitucheng West Road (Fig. S1 in the Supplement). The primary sampling platform was the Beijing 325 m meteorological tower (BMT), equipped with an external container that was lifted on the side wiring of the tower, which could ascend and descend at a relatively constant rate of ∼9 m min−1. A single vertical ascent or descent required less than 30 min. After reaching the top, the container stopped and data were measured continuously for 5–20 min of each cycle. For security reasons, the container reached a maximum height limit of 260 m during the daytime and 240 m at night (Fig. 1). The container instruments included the following: a global positioning system (GPS), an altimeter, and an incoherent broadband cavity enhanced absorption spectrometer (IBBCEAS) for measurements of HONO and NO2. In addition, another IBBCEAS was mounted in temperature-stabilized lab containers for the measurement of HONO and NO2 at ground level.
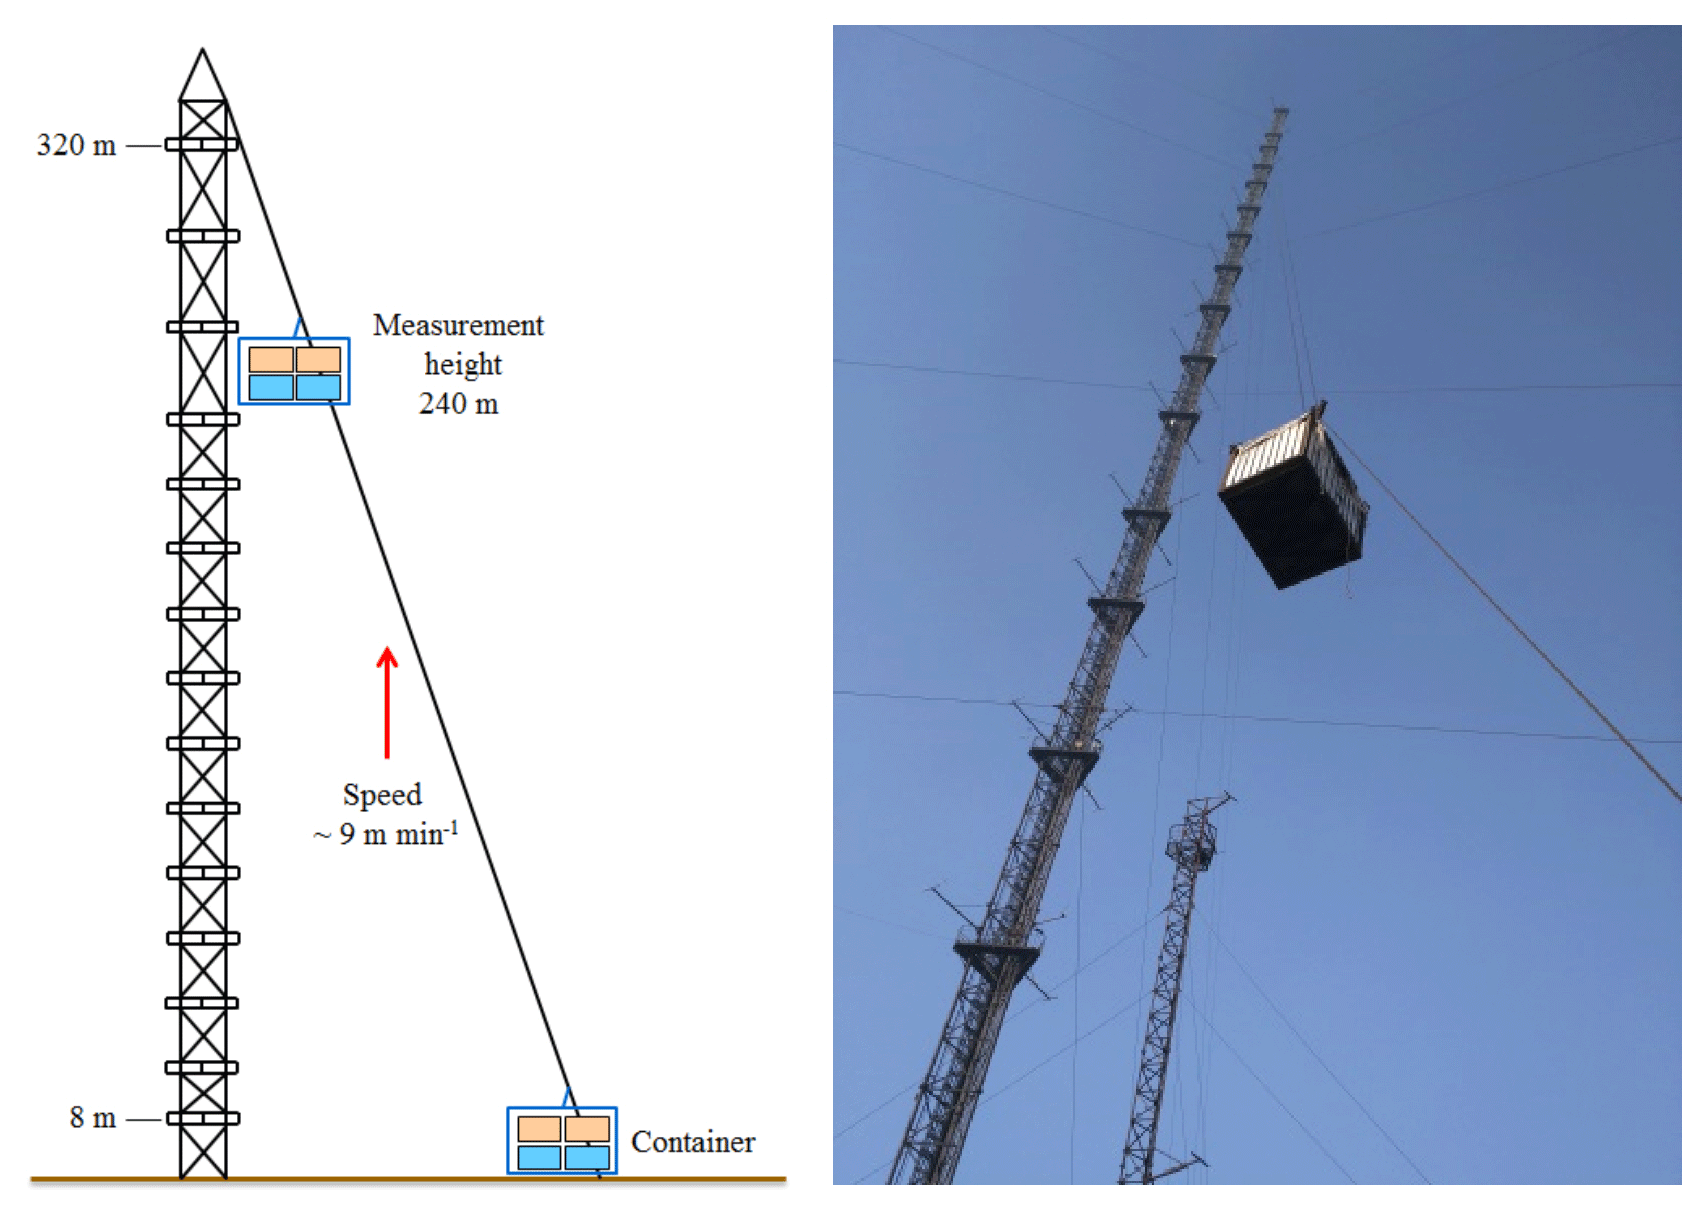
Figure 1The Beijing 325 m meteorological tower (BMT) at the Institute of Atmospheric Physics (IAP).
2.2 Instrumentation
HONO and NO2 were simultaneously measured using a in-house-made IBBCEAS. A detailed description of the IBBCEAS instrument can be found in Duan et al. (2018), and its application to the measurement made during this study is described below. IBBCEAS is a spectroscopic technique that combines a broad-band light source (UV-LED) with the principle of time-integrated cavity output spectroscopy. The HONO was sampled into an inlet tube (1.5 m length with a 4 mm outside diameter – OD) before entering an optical cavity (550 mm in length and 25.4 mm OD) that utilized PFA to minimize the HONO loss. The sampling gas flow rate was controlled at six standard liters per minute (SLPM) by a gas pump (KNF Neuberger GmbH, Freiburg, Germany). In the optical cavity, light was reflected between the two highly reflective mirrors (R=99.980 % at 368 nm, CRD Optics, California, USA) to obtain a long optical absorption length (the total optical path ∼ 4.5 km). To protect the highly reflective mirrors, pure N2 was used to continuously purge the mirrors to prevent contact between the mirrors and the sample airflow. The purge flow rate was controlled at 0.1 SLPM using mass flow controllers (MFCs, CS200A, Sevenstar, Beijing, China). In this study, the IBBCEAS instrument was mounted in a movable container of the BMT for vertical profile measurements, and this made measurements with a time resolution of 15 s (vertical resolution of 2.4 m). The 3σ detection limits for HONO and NO2 were 360 and 600 ppt, respectively. Another IBBCEAS instrument was mounted in temperature-stabilized lab containers at ground level, and it collected data with a time resolution of 30 s. The detection limits for HONO and NO2 were 270 and 510 ppt, respectively. The total relative uncertainty of the IBBCEAS instrument was 8.7 %, and it considered the uncertainty in the cross section (5 %), the calibration of reflectivity (5 %), spectral fitting (4 %), the effective cavity length (3 %), the pressure in the cavity (1 %), ΔI∕I0 (1 %), and sample loss (0.5 %). Correction of the light intensity was performed every hour, and the mirror reflectivity was calibrated daily.
Meteorological parameters that included wind speed (WS), wind direction (WD), temperature (T), and relative humidity (RH) were obtained using a 15-level meteorological gradient observation system installed at fixed intervals along the meteorological tower (at heights of 8, 15, 32, 47, 65, 80, 100, 120, 140, 160, 180, 200, 240, 280, and 320 m). The gaseous species, including nitrogen monoxide (NO), ozone (O3), and carbon monoxide (CO), were measured using a commercial gas analyzer from Thermo Scientific (Waltham, Massachusetts, USA) (Tan et al., 2017). NO was detected using NO–O3 chemiluminescence (Model 42iTL, Thermo Scientific), with an accuracy of ±20 % and a detection limit of 50 ppt. O3 and CO were measured by an O3 analyzer (Model 49i, Thermo Scientific) and a CO analyzer (Model 48iTLE, Thermo Scientific), with the detection limits of 0.50 ppb and 0.04 ppm, and an O3 accuracy of ±20 %. The seven-wavelength Aethalometer (AE33, Magee Scientific Corp, Berkeley, California, USA) was deployed to measure the black carbon (BC) at a time resolution of 1 min (Xie et al., 2019). Aerosol particles were continuously collected onto a quartz filter in the instrument to measure their light attenuation at 370, 470, 520, 590, 660, 880, and 950 nm. Trace gas (CO and O3) and aerosol parameters (BC; non-refractory submicron aerosol, NR-PM1; and aerosol surface area) were measured simultaneously at ground level and at 260 m on the tower, while NO was measured only at ground level. The NR-PM1 species were measured simultaneously at ground level and at 260 m using an Aerodyne high-resolution time-of-flight aerosol mass spectrometer (AMS) and an aerosol chemical speciation monitor (ACSM), respectively. The detailed sampling setup and calibration of the AMS and ACMS, as well as data analysis, have been described by Xu et al. (2019) and Sun et al. (2013). The dry-state particle number size distributions were measured at ground level and at 260 m using a scanning mobility particle sizer (SMPS) (Du et al., 2017). The particle number size distributions of 15–500 nm were used to calculate the aerosol surface area (Sa) by assuming the particles are spherical in shape. A hygroscopic factor f(RH) was applied to correct Sa to the aerosol surface area in the real atmosphere (Saw) (Li et al., 2012). The Saw was calculated using following equations:
where a and b are the empirical fitting parameters used to estimate f(RH), which were set to 2.06 and 3.6 in urban regions (Liu et al., 2008). The curve-fitting parameters a and b were derived from the measurements in Guangzhou region, which, like Beijing, is one of the mega-cities in China. The uncertainty of Saw was estimated to be ∼30 %, which was associated with the uncertainty from the Sa measurement (∼20 %) and the growth factor (∼20 %).

Figure 2(a) Correlation of NO2 concentration was measured using the two IBBCEAS instruments; (b) correlation of HONO concentration was measured using the two IBBCEAS instruments; (c) an inter-comparison between the IBBCEAS of Cambridge University and the IBBCEAS of the Anhui Institute of Optics and Fine Mechanics (AIOFM). The solid lines (red lines) show the orthogonal linear least squares regression between the two IBBCEAS instruments.
2.3 Inter-comparison
In the present study, the measurements of HONO and NO2 were conducted simultaneously in the container and at ground level. Therefore, the calibration and inter-comparison of the two IBBCEAS instruments were crucial. Comparison experiments were conducted in a temperature-stabilized laboratory. The sampling unit and sampling flow rate of the two instruments were identical to minimize measured deviations. Figure 2 shows the excellent agreement between the two IBBCEAS instruments (HONO: R2=0.99, NO2: R2=0.99), with slopes of 1.00±0.01 (NO2) and 1.00±0.01 (HONO) and small intercepts of 180±90 ppt (NO2) and ppt (HONO).
To verify the relative accuracy of the IBBCEAS instrument, an inter-comparison between the IBBCEAS of this study and the IBBCEAS of Cambridge University was conducted. The HONO measurements from the two different IBBCEAS instruments were highly consistent (R2=0.98, Fig. 2c), with a small intercept and a slope close to 1. The difference of 4 % was within the range of the instrumental measurement error. In addition, the IBBCEAS instrument was also compared with the long optical path absorption photometer (LOPAP) and the stripping coil ion chromatography (SC-IC) from our previous studies (Tang et al., 2019; Duan et al., 2018). This also showed good agreement with the HONO measurements (LOPAP: R2=0.894, SC-IC: R2=0.98). The regression slope and intercept of LOPAP to IBBCEAS was 0.941±0.0069 and 0.110±0.0089, respectively, with a difference of ∼6 %. The linear regression of IBBCEAS against the SC-IC exhibited a slope of 0.82 with an intercept of 0.22. The difference of ∼8 % between the two instruments may be caused by the gas sampling.
3.1 General observations and vertical measurements
The time series of meteorological parameters, trace gases, and aerosol parameters are shown in Fig. 3. Based on the NR-PM1 mass concentration level, three different meteorological conditions were characterized during the measurement periods (Table 1). The first episode (E1) from 7 December to 10:00 LT on 8 December was a haze event. The NR-PM1 mass concentration increased rapidly from 30 to ∼150 µg m−3 at ground level and at 260 m on the tower due to a low wind speed (0.78±0.42 m s−1) and a high RH (51 % ± 13 %).
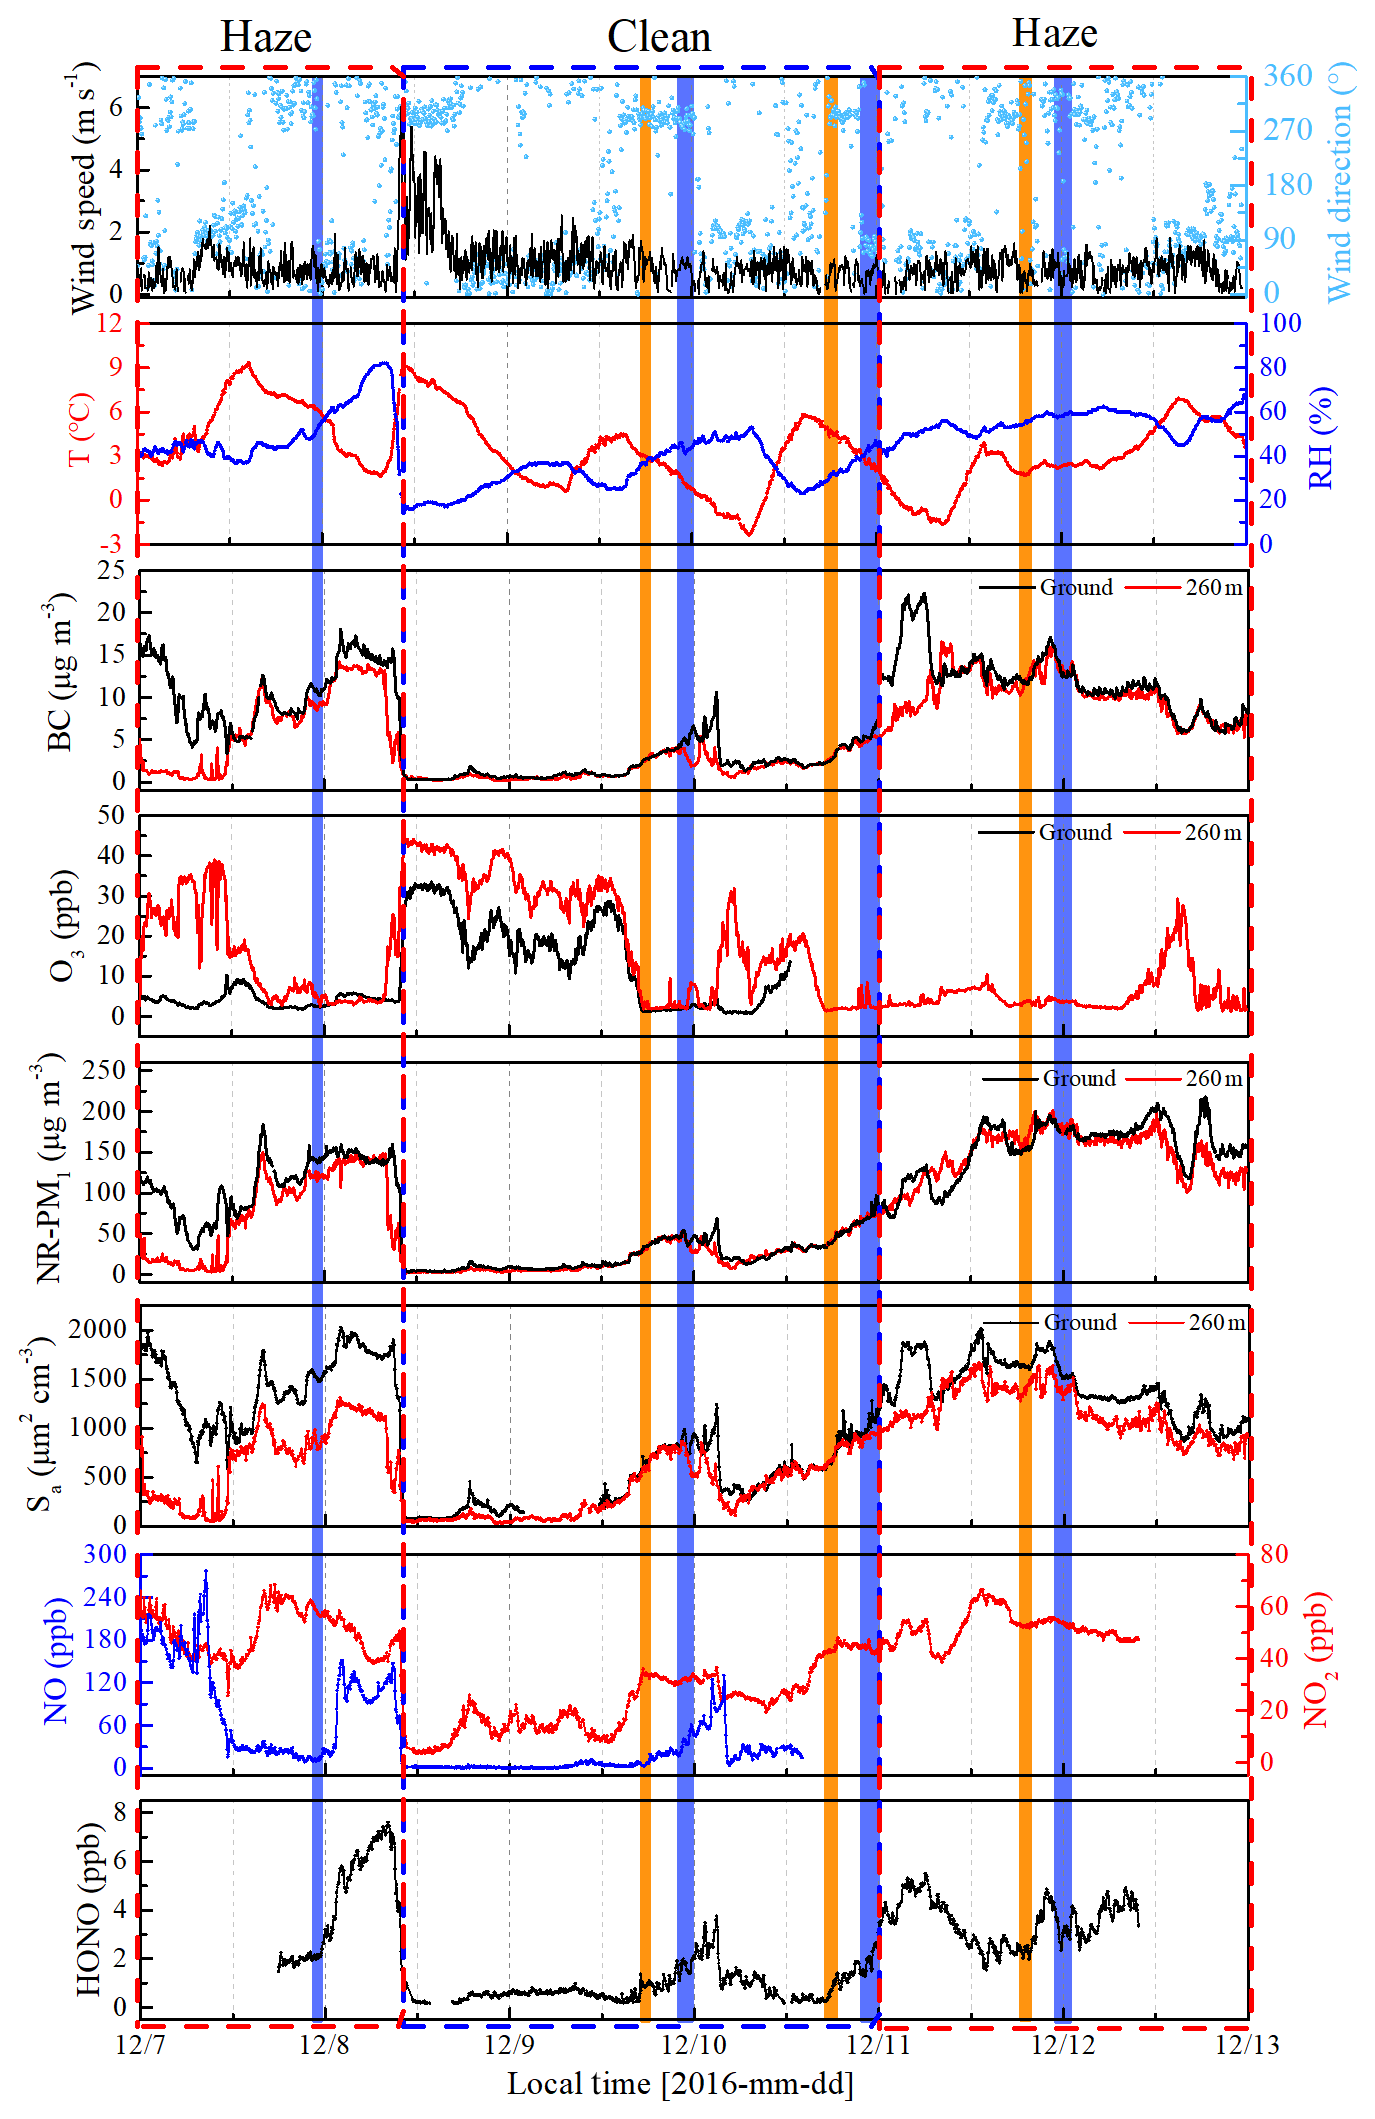
Figure 3Time series of wind speed (WS) and direction (WD), temperature (T), relative humidity (RH), BC, O3, NR-PM1, aerosol surface area (Sa), NO, NO2, and HONO from 7 to 12 December 2016 at the IAP Tower Division in Beijing, China. The measurements of NO, NO2, and HONO are made at the ground level. The shaded region represents the eight vertical measurements (Table S1). The orange shaded region represents the vertical measurements after sunset, and the violet shaded region represents the vertical measurements at night and midnight.
Table 1Classification of the meteorological conditions and corresponding concentrations of NR-PM1, NO2, and HONO from 7 to 12 December.
* NE: northeast; ESE: east-southeast; NW: northwest.
The second episode (8–11 December, C2) was a clean event with low NR-PM1 mass loading (mean: 24±19 µg m−3) and a high wind speed (>5 m s−1), primarily from the northwest. The third episode (E3) from 11 to 12 December was another haze event. During this period, the atmosphere was characterized by stagnant weather, lower wind speeds (an average of 0.77±0.4 m s−1), and a high RH (55 % ± 5 %). The mass concentration of the NR-PM1 gradually increased and then remained at relatively constant levels at ground level and 260 m on the tower, ranging from 69 to 218 µg m−3 with a mean value of 154±35 µg m−3.
Throughout the entire measurement periods, HONO concentrations ranged from 0.27 to 7.59 ppb. The mean HONO mixing ratios during E1, C2, and E3 were 4.26±2.08, 0.90±0.65, and 3.54±0.91 ppb, respectively. The maximum HONO concentration was 7.59 ppb, which was observed during E1 (at 08:10 LT on 8 December). From 11 to 12 December the pollutants continuously increased with the stagnant weather. The HONO concentrations remained at high levels, and the daytime mean HONO mixing ratio even reached 3.10±0.92 ppb. Figure 3 also shows the time series of simultaneously measured relevant species. The mean NO2 mixing ratios during E1, C2, and E3 were 51.98±8.41, 23.30±11.91, and 51.88±5.97 ppb, respectively. Because NO and O3 were not measured at ground level after 14:00 LT on 10 December, the mean concentrations of NO and O3 during E1 were 90.99±67.98 and 14.66±21.79 ppb, while the concentration of NO and O3 during C2 were 4.04±1.81 and 14.37±10.65 ppb, respectively. After sunset, the concentration of O3 at the surface was rapidly titrated due to the elevated NO and increased with an increase in height. The mixing ratio of O3 below 260 m was less than 9 ppb during the vertical measurements. The BC, NR-PM1, and aerosol surface area showed very similar patterns both at ground level and at 260 m. The RH-corrected aerosol surface area (Saw) is shown in Fig. S2. Higher BC, NR-PM1, and Saw levels were observed at ground level during the haze periods (E1 and E3).
Nocturnal stable surface layers of air generally form at low wind speeds (<6 m s−1) (VandenBoer et al., 2013). Hence, the vertical profile data were used when the wind speeds were less than 6 m s−1, except on 7 December. Vertical measurements during low wind events were successfully conducted on three occasions (9–10, 10–11, and 11–12 December) and will be discussed below. The near-continuous vertical measurements avoided the observation bias from prolonged fixed sampling. The date and time of the measurement for each vertical profile is detailed in Table S1 in the Supplement.
3.2 Nocturnal HONO vertical profiles
3.2.1 Vertical measurements after sunset
Vertical measurements were conducted from ground level to 240 m after sunset. The mixing ratios of HONO and NO2 at ground level were consistent with those measured in the container. The mixing ratios of HONO and NO2 showed nearly flat profiles throughout the column during C2 and E3 (Fig. S3), indicating that HONO and NO2 were relatively well mixed after sunset. The vertical variations of HONO, which are the differences in the HONO concentrations between measured in the container and at ground level, centered around 0 ppb. The variations of HONO throughout the column were close to the detection limit of the IBBCEAS instrument and were barely observed. This result also indicated the relatively uniform vertical distribution of HONO. The vertical variations in T and RH during these three vertical measurements were similar (Fig. S4). While T decreased gradually with increasing height, RH increased gradually with increasing height. In addition, RH was relatively higher during the haze episode. Also, there was no T inversion just after sunset, and the consistent variations in the HONO and NO2 at ground level and in the vertical measurements all supported a relatively well-mixed boundary layer, which explained the uniform vertical distribution of HONO and NO2.
3.2.2 Nocturnal vertical profiles
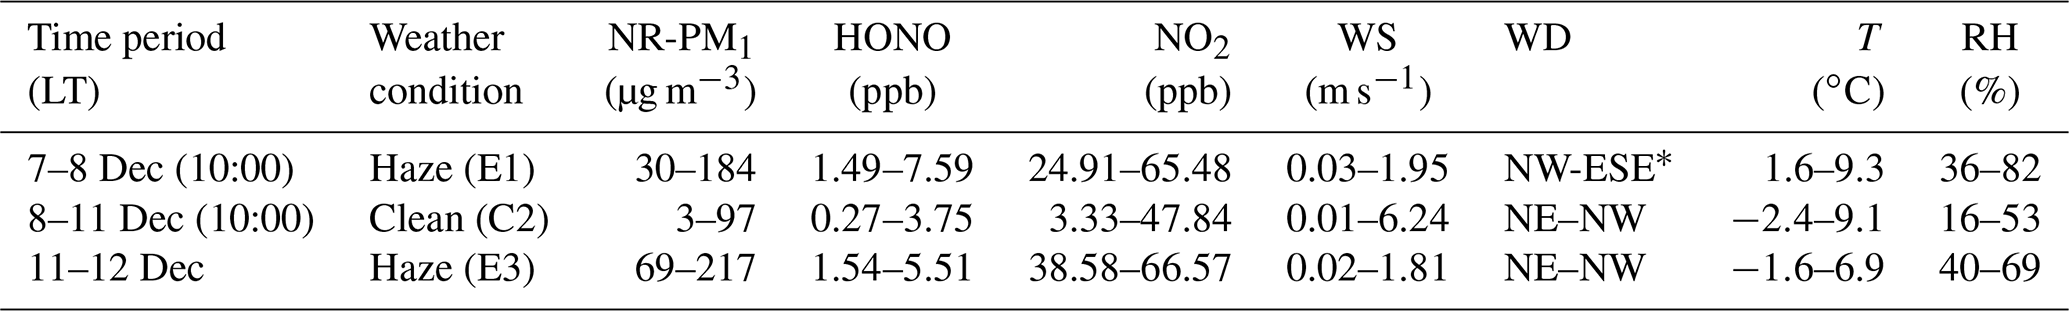
Nocturnal small-scale stratification and layering was determined according to the method of Brown et al. (2007), who used the potential temperature profile as an indicator of atmospheric static stability. According to the vertical variations in the potential temperature, the stable layer was divided into the “surface layer”, the “nocturnal boundary layer (NBL)”, the “top of the nocturnal boundary layer”, and the “residual layer (RL)”.
Figure 4Nocturnal vertical profiles of HONO, NO2, and the potential temperatures during the ascent and descent of the container on (a) 9 and (b) 10 December. The time in the figure corresponds to the measurement time of the vertical profile of the HONO and NO2. The different colored shaded region indicates the nocturnal small-scale stratification (surface layer, nocturnal boundary layer, shallow inversion layer, and residual layer). The heights of the surface layer, the shallow inversion layer, the nocturnal boundary layer, and the residual layer are denoted by grey shaded regions, pink shaded regions, yellow shaded regions, and white shaded regions, respectively.
Table 2The nocturnal gradient of HONO and NO2 throughout the vertical measurements and the linear least squares regression slope and correlation coefficient of HONO and NO2 to altitude identified in each vertical profile measurement.

Figure 4 depicts the nocturnal vertical profiles of HONO, NO2, and potential temperature during C2. The linear least squares regression slope and correlation coefficients of HONO and NO2 to altitude were applied to estimate the nocturnal gradient of HONO and NO2 (Table 2). Vertical profile data were used above the surface layer and 10 m vertical averages from the surface to 240 m a.g.l. to evaluate the vertical gradients of HONO and NO2. An example of the regression line was shown in Fig. S5. On the night of 9 December (Fig. 4a), negative profiles of both HONO and NO2 were clearly seen. When the container ascended during 22:42–23:06 LT, the potential temperature profile showed distinct stratification. The surface layer extended to 10–20 m and the NBL extended to ∼140 m. The obviously negative gradients of HONO ( ppt m−1) and NO2 ( ppt m−1) were observed throughout the heights from 0 to 240 m. A negative gradient of HONO was observed in the RL, but was not consistently observed in other measurements (see below). During the descent of the container from 23:15–23:40 LT, the potential temperature profile showed that a shallow T inversion had rapidly formed between 130 and 200 m. The obvious vertical variation in RH during 23:15–23:40 LT (Fig. S3) also indicated the different layers at different heights, which was due to the influence of a shallow inversion layer. Within the shallow inversion layer, vertical convection and transport were inhibited, and a remarkable negative gradient was observed there. However, within the NBL, the negative gradient of HONO and NO2 disappeared. This might have been due to the continuous vertical mixing below the shallow inversion layer from 23:06 to 23:40 LT. Additionally, the surface source of HONO was obvious, as evidenced by the apparently negative gradient of HONO in Table 2.
The vertical profile of potential temperature on 10 December (Fig. 4b) showed that a shallow inversion layer formed between the surface layer and the NBL. In the shallow inversion layer, the mixing ratios of HONO decreased rapidly with increasing height, and a significant negative gradient was observed within the shallow inversion layer and surface layer. With the attenuation of the shallow inversion layer during the descent of the container from 23:01 to 23:25 LT, the inhibition of vertical transport and mixing gradually weakened. The increase in the negative gradient of HONO and NO2 and the correlation coefficients of HONO and NO2 to altitude from 22:36 to 23:25 LT also showed the weakened shallow inversion layer near the surface, which suggested the nighttime HONO surface source. The attenuation event of the shallow inversion layer may have also been the result of an increase in the wind speed and the interaction of different air masses that changed from the west to southeast between 15 and 100 m (Fig. S6). Above the 100 m height, the mixing ratio of HONO decreased with increasing height, and the fluctuation in HONO was likely due to the interaction of different air masses. In contrast, the vertical profiles of NO2 showed that NO2 rapidly decreased towards the ground, and a significant positive gradient was observed near the surface that was caused by several factors. Nocturnal NO2 is produced by the reaction of O3 with NO, which primarily occurs near the surface, resulting in a negative gradient in NO2. However, this effect was counteracted by the dry deposition of NO2, which by itself would result in a positive gradient (Stutz et al., 2004b). Additionally, the mixing ratio of NO2 was also affected by local traffic emission sources, and a near-surface shallow inversion layer was formed on 10 December. All of these presumably led to a clearly positive gradient for the near-surface NO2. In contrast to the vertical profiles measured on 9 December, a positive gradient observed in near-surface NO2 on 10 December indicated that the shallow inversion layer affected the vertical distribution of HONO and NO2 at night.
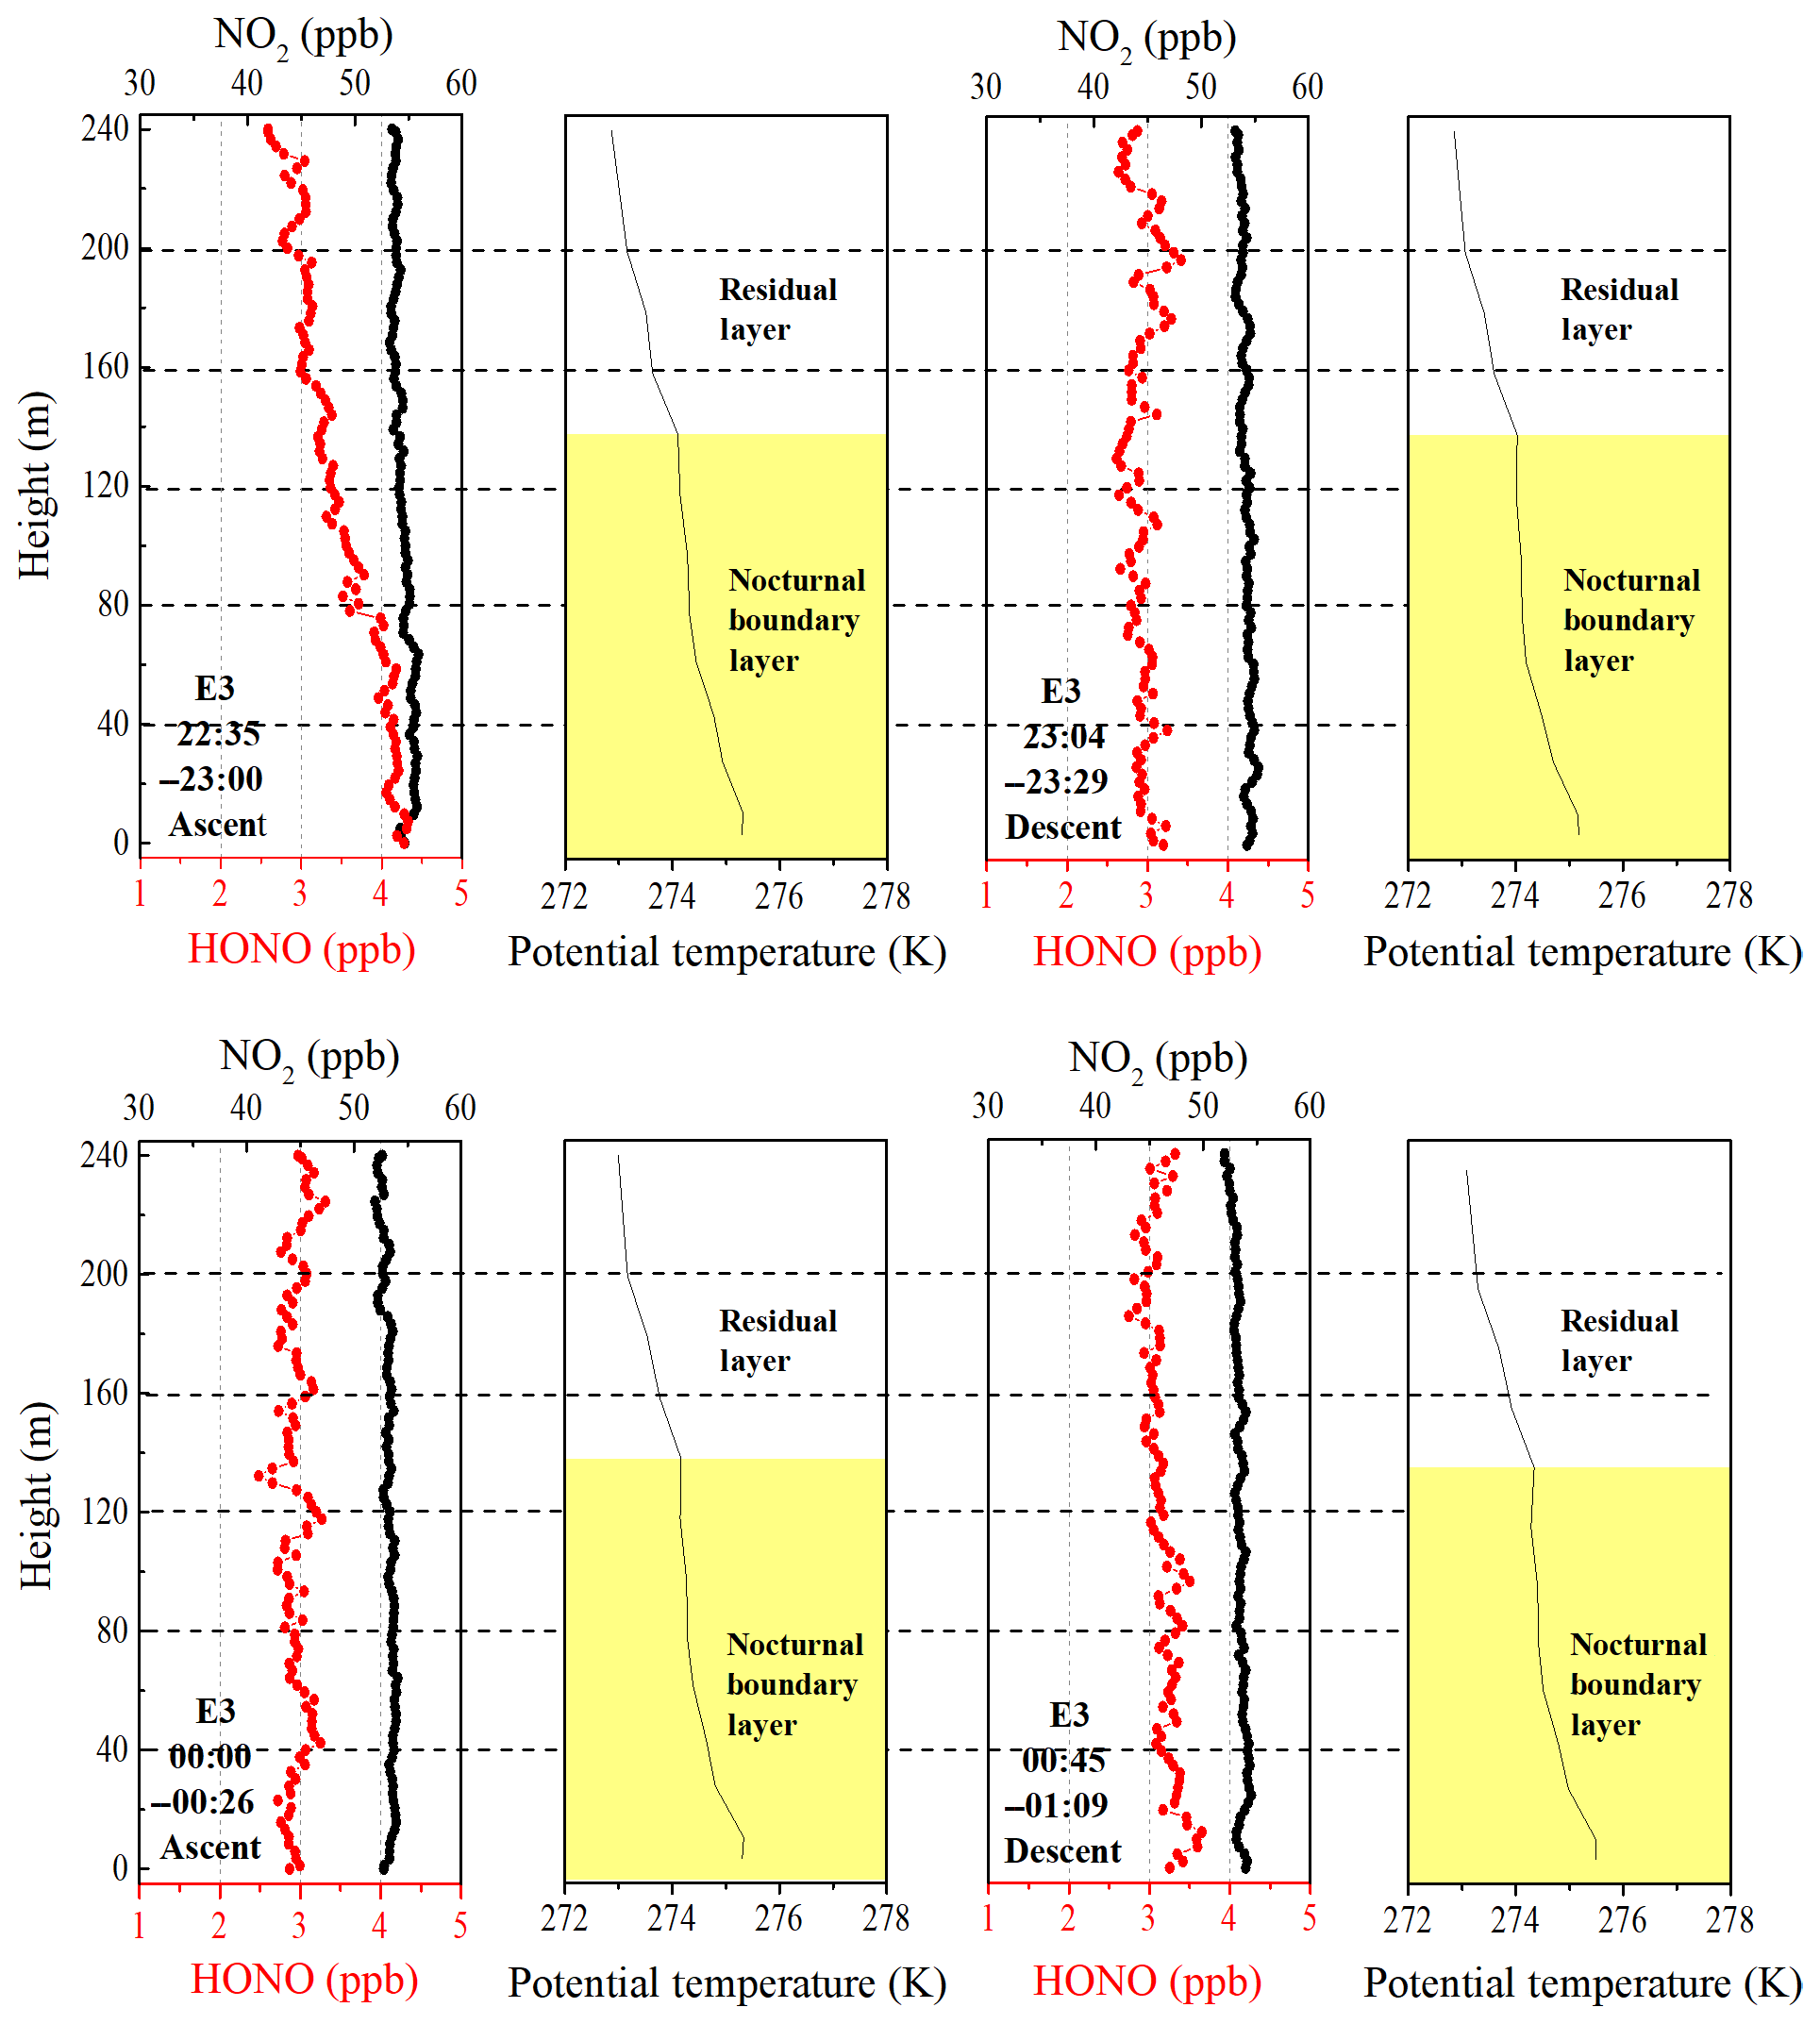
Figure 5Vertical profiles of HONO and NO2 on the night of 11 December and midnight of 12 December. The potential temperature profiles indicate nocturnal small-scale stratification (a nocturnal boundary layer and a residual layer). The height of the nocturnal boundary layer (NBL) is denoted by the yellow shaded region. The time in the figure corresponds to the measurement time of the vertical profiles of HONO and NO2.
Although the surface layer was a common feature in the potential temperature profiles, it was absent during E3, and the NBL extended downward to the lowest measurement height (8 m above the ground). As shown in Fig. 5, the vertical profile of HONO showed a significant negative gradient as the container ascended during 22:35–23:00 LT, and a higher HONO mixing ratio was observed at ground level. With the development of the boundary layer, the negative gradient of HONO continued to decrease from 6.92±0.36 ppt m−1 during 22:35–23:00 LT to 1.98±0.28 ppt m−1 during 00:45–01:09 LT and even disappeared between 00:00 and 00:26 LT. Moreover, consistent HONO∕NO2 ratios (∼5.6 % ± 0.3 %) were observed throughout the depth of the NBL between 23:00 and 01:00 LT (Fig. S7). A near-steady-state plateau of the HONO mixing ratio and HONO∕NO2 was established near midnight at the NBL. Similar vertical measurements were reported by VandenBoer et al. (2013), who also observed a near-steady state in the HONO mixing ratio and HONO∕NO2, and an approximate balance between the production and loss of HONO late in the night. A possible physical and chemical process, the loss of HONO to the ground surface due to dry deposition, could account for the buildup and near-steady state observed in the HONO mixing ratio and HONO∕NO2. This implied that significant quantities of HONO were deposited to the ground surface at night.
The utility of the linear least squares regression slope of HONO to altitude to estimate the vertical gradient of HONO at night suggests the potential nocturnal HONO production from the heterogeneous reaction of NO2 on aerosol surfaces. A positive gradient of HONO (0.24±0.39) between 00:00 and 00:26 LT was observed during E3. The aerosol surface area (Saw) in the residual layer was greater than 1500 µm2 cm−3 throughout the night (range: 1592–2655 µm2 cm−3). The Saw was 2314 µm2 cm−3 from 22:00 to 01:00 LT on 11 December and reached a maximum of 2569 µm2 cm−3 in the residual layer. These aerosol surface areas are a factor of 14–38 greater than those observed in previous studies of HONO vertical gradients, which ranged between 60 and 158 µm2 cm−3 (Kleffmann et al., 2003; VandenBoer et al., 2013). Such high aerosol surface areas may provide a sufficient surface for the heterogeneous reaction. The vertical profiles also showed enhanced HONO∕NO2 ratios from C2 to E3 (Fig. S8). Moreover, relatively constant HONO mixing ratios and HONO∕NO2 ratios above 160 m were observed from 22:35 to 01:09 LT during E3. Both of these observations are indicative of a potential aerosol surface source of HONO aloft during the haze episode. Assuming that aerosol surface production dominated the observed HONO mixing ratio in the overlying air during the haze episode, the mixing ratios of HONO and NO2 observed at 240 m and the aerosol surface area measured at 260 m were parameterized to estimate the nocturnal production of HONO on aerosol surfaces, which is explored in more detail in Sect. 3.4.2.
3.3 Direct emissions
In the present study, the measurement site was surrounded by several main roads and thus might have been affected by vehicle emissions. CO and NO, as the primary pollutants, are emitted from combustion processes like the burning of fossil fuels as well as vehicle emissions (Sun et al., 2014; Tong et al., 2016; Bond et al., 2013). BC is another primary pollutant typically emitted from diesel engines and residential solid fuels (Zhang et al., 2018). Good correlations of the nocturnal HONO with CO (R2=0.85), NO (R2=0.76), and BC (R2=0.84) at ground level were observed (Fig. S9), indicating the potential effect of direct emissions on the observed HONO at night. The emission ratio of HONO∕NOx has been determined from tunnel measurements in California (Kirchstetter et al., 1996), Germany (Kurtenbach et al., 2001), and Hong Kong (Liang et al., 2017). However, considering the differences in the type of vehicles, fuel compositions, and other factors, the reported emission factor of HONO∕NOx might not be representative for the Beijing region. To evaluate the influence of direct emissions, the local emission factor of HONO was derived from ambient measurements. Since NO was not measured at ground level after 10 December, the nighttime measurement data of HONO and NOx from 9 November to 10 December were used to evaluate the local HONO emission factor.
Considering the potential secondary HONO formation with air mass aging during the transport process, five criteria were applied to ensure as much of the freshly emitted air masses as possible: (a) only nighttime data (from 18:00 to 06:00 LT the next day) were included to avoid the fast photolysis of HONO; (b) only sharp peaks during nighttime and the elevations of HONO and NOx over the background levels were estimated; (c) ; (d) good correlation between HONO and NOx; (e) short duration of the plume (<30 min). The typical nighttime wind speed at the measurement site was 1.2 m s−1, and thus the duration for fresh air masses should have been less than 30 min during transport from the emission to the measurement site. Criteria (b) and (c) were used as indicators for identifying fresh vehicular emissions. Criteria (d) and (e) further confirmed that the increase in HONO was primarily caused by freshly emitted plumes instead of heterogeneous reactions of NO2.
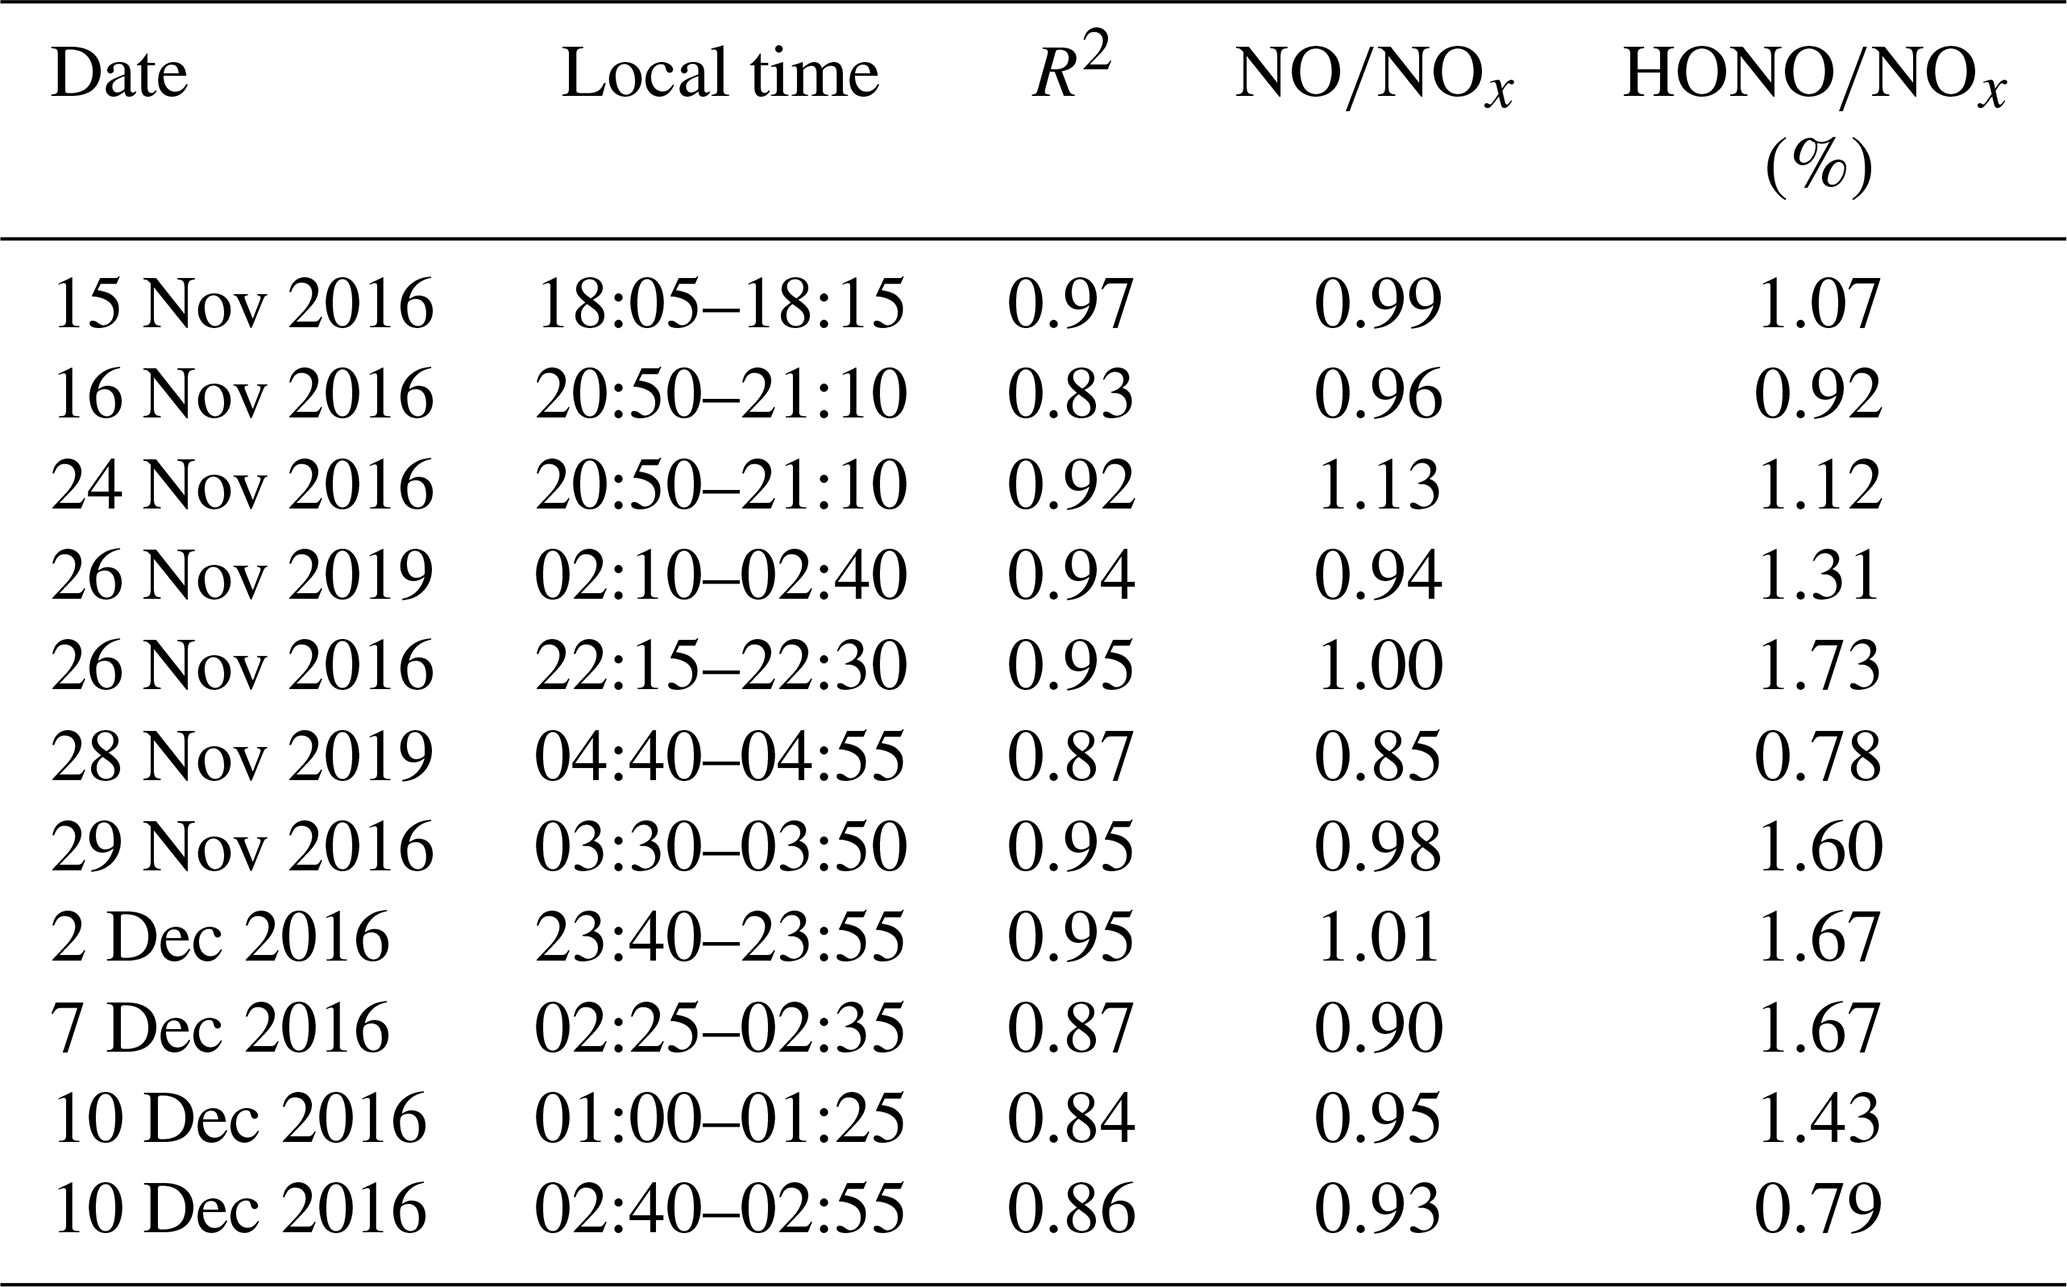
Figure 6 shows two emission plumes observed on 9 to 10 December 2016 based on the preceding selection criteria. The slopes of HONO to NOx can be considered as the emission ratios (Rappenglück et al., 2013). The HONO∕NOx emission ratios were estimated for the 11 fresh emission plumes that satisfied the preceding criteria (see Table 3). The derived emission factors of 0.78 %–1.73 % had an average value of 1.28 % ± 0.36 %, which was larger than the 0.53 %–0.8 % measured in the tunnel in Wuppertal (Kurtenbach et al., 2001). The minimum ratio of 0.78 % approximated the value (0.8 %) measured in Wuppertal. It is worth mentioning that the value of 0.8 % is widely used as the upper limit of the HONO∕NOx emission ratio from road traffic in interpreting field observations and modeling HONO emissions (Stutz et al., 2002; Su et al., 2008a; Tong et al., 2016). The maximum ratio of 1.73% in this study is comparable to the value of 1.7 % in Houston, Texas, observed by Rappenglück et al. (2013). The derived emission ratios were within the range of other published results (0.19 %–2.1 %) (Kirchstetter et al., 1996; Kurtenbach et al., 2001; Su et al., 2008a; Rappengluck et al., 2013; Yang et al., 2014; Xu et al., 2015; Trinh et al., 2017; Liang et al., 2017; Zhang et al., 2018; Li et al., 2018; Y. L. Liu et al., 2019). Comparisons of the derived HONO∕NOx ratios with the results obtained previously are summarized in Table S2. To minimize the risk of overestimating the direct emissions, the minimum HONO∕NOx ratio was used as an upper limit for the emission factor (Su et al., 2008a). The minimum HONO∕NOx ratio of 0.78 % was used to evaluate the contribution of vehicle emissions to the ambient HONO levels at night (Eq. 3). In this case, the risk of overestimating direct emissions was minimized, but there was still the effect of potential secondary HONO formation.
where [HONO]emis and [NOx] are the HONO mixing ratios from vehicle emissions and the observed NOx mixing ratios, respectively. The direct emissions contributed an average of 29.3 % ± 12.4 % to the ambient HONO concentrations at night, with an average HONOemis∕HONO value of 35.9 % ± 11.8 % during the clean episode and an average HONOemis∕HONO value of 26 % ± 11.3 % during the haze episode. The frequency distribution of HONOemis∕HONO during the clean and the haze episodes are shown in Fig. 7. The lower vehicle emissions contribution during the haze episode could have been caused by an odd–even car ban, which required alternate driving days for cars with even- and odd-numbered license plates.
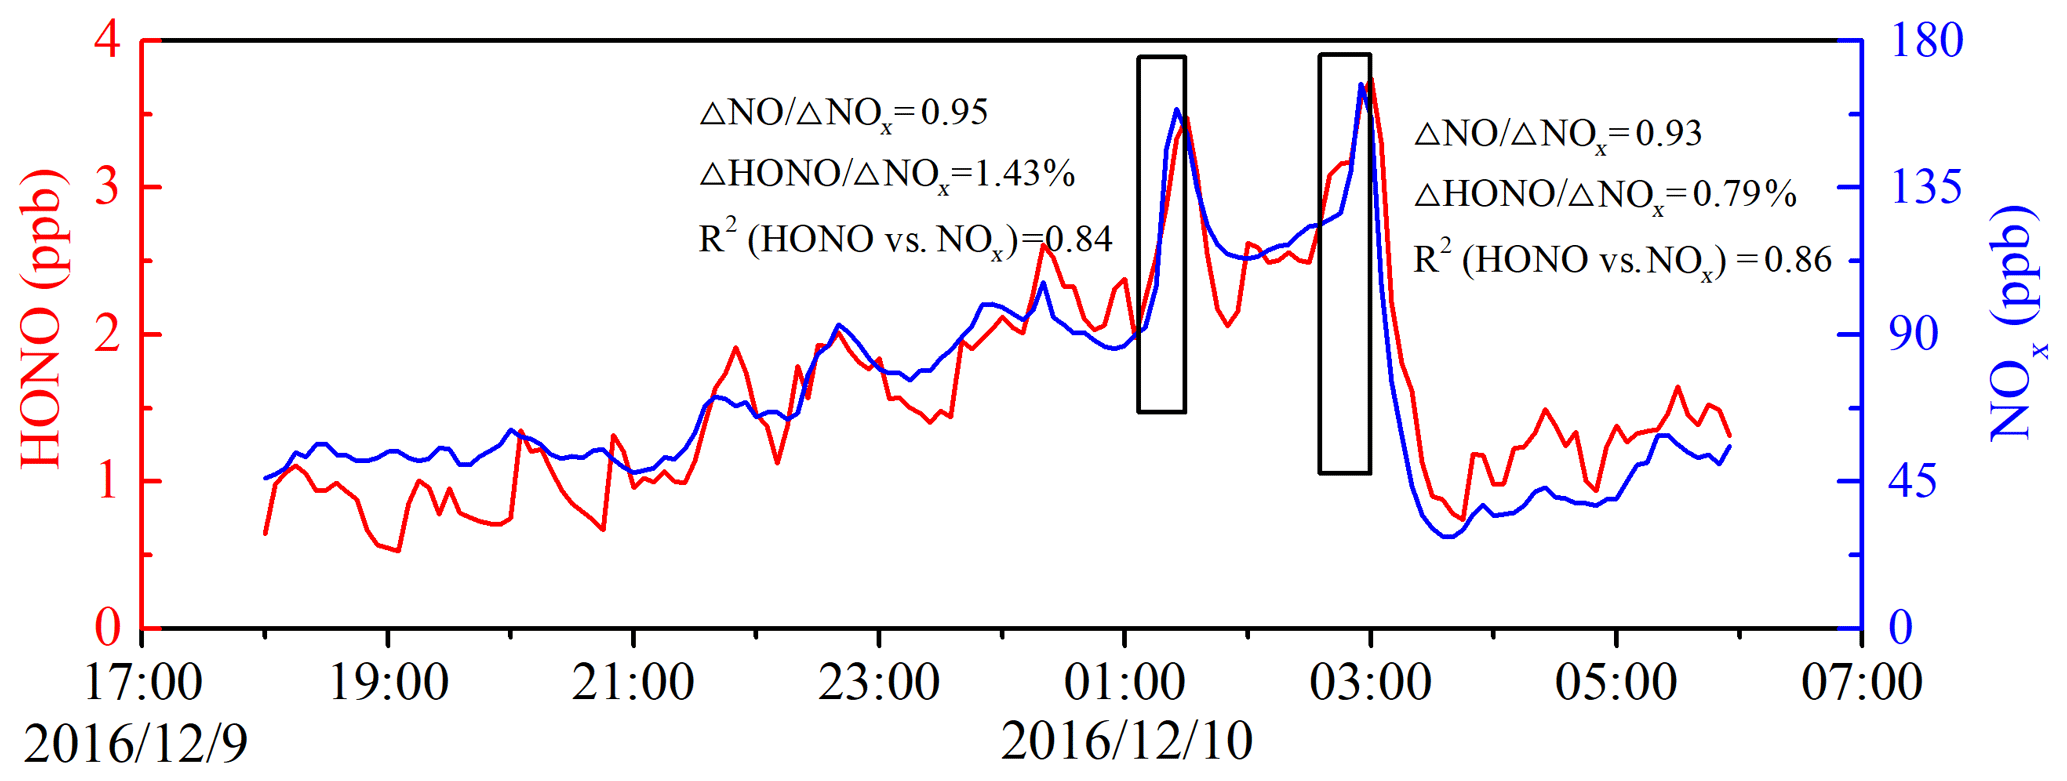
Figure 6Temporal variation of nocturnal HONO and NOx on 9 to 10 December 2016. The HONO emission ratios were estimated using data collected in the black frames.
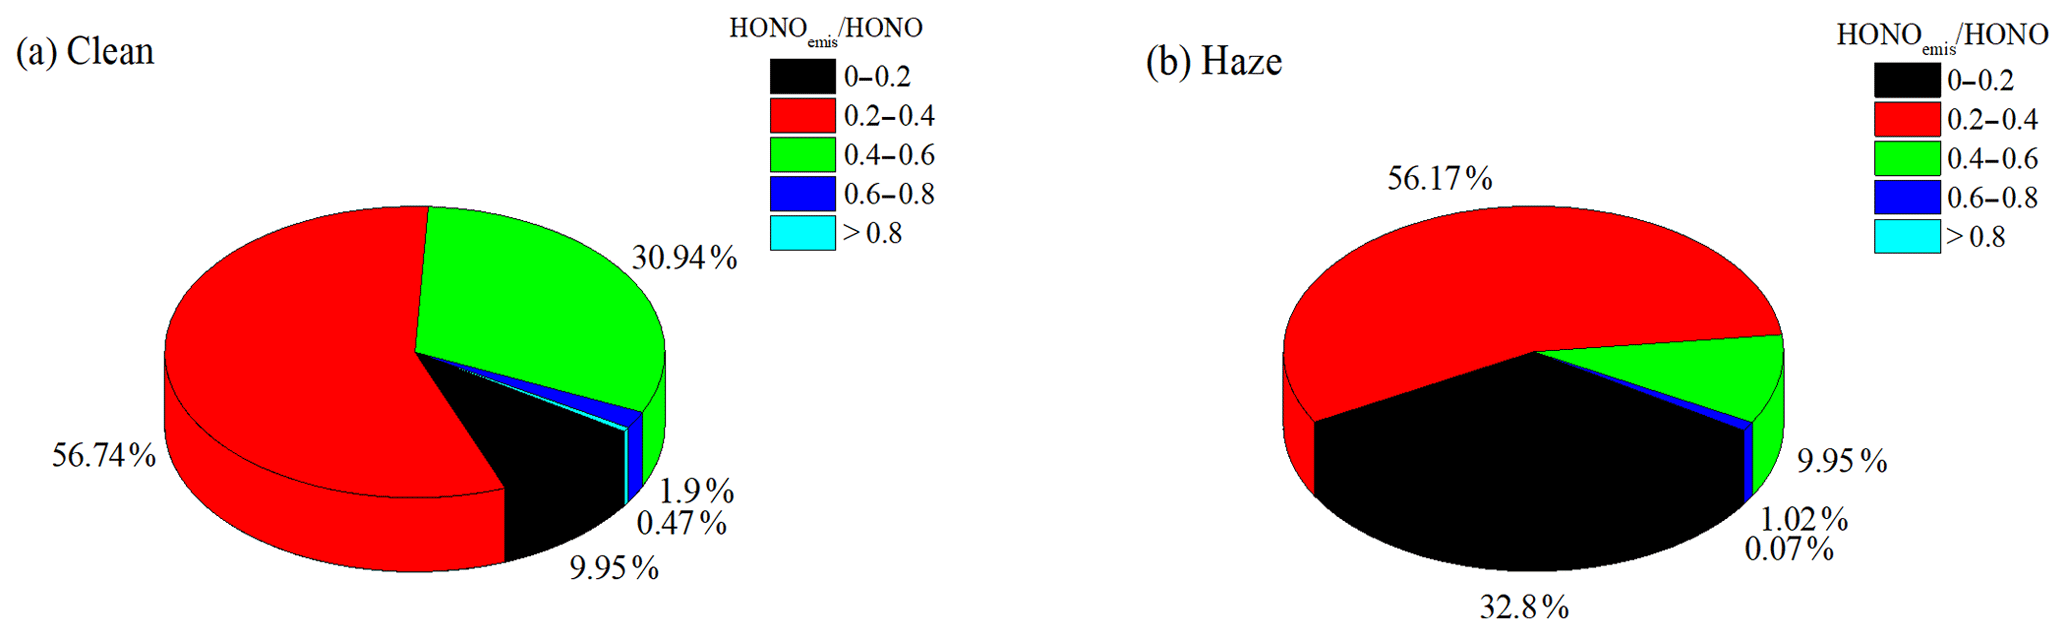
Figure 7The nocturnal HONOemis∕HONO ratios frequency distribution during (a) clean and (b) haze episodes.
Table 3Emission ratios (HONO∕NOx) of the fresh direct emission plumes.
3.4 Nocturnal HONO chemistry
3.4.1 Correlation studies
The heterogeneous conversion of NO2 is an important pathway for HONO formation during the nighttime, as many field observations have found a good correlation between HONO and NO2 (Hao et al., 2006; Su et al., 2008a; Wang et al., 2013; Huang et al., 2017). However, the use of a correlation analysis to interpret the heterogeneous conversion of NO2 should be treated carefully, as physical transport and source emissions also contribute to the correlation. In this study, the correlations of vertical profiles between HONO and NO2 were analyzed. Vertical profile data without horizontal transport were used to avoid the influence of physical transport. As shown in Fig. 8, the linear least squares regression correlations of HONO to NO2 exhibited moderate but significant correlations (C2: R2=0.72, E3: R2=0.69), supporting the theory that NO2 participated in the formation of HONO. The column of HONO and NO2 showed a significantly positive correlation during the haze episode. However, the negative correlation between HONO and NO2 was observed at ground level during the haze episode (Fig. S10), which was also observed in the previous ground-based observations (Hou et al., 2016; Zhang et al., 2018). The observed significant correlation between the HONO column and NO2 column could be due to (1) emissions and vertical mixing of HONO and NO2, and (2) a possible heterogeneous reaction of NO2 on aerosol surface.
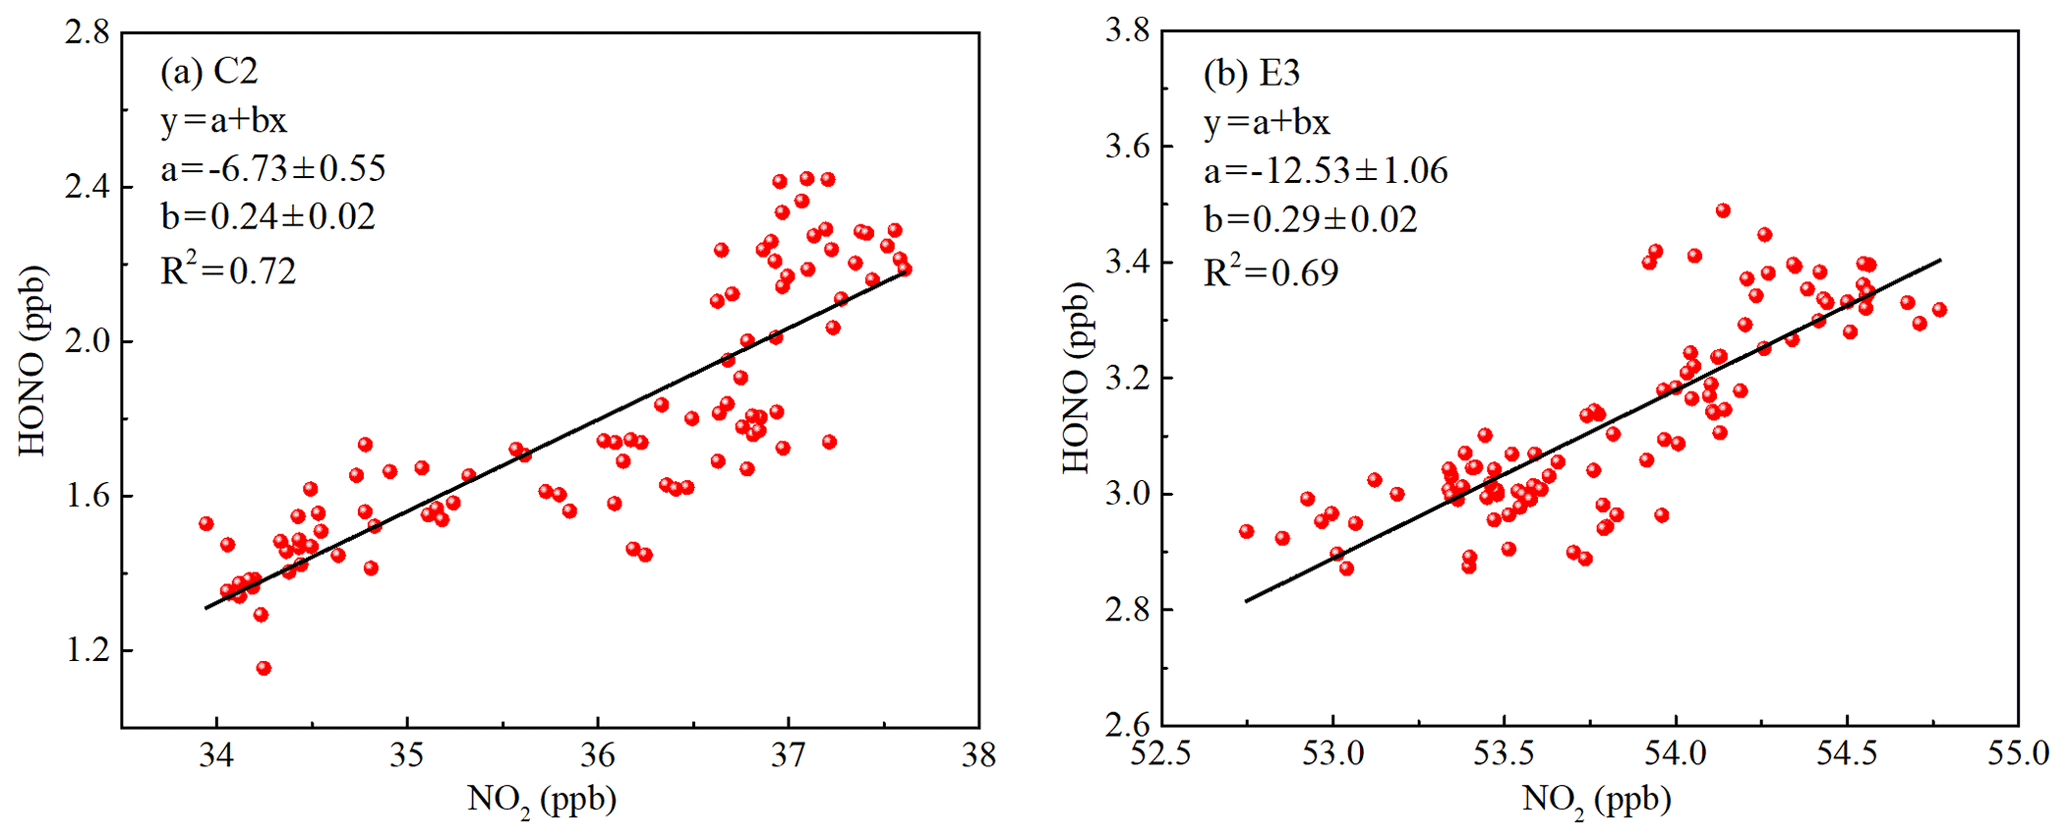
Figure 8The correlation of the vertical profiles between HONO and NO2 during (a) the clean episode (C2) and (b) the haze episode (E3) using a linear least squares regression fit.
Adsorbed water on a surface has been shown to affect the heterogeneous formation of HONO (Stutz et al., 2004a). The relationship between HONO∕NO2 and RH is illustrated in Fig. 9. Following the method introduced by Stutz et al. (2004a), the average of the five highest HONO∕NO2 values in each 10 % RH interval was evaluated to eliminate much of the influence of factors like the time of night, advection, the surface density, etc. An increase in the HONO∕NO2 ratio along with RH was observed at each height interval when the RH was less than 70 %. A previous observation at ground level also reported that the HONO∕NO2 ratio increased with an increase in RH when the RH was less than 70 %. A further increase in RH would lead to a decrease in the HONO∕NO2 ratio, which was considered to be caused by the number of water monolayers that formed on the surface, leading to an efficient uptake of HONO (Li et al., 2012; Yu et al., 2009; Y. L. Liu et al., 2019). However, a decreased uptake coefficient of HONO with increasing RH from 0 % to 80 % was observed in a laboratory study (Donaldson et al., 2014). The NO2 to HONO conversion efficiency depended negatively on RH at an RH above 70 %, which was presumably caused by the relative humidity affecting both HONO uptake onto the surface and the NO2-to-HONO conversion. A decrease in the HONO∕NO2 ratio with an increase in height at a similar RH level were observed during C2 and E3. A higher conversion efficiency of NO2 to HONO was observed near the surface, and the HONO∕NO2 ratios at different heights were significantly different during C2. However, this differences decreased, and similar HONO∕NO2 ratios were observed at different heights during E3. This observation implied a possible heterogeneous conversion of NO2 on aerosol surfaces in the overlying air. It is necessary to note that the limited vertical measurements resulted in a limited variation range in the RH, which limits this analysis. Additional efforts are needed to conduct more comprehensive vertical measurements to interpret the HONO∕NO2 ratios versus RH for different heights in the future.
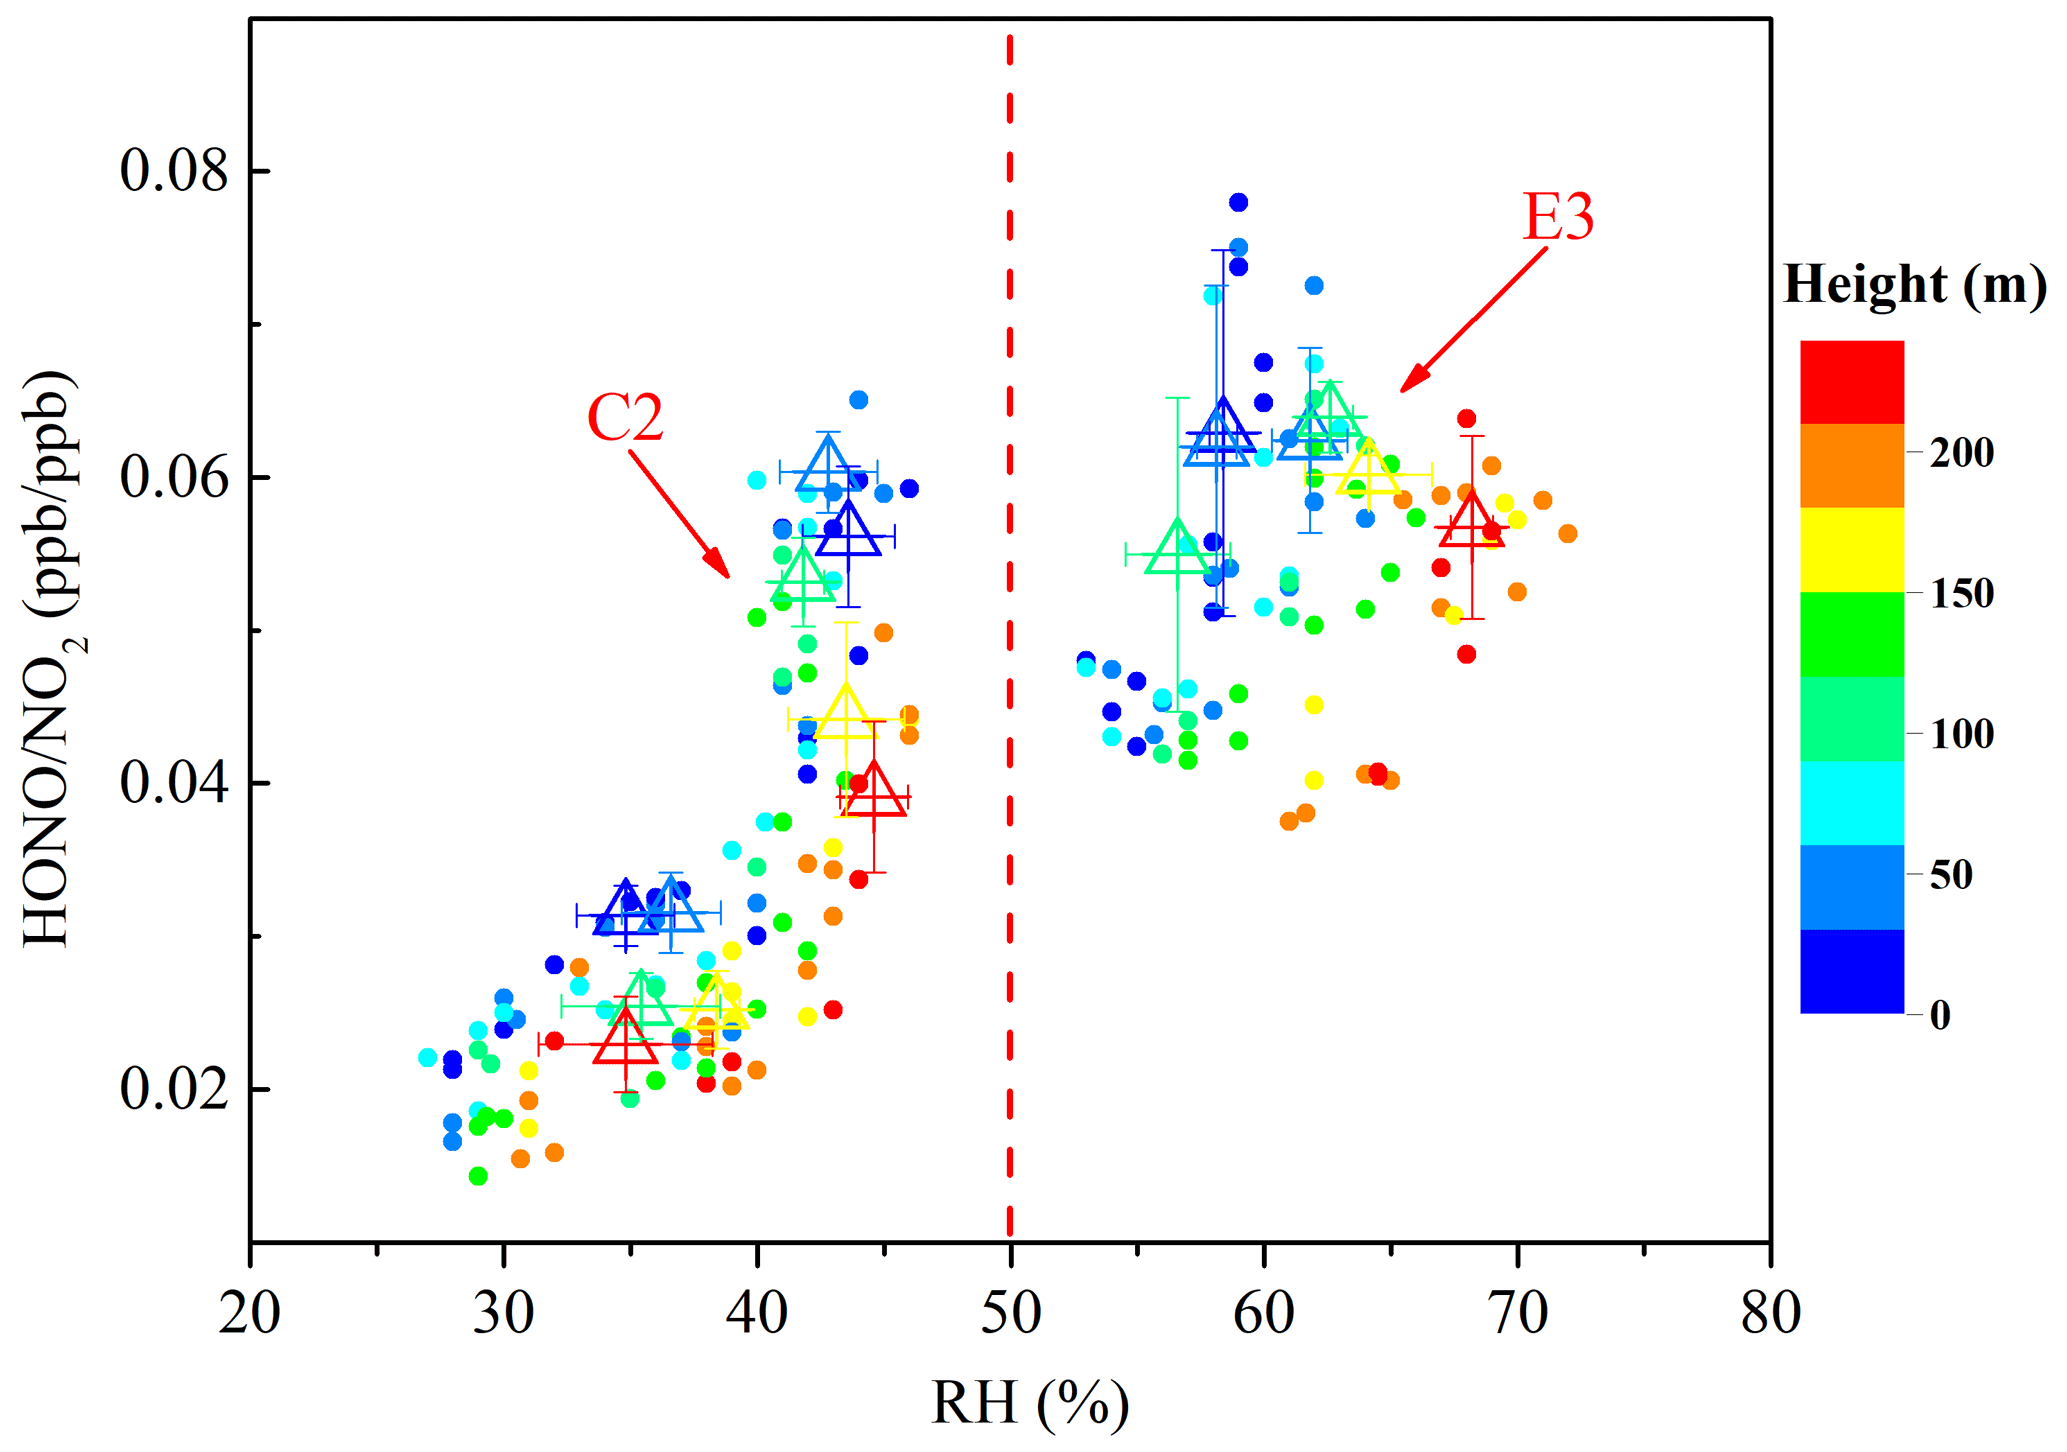
Figure 9Scatter plot of HONO∕NO2 against RH of all vertical profiles during the clean episode (C2) and the haze episode (E3). The HONO∕NO2 ratio is color coded by the heights. Triangles are the average of the first five HONO∕NO2 values in each 10 % RH interval at different height intervals (8–65, 65–120, 120–180, and 180–240 m).
3.4.2 Relative importance of aerosol and ground surfaces in nocturnal HONO production
The observed positive HONO gradient implied a potential heterogeneous conversion of NO2 on aerosol surfaces. The aerosol surface area observed during the haze episode was an order of magnitude higher than in other studies of HONO vertical gradients (Kleffmann et al., 2003; VandenBoer et al., 2013), which presumably provided sufficient aerosol surface area to account for the observed nighttime HONO production (Y. L. Liu et al., 2019). The surface area information for particles larger than 0.5 µm were not valid at ground level and 260 m during the measurement periods. Hence, this is a lower limit estimate of the total surface area for the heterogeneous reaction.
An estimate of the nocturnal HONO production on aerosol surfaces was made using the RH-corrected aerosol surface area (Saw) and NO2 observations from the residual layer. The CO and BC measured at ground level were independent of the CO and BC observed at 260 m during the haze period (Fig. S11), since it can be expected that air masses in the residual layer were decoupled from the ground-level processes and largely free of NO2 emissions (Brown et al., 2007; VandenBoer et al., 2013). The HONO production from the heterogeneous NO2 conversion (Reaction R1) on aerosol surfaces would then have become the primary HONO source in the residual layer during E3. The reactive uptake of NO2 by the aerosols was assumed to occur on all measured aerosol surface areas, regardless of their chemical composition. HONO production (P(HONO)) can then be expressed using the equation of Ye et al. (2018) modified to account for the disproportionation:
where is the uptake coefficient, R is the gas constant, T is the absolute temperature (K), M is the molecular mass of NO2 ( kg mol−1), and Saw is the RH-corrected aerosol surface area (µm2 cm−3). It was assumed that the uptake of NO2 to form HONO would not cause a significant change in NO2 concentration over a time period. The NO2-normalized HONO production over time, , can be calculated using the following Eq. (5):
Assume an NO2 uptake coefficient of to in the dark, which fits the NO2 uptake coefficient values observed in relevant studies (Kleffmann et al., 1998; Kurtenbach et al., 2001; Saastad et al., 1993; Bröske et al., 2003). A representative temperature of 273 K and an average observed Saw of 2314 µm2 cm−3 in the residual layer between 22:00 and 01:00 LT during E3 were used. A relative HONO accumulation rate of ranged between 37 and 0.0037 h−1, equivalent to the HONO production of 0.02 to 0.20 ppb h−1 at a constant NO2 concentration of 52.88 ppb, which was the average value of the nocturnal NO2 observed in the residual layer during E3. The absolute amount produced of HONO in an interval of 1.5 h (30–300 ppt) could account for the observed increases in HONO (15–368 ppt) in the residual layer between vertical profile measurements on 11 December (time interval: 1.5 h). Thus, production from the heterogeneous conversion of NO2 on aerosol surfaces can explain the HONO observations during E3. In addition, if the HONO production aloft was indeed dominated by reactions on aerosol surfaces, the column-average concentration of HONO would be expected to be independent of the amount of HONO observed at ground level. Figure 10a shows that the column of HONO is independent of the mixing ratio of HONO observed from the ground level to 10 m in height (R2=0.27), which is consistent with the hypothesis that the aerosol surface dominates HONO production aloft by heterogeneous uptake of NO2 during the haze episode, and the production of HONO at ground level and direct HONO emissions into the overlying air are minor contributors. This result was contrary to previous observations that the production of HONO on aerosol surfaces was insignificant compared to the ground surface (Kleffmann et al., 2003; Wong et al., 2011; VandenBoer et al., 2013), which could have been due to the higher aerosol surface area observed in this study. An aerosol surface area in the residual layer an order of magnitude higher than in previous vertical observations (<160 µm2 cm−3) was observed, which could provide sufficient aerosol surface area for the heterogeneous formation of HONO. However, the limited vertical profile dataset limits a comprehensive investigation of HONO formation in Beijing, yet provides a data basis and research direction.
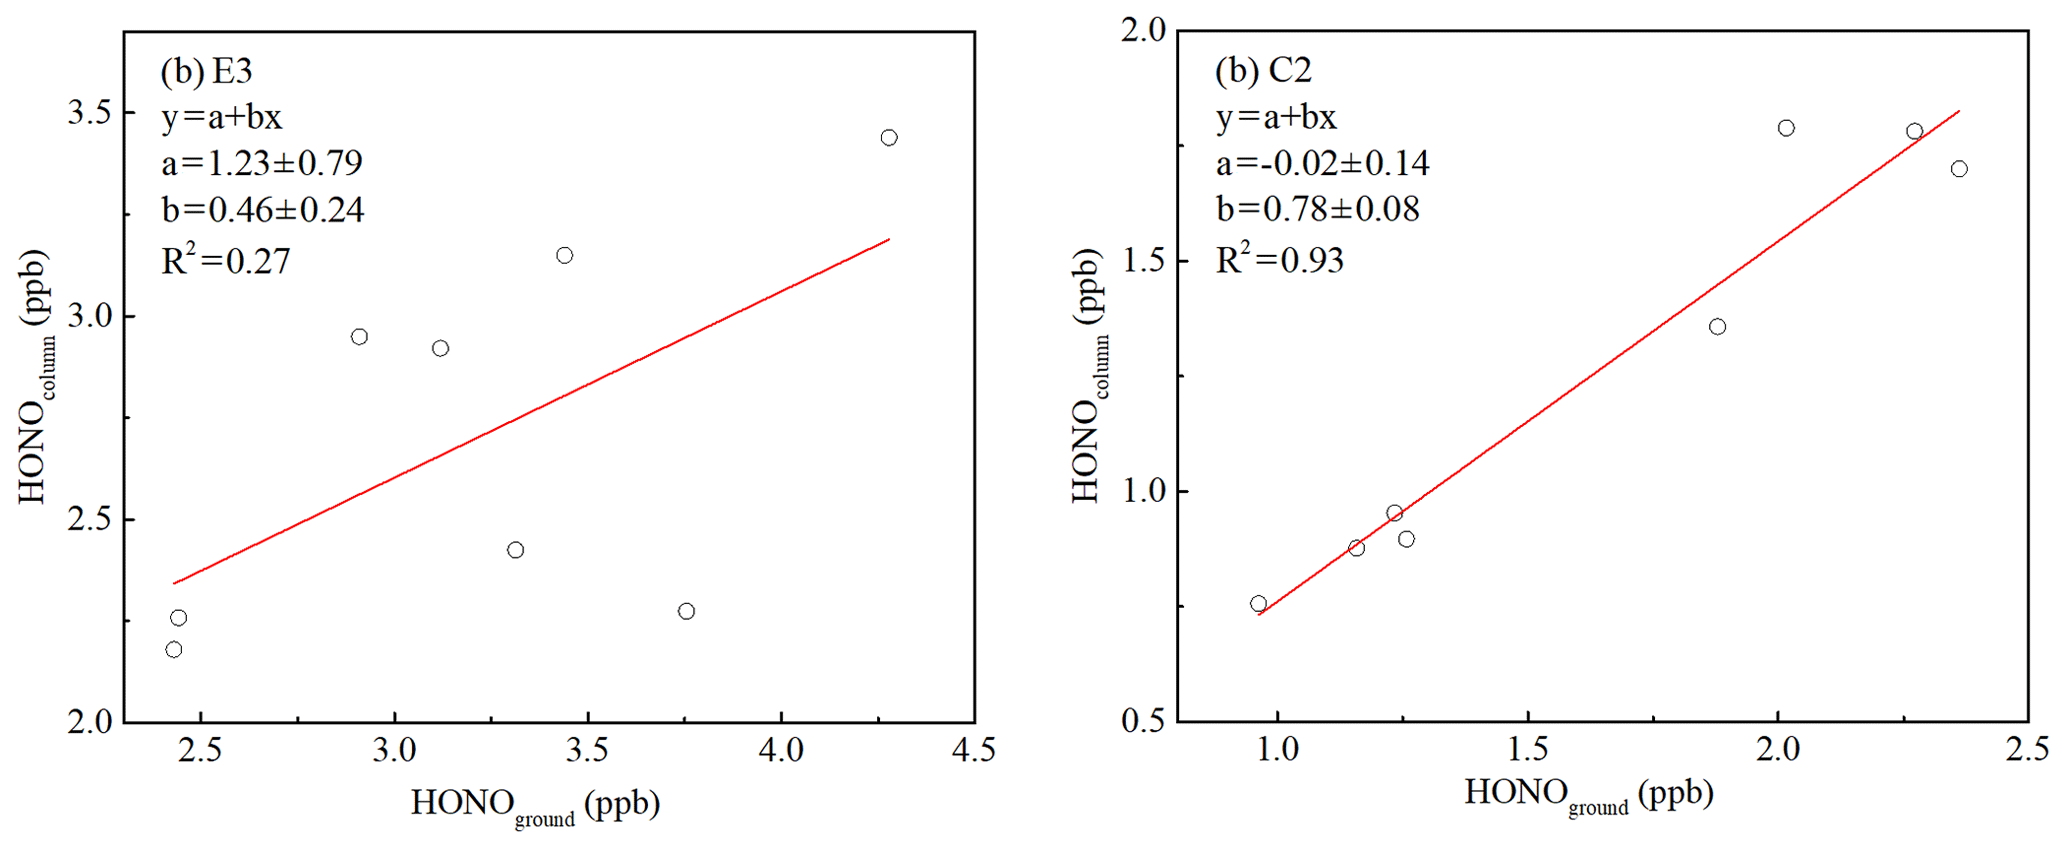
Figure 10Orthogonal linear least squares correlation between the column-average concentration of HONO (the average HONO column concentration from 10 to 240 m) and HONO measured from the ground level to 10 m a.g.l. (above ground level). Column values were calculated for (a) E3 and (b) C2.
An estimate of HONO production from the heterogeneous conversion of NO2 on aerosols was also made during C2 using Saw and NO2 observations from the residual layer. The column of the average HONO concentration was related to the amount of HONO observed between ground level and 10 m (Fig. 10b, R2=0.93), suggesting that the surface HONO sources affected the HONO observed throughout the depth of boundary layer during C2. A high correlation (R2=0.83) between the measured CO and BC at ground level and the CO and BC at 260 m was also observed (Fig. S10), which indicated that vehicle emissions affected air masses in the residual layer. The lack of the NO vertical profile cannot directly correct the influence of direct HONO emissions. If it is assumed that the contribution of direct HONO emissions was consistent at ground level and in the residual layer, the relative contribution of the aerosol and ground surfaces to nocturnal HONO production in the residual layer could be roughly estimated during C2. The direct emissions contribution of 35.9 % ± 11.8 % during C2 is a higher limit estimate of the contribution of direct emissions to the HONO levels in the residual layer.
The averages Saw of 791 and 894 µm2 cm−3 from 17:00 to 24:00 LT and the average NO2 mixing ratio of 34.67 and 42.40 ppb from the residual layer were used to estimate HONO production on aerosol surfaces on 9 and 10 December. The formation rates of HONO on aerosol surfaces were 0.0045–0.045 ppb h−1 on 9 December and 0.0059–0.059 ppb h−1 on 10 December. The observed HONO values that increased by 305–608 ppt between vertical profile measurements (time interval: 5.5 h), which have the contributions from direct HONO emissions subtracted, were higher than the production of HONO (25–248 ppt) in an interval of 5.5 h on 9 December. The formation of HONO on aerosol surfaces cannot explain the observed HONO increases in the residual layer, which suggests that the HONO observed in the residual layer was primarily derived from the heterogeneous conversion of NO2 on the ground surface followed by vertical transport throughout the column. The aerosol production of HONO could account for up to about 40 % of HONO observations in the residual layer. The HONO production from the aerosol surface in an interval of 5.35 h was 32–316 ppt on 10 December, which was comparable to the corrected HONO increases of 114–369 ppt observed between vertical profile measurements (time interval: 5.35 h). A shallow inversion layer formed near the surface could account for the aerosol surfaces playing a heterogeneous reaction surface in the residual layer.
In conclusion, HONO production solely on aerosol surfaces accounted for the HONO observations during E3. The ground surface dominated HONO production by heterogeneous conversion of NO2 during the clean episode, which was then transported throughout the column. With the increases in the NO2 mixing ratio and aerosol surface areas from the clean episode to the haze episode, the aerosol surface production became an important nocturnal source of HONO and dominated the heterogeneous production of HONO aloft from NO2 during the haze episode.
3.4.3 Nocturnal HONO production and loss at ground level
The nocturnal HONO observed throughout the depth of the boundary layer is primarily from the heterogeneous conversion of NO2 on the ground surface during clean episodes. The HONO conversion frequency can be estimated using the data from the nocturnal measurements at ground level (18:00–06:00 LT). The heterogeneous formation of HONO in Reaction (R2) is of the first order in NO2, and the HONO formation is proportional to the NO2 concentration. The conversion frequency was derived using the method proposed by Alicke et al. (2002). The emission ratio of HONO∕NOx derived in Sect. 3.3 was used to correct the HONO concentration by Eq. (6). Because NO was not measured at ground level after 14:00 LT on 10 December, the NOx data were not available during the nocturnal vertical measurements on 10 and 11 December. The average HONOemis∕HONO ratios of 35.9 % ± 11.8 % and 26 % ± 11.3 % were used to correct the observed HONO concentrations (i.e., [HONO]) during the clean and the haze episodes after 10 December, respectively. The NO2-to-HONO conversion frequency, kHONO, can be calculated using Eq. (7), by assuming that observed HONO comes from the conversion of NO2 (Su et al., 2008a).
where [] is the average NO2 mixing ratio during the time interval of t2–t1. The conversion frequencies, kHONO, on 9, 10, and 11 December were 0.0082, 0.0060, and 0.0114 h−1, respectively, corresponding to a HONO production rate by NO2 () of 0.25±0.03, 0.28±0.02, and 0.60±0.02 ppb h−1 (i.e., , respectively. It is necessary to elaborate that the derived is the net HONO production, which means sources and sinks of HONO (aerosol and ground surface sources, deposition, etc.) have already been taken into account in the . The HONO conversion frequency obtained in this study is comparable to the observations by Hou et al. (2016) (clean episode: 0.0065 h−1, haze episode: 0.0039 h−1) and Zhang et al. (2018) in the Beijing region (haze episode: 0.0058 h−1). However, they are lower than the observations made by Zhang et al. (2018) during the severe haze episode in Beijing (0.0146 h−1) and Li et al. (2012) (0.024±0.015 h−1) and Su et al. (2008b) (0.016±0.014 h−1) at a rural site in southern China.
It was assumed that production of HONO on aerosol surfaces was insignificant compared to the ground surface during the clean episode, which has been suggested in other studies of HONO vertical gradients (VandenBoer et al., 2013; Wong et al., 2011; Zhang et al., 2009). Therefore, the HONO production () could be considered as a net contribution of the surface production of HONO to the total column of HONO when HONO deposition is considered in . The surface production rates of HONO of 0.25±0.03 and 0.28±0.02 ppb h−1 were an order of magnitude higher than the maximum production rate of HONO on aerosol surfaces (0.047 and 0.062 ppb h−1) on 9 and 10 December. This result suggests that ground surface dominated HONO production by heterogeneous conversion of NO2 during the clean episode. In contrast, the production of HONO solely on aerosol surfaces can explain the HONO observations in the residual layer during E3, indicating that the aerosol surface production was an active HONO production mechanism during haze episodes. The derived is the total HONO production rate of the aerosol and ground surfaces by heterogeneous conversion of NO2. To compare the HONO heterogeneous production on aerosol and ground surfaces, a deposition velocity of NO2 to the surface in the dark, , of 0.07 cm s−1 (VandenBoer et al., 2013), in a boundary layer of height, h, of 140 m, was used to estimate the HONO production rate by NO2 on the ground surface. The nocturnal production of HONO by heterogeneous uptake of NO2 on ground surface can be estimated by the following:
The surface production rate of HONO (PHONO,ground) was 0.47±0.02 ppb h−1 on 11 December (E3), which was comparable to the HONO production rate on aerosol surfaces of 0.02–0.2 (0.11±0.09) ppb h−1. This result also suggests that the production of HONO on aerosols is an important nocturnal source of HONO during haze episodes. The higher production rates of HONO on the ground surfaces were consistent with the fact that the ground had a much greater surface area than the aerosol (i.e., the ground surface area was 7140 µm2 cm−3 in a 140 m deep NBL, versus the average Saw of 2255 µm2 cm−3 during E3). However, the vertical transport of the surface production of HONO throughout the column was likely inhibited during E3. The column-average concentration of HONO was independent of the mixing ratio of HONO observed between ground level and 10 m (Fig. 10a), which may have been due to a more stable nocturnal boundary layer structure during the haze episode.
A budget equation of nighttime HONO (Eq. 9) was utilized to separate the contributions of the individual chemical processes involved in the nocturnal production and loss of HONO (Su et al., 2008b; Oswald et al., 2015).
The production terms of the HONO consist of the direct emission rate (Pemis), the heterogeneous production rate on aerosol (Paerosol) and ground surfaces (Pground), and the additional nighttime HONO source/sink (PA). The loss process (Ldep) is the dry deposition rate at nighttime. Th and Tv describe the horizontal and vertical transport processes, respectively. The horizontal transport, Th, is negligible in a relatively calm atmosphere with low wind speeds (<1.6 m s−1) during vertical measurements. The vertical transport, Tv, acts as a sink close to the surface and as an additional source at elevated levels. However, it is difficult to quantify Tv without direct measurements of fluxes or using the chemical transport model, and its contribution is uncertain. Without explicitly considering Tv, the budget analysis is reasonable for relatively well-mixed conditions. Thus, the budget analysis is used for the measurements conducted on 9 and 11 December, when no shallow inversion layer was observed near the surface.

Figure 11Separated contributions of production and loss terms (colored bars) of HONO on (a) 9 December 2016 (C2) and (b) 11 December 2016 (E3).
Simplifying Eq. (9), the dHONO∕dt was approximated by ΔHONO∕Δt, which is the difference in the observed HONO mixing ratios at two time points. An additional nocturnal production rate term (PA) can be derived by Eq. (10). The emission ratio of HONO∕NOx (0.78 %) and HONOemis∕HONO ratio (26 % ± 11.3 %) obtained in Sect. 3.3 were used to estimate Pemis. The nocturnal production of HONO via NO2 on aerosol and ground surfaces and the production rate terms of Paerosol and Pground in Eqs. (4) and (8) were used as representations of the nocturnal production of HONO in Eq. (10). Here, with an overall consideration of uptake coefficient of used in the literature, the was assumed to be to estimate the HONO production rate on aerosol surfaces. For Ldep, the temperature-dependent deposition velocity of HONO () was used to estimate the Vdep,HONO, which decreased exponentially to non-significant values at 40 ∘C (Laufs et al., 2017). The average Vdep,HONO calculated from the nocturnal measurements (00:00–06:00 LT) was 1.8 cm s−1, with a range of values spanning 0.9 to 3 cm s−1, which was within the range of previously reported values between 0.077 and 3 cm s−1 (Harrison and Kitto, 1994; Harrison et al., 1996; Spindler et al., 1999; Stutz et al., 2002; Coe and Gallagher, 1992; Laufs et al., 2017).
Figure 11 shows the nocturnal HONO budgets from 18:00 to 06:00 LT on 9 December (C2) and 11 December (E3). The production rate of HONO on aerosol surfaces (0.02±0.01 ppb h−1) was insignificant compared to the ground surfaces (0.28±0.03 ppb h−1) during C2. However, an average Paerosol of 0.10±0.01 ppb h−1 derived during E3 was comparable to the surface production rate of HONO (Pground, 0.47±0.03 ppb h−1), contributing about 20 % of the production of HONO, supporting the preceding result that HONO production on aerosols was an important nocturnal source of HONO during the haze episode. For the source of direct HONO emissions, Pemis just provided a part of the HONO at a rate of 0.06±0.07 and 0.10±0.10 ppb h−1. The loss of HONO due to surface deposition was the dominant sink for HONO during nighttime. The Ldep contributed 0.74±0.31 and 1.55±0.32 ppb h−1 to the nocturnal loss of HONO during C2 and E3, respectively, implying that significant amounts of HONO were deposited to the ground surface at night. This had been suggested in another study on the vertical gradient of HONO (VandenBoer et al., 2013).
High-resolution vertical profiles of HONO and NO2 were measured using an IBBCEAS instrument during the APHH-Beijing winter campaign. To the best of our knowledge, these are the first high-resolution vertical measurements of HONO and NO2 in urban areas of China. The HONO concentrations observed during E1, C2, and E3 were 4.26±2.08, 0.90±0.65, and 3.54±0.91 ppb, respectively. A relatively well-mixed boundary layer was observed after sunset, and the vertical distribution of HONO was consistent with reduced mixing and stratification in the lower several hundred meters of the nocturnal urban atmosphere. The small-scale stratification of the nocturnal atmosphere and the formation of a shallow inversion layer affected the vertical distribution of HONO and NO2. A near-steady state in HONO mixing ratio and HONO∕NO2 ratio was observed near midnight on 11 to 12 December, and an approximate balance was established between the production and loss of HONO.
Direct HONO emissions contributed an average of 29.3 % ± 12.4 % to the ambient HONO levels at night. High-resolution vertical profiles of HONO revealed (1) the ground surface dominated HONO production by heterogeneous conversion of NO2 during clean episodes, and (2) the production of HONO on aerosol surfaces explained the HONO observations in the residual layer during E3, suggesting that the aerosol production was an important nighttime HONO source during haze episodes. The column-average HONO concentration was irrelevant to the HONO observed between the ground level and 10 m during E3, implying that the aerosols dominate the heterogeneous production of HONO aloft from NO2 during haze episodes, while the surface production of HONO and direct emissions into the overlying air are minor contributors. Average dry deposition rates of 0.74±0.31 and 1.55±0.32 ppb h−1 were identified during the clean and haze episodes, respectively, implying that significant amounts of HONO were deposited to the ground surface at night. Overall, these results draw a picture of the nocturnal sources of HONO during different pollution levels and demonstrated the urgent need for high-resolution vertical measurements of HONO to a high height (e.g., using tethered balloons) and more comprehensive vertical observations to improve our understanding of the vertical distribution and chemistry of HONO in the PBL.
The data used in this study are available from the corresponding author upon request (mqin@aiofm.ac.cn).
The supplement related to this article is available online at: https://doi.org/10.5194/acp-20-5071-2020-supplement.
MQ and PX organized the field contributions from the Anhui Institute of Optics and Fine Mechanics group for the APHH-Beijing project. MQ and JD designed the study. WF and JD built the IBBCEAS instrument. JD and KT collected the HONO and NO2 data. YS and CX provided the ancillary data. FM and MQ analyzed the data. FM wrote the paper and MQ revised it. The ranking of FM and MQ are in no particular order.
The authors declare that they have no conflict of interest.
This article is part of the special issue “In-depth study of air pollution sources and processes within Beijing and its surrounding region (APHH-Beijing) (ACP/AMT inter-journal SI)”. It is not associated with a conference.
We gratefully acknowledge Bin Ouyang from Cambridge University for providing HONO measurement data for inter-comparison.
This research has been supported by the National Natural Science Foundation of China (grant nos. 91544104, 41571130023, and 41875154), the National Key R & D Program of China (grant nos. 2017YFC0209400 and 2016YFC0208204), and the Science and Technology Major Special Project of Anhui Province, China (grant no. 16030801120).
This paper was edited by Jennifer G. Murphy and reviewed by three anonymous referees.
Alicke, B., Platt, U., and Stutz, J.: Impact of nitrous acid photolysis on the total hydroxyl radical budget during the Limitation of Oxidant Production/Pianura Padana Produzione di Ozono study in Milan, J. Geophys. Res., 107, LOP 9-1–LOP 9-17, https://doi.org/10.1029/2000jd000075, 2002.
An, J., Li, Y., Chen, Y., Li, J., Qu, Y., and Tang, Y. J.: Enhancements of major aerosol components due to additional HONO sources in the North China Plain and implications for visibility and haze, Adv. Atmos. Sci., 30, 57–66, https://doi.org/10.1007/s00376-012-2016-9, 2012.
Bao, F. X., Li, M., Zhang, Y., Chen, C. C., and Zhao, J. C.: Photochemical Aging of Beijing Urban PM2.5: HONO Production, Environ. Sci. Technol., 52, 6309–6316, https://doi.org/10.1021/acs.est.8b00538, 2018.
Bartolomei, V., Alvarez, E. G., Wittmer, J., Tlili, S., Strekowski, R., Temime-Roussel, B., Quivet, E., Wortham, H., Zetzsch, C., Kleffmann, J., and Gligorovski, S.: Combustion Processes as a Source of High Levels of Indoor Hydroxyl Radicals through the Photolysis of Nitrous Acid, Environ. Sci. Technol., 49, 6599–6607, https://doi.org/10.1021/acs.est.5b01905, 2015.
Bejan, I., Abd-El-Aal, Y., Barnes, I., Benter, T., Bohn, B., Wiesen, P., and Kleffmann, J.: The photolysis of ortho-nitrophenols: a new gas phase source of HONO, Phys. Chem. Chem. Phys., 8, 2028–2035, https://doi.org/10.1039/b516590c, 2006.
Bond, T. C., Doherty, S. J., Fahey, D. W., Forster, P. M., Berntsen, T., DeAngelo, B. J., Flanner, M. G., Ghan, S., Kärcher, B., Koch, D., Kinne, S., Kondo, Y., Quinn, P. K., Sarofim, M. C., Schultz, M. G., Schulz, M., Venkataraman, C., Zhang, H., Zhang, S., Bellouin, N., Guttikunda, S. K., Hopke, P. K., Jacobson, M. Z., Kaiser, J. W., Klimont, Z., Lohmann, U., Schwarz, J. P., Shindell, D., Storelvmo, T., Warren, S. G., and Zender, C. S.: Bounding the role of black carbon in the climate system: A scientific assessment, J. Geophys. Res.-Atmos., 118, 5380–5552, https://doi.org/10.1002/jgrd.50171, 2013.
Brigante, M., Cazoir, D., D'Anna, B., George, C., and Donaldson, D. J.: Photoenhanced Uptake of NO2 by Pyrene Solid Films, J. Phys. Chem. A, 112, 9503–9508, https://doi.org/10.1021/jp802324g, 2008.
Bröske, R., Kleffmann, J., and Wiesen, P.: Heterogeneous conversion of NO2 on secondary organic aerosol surfaces: A possible source of nitrous acid (HONO) in the atmosphere?, Atmos. Chem. Phys., 3, 469–474, https://doi.org/10.5194/acp-3-469-2003, 2003.
Brown, S. S., Dubé, W. P., Osthoff, H. D., Wolfe, D. E., Angevine, W. M., and Ravishankara, A. R.: High resolution vertical distributions of NO3 and N2O5 through the nocturnal boundary layer, Atmos. Chem. Phys., 7, 139–149, https://doi.org/10.5194/acp-7-139-2007, 2007.
Cai, R. L., Yang, D. S., Fu, Y. Y., Wang, X., Li, X. X., Ma, Y., Hao, J. M., Zheng, J., and Jiang, J. K.: Aerosol surface area concentration: a governing factor in new particle formation in Beijing, Atmos. Chem. Phys., 17, 12327–12340, https://doi.org/10.5194/acp-17-12327-2017, 2017.
Coe, H. and Gallagher, M. W.: Measurements of Dry Deposition of NO2 to A Dutch Heathland Using the Eddy-Correlation Technique, Q. J. Roy. Meteorol. Soc., 118, 767–786, https://doi.org/10.1002/qj.49711850608, 1992.
Cui, L. L., Li, R., Zhang, Y. C., Meng, Y., Fu, H. B., and Chen, J. M.: An observational study of nitrous acid (HONO) in Shanghai, China: The aerosol impact on HONO formation during the haze episodes, Sci. Total Environ., 630, 1057–1070, https://doi.org/10.1016/j.scitotenv.2018.02.063, 2018.
Donaldson, M. A., Berke, A. E., and Raff, J. D.: Uptake of Gas Phase Nitrous Acid onto Boundary Layer Soil Surfaces, Environ. Sci. Technol., 48, 375–383, https://doi.org/10.1021/es404156a, 2014.
Du, W., Zhao, J., Wang, Y. J., Zhang, Y. J., Wang, Q. Q., Xu, W. Q., Chen, C., Han, T. T., Zhang, F., Li, Z. Q., Fu, P. Q., Li, J., Wang, Z. F., and Sun, Y. L.: Simultaneous measurements of particle number size distributions at ground level and 260 m on a meteorological tower in urban Beijing, China, Atmos. Chem. Phys., 17, 6797–6811, https://doi.org/10.5194/acp-17-6797-2017, 2017.
Duan, J., Qin, M., Ouyang, B., Fang, W., Li, X., Lu, K. D., Tang, K., Liang, S. X., Meng, F. H., Hu, Z. K., Xie, P. H., Liu, W. Q., and Häsler, R.: Development of an incoherent broadband cavity-enhanced absorption spectrometer for in situ measurements of HONO and NO2, Atmos. Meas. Tech., 11, 4531–4543, https://doi.org/10.5194/amt-11-4531-2018, 2018.
Finlayson-Pitts, B. J.: Reactions at surfaces in the atmosphere: integration of experiments and theory as necessary (but not necessarily sufficient) for predicting the physical chemistry of aerosols, Phys. Chem. Chem. Phys., 36, 7760–7779, https://doi.org/10.1039/B906540G, 2009.
Finlayson-Pitts, B. J., Wingen, L. M., Sumner, A. L., Syomin, D., and Ramazan, K. A.: The heterogeneous hydrolysis of NO2 in laboratory systems and in outdoor and indoor atmospheres: An integrated mechanism, Phys. Chem. Chem. Phys., 5, 223–242, https://doi.org/10.1039/b208564j, 2003.
George, C., Strekowski, R. S., Kleffmann, J., Stemmler, K., and Ammann, M.: Photoenhanced uptake of gaseous NO2 on solid organic compounds: a photochemical source of HONO?, Faraday Discuss., 130, 195–210, https://doi.org/10.1039/b417888m, 2005.
Gómez Alvarez, E., Sörgel, M., Gligorovski, S., Bassil, S., Bartolomei, V., Coulomb, B., Zetzsch, C., and Wortham, H.: Light-induced nitrous acid (HONO) production from NO2 heterogeneous reactions on household chemicals, Atmos. Environ., 95, 391–399, https://doi.org/10.1016/j.atmosenv.2014.06.034, 2014.
Han, C., Yang, W. J., Wu, Q. Q., Yang, H., and Xue, X. X.: Heterogeneous Photochemical Conversion of NO2 to HONO on the Humic Acid Surface under Simulated Sunlight, Environ. Sci. Technol., 50, 5017–5023, https://doi.org/10.1021/acs.est.5b05101, 2016.
Han, C., Yang, W. J., Yang, H., and Xue, X. X.: Enhanced photochemical conversion of NO2 to HONO on humic acids in the presence of benzophenone, Environ. Pollut., 231, 979–986, https://doi.org/10.1016/j.envpol.2017.08.107, 2017.
Hanst, P. L., Spence, J. W., and Miller, M.: Atmospheric Chemistry of N-nitroso Dimethylamine, Environ. Sci. Technol., 11, 403–405, https://doi.org/10.1021/es60127a007, 1977.
Hao, N., Zhou, B., Chen, D., and Chen, L. M..: Observations of nitrous acid and its relative humidity dependence in Shanghai, J. Environ. Sci., 18, 910–915, https://doi.org/10.1016/S1001-0742(06)60013-2, 2006.
Harrison, R. M. and Kitto, A. M. N.: Evidence for a surface source of atmospheric nitrous acid, Atmos. Environ., 28, 1089–1094, https://doi.org/10.1016/1352-2310(94)90286-0, 1994.
Harrison, R. M., Peak, J. D., and Collins, G. M.: Tropospheric cycle of nitrous acid, J. Geophys. Res., 101, 14429–14439, https://doi.org/10.1029/96JD00341, 1996.
Hendrick, F., Müller, J. F., Clémer, K., Wang, P., De Mazière, M., Fayt, C., Gielen, C., Hermans, C., Ma, J. Z., Pinardi, G., Stavrakou, T., Vlemmix, T., and Van Roozendael, M.: Four years of ground-based MAX-DOAS observations of HONO and NO2 in the Beijing area, Atmos. Chem. Phys., 14, 765–781, https://doi.org/10.5194/acp-14-765-2014, 2014.
Hou, S. Q., Tong, S. R., Ge, M. F., and An, J. L.: Comparison of atmospheric nitrous acid during severe haze and clean periods in Beijing, China, Atmos. Environ., 124, 199–206, https://doi.org/10.1016/j.atmosenv.2015.06.023, 2016.
Huang, R. J., Yang, L., Cao, J. J., Wang, Q. Y., Tie, X. X., Ho, K. F., Shen, Z. X., Zhang, R. J., Li, G. H., Zhu, C. S., Zhang, N. N., Dai, W. T., Zhou, J. M., Liu, S. X., Chen, Y., Chen, J., and O'Dowd, C. D.: Concentration and sources of atmospheric nitrous acid (HONO) at an urban site in Western China, Sci. Total Environ., 593–594, 165–172, https://doi.org/10.1016/j.scitotenv.2017.02.166, 2017.
Karamchandani, P., Emery, C., Yarwood, G., Lefer, B., Stutz, J., Couzo, E., and Vizuete, W.: Implementation and refinement of a surface model for heterogeneous HONO formation in a 3-D chemical transport model, Atmos. Environ., 112, 356–368, https://doi.org/10.1016/j.atmosenv.2015.01.046, 2015.
Kirchstetter, T. W., Harley, R. A., and Littlejohn D.: Measurement of nitrous acid in motor vehicle exhaust, Environ. Sci. Technol., 30, 2843–2849, https://doi.org/10.1021/es960135y, 1996.
Kleffmann, J.: Daytime Sources of Nitrous acid (HONO) in the Atmospheric Boundary Layer, Chemphyschem, 8, 1137–1144, https://doi.org/10.1002/cphc.200700016, 2007.
Kleffmann, J., Beckera, K. H., and Wiesena, P.: Heterogeneous NO2 conversion processes on acid surfaces: possible atmospheric implications, Atmos. Environ., 32, 2721–2729, https://doi.org/10.1016/S1352-2310(98)00065-X, 1998.
Kleffmann, J., Kurtenbach, R., Lörzer, J., Wiesen, P., Kalthoff, N., Vogel, B., and Vogel, H.: Measured and simulated vertical profiles of nitrous acid – Part I: Field measurements, Atmos. Environ., 37, 2949–2955, https://doi.org/10.1016/s1352-2310(03)00242-5, 2003.
Kurtenbach, R., Becker, K. H., Gomes, J. A. G., Kleffmann, J., Lörzer, J., Spittler, M., Wiesen, P., Ackermann, R., Geyer, A., and Platt, U.: Investigations of emission and heterogeneous formation of HONO in a road traffic tunnel, Atmos. Environ., 35, 3385–3394, https://doi.org/10.1016/S1352-2310(01)00138-8, 2001.
Laufs, S., Cazaunau, M., Stella, P., Kurtenbach, R., Cellier, P., Mellouki, A., Loubet, B., and Kleffmann, J.: Diurnal fluxes of HONO above a crop rotation, Atmos. Chem. Phys., 17, 6907–6923, https://doi.org/10.5194/acp-17-6907-2017, 2017.
Li, D. D., Xue, L. K., Wen, L., Wang, X. F., Chen, T. S., Mellouki, A., Chen, J. M., and Wang, W. X.: Characteristics and sources of nitrous acid in an urban atmosphere of northern China: Results from 1-yr continuous observations, Atmos. Environ., 182, 296–306, https://doi.org/10.1016/j.atmosenv.2018.03.033, 2018.
Li, S. P., Matthews, J., and Sinha, A.: Atmospheric Hydroxyl Radical Production from Electronically Excited NO2 and H2O, Science, 319, 1657–1660, https://doi.org/10.1126/science.1151443, 2008.
Li, X., Brauers, T., Häseler, R., Bohn, B., Fuchs, H., Hofzumahaus, A., Holland, F., Lou, S., Lu, K. D., Rohrer, F., Hu, M., Zeng, L. M., Zhang, Y. H., Garland, R. M., Su, H., Nowak, A., Wiedensohler, A., Takegawa, N., Shao, M., and Wahner, A.: Exploring the atmospheric chemistry of nitrous acid (HONO) at a rural site in Southern China, Atmos. Chem. Phys., 12, 1497–1513, https://doi.org/10.5194/acp-12-1497-2012, 2012.
Li, X., Rohrer, F., Hofzumahaus, A., Brauers, T., Häseler, R., Bohn, B., Broch, S., Fuchs, H., Gomm, H., Holland, F., Jäger, J., Kaiser, J., Keutsch, F. N., Lohse, I., Lu, K. D., Tillmann, R., Wegener, R., Wolfe, G. M., Mentel, T. F., Kiendler-Scharr, A., and Wahner, A.: Missing Gas-Phase Source of HONO Inferred from Zeppelin Measurement in the Troposphere, Science, 334, 292–296, https://doi.org/10.1126/science.1248999, 2014.
Liang, Y. T., Zha, Q. Z., Wang, W. H., Cui, L., Lui, K. H., Ho, K. F., Wang, Z., Lee, S. C., and Wang, T.: Revisiting nitrous acid (HONO) emission from on-road vehicles: A tunnel study with a mixed fleet, J. Air Waste Manage., 67, 797–805, https://doi.org/10.1080/10962247.2017.1293573, 2017.
Liu, X., Cheng, Y., Zhang, Y., Jung, J., Sugimoto, N., Chang, S. Y., Kim, Y. J., Fan, S., and Zeng, L.: Influences of relative humidity and particle chemical composition on aerosol scattering properties during the 2006 PRD campaign, Atmos. Environ., 42, 1525–1536, https://doi.org/10.1016/j.atmosenv.2007.10.077, 2008.
Liu, Y. H., Lu, K. D., Li, X., Dong, H. B., Tan, Z. F., Wang, H. C., Zou, Q., Wu, Y. S., Zeng, L. M., Hu, M., Min, K. E., Kecorius, S., Wiedensohler, A., and Zhang, Y. H.: A Comprehensive Model Test of the HONO Sources Constrained to Field Measurements at Rural North China Plain, Environ. Sci. Technol., 53, 3517–3525, https://doi.org/10.1021/acs.est.8b06367, 2019.
Liu, Y. L., Nie, W., Xu, Z., Wang, T. Y., Wang, R. X., Li, Y. Y., Wang, L., Chi, X. G., and Ding, A. J.: Semi-quantitative understanding of source contribution to nitrous acid (HONO) based on 1 year of continuous observation at the SORPES station in eastern China, Atmos. Chem. Phys., 19, 13289–13308, https://doi.org/10.5194/acp-19-13289-2019, 2019.
Liu, Z., Wang, Y. h., Costabile, F., Amoroso, A., Zhao, C., Huey, L. G., Stickel, R., Liao, J., and Zhu, T.: Evidence of Aerosols as a Media for Rapid Daytime HONO Production over China, Environ. Sci. Technol., 48, 14386–14391, https://doi.org/10.1021/es504163z, 2014.
Liu, Z., Wang, Y., Gu, D., Zhao, C., Huey, L. G., Stickel, R., Liao, J., Shao, M., Zhu, T., Zeng, L., Amoroso, A., Costabile, F., Chang, C.-C., and Liu, S.-C.: Summertime photochemistry during CAREBeijing-2007:ROx budgets and O3 formation, Atmos. Chem. Phys., 12, 7737–7752, https://doi.org/10.5194/acp-12-7737-2012, 2012.
Lu, K. D., Rohrer, F., Holland, F., Fuchs, H., Bohn, B., Brauers, T., Chang, C. C., Häseler, R., Hu, M., Kita, K., Kondo, Y., Li, X., Lou, S. R., Nehr, S., Shao, M., Zeng, L. M., Wahner, A., Zhang, Y. H., and Hofzumahaus, A.: Observation and modelling of OH and HO2 concentrations in the Pearl River Delta 2006: a missing OH source in a VOC rich atmosphere, Atmos. Chem. Phys., 12, 1541–1569, https://doi.org/10.5194/acp-12-1541-2012, 2012.
Ma, Q. X., Wang, T., Liu, C., He, H., Wang, Z., Wang, W. H., and Liang, Y. T.: SO2 Initiates the Efficient Conversion of NO2 to HONO on MgO Surface, Environ. Sci. Technol., 51, 3767–3775, https://doi.org/10.1021/acs.est.6b05724, 2017.
Mendez, M., Blond, N., Amedro, D., Hauglustaine, D. A., Blondeau, P., Afif, C., Fittschen, C., and Schoemaecker, C.: Assessment of indoor HONO formation mechanisms based on in situ measurements and modeling, Indoor Air, 27, 443–451, https://doi.org/10.1111/ina.12320, 2017.
Michoud, V., Colomb, A., Borbon, A., Miet, K., Beekmann, M., Camredon, M., Aumont, B., Perrier, S., Zapf, P., Siour, G., Ait-Helal, W., Afif, C., Kukui, A., Furger, M., Dupont, J. C., Haeffelin, M., and Doussin, J. F.: Study of the unknown HONO daytime source at a European suburban site during the MEGAPOLI summer and winter field campaigns, Atmos. Chem. Phys., 14, 2805–2822, https://doi.org/10.5194/acp-14-2805-2014, 2014.
Michoud, V., Doussin, J.-F., Colomb, A., Afif, C., Borbon, A., Camredon, M., Aumont, B., Legrand, M., and Beekmann, M.: Strong HONO formation in a suburban site during snowy days, Atmos. Environ., 116, 155–158, https://doi.org/10.1016/j.atmosenv.2015.06.040, 2015.
Oswald, R., Ermel, M., Hens, K., Novelli, A., Ouwersloot, H. G., Paasonen, P., Petäjä, T., Sipilä, M., Keronen, P., Bäck, J., Königstedt, R., Hosaynali Beygi, Z., Fischer, H., Bohn, B., Kubistin, D., Harder, H., Martinez, M., Williams, J., Hoffmann, T., Trebs, I., and Sörgel, M.: A comparison of HONO budgets for two measurement heights at a field station within the boreal forest in Finland, Atmos. Chem. Phys., 15, 799–813, https://doi.org/10.5194/acp-15-799-2015, 2015.
Pitts, J. N., Grosjean, D., Cauwenberghe, K. V., Schmid, J. P., and Fitz, D. R.: Photooxidation of aliphatic amines under simulated atmospheric conditions: formation of nitrosamines, nitramines, amides, and photochemical oxidant, Environ. Sci. Technol., 12, 946–953, https://doi.org/10.1021/es60144a009, 1978.
Rappenglück, B., Lubertino, G., Alvarez, S., Golovko, J., Czader, B., and Ackermann, L.: Radical precursors and related species from traffic as observed and modeled at an urban highway junction, J. Air Waste Manage. Assoc., 63, 1270–1286, https://doi.org/10.1080/10962247.2013.822438, 2013.
Reisinger, A. R.: Observations of HNO2 in the polluted winter atmosphere: possible heterogeneous production on aerosols, Atmos. Environ., 34, 3865–3874, https://doi.org/10.1016/S1352-2310(00)00179-5, 2000.
Saastad, O. W., Ellermann, T., and Nielsen, C., J.: On the adsorption of NO and NO2 on cold H2O∕H2SO4 surfaces, Geophys. Res. Lett., 20, 1191–1193, https://doi.org/10.1029/93GL01621, 1993.
Sleiman, M., Gundel, L. A., Pankow, J. F., Jacob III, P., Singer, B. C., and Destaillats, H.: Formation of carcinogens indoors by surface-mediated reactions of nicotine with nitrous acid, leading to potential thirdhand smoke hazards, P. Natl. Acad. Sci. USA, 107, 6576–6581, https://doi.org/10.1073/pnas.0912820107, 2010.
Sörgel, M., Regelin, E., Bozem, H., Diesch, J. M., Drewnick, F., Fischer, H., Harder, H., Held, A., Hosaynali-Beygi, Z., Martinez, M., and Zetzsch, C.: Quantification of the unknown HONO daytime source and its relation to NO2, Atmos. Chem. Phys., 11, 10433–10447, https://doi.org/10.5194/acp-11-10433-2011, 2011.
Spataro, F., Ianniello, A., Esposito, G., Allegrini, I., Zhu, T., and Hu, M.: Occurrence of atmospheric nitrous acid in the urban area of Beijing (China), Sci. Total Environ., 447, 210–224, https://doi.org/10.1016/j.scitotenv.2012.12.065, 2013.
Spindler, G., Brüggemann, E., and Herrmann, H.: Nitrous acid (HNO2) Concentration Measurements and Estimation of Dry Deposition over Grassland in Eastern Germany, Trans. Ecol. Environ., 28, 223–227, 1999.
Stemmler, K., Ammann, M., Donders, C., Kleffmann, J., and George, C.: Photosensitized reduction of nitrogen dioxide on humic acid as a source of nitrous acid, Nature, 440, 195–198, https://doi.org/10.1038/nature04603, 2006.
Stutz, J., Alicke, B., and Neftel, A.: Nitrous acid formation in the urban atmosphere: Gradient measurements of NO2 and HONO over grass in Milan, Italy, J. Geophys. Res., 107, LOP 5-1–LOP 5-15, https://doi.org/10.1029/2001JD000390, 2002.
Stutz, J., Alicke, B., Ackermann, R., Geyer, A., Wang, S. H., White, A. B., Williams, E. J., Spicer, C. W., and Fast, J. D.: Relative humidity dependence of HONO chemistry in urban areas, J. Geophys. Res.-Atmos., 109, D03307, https://doi.org/10.1029/2003JD004135, 2004a.
Stutz, J., Alicke, B., Ackermann, R., Geyer, A., White, A., and Williams, E.: Vertical profiles of NO3, N2O5, O3, and NOx in the nocturnal boundary layer: 1. Observations during the Texas Air Quality Study 2000, J. Geophys. Res.-Atmos., 109, D12306, https://doi.org/10.1029/2003JD004209, 2004b.
Su, H., Cheng, Y. F., Cheng, P., Zhang, Y. H., Dong, S. F., Zeng, L. M., Wang, X. S., Slanina, J., Shao, M., and Wiedensohler, A.: Observation of nighttime nitrous acid (HONO) formation at a non-urban site during PRIDE-PRD2004 in China, Atmos. Environ., 42, 6219–6232, https://doi.org/10.1016/j.atmosenv.2008.04.006, 2008a.
Su, H., Cheng, Y. F., Shao, M., Gao, D. F., Yu, Z. Y., Zeng, L. M., Slanina, J., Zhang, Y. H., and Wiedensohler, A.: Nitrous acid (HONO) and its daytime sources at a rural site during the 2004 PRIDE-PRD experiment in China, J. Geophys. Res., 113, D14312, https://doi.org/10.1029/2007JD009060, 2008b.
Sun, Y. L., Wang, Z. F., Fu, P. Q., Yang, T., Jiang, Q., Dong, H. B., Li, J., and Jia, J. J.: Aerosol composition, sources and processes during wintertime in Beijing, China, Atmos. Chem. Phys., 13, 4577–4592, https://doi.org/10.5194/acp-13-4577-2013, 2013.
Sun, Y. L., Jiang, Q., Wang, Z. F., Fu, P. Q., Li, J., Yang, T., and Yin, Y.: Investigation of the sources and evolution processes of severe haze pollution in Beijing in January 2013, J. Geophys. Res.-Atmos., 119, 4380–4398, https://doi.org/10.1002/2014JD021641, 2014.
Tan, Z. F., Fuchs, H., Lu, K. D., Hofzumahaus, A., Bohn, B., Broch, S., Dong, H. B., Gomm, S., Häseler, R., He, L. Y., Holland, F., Li, X., Liu, Y., Lu, S. H., Rohrer, F., Shao, M., Wang, B. L., Wang, M., Wu, Y. S., Zeng, L. M., Zhang, Y. S., Wahner, A., and Zhang, Y. H.: Radical chemistry at a rural site (Wangdu) in the North China Plain: observation and model calculations of OH, HO2 and RO2 radicals, Atmos. Chem. Phys., 17, 663–690, https://doi.org/10.5194/acp-17-663-2017, 2017.
Tang, K., Qin, M., Duan, J., Fang, W., Meng, F. H., Liang, S. X., Xie, P. H., Liu, J. G., Liu, W. Q., Xue, C. Y., and Mu, Y. J.: A dual dynamic chamber system based on IBBCEAS for measuring fluxes of nitrous acid in agricultural fields in the North China Plain, Atmos. Environ., 196, 10–19, https://doi.org/10.1016/j.atmosenv.2018.09.059, 2019.
Tang, Y., An, J., Wang, F., Li, Y., Qu, Y., Chen, Y., and Lin, J.: Impacts of an unknown daytime HONO source on the mixing ratio and budget of HONO, and hydroxyl, hydroperoxyl, and organic peroxy radicals, in the coastal regions of China, Atmos. Chem. Phys., 15, 9381–9398, https://doi.org/10.5194/acp-15-9381-2015, 2015.
Tong, S. R., Hou, S. Q., Zhang, Y., Chu, B. W., Liu, Y. C., He, H., Zhao, P. S., and Ge, M. F.: Exploring the nitrous acid (HONO) formation mechanism in winter Beijing: direct emissions and heterogeneous production in urban and suburban areas, Faraday Discuss., 189, 213–230, https://doi.org/10.1039/c5fd00163c, 2016.
Trinh, H. T., Imanishi, K., Morikawa, T., Hagino, H., and Takenaka N.: Gaseous nitrous acid (HONO) and nitrogen oxides (NOx) emission from gasoline and diesel vehicles under real-world driving test cycles, J. Air Waste Manage. Assoc., 67, 412–420, https://doi.org/10.1080/10962247.2016.1240726, 2017.
VandenBoer, T. C., Brown, S. S., Murphy, J. G., Keene, W. C., Young, C. J., Pszenny, A. A. P., Kim, S., Warneke, C., de Gouw, J. A., Maben, J. R., Wagner, N. L., Riedel, T. P., Thornton, J. A., Wolfe, D. E., Dubé, W. P., Öztürk, F., Brock, C. A., Grossberg, N., Lefer, B., Lerner, B., Middlebrook, A. M., and Roberts, J. M.: Understanding the role of the ground surface in HONO vertical structure: High resolution vertical profiles during NACHTT-11, J. Geophy. Res.-Atmos., 118, 10155–10171, https://doi.org/10.1002/jgrd.50721, 2013.
Villena, G., Kleffmann, J., Kurtenbach, R., Wiesen, P., Lissi, E., Rubio, M. A., Croxatto, G., and Rappenglück, B.: Vertical gradients of HONO, NOx and O3 in Santiago de Chile, Atmos. Environ., 45, 3867–3873, https://doi.org/10.1016/j.atmosenv.2011.01.073, 2011.
Vogel, B., Vogel H., Kleffmann, J., and Kurtenbach, R.: Measured and simulated vertical profiles of nitrous acid – Part II. Model simulations and indications for a photolytic source, Atmos. Environ., 37, 2957–2966, https://doi.org/10.1016/S1352-2310(03)00243-7, 2003.
Wang, H. C., Lu, K. D., Chen, X. R., Zhu, Q. D., Wu, Z. J., Wu, Y. S., and Sun, K.: Fast particulate nitrate formation via N2O5 uptake aloft in winter in Beijing, Atmos. Chem. Phys., 18, 10483–10495, https://doi.org/10.5194/acp-18-10483-2018, 2018.
Wang, J. Q., Zhang, X. S., Guo, J., Wang, Z. W., and Zhang, M. G.: Observation of nitrous acid (HONO) in Beijing, China: Seasonal variation, nocturnal formation and daytime budget, Sci. Total Environ., 587–588, 350–359, https://doi.org/10.1016/j.scitotenv.2017.02.159, 2017.
Wang, S. S., Zhou, R., Zhao, H., Wang, Z. R., Chen, L. M., and Zhou, B.: Long-term observation of atmospheric nitrous acid (HONO) and its implication to local NO2 levels in Shanghai, China, Atmos. Environ., 77, 718–724, https://doi.org/10.1016/j.atmosenv.2013.05.071, 2013.
Wong, K. W., Oh, H. -J., Lefer, B. L., Rappenglück, B., and Stutz, J.: Vertical profiles of nitrous acid in the nocturnal urban atmosphere of Houston, TX, Atmos. Chem. Phys., 11, 3595–3609, https://doi.org/10.5194/acp-11-3595-2011, 2011.
Wong, K. W., Tsai, C., Lefer, B., Haman, C., Grossberg, N., Brune, W. H., Ren, X., Luke, W., and Stutz, J.: Daytime HONO vertical gradients during SHARP 2009 in Houston, TX, Atmos. Chem. Phys., 12, 635–652, https://doi.org/10.5194/acp-12-635-2012, 2012.
Wong, K. W., Tsai, C., Lefer, B., Grossberg, N., and Stutz, J.: Modeling of daytime HONO vertical gradients during SHARP 2009, Atmos. Chem. Phys., 13, 3587–3601, https://doi.org/10.5194/acp-13-3587-2013, 2013.
Xie, C. H., Xu, W. Q., Wang, J. F., Wang, Q. Q., Liu, D. T., Tang, G. Q., Chen, P., Du, W., Zhao, J., Zhang, Y. J., Zhou, W., Han, T. T., Bian, Q. Y., Li, J., Fu, P. Q., Wang, Z. F., Ge, X. L., Allan, J., Coe, H., and Sun, Y. L.: Vertical characterization of aerosol optical properties and brown carbon in winter in urban Beijing, China, Atmos. Chem. Phys., 19, 165–179, https://doi.org/10.5194/acp-19-165-2019, 2019.
Xu, W. Q., Sun, Y. L., Wang, Q. Q., Zhao, J., Wang, J. F., Ge, X. L., Xie, C. H., Zhou, W., Du, W., Li, J., Fu, P. Q., Wang, Z. F., Worsnop, D. R., and Coe, H.: Changes in Aerosol Chemistry From 2014 to 2016 in Winter in Beijing: Insights From High-Resolution Aerosol Mass Spectrometry, J. Geophys. Res.-Atmos., 124, 1132–1147, https://doi.org/10.1029/2018JD029245, 2019.
Xu, Z., Wang, T., Wu, J. Q., Xue, L. K., Chan, J., Zha, Q., Z., Zhou, S. Z., Louie, P. K. K., and Luk, C. W. Y.: Nitrous acid (HONO) in a polluted subtropical atmosphere: Seasonal variability, direct vehicle emissions and heterogeneous production at ground surface, Atmos. Environ., 106, 100–109, https://doi.org/10.1016/j.atmosenv.2015.01.061, 2015.
Yang, Q., Su, H., Li, X., Cheng, Y. F., Lu, K. D., Cheng, P., Gu, J. W., Guo, S., Hu, M., Zeng, L. M., Zhu, T., and Zhang, Y. H.: Daytime HONO formation in the suburban area of the megacity Beijing, China, Sci. China Chem., 57, 1032–1042, https://doi.org/10.1007/s11426-013-5044-0, 2014.
Ye, C. X., Zhang, N., Gao, H. L., and Zhou, X. L.: Photolysis of Particulate Nitrate as a Source of HONO and NOx, Environ. Sci. Technol., 51, 6849–6856, https://doi.org/10.1021/acs.est.7b00387, 2017.
Ye, C. X., Zhou, X. L., Pu, D., Stutz, J., Festa, J., Spolaor, M., Tsai, C., Cantrell, C., Mauldin, R. L., Weinheimer, A., Hornbrook, R. S., Apel, E. C., Guenther, A., Kaser, L., Yuan, B., Karl, T., Haggerty, J., Hall, S., Ullmann, K., Smith, J., and Ortega, J.: Tropospheric HONO distribution and chemistry in the southeastern US, Atmos. Chem. Phys., 18, 9107–9120, https://doi.org/10.5194/acp-18-9107-2018, 2018.
Yu, Y., Galle, B., Panday, A., Hodson, E., Prinn, R., and Wang, S.: Observations of high rates of NO2-HONO conversion in the nocturnal atmospheric boundary layer in Kathmandu, Nepal, Atmos. Chem. Phys., 9, 6401–6415, https://doi.org/10.5194/acp-9-6401-2009, 2009.
Zhang, N., Zhou, X. L., Shepson, P. B., Gao, H. L., Alaghmand, M., and Stirm, B.: Aircraft measurement of HONO vertical profiles over a forested region, Geophys. Res. Lett., 36, L15820, https://doi.org/10.1029/2009GL038999, 2009.
Zhang, R., Wang, G., Guo, S., Zamora, M. L., Ying, Q., Lin, Y., Wang. W., Hu, M., and Wang, Y.: Formation of Urban Fine Particulate Matter, Chem. Rev., 115, 3303–3855, https://doi.org/10.1021/acs.chemrev.5b00067, 2015.
Zhang, W. Q., Tong, S. R., Ge, M. F., An, J. L., Shi, Z. B., Hou, S. Q., Xia, K. H., Qu, Y., Zhang, H. X., Chu, B. W., Sun, Y. L., and He, H.: Variations and sources of nitrous acid (HONO) during a severe pollution episode in Beijing in winter 2016, Sci. Total Environ., 648, 253–262, https://doi.org/10.1016/j.scitotenv.2018.08.133, 2018.