the Creative Commons Attribution 4.0 License.
the Creative Commons Attribution 4.0 License.
 | 28 Apr 2020
Tracer-based investigation of organic aerosols in marine atmospheres from marginal seas of China to the northwest Pacific Ocean
Tianfeng Guo
Zhigang Guo
Juntao Wang
Jialiang Feng
Huiwang Gao
Xiaohong Yao
We investigated the geographic distributions of organic tracers in total suspended particles over the marginal seas of China, including the Yellow and Bohai seas (YBS) and the South China Sea (SCS), and the northwest Pacific Ocean (NWPO) in spring, when Asian outflows strongly affect downwind marine atmospheres. The comparison of levoglucosan observed in this study with values from the literature showed that the concentrations of biomass burning aerosols over the NWPO increased largely in 2014. However more observations, in addition to our snapshot measurement, are need to confirm whether the large increase has occurred continuously over the last few decades. The increase led to a mean observed levoglucosan value (8.2±14 ng m−3) over the NWPO that was close to that over the SCS (9.6±8.6 ng m−3) and almost half of that over the YBS (21±11 ng m−3). Small geographic differences in monoterpene-derived and sesquiterpene-derived secondary organic tracer concentrations were obtained among the three atmospheres, although the causes may differ. By contrast, a large difference in isoprene-derived secondary organic tracer concentrations was observed among the three atmospheres, with the sum of tracer concentrations over the SCS (45±54 ng m−3) being several times and approximately 1 order of magnitude greater than that over the YBS (15±16 ng m−3) and the NWPO (2.3±1.6 ng m−3), respectively. The geographic distribution of aromatic-derived secondary organic tracers was similar to that of isoprene-derived secondary organic tracers, with a slightly narrower difference: 1.8±1.7, 1.1±1.4 and 0.3±0.5 ng m−3 over the SCS, the YBS and the NWPO, respectively. We discuss the causes of the distinctive geographic distributions of these tracers and present the tracer-based estimation of organic carbon.
- Article
(7860 KB) - Full-text XML
-
Supplement
(930 KB) - BibTeX
- EndNote


Aerosols that emanate from biomass burning (BB) consist primarily of carbonaceous components and inorganic salts, which can affect the climate directly by absorbing solar radiation or indirectly by acting as either cloud condensation nuclei (CCN) or ice nuclei (IN) (Bougiatioti et al., 2016; Chen et al., 2017; Hsiao et al., 2016). High BB aerosol emissions zones include boreal forests (e.g., in Eurasia and North America), tropical forests (e.g., in southeast Asia and the tropical Americas) and agriculture areas where crop residuals are burned (e.g., in developing countries such as China and India; van der Werf et al., 2006). BB aerosols can undergo long-range transport in the atmosphere, which can carry them from the continents to the oceans (Ding et al., 2013; Fu et al., 2011; Kanakidou et al., 2005). For example, BB aerosols from boreal forest wildfires in Russia and China reportedly made an appreciable contribution to atmospheric particle loads observed over the Arctic Ocean and northwest Pacific Ocean (NWPO) based on specific BB tracers (Ding et al., 2013). Although open wildfires from forests occur sporadically in terms of strength and occurrence frequency, global warming could be conducive to vegetation fires (Running, 2006) and, thus, increase emissions of BB aerosols. In this century, 9 years were among the 10 hottest global years on record, with the years from 2014 to 2018 being ranked as the top five hottest years (https://www.climatecentral.org/gallery/graphics/the-10-hottest-global-years-on-record, last access: 24 April 2020). Thus, the following question is automatically raised: how do BB aerosols in the marine atmosphere in the hottest global years change against previously reported observations?
In addition to BB aerosols, the secondary oxidation of biogenic volatile organic compounds (BVOCs) and anthropogenic VOCs (AVOCs) also contribute to the particulate carbonaceous components of marine atmospheres (Kanakidou et al., 2005). Secondary organic aerosols (SOAs) arising from the oxidation of phytoplankton-derived isoprene have been argued to affect the chemical composition of marine atmospheric aerosols and, consequently, CCN loading and cloud droplet number concentrations (Ekström et al., 2009; Meskhidze and Nenes, 2006), but the importance of marine isoprene-derived SOAs is still debated (Arnold et al., 2009; Claeys et al., 2010; Gantt et al., 2009; Guenther et al., 1995). For example, Gantt et al. (2009) estimated that the contribution of marine isoprene-derived SOA to the organic carbon (OC) in marine atmospheric particles is less than 0.2 % on a global scale, but that the hourly averaged submicrometer OC emission may approach 50 % over vast regions of the oceans during the midday hours when isoprene emissions are highest. Several modeling studies have shown that the NWPO may experience the greatest increases in sea surface temperature and CO2 input under a future warming climate (John et al., 2015; Lauvset et al., 2017). The Kuroshio extension current system causes the NWPO to be an active subtropical cyclone basin, promoting biogenic activities (Hu et al., 2018). From the perspective of global change, there is a long-term need to study the dynamic changes in atmospheric aerosols derived from marine sources over the NWPO and the adjacent marginal seas of China, as well as their potential effects on climate.
More importantly, BVOCs emitted from continental ecosystems and their oxidation products can significantly affect the atmosphere in remote marine areas via long-range transport (Ding et al., 2013; Fu et al., 2011; Hu et al., 2013a; Kang et al., 2018; Kawamura et al., 2017). BVOCs consist primarily of isoprene, monoterpenes, sesquiterpenes and their oxygenated hydrocarbons, such as alcohols, aldehydes and ketones (Ehn et al., 2014; Guenther et al., 2006), and account for the majority of the global VOC inventory (Heald et al., 2008; Zhu et al., 2016a, b). However, emission fluxes and oxidation processes of BVOCs show great variation, depending on global warming and other factors such as regional landscape and other pollutants in the ambient air (Ait-Helal et al., 2014; Claeys et al., 2004; Hu and Yu, 2013; Peñuelas and Staudt, 2010). Unlike a potential increase in BVOC-derived organics aerosols in marine atmospheres under global warming, anthropogenic VOCs and carbonaceous particles over the continents have decreased due to effective mitigation of air pollutants over the last few decades (Li et al., 2019; Murphy et al., 2011; Sharma et al., 2004; Zhang et al., 2012). In the Northern Hemisphere, marine atmospheres are also usually affected by anthropogenic pollutants to some extent, most of which are derived from long-range transport from continents (Bao et al., 2018; Kang et al., 2019; Zhang et al., 2017). The reverse trends in BVOCs and anthropogenic VOCs would change the composition and sources of carbonaceous particles in marine atmospheres. Therefore, updated observations are needed to reveal this change and service the future study of the impacts.
In this study, we determined the concentrations of some typical organic tracers in aerosol samples obtained from three cruise campaigns from the marginal seas of China, including in the South China Sea (SCS) in 2017 and the Yellow Sea and Bohai Sea (YBS) to the NWPO in 2014 (both in springtime). We investigated the influences of BB aerosols from continents over three marine atmospheres, quantified the contributions of various precursors to the observed SOA in marine atmospheres using organic tracers established in the literature and explored the formation pathways of SOA from their precursors during long-range transport in these hottest global years. In particular, we conducted a comprehensive comparison of this observation with those reported in the literature in terms of parameters such as long-term variations and geographic distributions of these tracers.
Total suspended particulate (TSP) samples were collected over the NWPO from 19 March to 21 April 2014, over the YBS from 30 April to 17 May 2014 and over the SCS from 29 March to 4 May 2017. All samples were collected on the upper deck of the R/V Dong Fang Hong II, which sits ∼8 m above the sea surface. To avoid contamination from the ship's exhaust, samples were only collected when the ship was sailing, and the wind direction ranged from −90 to 90∘ relative to the bow. TSP samples were collected on quartz fiber filters (Whatman QM-A) that had been prebaked for 4 h at 500∘ C prior to sampling using a high-volume sampler (KC-1000, Qingdao Laoshan Electric Inc., China). The sampling duration was 15–20 h at a flow rate of ∼1000 L min−1. After sampling, the sample filters were wrapped in baked aluminum foil and sealed in polyethylene bags; they were then stored at −20 ∘ C and transported to the laboratory. Field blanks were collected during each sampling period. However, one sampler was out of service during the cruise on the SCS. As a compromise, cellulose filters (Whatman Grade 41) that were previously intended for elemental analyses were used for the analyses of the organic tracers in TSP.
The method for determining the concentrations of tracers was adapted from Kleindienst et al. (2007) and Feng et al. (2013). Briefly, 20 mL of dichloromethane/methanol (1:1, v∕v) was used for ultrasonic extraction of 40 cm2 of each filter at room temperature three times. The combined extracts were filtered, dried under a gentle stream of ultrapure nitrogen and then derivatized with 100 µL N,O-bis-(trimethylsilyl)-trifluoroacetamide (BSTFA, containing 1 % trimethylchlorosilane as a catalyst) and 20 µL pyridine at 75 ∘C for 45 min. Gas chromatography mass spectrometry (GC-MS) analyses were conducted with an Agilent 6890 GC/5975 MSD. Prior to solvent extraction, methyl-β-D-xylanopyranoside (MXP) was spiked into the samples as an internal/recovery standard. Hexamethylbenzene was added prior to injection as an internal standard to check the recovery of the surrogates.
Like those reported by Feng et al. (2013), the primary organic tracers measured in this study included levoglucosan (LEVO), mannosan and galactosan. Four types of secondary organic tracers were used: isoprene-derived secondary organic tracers (SOAI) including 2-methylglyceric acid (2-MGA), C5-alkene triols (cis-2-methyl-1,3,4-trihydroxy-1-butene, 3-methyl-2,3,4-trihydroxy-1-butene and trans-2-methyl-1,3,4-trihydroxy-1-butene) and MTLs (2-methylthreitol and 2-methylerythritol); monoterpene-derived secondary organic tracers (SOAM) including 3-hydroxyglutaric acid (HGA), 3-hydroxy-4,4-dimethylglutaric acid (HDMGA) and 3-methyl-1,2,3-butanetricarboxylic acid (MBTCA); the sesquiterpene-derived secondary organic tracer (SOAS) β-caryophyllinic acid; and the aromatic (toluene)-derived secondary organic tracer (SOAA) 2,3-dihydroxy-4-oxopentanoic acid (DHOPA). LEVO was quantified based on authentic standards in this study, whereas the SOA tracers without available commercial standards were quantified using methyl-β-D-xylanopyranoside (MXP) as a surrogate. To reduce the uncertainty of quantification, relative response factors of the target tracers to MXP were estimated by comparing the target tracers to the MXP area ratio in selected-ions mode with that in total-ions mode in samples that showed high concentrations of the target tracers (Feng et al., 2013).
Field blanks and laboratory blanks (run every 10 samples) were extracted and analyzed in the same manner as the ambient samples. Target compounds were nearly always below the detection limit in field and laboratory blanks. Recoveries of the surrogate (MXP) were in the range of 70 %–110 %. The reported results were corrected for recovery, assuming that the target compounds had the same recovery as the surrogate. Duplicate analyses indicated that the deviation was less than 15 %.
However, the substitution of cellulose filters (Whatman Grade 41) during the cruise on the SCS led to increased field blank values for some tracers. However, the tracer concentrations in those samples were over 3 times higher than the field blank values, except for those of mannosan and galactosan. Thus, data for mannosan and galactosan were unavailable, as were the total organic carbon concentrations, for samples collected during the cruise on the SCS.
The concentrations of organic carbon (OC) and element carbon (EC) in each sample were measured with a DRI Model 2001A thermal/optical carbon analyzer (Atmoslytic Inc., Calabasas, CA, USA) using the IMPROVE temperature program (Wang et al., 2015). All filters were weighted before and after sampling at a glove box under controlled ambient temperature and relative humidity. Mass concentrations of TSP, however, should be treated as semiquantitative results by considering analytic errors of quartz fiber filters (Yao et al., 2009).
3.1 Spatiotemporal distributions of LEVO
Levoglucosan, mannosan and galactosan produced by the pyrolysis of cellulose and hemicellulose have been widely used as organic tracers of BB aerosols in ambient air (Ding et al., 2013; Fu et al., 2011; Feng et al., 2013). The mean levels of LEVO in TSP collected during the cruises on the NWPO and the SCS were comparable, at 8.2 and 9.6 ng m−3, respectively (Fig. S1; Table 1). They were almost half of the mean value of 21 ng m−3 during the cruise on the YBS, where high concentrations of BB aerosols have been observed in continental atmospheres upwind of the YBS from sources such as wildfires and the burning of crop residue (Feng et al., 2012, 2013; Yang et al., 2014). Unlike the small difference among the mean values, the concentration of LEVO fluctuated greatly among TSP samples in each oceanic zone, ranging from 0.5 to 65 ng m−3 over the NWPO, from 1.0 to 30 ng m−3 over the SCS and from 2.5 to 42 ng m−3 over the YBS (Fig. S1). High spatiotemporal variation in LEVO in TSP has also been observed in the literature, with concentrations of LEVO fluctuating around 0.2–41 ng m−3 during Arctic to Antarctic cruises from July to September 2008 and from November 2009 to April 2010 (Hu et al., 2013b). Hu et al. (2013b) also reported the highest LEVO concentrations occurring at midlatitudes (30–60∘ N and 30–60∘ S) and the lowest at Antarctic and equatorial latitudes over the several months of sampling. This distinctive geographical distribution was not observed in the present study, as there were no significant differences in LEVO in TSP between the SCS and NWPO (p > 0.05).
Table 1Sum of organic tracer contents (ng m−3) at different locations worldwide.
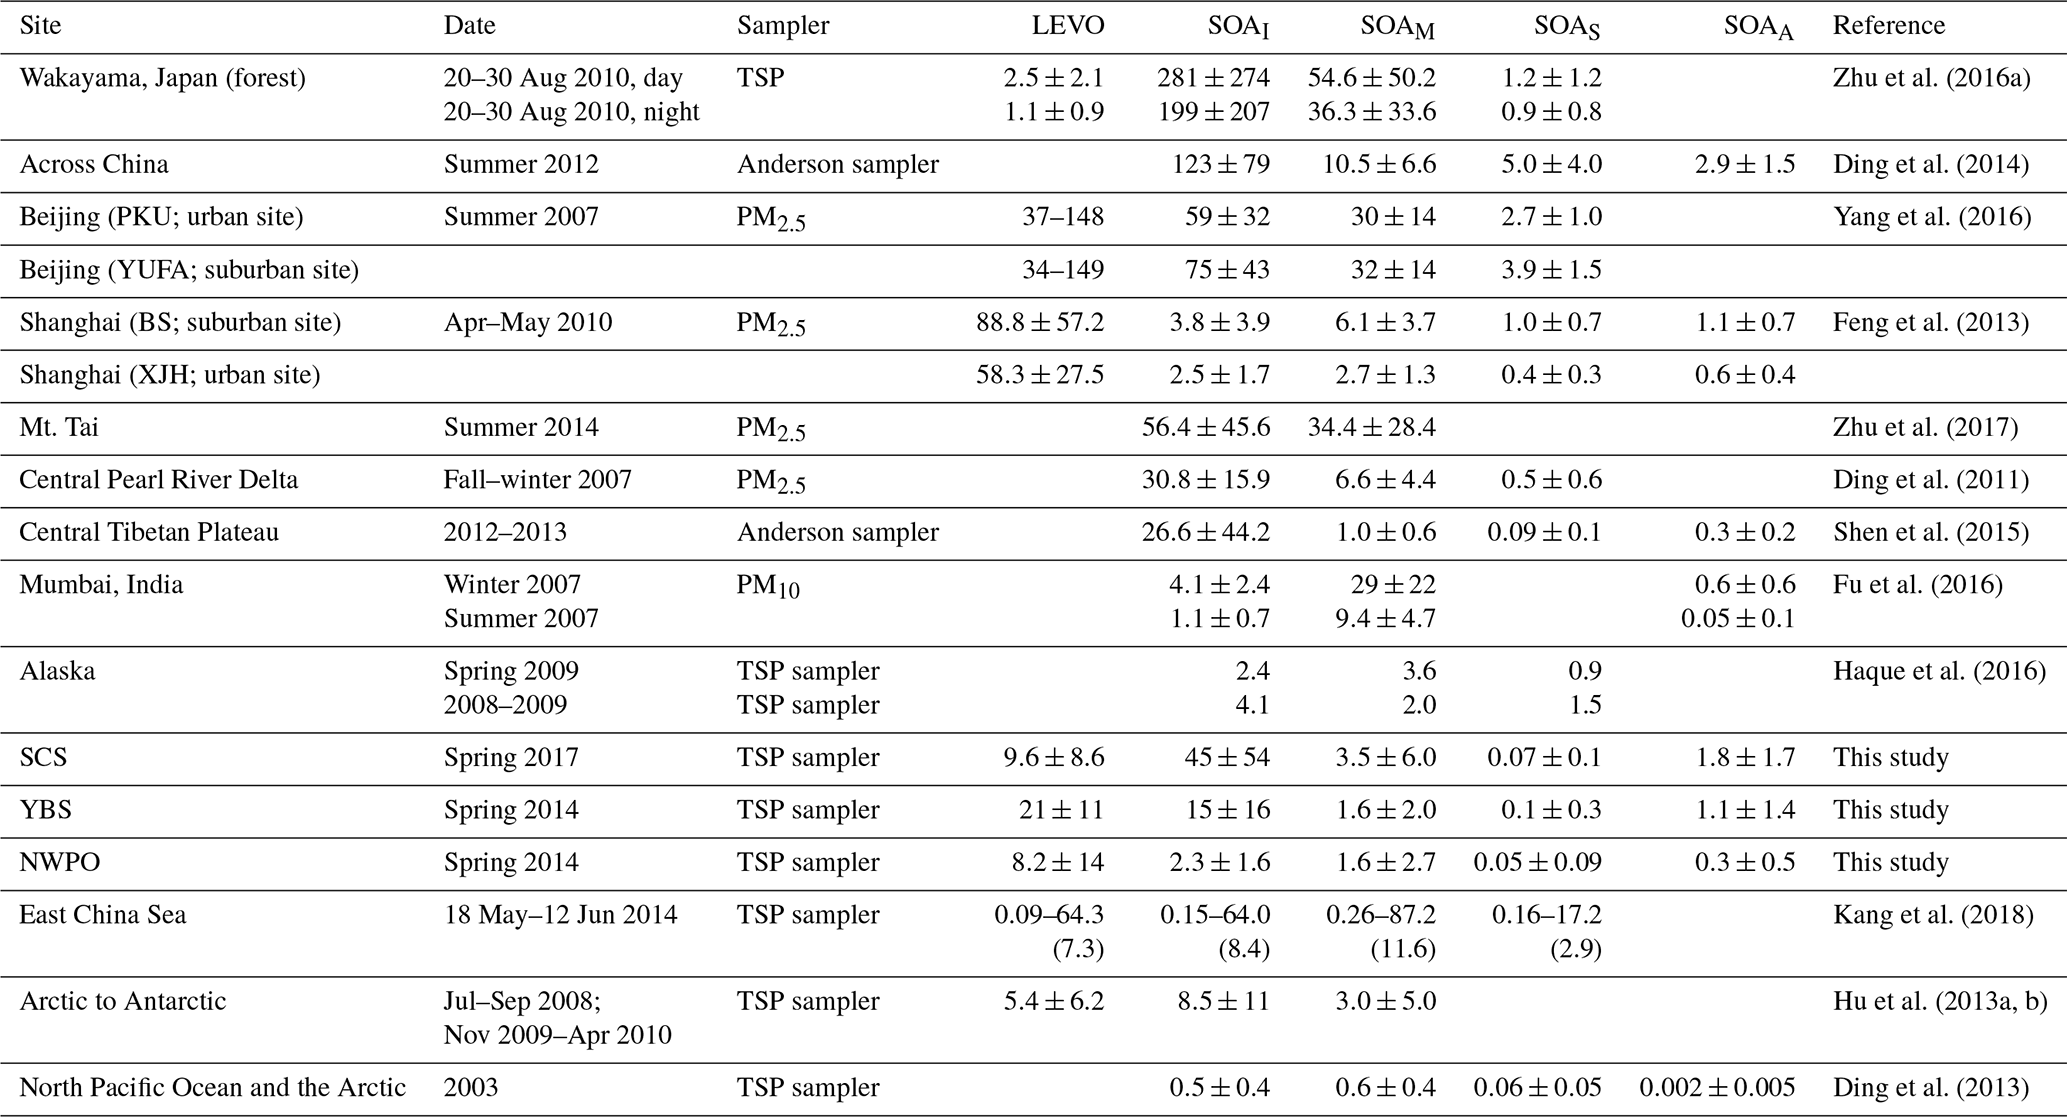
Narrow spatiotemporal variation in LEVO in TSP has been reported during summer sampling over the North Pacific Ocean and the Arctic in 2003, with maximum and mean values as low as 2.1 and 0.5 ng m−3, respectively (Ding et al., 2013). A lower mean LEVO value of 1.0 ng m−3 has also been reported in the spring over the island of Chichijima from 2001 to 2004 (Mochida et al., 2010), whereas the levels increased to 3.1±3.7 ng m−3 in TSP collected on the island of Okinawa from 2009 to 2012 (Zhu et al., 2015). Using these previous observations as a reference (Table 1), our observations suggest that the BB aerosols from the long-range transport over the NWPO in 2014 largely increased. Thus, an important question is raised: does the increase occur continuously and largely over the last decades in marine atmospheres over the NWPO? Due to the lack of BB sources in oceans, large spatiotemporal variation in the concentrations of LEVO in the marine atmosphere may be related to the long-range transport of atmospheric particles from continents. Thus, 72 h back trajectories of air masses at a height of 1000 m during our sampling periods (Figs. 1, 2) were calculated using the HYSPLIT model (https://ready.arl.noaa.gov/HYSPLIT.php, last access: 24 April 2020). Based on the calculated back trajectories, TSP samples could be classified into two categories: Category 1 – representing continent-derived aerosol samples, and Category 2 – representing ocean-derived aerosol samples. All 12 samples collected over the YBS fell into Category 1 (Fig. 2). Half (11 from 19) of the samples collected over the NWPO were classified into Category 1 (Fig. 1). A significant difference (p < 0.05) was obtained between the concentrations of LEVO in Category 1 (13±18 ng m−3) and Category 2 (2.0±1.8 ng m−3) over the NWPO. The values in Category 2 were closer to the springtime observations reported by Mochida et al. (2010) and Zhu et al. (2015) as well as the summer observations reported by Ding et al. (2013), reflecting that the marine background value is less affected by continental air masses. In contrast, the much higher values in Category 1 (than in Category 2) further indicate a large increase in the contribution of BB aerosols being transported from the continents to the remote marine atmosphere in 2014.
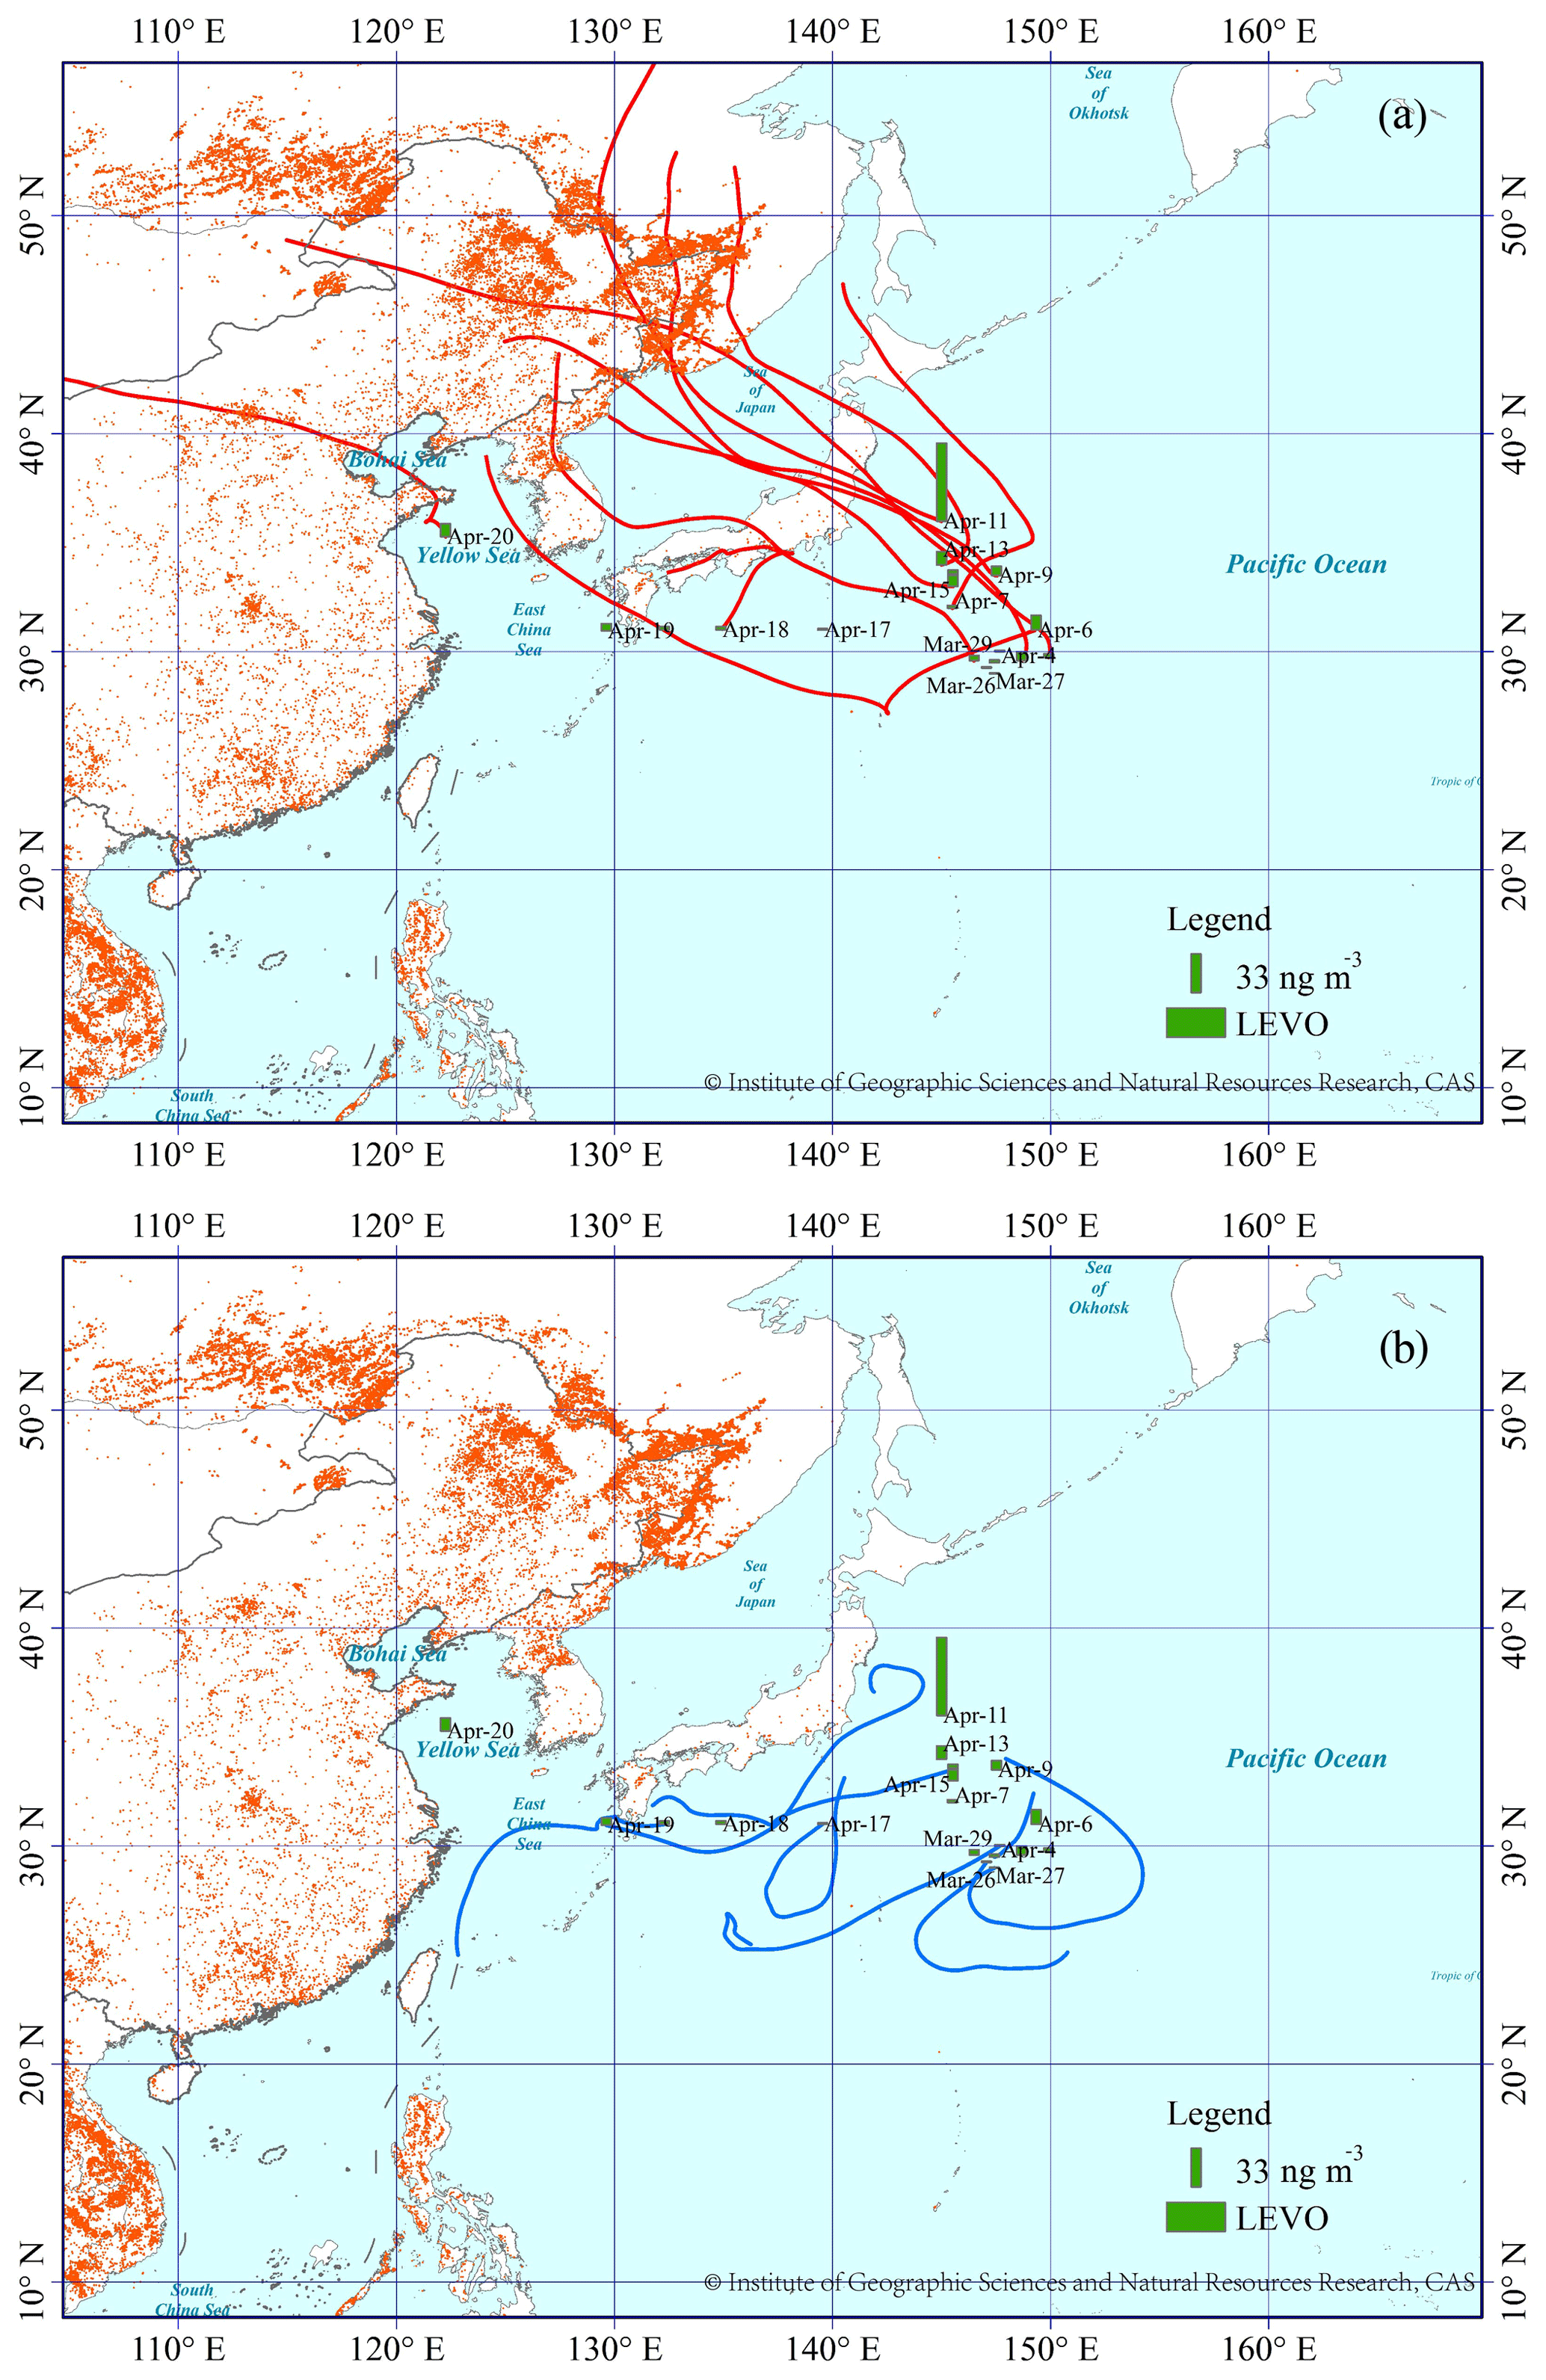
Figure 1The spatial distribution of LEVO in TSP over the NWPO in spring of 2014, and the 72 h back trajectory associated with each TSP sample. (a) The red lines represent that air masses can be derived from the continent (Category 1); (b) the blue lines represent that air masses may be derived mainly from the oceans (Category 2). The red dots represent the locations of fires from Fire Information for Resource Management System (FIRMS; https://firms.modaps.eosdis.nasa.gov/, last access: 24 April 2020). The base map was sourced from the Resource and Environment Data Cloud Platform (http://www.resdc.cn/DOI/doi.aspx?DOIid=56, last access: 24 April 2020), © Institute of Geographic Sciences and Natural Resources Research, Chinese Academy of Sciences (CAS). The data from the Resource and Environment Data Cloud Platform are open-access and free. (Please note that the above figure contains disputed territories.)
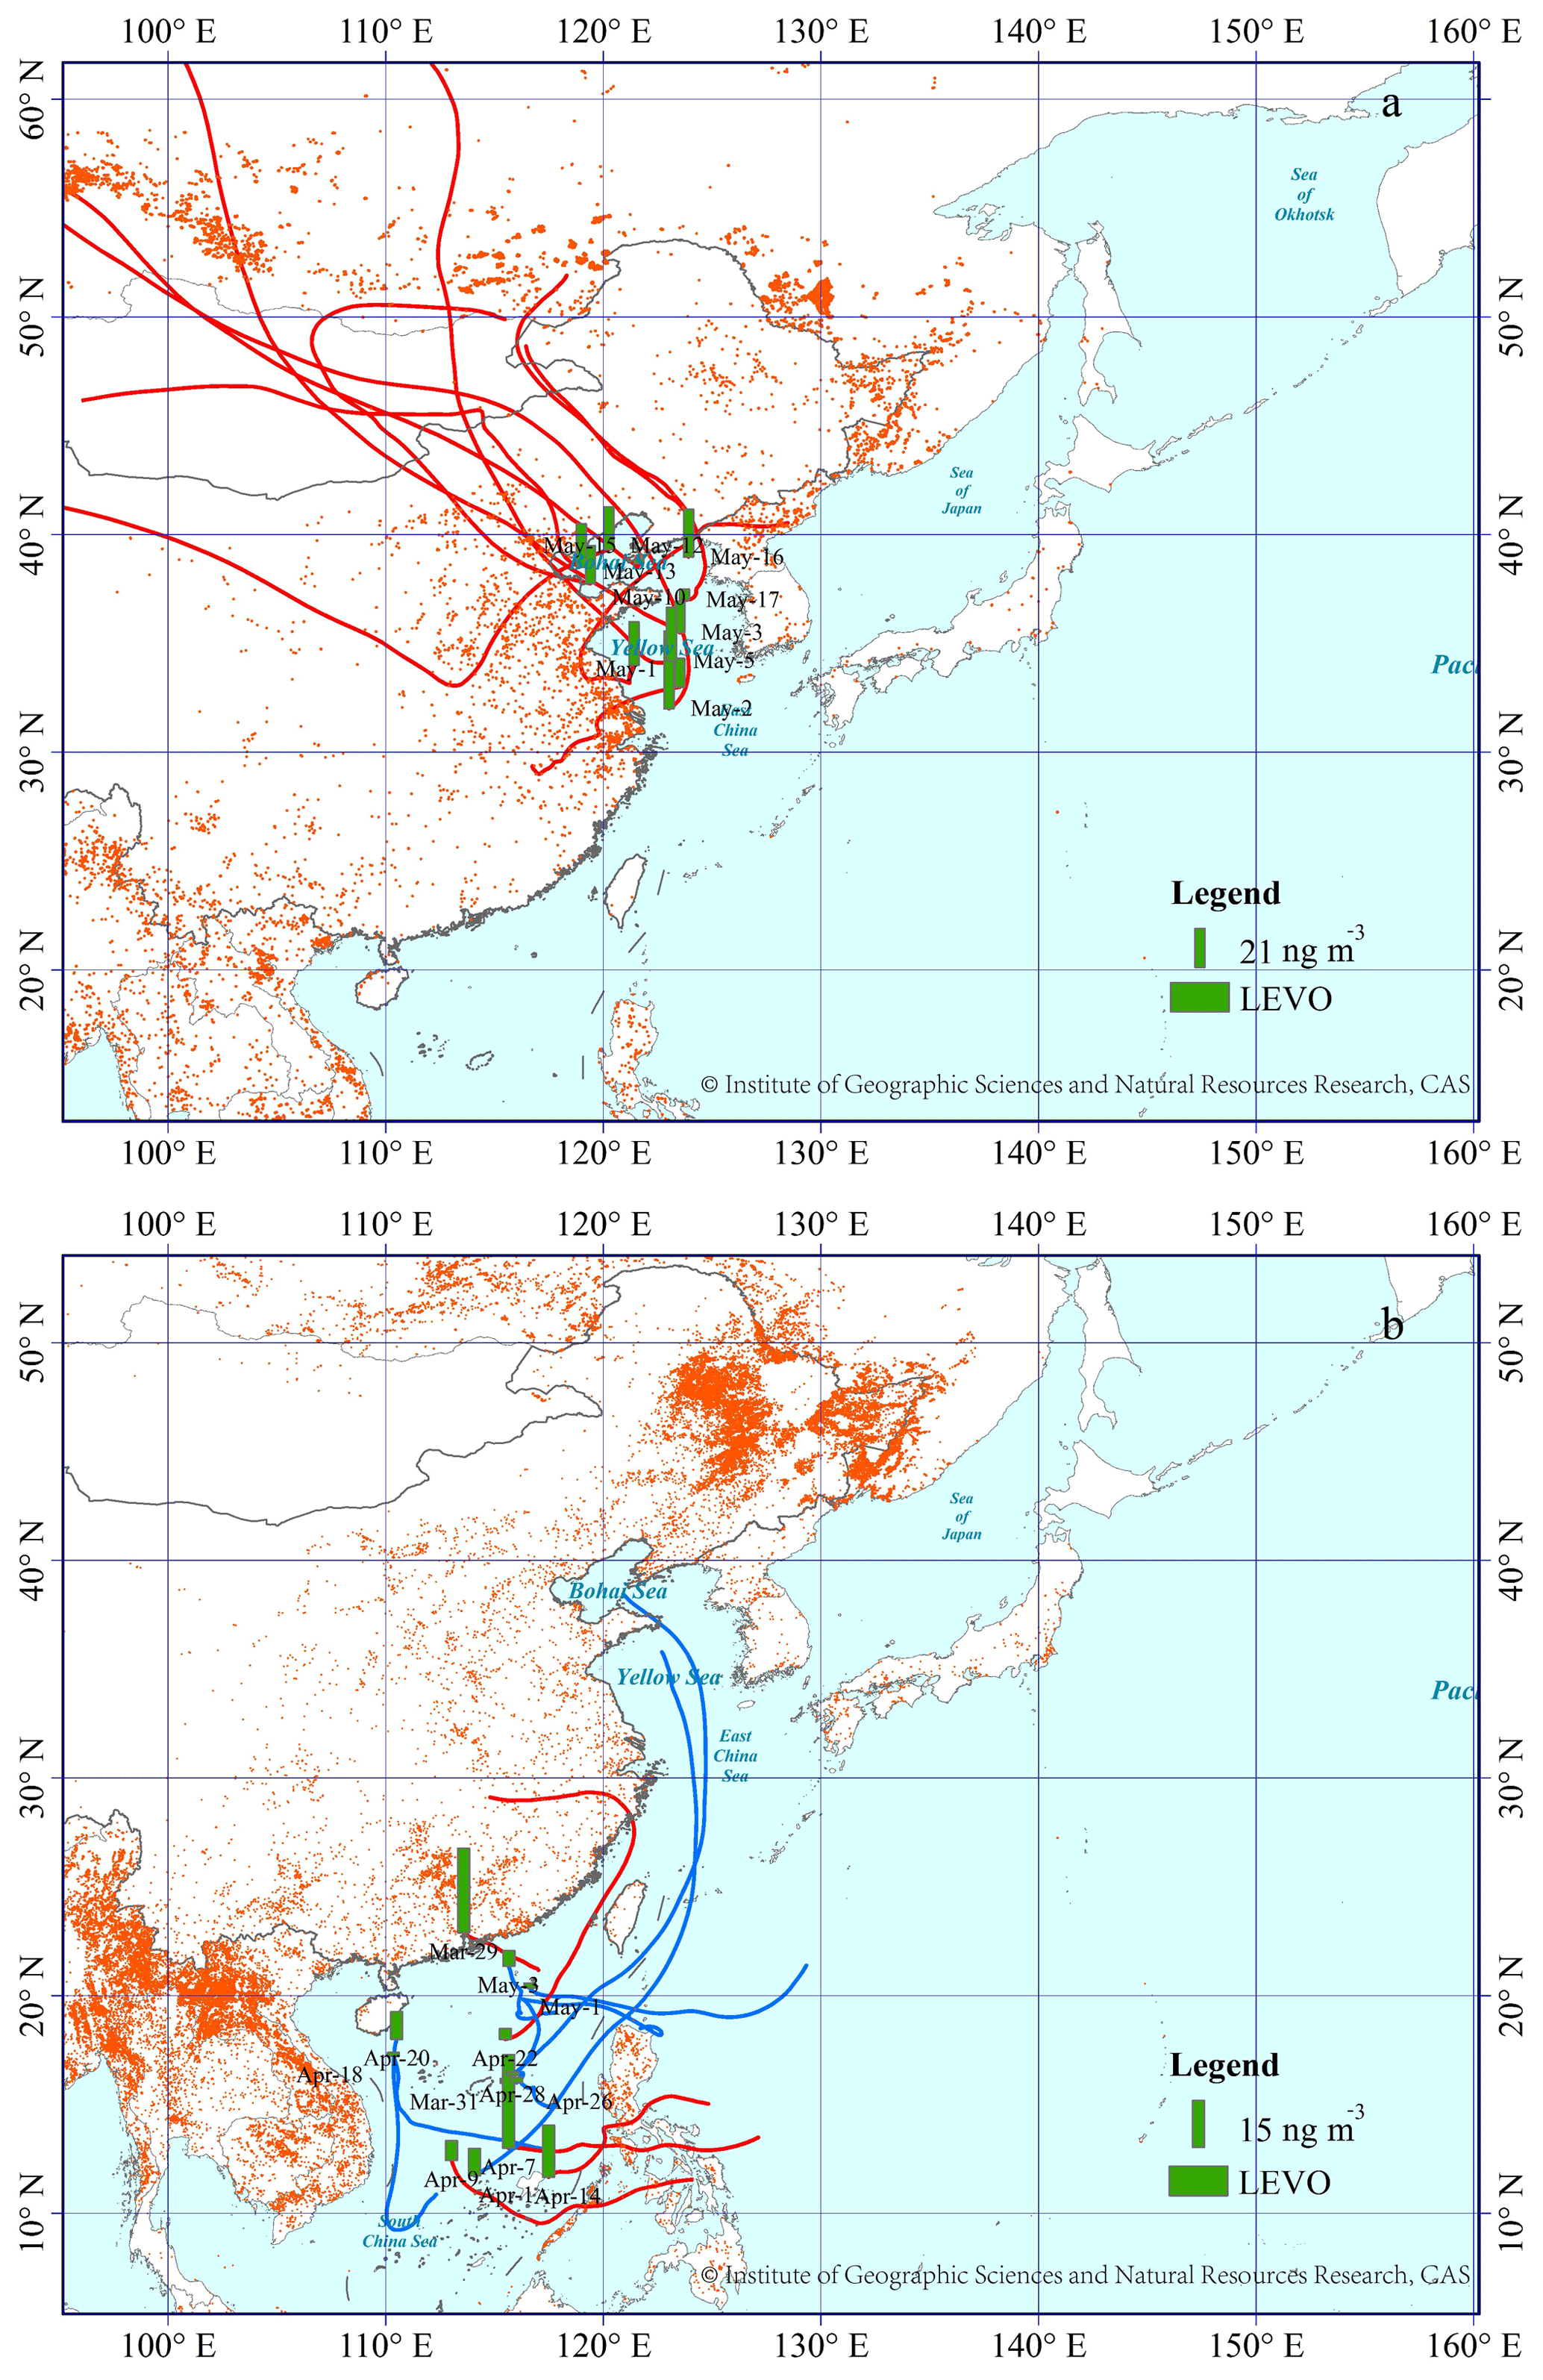
Figure 2(a) The spatial distribution of LEVO over the YBS (2014), and (b) SCS (2017); detailed information is given in Fig. 1. The base map was sourced from the Resource and Environment Data Cloud Platform (http://www.resdc.cn/DOI/doi.aspx?DOIid=56), © Institute of Geographic Sciences and Natural Resources Research, Chinese Academy of Sciences (CAS). (Please note that the above figure contains disputed territories.)
On 11 April 2014, an episode with a high LEVO concentration of 65 ng m−3 occurred over the NWPO (Fig. 1). Like LEVO, the concentrations of galactosan and mannosan in the sample were also the highest among all of the samples collected over the NWPO. This sample was collected in the oceanic zone, approximately 500 km from the continent of Japan. A combination of air mass back trajectories and NASA's FIRMS Fire Map indicated strong BB aerosol emissions from intense fire events in Siberia and subsequent long-range transport by the westerly wind as the major contributors to this anomaly (Fig. 1). A similar episodic concentration of LEVO of 27 ng m−3 in TSP had been observed once previously over the NWPO during a circumnavigation cruise (Fu et al., 2011). By combining satellite data with other observations, many studies in the literature have found that BB aerosols from major forest fires and smoke events in Siberia could be transported downwind to remote marine regions not only in spring but also in summer (Ding et al., 2013; Generoso et al., 2007; Huang et al., 2009). In a few cases, BB aerosols have been reported to have reached as far as the adjacent Arctic region (Generoso et al., 2007; Warneke et al., 2010). The study by van der Werf et al. (2006) estimated the emissions of BB aerosols from Eurasia to be much larger than those from North America. Thus, it is not surprising that the concentrations of LEVO over the NWPO were much higher than those over the eastern North Pacific and western North Atlantic at similar latitudes (Hu et al., 2013b).
In addition, both galactosan and mannosan showed strong linear correlations with LEVO (R2=0.98, p < 0.05) in TSP collected over the NWPO and YBS in this study. These strong correlations indicate that the three tracers were probably derived from the same BB sources. Previous studies have reported LEVO∕mannosan (L∕M) ratios of 3–10, 15–25 and 25–40 from softwood, hardwood and crop-residue burning, respectively (Kang et al., 2018; Zhu et al., 2015). The calculated L∕M ratios in TSP collected over the NWPO were 19±4 in this study, which implies dominant contributions from herbaceous plants and hardwood. The calculated L∕M ratios in TSP collected over the YBS were 14±11, indicating mixed sources.
In all, 5 of 13 samples collected over the SCS were classified as Category 1, with air masses identified as originating from either the continental areas of South China or the Philippines (Fig. 2). The concentration of LEVO fluctuated around 17±12 ng m−3 in Category 1 but decreased to 3.6±3.4 ng m−3 in Category 2. However, no significant difference was found between categories due to the large variation in the LEVO concentration among the limited number of samples in Category 1 (p > 0.05). Forest fires occur accidentally, leading to the large variation in LEVO in Category 1. Southern Asia has been reported to be one of the greatest emission sources of BB aerosols worldwide (van der Werf et al., 2006), which likely led to the higher mean value of LEVO in Category 1. However, the LEVO level observed over the SCS in Category 2 was closer to that reported from low-latitude regions (2.7±1.1 ng m−3, Table 1) collected during a global circumnavigation cruise (Hu et al., 2013b). Hu et al. (2013b) argued that their low observed concentrations may have been associated with intense wet deposition, degradation and intensive moist convection that occurred in the tropical region during their summer cruise. Unfortunately, no previous observations of LEVO in spring allow us to analyze the long-term variation in the contribution of BB aerosols in the region. However, this observation can be used for future comparison.
3.2 Spatiotemporal distributions of SOAI tracers
SOAI tracers were detected during all three cruises. The sum of SOAI tracers showed a decreasing trend of up to approximately 1 order of magnitude from the marginal seas to the open ocean: 45±54 ng m−3 in TSP over the SCS, 15±16 ng m−3 over the YBS and 2.3±1.6 ng m−3 over the NWPO (Fig. S1). The highest sum value of SOAI tracers over the SCS was 176 ng m−3, indicating strong photochemical formation of SOA from biogenic volatile organics (Fig. 3). The geographical distribution of SOAI tracers in this study was generally consistent with those reported by Hu et al. (2013a), with higher concentrations of these tracers in atmospheric particles collected from low-latitude oceanic zones (30∘ S–30∘ N) due to large emissions from tropical forests and strong photochemical reactions. Their reported average contents of SOAI tracers in low-latitude oceanic zones fluctuated around 9.2±6.7 ng m−3, which is much lower than those measured in this study.
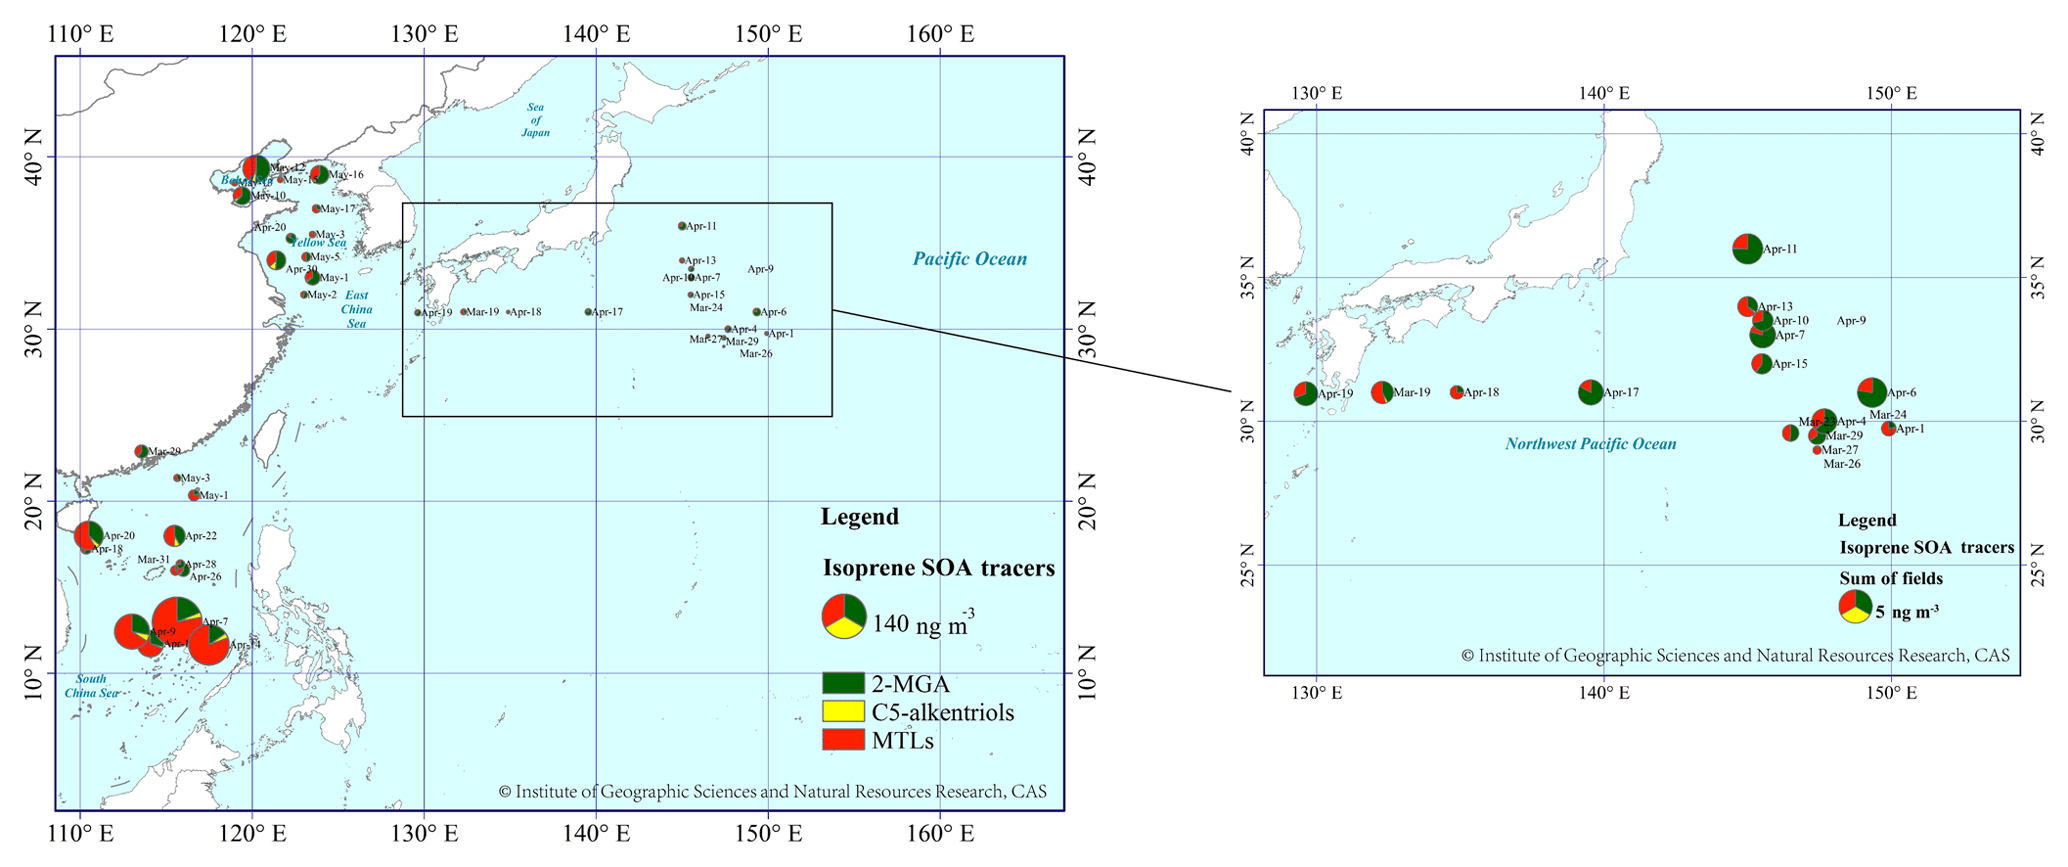
Figure 3The spatial distribution of SOAI tracer compounds over three marine regions: YBS and NWPO in 2014 and SCS in 2017. The area of the pie indicates the concentration of total SOAI tracers. The base map was sourced from the Resource and Environment Data Cloud Platform (http://www.resdc.cn/DOI/doi.aspx?DOIid=56), © Institute of Geographic Sciences and Natural Resources Research, Chinese Academy of Sciences (CAS). (Please note that the above figure contains disputed territories.)
When the sum of SOAI tracers in each sample was examined separately according to the air mass source, a significant difference was found over the SCS between Category 1 (85±66 ng m−3) and Category 2 (19±22 ng m−3), with a significance level of p<0.01. The average contribution of SOAI tracers to the TSP mass concentration over the SCS was higher in Category 1 (0.4 %±0.6 %) than in Category 2 (0.06 %±0.07 %). The tracer values were 2.7±1.8 ng m−3 in Category 1 and 1.7±1.0 ng m−3 in Category 2 over the NWPO, where no significant difference between the two categories was found (p > 0.05). The average contribution of SOAI tracers to TSP mass concentration over the NWPO was higher in Category 1 (0.008 %±0.005 %) than that in Category 2 (0.005 %±0.005 %). Assuming that the concentrations of the tracers in Category 2 were completely contributed by marine sources, it can be inferred that SOAI carried by continental air masses increased sharply over the SCS. However, this was not the case over the NWPO. Because all samples over the YBS fell into Category 1, this comparison could not be made for the YBS.
3.3 Spatiotemporal distributions of SOAM tracers
The sum of SOAM tracers including HGA, HDMGA and MBTCA was greatest over the SCS region (3.5±6.0 ng m−3), where the concentration was approximately double those over the respective YBS (1.6±2.0 ng m−3) and NWPO regions (1.6±2.7 ng m−3, Fig. S1), but no significant differences were identified between any two campaigns. The concentrations of SOAM tracers were almost 1 order of magnitude lower than those of SOAI tracers. Due to the unique contribution of terpene-derived SOA to the nucleation and growth of newly formed particles in the atmosphere (Ehn et al., 2014; Gordon et al., 2017; Zhu et al., 2019), SOAM may primarily cause indirect climate effects rather than direct effects of aerosols in the marine atmosphere. The difference in the mean SOAM concentration between the SCS and NWPO narrowed to a factor of 2, which was in contrast to the differences of approximately 1 order of magnitude in mean SOAI between the two types of atmospheres. The precursors of SOAM tracers derive mainly from coniferous forests (Duhl et al., 2008); thus, the decreasing proportion of coniferous forests in subtropical and tropical regions may partially explain the smaller spatial difference in SOAM tracers over the SCS compared with the YBS and NWPO. However, the comparable SOAM levels over the YBS and NWPO have not yet been explained.
Only three SOAM tracers were measured in this study, but other SOAM tracers have been measured and reported in marine atmospheres (Fu et al., 2011; Kang et al., 2018). In order to compare our results with the total amounts of SOAM tracers reported in the literature, the total amounts measured in this study were multiplied by a factor of 3.1 (described in Sect. S1 and Fig. S4 in the Supplement), according to the chamber results obtained by Kleindienst et al. (2007). The adjusted values over the SCS were closer to the mean of 11.6 ng m−3 observed over the East China Sea (ECS; Kang et al., 2018) and the lower values of 9.80–49.0 ng m−3 observed among 12 continental sites in China (Ding et al., 2016). The adjusted total amounts of SOAM over the NWPO and YBS were comparable to previous observations of 3.0±5.0 ng m−3 collected from the Arctic to Antarctic from 2008 to 2010 (Hu et al., 2013a), but they were much higher than the observations of 63±49 pg m−3 over the North Pacific and Arctic in 2003 (Ding et al., 2013). This may also imply a substantial increase in SOAM over the last few decades, although more investigations are needed to confirm this.
β-Caryophyllene is a major sesquiterpene emitted from plants such as Scots pine and European birch (Duhl et al., 2008; Tarvainen et al., 2005). β-Caryophyllinic acid is formed via the ozonolysis or photooxidation of β-caryophyllene. The highest levels of β-caryophyllinic acid were observed over the YBS (0.13±0.03 ng m−3), followed by the SCS (0.08±0.11 ng m−3) and NWPO (0.05±0.09 ng m−3) (Fig. S1). The spatial distribution of β-caryophyllinic acid clearly did not follow the general trend of biogenic SOA, with the highest values over the SCS followed by the YBS. Compared with values from the literature, our results are much higher than those over the North Pacific and Arctic oceans (2.4±5.4 pg m−3; Ding et al., 2013) but much lower than observations over the East China Sea reported by Kang et al. (2018), where β-caryophyllinic acid was reported to be in the range of 0.16–17.2 ng m−3 with a mean of 2.9 ng m−3. The large differences in the β-caryophyllinic acid content observed in various campaigns remain unexplained.
3.4 Spatiotemporal distributions of SOAA tracers
When the concentrations of DHOPA in TSP were examined, the highest concentrations occurred over the SCS (1.8±1.7 ng m−3), followed by the YBS (1.1±1.4 ng m−3), and the lowest values were recorded in the NWPO region (0.3±0.5 ng m−3) (Fig. S1). The decreasing extent of the DHOPA from the SCS to the NWPO was approximately 3 times lower than that of SOAI tracers but approximately 3 times higher than that of SOAM tracers. Ding et al. (2017) reported annual averages of DHOPA among various sites in China that ranged from 1.2 to 8.8 ng m−3. The concentrations of DHOPA observed over the SCS and the YBS were similar to the lower values observed in upwind continental atmospheres.
The formation of DHOPA depends on the molecular structures of aromatics as well as factors such as the concentrations of free radicals and oxidants (Henze et al., 2008; Li et al., 2016). The mean value of DHOPA in Category 1 (0.43±0.65 ng m−3) was nearly twice that in Category 2 (0.20±0.31 ng m−3) over the NWPO (p > 0.05). When two samples with high DHOPA (1.2 and 2.1 ng m−3, respectively) were excluded from Category 1, the recalculated average DHOPA decreased to 0.17±0.21 ng m−3. The continent-derived DHOPA seemingly yielded a minor contribution to the observed values over the NWPO, except during strong long-range transport episodes. Similarly, the mean values of DHOPA were the same in Category 1 (1.8±2.1 ng m−3) and Category 2 (1.8±1.5 ng m−3) samples collected over the SCS, and no significant difference was observed between the two categories. Much stronger UV radiation occurs over the SCS than over the YBS, which may contribute to the elevated DHOPA level over the SCS. Aside from continent-derived precursors, oil exploration and heavy marine traffic over the SCS are also potential contributors to the higher DHOPA levels in this region, and this link requires further investigation. Previous field observations in China have demonstrated that biofuel or biomass combustion emissions act as important sources of aromatics in the atmosphere (Zhang et al., 2016), as evidenced by the association between the nationwide increase in DHOPA during the cold period and the enhancement of BB emissions (Ding et al., 2017). In this study, no linear correlation was obtained between DHOPA and LEVO in samples collected over the SCS and the other two campaigns, leaving emissions other than BB emissions, e.g., solvent use, oil exploration and marine traffic, as the major precursors for DHOPA in these marine atmospheres (Li et al., 2014).
3.5 Causes of high photochemical yields of SOAI over the SCS
Because higher concentrations of SOAI were observed in TSP samples collected over the SCS, the composition of SOAI tracers was investigated further in terms of their formation pathways and sources. Based on the results of chamber experiments, Surratt et al. (2010) proposed different formation mechanisms for 2-MGA and MTLs. 2-MGA is a C4-dihydroxycarboxylic acid that forms via a high-NOx pathway. MTLs and C5-alkene triols are mainly products of the photooxidation of epoxydiols of isoprene under low-NOx conditions.
MTLs acted as the dominant compounds among SOAI tracers in most TSP samples collected over the SCS, with concentrations of 31±42 ng m−3 (Fig. 3). The 2-MGA ∕ MTLs ratio ranged from 0.2 to 3.1, with a median value of 0.6. The ratio exceeded unity in only 4 of 13 samples. This result allowed us to infer that the observed SOAI tracers were mainly generated under low-NOx conditions. Although the concentration of 2-methylerythritol was nearly double that of 2-methylthreitol, they were highly correlated (R2=0.99, p < 0.05) because of their shared formation pathway. Satellite data showed that the NO2 levels in South China and the Philippines were low, except in a few hot spots (Fig. S2). Such low-NOx conditions favor the formation of MTLs rather than 2-MGA over the tropical SCS. The isoprene emitted from plants growing on oceanic islands may also undergo chemical conversion to SOA under low-NOx conditions, and low-NOx conditions are always expected in remote marine atmospheres (Davis et al., 2001).
In general, zonally and monthly averaged OH concentrations around 15∘ N were ∼50 % greater than those around 35∘ N (Bahm and Khalil, 2004). Thus, enhanced formation of MTLs is theoretically expected under the strong UV radiation of tropical regions. However, no significant correlation between the concentrations of MTLs and UV radiation was obtained over the SCS (data not shown), which was possibly due to the influences of various air masses. A field study showed that MTLs yields were positively correlated with ambient temperature in continental atmospheres (Ding et al., 2011). The 2-MGA yields, in contrast, showed no significant correlation with ambient temperature in this study. Moreover, lower relative humidity may enhance the formation of 2-MGA in the particulate phase but not the formation of MTLs (Zhang et al., 2011). Variation in ambient temperature and relative humidity may complicate the relationship between the concentrations of SOAI tracers and UV radiation over the SCS.
In addition, the MTLs concentration in Category 1 (62±55 ng m−3) was larger than that in Category 2 (11±14 ng m−3). The more abundant MTLs associated with Category 1 were most likely related to long-range transport of these chemicals from upwind continental areas, the oxidation of continental precursors in the marine atmosphere or both. Large emissions of isoprene were expected from tropical forests upwind of the SCS due to the high vegetation coverage and high ambient temperature of such areas (Ding et al., 2011; Rinne et al., 2002). Global estimates show tropical trees to be responsible for ∼80 % of terpenoid emissions and ∼50 % of other VOC emissions (Guenther et al., 2012).
In a clean marine atmosphere, phytoplankton is the sole source of isoprene emissions over the oceans (Bonsang et al., 1992; Broadgate et al., 1997). Chlorophyll-a has been widely employed as a measure of phytoplankton abundance and a proxy for predicting isoprene concentrations in water (Hackenberg et al., 2017). The satellite-derived chlorophyll-a level during the study period over the SCS was below 0.45 mg m−3, excluding coastal areas (Fig. S3). The MTLs observation value of 11±14 ng m−3 in Category 2 should be considered as the upper limit derived from marine phytoplankton in the SCS. Although air masses differed between categories 1 and 2, a good correlation was obtained between MTLs and 2-MGA when the data in the two categories were pooled for analyses (R2=0.77, p < 0.01). This strong correlation indicates that these tracers are primarily formed through shared pathways. However, this correlation was poor over the NWPO, as discussed below.
3.6 Origin and formation of SOAI over the NWPO
Over the NWPO, the concentration of 2-MGA was 1.6±1.5 ng m−3 which was generally dominant among SOAI tracers, followed by MTLs (0.7±0.3 ng m−3) and C5-alkene triols (0.03±0.02 ng m−3). When the 2-MGA ∕ MTLs ratio was further examined, it varied greatly from < 0.1 to 6.3, with a median value of 2.1. Most ratios observed over the NWPO in this study were far greater than the values of between 0.18 and 0.59 reported by Hu et al. (2013a) from a global circumnavigation cruise, greater than the values between 0.87 and 1.8 reported in urban areas of California (Lewandowski et al., 2013) and greater than the maximum value of 2.0 obtained over the YBS. Ding et al. (2013) also reported ratios that fluctuated greatly from 0.5 to 10 with a median value of 3.3 during a summer cruise in the NWPO and Arctic Ocean in 2003. The large 2-MGA ∕ MTLs ratios over the NWPO appeared to be highly consistent over two independent sampling campaigns.
The compound profile of SOAI tracers over the NWPO implied high-NOx conditions that allowed the oxidation of isoprene to generate the SOAI present in most samples. Such high-NOx conditions are impossible in a remote marine atmosphere, as indicted in Fig. S2. Given that the life span of isoprene in the atmosphere is only several hours (Bonsang et al., 1992), the long-range transport of oxidation products formed under high-NOx levels over the continents likely led to the 2-MGA-dominated composition of SOAI. Based on air mass back trajectories, this long-range transport may involve 2-MGA originating from Siberia, northeastern China or Japan.
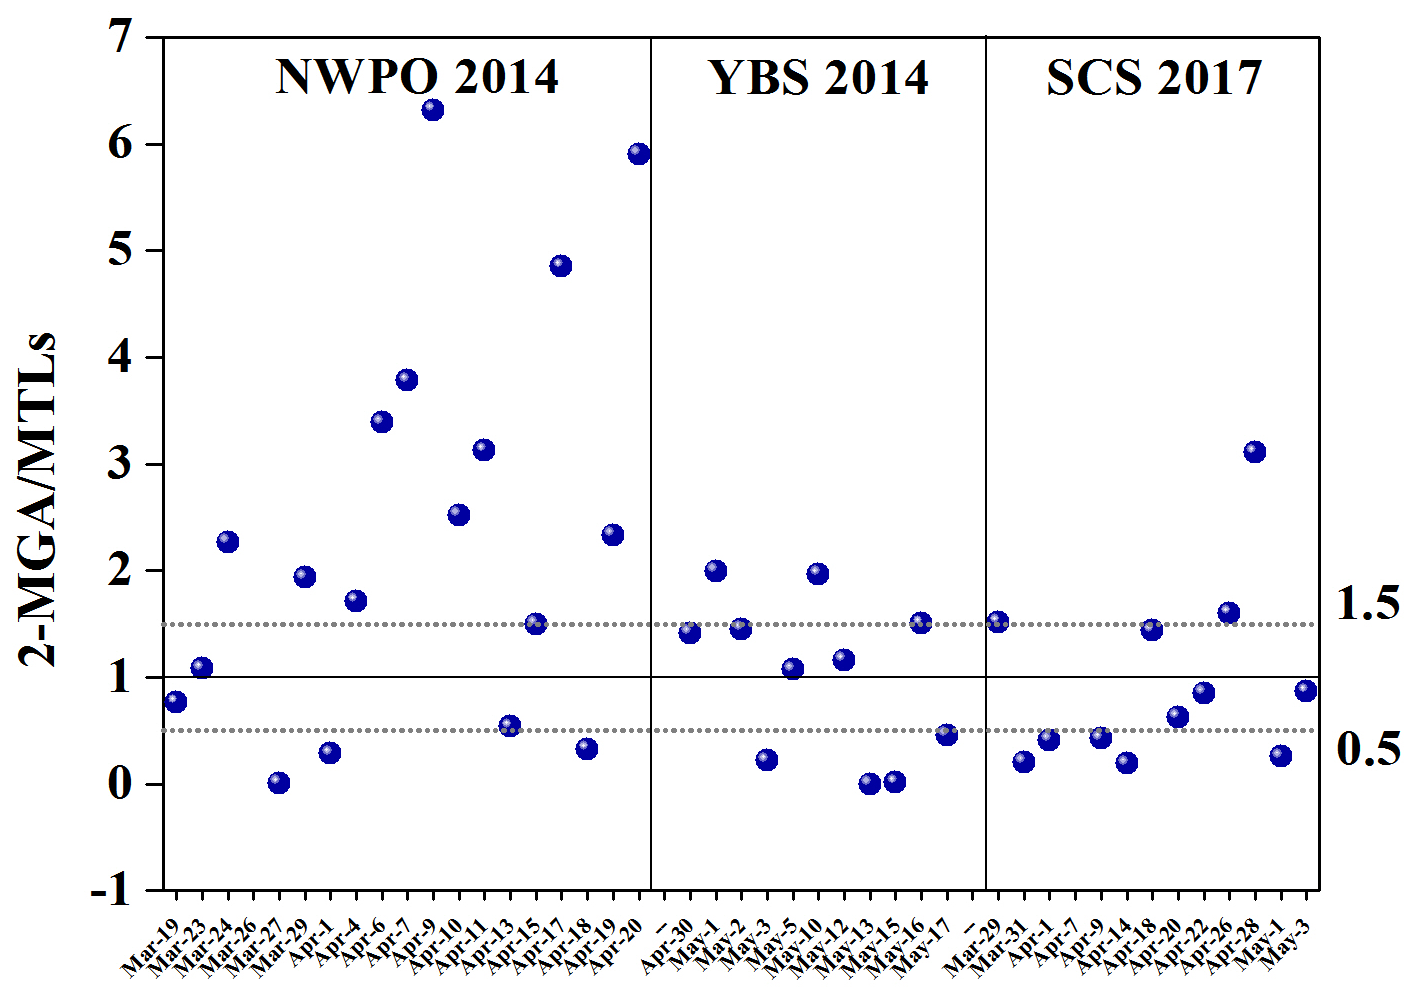
Organic aerosols over the NWPO were strongly influenced by forest fires that take place in Siberia during spring and summer almost every year (Ding et al., 2013; Huang et al., 2009). Previous emissions inventory studies have reported high isoprene and NOx emissions from various BB types (Akagi et al., 2011; Andreae and Merlet, 2001). Thus, Ding et al. (2013) argued that an increase in the emission of isoprene in the presence of BB, followed by its chemical conversion under high-NOx conditions, may lead to transport over thousands of kilometers and hold at the detectable concentrations in the remote marine atmosphere over the NWPO. The same argument may hold true for the elevated 2-MGA ∕ MTLs ratios observed over the NWPO in this study (Fig. 4). However, we did not find a significant correlation between 2-MGA and LEVO over the NWPO. The decomposition of LEVO reported in the literature (Fraser and Lakshmanan, 2000; Hennigan et al., 2010; Hoffmann et al., 2010) may lower the correlation between them. However, whether 2-MGA can decompose in ambient air remains poorly understood.
In contrast, the 2-MGA ∕ MTLs ratios in 3 of 19 samples collected over the NWPO were below 0.5 (Fig. 4). In these cases, the oxidation of isoprene under low-NOx conditions likely dominated the generation of SOAI. The 2-MGA ∕ MTLs ratios were between 0.5 and 1.5 in 4 of 19 samples, suggesting mixed contributions to SOAI from the oxidation of isoprene under low-NOx conditions and high-NOx conditions. As the major formation pathways of 2-MGA and MTLs varied greatly among samples, no significant correlation (R2=0.12, p > 0.05) was obtained between 2-MGA and MTLs over the NWPO. Recall that the tracer values of SOAI were 2.7±1.8 ng m−3 in Category 1 and 1.7±1.0 ng m−3 in Category 2. This implied that SOAI derived from marine sources was comparable to that derived from the continent outflows.
3.7 Source apportionment of secondary organic carbon
The tracer-based approach developed by Kleindienst et al. (2007) was applied to estimate the concentrations of secondary organic carbon (SOC) and biomass-burning-induced water-soluble organic carbon (WSOCBB) as follows:
where Σi(tri) is the sum of concentrations of the selected suite of tracers for a precursor, and fSOC is the mass fraction of tracer compounds in SOC generated from the precursor in chamber experiments. Assuming that the fSOC values in ambient air match those in the chamber, the fSOC values for precursors such as isoprene, monoterpenes, β-caryophyllene and aromatics were 0.155±0.039, 0.231±0.111, 0.023±0.0046 and 0.00797±0.0026 µg µgC−1, respectively (Kleindienst et al., 2007), with the uncertainty described in Sect. S2. The fraction of LEVO in WSOC (0.0994 µg µgC−1) from the BB plume was used for WSOCBB (Ding et al., 2008). The fSOC value for monoterpenes was scaled up by a factor of 3.1 based on experimental observations, as these two tracers (HGA + HDMGA) accounted for two-ninths of the total tracers of monoterpenes, as described in the Supplement (Kleindienst et al., 2007).
Over the SCS, nearly half of the sum of SOC and WSOCBB was in the form of SOCI (47 %), followed by SOCA (36 %), WSOCBB (14 %) and a minor contribution of 2.5 % from SOCM (Fig. 5). This composition pattern over the SCS could be attributed to abundant biogenic SOA formation in low-latitude tropical marine atmospheres. Over tropical marine regions, atmospheric oxidation products can account for 47 %–59 % of the estimated total organic content, with biomass burning emissions making up only 2 %–7 % based on source apportionment using organic tracers (Fu et al., 2011). A model study by Fu et al. (2012) showed that secondary formation accounts for as much as 62 % of OC estimated using tracers in eastern China in summer. The inverse of the pattern over the SCS was observed over the YBS, with WSOCBB as the dominant contributor (45 %) to the sum of SOC and WSOCBB, followed by SOCA (32 %) and SOCI (20 %). The contribution of SOCM was also minor (1.5 %). Notably, the chemical composition observed over the NWPO was similar to that over the YBS, with WSOCBB contributing up to 53 %. In addition, Kang et al. (2018) used the Positive Matrix Factorization Model (PMF) method to identify various sources of OC in marine aerosols over the ECS, such as secondary nitrate, BSOA, BB and fungal spores.
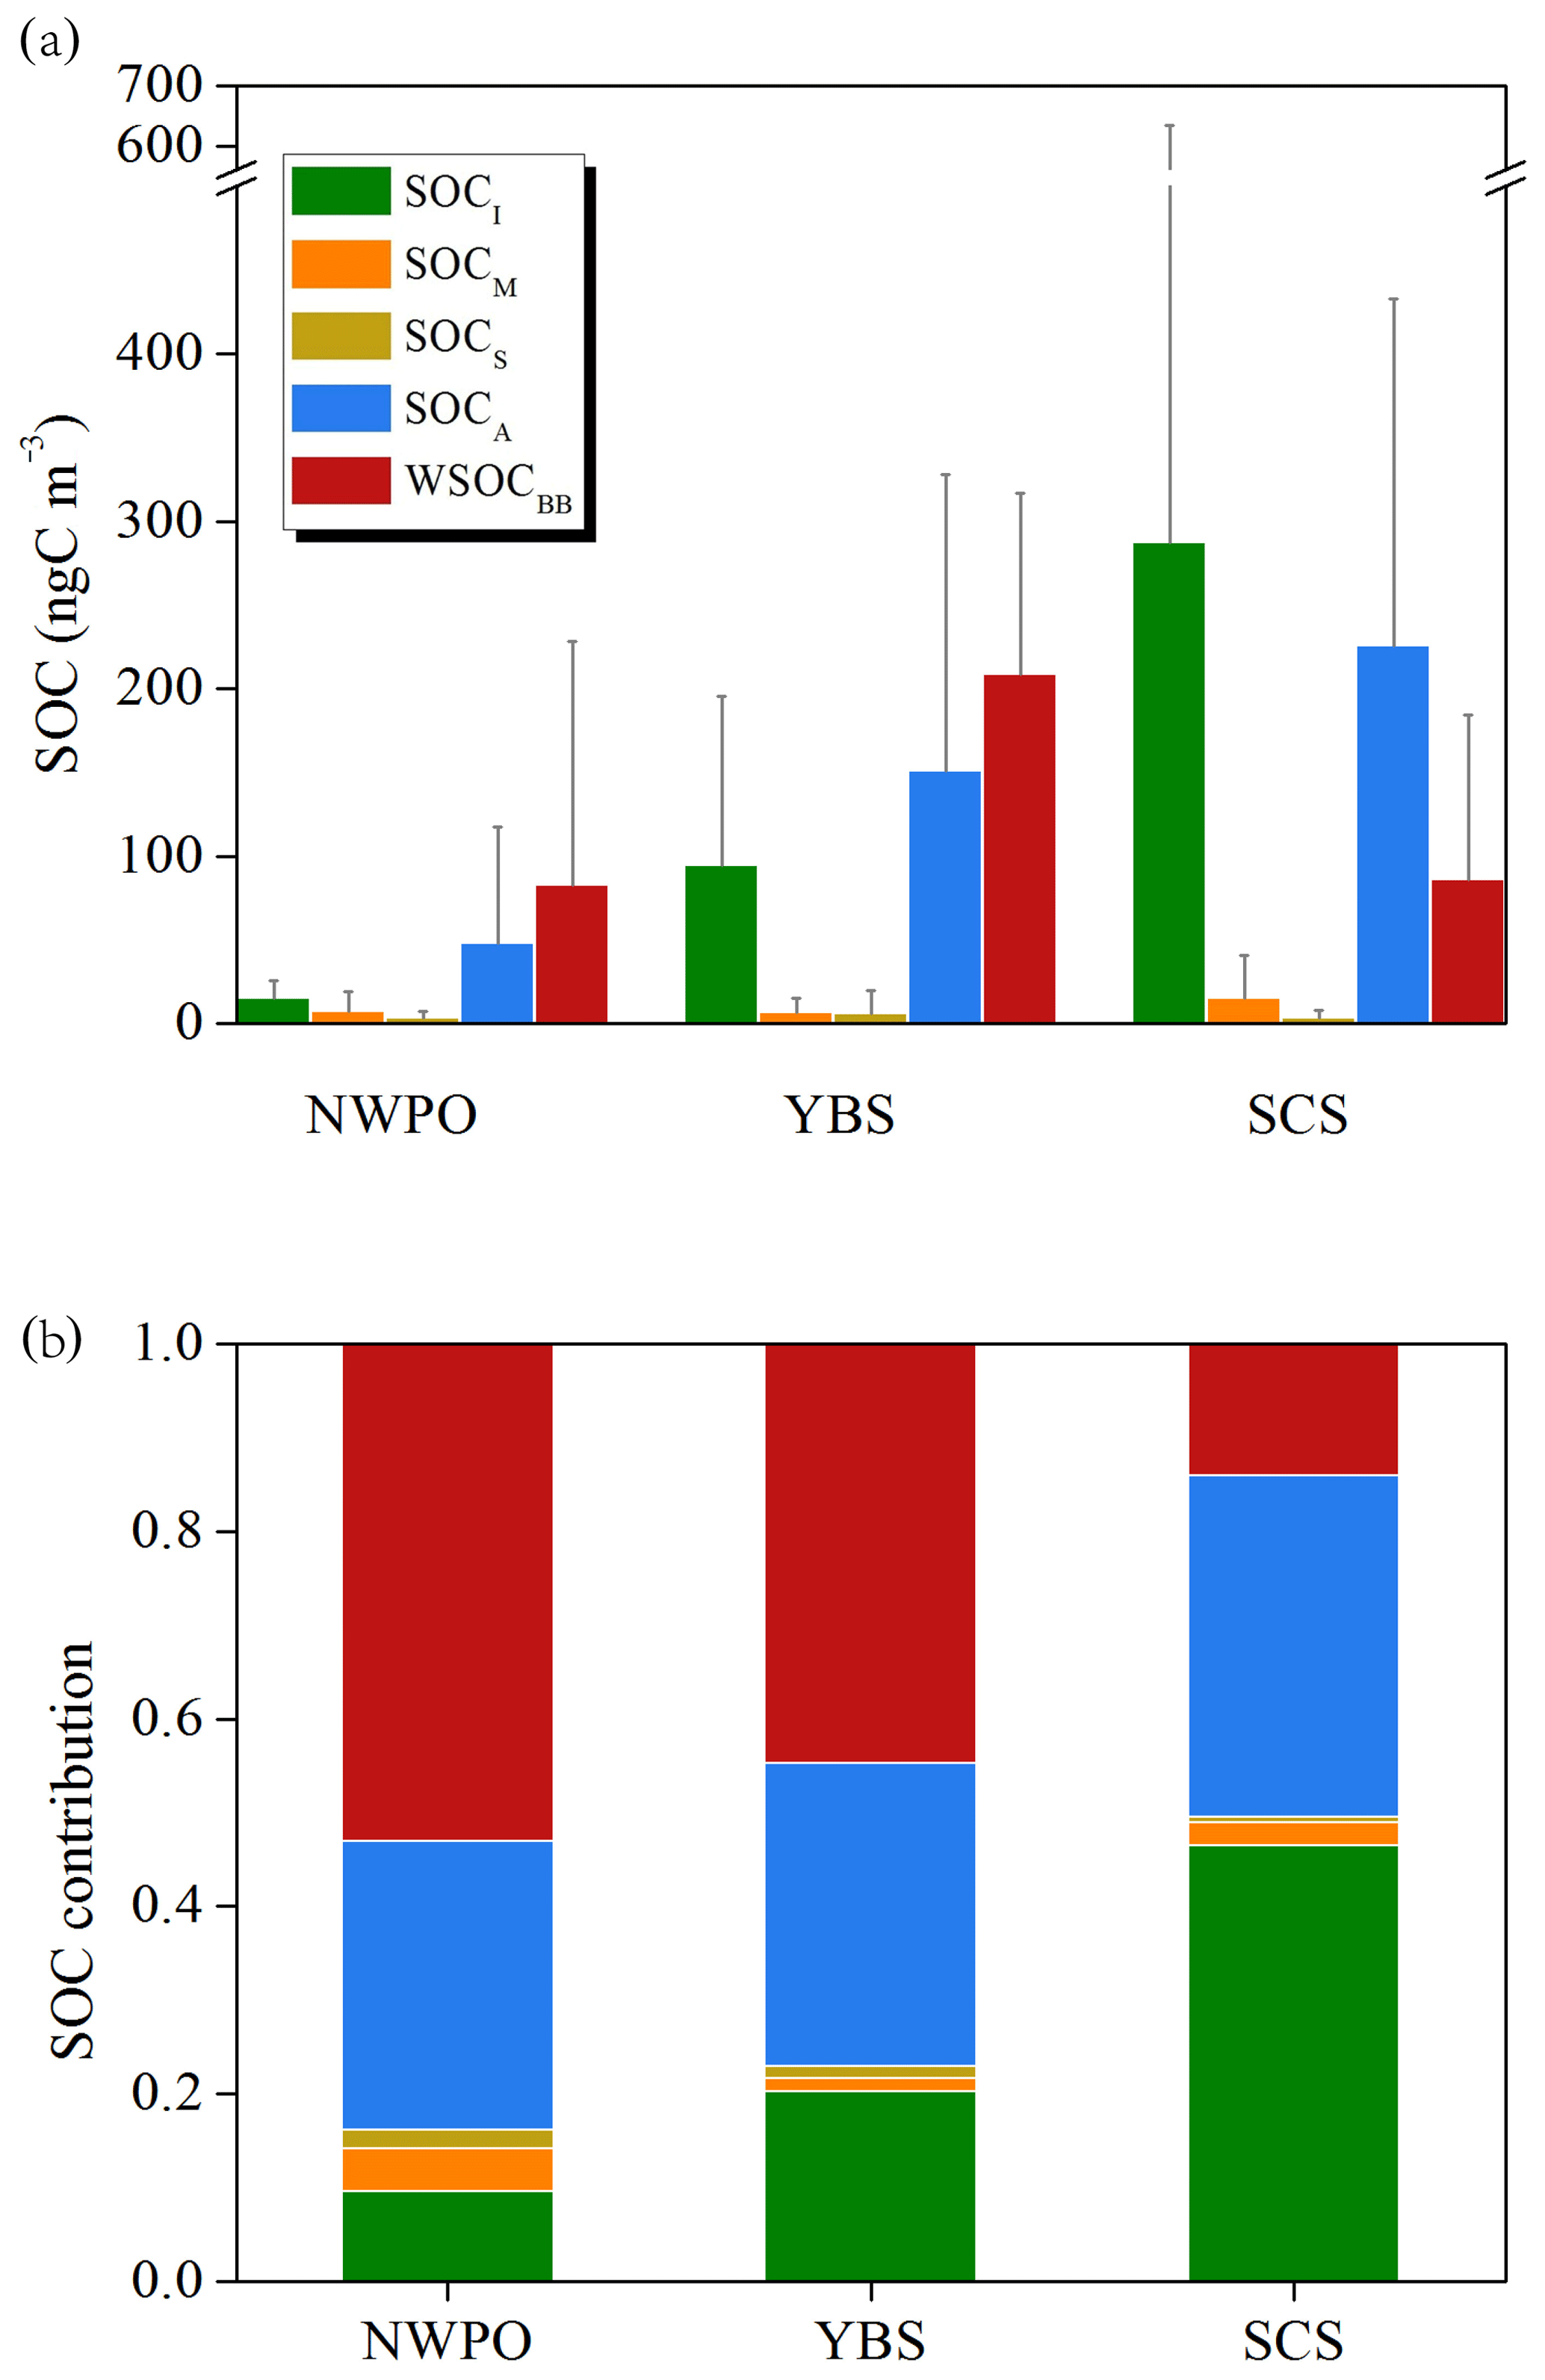
Figure 5Average SOC levels calculated using the tracer-SOC/WSOCBB method over three marine regions (YBS and NWPO in 2014 and SCS in 2017) and their contributions based on five organic tracers measured in this study.
Geographically, the estimated SOC values from BVOCs ranked at the highest level of 306±343 ngC m−3 over the SCS, decreasing to 107±99 ngC m−3 over the YBS and 24±22 ngC m−3 over the NWPO. The estimates of aromatic SOC exhibited the same geographic trend, with values of 225±208 ngC m−3 over the SCS, 151±177 ngC m−3 over the YBS and 48±69 ngC m−3 over the NWPO. Recent modeling results have also shown that aromatic emissions are the predominant precursors of SOA during springtime in China in comparison with BVOCs and other AVOCs (Han et al., 2016). Among estimates of WSOCBB, the highest values of 209±108 ngC m−3 were recorded over the YBS, followed by comparable levels of 86±98 ngC m−3 (SCS) and 83±145 ngC m−3 (NWPO).
In our study, the calculated WSOCBB estimate accounted for 4.1±5.0 % and 3.3±1.7 % of measured OC over the NWPO and YBS, respectively, and these values were higher than that obtained over the ECS during summer (1.4 %; Kang et al., 2018). Estimated SOC from BVOCs only accounted for 1.5±1.4 % and 1.8±1.7 % of the measured OC over the NWPO and YBS, respectively, which is lower than that over the ECS (4.21 %; Kang et al., 2018). However, the mean values obtained in this study were similar to the total SOC level estimated using tracers as a proportion of measured WSOC (4 %) during a cruise on the North Pacific and Arctic oceans, assuming that WSOC accounted for half of the total OC in atmospheric particles (Ding et al., 2013).
The calculated SOC level derived from organic tracers accounted for less than 8 % of the total measured OC in these study areas. However, these SOC compounds are expected to derive mainly from photochemical reactions in the gas phase, followed by gas–aerosol partitioning. These compounds likely play an important role in the growth of newly formed particles alongside preexisting nucleation-mode or Aitken-mode particles. However, most organic matter detected in bulk samples may originate from primary sources, heterogeneous reactions and in-cloud processing (Ervens et al., 2011; Kanakidou et al., 2005; Nichols, 2016), and these compounds may be major drivers of the direct climate effects of aerosols rather than indirect climate effects. In the future, a comprehensive combination measurement of organic tracers and organic matter using an aerosol mass spectrometer should be utilized to elucidate the formation and growth processes of atmospheric nanoparticles.
This study investigated the geographical distributions of tracer-based organic matter observations in TSP collected over two marginal seas of China and the NWPO in the spring season, when the East Asian monsoon carries biogenic and anthropogenic aerosols over these oceanic zones. We found a significantly large difference in LEVO over the NWPO between two categories of air masses originating from upwind continents or oceanic regions: Category 1 (continental) contained 13±18 ng m−3, and Category 2 (oceanic) contained 2.0±1.8 ng m−3; the concentrations of LEVO in Category 2 were closer to the low values reported in the literature. This further implied a large increase in continent-derived BB aerosols in marine atmospheres over the NWPO in recent decades compared with previous studies. An important question is thereby raised: has a large increase in continent-derived BB aerosols in marine atmospheres over the NWPO occurred continuously and largely over recent decades? Combining the L∕M ratios of 19±4 over the NWPO with the calculated air mass back trajectories indicates that the increase was very likely associated with enhanced emissions of BB aerosols from wildfires in Siberia and northeastern China. Moreover, the mean level of BB aerosols over the SCS almost matched that over the NWPO. The contents of LEVO in Category 2 air masses, derived from oceanic zones over the SCS, were comparable with those reported in the literature, but the mean value was only about a quarter of that in Category 1 (representing air masses from upwind continents). However, the limited data available over the SCS in the literature cannot support inferences about whether BB aerosols emitted from upwind tropical forests have increased in recent decades.
The concentrations of SOAI over the SCS were approximately 1 order of magnitude greater than those observed over the NWPO and several times larger than those over the YBS. The larger values observed over the SCS in Category 1 (compared with Category 2) were likely driven by high emissions of isoprene from upwind tropical forests and strong solar radiation. The MTLs dominance of SOAI over the SCS strongly suggested that SOC from BVOCs was primarily generated under low-NOx conditions. Conversely, the 2-MGA dominance over the YBS implied that most SOC was generated under high-NOx conditions. Elevated 2-MGA ∕ MTLs ratios of more than 1.5 were obtained for 11 of 19 total samples collected over the NWPO, which is consistent with those reported in the literature. Larger ratios may be attributed to possible emissions of BVOCs in the presence of BB. However, the comparable concentrations of SOAI in Category 1 and Category 2 samples collected over the NWPO implied a large contribution of SOAI from marine sources. The aromatic SOA tracers' levels were highest over the SCS, followed by values obtained over the YBS and NWPO. The high values observed over the SCS may be related to strong solar radiation, but the sources of precursors remain unexplained. Based on the concentrations in Category 1 and 2 air samples collected over the SCS and NWPO, mixed sources of aromatic VOCs should exist, including continent-derived precursors, oil exploration and heavy marine traffic.
Over the NWPO and the YBS, the estimated WSOCBB levels were nearly equal to the sum of SOC estimated from the oxidation of aromatics and BVOCs. Over the SCS, the SOC estimated from the oxidation of BVOCs was significantly higher than the estimated WSOCBB. The geographical difference may be related to emissions of primary particulate organics and gaseous precursors as well as formation processing of secondary organics in various atmospheres.
However, the atmospheric composition of SOA in different geographical locations is highly complex and is regulated by many factors, including local meteorological conditions, anthropogenic emissions, plant species, vegetation cover and regional chemistry, and therefore warrants further quantification and analyses – particularly, whether BB aerosols and other biogenic organic aerosols in marine atmospheres will continuously increase under warming conditions.
Most of the data are shown in the Supplement. The remaining data are available upon request from the corresponding author (xhyao@ouc.edu.cn).
The supplement related to this article is available online at: https://doi.org/10.5194/acp-20-5055-2020-supplement.
XY, TG and JF conceived and led the studies. TG, JW and JF carried out the experiments and analyzed the data. TG and JF interpreted the results. ZG, JF and HG discussed the results and commented on the paper. TG prepared the paper with contributions from all the co-authors.
The authors declare that they have no conflict of interest.
This research has been supported by the National Key Research and Development Program of China (grant no. 2016YFC0200504) and the Natural Science Foundation of China (grant nos. 41576118 and 41473088).
This research has been supported by the National Key Research and Development Program of China (grant no. 2016YFC0200504) and the Natural Science Foundation of China (grant nos. 41576118 and 41473088).
This paper was edited by Willy Maenhaut and reviewed by three anonymous referees.
Ait-Helal, W., Borbon, A., Sauvage, S., de Gouw, J. A., Colomb, A., Gros, V., Freutel, F., Crippa, M., Afif, C., Baltensperger, U., Beekmann, M., Doussin, J.-F., Durand-Jolibois, R., Fronval, I., Grand, N., Leonardis, T., Lopez, M., Michoud, V., Miet, K., Perrier, S., Prévôt, A. S. H., Schneider, J., Siour, G., Zapf, P., and Locoge, N.: Volatile and intermediate volatility organic compounds in suburban Paris: variability, origin and importance for SOA formation, Atmos. Chem. Phys., 14, 10439–10464, https://doi.org/10.5194/acp-14-10439-2014, 2014.
Akagi, S. K., Yokelson, R. J., Wiedinmyer, C., Alvarado, M. J., Reid, J. S., Karl, T., Crounse, J. D., and Wennberg, P. O.: Emission factors for open and domestic biomass burning for use in atmospheric models, Atmos. Chem. Phys., 11, 4039–4072, https://doi.org/10.5194/acp-11-4039-2011, 2011.
Andreae, M. O. and Merlet, P.: Emission of trace gases and aerosols from biomass burning, Global Biogeochem. Cy., 15, 955–966, 2001.
Arnold, S. R., Spracklen, D. V., Williams, J., Yassaa, N., Sciare, J., Bonsang, B., Gros, V., Peeken, I., Lewis, A. C., Alvain, S., and Moulin, C.: Evaluation of the global oceanic isoprene source and its impacts on marine organic carbon aerosol, Atmos. Chem. Phys., 9, 1253–1262, https://doi.org/10.5194/acp-9-1253-2009, 2009.
Bahm, K. and Khalil, M. A. K.: A new model of tropospheric hydroxyl radical concentrations, Chemosphere, 54, 143–166, https://doi.org/10.1016/j.chemosphere.2003.08.006, 2004.
Bao, H., Niggemann, J., Luo, L., Dittmar, T., and Kao, S.: Molecular composition and origin of water-soluble organic matter in marine aerosols in the Pacific off China, Atmos. Environ., 191, 27–35, https://doi.org/10.1016/j.atmosenv.2018.07.059, 2018.
Bonsang, B., Polle, C., and Lambert, G.: Evidence for marine production of isoprene, Geophys. Res. Lett., 19, 1129–1132, 1992.
Bougiatioti, A., Bezantakos, S., Stavroulas, I., Kalivitis, N., Kokkalis, P., Biskos, G., Mihalopoulos, N., Papayannis, A., and Nenes, A.: Biomass-burning impact on CCN number, hygroscopicity and cloud formation during summertime in the eastern Mediterranean, Atmos. Chem. Phys., 16, 7389–7409, https://doi.org/10.5194/acp-16-7389-2016, 2016.
Broadgate, W. J., Liss, P. S., and Penkett, S. A.: Seasonal emissions of isoprene and other reactive hydrocarbon gases from the ocean, Geophys. Res. Lett., 24, 2675–2678, 1997.
Chen, J., Li, C., Ristovski, Z., Milic, A., Gu, Y., Islam, M. S., Wang, S., Hao, J., Zhang, H., He, C., Guo, H., Fu, H., Miljevic, B., Morawska, L., Thai, P., LAM, Y. F., Pereira, G., Ding, A., Huang, X., and Dumka, U. C.: A review of biomass burning: Emissions and impacts on air quality, health and climate in China, Sci. Total Environ., 579, 1000–1034, https://doi.org/10.1016/j.scitotenv.2016.11.025, 2017.
Claeys, M., Graham, B., Vas, G., Wang, W., Vermeylen, R., Pashynska, V., Cafmeyer, J., Guyon, P., Andreae, M. O., Artaxo, P., and Maenhaut, W.: Formation of secondary organic aerosols through photooxidation of isoprene, Science, 303, 1173–1176, 2004.
Claeys, M., Wang, W., Vermeylen, R., Kourtchev, I., Chi, X., Farhat, Y., Surratt, J. D., Gómez-González, Y., Sciare, J., and Maenhaut, W.: Chemical characterisation of marine aerosol at Amsterdam Island during the austral summer of 2006–2007, J. Aerosol Sci., 41, 13–22, https://doi.org/10.1016/j.jaerosci.2009.08.003, 2010.
Davis, D. D., Grodzinsky, G., Kasibhatla, P., Crawford, J., Chen, G., Liu, S., Bandy, A., Thornton, D., Guan, H., and Sandholm, S.: Impact of ship emissions on marine boundary layer NOx and SO2 distributions over the Pacific Basin, Geophys. Res. Lett., 28, 235–238, 2001.
Ding, X., Zheng, M., Yu, L., Zhang, X., Weber, R. J., Yan, B., Russell, A. G., Edgerton, E. S., and Wang, X.: Spatial and seasonal trends in biogenic secondary organic aerosol tracers and water-soluble organic carbon in the southeastern United States, Environ. Sci. Technol., 42, 5171–5176, https://doi.org/10.1021/es7032636, 2008.
Ding, X., Wang, X., and Zheng, M.: The influence of temperature and aerosol acidity on biogenic secondary organic aerosol tracers: Observations at a rural site in the central Pearl River Delta region, South China, Atmos. Environ., 45, 1303–1311, https://doi.org/10.1016/j.atmosenv.2010.11.057, 2011.
Ding, X., Wang, X., Xie, Z., Zhang, Z., and Sun, L.: Impacts of Siberian biomass burning on organic aerosols over the North Pacific Ocean and the Arctic: Primary and secondary organic tracers, Environ. Sci. Technol., 47, 3149–3157, https://doi.org/10.1021/es3037093, 2013.
Ding, X., He, Q., Shen, R., Yu, Q., and Wang, X.: Spatial distributions of secondary organic aerosols from isoprene, monoterpenes, β-caryophyllene, and aromatics over China during summer, J. Geophys. Res.-Atmos., 119, 877–891, https://doi.org/10.1002/2014JD021748, 2014.
Ding, X., Zhang, Y., He, Q., Yu, Q., Shen, R., Zhang, Y., Zhang, Z., Lyu, S., Hu, Q., Wang, Y., Li, L., Song, W., and Wang, X.: Spatial and seasonal variations of secondary organic aerosol from terpenoids over China, J. Geophys. Res.-Atmos., 121, 661–678, https://doi.org/10.1002/2016JD025467, 2016.
Ding, X., Zhang, Y., He, Q., Yu, Q., Wang, J., Shen, R., Song, W., Wang, Y., and Wang, X.: Significant increase of aromatics-derived secondary organic aerosol during fall to winter in China, Environ. Sci. Technol., 51, 7432–7441, https://doi.org/10.1021/acs.est.6b06408, 2017.
Duhl, T. R., Helmig, D., and Guenther, A.: Sesquiterpene emissions from vegetation: a review, Biogeosciences, 5, 761–777, https://doi.org/10.5194/bg-5-761-2008, 2008.
Ehn, M., Thornton, J. A., Kleist, E., Sipilä, M., Junninen, H., Pullinen, I., Springer, M., Rubach, F., Tillmann, R., Lee, B., Lopez-Hilfiker, F., Andres, S., Acir, I.-H., Rissanen, M., Jokinen, T., Schobesberger, S., Kangasluoma, J., Kontkanen, J., Nieminen, T., Kurtén, T., Nielsen, L. B., Jørgensen, S., Kjaergaard, H. G., Canagaratna, M., Dal Maso, M., Berndt, T., Petäjä, T., Wahner, A., Kerminen, V.-M., Kulmala, M., Worsnop, D. R., Wildt, J., and Mentel, T. F.: A large source of low volatility secondary organic aerosol, Nature, 506, 476–479, https://doi.org/10.1038/nature13032, 2014.
Ekström, S., Nozière, B., and Hansson, H.-C.: The Cloud Condensation Nuclei (CCN) properties of 2-methyltetrols and C3-C6 polyols from osmolality and surface tension measurements, Atmos. Chem. Phys., 9, 973–980, https://doi.org/10.5194/acp-9-973-2009, 2009.
Ervens, B., Turpin, B. J., and Weber, R. J.: Secondary organic aerosol formation in cloud droplets and aqueous particles (aqSOA): a review of laboratory, field and model studies, Atmos. Chem. Phys., 11, 11069–11102, https://doi.org/10.5194/acp-11-11069-2011, 2011.
Feng, J., Li, M., Zhang, P., Gong, S., Zhong, M., Wu, M., Zheng, M., Chen, C., Wang, H., and Lou, S.: Investigation of the sources and seasonal variations of secondary organic aerosols in PM2.5 in Shanghai with organic tracers, Atmos. Environ., 79, 614–622, https://doi.org/10.1016/j.atmosenv.2013.07.022, 2013.
Feng, J. L., Guo, Z. G., Zhang, T. R., Yao, X. H., Chan, C. K., and Fang, M.: Source and formation of secondary particulate matter in PM2.5 in Asian continental outflow, J. Geophys. Res.-Atmos., 117, D03302, https://doi.org/10.1029/2011JD016400, 2012.
Fraser, M. P. and Lakshmanan, K.: Using levoglucosan as a molecular marker for the long-range transport of biomass combustion aerosols, Environ. Sci. Technol., 34, 4560–4564, https://doi.org/10.1021/es991229l, 2000.
Fu, P., Kawamura, K., and Miura, K.: Molecular characterization of marine organic aerosols collected during a round-the-world cruise, J. Geophys. Res.-Atmos., 116, D13302, https://doi.org/10.1029/2011JD015604, 2011.
Fu, P., Aggarwal, S. G., Chen, J., Li, J., Sun, Y., Wang, Z., Chen, H., Liao, H., Ding, A., Umarji, G. S., Patil, R. S., Chen, Q., and Kawamura, K.: Molecular markers of secondary organic aerosol in Mumbai, India, Environ. Sci. Technol., 50, 4659–4667, https://doi.org/10.1021/acs.est.6b00372, 2016.
Fu, T.-M., Cao, J. J., Zhang, X. Y., Lee, S. C., Zhang, Q., Han, Y. M., Qu, W. J., Han, Z., Zhang, R., Wang, Y. X., Chen, D., and Henze, D. K.: Carbonaceous aerosols in China: top-down constraints on primary sources and estimation of secondary contribution, Atmos. Chem. Phys., 12, 2725–2746, https://doi.org/10.5194/acp-12-2725-2012, 2012.
Gantt, B., Meskhidze, N., and Kamykowski, D.: A new physically-based quantification of marine isoprene and primary organic aerosol emissions, Atmos. Chem. Phys., 9, 4915–4927, https://doi.org/10.5194/acp-9-4915-2009, 2009.
Generoso, S., Bey, I., Attié, J., and Bréon, F.: A satellite- and model-based assessment of the 2003 Russian fires: Impact on the Arctic region, J. Geophys. Res.-Atmos., 112, D15302, https://doi.org/10.1029/2006JD008344, 2007.
Gordon, H., Kirkby, J., Baltensperger, U., Bianchi, F., Breitenlechner, M., Curtius, J., Dias, A., Dommen, J., Donahue, N. M., Dunne, E. M., Duplissy, J., Ehrhart, S., Flagan, R. C., Frege, C., Fuchs, C., Hansel, A., Hoyle, C. R., Kulmala, M., Kürten, A., Lehtipalo, K., Makhmutov, V., Molteni, U., Rissanen, M. P., Stozkhov, Y., Tröstl, J., Tsagkogeorgas, G., Wagner, R., Williamson, C., Wimmer, D., Winkler, P. M., Yan, C., and Carslaw, K. S.: Causes and importance of new particle formation in the present-day and preindustrial atmospheres, J. Geophys. Res.-Atmos., 122, 8739–8760, https://doi.org/10.1002/2017JD026844, 2017.
Guenther, A., Hewitt, C. N., Erickson, D., Fall, R., Geron, C., Graedel, T., Harley, P., Klinger, L., Lerdau, M., McKay, W. A., Pierce, T., Scholes, B., Steinbrecher, R., Tallamraju, R., Taylor, J., and Zimmerman, P.: A global model of natural volatile organic compound emissions, J. Geophys. Res.-Atmos., 100, 8873–8892, 1995.
Guenther, A., Karl, T., Harley, P., Wiedinmyer, C., Palmer, P. I., and Geron, C.: Estimates of global terrestrial isoprene emissions using MEGAN (Model of Emissions of Gases and Aerosols from Nature), Atmos. Chem. Phys., 6, 3181–3210, https://doi.org/10.5194/acp-6-3181-2006, 2006.
Guenther, A. B., Jiang, X., Heald, C. L., Sakulyanontvittaya, T., Duhl, T., Emmons, L. K., and Wang, X.: The Model of Emissions of Gases and Aerosols from Nature version 2.1 (MEGAN2.1): an extended and updated framework for modeling biogenic emissions, Geosci. Model Dev., 5, 1471–1492, https://doi.org/10.5194/gmd-5-1471-2012, 2012.
Hackenberg, S. C., Andrews, S. J., Airs, R., Arnold, S. R., Bouman, H. A., Brewin, R. J. W., Chance, R. J., Cummings, D., Dall'Olmo, G., Lewis, A. C., Minaeian, J. K., Reifel, K. M., Small, A., Tarran, G. A., Tilstone, G. H., and Carpenter, L. J.: Potential controls of isoprene in the surface ocean, Global Biogeochem. Cy., 31, 644–662, https://doi.org/10.1002/2016GB005531, 2017.
Han, Z., Xie, Z., Wang, G., Zhang, R., and Tao, J.: Modeling organic aerosols over east China using a volatility basis-set approach with aging mechanism in a regional air quality model, Atmos. Environ., 124, 186–198, https://doi.org/10.1016/j.atmosenv.2015.05.045, 2016.
Haque, M. M., Kawamura, K., and Kim, Y.: Seasonal variations of biogenic secondary organic aerosol tracers in ambient aerosols from Alaska, Atmos. Environ., 130, 95–104, 2016.
Heald, C. L., Henze, D. K., Horowitz, L. W., Feddema, J., Lamarque, J.-F., Guenther, A., Hess, P. G., Vitt, F., Seinfeld, J. H., Goldstein, A. H., and Fung, I.: Predicted change in global secondary organic aerosol concentrations in response to future climate, emissions, and land use change, J. Geophys. Res.-Atmos., 113, D05211, https://doi.org/10.1029/2007JD009092, 2008.
Hennigan, C. J., Sullivan, A. P., Collett Jr., J. L., and Robinson, A. L.: Levoglucosan stability in biomass burning particles exposed to hydroxyl radicals, Geophys. Res. Lett., 37, L09806, https://doi.org/10.1029/2010GL043088, 2010.
Henze, D. K., Seinfeld, J. H., Ng, N. L., Kroll, J. H., Fu, T.-M., Jacob, D. J., and Heald, C. L.: Global modeling of secondary organic aerosol formation from aromatic hydrocarbons: high- vs. low-yield pathways, Atmos. Chem. Phys., 8, 2405–2420, https://doi.org/10.5194/acp-8-2405-2008, 2008.
Hoffmann, D., Tilgner, A., Iinuma, Y., and Herrmann, H.: Atmospheric stability of levoglucosan: A detailed laboratory and modeling study, Environ. Sci. Technol., 44, 694–699, https://doi.org/10.1021/es902476f, 2010.
Hsiao, T., Ye, W., Wang, S., Tsay, S., Chen, W., Lin, N., Lee, C., Hung, H., Chuang, M., and Chantara, S.: Investigation of the CCN activity, BC and UVBC mass concentrations of biomass burning aerosols during the 2013 BASELInE campaign, Aerosol Air Qual. Res., 16, 2742–2756, https://doi.org/10.4209/aaqr.2015.07.0447, 2016.
Hu, D. and Yu, J. Z.: Secondary organic aerosol tracers and malic acid in Hong Kong: seasonal trends and origins, Environ. Chem., 10, 381–394, https://doi.org/10.1071/EN13104, 2013.
Hu, Q., Xie, Z., Wang, X., Kang, H., He, Q., and Zhang, P.: Secondary organic aerosols over oceans via oxidation of isoprene and monoterpenes from Arctic to Antarctic, Sci. Rep.-UK, 3, 2280, https://doi.org/10.1038/srep02280, 2013a.
Hu, Q., Xie, Z., Wang, X., Kang, H., and Zhang, P.: Levoglucosan indicates high levels of biomass burning aerosols over oceans from the Arctic to Antarctic, Sci. Rep.-UK, 3, 3119, https://doi.org/10.1038/srep03119, 2013b.
Hu, Q., Qu, K., Gao, H., Cui, Z., Gao, Y., and Yao, X.: Large increases in primary trimethylaminium and secondary dimethylaminium in atmospheric particles associated with cyclonic eddies in the Northwest Pacific Ocean, J. Geophys. Res.-Atmos., 123, 133–146, https://doi.org/10.1029/2018JD028836, 2018.
Huang, S., Siegert, F., Goldammer, J. G., and Sukhinin, A. I.: Satellite-derived 2003 wildfires in southern Siberia and their potential influence on carbon sequestration, Int. J. Remote Sens., 30, 1479–1492, https://doi.org/10.1080/01431160802541549, 2009.
John, J. G., Stock, C. A., and Dunne, J. P.: A more productive, but different, ocean after mitigation, Geophys. Res. Lett., 42, 9836–9845, https://doi.org/10.1002/2015GL066160, 2015.
Kanakidou, M., Seinfeld, J. H., Pandis, S. N., Barnes, I., Dentener, F. J., Facchini, M. C., Van Dingenen, R., Ervens, B., Nenes, A., Nielsen, C. J., Swietlicki, E., Putaud, J. P., Balkanski, Y., Fuzzi, S., Horth, J., Moortgat, G. K., Winterhalter, R., Myhre, C. E. L., Tsigaridis, K., Vignati, E., Stephanou, E. G., and Wilson, J.: Organic aerosol and global climate modelling: a review, Atmos. Chem. Phys., 5, 1053–1123, https://doi.org/10.5194/acp-5-1053-2005, 2005.
Kang, M., Fu, P., Kawamura, K., Yang, F., Zhang, H., Zang, Z., Ren, H., Ren, L., Zhao, Y., Sun, Y., and Wang, Z.: Characterization of biogenic primary and secondary organic aerosols in the marine atmosphere over the East China Sea, Atmos. Chem. Phys., 18, 13947–13967, https://doi.org/10.5194/acp-18-13947-2018, 2018.
Kang, M., Guo, H., Wang, P., Fu, P., Ying, Q., Liu, H., Zhao, Y., and Zhang, H.: Characterization and source apportionment of marine aerosols over the East China Sea, Sci. Total Environ., 651, 2679–2688, https://doi.org/10.1016/j.scitotenv.2018.10.174, 2019.
Kawamura, K., Hoque, M. M. M., Bates, T. S., and Quinn, P. K.: Molecular distributions and isotopic compositions of organic aerosols over the western North Atlantic: Dicarboxylic acids, related compounds, sugars, and secondary organic aerosol tracers, Org. Geochem., 113, 229–238, https://doi.org/10.1016/j.orggeochem.2017.08.007, 2017.
Kleindienst, T. E., Jaoui, M., Lewandowski, M., Offenberg, J. H., Lewis, C. W., Bhave, P. V., and Edney, E. O.: Estimates of the contributions of biogenic and anthropogenic hydrocarbons to secondary organic aerosol at a southeastern US location, Atmos. Environ., 41, 8288–8300, https://doi.org/10.1016/j.atmosenv.2007.06.045, 2007.
Lauvset, S. K., Tjiputra, J., and Muri, H.: Climate engineering and the ocean: effects on biogeochemistry and primary production, Biogeosciences, 14, 5675–5691, https://doi.org/10.5194/bg-14-5675-2017, 2017.
Lewandowski, M., Piletic, I. R., Kleindienst, T. E., Offenberg, J. H., Beaver, M. R., Jaoui, M., Docherty, K. S., and Edney, E. O.: Secondary organic aerosol characterisation at field sites across the United States during the spring-summer period, Int. J. Environ. Anal. Chem., 93, 1084–1103, https://doi.org/10.1080/03067319.2013.803545, 2013.
Li, L., Tang, P., Nakao, S., Kacarab, M., and Cocker, D. R.: Novel approach for evaluating secondary organic aerosol from aromatic hydrocarbons: unified method for predicting aerosol composition and formation, Environ. Sci. Technol., 50, 6249–6256, https://doi.org/10.1021/acs.est.5b05778, 2016.
Li, M., Zhang, Q., Streets, D. G., He, K. B., Cheng, Y. F., Emmons, L. K., Huo, H., Kang, S. C., Lu, Z., Shao, M., Su, H., Yu, X., and Zhang, Y.: Mapping Asian anthropogenic emissions of non-methane volatile organic compounds to multiple chemical mechanisms, Atmos. Chem. Phys., 14, 5617–5638, https://doi.org/10.5194/acp-14-5617-2014, 2014.
Li, R., Wang, Z., Cui, L., Fu, H., Zhang, L., Kong, L., Chen, W., and Chen, J.: Air pollution characteristics in China during 2015–2016: Spatiotemporal variations and key meteorological factors, Sci. Total Environ., 648, 902–915, 2019.
Meskhidze, N. and Nenes, A.: Phytoplankton and cloudiness in the Southern Ocean, Science, 314, 1419–1423, https://doi.org/10.1126/science.1131779, 2006.
Mochida, M., Kawamura, K., Fu, P., and Takemura, T.: Seasonal variation of levoglucosan in aerosols over the western North Pacific and its assessment as a biomass-burning tracer, Atmos. Environ., 44, 3511–3518, https://doi.org/10.1016/j.atmosenv.2010.06.017, 2010.
Murphy, D. M., Chow, J. C., Leibensperger, E. M., Malm, W. C., Pitchford, M., Schichtel, B. A., Watson, J. G., and White, W. H.: Decreases in elemental carbon and fine particle mass in the United States, Atmos. Chem. Phys., 11, 4679–4686, https://doi.org/10.5194/acp-11-4679-2011, 2011.
Nichols, M. A.: Spatial and temporal variability of marine primary organic aerosols over the global oceans: a review, University of Maryland College Park, 2016.
Peñuelas, J. and Staudt, M.: BVOCs and global change, Trends Plant Sci., 15, 133–144, https://doi.org/10.1016/j.tplants.2009.12.005, 2010.
Rinne, H. J. I., Guenther, A. B., Greenberg, J. P., and Harley, P. C.: Isoprene and monoterpene fluxes measured above Amazonian rainforest and their dependence on light and temperature, Atmos. Environ., 36, 2421–2426, https://doi.org/10.1016/S1352-2310(01)00523-4, 2002.
Running, S. W.: Is global warming causing more, larger wildfires?, Science, 313, 927–928, https://doi.org/10.1126/science.1130370, 2006.
Sharma, S., Lavoué, D., Cachier, H., Barrie, L. A., and Gong, S. L.: Long-term trends of the black carbon concentrations in the Canadian Arctic, J. Geophys. Res.-Atmos., 109, D15203, https://doi.org/10.1029/2003JD004331, 2004.
Shen, R.-Q., Ding, X., He, Q.-F., Cong, Z.-Y., Yu, Q.-Q., and Wang, X.-M.: Seasonal variation of secondary organic aerosol tracers in Central Tibetan Plateau, Atmos. Chem. Phys., 15, 8781–8793, https://doi.org/10.5194/acp-15-8781-2015, 2015
Surratt, J. D., Chan, A. W. H., Eddingsaas, N. C., Chan, M., Loza, C. L., Kwan, A. J., Hersey, S. P., Flagan, R. C., Wennberg, P. O., and Seinfeld, J. H.: Reactive intermediates revealed in secondary organic aerosol formation from isoprene, P. Natl. Acad. Sci. USA, 107, 6640–6645, https://doi.org/10.1073/pnas.0911114107, 2010.
Tarvainen, V., Hakola, H., Hellén, H., Bäck, J., Hari, P., and Kulmala, M.: Temperature and light dependence of the VOC emissions of Scots pine, Atmos. Chem. Phys., 5, 989–998, https://doi.org/10.5194/acp-5-989-2005, 2005.
van der Werf, G. R., Randerson, J. T., Giglio, L., Collatz, G. J., Kasibhatla, P. S., and Arellano Jr., A. F.: Interannual variability in global biomass burning emissions from 1997 to 2004, Atmos. Chem. Phys., 6, 3423–3441, https://doi.org/10.5194/acp-6-3423-2006, 2006.
Wang, F., Guo, Z., Lin, T., Hu, L., Chen, Y., and Zhu, Y.: Characterization of carbonaceous aerosols over the East China Sea: The impact of the East Asian continental outflow, Atmos. Environ., 110, 163–173, https://doi.org/10.1016/j.atmosenv.2015.03.059, 2015.
Warneke, C., Froyd, K. D., Brioude, J., Bahreini, R., Brock, C. A., Cozic, J., de Gouw, J. A., Fahey, D. W., Ferrare, R., Holloway, J. S., Middlebrook, A. M., Miller, L., Montzka, S., Schwarz, J. P., Sodemann, H., Spackman, J. R., and Stohl, A.: An important contribution to springtime Arctic aerosol from biomass burning in Russia, Geophys. Res. Lett., 37, L01801, https://doi.org/10.1029/2009GL041816, 2010.
Yang, F., Gu, Z., Feng, J., Liu, X., and Yao, X.: Biogenic and anthropogenic sources of oxalate in PM2.5 in a mega city, Shanghai, Atmos. Res., 138, 356–363, https://doi.org/10.1016/j.atmosres.2013.12.006, 2014.
Yang, F., Kawamura, K., Chen, J., Ho, K., Lee, S., Gao, Y., Cui, L., Wang, T., and Fu, P.: Anthropogenic and biogenic organic compounds in summertime fine aerosols (PM2.5) in Beijing, China, Atmos. Environ., 124, 166–175, 2016.
Yao, X., Xu, X., Sabaliauskas, K., and Fang, M.: Comment on “Atmospheric Particulate Matter Pollution during the 2008 Beijing Olympics”, Environ. Sci. Technol., 43, 7589, https://doi.org/10.1021/es902276p, 2009.
Zhang, H., Surratt, J. D., Lin, Y. H., Bapat, J., and Kamens, R. M.: Effect of relative humidity on SOA formation from isoprene/NO photooxidation: enhancement of 2-methylglyceric acid and its corresponding oligoesters under dry conditions, Atmos. Chem. Phys., 11, 6411–6424, https://doi.org/10.5194/acp-11-6411-2011, 2011.
Zhang, Q., He, K., and Huo, H.: Policy: cleaning China's air, Nature, 484, 161–162, 2012.
Zhang, Y., Yang, X., Brown, R., Yang, L., Morawska, L., Ristovski, Z., Fu, Q., and Huang, C.: Shipping emissions and their impacts on air quality in China, Sci. Total Environ., 581–582, 186–198, https://doi.org/10.1016/j.scitotenv.2016.12.098, 2017.
Zhang, Z., Zhang, Y., Wang, X., Lü, S., Huang, Z., Huang, X., Yang, W., Wang, Y., and Zhang, Q.: Spatiotemporal patterns and source implications of aromatic hydrocarbons at six rural sites across China's developed coastal regions, J. Geophys. Res.-Atmos., 121, 6669–6687, https://doi.org/10.1002/2016JD025115, 2016.
Zhu, C., Kawamura, K., and Kunwar, B.: Effect of biomass burning over the western North Pacific Rim: wintertime maxima of anhydrosugars in ambient aerosols from Okinawa, Atmos. Chem. Phys., 15, 1959–1973, https://doi.org/10.5194/acp-15-1959-2015, 2015.
Zhu, C., Kawamura, K., Fukuda, Y., Mochida, M., and Iwamoto, Y.: Fungal spores overwhelm biogenic organic aerosols in a midlatitudinal forest, Atmos. Chem. Phys., 16, 7497–7506, https://doi.org/10.5194/acp-16-7497-2016, 2016a.
Zhu, C., Kawamura, K., and Fu, P.: Seasonal variations of biogenic secondary organic aerosol tracers in Cape Hedo, Okinawa, Atmos. Environ., 130, 113–119, https://doi.org/10.1016/j.atmosenv.2015.08.069, 2016b.
Zhu, Y., Yang, L., Kawamura, K., Chen, J., Ono, K., Wang, X., Xue, L., and Wang, W.: Contributions and source identification of biogenic and anthropogenic hydrocarbons to secondary organic aerosols at Mt. Tai in 2014, Environ. Pollut., 220, 863–872, 2017.
Zhu, Y., Li, K., Shen, Y., Gao, Y., Liu, X., Yu, Y., Gao, H., and Yao, X.: New particle formation in the marine atmosphere during seven cruise campaigns, Atmos. Chem. Phys., 19, 89–113, https://doi.org/10.5194/acp-19-89-2019, 2019.