the Creative Commons Attribution 4.0 License.
the Creative Commons Attribution 4.0 License.
 | 27 Apr 2020
Effects of aerosol dynamics and gas–particle conversion on dry deposition of inorganic reactive nitrogen in a temperate forest
Genki Katata
Kazuhide Matsuda
Atsuyuki Sorimachi
Mizuo Kajino
Kentaro Takagi
Dry deposition has an impact on nitrogen status in forest environments. However, the mechanism for the high dry-deposition rates of fine nitrate particles () observed in forests remains unknown and is thus a potential source of error in chemical transport models (CTMs). Here, we modified and applied a multilayer land surface model coupled with dry-deposition and aerosol dynamic processes for a temperate mixed forest in Japan. This represents the first application of such a model to ammonium nitrate (NH4NO3) gas–particle conversion (gpc) and the aerosol water uptake of reactive nitrogen compounds. Thermodynamics, kinetics, and dry deposition for mixed inorganic particles are modeled by a triple-moment modal method. Data for inorganic mass and size-resolved total number concentrations measured by a filter pack and electrical low-pressure impactor in autumn were used for model inputs and subsequent numerical analysis. The model successfully reproduces turbulent fluxes observed above the canopy and vertical micrometeorological profiles noted in our previous studies. The sensitivity tests with and without gpc demonstrated clear changes in the inorganic mass and size-resolved total number concentrations within the canopy. The results also revealed that within-canopy evaporation of NH4NO3 under dry conditions significantly enhances the deposition flux of fine- and fine- particles, while reducing the deposition flux of nitric acid gas (HNO3). As a result of the evaporation of particulate NH4NO3, the calculated daytime mass flux of fine over the canopy was 15 times higher in the scenario of “gpc” than in the scenario of “no gpc”. This increase caused high contributions from particle deposition flux ( and ) to total nitrogen flux over the forest ecosystem (∼39 %), although the contribution of NH3 was still considerable. A dry-deposition scheme coupled with aerosol dynamics may be required to improve the predictive accuracy of chemical transport models for the surface concentration of inorganic reactive nitrogen.
- Article
(6068 KB) - Full-text XML
-
Supplement
(152 KB) - BibTeX
- EndNote


The dry deposition of inorganic reactive nitrogen gas (e.g., HNO3 and NH3) and particles (e.g., and ) is one of the major pathways of nitrogen input into forest ecosystems. In eastern Asia, air pollutant emissions continue to increase (EANET, 2016), and, although dry deposition of inorganic reactive nitrogen has been suggested as an important consequence by prior studies using indirect estimates (e.g., Pan et al., 2012; Li et al., 2013; Xu et al., 2015), direct-measurement studies remain limited (Nakahara et al., 2019). Recent observational studies at forests revealed that the dry-deposition flux of inorganic reactive nitrogen in the form of fine was markedly higher than that expected from theory (Takahashi and Wakamatsu, 2004; Yamazaki et al., 2015; Honjo et al., 2016; Sakamoto et al., 2018; Nakahara et al., 2019). Provided that physical deposition processes are dominant, the deposition velocities of and particles are expected to be similar because both species exist in the same submicrometer size range (e.g., Wolff et al., 2011). However, Sakamoto et al. (2018) observed a deposition velocity of as high as those of HNO3 in temperate mixed forests, when using the relaxed eddy accumulation method (Matsuda et al., 2015). Nakahara et al. (2019) also observed a higher concentration gradient of fine than of fine in cool–temperate forests using a thermodynamic equilibrium model to explain this difference via the evaporation of NH4NO3 particles in the NH4NO3–NH3–HNO3 triad within the canopy. Numerical chemical transport models (CTMs) for eastern Asia have also demonstrated that models can overestimate the total (gas and particle) nitrate concentrations present in many locations (Kajino et al., 2013; Shimadera et al., 2018; Morino et al., 2015; Sakurai et al., 2015). Despite many uncertain factors (e.g., emission inventory, grid resolution, chemical and physical dynamics, and deposition modules), Shimadera et al. (2014) demonstrated that the surface concentration of total nitrate could be reproduced by increasing the dry-deposition velocity of HNO3 by a factor of 20 with respect to previous studies. Hence, the deposition velocity of in fine particles and/or HNO3 are among the major uncertainties in the CTMs.
Modeling studies for dry deposition have demonstrated the importance of the volatilization of NH4NO3 during the dry deposition of gaseous and particulate nitrates (Brost et al., 1988; van Oss et al., 1998; Kramm and Dlugi, 1994), although the process itself has been known in the atmospheric-chemistry community for some time (Seinfeld and Pandis, 2006). Such modeling studies used the “big-leaf” concept to represent the forest canopy under steady-state and thermodynamic-equilibrium assumptions, with chemical reaction rates provided by observational data. Nemitz and Sutton (2004) developed a more sophisticated model through the introduction of chemical timescales for a size-resolved particle and showed that the thermodynamic gas–particle conversion of NH4NO3 (hereafter referred to as gpc) may explain the bidirectional fluxes observed above a Dutch heathland. However, several uncertainties remained in their modeled results, largely due to uncertainties in empirical treatments of particle deposition and thermodynamic processes and the assumption that gas concentrations are in equilibrium with the pure NH4NO3 particle phase (Nemitz and Sutton, 2004). Meanwhile, the equilibration of aerosols with surrounding liquid water is also important in determining their thermodynamic equilibrium (e.g., Fountoukis and Nenes, 2007). An accurate evaluation of the impact of NH4NO3–NH3–HNO3 conversion within the canopy requires a process-based model that includes the thermodynamics of mixed inorganic aerosols linked to gas-phase chemistry, while ensuring that no equilibrium assumption is required (Nemitz, 2015).
We here propose a new multilayer land surface model coupled with dry deposition and aerosol dynamics (thermodynamics and kinetics of mixed inorganic aerosols) for forest environments. In aerosol dynamics modeling, the moment method is used to reduce computational costs and incorporates general processes, such as condensation, coagulation, below-cloud scavenging (e.g., Binkowski and Shankar, 1995), and dry deposition (Bae et al., 2009). These processes are implemented into a multilayer atmosphere–SOiL–VEGetation model (SOLVEG) including particle and fog droplet deposition and hygroscopic particle growth processes (Katata et al., 2014). We apply the model to a Japanese mixed forest for calibration and validation. Finally, we use numerical experiments to examine the impacts of two key processes on dry-deposition flux over the canopy: gas–particle conversion of inorganic nitrogen compounds and hygroscopic growth.
2.1 Model overview
A one-dimensional multilayer SOLVEG model consists of four submodels: atmosphere, soil, vegetation, and radiation within the vegetation canopy. A general description of gas and particle transport and dry deposition is given in Katata and Ota (2017). In the atmosphere submodel, one-dimensional diffusion equations are solved between atmospheric layers for the horizontal wind speed, potential temperature, specific (relative) humidity, liquid water content of fog, turbulent kinetic energy and length scale (Katata, 2009), and gas and particle concentrations (Katata and Ota, 2017). Observational data are used to determine the upper boundary conditions. Bulk transfer equations are applied at the lowest layer using soil surface temperatures and specific humidity calculated by the soil submodel.
In the soil submodel, soil temperature, volumetric soil water content, and soil pore specific humidity are predicted from heat conduction, mass balance in liquid water, and water vapor diffusion equations, respectively (Katata, 2009). Root water uptake is calculated from the transpiration rate in the vegetation submodel. Mass conservation equations for the liquid and gas phases are solved to determine soil CO2 (Nagai, 2004). Organic-matter dynamics are also considered (Ota et al., 2013): microbial decomposition and dissolved organic-carbon (DOC) leaching in the above-ground litter layer, the below-ground input of carbon from roots (root litter), and soil organic-carbon (SOC) turnover and DOC transport along water flows throughout the soil profile are determined for three SOC pools (active, slow, and passive) with different turnover times.
In the vegetation submodel, profiles for leaf temperature, leaf surface water, and vertical liquid water flux are predicted (Nagai, 2004). The heat budget equation at the leaf surface uses key variables from the atmosphere submodel combined with the radiation scheme to predict leaf temperature. At the upper boundary of the submodel, a given precipitation intensity is used to calculate the vertical liquid water flux within the canopy based on the surface water budget equation. The CO2 assimilation rate due to photosynthesis is predicted using Farquhar’s formulations (Farquhar et al., 1980) together with stomatal resistance. In the radiation submodel, direct and diffuse downward and upward fluxes of solar and longwave radiation are calculated to determine the radiation energy input at each canopy layer. Fractions of sunlit and shaded leaves at each canopy layer are used to calculate stomatal resistance and the total energy budget.
A multilayer snow module is unique in its ability to include the gravitational and capillary liquid water flows in the unsaturated snow layer based on van Genuchten’s concept of water flow in the unsaturated zone (cf. Hirashima et al., 2010; Katata et al., 2020). In the soil module, freeze–thaw processes based on the freezing-point depression equation are considered in equations of heat conduction and liquid water flow. Winter-related processes for grassland phenology, such as leaf development and senescence due to cold stresses, are also implemented in the vegetation submodel. Carbon gain, both from photosynthesis and remobilized reserves, is allocated to sinks according to changing sink priorities and strengths. Sink strengths are calculated based on the dynamics of leaves and stems and their acclimation to low temperatures. The removal of tillers and leaves by cutting can also be simulated during the growing season, as can subsequent regrowth of the sward. The regrowth rate after cutting is calculated at each phenological stage. The natural turnover of leaves and roots is modeled using typical life spans in years. Rooting depth and the fraction of roots in soil layers are modeled as functions of root biomass. The daily amount of dead root biomass (root litter) is used as the input to SOC in SOLVEG's soil submodel.
2.2 Dry deposition
Since full descriptions for the dry-deposition process of gases and particles are available in Katata et al. (2013, 2014) and Katata and Ota (2017), this subsection presents only the key equations.
Using compensation points for trace gases in the substomatal cavity, χs (nmol m−3), and above the leaf water surface, χd (nmol m−3), we model bidirectional gas exchange fluxes with stomata, Fgs (nmol m−2 s−1), and with leaf water surfaces, Fgd (nmol m−2 s−1), for each canopy layer following the approach presented in Katata et al. (2013):
where a is the leaf area density (m2 m−3), Dgas and Dw are the diffusivities (m2 s−1) of trace gas and water vapor, respectively, rb, rs, and rd are the resistances (s m−1) for the leaf boundary layer, stomata, and evaporation (cuticular), χa is the ambient gas concentration (nmol m−3) in the canopy layer, and . The total gas exchange flux over the leaves can be calculated as the sum of Fgs and Fgd for all canopy layers. In accordance with a number of observations (e.g., Huebert and Robert, 1985), all χs, rd, and rs values are set to zero for highly reactive and water-soluble gas species of HNO3 and HCl; i.e., we assume perfect absorption by plant canopies. For both species, parameterization specific to a deciduous forest by Meyers et al. (1989) is used to calculate rb. For NH3, χs is calculated based on the thermodynamic equilibrium between NH3 in the liquid and gas phases (Nemitz et al., 2000; Sutton et al., 1994) as follows:
where Tc is the canopy temperature (∘C) and Γs is the stomatal emission potential (also known as the apoplastic ratio) at 1013 hPa (Nemitz et al., 2004). NH3 concentrations in leaf surface water (χd) are calculated by assuming Henry’s law and dissociation equilibria with atmospheric concentrations of NH3 at each canopy layer. To calculate the exchange flux of SO2 and NH3 over the wet canopy, an empirical formula for rd is applied (Massad et al., 2010) as follows:
where b is the constant, RH is the relative humidity (%), and AR is the ratio of total acid∕NH3, represented as (2[SO2] + [HNO3] + [HCl]) ∕ [NH3] in each atmospheric layer. The value of AR is determined from the gaseous inorganic concentration. Since the affinity (such as solubility in water) of SO2 at the leaf surface is approximately twice that of NH3 (van Hove et al., 1989), a half value of rd calculated by Eq. (4) is applied to SO2 deposition. The RH value could be affected by leaf surface water content at each canopy layer as a function of water balance due to the leaf surface water evaporation, interception of precipitation by leaves, capture of fog water by leaves, and drip from leaves (Katata et al., 2008, 2013). Since our model is not a dynamic modeling approach (e.g., Sutton et al., 1998; Flechard et al., 1999), uncertainties in Eq. (4) could affect the simulation of the charging and discharging of NH3 in the cuticle due to the wet canopy being in equilibrium with non-zero leaf surface concentrations of NH3.
The gas exchange flux over the ground Fg0 (nmol m−2 s−1) was described with compensation points at the ground χg (nmol m−3) as follows:
where cH0 is the surface exchange coefficient for heat, and χa0 are the horizontal wind speed (m s−1) and gas concentration at the bottom of the atmospheric layer (nmol m−3), respectively, Ts0 is the soil surface temperature (∘C), and Γg is the ground level emission potential for NH3 at 1013 hPa.
As explained in Katata et al. (2014), the particle deposition rate of each inorganic species in each canopy layer, Fp (µg m−2 s−1 or no. m−2 s−1), is represented as follows:
where Ep is the particle capture by leaves (µg m−3 s−1 or no. m−3 s−1) and ε is the total particle capture efficiency by leaves as a result of inertial impaction (Peters and Eiden, 1992), gravitational settling, Brownian diffusion (Kirsch and Fuchs, 1968), and interception (Fuchs, 1964; Petroff et al., 2009). Ff is the shielding coefficient for particles in the horizontal direction, is the horizontal wind speed (m s−1) at each canopy layer, and cp is the particle mass or number concentration (µg m−3 or no. m−3). Ep, ε, and cp are integration values of given size bins with particle diameters (Dp; µm).
2.3 Aerosol dynamics
In order to simulate changes in particle size due to condensation, evaporation, and water uptake, a triple-moment modal method (Kajino et al., 2012) is employed at each atmospheric layer in SOLVEG. Particles are grouped into fine (accumulation) and Aitken modes with size distributions prescribed by a lognormal function; the coarse mode is not considered in the simulation. The lognormal function is identified by three parameters: number concentration (N; no. m−3), geometric mean diameter (Dg; µm), and geometric standard deviation (σg). The triple-moment method predicts spatiotemporal changes in three moments (k) in order to identify changes in the shape of the lognormal size distribution of each mode. The selected three moments are 0th, 2nd, and 3rd (M0, M2, and M3), which are respectively number (N), surface area (m2 m−3), and volume concentrations (m3 m−3). Dg values for each moment are named Dg0, Dg2, and Dg3. The relationships of the above lognormal parameters with the three moments for each atmospheric layer are as follows:
Particle growth is dynamically solved following the method of Kajino et al. (2012). Gas-to-particle mass transfer is driven by the difference between the current state and the thermodynamic equilibrium state, as simulated by the ISORROPIA2 model (Fountoukis and Nenes, 2007) for semivolatile inorganic components such as , , Cl−, and liquid water (H2O). The gas-phase chemical production of HNO3 could further affect simulated HNO3 concentration and flux, and this parameter should therefore be implemented to this model in the future. In the present, the gas–particle conversion of organics is not considered because the required observational speciation data were not available. Thus, both organics and other components of the total mass were assumed to be hydrophobic aerosols in the present simulation. Since the current study focuses on mass gain or loss specific to accumulation mode aerosols, coagulation processes are also not included. Brownian coagulation, while critically important for predicting the number concentration of Aitken mode particles, is not important in the prediction of accumulation mode particle mass (e.g., Kajino et al., 2013).
3.1 Study site and observational data
We used measurements from an observation tower in a mixed forest, namely the Field Museum Tamakyuryo (FM Tama) of the Tokyo University of Agriculture and Technology, located in a western suburb of Tokyo, Japan (35∘38′ N, 139∘23′ E). Deciduous trees (Quercus spp.) are dominant around the meteorological tower together with Japanese cedar trees (Cryptomeria japonica). The canopy height around the tower is approximately 20 m. The growth period of deciduous trees is typically from April to December. Further detailed descriptions of this site are provided by Matsuda et al. (2015) and Yamazaki et al. (2015).
Simulations were carried out over two experimental periods: the first in early autumn (26 September to 11 October 2016) and the second in late autumn (7 November to 7 December 2016). In the early-autumn period, daytime (08:00–17:00 local time) and nighttime (17:00–08:00 local time) mean concentrations of inorganic gases were available at five heights (1, 8, 16, 23, and 30 m), with fine-particle mass concentrations observed using a four-stage filter-pack sampling system. System specifications were identical to those used in Nakahara et al. (2019), except for the particle filter material. This study used a glass fiber filter coated with Teflon for collecting fine and coarse particles. For the early-autumn period, filter-pack sampling was continuously performed during the day and night except during periods of rain. As a result, five daytime reading datasets and six nighttime reading datasets were collected. The gaps between data in rain days of the early-autumn period were linearly interpolated for simulations. Since this interpolation could cause unrealistic effects on the results, we used only the calculations and measurements in the periods of no rain for comparisons of inorganic mass concentration. For the late-autumn period, the time resolution was relatively low, as weekly continuous measurements were used. After the samples were collected, inorganic ions in each filter were extracted into deionized water by ultrasonic extraction and then analyzed using ion chromatography (Dionex ICS-1100, Thermo Scientific).
In the late-autumn period, measurements of particle number concentrations were taken during the daytime (10:00–16:00) for 7 d without rainfall. Airborne particle number concentrations were measured by an electrical low-pressure impactor (ELPI+, Dekati Ltd.). This involves sampled particles being charged by corona discharge and later separated by size using the principle of inertial classification through a 13-stage cascade low-pressure (40 hPa) impactor combined with a backup filter stage. During collection, charged particles produce a current proportional to their respective number concentrations. The broad particle size distribution measured by the ELPI+ ranges from 6 nm to 10 µm. More details on the ELPI+ system used are provided in Järvinen et al. (2014). The ELPI+ particle sample inlets were placed at heights of 30, 23, 17, 8, and 1 m at the tower through Tygon intake tubing with an inner diameter of 7.94 mm and respective lengths of 6, 5, 10, 20, and 25 m. Each sampling line for the five measuring heights was manually switched every 2 min. The transit times for particle samples in the tubing at each height ranged between 2 and 12 s. Results of the first minute of concentration measurement were rejected in order to avoid the mixing of air samples from different heights. Data were stored at a sampling rate of 1 s−1. Raw data were averaged over intervals of 60 s and were later used for calculating 600 s mean vertical profiles. Particle penetration efficiencies were estimated using the indoor particles in the laboratory by changing the lengths of the sampling tubes accordingly (30, 20, 15, 10, and 5 m). Based on these results, raw concentrations were corrected prior to postprocessing. Furthermore, the data were further screened out according to several selection criteria to ensure their credibility with respect to three uncertainties: uncertainty in the number concentration measurements, signal-to-noise ratio (Deventer et al., 2015), and variation in background current (the signal obtained from particle-free air through a HEPA – high-efficiency particulate air – filter for each particle stage) before and after the measurements.
Half-hourly meteorological data for horizontal wind speed, air temperature, and humidity at heights of 30, 25, 20, 10, 6, and 1 m at the tower were used for model input and validation. Incoming shortwave and longwave radiation values at 30 m were used for the model input, while incoming longwave radiation was estimated by the parameterization method of Duarte et al. (2006). Net radiation was measured using a net radiometer (Q7, REBS) and stored as half-hourly means by a data logger (CR10X, Campbell Scientific). A sonic anemometer (81000, Young) was used to measure three-dimensional wind velocities and air temperatures, and an enclosed infrared CO2∕H2O gas analyzer (LI-7200, LI-COR) was used to measure the molar fraction of CO2 and H2O. These data were sampled at a frequency of 10 Hz using an interface unit (LI-7550, LI-COR). Half-hourly CO2, heat, and momentum fluxes were calculated using Eddy Pro software (version 4.2.0, LI-COR), where double rotation (Kaimal and Finnigan, 1994) and block averaging were applied to fluctuation data in order to calculate covariance. We then corrected the effect of air density fluctuations on the flux values (Burba et al., 2012). Corrections were made for low-frequency losses (Moncrieff et al., 2004) and high-frequency losses for low-pass filtering (Ibrom et al., 2007) and sensor separation (Horst and Lenschow, 2009). All raw flux data were checked following the quality control program of Vickers and Mahrt (1997). Finally, we applied the quality check system proposed by Mauder and Foken (2006) and excluded data judged to be low quality (quality control flag of 2).
The total (one-sided) leaf area index (LAI) measured with a plant canopy analyzer (LAI-2200, LI-COR) was 4.3 and 3.6 m2 m−2 for October and November 2016, respectively. Vertical profiles of leaf area density (LAD) were provided in order to obtain the above values of total LAI after gamma function interpolation, with a maximum at a height of 15 m following Katata et al. (2013). LAI of the understory vegetation with 0.5 m height was given a typical value of 2.0 m2 m−2 in a Japanese forest (e.g., Sakai et al., 2006) due to a lack of observational data.
3.2 Boundary and initial conditions
The boundaries of each vegetation layer were set at heights of 0.05, 0.1, 0.2, 0.3, and 0.5 m (understory vegetation) and from 1 to 20 m (forest canopy) with an increment of 1 m. Atmospheric layers were extended from the 20 m canopy to 30 m with an increment of 1 m. Half-hourly data for precipitation, atmospheric pressure, horizontal wind speed, air temperature and humidity, and incoming longwave and shortwave radiation were applied to the top atmospheric layer. Inorganic mass concentrations of gases (SO2, NH3, HNO3, and HCl) and PM2.5 particles (, , , Na+, Cl−, Ca2+, K+, and Mg2+) measured by a filter pack were linearly interpolated at half-hourly timescales. For the Aitken mode, inorganic mass concentrations were assumed to be one tenth of those of the fine mode, based on size-resolved number concentrations from ELPI+ observations (not shown). The boundaries of the soil layers were at depths of 0.02, 0.05, 0.1, 0.2, 0.5, 1.0, and 2.0 m. Constant values for soil temperature (15 ∘C) and saturated volumetric water content for typical loam soil texture (0.43 m3 m−3) were used. The model setup and parameters are given in Supplement Table S1.
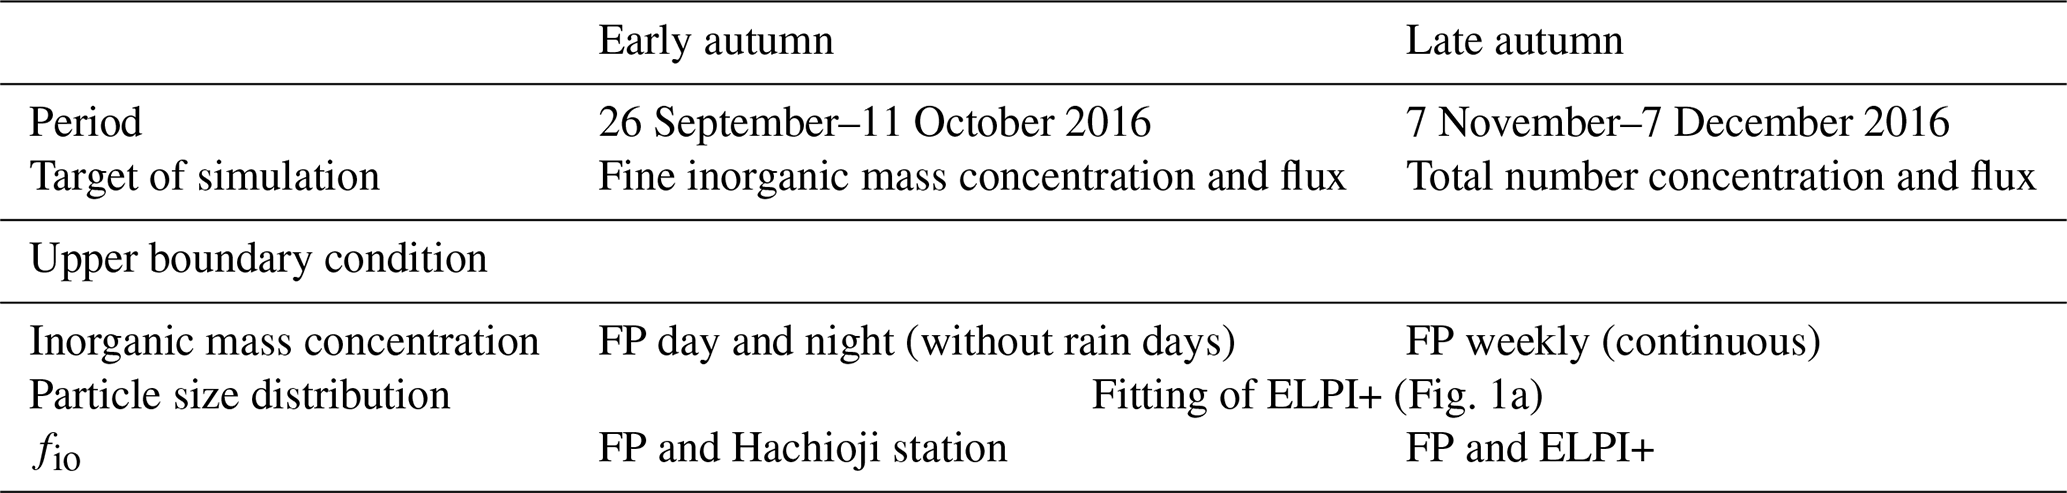
The boundary conditions and input data used in the setup of the simulation are summarized in Table 1. Lognormal parameter sets of (Dg3, σg) for fine and Aitken modes at the upper boundary condition were respectively set at (0.089 µm, 2.1) and (0.26 µm, 2.0) based on manual fitting of ELPI+ measurements at a height of 30 m (Fig. 1a). These parameter sets were applied to the early- and late-autumn periods. In order to simulate the vertical profiles of the total number concentration within the canopy, the volume fraction of inorganic compounds, fio, was given by the data of total inorganic mass and total number concentration. For the late-autumn period, temporal changes in weekly fio values in both the fine and Aitken modes was shown by data from filter-pack and ELPI+ measurements. However, for the early-autumn period, ELPI+ measurements were unavailable as described above. Consequently, temporal changes in fio (Fig. 1b) were set based on both filter-pack data at the study site and total PM2.5 mass concentrations observed at the nearest air quality monitoring station at Hachioji (3 km west-northwest of the study site). For both periods, fio values for the Aitken mode were assumed to be equal to the fine mode, since no observational data were available.
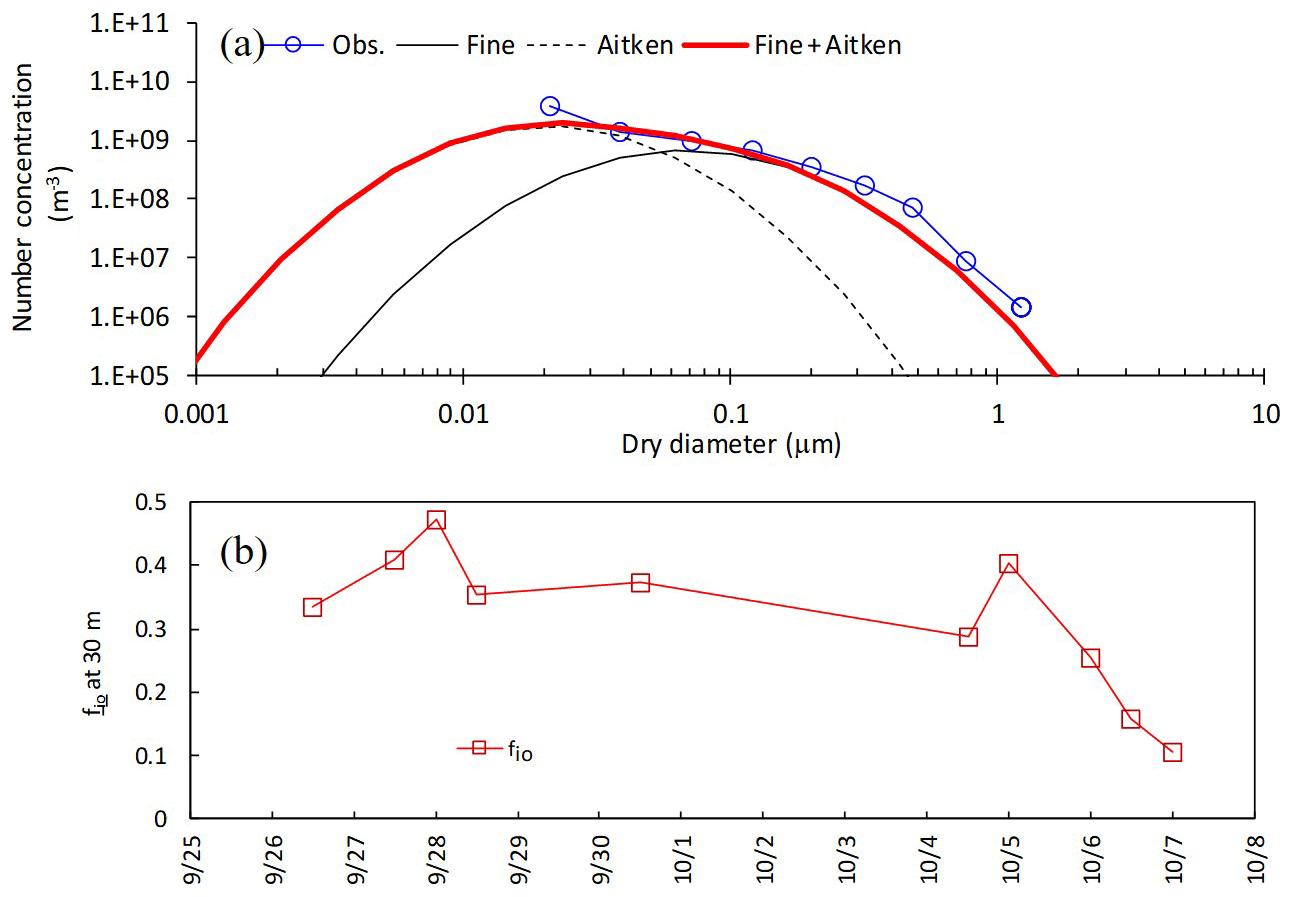
Figure 1(a) Modeled and observed number-based size distribution of particles at 10:00 on 7 November 2016. (b) Temporal changes in the volume fraction of inorganic compounds (fio) for the early-autumn period. Please note that the date is given on the x axis in the month/day format.
Table 1Summary of input data, initial conditions, and boundary conditions for the SOLVEG simulation setup. FP: filter-pack measurements; ELPI+: ELPI+ measurements; fio: volume fraction of inorganic compounds. It should be noted that the gaps between FP in rain days of the early-autumn period were linearly interpolated for simulations.
Since no data were available at the study site for emission potentials of NH3 at the ground surface (χg) and stomata (χs), we used typical values of Γg=300 (Massad et al., 2010) and Γs=2000 (Neirynck and Ceulemans, 2008).
Our simulation used basic and less time-resolved datasets for a first application of the model to the NH4NO3 gas–particle conversion and aerosol water uptake of reactive nitrogen compounds. The uncertainties associated with input data described above, such as number concentration and particle size distribution, should be improved in the future.
3.3 Simulation scenarios
To reveal the impacts of NH4NO3 gas–particle conversion and hygroscopic growth, the following four simulation scenarios were adopted: (1) NH4NO3 gas–particle conversion and aerosol water uptake (“gpc” scenario); (2) aerosol water uptake but no NH4NO3 gas–particle conversion (“no gpc” scenario); (3) NH4NO3 gas–particle conversion but no aerosol water uptake (“gpc dry” scenario); and (4) no NH4NO3 gas–particle conversion and no aerosol water uptake (“no gpc dry” scenario). Calculations in all scenarios were compared with observations of vertical profiles of the total number and inorganic mass concentrations within and above the canopy.
4.1 Micrometeorology during autumn 2016
Temporal changes in friction velocity (u*), net radiation (Rnet), and sensible (H) and latent heat (LE), and CO2 fluxes over the canopy for the early-autumn and the late-autumn periods are shown in Figs. 2 and 3, respectively. Overall, the modeled momentum and heat fluxes agreed with observed values, although observed high friction velocities in November and December 2016 were slightly underestimated (Fig. 3a). Water vapor and CO2 exchange processes determining the level of stomatal uptake of gases were also reproduced well by the model (Figs. 2c, e and 3c, e).

Figure 2Temporal changes in observed and simulated (a) friction velocity, (b) net radiation, (c) sensible and (d) latent heat, and (e) CO2 fluxes from 27 September to 11 October 2016. Please note that the date is given on the x axis in the month/day format.
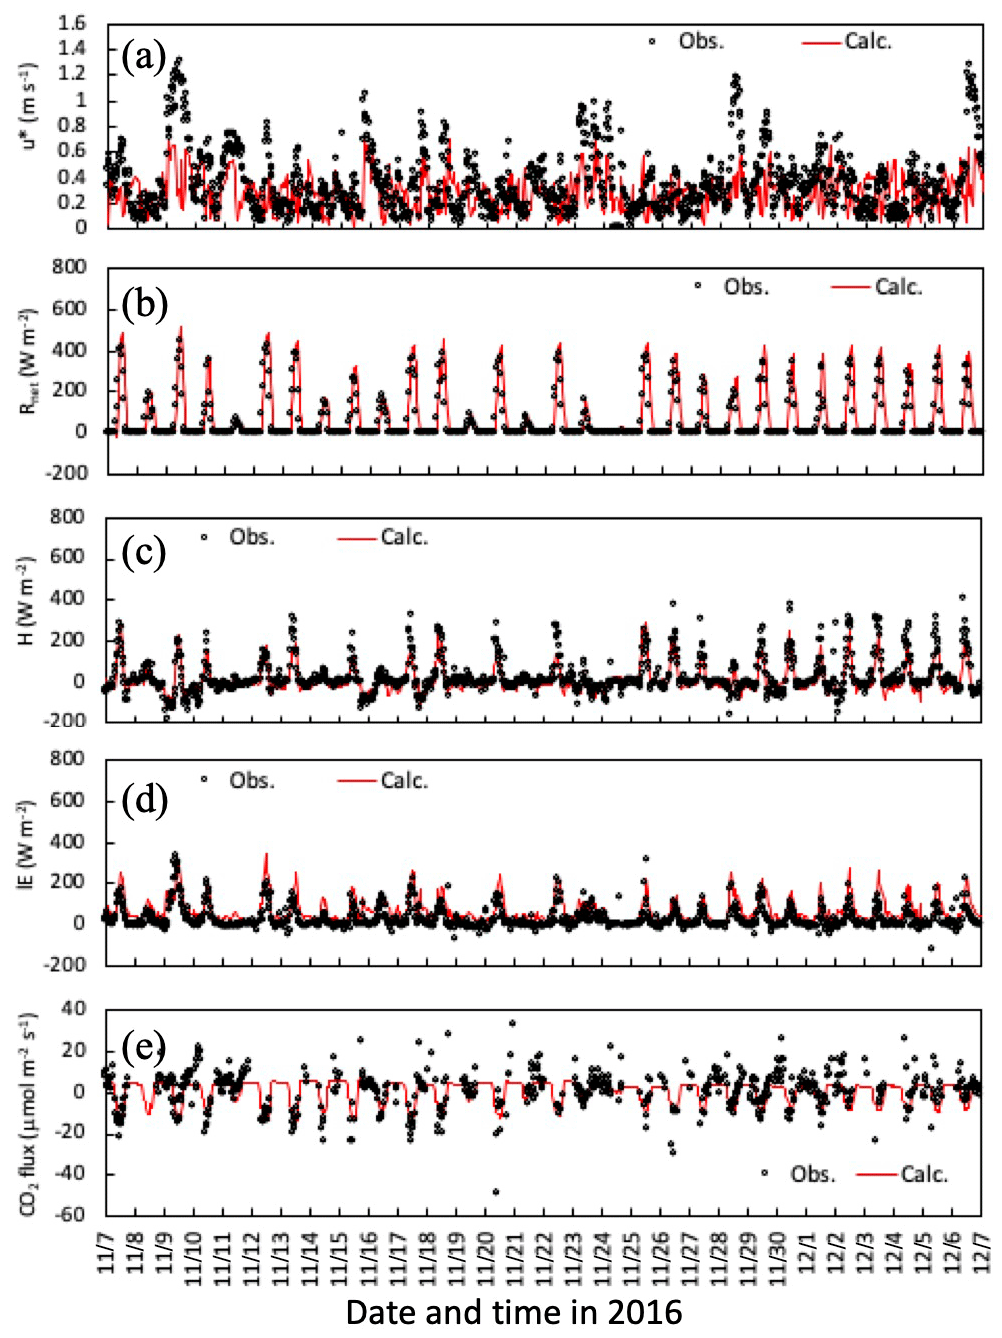
Figure 3Temporal changes in observed and simulated (a) friction velocity, (b) net radiation, and (c) sensible and (d) latent heat, and (e) CO2 fluxes from 7 November to 6 December 2016. Please note that the date is given on the x axis in the month/day format.
Figures 4 and 5 illustrate time series of horizontal wind speed, air temperature, and relative humidity under the canopy in both simulation periods. Wind speed was underestimated within the forest, as was friction velocity (Fig. 3a and d), probably due to horizontal advection over hilly terrain (Matsuda et al., 2015). For calculated air temperature and humidity, the primary determinants of ambient conditions of gas–particle conversion and aerosol hygroscopic growth, calculated temporal changes were similar to observations within the canopy (Figs. 3b, c and 4b, c). These features were also noted in mean vertical profiles during both daytime and nighttime in the early-autumn period (Fig. S1).
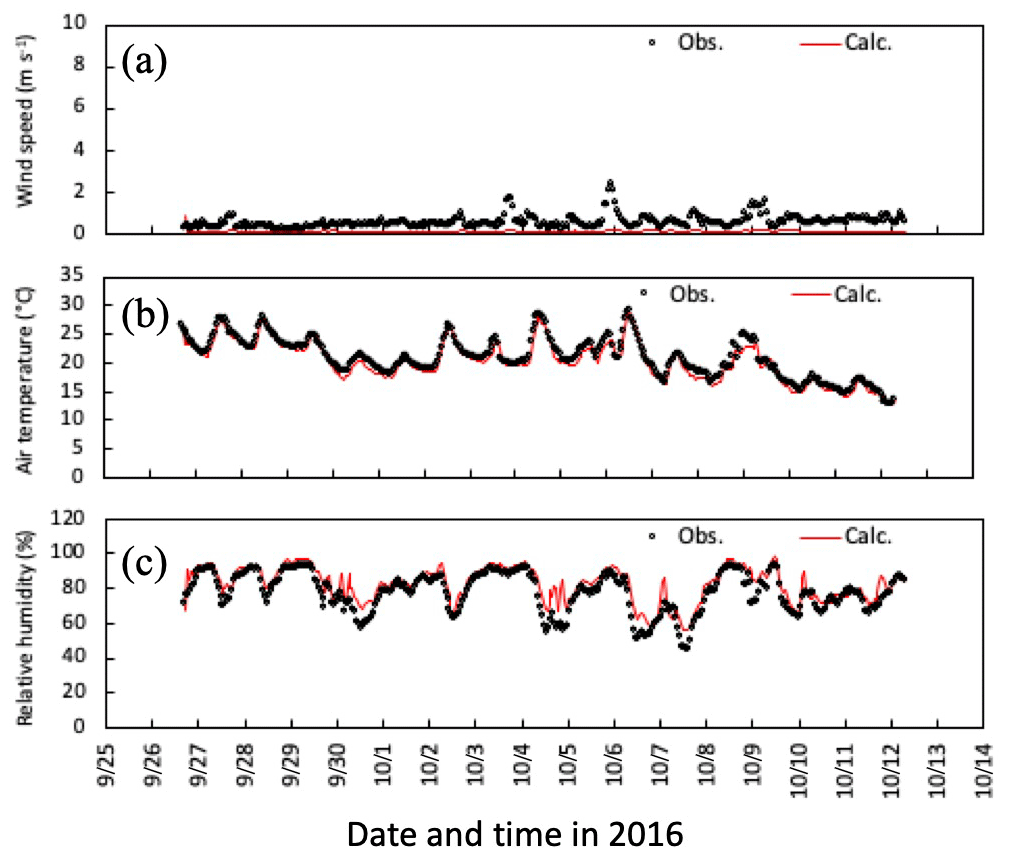
Figure 4Temporal changes in observed and simulated (a) horizontal wind speed, (b) air temperature, and (c) relative humidity at 6 m height from 27 September to 11 October 2016. Please note that the date is given on the x axis in the month/day format.
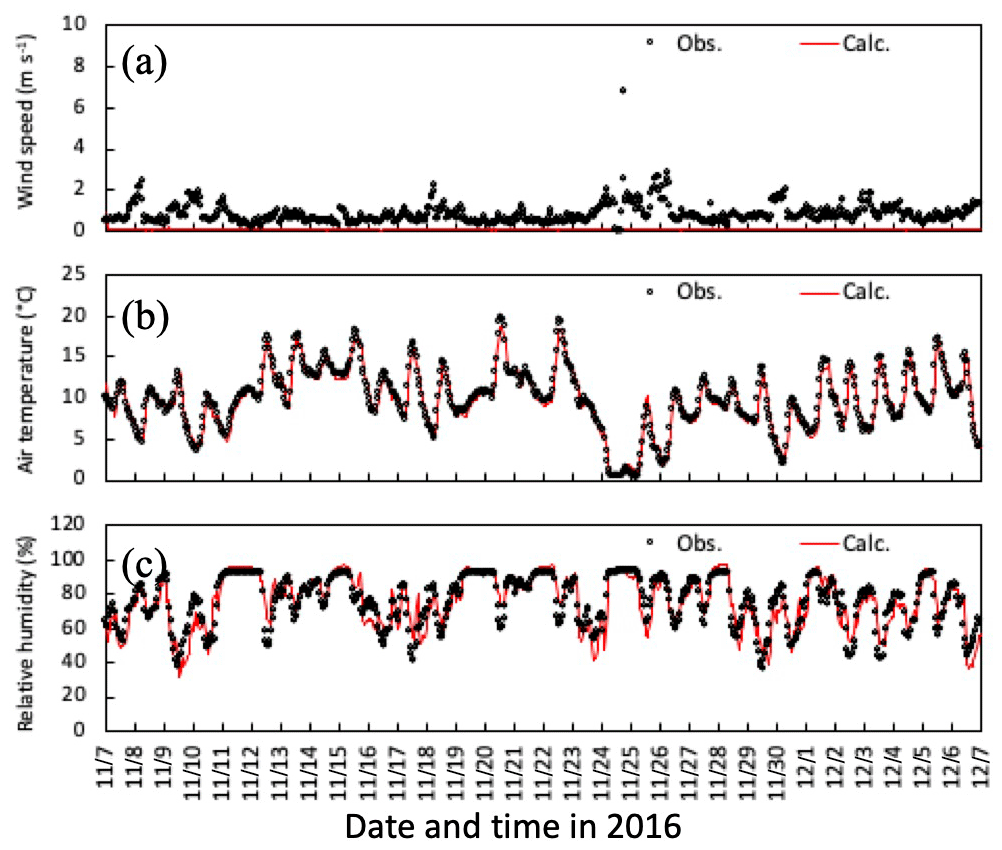
Figure 5Temporal changes in observed and simulated (a) horizontal wind speed, (b) air temperature, and (c) relative humidity at 6 m height from 7 November to 6 December 2016. Please note that the date is given on the x axis in the month/day format.
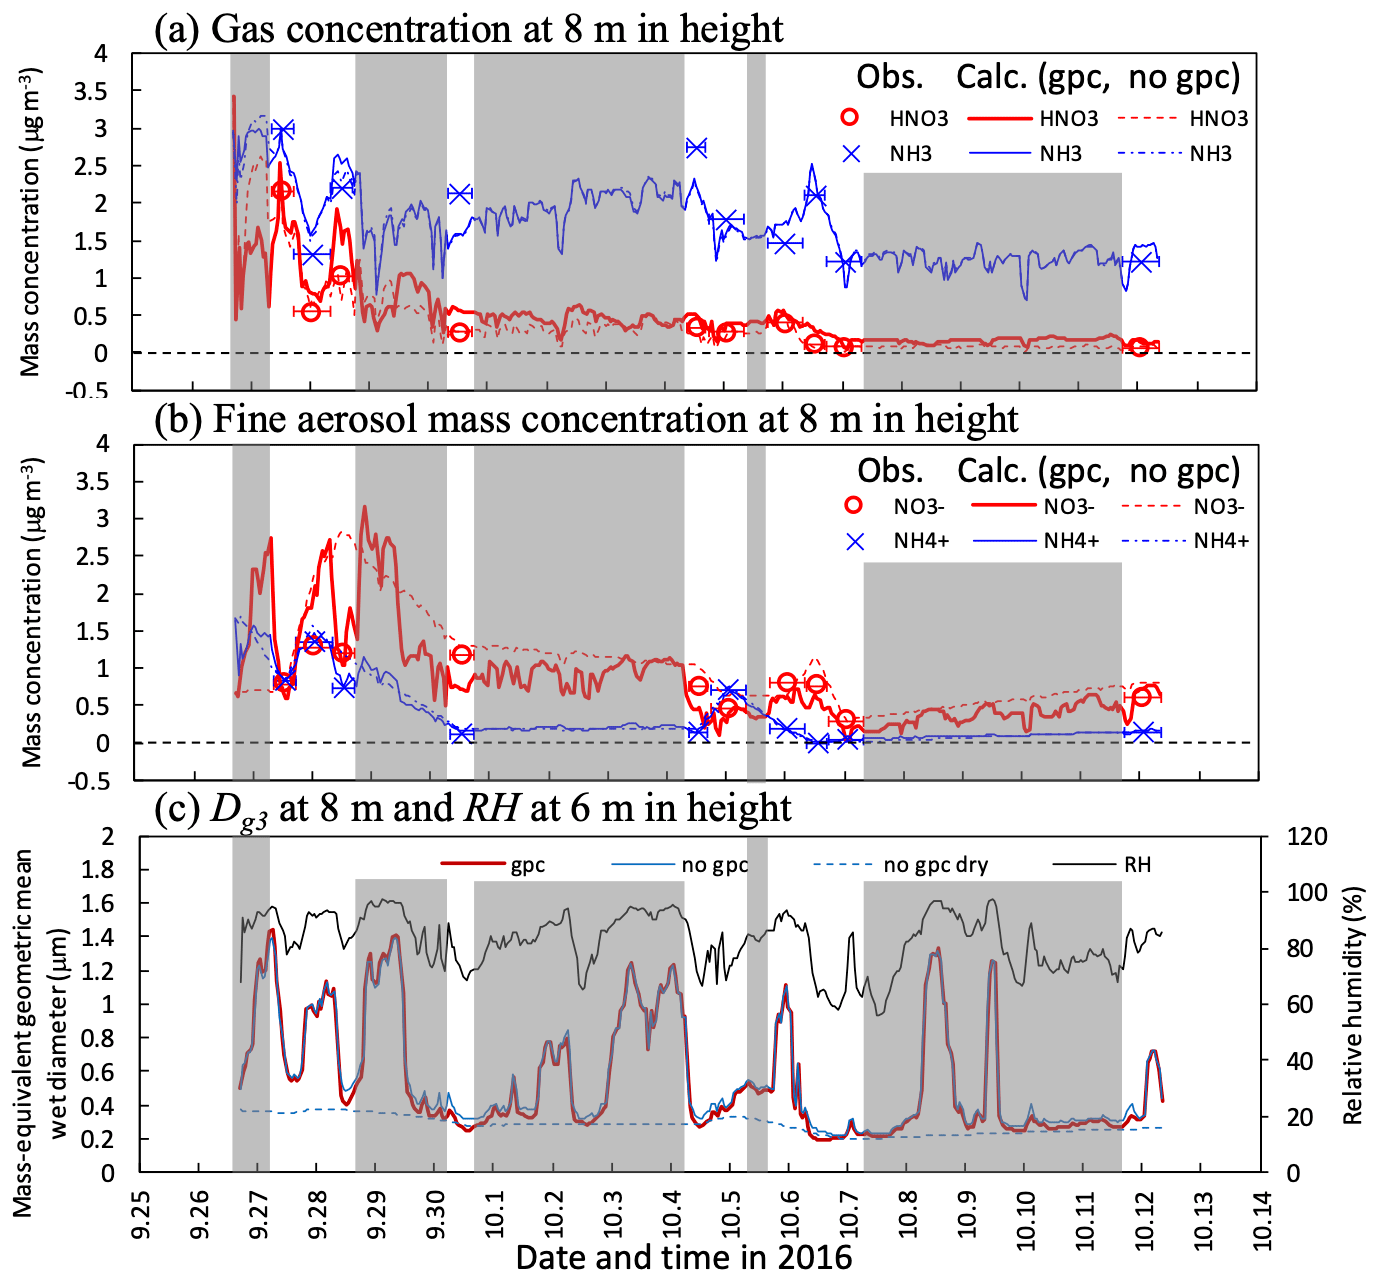
Figure 6Temporal changes in observed and calculated mass concentrations of (a) HNO3 and NH3 gases and (b) and fine particles and mass-equivalent geometric mean wet diameter (Dg3) at 8 m height from 27 September to 11 October 2016. Calculations for three scenarios (gpc, no gpc, and no gpc dry; see main text for details) are plotted in the figure. The relative humidity (RH) calculated at 6 m height in Fig. 3c also appears in (c). Grey-shaded areas represent periods of rainfalls during which no filter-pack data are available. Please note that the date is given on the x axis in the month/day format.
4.2 Inorganic mass concentration and flux in early autumn 2016
Figure 6a and b shows time series for observed and calculated major inorganic nitrogen compounds (HNO3 and NH3 gases and and fine particles) under the canopy in the early-autumn period. Substantial differences were observed between the scenarios of gpc and no gpc for HNO3 and fine- concentrations during the daytime on 28 September. In the gpc scenario, HNO3 concentrations were increased due to the evaporation of NH4NO3 during the daytime, whereas concentrations were decreased. Consequently, strong variations in mass concentration were reproduced in the gpc scenario. A lesser impact of evaporation due to NH4NO3 on both NH3 and fine- concentrations was observed.
The calculated fine-mode mass-based wet diameter (Dg3) and RH are shown in Fig. 6c. Hygroscopic growth has a significant impact, reflecting in particle size distribution differences between the scenarios of no gpc and no gpc dry; e.g., Dg3 values in the latter were 1.4 µm higher than those in the former at 0.4 µm during the nighttime on 29 September 2016. Although this process also influences size distribution during the daytime, a competing shrinkage mechanism, NH4NO3 evaporation, appeared in the gpc scenario. As a result, the difference in daytime Dg3 between the scenarios of gpc and no gpc was up to 0.12 µm on 28 September.

Figure 7Mean vertical profiles in (a) observed and (b) calculated normalized mass concentration in the scenario of no gpc and (c) the scenario of gpc for HNO3 and NH3 gases and , , and fine particles (a–c) during the daytime and (d–f) nighttime between 27 September and 11 October 2016.
Figure 7 depicts vertical profiles of normalized gaseous and particulate mass concentrations in the early-autumn period. The profiles averaged for the sampling periods were compared with observed profiles. In the scenario of no gpc (Fig. 7b), vertical gradients in fine-particle compounds (, , and ) were similar, since the same equation for collection efficiency (Eq. 8) was used for all inorganic particle compounds. In contrast, vertical gradients of and concentrations drastically increased due to NH4NO3 evaporation in the gpc scenario (Fig. 7c and f), producing gradients similar to those observed (Fig. 7a and d). This feature was also visible in vertical profiles of mass flux for all inorganic nitrogen components during the daytime (Fig. S2). The impact of NH4NO3 evaporation was smaller during nighttime (Fig. 7c) than daytime (Fig. 7f), which also aligns with observed diurnal patterns (Fig. 7a and d). High values of observed fine- concentration were calculated in both scenarios (Fig. 7a–c).
Figure 8 shows the time series for the calculated apparent mass flux of HNO3, NH3, and fine and over the canopy in both the scenarios of gpc and no gpc. The actual deposition flux of each component (ecosystem flux) is shown for comparison with apparent flux. The impact of NH4NO3 evaporation on fluxes was the highest from 26 to 29 September. The calculated flux above the canopy was positive during the nighttime for several days (Fig. 8c) due to the condensation of HNO3 (Fig. 8a). As for in-canopy NH3 concentrations (Figs. 6 and 7), NH4NO3 evaporation has less impact on NH3 flux than on other species (Fig. 8b).
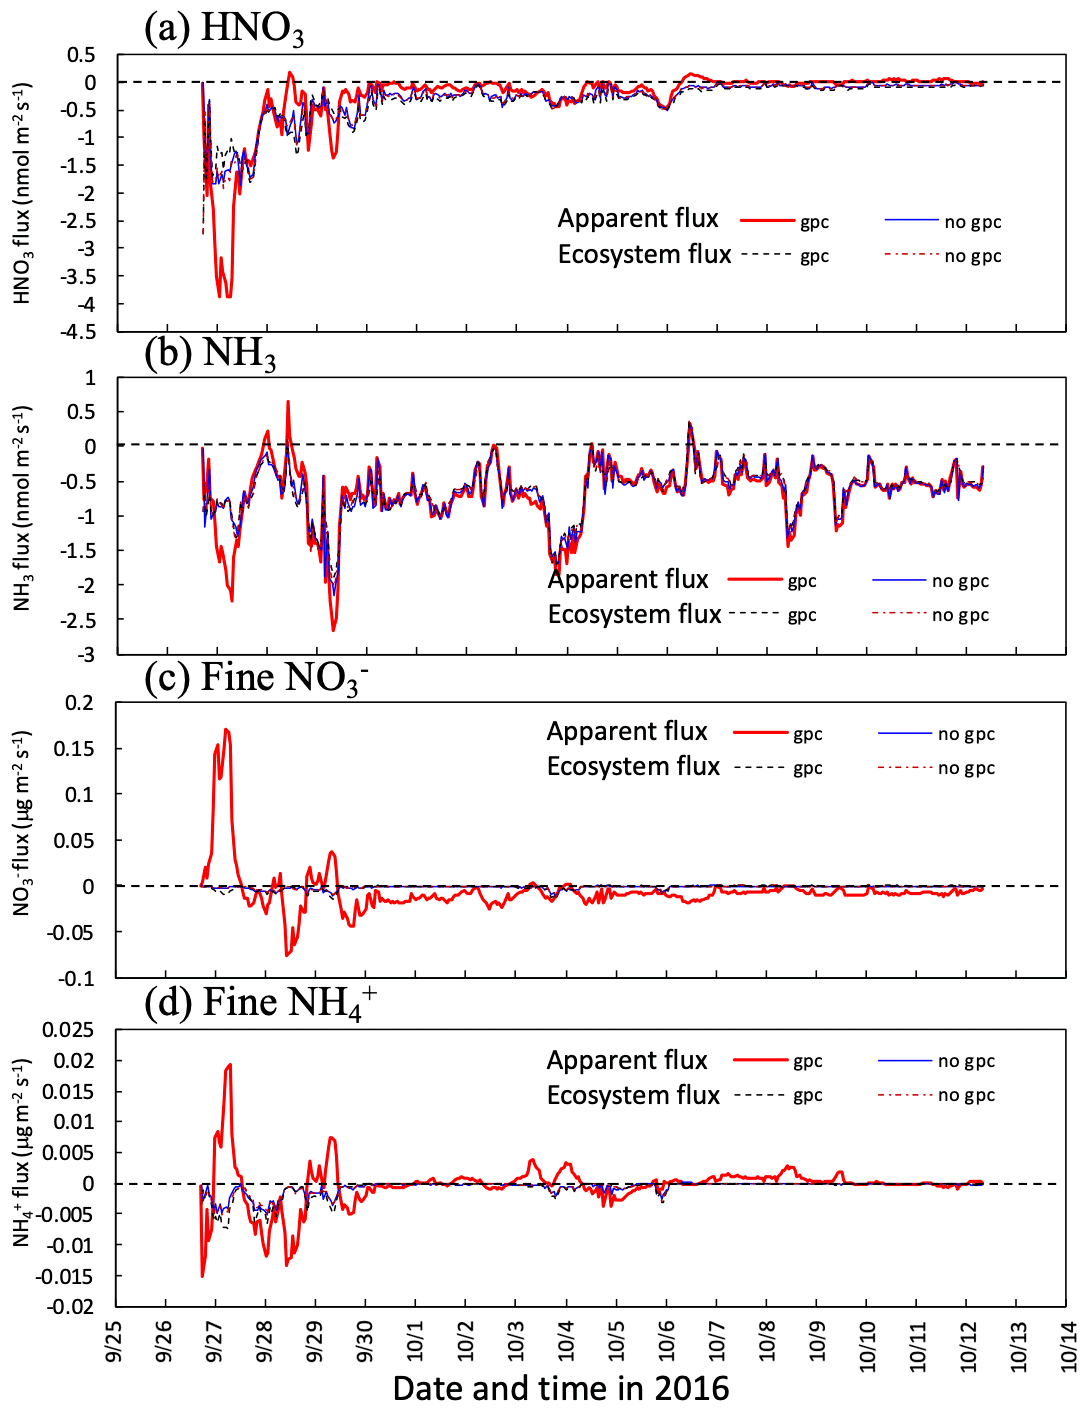
Figure 8Temporal changes in calculated apparent mass flux of (a) HNO3 gas and (b) and fine particles at 30 m height in two scenarios (gpc and no gpc) between 27 September and 11 October 2016. Fluxes captured by forest (ecosystem flux) are also plotted in the figure. Please note that the date is given on the x axis in the month/day format.
4.3 Particle size distribution in late autumn 2016
Figure 9 shows the time series for number concentration within the canopy in the late-autumn period, together with parameters for the lognormal size distribution of the fine mode. Initial number concentration values on 7 November (Fig. 9a) were tuned via adjustments of the ratio of inorganic compounds (fio) for each mode. Below-canopy Dg3 and σg were smaller in gpc dry than in no gpc dry due to NH4NO3 evaporation (Fig. 9b and d), whereas below-canopy Dg0 was larger in gpc dry than in no gpc dry (Fig. 9c). For the scenarios of gpc and no gpc in which aerosol water was considered, Dg3 increased due to hygroscopic growth, although the influence of NH4NO3 gas–particle conversion on Dg3 was still apparent (Fig. 9b). Some discrepancies between observations and calculations were found after 25 November 2016 with respect to temporal changes in number concentration (Fig. 9a).
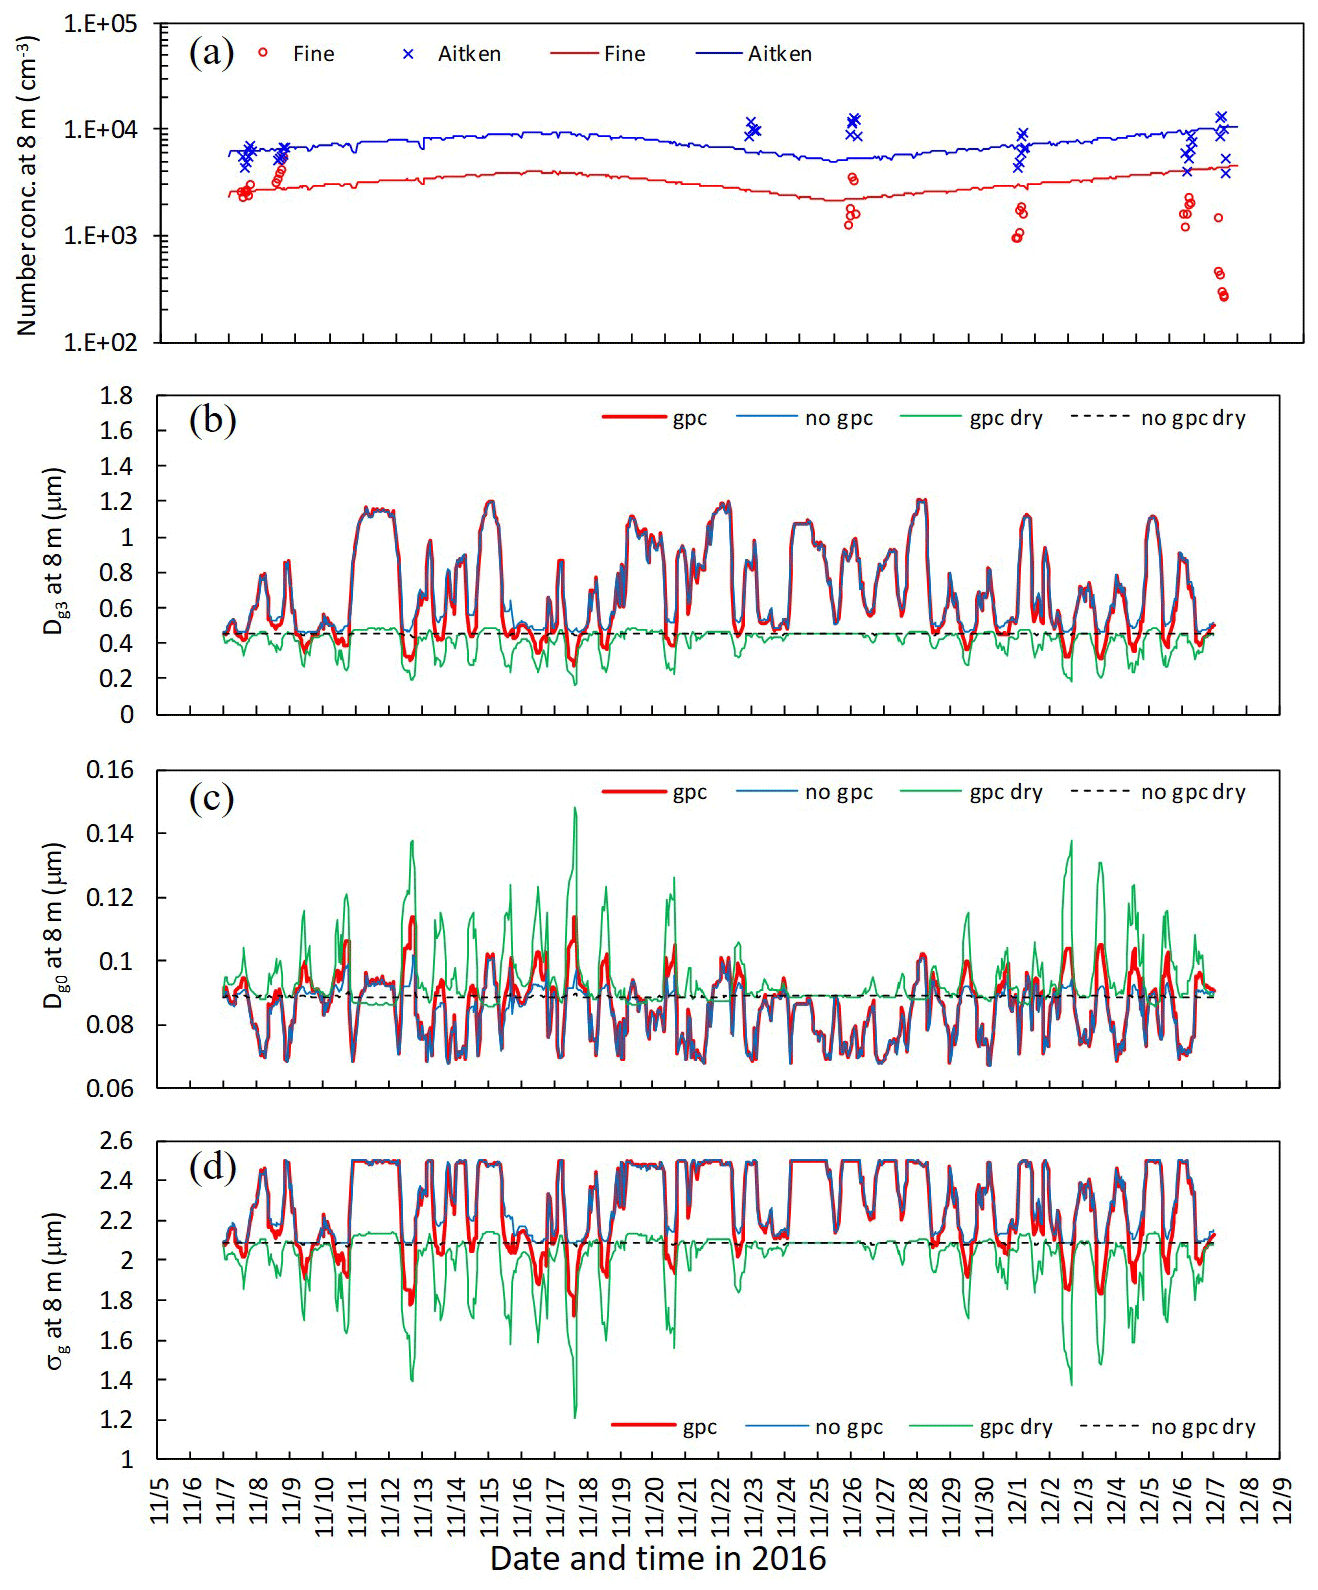
Figure 9Temporal changes in (a) observed and calculated number concentration of fine and Aitken modes, (b) calculated mass-equivalent (Dg3), (c) number-equivalent geometric mean wet diameter (Dg0), and (d) standard deviation (σg) of fine particles at 8 m height from 7 November to 7 December 2016. Calculations for four scenarios (gpc, no gpc, gpc dry, and no gpc dry) are plotted in the figure. Please note that the date is given on the x axis in the month/day format.
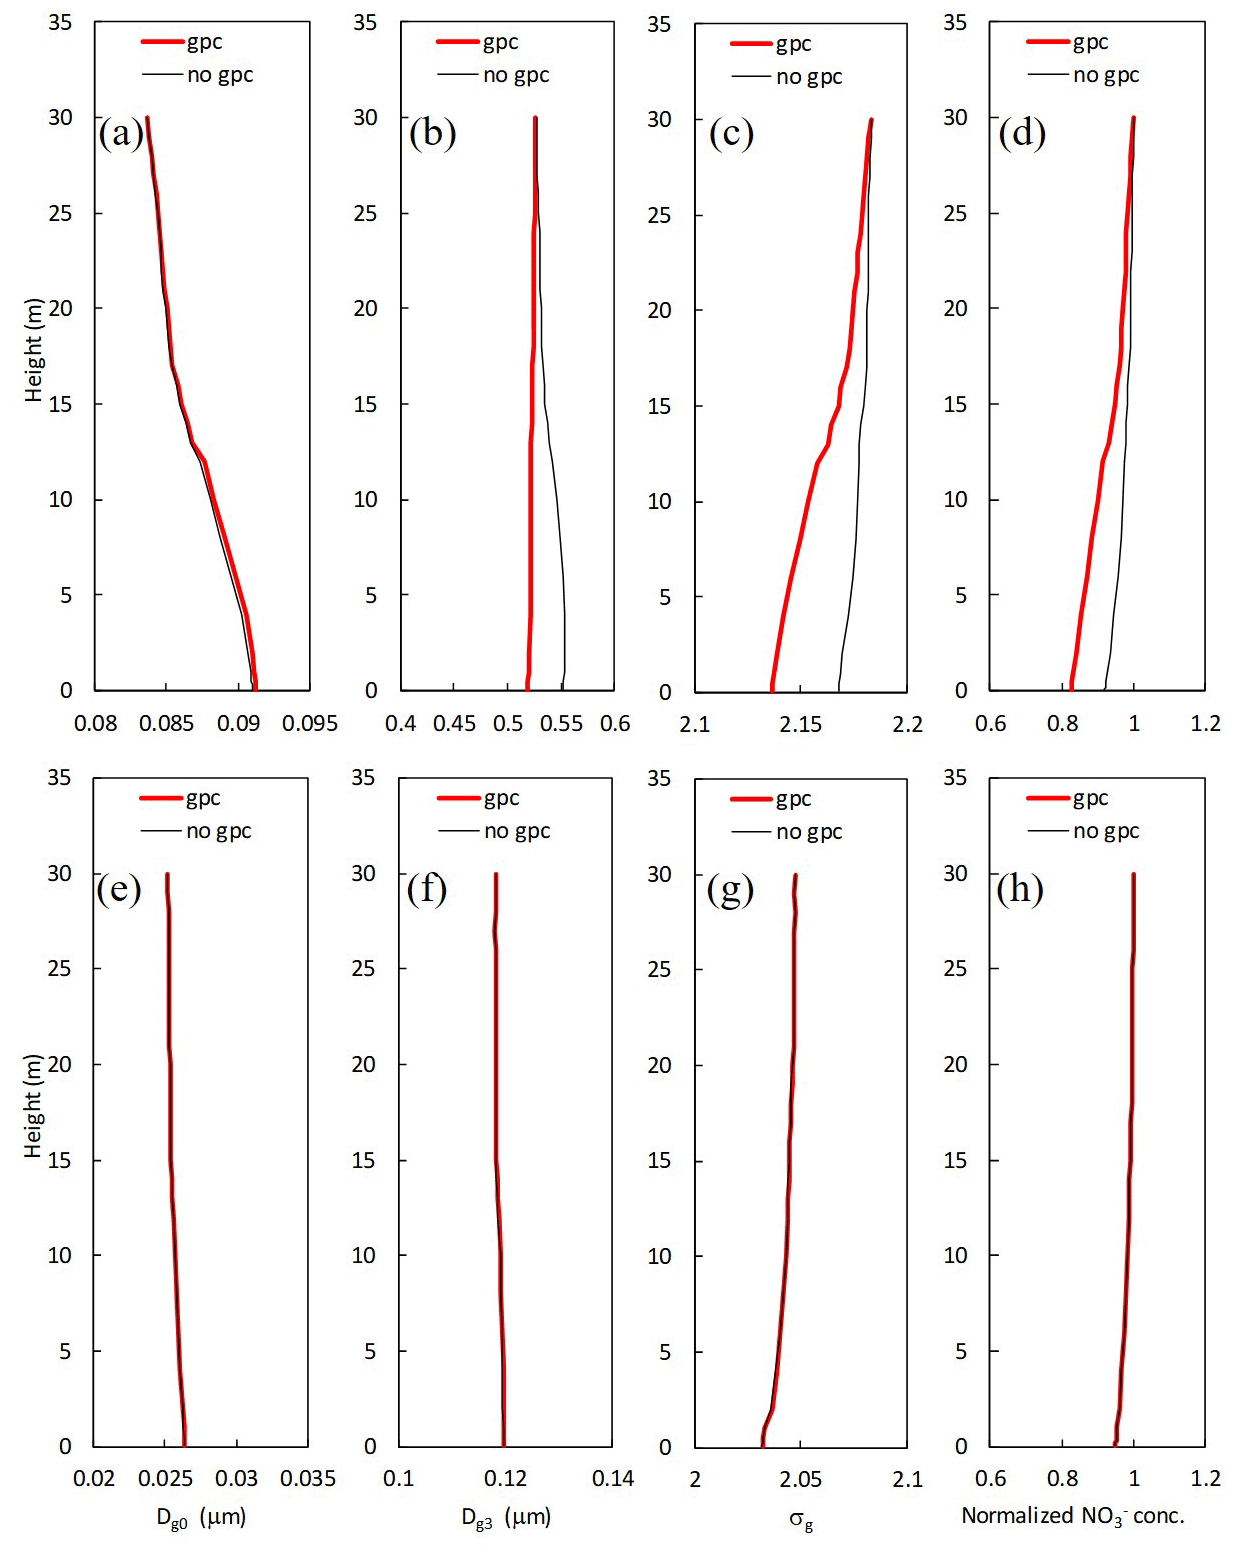
Figure 10Mean vertical profiles for calculated (a, e) number-equivalent (Dg0) and (b, f) mass-equivalent geometric mean wet diameter (Dg3), (c, g) standard deviation (σg), and (d, h) normalized mass concentration of for (a–d) fine and (e–h) Aitken modes in two scenarios (gpc and no gpc) from 7 November to 7 December 2016.
Figure 10 shows vertical profiles of parameters for the lognormal size distribution and normalized mass concentration in the scenarios of no gpc and gpc. For fine particles, the values of Dg3 and normalized concentrations at 8 m were respectively 5.1 % and 8.9 % smaller in the scenario of gpc than in the scenario of no gpc due to the evaporation of NH4NO3 (Fig. 10b and d), and the calculated σg was also 1.2 % smaller (Fig. 10c). In contrast, calculated Dg0 slightly increased by 0.3 % at the same height (Fig. 10a). Almost no effect of NH4NO3 gas–particle conversion was found in the Aitken mode (Fig. 10e–h).
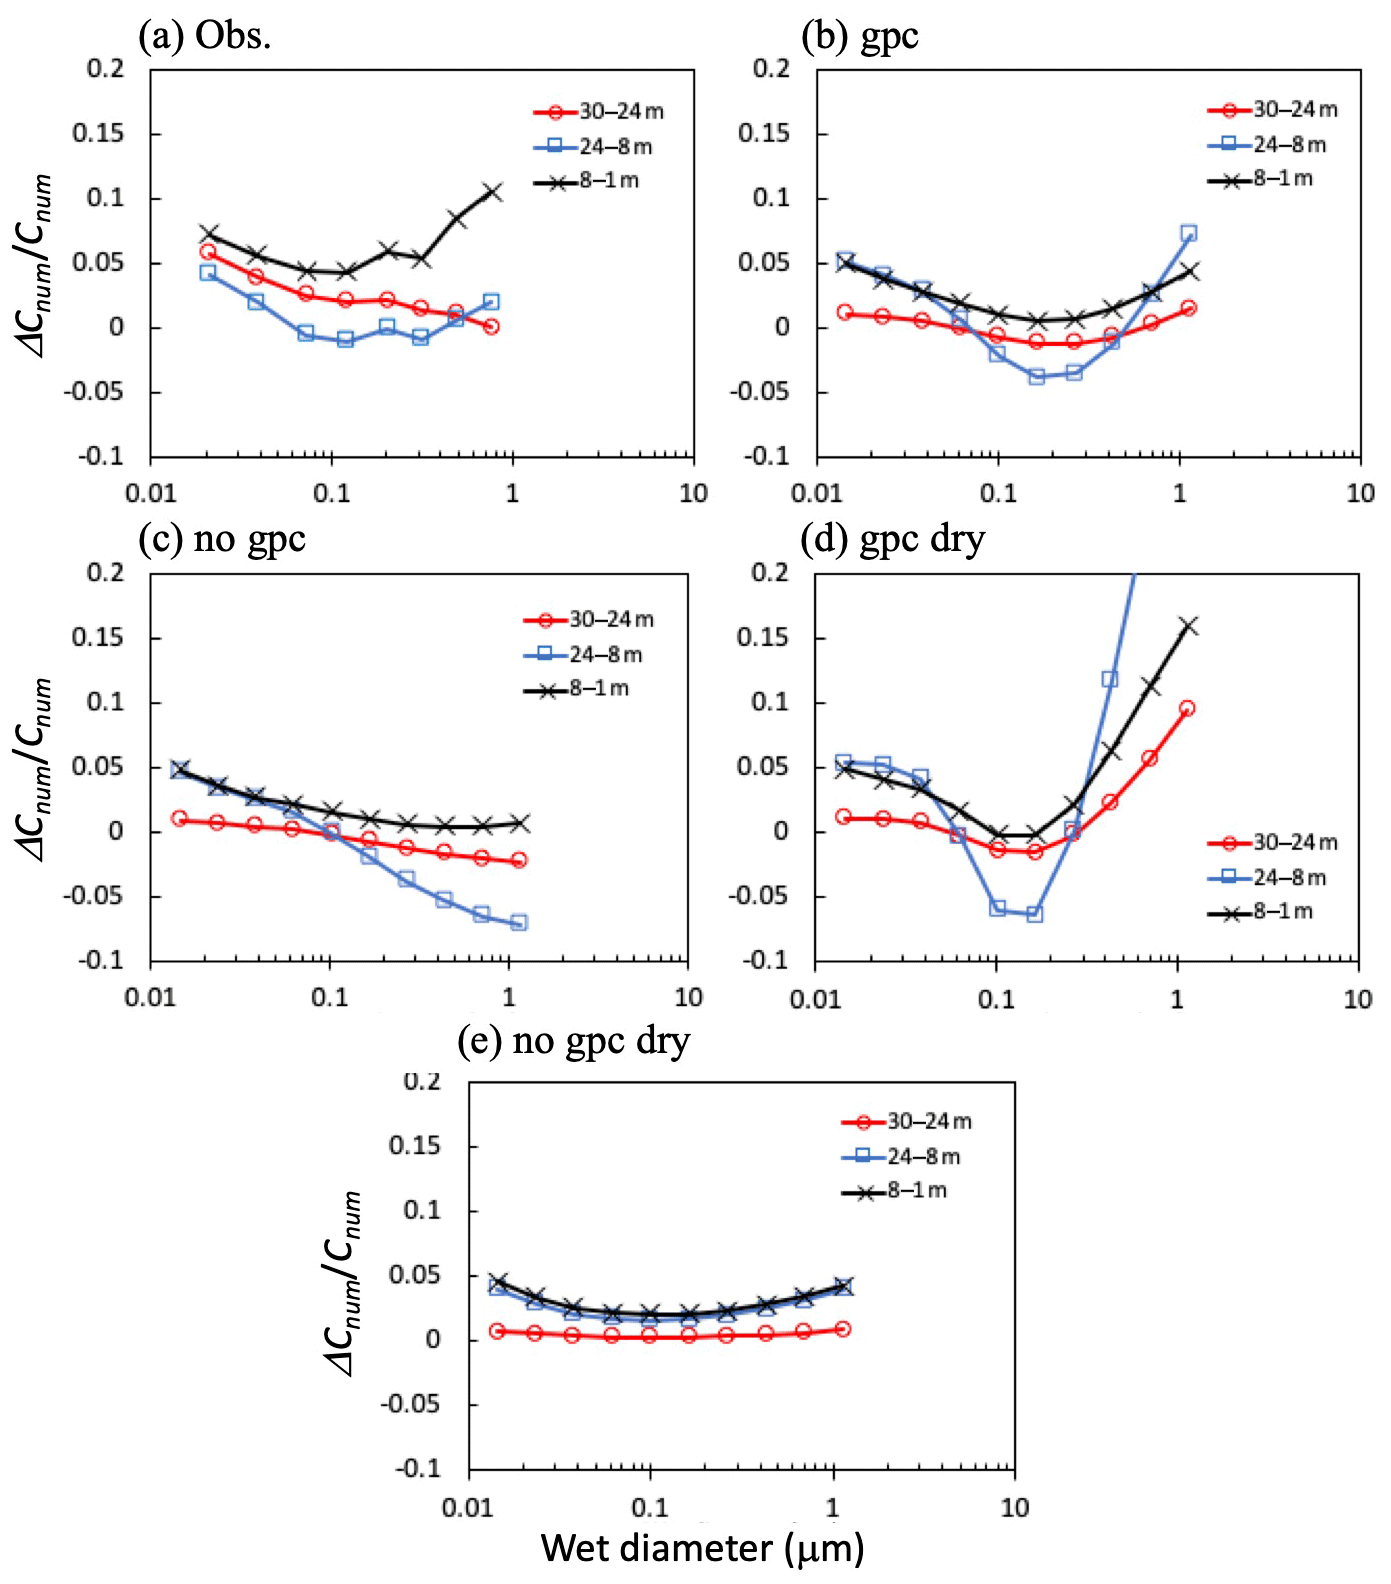
Figure 11Differences (ΔCnum) in (a) observed and (b–e) calculated mean total number concentrations (Cnum) between height pairs for 11:00–17:00 on 7, 8, 25, and 30 November 2016. Four calculation scenarios are presented in the figure: (b) gpc, (c) no gpc, (d) gpc dry, and (e) no gpc dry.
Figure 11 shows differences in the total number concentration for the regions above, within, and below the canopy during the daytime in the late-autumn period, with particular reference to the differences among these concentrations. In the submicrometer size range (0.1–0.4 µm), differences between height pairs were strongest between 8 and 1 m (below), between 30 and 24 m (above), and between 24 and 8 m (within the canopy). In the scenario of no gpc dry, the difference in number concentration between height pairs was minimal in the submicrometer size range, as determined by modeled size-resolved dry-deposition velocity (Fig. 11e). Similar results have been demonstrated by past numerical studies of size-resolved particle number flux (Ryder, 2010); for a particle diameter around 0.15 µm, the apparent flux switches from deposition to emission within the canopy and approximately reflects the peak in number size distribution. Furthermore, apparent emission fluxes were represented as more particles shrink into a given size bin from the next larger size bin than leave to the next smaller size bin, whereas more particles shrink out of a given size bin than shrink into it from the next larger size bin, resulting in apparent fast deposition (Ryder, 2010). In the gpc scenario (Fig. 11a–d), particles in the fine mode shrunk in this size range due to in-canopy NH4NO3 evaporation, resulting in an apparent tendency to emit from the canopy to the air above (Fig. 11d). Meanwhile, differences in number concentrations between 24 and 8 m (within the canopy) for large particles (>0.3 µm) were excessively high in the gpc scenario compared to observational data. In the scenario of no gpc, in which only aerosol water uptake was considered (Fig. 11c), fine-particle sizes increased due to hygroscopic growth (Fig. 10), and the concentration differences between height pairs always remained positive in this range. Finally, in the gpc scenario where both NH4NO3 evaporation and hygroscopic growth processes are considered (Fig. 11b), calculated negative gradients of number concentration appeared between 24 and 8 m (within the canopy) for the submicrometer range of 0.1–0.4 µm, again similar to observed patterns (Fig. 11a).
5.1 Uncertainties in observation and model results
SOLVEG reproduced the general features of gas concentration, fine-particle mass, and fine-particle number concentration observed within the canopy. Several uncertainties (e.g., low time resolution of weekly filter-pack data in the late-autumn period, initialization of measurement uncertainty, and complex topography of the study site) may cause underestimations in calculated wind speed (Figs. 3a and 4a) and overestimations in total number concentration within the canopy after 25 November 2016 (Fig. 9a). In Fig. 8, the conditions for NH4NO3 condensation were calculated for the studied forest, although these conditions are normally found over strong sources of NH3 (e.g., Nemitz et al., 2009). Thus, the results of this study should be considered a first test of the model to the NH4NO3 gas–particle conversion and aerosol water uptake of reactive nitrogen compounds, rather than a conclusive assessment of its capability.
Another uncertainty in the results could be associated with the assumption of the same composition in size at the initial and boundary conditions. Variations of chemical composition in size cause variations in equilibrium vapor pressure at the particle surface due to Kelvin and Raoult effects, due to uncertainty in the simulation of the swelling and shrinking of particles. Since we used a modal aerosol dynamics method, the differences of these effects within each mode cannot be resolved. It is necessary to revisit this issue in the future using size-resolved composition measurements and size-resolved aerosol models, as done by Ryder (2010), to assess this uncertainty.
Concerning potential shortcomings in the modeling aspect, particle growth due to biogenic secondary organics was not considered and might increase uncertainty in model results. Although this effect might not be important for the dry-deposition and evaporation processes that formed the main focus of this study, this effect certainly influences particle mass flux in the forest itself. Nevertheless, the order of the magnitude of observed normalized inorganic mass concentration within the canopy during the daytime, i.e., > NH3 > > > HNO3 (Fig. 7a), was well reproduced by the gpc scenario of the model (Fig. 7c). For the late-autumn period, while there is no direct measurement of aerosol water content, the ambient RH profile to determine hygroscopic aerosol growth was reproduced (Figs. 4c and 5c). As a result, the observed in-canopy negative gradient in number concentration (i.e., apparent emission of particles) in the 0.1–0.4 µm size range was simulated in the gpc scenario (Fig. 11a and b). These results indicate that the model developed can be effectively used to address the impact of aerosol dynamics on dry-deposition processes.
5.2 Formation mechanisms of particle size distributions
The complex form of the particle size distributions can mainly be explained by a combination of the (1) effects of in-canopy NH4NO3 evaporation of small particles and (2) fine-mode hygroscopic growth of large particles. Observed vertical gradients of size-resolved number concentrations within the canopy were reproduced only in the gpc scenario (Fig. 11b). Other scenarios showed different tendencies as follows (Fig. 11c–e). When only dry-deposition processes were considered (Fig. 11e), number concentrations above the canopy were always larger than those within the canopy. Although the sharp negative gradient of number concentration between height pairs was computed for the 0.1–0.4 µm size range, the addition of gas–particle conversion processes to the model (Fig. 11d) caused positive gradients for large particles (>0.2 µm) to take on excessively high values compared to observational data. The number concentration of such large particles increased within the canopy due to hygroscopic growth (Fig. 11d and e), resulting in a negative gradient from the air above the canopy to the air within the canopy.
5.3 Impacts of gas–particle conversion and aerosol dynamics on dry deposition
To quantify the impact of gas–particle conversion of NH4NO3 on fine- flux above the canopy, we plotted the respective ratios of HNO3, , and fluxes over the canopy in the scenario of gpc (Fgpc) to those in the scenario of no gpc (Fnogpc), plotting each such ratio against RH at the top of the canopy in the early-autumn period (Fig. 12). In this study, since the water uptake of aerosols, typically represented as the hygroscopic growth factor defined as the ratio between humidified and dry particle diameters, is almost negligible under RH < approximately 80 % and increases at values over RH >80 % (e.g., Fig. 6 in Katata et al., 2014), we defined a threshold of 80 % for high- and low-RH conditions. As shown in Fig. 12b, the gas–particle conversion of HNO3 and shifted toward the particle phase under high-RH conditions. Conversely, under low-RH conditions (<80 %), most Fgpc∕Fnogpc ratios were higher than unity for fine- concentrations (Fig. 12b and e). The impact of NH4NO3 evaporation on the fine- flux was very strong, i.e., just below the deliquescence relative humidity (DRH) of pure NH4NO3 (61.8 %). The value of the Fgpc∕Fnogpc ratio also reached ∼40 around RH =50 % (Fig. 12b). Notably, the thermodynamic equilibrium model in SOLVEG calculates the mutual DRH, which should not be pure NH4NO3 particles. Such high values of (apparent) flux have also been observed in various forest types in Europe (Nemitz, 2015). These cases may be also affected by NH4NO3 evaporation near the surface.
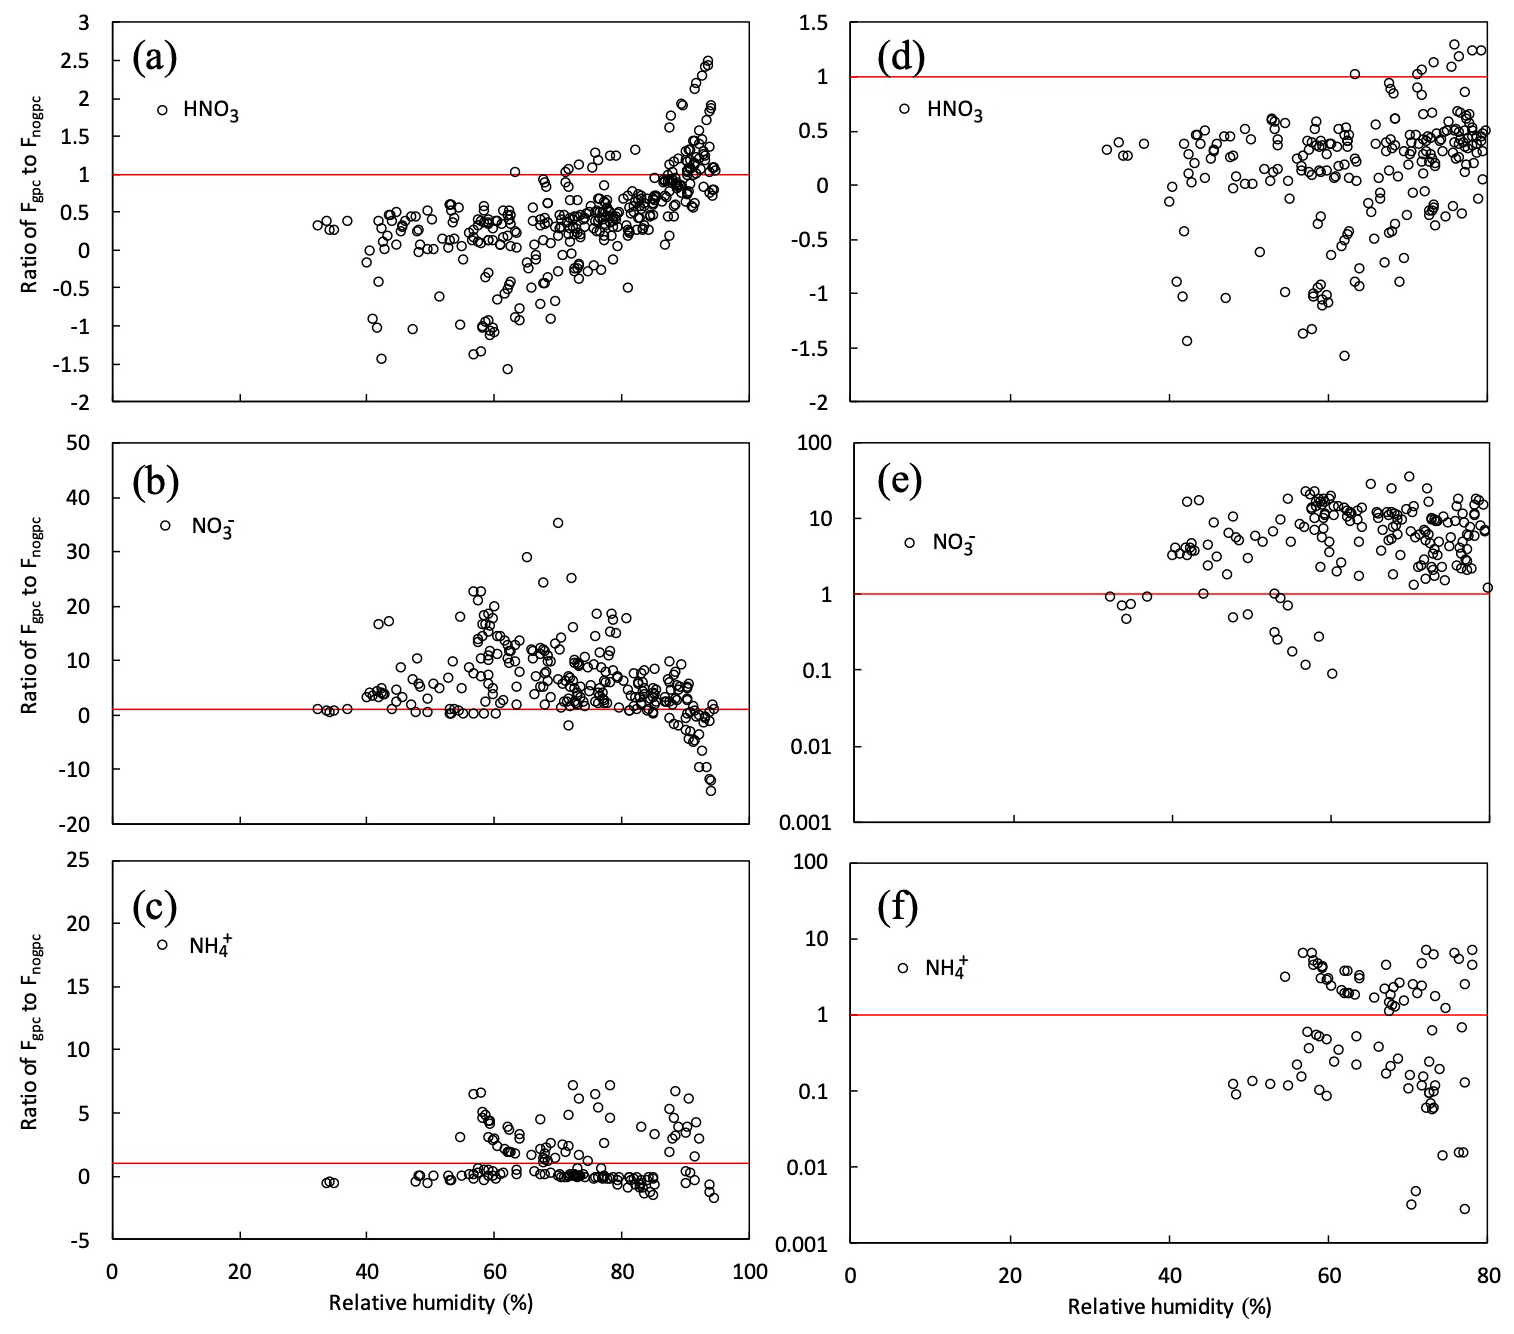
Figure 12Relationship between relative humidity (RH) at 30 m height and ratios of gpc to no gpc of calculated half-hourly fluxes (Fgpc∕Fnogpc) for (a, d) HNO3 gas and (b, e) and (c, f) fine particles over the canopy from 27 September to 11 October 2016. Red lines represent the situation in which Fgpc=Fnogpc. Panels (d–f) plot the same variables as panels (a–c) but under dry conditions (RH <80 %).
Calculated HNO3 fluxes decreased with decreasing RH, due to the evaporation of NH4NO3 (Fig. 12a). Most values of the Fgpc∕Fnogpc ratio for HNO3 under dry conditions (RH <80 %) were below 0.5 and even tended to be negative, reflecting emission from the forest to the atmosphere. Prior studies have found the same flux difference; the deposition velocity of HNO3 varies from 4 to 7 cm s−1 (Huebert and Robert, 1985; Meyers et al., 1989; Sievering et al., 1994). These velocities are often lower than theoretical maximum values or even negative values, i.e., emission from the canopy (Pryor et al. 2002; Nemitz et al., 2004). High HNO3 concentrations were observed within the canopy, indicated by the appearance of upward HNO3 fluxes over the canopy (Pryor et al., 2002). This suggests the possibility of flux divergence due to NH4NO3 evaporation in the HNO3–NH3–NH4NO3 triad within the forest. This explanation has previously been suggested for other localities (Harrison et al., 1989; Sutton et al., 1993; Kramm and Dlugi, 1994; Müller et al., 1993).
flux over the forest was less influenced by gas-to-particle conversion than (Figs. 7c, f, 8d) because the dry-deposition rates of NH3 were substantially lower than those of HNO3, such that the differences in deposition rates between NH3 and were much smaller than those between HNO3 and NO3. Indeed, the observed deposition trends for NH3 and were considerably weaker than those of HNO3 and . Furthermore, although the major counter-ion of was , that of was not but rather . Even though the same count of molecules of NH3 and HNO3 was evaporated, the gross deposition rate of appears to have been influenced mainly by (NH4)2SO4 and/or NH4HSO4 as previously suggested by Nemitz (2015). The effect of NH4NO3 gas–particle conversion on NH3 flux was even lower than on fine (Fig. 6a) because the mass concentration of NH3 was much higher.
5.4 Influencing the chemical transport modeling
Considering the gpc process, particle deposition could represent a very important nitrogen flux over the forest ecosystem. Comparing calculated daytime mass fluxes at 30 m height between the scenarios of no gpc and gpc in the early-autumn period (Fig. S2), the deposition fluxes of fine and were 15 and 4 times higher in the gpc scenario, respectively. Since there was almost no change in flux between the two scenarios, this change is found to result only from gpc. For gas species, both HNO3 and NH3 slightly decreased to 0.6 and 0.8 times due to the evaporation of NH4NO3 particles. This change in flux could be applied to that in the deposition velocity of each species. Furthermore, although particle deposition flux contributes only 5 % of the total nitrogen flux above the canopy in the scenario of no gpc, this impact was increased to ∼39 % (: 27.5 %, : 11.4 %) in the scenario of gpc. It should be noted that contributions of NH3 were still as large as 37 % of the total nitrogen flux, even in the gpc scenario. These results indicate that the increase of (apparent) particle deposition due to NH4NO3 evaporation may be important in chemical transport modeling.
Theoretical values of deposition velocity for submicrometer particles, typically ranging from 0.1–1 cm s−1, may have no substantial impact on surface concentrations in CTMs. However, as discussed above, a high deposition velocity of fine due to evaporation in the forest (up to 40 times the above values) may effectively remove nitrate particles from the atmosphere over the forest and leeward. If aerosol dynamics and gas–particle conversion processes can be incorporated into the dry-deposition scheme of CTMs, we may improve upon or even eliminate prior studies' overestimates of the surface concentration of fine (Kajino et al., 2013; Shimadera et al., 2014, 2018; Morino et al., 2015; Sakurai et al., 2015). Hicks et al. (2016) found that, when modeling particle deposition velocities, the greatest uncertainty manifested in the range 0.1–1.0 µm. The cause of this uncertainty has not yet been convincingly established, although differing treatments of key particle deposition processes (e.g., turbulent diffusion) have been suggested by prior studies (Petroff and Zhang, 2010; Zhang and Shao, 2014). As demonstrated in Fig. 12b and c, the evaporation of NH4NO3 under less humid conditions may play an important role in the dry deposition of submicrometer particles.
A new multilayer land surface model fully coupled with dry deposition and aerosol dynamics was developed to evaluate the impact of NH4NO3–NH3–HNO3 conversion in temperate forests. The model was applied to field studies of mass and number concentration profiles in a Japanese mixed forest during autumn 2016. Four model scenarios with and without NH4NO3 gas–particle conversion and/or aerosol water uptake were tested to quantify the impact of these parameters on processes of dry deposition. Overall, the model successfully reproduced micrometeorological conditions (in particular, relative humidity) within and above the canopy. When NH4NO3 gas–particle conversion processes were included in the simulation, the vertical gradients of normalized mass concentrations of nitrogen gases (HNO3 and NH3) and fine particles ( and ) within the canopy were clearly higher than those of . For particle size distribution, the observed emission tendency of total number concentration from the canopy to the atmosphere was explained by a larger effect of within-canopy evaporation of NH4NO3 than due to hygroscopic growth. As a result, the removal flux of calculated fine from the air above the forest to the forest can increase by up to 40 times under the DRH of pure NH4NO3. Similarly, the removal flux of calculated fine can increase up to ∼10 times, although calculations for fine fluctuate strongly with RH. Conversely, HNO3 flux over the forest can decrease by 50 % or more due to NH4NO3 evaporation, supporting the findings of previous studies. Processes of aerosol dynamics and NH4NO3–NH3–HNO3 conversion play a crucial role in the dry deposition of inorganic nitrogen particles in temperate forests. These processes can and should be incorporated into chemical transport models (CTMs) in order to improve the accuracy of total nitrate surface concentrations. An aerosol-dynamics–dry-deposition scheme simplified from that present in this study could therefore be implemented in CTMs.
The output data in this study are publicly accessible via contacting the authors.
The supplement related to this article is available online at: https://doi.org/10.5194/acp-20-4933-2020-supplement.
GK developed the model with support from MK and performed the simulations using the data collected by KM, AS, and KT. GK prepared the paper with contributions from all coauthors.
The authors declare that they have no conflict of interest.
We gratefully acknowledge the helpful comments and suggestions from Kentaro Hayashi at the National Institute for Agro-Environmental Sciences, Tatsuya Sakurai at Meisei University, Takeshi Izuta at the Tokyo University of Agriculture and Technology, Satoru Miura at the Forestry and Forest Products Research Institute, and Makoto Tamura and Tetsuji Ito at Ibaraki University, Japan. Our thanks are also extended to Mao Xu at the Tokyo University of Agriculture and Technology, Japan, for his contribution to the filter-pack measurements.
This research has been supported by Grants-in-Aid for Scientific Research (nos. 17H01868 and 16H02933) and the Leading Initiative for Excellent Young Researchers, provided by the Japan Society for the Promotion of Science and the Ministry of Education, Culture, Sports, Science and Technology.
This paper was edited by Leiming Zhang and reviewed by three anonymous referees.
Bae, S. Y., Jung, C. H., and Kim, Y. P.: Development of an aerosol dynamics model for dry deposition process using the moment method, Aerosol. Sci. Tech., 43, 570–580, 2009.
Binkowski, F. S. and Shankar, U.: The regional particulate model 1. Model description and preliminary results, J. Geophys. Res., 100, 26191–26209, 1995.
Brost, R. A., Delany, A. C., and Huebert, B. J.: Numerical modeling of concentrations and fluxes of HNO3, NH3, and NH4NO3 near the surface, J. Geophys. Res., 93, 7137–7152, 1988.
Burba, G., Schmidt, A., Scott, R. L., Nakai, T., Kathilankal, J., Fratini, G., Hanson, C., Law, B., McDermitt, D. K., Eckles, R., Furtaw, M., and Velgersdyk, M.: Calculating CO2 and H2O eddy covariance fluxes from an enclosed gas analyzer using an instantaneous mixing ratio, Glob. Change Biol., 18, 385–399, 2012.
Deventer, M. J., Held, A., El-Madany, T. S., and Klemm, O.: Size-resolved eddy covariance fluxes of nuclear to accumulation mode aerosol particles over a coniferous forest, Agr. Forest Meteorol., 214–215, 328–340, 2015.
Duarte, H. F., Dias, N. L., and Maggiotto, S. R.: Assessing daytime downward longwave radiation estimates for clear and cloudy skies in southern Brazil, Agr. Forest Meteorol., 139, 171–181, 2006.
EANET (Acid Deposition Monitoring Network in East Asia): The Third Periodic Report on the State of Acid Deposition in East Asia Part III: Executive Summary, 2–5, available at: https://www.eanet.asia/wp-content/uploads/2019/03/3_ex.pdf (last access: 23 April 2020), 2016.
Farquhar, G. D., Firth, P. M., Wetselaar, R., and Weir, B.: On the gaseous exchange of ammonia between leaves and the environment: determination of the ammonia compensation point, Plant Physiol., 66, 710–714, 1980.
Flechard, C., Fowler, D., Sutton, M. A., and Cape, J. N.: A dynamic chemical model of bi-directional ammonia exchange between semi-natural vegetation and the atmosphere, Q. J. Roy. Meteorol. Soc., 125, 2611–2641, 1999.
Fountoukis, C. and Nenes, A.: ISORROPIA II: a computationally efficient thermodynamic equilibrium model for K+–Ca2+–Mg2+––Na+–––Cl−–H2O aerosols, Atmos. Chem. Phys., 7, 4639–4659, https://doi.org/10.5194/acp-7-4639-2007, 2007.
Fuchs, N. A.: The Mechanics of Aerosols, Pergamon Press, Oxford, 408, 1964.
Harrison, R. M., Rapsomanikis, S., and Turnbull, A.: Land Surface Exchange in a Chemically-Reactive System – Surface Fluxes of HNO3, HCl and NH3, Atmos. Environ., 23, 1795-1800, 1989.
Hicks, B. B., Saylor, R. D., and Baker, B. D.: Dry deposition of particles to canopies – A look back and the road forward, J. Geophys. Res.-Atmos., 121, 14691–14707, https://doi.org/10.1002/2015JD024742, 2016.
Hirashima, H., Yamaguchi, S., Sati, A., and Lehning, M.: Numerical modeling of liquid water movement through layered snow based on new measurements of the water retention curve, Cold Reg. Sci. Technol., 64, 94–103, https://doi.org/10.1016/j.coldregions.2010.09.003, 2010.
Honjo, T., Takahashi, A., and Matsuda, K.: Deposition velocity of sulfate and nitrate in PM2.5 above a forest in suburban Tokyo using relaxed eddy accumulation, J. Jpn. Soc. Atmos. Environ., 51, 257–265, 2016 (in Japanese with English abstract).
Horst, T. W. and Lenschow, D. H.: Attenuation of scalar fluxes measured with spatially-displaced sensors, Bound.-Lay. Meteorol., 130, 275–300, 2009.
Huebert, B. J. and Robert, C. H.: The dry deposition of nitric acid to grass, J. Geophys. Res., 90, 208090, https://doi.org/10.1029/JD090iD01p02085, 1985.
Ibrom, A., Dellwik, E., Flyvbjerg, H., Jensen, N. O., and Pilegaard, K.: Strong low-pass filtering effects on water vapor flux measurements with closed-path eddy correlation systems, Agr. Forest Meteorol., 147, 140–156, 2007.
Järvinen, A., Aitomaa, M., Rostedt, A., Keskinen, J., and Yli-Ojanperä, J.: Calibration of the new electrical low pressure impactor (ELPI+), J. Aerosol Sci., 69, 150–159, 2014.
Kaimal, J. C. and Finnigan, J. J.: Atmospheric boundary layer flows: their structure and measurement, Oxford university press, 289, 1994.
Kajino, M., Inomata, Y., Sato, K., Ueda, H., Han, Z., An, J., Katata, G., Deushi, M., Maki, T., Oshima, N., Kurokawa, J., Ohara, T., Takami, A., and Hatakeyama, S.: Development of the RAQM2 aerosol chemical transport model and predictions of the Northeast Asian aerosol mass, size, chemistry, and mixing type, Atmos. Chem. Phys., 12, 11833–11856, https://doi.org/10.5194/acp-12-11833-2012, 2012.
Kajino, M., Sato, K., Inomata, Y., and Ueda, H.: Source-receptor relationships of nitrate in Northeast Asia and influence of sea salt on the long-range transport of nitrate, Atmos. Environ., 9, 67–78, 2013.
Katata, G.: Improvement of a land surface model for accurate prediction of surface energy and water balances, JAEA-Data/Code, 2008-033, 64, 2009.
Katata, G., Nagai, H., Wrzesinsky, T., Klemm, O., Eugster, W., and Burkard, R.: Development of a land surface model including cloud water deposition on vegetation, J. Appl. Meteorol. Clim., 47, 2129–2146, 2008.
Katata, G., Hayashi, K., Ono, K., Nagai, H., Miyata, A., and Mano, M.: Coupling atmospheric ammonia exchange process over a rice paddy field with a multi-layer atmosphere-soil-vegetation model, Agr. Forest Meteorol., 180, 1–21, 2013.
Katata, G., Kajino, M., Matsuda, K., Takahashi, A., and Nakaya, K.: A numerical study of the effects of aerosol hygroscopic properties to dry deposition on a broad-leaved forest, Atmos. Environ., 97, 501–510, 2014.
Katata, G. and Ota, M.: A terrestrial ecosystem model (SOLVEG) coupled with atmospheric gas and aerosol exchange processes, JAEA-Data/Code, 2016-014, 35, 2017.
Katata, G., Grote, R., Mauder, M., Zeeman, M. J., and Ota, M.: Wintertime grassland dynamics may influence belowground biomass under climate change: a model analysis, Biogeosciences, 17, 1071–1085, https://doi.org/10.5194/bg-17-1071-2020, 2020.
Kirsch, A. A. and Fuchs, N. A.: Studies on fibrous aerosol filters. III. Diffusional deposition of aerosols in fibrous filters, Ann. Occup. Hyg., 11, 299–304, 1968.
Kramm, G. and Dlugi, R.: Modelling of the ver, 18, 319–357, 1994.
Li, K., Liu, X., Song, W., Chang, Y., Hu, Y., and Tian, C.: Atmospheric nitrogen deposition at two sites in an arid environment of central Asia, PLoS ONE, 8, e67018, https://doi.org/10.1371/journal.pone.0067018, 2013.
Massad, R.-S., Nemitz, E., and Sutton, M. A.: Review and parameterisation of bi-directional ammonia exchange between vegetation and the atmosphere, Atmos. Chem. Phys., 10, 10359–10386, https://doi.org/10.5194/acp-10-10359-2010, 2010.
Matsuda, K., Watanabe, I., Mizukami, K., Ban, S., and Takahashi, A.: Dry deposition of PM2.5 sulfate above a hilly forest using relaxed eddy accumulation, Atmos. Environ., 107, 255–261, 2015.
Mauder, M. and Foken, T.: Impact of post-field data processing on eddy covariance flux estimates and energy balance closure, Meteor. Z., 15, 597–609, 2006.
Meyers, T. P., Huebert, B. J., and Hicks, B. B.: HNO3 deposition to a deciduous forest, Bound.-Lay. Meteorol., 49, 395–410, https://doi.org/10.1007/BF00123651, 1989.
Moncrieff, J. B., Clement, R., Finnigan, J., and Meyers, T.: Averaging, detrending and filtering of eddy covariance time series, in Handbook of micrometeorology: a guide for surface flux measurements, edited by: Lee, X., Massman, W. J., and Law, B. E., Kluwer Academic, Dordrecht, 7–31, 2004.
Morino, Y., Nagashima, T., Sugata, S., Sato, K., Tanabe, K., Noguchi, T., Takami, A., Tanimoto, H., and Ohara, T.: Verification of chemical transport models for PM2.5 chemical composition using simultaneous measurement data over Japan, Aerosol Air Qual. Res., 15, 2009–2023, 2015.
Müller, H., Kramm, G., Meixner, F., Dollard, G. J., Fowler, D., and Possanzini, M.: Determination of HNO3 dry deposition by modified bowen‐ratio and aerodynamic profile techniques, Tellus B, 45, 346–367, 1993.
Nagai, H.: Atmosphere-soil-vegetation model including CO2 exchange processes: SOLVEG2, JAERI-Data/Code, 2004-014, 92, 2004.
Nakahara, S., Takagi, K., Sorimachi, A., Katata, G., and Matsuda, K.: Enhancement of dry deposition of PM2.5 nitrate in a cool-temperate forest, Atmos. Environ., 212, 136–141, 2019.
Neirynck, J. and Ceulemans, R.: Bidirectional ammonia exchange above a mixed coniferous forest, Environ. Pollut., 154, 424–438, 2008.
Nemitz, E.: Surface/atmosphere Exchange of Atmospheric Acids and Aerosols, Including the Effect and Model Treatment of Chemical Interactions. Review and Integration of Biosphere-Atmosphere Modelling of Reactive Trace Gases and Volatile Aerosols, Springer, 115–149, 2015.
Nemitz, E. and Sutton, M. A.: Gas-particle interactions above a Dutch heathland: III. Modelling the influence of the NH3-HNO3-NH4NO3 equilibrium on size-segregated particle fluxes, Atmos. Chem. Phys., 4, 1025–1045, https://doi.org/10.5194/acp-4-1025-2004, 2004.
Nemitz, E., Sutton, M. A., Schjoerring, J. K., Husted, S., and Wyers, G. P.: Resistance modelling of ammonia exchange over oilseed rape, Agr. Forest Meteorol., 105, 405–425, 2000.
Nemitz, E., Sutton, M. A., Wyers, G. P., and Jongejan, P. A. C.: Gas-particle interactions above a Dutch heathland: I. Surface exchange fluxes of NH3, SO2, HNO3 and HCl, Atmos. Chem. Phys., 4, 989–1005, https://doi.org/10.5194/acp-4-989-2004, 2004.
Nemitz, E., Dorsey, J. R., Flynn, M. J., Gallagher, M. W., Hensen, A., Erisman, J.-W., Owen, S. M., Dämmgen, U., and Sutton, M. A.: Aerosol fluxes and particle growth above managed grassland, Biogeosciences, 6, 1627–1645, https://doi.org/10.5194/bg-6-1627-2009, 2009.
Ota, M., Nagai, H., and Koarashi, J.: Root and dissolved organic carbon controls on subsurface soil carbon dynamics: A model approach, J. Geophys. Res., 118, 1646–1659, 2013.
Pan, Y. P., Wang, Y. S., Tang, G. Q., and Wu, D.: Wet and dry deposition of atmospheric nitrogen at ten sites in Northern China, Atmos. Chem. Phys., 12, 6515–6535, https://doi.org/10.5194/acp-12-6515-2012, 2012.
Peters, K. and Eiden, R.: Modelling the dry deposition velocity of aerosol particles to a spruce forest, Atmos. Environ., 26, 2555–2564, 1992.
Petroff, A. and Zhang, L.: Development and validation of a size-resolved particle dry deposition scheme for application in aerosol transport models, Geosci. Model Dev., 3, 753–769, https://doi.org/10.5194/gmd-3-753-2010, 2010.
Petroff, A., Zhang, L., Pryor, S. C., and Belot, Y.: An extended dry deposition model for aerosols onto broadleaf canopies, J. Aerosol Sci., 40, 218–240, 2009.
Pryor, S. C., Barthelmie, R. J., Jensen, B., Jensen, N. O., and Sørensen, L. L.: HNO3 fluxes to a deciduous forest derived using gradient and REA methods, Atmos. Environ., 36, 5993–5999, 2002.
Ryder, J.: Emission, deposition and chemical conversion of atmospheric trace substances in and above vegetation canopies PhD Thesis, University of Manchester, UK, 2010.
Sakai, T., Akiyama, T., Saigusa, N., Yamamoto, S., and Yasuoka, Y.: The contribution of gross primary production of understory dwarf bamboo, Sasa senanensis, in a cool-temperate deciduous broadleaved forest in central Japan, Forest Ecol. Manage., 236, 259–267, 2006.
Sakamoto, T., Nakahara, A., Takahashi, A., Sorimachi, A., Katata, G., and Matsuda, K.: Deposition velocity of PM2.5 nitrate and gaseous nitric acid above a forest in suburban Tokyo using relaxed eddy accumulation with denuder sampling technique, J. Jpn. Soc. Atmos. Environ., 53, 136–143, 2018 (in Japanese with English abstract).
Sakurai, T., Satake, S., and Matsuda, K.: Measurement of the inorganic ions in PM2.5 at western Tokyo and the evaluation for AQM performance based on the measurement, Earozoru Kenkyu, 30, 134–141, 2015 (In Japanese with English abstract).
Seinfeld, J. H. and Pandis, S. N.: Atmospheric Chemistry and Physics: From Air Pollution to Climate Change, 2nd eds., John Wiley & Sons, New York, 2006.
Shimadera, H., Hayami, H., Chatani, S., Morino, Y., Mori, Y., Morikawa, T., Yamaji, K., and Ohara, T.: Sensitivity analyses of factors influencing CMAQ performance for fine particulate nitrate, J. Air Waste Manage., 64, 374–387, 2014.
Shimadera, H., Hayami, H., Chatani, S., Morikawa, T., Morino, Y., Mori, Y., Tamaji, K., Nakatsuka, S., and Ohara, T.: Urban air quality model inter-comparison study (UMICS) for improvement of PM2.5 simulation in greater Tokyo area of Japan, Asian J. Atmos. Environ, 12, 139–152, 2018.
Sievering, H., Enders, G., Kins, L., Kramm, G., Ruoss, K., Roider, G., Zelger, M., Anderson, L., and Dlugi, R.: Nitric acid, particulate nitrate and ammonium profiles at the Bayerisher Wald: evident for large deposition rates of total nitrate, Atmos. Environ., 28, 311–315, 1994.
Sutton, M. A., Pitcairn, C. E. R., and Fowler, D.: The exchange of ammonia between the atmosphere and plant communities, Adv. Ecol. Res., 24, 301–393, 1993.
Sutton, M. A., Asman, W. A. H., and Schjørring, J. K.: Dry deposition of reduced nitrogen, Tellus B, 46, 255–273, 1994.
Sutton, M. A., Burkhardt, J. K., Guerin, D., Nemitz, E., and Fowler, D.: Development of resistance models to describe measurement of bi-directional ammonia surface–atmosphere exchange, Atmos. Environ., 32, 473–480, 1998.
Takahashi, A. and Wakamatsu, T.: Estimation of deposition velocity of particles to a forest using the concentration gradient method, J. Jpn. Soc. Atmos. Environ., 39, 53–61, 2004 (In Japanese with English abstract).
van Hove, L. W. A., Adema, E. H., and Vredenberg, W. J.: A study of the adsorption of NH3 and SO2 on leaf surfaces, Atmos. Environ., 23, 1479–1486, 1989.
van Oss, R., Duyzer, J., and Wyers, P.: The influence of gas-to-particle conversion on measurements of ammonia exchange over forest, Atmos. Environ., 32, 465–471, 1998.
Vickers, D. and Mahrt, L.: Quality control and flux sampling problems for tower and aircraft data, J. Atmos. Ocean. Tech., 14, 512–526, 1997.
Wolff, V., Meixner, F. X., and Trebs, I.: Mixing ratios and exchange processes of the ammonia-nitric acid-ammonium nitrate triad above a spruce forest canopy, edited by: Lacoste‐Francid, H., in: Earth Observations for Land-Atmosphere Interaction Science. European SpaceAgency, ESTEC P.O. Box 299 2200, 2011.
Xu, W., Luo, X. S., Pan, Y. P., Zhang, L., Tang, A. H., Shen, J. L., Zhang, Y., Li, K. H., Wu, Q. H., Yang, D. W., Zhang, Y. Y., Xue, J., Li, W. Q., Li, Q. Q., Tang, L., Lu, S. H., Liang, T., Tong, Y. A., Liu, P., Zhang, Q., Xiong, Z. Q., Shi, X. J., Wu, L. H., Shi, W. Q., Tian, K., Zhong, X. H., Shi, K., Tang, Q. Y., Zhang, L. J., Huang, J. L., He, C. E., Kuang, F. H., Zhu, B., Liu, H., Jin, X., Xin, Y. J., Shi, X. K., Du, E. Z., Dore, A. J., Tang, S., Collett Jr., J. L., Goulding, K., Sun, Y. X., Ren, J., Zhang, F. S., and Liu, X. J.: Quantifying atmospheric nitrogen deposition through a nationwide monitoring network across China, Atmos. Chem. Phys., 15, 12345–12360, https://doi.org/10.5194/acp-15-12345-2015, 2015.
Yamazaki, T., Takahashi, A., and Matsuda, K.: Differences of dry deposition between sulfate and nitrate in PM2.5 to a forest in suburban Tokyo by vertical profile observations, J. Jpn. Soc. Atmos. Environ., 50, 167–175, 2015 (In Japanese with English abstract).
Zhang, J. and Shao, Y.: A new parameterization of particle dry deposition over rough surfaces, Atmos. Chem. Phys., 14, 12429–12440, https://doi.org/10.5194/acp-14-12429-2014, 2014.