the Creative Commons Attribution 4.0 License.
the Creative Commons Attribution 4.0 License.
 | 17 Apr 2020
On the annual variability of Antarctic aerosol size distributions at Halley Research Station
Thomas Lachlan-Cope
David C. S. Beddows
Neil Brough
Anna E. Jones
Roy M. Harrison
Angelo Lupi
Young Jun Yoon
Aki Virkkula
The Southern Ocean and Antarctic region currently best represent one of the few places left on our planet with conditions similar to the preindustrial age. Currently, climate models have a low ability to simulate conditions forming the aerosol baseline; a major uncertainty comes from the lack of understanding of aerosol size distributions and their dynamics. Contrasting studies stress that primary sea salt aerosol can contribute significantly to the aerosol population, challenging the concept of climate biogenic regulation by new particle formation (NPF) from dimethyl sulfide marine emissions.
We present a statistical cluster analysis of the physical characteristics of particle size distributions (PSDs) collected at Halley (Antarctica) for the year 2015 (89 % data coverage; 6–209 nm size range; daily size resolution). By applying the Hartigan–Wong k-mean method we find eight clusters describing the entire aerosol population. Three clusters show pristine average low particle number concentrations (< 121–179 cm−3) with three main modes (30, 75–95 and 135–160 nm) and represent 57 % of the annual PSD (up to 89 %–100 % during winter and 34 %–65 % during summer based on monthly averages). Nucleation and Aitken mode PSD clusters dominate summer months (September–January, 59 %–90 %), whereas a clear bimodal distribution (43 and 134 nm, respectively; Hoppel minimum at mode 75 nm) is seen only during the December–April period (6 %–21 %). Major findings of the current work include: (1) NPF and growth events originate from both the sea ice marginal zone and the Antarctic plateau, strongly suggesting multiple vertical origins, including the marine boundary layer and free troposphere; (2) very low particle number concentrations are detected for a substantial part of the year (57 %), including summer (34 %–65 %), suggesting that the strong annual aerosol concentration cycle is driven by a short temporal interval of strong NPF events; (3) a unique pristine aerosol cluster is seen with a bimodal size distribution (75 and 160 nm, respectively), strongly associated with high wind speed and possibly associated with blowing snow and sea spray sea salt, dominating the winter aerosol population (34 %–54 %). A brief comparison with two other stations (Dome C – Concordia – and King Sejong Station) during the year 2015 (240 d overlap) shows that the dynamics of aerosol number concentrations and distributions are more complex than the simple sulfate–sea-spray binary combination, and it is likely that an array of additional chemical components and processes drive the aerosol population. A conceptual illustration is proposed indicating the various atmospheric processes related to the Antarctic aerosols, with particular emphasis on the origin of new particle formation and growth.
- Article
(5046 KB) - Full-text XML
-
Supplement
(1990 KB) - BibTeX
- EndNote


Atmospheric marine aerosol particles contribute substantially to the global aerosol budget; they can impact the planetary albedo and climate (Reddington et al., 2017). However, aerosols remain the least understood and constrained aspect of the climate system (Boucher et al., 2013). Aerosol concentration, size distribution, chemical composition and dynamic behaviour in the atmosphere play a crucial role in governing radiation transfer. However, aerosol sources and processes, including critical climate feedback mechanisms, are still not fully characterized. This is especially true in pristine environments, where the largest uncertainties are found, mainly due to a lack of understanding of pristine natural sources (Carslaw et al., 2013). Indeed, the Southern Ocean and the Antarctic region still raises many unanswered atmospheric-science questions. This region has complex interconnected environmental systems – such as ocean circulation, sea ice, and land and snow cover – which are very sensitive to climate change (Chen et al., 2009).
Early research on Antarctic aerosols was carried out over various part of the continent and reviewed by Shaw (1979). It was concluded that a peculiar feature of the Antarctic aerosol system is a very pronounced annual cycle of the total particle number concentration, with concentrations 20–100 times higher during austral summer than during winter.
This seasonal cycle – like a seasonal “pulse” over the summer months (December, January and February) – seems to be more prominent in the upper Antarctic plateau than the coastal Antarctic zones, but particle number concentrations are much higher in coastal Antarctica. One possible origin for these nuclei could be the Antarctic free troposphere, as suggested by Ito (1993), although this free-troposphere-to-marine-boundary-layer transport was considered by no means a definite explanation (Koponen et al., 2002, 2003). Overall, the aerosol summer maximum concentrations can be largely explained by new particle formation (NPF) events, as recently reviewed by Kerminen et al. (2018).
The vertical origin of these NPF events is still a matter of debate. Some indications suggesting NPF takes place preferentially in the Antarctic free troposphere (FT): aerosols originate in the upper troposphere, and then the circulation induced by the Antarctic drainage flow (James, 1989) transports aerosols down to the boundary layer in the Antarctic plateau, with subsequent transport further to the coast by katabatic winds (Ito, 1993; Koponen et al., 2002; Fiebig et al., 2014; Hara et al., 2011; Järvinen et al., 2013; Humphries et al., 2015). A recent study found that the Southern Ocean was the dominant source region for particles observed at Princess Elisabeth (PE) station, leading to an enhancement in particle number (N), while the Antarctic continent itself was not acting as a particle source (Herenz et al., 2019). Further studies also point to boundary layer oceanic sources of NPF events (Weller et al., 2011, 2015, 2018). Recently, a long-term analysis of the seasonal variability in the physical characteristics of aerosol particles sampled from the King Sejong Station (located on King George Island at the top of the Antarctic Peninsula) was reported (Kim et al., 2017). The CCN (cloud condensation nuclei) concentration during the NPF period increased by approximately 11 % compared with the background concentration (Kim et al., 2019). Interestingly, new particle formation events were more frequent in the air masses that originated from the Bellingshausen Sea than in those that originated from the Weddell Sea, and it was argued that the taxonomic composition of phytoplankton could affect the formation of boundary layer new particles in the Antarctic Ocean (Jang et al., 2019). Dall'Osto et al. (2017b) reported higher ultrafine particles in sea ice-influenced air masses.
Overall, studies to date suggest that regional NPF events in Antarctica are not as frequent as those in the Arctic or other natural environments, although the growth rates are similar (Kerminen et al., 2018). In terms of aerosol size, most of the ultrafine (< 100 nm) particle concentrations have been linked to NPF events, whereas sea salt particles dominate the coarse mode and accumulation mode (> 100 nm). A recent study by Yang et al. (2019), however, proposes a source for ultrafine sea salt aerosol particles from blowing snow, dependent on snow salinity. This mechanism could account for the small particles seen during Antarctic winter at coastal stations.
It is interesting to note that the recent, spatially extensive study of the concentration of sea salt aerosol throughout most of the depth of the troposphere and over a wide range of latitudes (Murphy et al., 2019) reported a source of sea salt aerosol over pack ice that is distinct from that over open water, likely produced by blowing snow over sea ice (Huang et al., 2018; Giordano et al., 2018; Frey et al., 2020). In recent years, a number of long-term aerosol size distribution datasets have been discussed (Järvinen et al., 2013; Kim et al., 2019), but these types of datasets are still scarce. The ability to measure aerosol size distributions at a high time resolution allows open questions to be investigated. The purpose of the present work is to examine for the first time a 1-year (2015) dataset collected at Halley Research Station.
Previous work at Halley Research Station reported size-segregated aerosol samples collected with a cascade impactor at 2-week intervals for a year. Sea salt was found to be a major component of aerosol throughout the year (60 % of mass) deriving from the sea ice surface rather than open water. Methanesulfonic acid (MSA) and non-sea-salt sulfate both peaked in the summer and were found predominantly in the sub-micrometre size range (Rankin and Wolff, 2003). Observations of new particle formation during a 2-month cruise in the Weddell Sea revealed an iodine source (Atkinson et al., 2012). While no short-term correlation (timescale < 2 d) was found between particles and iodine compounds in a later study (Roscoe et al., 2015), the authors highlighted correlations on seasonal timescales. It is also worth mentioning that a previous Weddell Sea study also found increased new particle formation in the sea ice zone (Davison et al., 1996), but no clear correlation between dimethyl sulfide and new particle bursts was found.
In this paper, we use k-mean cluster analysis (Beddows et al., 2009) to elucidate the properties of the aerosol size distributions collected across the year 2015 at Halley. A clear advantage of this clustering method over average size distributions (monthly, seasonally, etc.) is that specific aerosol categories of particle size distribution (PSD) can be compared across different time periods, as further described later in Sect. 2. While a number of intensive polar field studies have focused on average monthly datasets, cluster analyses of year-long polar and marine particle size distributions measurements are scarce. In a nutshell, these clustering methods can reduce the complexity of the PSD dataset, allowing for a smoother separation of different PSDs (Beddows et al., 2014). Recently, cluster analysis was applied to Arctic aerosol size distributions taken at Zeppelin Mountain (Svalbard; Dall'Osto et al., 2017a) during an 11-year record (2000–2010) and at Villum Research Station (Greenland; Dall'Osto et al., 2018b) during a 5-year period (2012–2016). Both studies showed a striking negative correlation between sea ice extent and nucleation events and concluded that NPF are events linked to biogenic precursors released by open water and melting-sea-ice regions, especially during the summer season. Recently, data from three high Arctic sites (Zeppelin research station, Gruvebadet Observatory and Villum Research Station at Station Nord) over a 3-year period (2013–2015) were analysed via clustering analysis, reporting different categories including pristine low concentrations (12 %–14 % occurrence), new particle formation (16 %–32 %), Aitken (21 %–35 %) and accumulation (20 %–50 %) particles categories (Dall'Osto et al., 2019). To our knowledge, this is the first year-long Antarctic dataset where cluster analysis has been applied. The objective of this work is to analyse different types of aerosol size distributions collected over a whole year of measurements, to elucidate source regions (including open ocean, land, snow on land, and consolidated and marginal sea ice zones), discuss possible primary and secondary aerosol components, and propose mechanisms where NPF and growth may take place in the study region.
2.1 Location
The measurements reported here were made at the British Antarctic Survey's Halley VI station (75∘36′ S, 26∘11′ W), located in coastal Antarctica, on the floating Brunt Ice Shelf ∼ 20 km from the coast of the Weddell Sea. A variety of measurements were made from the Clean Air Sector Laboratory (CASLab), which is located about 1 km south-east of the station (Jones et al., 2008).
2.2 SMPS and CPC
The aerosol size distribution was measured using a TSI Inc. Scanning Mobility Particle Sizer (SMPS), comprising an Electrostatic Classifier (model 3082), a Condensation Particle Counter (CPC; model 3775) and a long Differential Mobility Analyser (DMA; model 3081). The SMPS returned information on numbers of particles in discrete size bins in the size range 6 to 209 nm, at 1 min temporal resolution. A condensation particle counter (CPC, TSI Inc. model 3010) is routinely run at Halley. It provides a measure of total number of particles with a diameter between 10 nm and ∼ 3 µm. Both instruments sampled from the CASLab's central, isokinetic, aerosol stack (200 mm inside diameter – i.d. – stainless steel; see Jones et al. (2008) for details).
2.2.1 SMPS k-mean clustering data analysis
Cluster analysis has routinely been used to understand SMPS data for over a decade (Dall'Osto et al., 2019, 2018a, b, 2017a; Lange et al., 2018; Beddows et al., 2014, 2009) and is useful in reducing the complexity of multivariate data into a manageable size to understand natural processes in the environment. The cluster analysis procedure is relatively straightforward and consists of three stages: (i) normalization, (ii) cluster choice and (iii) cluster partition.
- i.
Prior to clustering, the SMPS distributions are normalized so that the Euclidean length of each (treated as a vector) is 1. This ensures that we are clustering the shape of the distributions irrespective of the magnitude of the number count within each. The normalized data given then are clustered using k mean (method of R Core Team, http://www.r-project.org/index.html, last access: 9 April 2020). This partitions the SMPS distributions (treated as vectors by k mean) into k groups such that the sum of squares of the distances from these points to the assigned cluster centres is minimized. At the minimum, the cluster centres form the average SMPS distributions of the individual SMPS distributions assigned to each cluster (see Supplement in Beddows and Harrison, 2019, for more details).
- ii.
The choice of cluster number can be decided upon using cluster validation metrics which parameterize the compactness and separation of the clusters within the measurements space (i.e. a space with the same number of dimensions as the number of size bins within the SMPS). In an ideal case, each cluster forms its own island within the measurement space, defined by highly similar elements (i.e. are compact) and are distinct from each other by highly dissimilar elements (i.e. are separate). However, in the case of SMPS spectra such a high degree of compactness and separation is not realized in environmental data. Instead, the data are partitioned into areas of increased density within the measurement space; i.e. the data do not have sufficient compactness and separation to form islands within the measurement space but instead forms hills within the measurement landscape, which is divided up by the partitions.
To decide on the number of factors, the Dunn index (DI) and silhouette width (SW) were calculated for each factor number (Halkidi et al., 2001; Rousseeuw, 1987). The DI is a function the ratio of the smallest distance between observations not in the same cluster to the largest intra-cluster distance. Hence, DI has a value of 0 and above. The higher the values, the more compact and separate are the elements within the clusters, but conversely the closer the value is to 0, the more loose and diffuse the elements are across the clusters. When cluster analysing SMPS data, a DI of the order of 10−3–10−4 is often obtained indicating that k mean is partitioning the data into clusters which are in close proximity to each other.
The average SW value is a measure of how similar the observations are with the clusters they are assigned to relative to other clusters. A value approaching 1 indicates that the elements within each cluster are identical to each other; a value close to 0 suggests that there is no clear division between clusters; and a value close to −1 suggests that elements are better placed in its nearest neighbouring cluster. Typical values for SMPS data are of the order 0.3–0.4, and coupled with the low DI value these indicate that the clusters within the SMPS data are less compact and separate but rather loose and diffuse (cf. the analogy alluded to above of hills within a landscape instead of an island within a sea).
As we increase the cluster number from 2 up to 30, the SW value decreases from a maximum value of 0.49 to 0.28, and the DI increases from a minimum of to a maximum (Fig. S1 in the Supplement). As the number of clusters is increased from 2, the increase in DI and decrease in SW reflects the “loose and diffuse” nature of the SMPS elements within the clusters; i.e. as the number of clusters increase, the small irregularities within the data due to noise are more likely to be partitioned. Hence, we look for the cluster number (in this case eight clusters; with SW = 0.35 and DI ) where there is a peak in this trend identifying the natural partition within the data, which marks out the islands of increased density space.
As with all statistical methods, there is a tendency to depend on the cluster validation metrics to drive the final solution that may not necessarily be the correct solution to describe the environmental conditions. Hence, they are only used as a guide, and it is often helpful as a next step to compare the plots of the individual SMPS elements against the mean SMPS of each cluster (Fig. S2).
From Fig. S2, it is clear that we do indeed have sufficient separation of the SMPS data within the clusters with the odd spurious NSD (number size distribution) in clusters 1, 3, 4 and 7, which are themselves insufficient in number to form their own cluster but are allocated to their nearest cluster. From this optimum situation, it can be envisioned that as we reduce the number of clusters, we will lose the integrity of the separation, and we might well expect the cluster elements to aggregate into larger clusters according to their modal diameter, e.g. clusters 1, 3, 4 and 7; clusters 2, 6 and 8; and cluster 6. In fact, when we calculate the median standard deviation of the SMPS data within the clusters for clusters 2–10, there is in fact a minimum value at eight clusters, thus further supporting our cluster partitions.
2.3 Meteorological data
Standard meteorological measurements are made at the new Clean Air Sector Laboratory (CASLab) which is designed specifically for studies of background atmospheric chemistry and air–snow exchange; further information can be found elsewhere (Jones et al., 2008; Vignon et al., 2019).
2.4 Air mass trajectories
Air mass back trajectories were calculated using the HYSPLIT4 (Hybrid Single Particle Lagrangian Integrated Trajectory) trajectory model (Draxler and Hess, 1998) using the NCAR/NCEP (National Centers for Atmospheric Prediction/National Center for Atmospheric Research) 2.5∘ global reanalysis archive (Kalnay et al., 1996). Trajectories were calculated arriving at Halley (75∘34′16′′ S, 25∘28′26′′ W; 30 m above sea level – a.s.l.) every 6 h (06:00, 12:00, 18:00 and 00:00) during the study period. All calculations were carried out through the “openair” trajectory functions in CRAN R (Carslaw and Ropkins, 2012). In particular, once calculated, the trajectories were clustered using the openair function “trajCluster” using the Euclidean method. When considering the various cluster numbers, a setting of six trajectory clusters was chosen as best describing the air masses arriving at Halley. Note that metrics similar to the Dunn Index and silhouette width were not needed in this decision. The results of the air mass trajectory calculation were plotted either as individual, average or raster layer objects (Hijmans, 2019) drawn on stereographic projections of Antarctica using the “mapproj” and “maps” package (Becker and Wilks, 2018; McIlroy, 2018).
3.1 Categorizing Antarctic aerosol size distributions
3.1.1 Average particle number and size-resolved concentrations
We investigated the seasonal variability in the physical aerosol size characteristics of particles sampled from Halley VI in coastal Antarctica over the period January to December 2015. A clear maximum at 45 and at 145 nm can be seen in the annual average size distribution (Fig. 1). However, a striking difference can be seen among different seasons: high concentrations of aerosols at about 40 nm dominate during summer, whereas larger modes can be observed during winter, with intermediate conditions during spring and autumn. The difference between spring and autumn at D > 60 nm is also interesting, showing much higher concentrations in autumn and likely due to a number of additional unknown sources including primary (sea spray and blowing snow) and secondary (sulfate and organic components) sources.

Figure 1Seasonal mean aerosol size distribution measured by the SMPS at Halley VI over the year 2015. The error bars represent the standard deviation of the measurements from the mean value. D: diameter.
Results are broadly in line with previous results published from the Antarctic Peninsula (Kim et al., 2017). Total particle number concentrations are derived from a condensation particle counter (CPC) deployed parallel to the SMPS (Fig. S3), supporting the excellent performance of the SMPS over a large data coverage (89 % of the time during 2015). Minimum concentrations are found for the month of August (47±10 cm−3), and maximum concentrations are found for January (602±65 cm−3). These are reflected in the clear seasonal cycles for the total particle concentration (CN) observed (Fig. S4). Figure S4 (bottom) also shows daily average concentrations of the N30 nm, N30–100 nm and N>100 nm integral particle population. The selected cutoffs of 30 and 100 nm are based on the average shape of the size distribution (Fig. 1). It is interesting that whereas the absolute concentrations are remarkably different, the relative percentages of the three aerosol populations do not differ much across different months, on average 21±9 %, 54±7 % and 25±8 % for N30 nm, N30–100 nm and N>100 nm, respectively. Ultrafine particles dominate summer concentrations but are – relative to total – a dominating fraction also during winter.
3.1.2 k-Mean SMPS cluster analysis
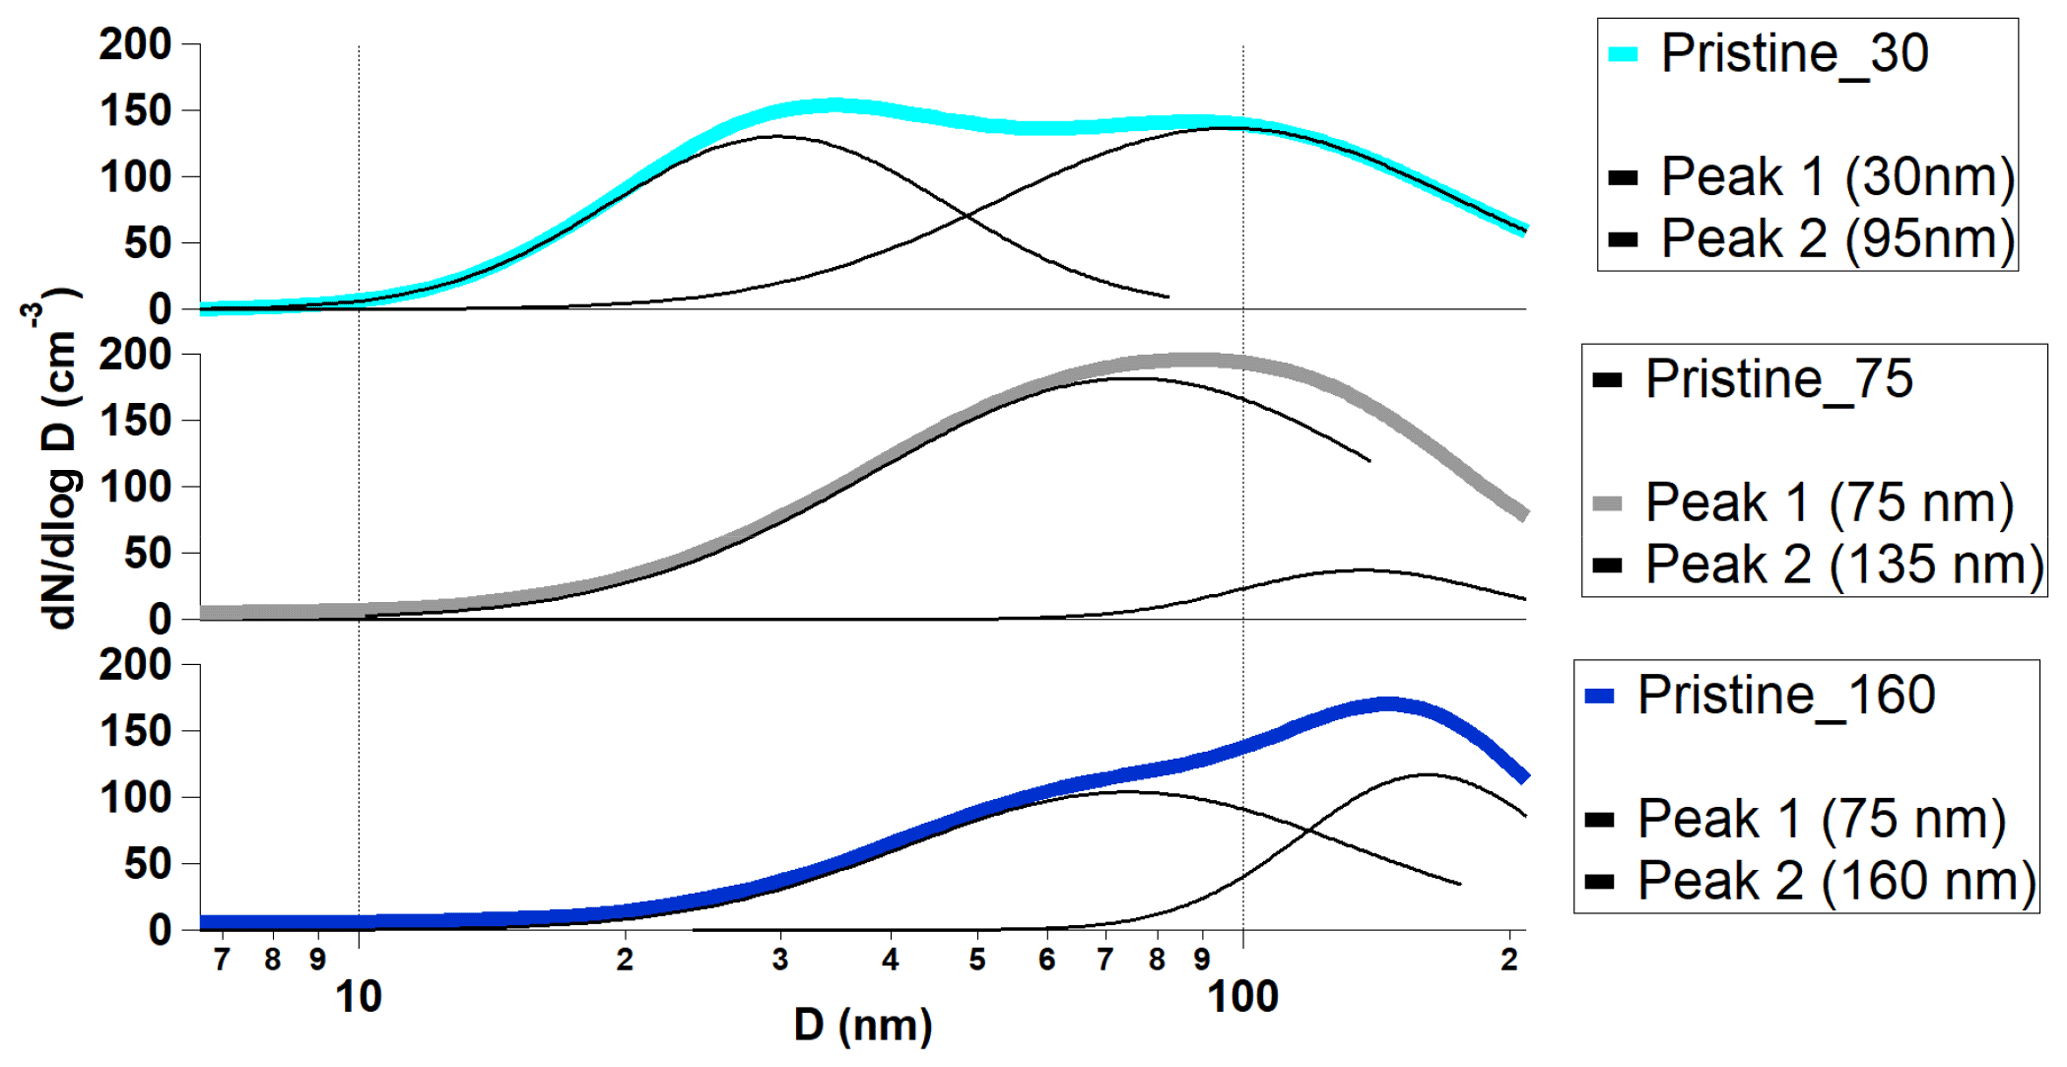
k-Mean cluster analysis of particle number size distributions was performed using 5664 hourly distributions collected over the year 2015. Our clustering analysis led to an optimum number of eight categories of aerosol number size distributions. The corresponding average daily aerosol number size distributions are shown in Fig. 2a, whereas the annual seasonality is shown in Fig. 2b. Here, we refer to ultrafine as particles with diameters between 6 and 210 nm. Three categories were characterized by very low particle number concentrations (< 200 particles cm−3) and described by their different aerosol modes (plotted and size resolved in Fig. 3), specifically:
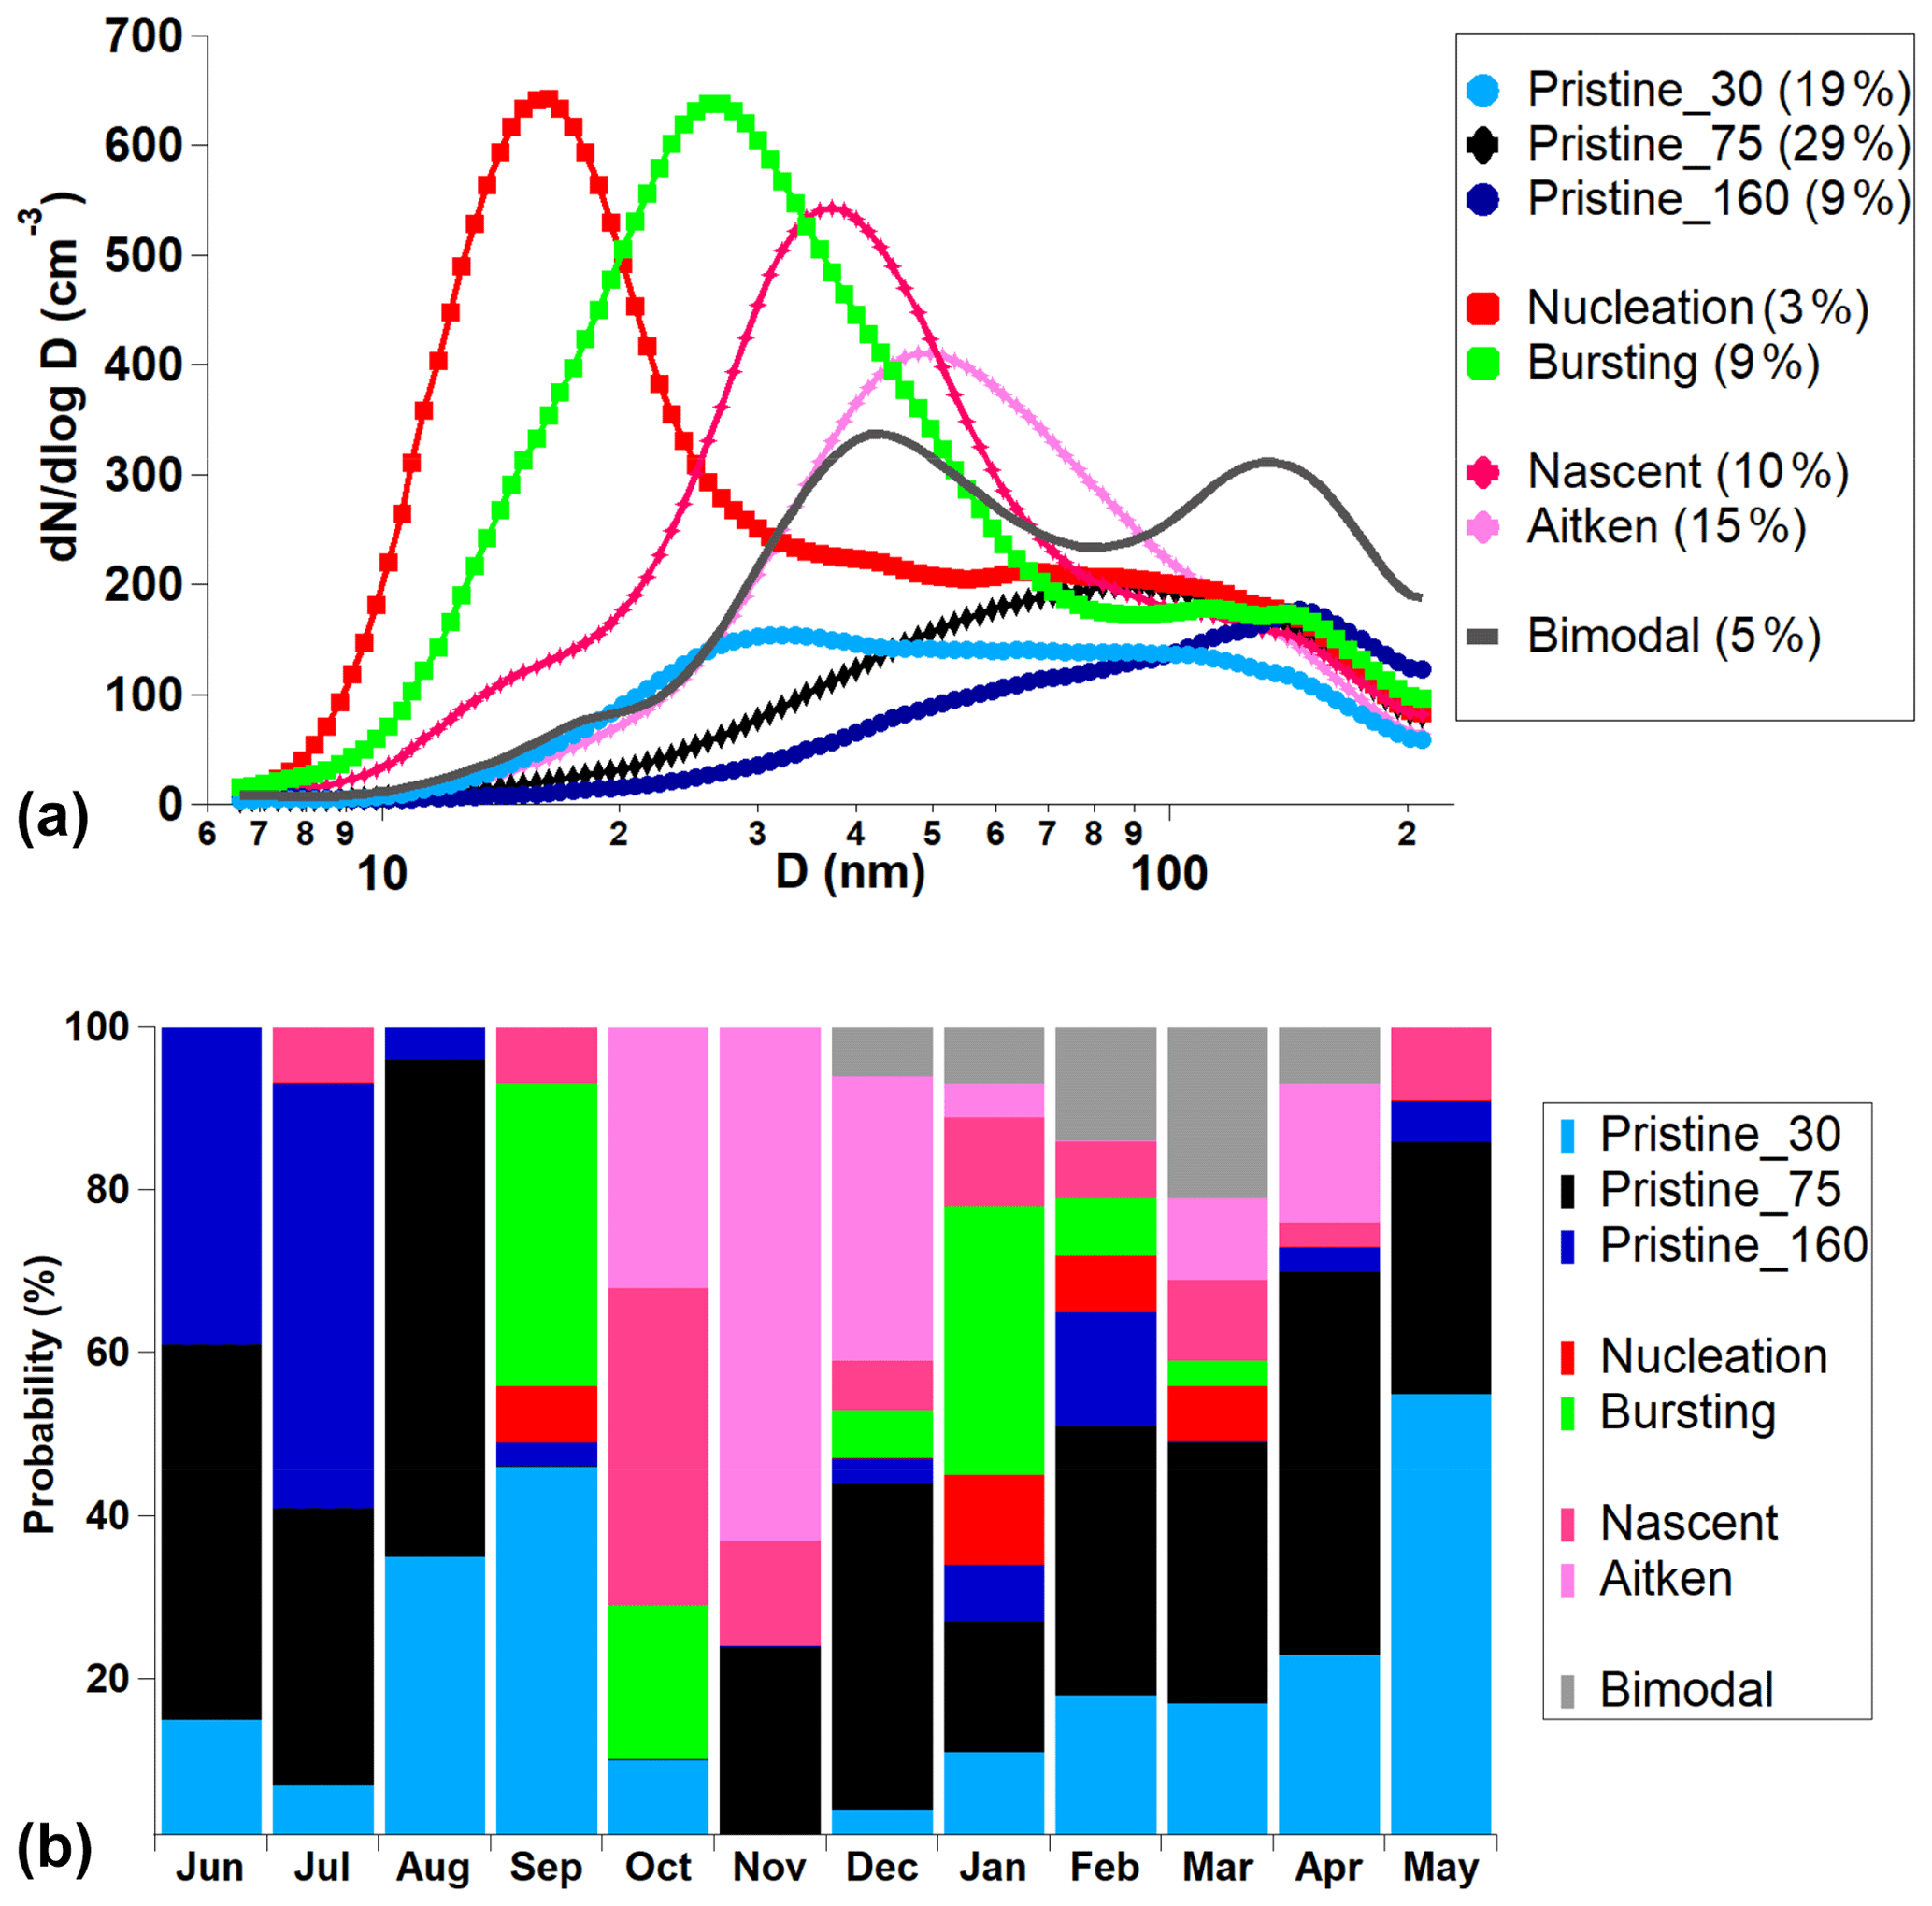
Figure 2(a) Size distribution of the eight k-mean clusters and (b) annual frequency distributions of the six aerosol categories. D: diameter.
-
“Pristine_30” ultrafine. Occurring annually 19 % of the time (minimum to maximum of 0 %–55 % based on monthly averages), this aerosol category (NCPC179±30 cm−3) shows two main peaks at 30 and 95 nm (Figs. 3, S5). The maximum in occurrence is seen for the months of September (47 %) and May (55 %).
-
“Pristine_75” ultrafine. Occurring annually 29 % of the time (minimum to maximum of 0 %–61 % based on monthly averages), this aerosol category (NCPC157±25 cm−3) shows two main peaks at 70 and 130 nm (Figs. 3, S5). The occurrence is scattered across the entire year except during spring months (September and October).
-
“Pristine_160” ultrafine. Occurring annually 9 % of the time (minimum to maximum of 0 %–52 % based on monthly averages), this aerosol category (NCPC121±40 cm−3) shows two main peaks at 70 and 160 nm (Figs. 3, S5). The maximum in occurrence is seen for the winter months of June (41 %) and July (52 %).
These three pristine aerosol cluster types describe up to 57 % of the aerosol population and mainly dominate the aerosol population during cold months (73 %–100 % for April–August). Other aerosol categories possessing higher particle concentrations include:
-
“Nucleation” ultrafine. Occurring annually 3 % of the time (minimum to maximum of 0 %–11 % based on monthly averages), this aerosol category (NCPC620±220 cm−3) shows a main nucleation peak at 15 nm detected during summer months (Fig. 2a, b). Figure S5d shows the evolution of the aerosol number size distributions starting at about noon and peaking at about 18:00; overall 95 % of these events were detected during daylight. The name of this category – which will be used below to represent new particle formation events – stands for continuous gas-to-particle growth occurring after the particle nucleation event, although these nucleation events – detected at about 7–10 nm – must have originated away from Halley Research Station.
-
“Bursting” ultrafine. Occurring annually 9 % of the time (minimum to maximum of 0 %–37 % based on monthly averages), this aerosol category (NCPC602±120 cm−3) shows a main nucleation peak at 27 nm detected during summer months (Fig. 2a, b). Figure S5e suggests these aerosols are similar to the nucleation cluster, although these new particle formation events are already in the growth process almost reaching 30 nm on average.
The clusters nucleation and bursting are seen during summer months and September–October, contributing up to 44 % of the total aerosol population during the months of September and January (Fig. S6b, d). Following terminology developed in previous work (Dall'Osto et al., 2017a, 2018b) the remaining aerosol clusters can be classified as follows:
-
“Nascent” ultrafine. This category occurs annually 10 % of the time, with a strong seasonal trend peaking during summer (October–December; 10 %–39 %) and with a broad Aitken mode centred at about 38 nm (Fig. 2) without showing a clear diurnal pattern (Fig. S5f). The name of this category emerges from growing ultrafine aerosol particles which may result from an array of different primary and secondary aerosol processes.
-
“Aitken” ultrafine. This category occurs annually 15 % of the time, with a strong seasonal trend peaking during summer (October–December; 32 %–63 %; Fig. 2b) and – similar to the nascent cluster – a broad Aitken mode centred at about 50 nm (Fig. 2a) without showing a clear diurnal pattern (Fig. S5h).
-
“Bimodal” ultrafine. Occurring annually 5 % (minimum to maximum of 0 %–21 %) of the time, this unique category shows a strongly bimodal size distribution (43 and 134 nm, with a small nucleation mode at 16 nm; Fig. 2a); it occurs during the period December–April (7 %–21 %) and parallels previously reported bimodal aged Antarctic distributions (Ito, 1993). The Hoppel minimum mode is seen at 70 nm.
In summary, our method allows for the apportionment of the Antarctic aerosol observed at Halley Research Station into eight categories describing the whole aerosol population. In the following sections, emphasis is given to understanding the origin and processes driving Antarctic aerosol formation.
3.2 Association of PSD with meteorological, physical and chemical parameters
The main ground-level meteorological observations from Halley for the year 2015 are temporally averaged over the periods of occurrence of the different aerosol categories (Fig. S7). Higher average wind speeds (WS; 7.2±2 m s−1) were encountered for the pristine aerosol clusters relative to the remaining five (3.2±2 m s−1); the cluster pristine_160 shows the highest WS (8.5±3 m s−1), suggesting the larger mode may be due to a primary aerosol component, further discussed in Sect. 4. Little variation in atmospheric pressure was found among the eight aerosol clusters. By contrast, the nucleation and bursting clusters were found in driest (relative humidity – RH; 48±5 %) and coldest ( ∘C) weather among all clusters, supporting the fact that NPF takes place preferentially at low RH (Laaksonen et al., 2008; Hamed et al., 2011).
Vertical profiles of meteorological data are available for most days in 2015 and complement local ground-level measurements. Fig. S6a and b show the driest and coldest conditions for clusters bursting and nucleation. By contrast, the warmest and wettest conditions occur for the bimodal category. A large difference is also seen in the wind speed vertical profiles (Fig. S8c), which are strongest for the cluster pristine_160, and a clear inversion is seen during the bimodal cluster days. Concurrent ozone gas measurements (Fig. S7) show the lowest values for the cluster bimodal (18±3 ppb), moderate values for ultrafine dominating clusters (24±8 ppb) and higher values for pristine clusters (29±5 ppb).
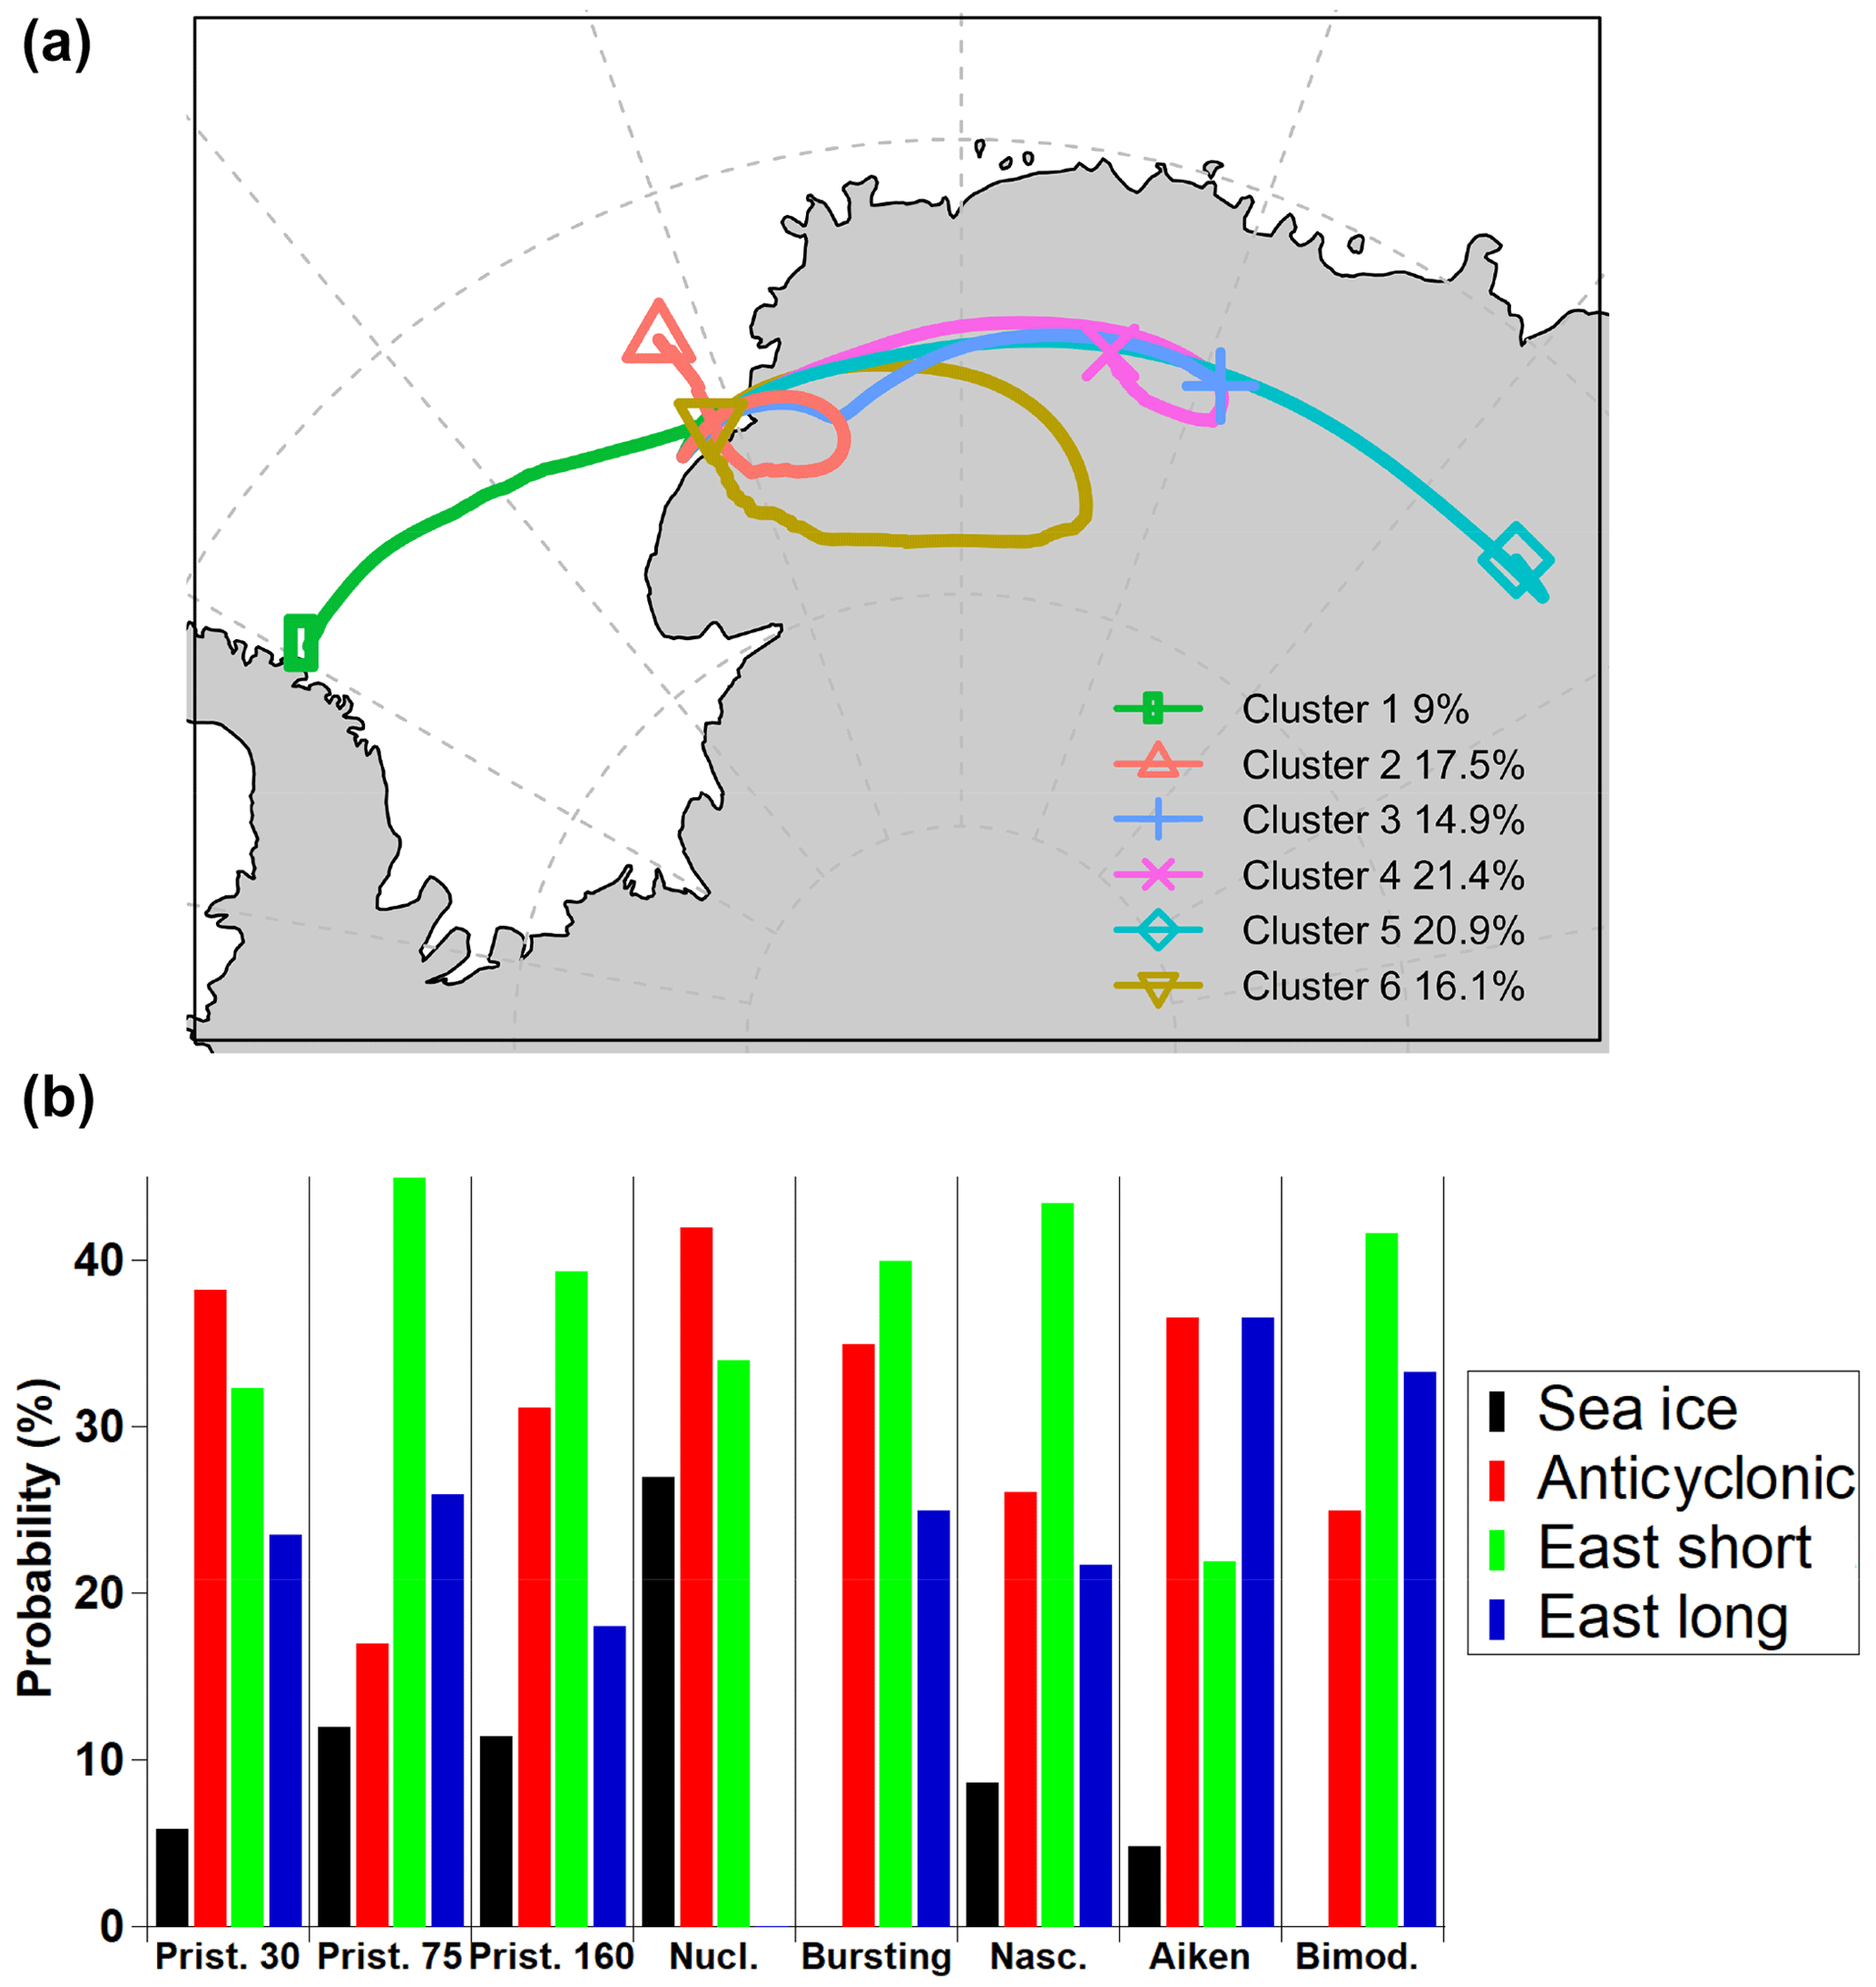
Figure 4(a) Air mass analysis of air mass back trajectories arriving at Halley during the year 2015 (hourly resolution) and (b) relative contribution for each aerosol category. Groups in (b) are sea ice (1), anticyclonic (2, 6), east short (3, 4) and east long (5).
3.3 Elucidating source regions by association of PSD clusters with air mass back trajectories
Throughout the studied period, hourly 120 h back trajectories were calculated using the HYSPLIT4 model (Draxler and Hess, 1998). Figure 4 shows the results of the air mass back trajectories calculated for Halley throughout 2015, showing six main clusters. Broadly, two air trajectory clusters were associated with anticyclonic conditions (clusters 2 and 6; up to 33.6 % of air masses); three clusters were associated with air masses coming from the eastern Antarctic plateau (clusters 3, 4 and 5; up to 57.2 % of air masses); and one unique air trajectory cluster was found associated with air masses originating within the Weddell Sea (cluster 1; 9 %).
Figure S9 shows the six air mass back trajectory clusters and the average height of the trajectories up to 120 h before arrival at Halley. While clusters 2–6 show their origin over the Antarctic plateau, cluster 1 shows average altitudes lower than 1000 m, close to the height of the mixed layer (Fig. S9). Figure S10 shows the air mass trajectories according to the PSD clusters. On the basis of Fig. S9, it looks rather similar to the other air mass types with the air only entering the boundary layer for the last ∼ 15 h of the trajectory. One striking difference is found when these air mass back trajectory clusters are compared temporally among the aerosol categories (Fig. 5).
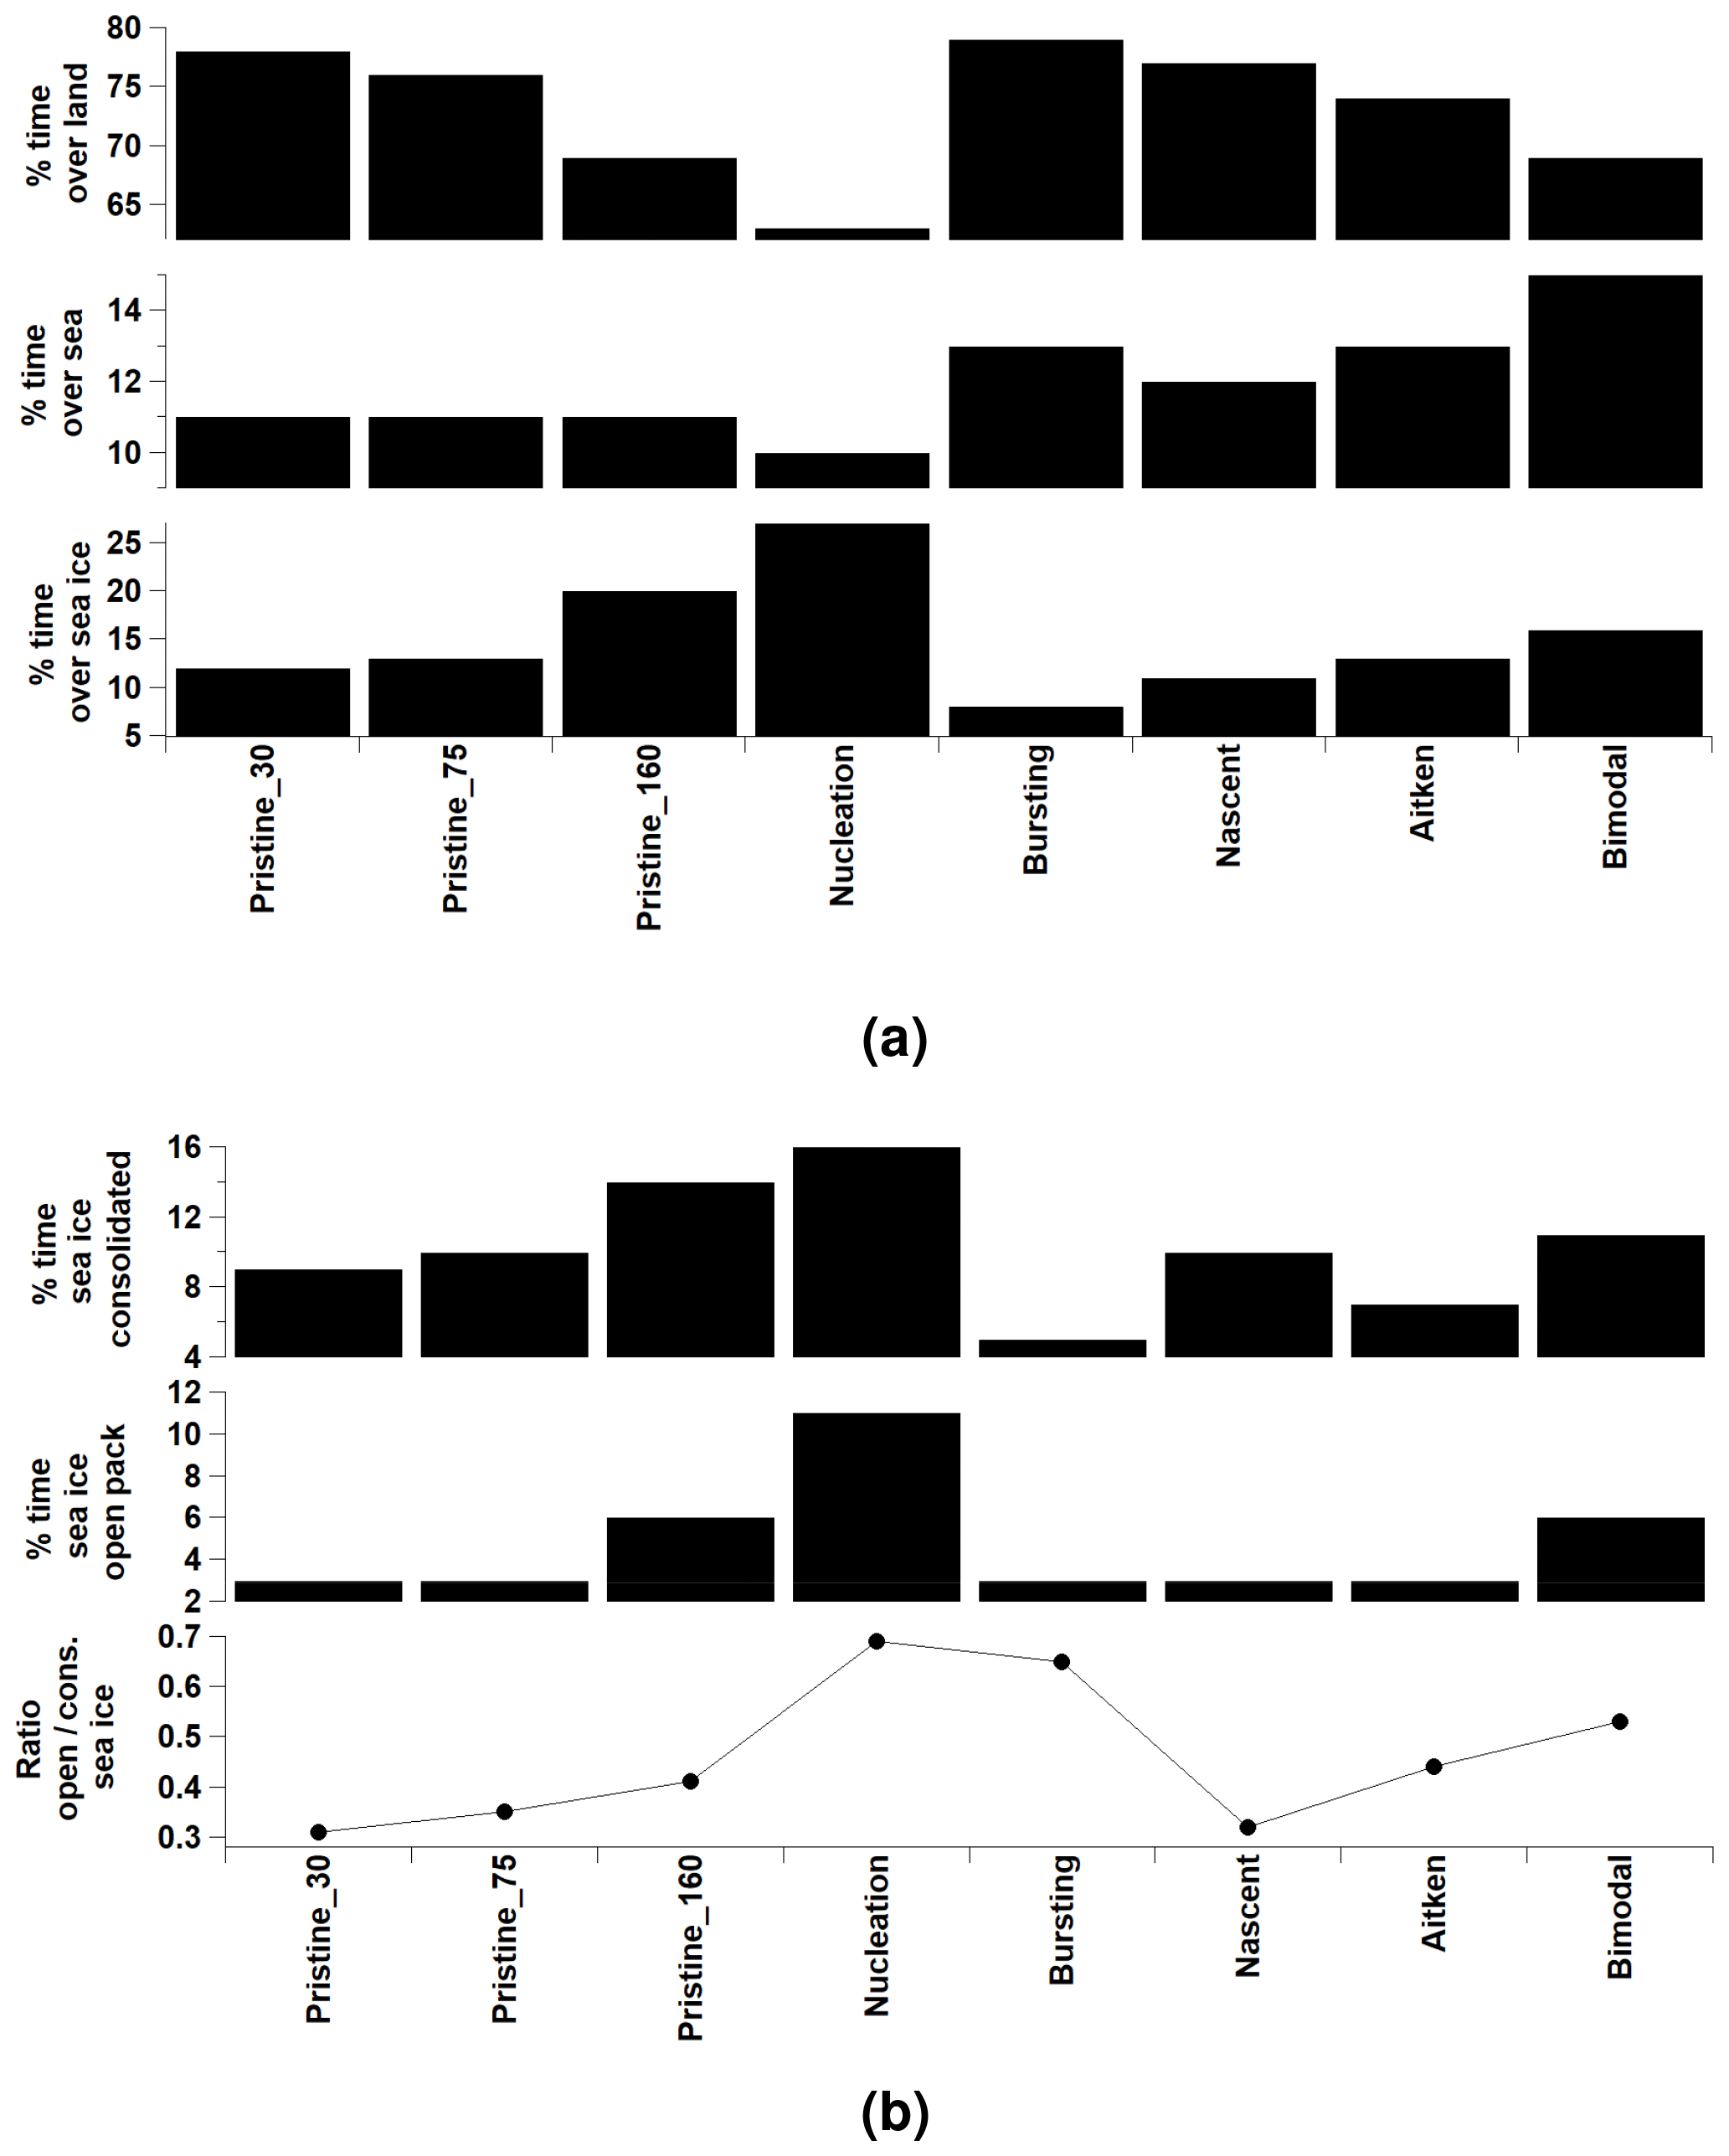
Figure 5(a) Percentages of air masses over land, sea and sea ice for the eight k-mean aerosol categories and (b) percentages of consolidated and open-pack sea ice and the ratio of open-pack / consolidated sea ice.
A key conclusion of this study is that most aerosol categories (excluding the cluster nucleation) are associated with air masses arriving with eastern winds from the Antarctic plateau (east short and east long; 56 %–76 % of the time). Anticyclones also seem to be a predominant air mass type (17 %–42 %). At Halley, air mass back trajectories that have travelled over the sea–sea-ice zone and play only a minor overall role in terms of annual average air mass trajectories (10 %–15 %).
In a further analysis, we obtained information on how far each air mass travelled (total travel time of 60 h) over zones distinguished by their surface characteristics, namely snow, sea ice and open water for each one of the different aerosol categories presented (see Sect. 2). Figure 5a shows that the category nucleation is the one most associated with sea ice (27 % of the time). An example of NPF events is shown in Fig. S11, occurring on 28 January 2015, where air mass back trajectories showed most of their travel time over sea ice (65 % consolidate and 25 % open pack; total of 85 %) and the remaining open ocean (10 %). Further studies will address specific events and more specific case studies. It is important to stress that the nucleation category has its air mass back trajectories mainly travelling over land (63 %). However – relative to the other clusters – it is the most affected by air masses which had travelled over the Weddell Sea (27 %), most of which is open pack ice (ratio of open-pack / consolidated sea ice of 0.6; Fig. 5b). This is an important conclusion of this work, pointing out that at least two source regions of new particle formation exist in the Antarctic. It is interesting to note also that the bursting category has a large ratio of open-pack / consolidated sea ice (Fig. 5b), confirming marginal sea ice zones may be a strong source of biogenic gases responsible for new particle formation.
By examining the air mass trajectory heights, we also show that during the 5 d prior to sampling, the sampled air from the Weddell Sea was remarkably different from the other air mass types (Fig. S9); it had travelled within the marine boundary layer, with no intrusion from the free troposphere. Our results strongly suggest the nucleating events originated within the boundary layer, likely from gaseous precursors associated with sea ice emissions.
4.1 Origin and sources of Antarctic aerosol
The purpose of this study was to analyse a year-long (throughout 2015) set of observations of Antarctic aerosol number size distributions to gain a better understanding of those processes which control Antarctic aerosol properties. In a pristine environment like Antarctica and its surrounding ocean, where the atmosphere is thought to still resemble that of preindustrial Earth (Hamilton et al., 2014), missing aerosol sources must reflect overlooked natural processes. Uncertainties for modelling aerosol–cloud interactions and cloud radiative forcing arise from a poor source apportionment of aerosols and their size distributions (Carslaw et al., 2013).
Broadly, marine particles in the nanometre size range originate from gas-to-particle secondary processes, whereas those in super-micrometre sizes are predominantly composed of primary sea spray (O'Dowd et al., 1997a). However, the accumulation mode (broadly composed of intermediate particle sizes of 50–500 nm) is composed of a complex mixture of both secondary and primary particles. The relative roles of secondary aerosols produced from biogenic sulfur versus primary sea spray aerosols in regulating cloud properties and amounts above the Southern Ocean is still a matter of debate (Meskhidze and Nenes, 2006; Korhonen et al., 2008; Quinn and Bates, 2011; McCoy et al., 2015; Gras and Keywood, 2017; Fossum et al., 2018). First observations of organic carbon (OC) in size-segregated aerosol samples collected at a coastal site in the Weddell Sea (Virkkula et al., 2006) showed that MSA represented only a few percent of the total OC in the sub-micrometre fraction; recent studies demonstrate that sea bird colonies are also important sources of organic compounds locally (Schmale et al., 2013; Liu et al., 2018) as well as seasonal ice microbiota (Dall'Osto et al., 2017b). The overall balance between secondary aerosol formation versus primary particle formation from sea spray still needs to be determined and is a pressing open question.
A key result of this study is that for 59 % of the year (89 %–100 % during winter in June, July and August – JJA; 10 %–50 % during spring in September, October and November – SON; 34 %–65 % during summer in December, January and February – DJF; and 48 %–91 % during autumn in March, April and May – MAM), aerosol size distributions were characterized by very low particle number concentrations (< 121–179 cm−3). It is often assumed that a strong annual cycle of particle number concentrations is mainly driven by summer new particle formation events (Shaw, 1979; Ito, 1993; Kerminen et al., 2018). However, at Halley during summer 2015, 34 %–65 % of the time low particle number concentrations (121–179 cm−3) of unknown origin dominate the overall temporal variation. Unique bimodal size distributions are seen in December–April, where a clear bimodal distribution is seen for 7 %–21 % of the time (peaking in March; 21 %) and likely related to cloud processing (Hoppel et al., 1994).
In the following sub-sections we discuss our results in the light of recent studies focusing on Antarctic aerosol source apportionment. The majority of the studies report primary and secondary components in term of mass, which should not be confused with particle number concentration.
4.1.1 Primary Antarctic aerosol
Sea spray is almost always reported as the main source of super-micrometre (> 1 µm) aerosols in marine areas, including the Southern Ocean and Antarctica (Quinn et al., 2015; Bertram et al., 2018). However, models of global sea salt distribution have frequently underestimated concentrations at polar locations (Gong et al., 2002). Rankin and Wolff (2003) suggested the Antarctic sea ice zone was a more important source of sea salt aerosol, during the winter months, than the open ocean. In particular, they proposed brine and frost flowers on the surface of newly forming sea ice as the dominant source, a hypothesis supported by other studies (e.g. Udisti et al., 2012). The results presented here suggest that, in coastal Antarctica, aerosol composition is a strong function of wind speed and that the mechanisms determining aerosol composition are likely linked to blowing snow (Giordano et al., 2018; Yang et al., 2019; Frey et al., 2020). We note that Legrand et al. (2016) suggested that on average, the sea ice and open-ocean emissions equally contribute to the sea salt aerosol load of the inland Antarctic atmosphere.
Averaged across the year, we found a very clear aerosol size distribution with the largest detected mode at ∼ 160 nm, pointing to a primary – likely sea spray – source, which was detected during periods of strong winds. However, it is also possible that in size range the dominating constituent is sulfate (Teinilä et al., 2014); further studies are needed to apportion this mode correctly. This aerosol category type occurs very frequently during winter months (JJ at 33 %–52 %) but not during the other months (0 %–14 %). Gras and Keywood (2017) showed, using data from Cape Grim, that wind-generated coarse-mode sea salt is an important CCN component year round and from autumn through to mid-spring is the second-most important component, contributing around 36 % to observed CCN; these measurements were taken in the Southern Ocean marine boundary layer.
Marine primary organic aerosol (POA) is often associated with sea spray, but recent studies indicate that a fine mode (usually < 200 nm) can have a size distribution that is independent from sea salt (externally mixed), whereas super-micrometre marine aerosols are more likely to be internally mixed with sea salt (Gantt and Meskhidze, 2013). McCoy et al. (2015) reported observational data indicating a significant spatial correlation between regions of elevated Chl-a and particle number concentrations across the Southern Ocean and showed that modelled organic mass fraction and sulfate explains 53±22 % of the spatial variability in observed particle concentration. Our study cannot apportion any aerosol related to primary organic aerosol, given the lack of chemical measurements carried out during 2015 at Halley Research Station. It is possible that part of the broad mode at 90 nm of the pristine_90 category contain a fraction of primary marine organic aerosols, but the relative importance cannot be quantified in this study. Interestingly, open-ocean aerosol measurements collected over the Southern Ocean (43–70∘ S) and the Amundsen Sea (70–75∘ S) were recently reported by Jung et al. (2019). During the cruise, water-insoluble organic components (WIOCs) were the dominant organic carbon (OC) species in both the Southern Ocean and the Amundsen Sea, accounting for 75 % and 73 % of total aerosol organic carbon, respectively. The WIOC concentrations were found to correlate with the relative biomass of a specific phytoplankton species (Phyllophora antarctica), producing extracellular polysaccharide mucus and strongly affecting the atmospheric WIOC concentration in the Amundsen Sea (Jung et al., 2019).
4.1.2 Secondary Antarctic aerosol
Our results show that two sub-30 nm aerosol categories (nucleation and bursting; 12 % in total) and two Aitken 30–60 nm aerosol categories (nascent and Aitken; 25 %) account for up to 37 % of the PSD detected at Halley during the year 2015. Our results point to secondary aerosol processes driving the aerosol population during 5 months of the year (September–January; 48 %–90 %), where aerosol particle number concentrations are on average 3–4 times higher than the Antarctic aerosol annual winter average concentration (121–179 cm−3). Our study strongly suggests that new particle formation may have at least two contrasting sources. The former is related to sea ice marginal zones formed in the marine boundary layer. The latter is related to air masses arriving from the Antarctic plateau, possibly having a free-troposphere origin.
The biogenic precursors responsible for the new particle formation are not known. Charlson et al. (1987) postulated the CLAW (Charlson–Lovelock–Andreae–Warren) hypothesis: the most significant source of CCN in the marine environment is non-sea-salt sulfate derived from atmospheric oxidation of dimethylsulfide (DMS); however measurements able to provide information on where individual particles come from are still limited (O'Dowd et al., 1997b; Quinn and Bates, 2011; Sanchez et al., 2018). A previous ship-borne field campaign in the Weddell Sea found increased new particle formation in the sea ice zone of the Weddell Sea (Davison et al., 1996) but no clear correlation to the dimethyl sulfide that was then assumed to control new particle bursts. A smaller-mode radius associated with polar aerosol (relative to marine Southern Ocean aerosol) was found associated with less cloud cover and consequently less cloud processing, over the continent and pack ice regions. During the cruise, new particle formation observed over the Weddell Sea resulted from boundary layer nucleation bursts rather than tropospheric entrainment. Brooks and Thornton (2018) argued that additional modelling studies are still needed that address contributions from both secondary DMS-derived aerosols and primary organic aerosols as CCN on a realistic timescale, although the occurrence of a “seasonal CLAW” in remote marine atmospheres is becoming plausible (Vallina and Simó, 2007; Quinn et al., 2017; Sanchez et al., 2018).
Satellite (Schönhardt et al., 2008) and on-site measurements (Saiz-Lopez et al., 2007; Atkinson et al., 2012) showed that the Weddell Sea is an iodine hotspot; however there was no short-term correlation between IO (iodine monoxide) and particle concentration found (Roscoe et al., 2015). Using an unprecedented suite of instruments, Jokinen et al. (2018) showed that ion-induced nucleation of sulfuric acid and ammonia, followed by sulfuric acid-driven growth, is the predominant mechanism for NPF and growth in eastern Antarctica a few hundred kilometres from the coast (the Finnish Antarctic research station Aboa is located in Queen Maud Land in eastern Antarctica; Jokinen et al., 2018). Some ion clusters contained iodic acid, but its concentration was very small, and no pure iodic acid or iodine oxide clusters were detected (Sipilä et al., 2016). Finally, some organic oxidation products from land melt ponds have also been suggested (Kyrö et al., 2013) as a potential source for condensable vapour, although this may be a confined and minor source (Weller et al., 2018). Other measurements of new particle formation and growth were governed by the availability of other yet unidentified gaseous precursors, most probably low volatile organic compounds of marine origin (Weller et al., 2015, 2018).
4.2 Implication for climate and conclusion
A strong annual cycle of total particle number concentration is a prominent characteristic of the Antarctic aerosol system, with the austral summer concentration being up to 20–100 times greater than during the winter (Shaw, 1979; Gras, 1995; Ito, 1993; Hara et al., 2011; Weller et al., 2011; Järvinen et al., 2013; Fiebig et al., 2014; Kim et al., 2017). These summer particle number concentration maxima are largely explained by NPF taking place in the Antarctic atmosphere. However, these seasonal cycles are more pronounced at monitoring sites situated on the upper plateau of Antarctica than at the coastal Antarctic sites. It is worth keeping in mind that these cycles could also be more pronounced because in coastal regions in winter, sea salt aerosol has a relatively larger source; i.e. the amplitude of the seasonal cycle is driven both by what is going on in winter as well as summer. Nevertheless, overall much higher particle number concentrations have long been reported in coastal Antarctica relative to the plateau. The vertical location of Antarctic NPF has not been well quantified; there are some indications that NPF takes place preferentially in the Antarctic free troposphere (FT) rather than in the boundary layer (BL) (Koponen et al., 2002; Hara et al., 2011; Humphries et al., 2015), whereas other studies show opposite trends (Kim et al., 2017; Weller et al., 2011, 2015, 2018). A study conducted on the upper plateau of Antarctica demonstrates that also wintertime regional NPF is possible in this environment (Järvinen et al., 2013). Very low particle growth rates (between about 0.1 and 1 nm h−1) were reported in Antarctica (Weller et al., 2015).

Figure 6Average size-resolved particle size distributions simultaneously measured during the year 2015 at Halley, Dome C and King Sejong stations for (a) May–December (8 months), (b) spring (September, October and November; 3 months), (c) summer (December; 1 month) and (d) winter (June, July and August; 3 months). D: diameter.
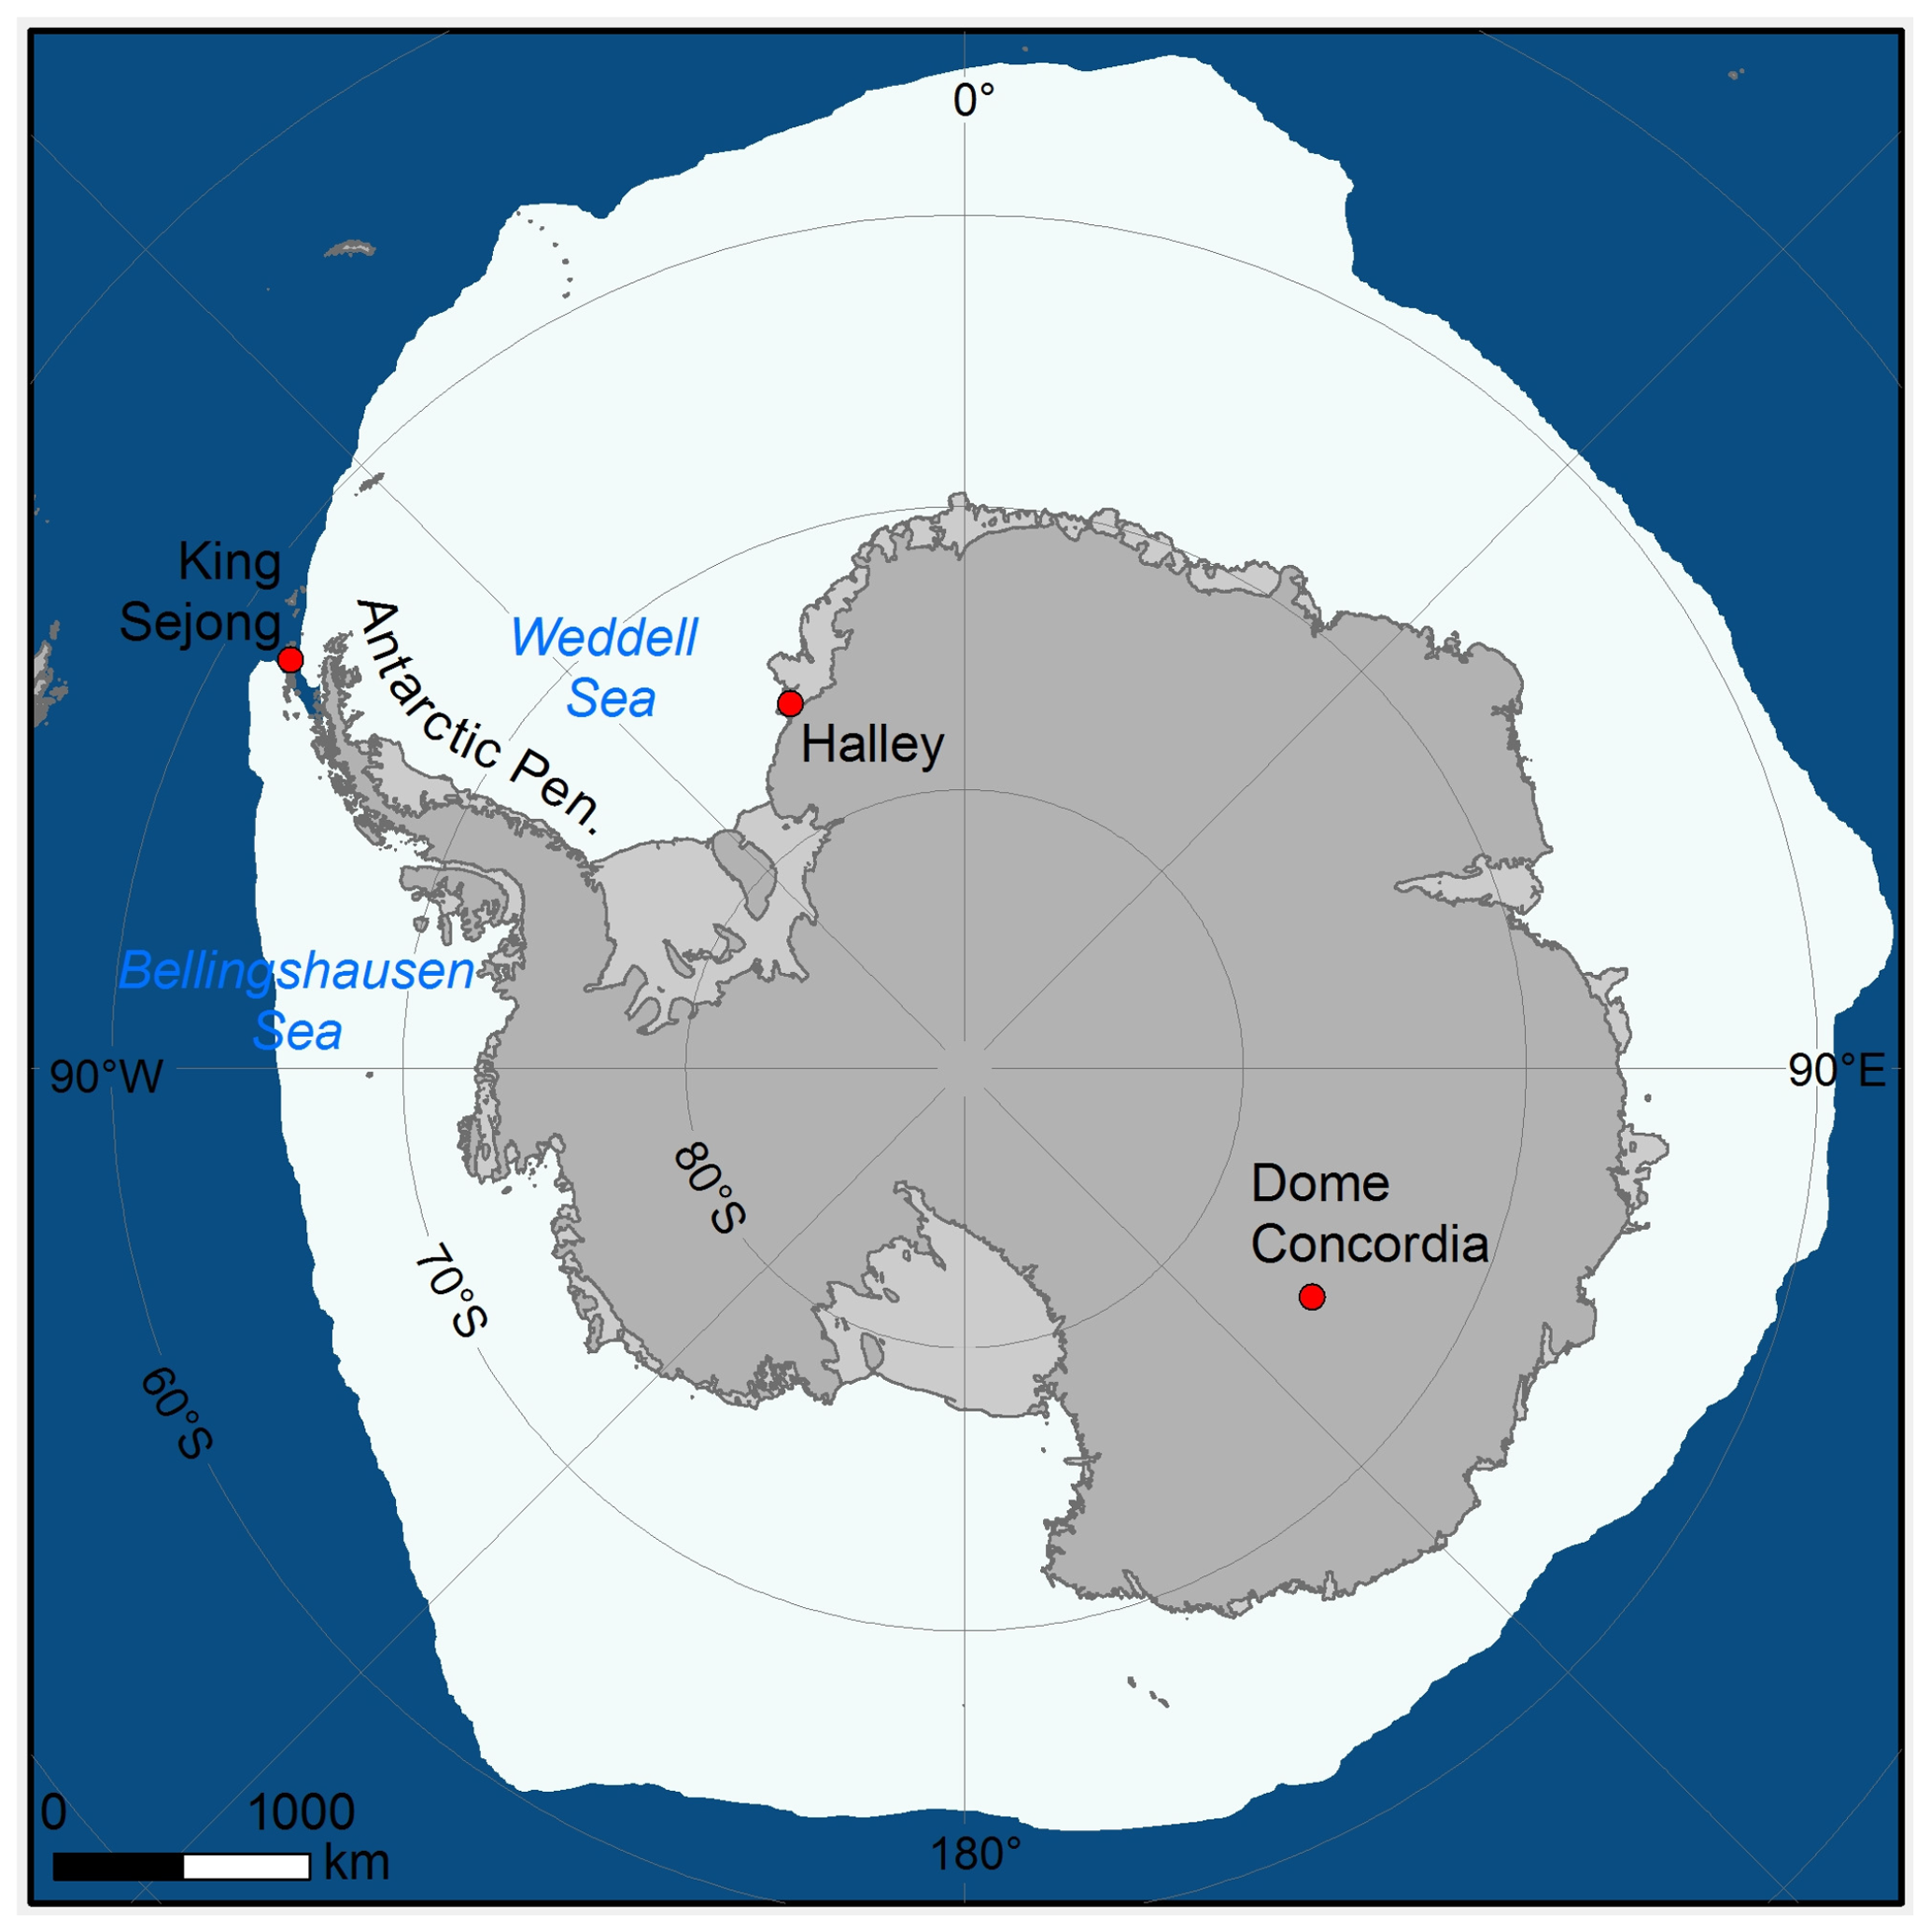
Figure 7Map with locations of Antarctic monitoring stations considered in Fig. 6. Please note that the sea ice extent is the median September extent from 1981 to 2010 (data are from the National Snow and Ice Data Center – NSIDC – at https://nsidc.org/data/g02135, last access: 10 April 2020, Fetterer et al., 2017).
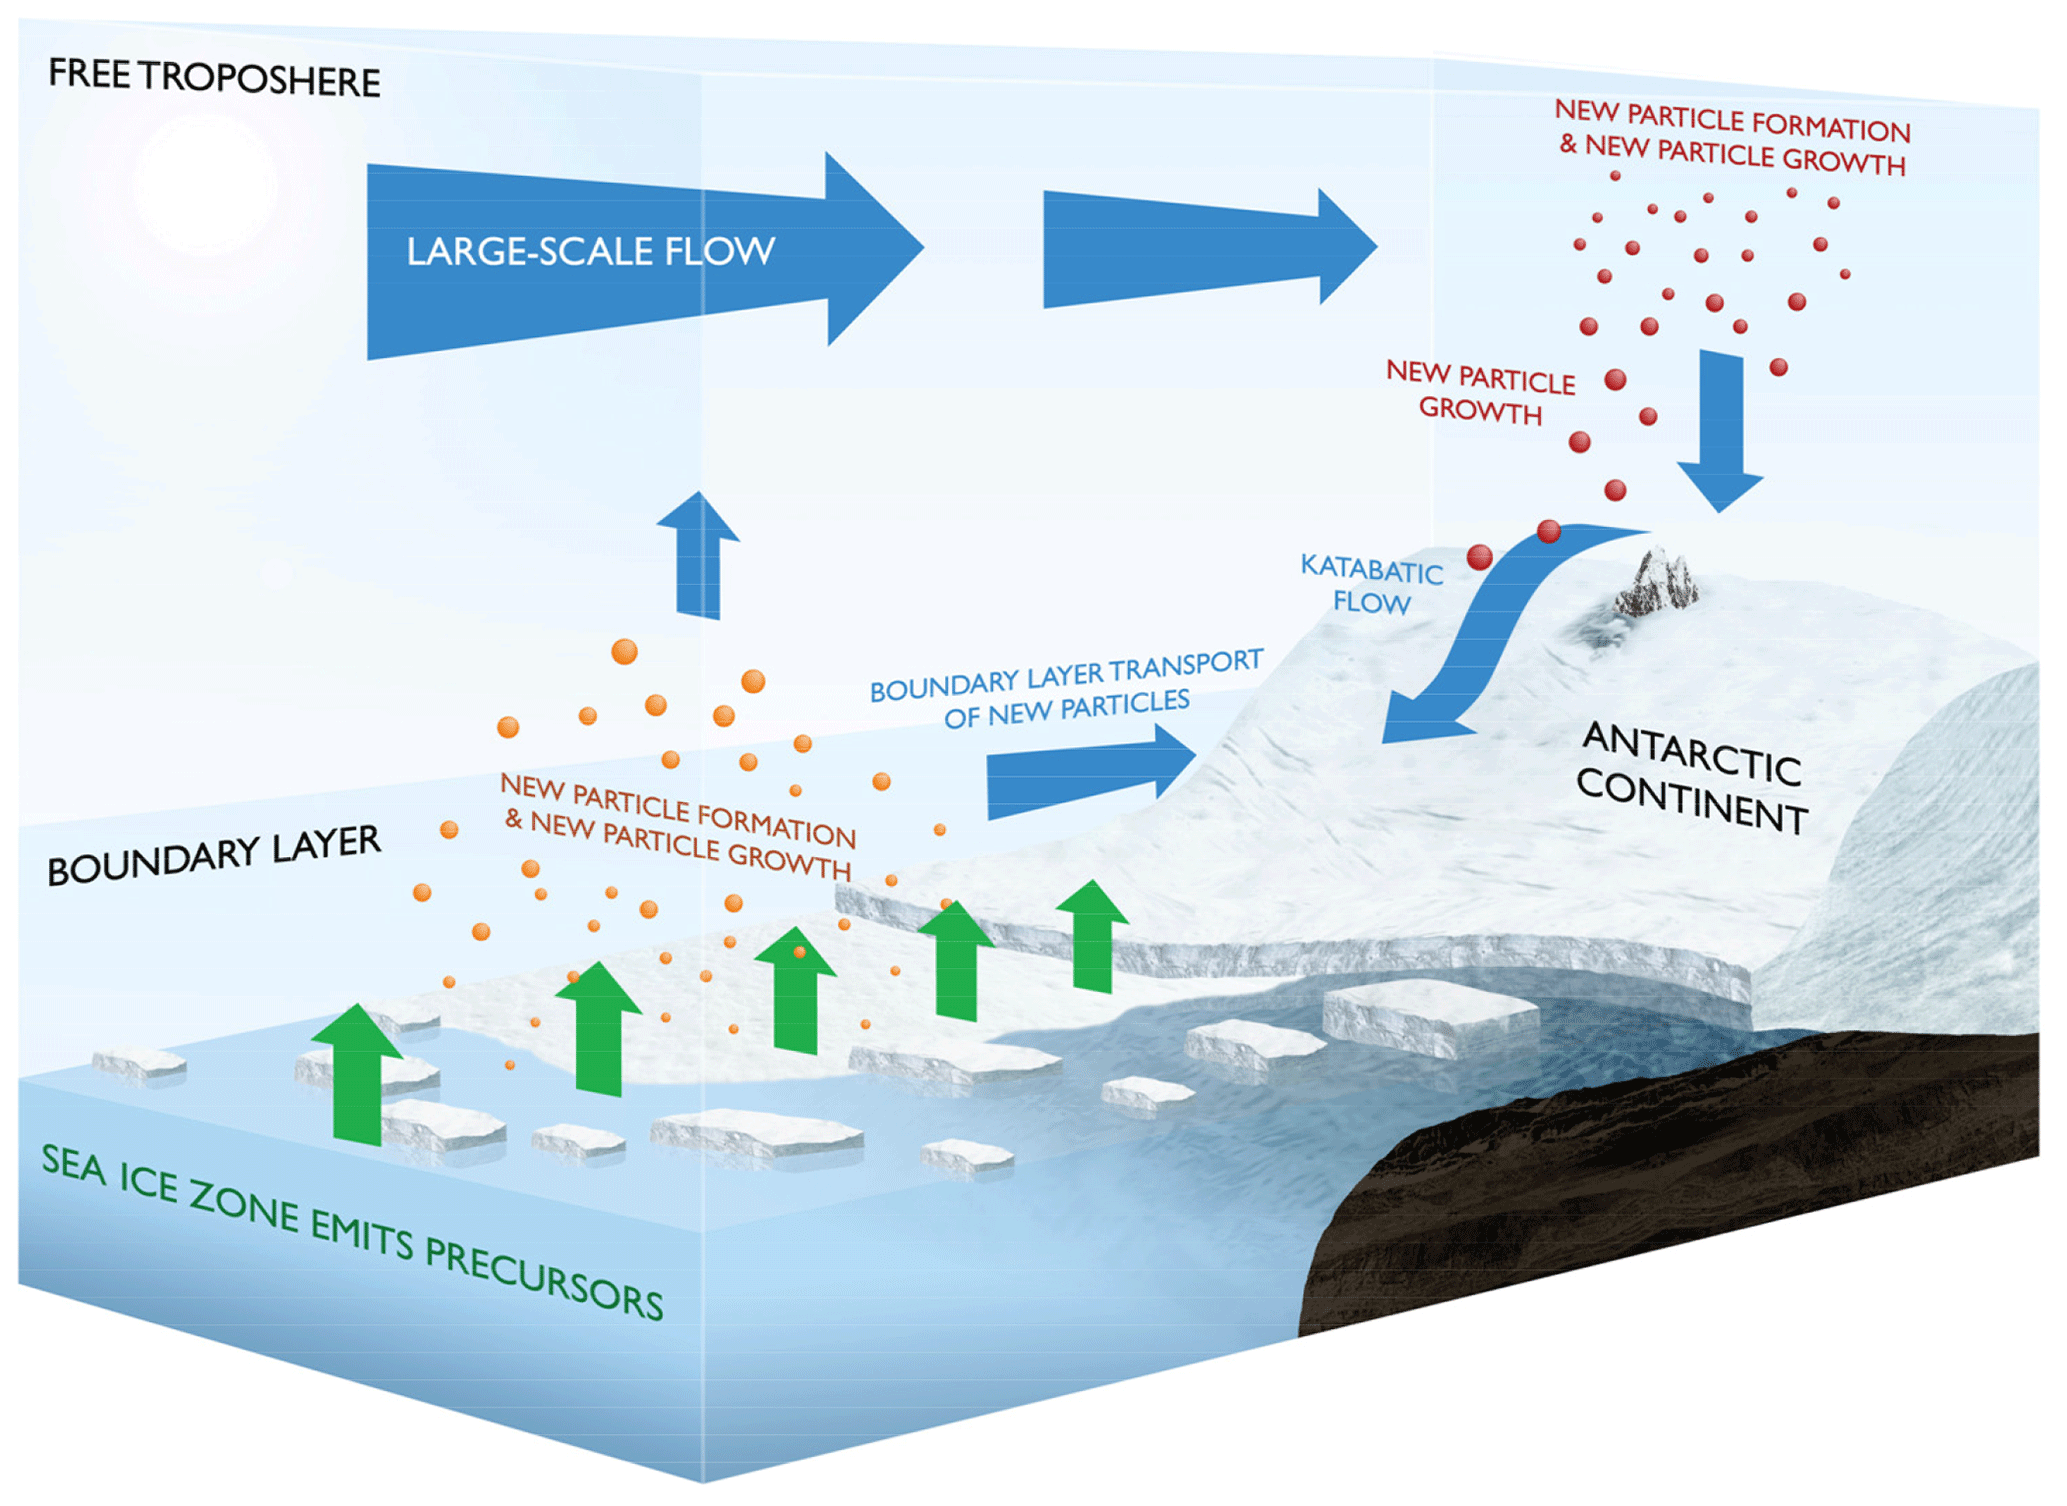
Figure 8Schematic illustrations of the ultrafine new particle formation (NPF) and new particle growth (NPG) aerosols in Antarctica.
We obtained data from Dome C and King Sejong (KS) Station for the period May–December 2015 and compared them with Halley (H). Data are shown in Fig. 6 where seasonal mean aerosol size distributions measured simultaneously at three different sites are reported for (a) May–December 2015 (8 months in total), (b) spring (September, October and November; 3 months in total), (c) summer (December; 1 month in total) and (d) winter (June, July and August; 3 months in total; a map of the three stations considered is shown in Fig. 7. Overall, much higher concentrations are seen at the coastal Antarctic sites (H and KS) relative to Dome C (Fig. 6a). The presence of permanent Antarctic stations could also affect aerosol size distributions (Kim et al., 2017); future studies will aim at comparing aerosol size distributions data simultaneously collected in different Antarctic stations. Two broad modes at about 30–50 nm and at about 110–160 nm can be seen for the coastal stations, whereas a smaller single mode at 60 nm is seen for the Dome C station. When three seasons are compared, very different features can be seen. During spring (Fig. 6b), both Aitken and accumulation modes dominate the coastal sites, whereas a strong single mode is seen in the Dome C site. By contrast, during summer (Fig. 6c), much stronger nucleation and Aitken modes are seen at the coastal sites, likely due to NPF taking place during summer time. The smaller nucleation mode size detected in the Antarctic Peninsula (King Sejong Station) relative to the one seen at Halley may suggest a more local source of NPF in the Antarctic Peninsula, including open water, coastal macroalgae and bird colonies. The average size distributions during winter (Fig. 6d) again show marked differences among the three different monitoring sites. Halley Research Station shows the largest aerosol modes (about 100 and 160 nm), whereas smaller modes can be seen at the other two sites. Overall, Fig. 6 serves to stress that the aerosol population in Antarctica – an environment often considered homogenous and simple to study – is different in different geographical regions, and very likely a number of different processes and sources affect the aerosol population at different times of the year. Ito (1993) presented a conceptual diagram where different aerosol size distributions were seen, and a main NPF mode was associated with the free troposphere and transported by katabatic winds. Korhonen et al. (2008) also estimated that over 90 % of the non-sea-spray CCN were generated above the boundary layer by the nucleation of sulfuric acid aerosol in the free troposphere. Our results point to sea ice regions and open-ocean water being a source not only of gaseous precursors but also of new particle formation. These then can growth once lifted in the free troposphere (Fig. 8), and larger modes are brought down again by the Antarctic drainage flow (James, 1989). The relative importance of free-troposphere versus boundary layer nucleation is not known at this stage, but this study shows that the latter is seen, and the former is likely to happen and contribute to the Aitken mode detected from the Antarctic plateau. Sea ice regions (mainly via secondary processes but also to a lesser degree via sea spray and blowing snow) may control the CCN production, both regulating the first stage of nucleation events and providing gaseous precursors and slowly growing nucleated particles with transport in the upper troposphere.
These results are in line with previous studies in polar areas. First, Dall'Osto et al. (2017a) suggested that the microbiota of sea ice and the sea-ice-influenced ocean were a significant source of atmospheric nucleating particles concentrations (N1–3 nm). Second, within two different Arctic locations across large temporal scales (2000–2016) new particle formation was associated with air mass back trajectories passing over open water and melting-sea-ice regions, also pointing to marine biological activities within the open leads in the pack ice and/or along the melting marginal sea ice zone (MIZ) being responsible for such events (Dall'Osto et al., 2017b, 2018b). Our data from Halley and the brief intercomparison with two other stations suggest that the size distributions of Antarctic sub-micrometre aerosols may have been oversimplified in the past (Ito, 1993) and that complex interactions between multiple ecosystems, coupled with different atmospheric circulation, result in very different aerosol size distributions populating the Southern Hemisphere. We simply know too little about the sources of primary and secondary aerosols of biogenic origin. Further studies are needed in order to quantify the baseline aerosol properties in the polar regions and determine how they are affected by emission processes and atmospheric processing and ageing. Future work in preparation will soon address these questions by an analysis of aerosol size distributions simultaneously detected around the Antarctic continent.
Data can be accessed by contacting the corresponding author.
The supplement related to this article is available online at: https://doi.org/10.5194/acp-20-4461-2020-supplement.
DB and MD conducted the analysis and wrote the paper. TCL, NB and AJ provided the Halley SMPS data. AL, YJY and AV provided additional SMPS data. All authors edited and contributed to subsequent drafts of the paper.
The authors declare that they have no conflict of interest.
The authors are grateful to the overwintering staff at Halley Research Station who carried out the suite of measurements presented here. This work was funded by the Natural Environment Research Council as part of the British Antarctic Survey's research programme “Polar Science for Planet Earth”. We thank Pasi Aalto (Institute for Atmospheric and Earth System Research, University of Helsinki) and the joint French–Italian Concordia Program with the project LTCPAA for providing DMPS data for 2015 for intercomparison with data taken at Halley Research Station; similar data were discussed in detail elsewhere (Järvinen et al., 2013; Kim et al., 2017).
The study was further supported by the Spanish Ministry of Economy through project PI-ICE (no. CTM 2017–89117-R) and the Ramon y Cajal fellowship (no. RYC-2012-11922). The National Centre for Atmospheric Science (NCAS) Birmingham group is funded by the UK Natural Environment Research Council. Aki Virkkula was supported by the Academy of Finland's Centre of Excellence programme (Centre of Excellence in Atmospheric Science – From Molecular and Biological processes to The Global Climate; project no. 272041). The KS station SMPS measurement was supported by the KOPRI project (no. PE20060).
This paper was edited by Veli-Matti Kerminen and reviewed by four anonymous referees.
Atkinson, H. M., Huang, R.-J., Chance, R., Roscoe, H. K., Hughes, C., Davison, B., Schönhardt, A., Mahajan, A. S., Saiz-Lopez, A., Hoffmann, T., and Liss, P. S.: Iodine emissions from the sea ice of the Weddell Sea, Atmos. Chem. Phys., 12, 11229–11244, https://doi.org/10.5194/acp-12-11229-2012, 2012.
Becker, R. A. and Wilks, A. R.: R version by Ray Brownrigg, Enhancements by Minka, T. P. and Deckmyn, A., maps: Draw Geographical Maps, R package version 3.3.0, available at: https://CRAN.R-project.org/package=maps (last access: April 2020), 2018.
Beddows, D. C. S., Dall'Osto, M., and Harrison, R. M.: Cluster Analysis of Rural, Urban and Curbside Atmospheric Particle Size Data, Environ. Sci. Technol., 43, 4694–4700, 2009.
Beddows, D. C. S., Dall'Osto, M., Harrison, R. M., Kulmala, M., Asmi, A., Wiedensohler, A., Laj, P., Fjaeraa, A. M., Sellegri, K., Birmili, W., Bukowiecki, N., Weingartner, E., Baltensperger, U., Zdimal, V., Zikova, N., Putaud, J.-P., Marinoni, A., Tunved, P., Hansson, H.-C., Fiebig, M., Kivekäs, N., Swietlicki, E., Lihavainen, H., Asmi, E., Ulevicius, V., Aalto, P. P., Mihalopoulos, N., Kalivitis, N., Kalapov, I., Kiss, G., de Leeuw, G., Henzing, B., O'Dowd, C., Jennings, S. G., Flentje, H., Meinhardt, F., Ries, L., Denier van der Gon, H. A. C., and Visschedijk, A. J. H.: Variations in tropospheric submicron particle size distributions across the European continent 2008–2009, Atmos. Chem. Phys., 14, 4327–4348, https://doi.org/10.5194/acp-14-4327-2014, 2014.
Beddows, D. C. S. and Harrison, R. M.: Receptor modelling of both particle composition and size distribution from a background site in London, UK – a two-step approach, Atmos. Chem. Phys., 19, 4863–4876, https://doi.org/10.5194/acp-19-4863-2019, 2019.
Bertram, T. H., Cochran, R. E., Grassian, V. H., and Stone, E. A.: Sea spray aerosol chemical composition: Elemental and molecular mimics for laboratory studies of heterogeneous and multiphase reactions, Chem. Soc. Rev., 47, 2374–2400, 2018
Boucher, O., Randall, D., Artaxo, P., Bretherton, C., Feingold, G., Forster, P., Kerminen, V. M., Kondo, Y., Liao, H., Lohmann, U., Rasch, P., Satheesh, S., Sherwood, S., Stevens, B., and Zhang, X.: Clouds and aerosols, in: Climate change 2013: the physical science basis, Contribution of working group I to the fifth assessment report of the intergovernmental panel on climate change, edited by: Stocker, T. F., Qin, D., Plattner, G. K., Tignor, M., Allen, S., Boschung, J., Nauels, A., Xia, Y., Bex, V., and Midgley, P., chap. 7, Cambridge Universtiy Press, Cambridge, 2013.
Brooks, S. D. and Thornton, D. C. O.: Marine Aerosols and Clouds, Annu. Rev. Mar. Sci., 10, 289–313, 2018.
Carslaw, K. S., Lee, L. A., Reddington, C. L., Pringle, K. J., Rap, A., Forster, P. M., Mann, G. W., Spracklen, D. V., Woodhouse, M. T., Regayre, L. A., and Pierce, J. R.: Large contribution ofnatural aerosols to uncertainty in indirect forcing, Nature, 503, 67–71, https://doi.org/10.1038/nature12674, 2013.
Carslaw, D. C. and Ropkins, K.: openair – an R package for air quality data analysis, Environ. Model. Softw., 27–28, 52–61, https://doi.org/10.1016/j.envsoft.2011.09.008, 2012.
Charlson, R. J., Lovelock, J. E., Andreae, M. O., and Warren, S. G.: Oceanic Phytoplankton, Atmospheric Sulfur, Cloud Albedo and Climate, Nature, 326, 655–661, https://doi.org/10.1038/326655a0, 1987.
Chen, J. L., Wilson, C. R., Blankenship, D., and Tapley, B. D.: Accelerated Antarctic ice loss from satellite gravity measurements, Nat.Geosci., 2, 859–862, https://doi.org/10.1038/ngeo694, 2009.
Dall'Osto, M., Beddows, D. C. S., Tunved, P., Krejci, R., Ström,J., Hansson, H.-C., Yoon, Y. J., Park, K.-T., Becagli, S., Udisti,R., Onasch, T., O'Dowd, C. D., Simó, R., and Harrison, R. M.:Arctic sea ice melt leads to atmospheric new particle formation, Sci. Rep., 7, 3318, https://doi.org/10.1038/s41598-017-03328-1, 2017a.
Dall'Osto, M., Ovadnevaite, J., Paglione, M., Beddows, D. C. S., Ceburnis, D., Cree, C., Cortes, P., Zamanillo, M., Nunes, S. O., Perez, G. L., Ortega-Retuerta, E., Emelianov, M., Vaque, D., Marrase, C., Estrada, M., Sala, M. M., Vidal, M., Fitzsimons, M. F., Beale, R., Airs, R., Rinaldi, M., Decesari, S., Facchini, M. C., Harrison, R. M., O'Dowd, C., and Simo, R.: Antarctic sea ice region as a source of biogenic organic nitrogen in aerosols, Sci. Rep., 7, 6047, https://doi.org/10.1038/s41598-017-06188-x, 2017b.
Dall'Osto, M., Beddows, D. C. S., Asmi, A., Poulain, L., Hao, L., Freney, E., Allan, J. D., Canagaratna, M., Crippa, M., Bianchi, F., de Leeuw, G., Eriksson, A., Swietlicki, E., Hansson, H. C., Henzing, J. S., Granier, C., Zemankova, K., Laj, P., Onasch, T., Prevot, A., Putaud, J. P., Sellegri, K., Vidal, M., Virtanen, A., Simo, R., Worsnop, D., O'Dowd, C., Kulmala, M., and Harrison, R. M.: Novel insights on new particle formation derived from a paneuropean observing system, Sci. Rep., 8, 1482, https://doi.org/10.1038/s41598-017-17343-9, 2018a.
Dall'Osto, M., Geels, C., Beddows, D. C. S., Boertmann, D., Lange, R., Nøjgaard, J. K., Harrison Roy, M., Simo, R., Skov, H., and Massling, A.: Regions of open water and melting sea ice drive new particle formation in North East Greenland, Sci. Rep., 8, 6109, https://doi.org/10.1038/s41598-018-24426-8, 2018b.
Dall'Osto, M., Beddows, D. C. S., Tunved, P., Harrison, R. M., Lupi, A., Vitale, V., Becagli, S., Traversi, R., Park, K.-T., Yoon, Y. J., Massling, A., Skov, H., Lange, R., Strom, J., and Krejci, R.: Simultaneous measurements of aerosol size distributions at three sites in the European high Arctic, Atmos. Chem. Phys., 19, 7377–7395, https://doi.org/10.5194/acp-19-7377-2019, 2019.
Davison, B, O'Dowd, C., Hewitt, C., Smith, M., Harrison Roy, M., Peel, D., Wolf, E., Mulvaney, R., Schwikowski, M., and Baltensperger, U.: Dimethylsulfide and its oxidation products in the atmosphere of the Atlantic and southern oceans, Atmos. Environ., 30, 1895–1906, 1996.
Draxler, R. R. and Hess, G. D.: An Overview of the HYSPLIT_4 Modeling System of Trajectories, Dispersion, and Deposition, Aust. Meteorol. Mag., 47, 295–308, 1998.
Fetterer, F., Knowles, K., Meier, W. N., Savoie, M., and Windnagel, A. K.: Sea Ice Index, Version 3. [Indicate subset used]. Boulder, Colorado USA, NSIDC: National Snow and Ice Data Center, https://doi.org/https://doi.org/10.7265/N5K072F8.2019, 2017, updated daily.
Fiebig, M., Hirdman, D., Lunder, C. R., Ogren, J. A., Solberg, S., Stohl, A., and Thompson, R. L.: Annual cycle of Antarctic baseline aerosol: controlled by photooxidation-limited aerosol formation, Atmos. Chem. Phys., 14, 3083–3093, https://doi.org/10.5194/acp-14-3083-2014, 2014.
Fossum, K. N., Ovadnevaite, J., Ceburnis, D., Dall'Osto, M., Marullo, S., Bellacicco, M., Simó, R., Liu, D., Flynn, M., Zuend, A., and O'Dowd, C.: Summertime primary and secondary contributions to Southern Ocean cloud condensation nuclei, Sci. Rep., 8, 13844, https://doi.org/10.1038/s41598-018-32047-4, 2018.
Frey, M. M., Norris, S. J., Brooks, I. M., Anderson, P. S., Nishimura, K., Yang, X., Jones, A. E., Nerentorp Mastromonaco, M. G., Jones, D. H., and Wolff, E. W.: First direct observation of sea salt aerosol production from blowing snow above sea ice, Atmos. Chem. Phys., 20, 2549–2578, https://doi.org/10.5194/acp-20-2549-2020, 2020.
Gantt, B. and Meskhidze, N.: The physical and chemical characteristics of marine primary organic aerosol: a review, Atmos. Chem. Phys., 13, 3979–3996, https://doi.org/10.5194/acp-13-3979-2013, 2013.
Giordano, M. R., Kalnajs, L. E., Goetz, J. D., Avery, A. M., Katz, E., May, N. W., Leemon, A., Mattson, C., Pratt, K. A., and DeCarlo, P. F.: The importance of blowing snow to halogen-containing aerosol in coastal Antarctica: influence of source region versus wind speed, Atmos. Chem. Phys., 18, 16689–16711, https://doi.org/10.5194/acp-18-16689-2018, 2018.
Gong, S. L., Barrie, L. A., and Lazare, M.: Canadian Aerosol Module (CAM): A size‐segregated simulation of atmospheric aerosol processes for climate and air quality models 2. Global sea‐salt aerosol and its budgets, J. Geophys. Res., 107, 4779, https://doi.org/10.1029/2001JD002004, 2002.
Gras, J. L.: CN, CCN and particle size in Southern Ocean air at Cape Grim, Atmos. Res., 35, 237–251, 1995.
Gras, J. L. and Keywood, M.: Cloud condensation nuclei over the Southern Ocean: wind dependence and seasonal cycles, Atmos. Chem. Phys., 17, 4419–4432, https://doi.org/10.5194/acp-17-4419-2017, 2017.
Halkidi, M., Batistakis, Y., and Vazirgiannis, M.: On Clustering Validation Techniques, J. Intell. Inf. Syst., 17, 107–145, 2001
Hamed, A., Korhonen, H., Sihto, S.-L., Joutsensaari, J., Jarvinen, H., Petaja, T., Arnold, F., Nieminen, T., Kulmala, M., Smith, J. N., Lehtinen, K. E. J., and Laaksonen, A.: The role of relative humidity in continental new particle formation, J. Geophys. Res., 116, D03202, https://doi.org/10.1029/2010JD014186, 2011.
Hamilton, D. S., Lee, L. A., Pringle, K. J., Reddington, C. L., Spracklen, D. V., and Carslaw, K. S.: Occurrence of pristine aerosol environments on a polluted planet, P. Natl. Acad. Sci. USA, 111, 18466–18471, https://doi.org/10.1073/pnas.1415440111, 2014.
Hara, K., Osada, K., Nishita-Hara, C., and Yamanouchi, T.: Seasonal variations and vertical features of aerosol particles in the Antarctic troposphere, Atmos. Chem. Phys., 11, 5471–5484, https://doi.org/10.5194/acp-11-5471-2011, 2011.
Herenz, P., Wex, H., Mangold, A., Laffineur, Q., Gorodetskaya, I. V., Fleming, Z. L., Panagi, M., and Stratmann, F.: CCN measurements at the Princess Elisabeth Antarctica research station during three austral summers, Atmos. Chem. Phys., 19, 275–294, https://doi.org/10.5194/acp-19-275-2019, 2019.
Hijmans, R. J.: raster: Geographic Data Analysis and Modeling. R package version 2.9-23, available at: https://CRAN.R-project.org/package=raster (last access: 10 April 2020), 2019.
Hoppel, W. A., Frick, G. M., and Fitzgerald, J. W.: Marine boundary layer measurements of new-particle formation and the effects of non-precipitating clouds have on aerosol size distribution, J. Geophys. Res., 99, 14443–14459, 1994.
Huang, J., Jaeglé, L., and Shah, V.: Using CALIOP to constrain blowing snow emissions of sea salt aerosols over Arctic and Antarctic sea ice, Atmos. Chem. Phys., 18, 16253–16269, https://doi.org/10.5194/acp-18-16253-2018, 2018.
Humphries, R. S., Schofield, R., Keywood, M. D., Ward, J., Pierce, J. R., Gionfriddo, C. M., Tate, M. T., Krabbenhoft, D. P., Galbally, I. E., Molloy, S. B., Klekociuk, A. R., Johnston, P. V., Kreher, K., Thomas, A. J., Robinson, A. D., Harris, N. R. P., Johnson, R., and Wilson, S. R.: Boundary layer new particle formation over East Antarctic sea ice – possible Hg-driven nucleation?, Atmos. Chem. Phys., 15, 13339–13364, https://doi.org/10.5194/acp-15-13339-2015, 2015.
Ito, T.: Size distribution of Antarctic submicron aerosols, Tellus B, 45, 145–59, 1993.
James, I. M.: The Antarctic drainage flow: implications for hemispheric flow on the Southern Hemisphere, Antarct. Sci., 1, 279–290, 1989.
Jang, E., Park, K.-T., Yoon, Y. J., Kim, T.-W., Hong, S.-B., Becagli, S., Traversi, R., Kim, J., and Gim, Y.: New particle formation events observed at the King Sejong Station, Antarctic Peninsula – Part 2: Link with the oceanic biological activities, Atmos. Chem. Phys., 19, 7595–7608, https://doi.org/10.5194/acp-19-7595-2019, 2019.
Järvinen, E., Virkkula, A., Nieminen, T., Aalto, P. P., Asmi, E., Lanconelli, C., Busetto, M., Lupi, A., Schioppo, R., Vitale, V., Mazzola, M., Petäjä, T., Kerminen, V.-M., and Kulmala, M.: Seasonal cycle and modal structure of particle number size distribution at Dome C, Antarctica, Atmos. Chem. Phys., 13, 7473–7487, https://doi.org/10.5194/acp-13-7473-2013, 2013.
Jokinen, T., Sipilä, M., Kontkanen, J., Vakkari, V., Tisler, P., Duplissy, E.-M., Junninen, H., Kangasluoma, J., Manninen, H. E., Petäjä, T., Kulmala, M., Worsnop, D. R., Kirkby, J., Virkkula, A., and Kerminen, V.-M.: Ion-induced sulfuric acid–ammonia nucleation drives particle formation in coastal Antarctica, Sci. Adv., 4, eaat9744, https://doi.org/10.1126/sciadv.aat9744, 2018.
Jones, A. E., Wolff, E. W., Salmon, R. A., Bauguitte, S. J.-B., Roscoe, H. K., Anderson, P. S., Ames, D., Clemitshaw, K. C., Fleming, Z. L., Bloss, W. J., Heard, D. E., Lee, J. D., Read, K. A., Hamer, P., Shallcross, D. E., Jackson, A. V., Walker, S. L., Lewis, A. C., Mills, G. P., Plane, J. M. C., Saiz-Lopez, A., Sturges, W. T., and Worton, D. R.: Chemistry of the Antarctic Boundary Layer and the Interface with Snow: an overview of the CHABLIS campaign, Atmos. Chem. Phys., 8, 3789–3803, https://doi.org/10.5194/acp-8-3789-2008, 2008.
Jung, J., Hong, S.-B., Chen, M., Hur, J., Jiao, L., Lee, Y., Park, K., Hahm, D., Choi, J.-O., Yang, E. J., Park, J., Kim, T.-W., and Lee, S.: Characteristics of biogenically-derived aerosols over the Amundsen Sea, Antarctica, Atmos. Chem. Phys. Discuss., https://doi.org/10.5194/acp-2019-133, in review, 2019.
Kalnay, E., Kanamitsu, M., Kistler, R., Collins, W., Deaven, D., Gandin, L., Iredell, M., Saha, S., White, G., Woollen, J., Zhu, Y., Chelliah, M., Ebisuzaki, W., Higgins, W., Janowiak, J., Mo, K. C., Ropelewski, C., Wang, J., Leetmaa, A., Reynolds, R., Jenne, R., and Joseph D.: The NCEP/NCAR 40-year Reanalysis project, B. Am. Meteorol. Soc., 77, 437–471, https://doi.org/10.1175/1520-0477(1996)077<0437:TNYRP>2.0.CO;2, 1996
Kerminen, V.-M., Chen, X., Vakkari, V., Petäjä, T., Kulmala, M., and Bianchi, F.: Atmospheric new particle formation and growth: review of field observations, Environ. Res. Lett., 13, 103003, https://doi.org/10.1088/1748-9326/aadf3c, 2018.
Kim, J., Yoon, Y. J., Gim, Y., Kang, H. J., Choi, J. H., Park, K.-T., and Lee, B. Y.: Seasonal variations in physical characteristics of aerosol particles at the King Sejong Station, Antarctic Peninsula, Atmos. Chem. Phys., 17, 12985–12999, https://doi.org/10.5194/acp-17-12985-2017, 2017.
Kim, J., Yoon, Y. J., Gim, Y., Choi, J. H., Kang, H. J., Park, K.-T., Park, J., and Lee, B. Y.: New particle formation events observed at King Sejong Station, Antarctic Peninsula – Part 1: Physical characteristics and contribution to cloud condensation nuclei, Atmos. Chem. Phys., 19, 7583–7594, https://doi.org/10.5194/acp-19-7583-2019, 2019.
Koponen, I. K., Virkkula, A., Hillamo, R., Kerminen, V.-M., and Kulmala, M.: Number size distributions of marine aerosols: observations during a cruise between the English Channel and coast of Antarctica, J. Geophys. Res., 107, 4753, https://doi.org/10.1029/2002JD002533, 2002.
Koponen, I. K., Virkkula, A., Hillamo, R., Kerminen, V.-M., and Kulmala, M.: Number size distributions and concentrations of the continental summer aerosols in Queen Maud Land, Antarctica, J. Geophys. Res., 108, 4587, https://doi.org/10.1029/2003JD003614, 2003.
Korhonen, H., Carslaw, K. S., Spracklen, D. V., Mann, G., W., and Woodhouse, M. T.: Influence of oceanic dimethyl sulfide emissions on cloud condensation nuclei concentrations and seasonality over the remote Southern Hemisphere oceans: A global model study, J. Geophys. Res.-Atmos., 113, D15204, https://doi.org/10.1029/2007JD009718, 2008.
Kyrö, E.-M., Kerminen, V.-M., Virkkula, A., Dal Maso, M., Parshintsev, J., Ruíz-Jimenez, J., Forsström, L., Manninen, H. E., Riekkola, M.-L., Heinonen, P., and Kulmala, M.: Antarctic new particle formation from continental biogenic precursors, Atmos. Chem. Phys., 13, 3527–3546, https://doi.org/10.5194/acp-13-3527-2013, 2013.
Laaksonen, A., Kulmala, M., O'Dowd, C. D., Joutsensaari, J., Vaattovaara, P., Mikkonen, S., Lehtinen, K. E. J., Sogacheva, L., Dal Maso, M., Aalto, P., Petäjä, T., Sogachev, A., Yoon, Y. J., Lihavainen, H., Nilsson, D., Facchini, M. C., Cavalli, F., Fuzzi, S., Hoffmann, T., Arnold, F., Hanke, M., Sellegri, K., Umann, B., Junkermann, W., Coe, H., Allan, J. D., Alfarra, M. R., Worsnop, D. R., Riekkola, M.-L., Hyötyläinen, T., and Viisanen, Y.: The role of VOC oxidation products in continental new particle formation, Atmos. Chem. Phys., 8, 2657–2665, https://doi.org/10.5194/acp-8-2657-2008, 2008.
Lange, R., Dall'Osto, M., Skov, H., Nielsen, I. E., Beddows, D. C. S., Simo, R., Harrison, R. M., and Massling, A.: Characterization of distinct Arctic Aerosol Accumulation Modes and their Sources, Atmos. Environ., 183, 1–10, 2018.
Legrand, M., Yang, X., Preunkert, S., and Theys, N.: Year‐round records of sea salt, gaseous, and particulate inorganic bromine in the atmospheric boundary layer at coastal (Dumont d'Urville) and central (Concordia) East Antarctic sites, J. Geophys. Res., 121, 997–1023, https://doi.org/10.1002/2015JD024066, 2016.
Liu, J., Dedrick, J., Russell, L. M., Senum, G. I., Uin, J., Kuang, C., Springston, S. R., Leaitch, W. R., Aiken, A. C., and Lubin, D.: High summertime aerosol organic functional group concentrations from marine and seabird sources at Ross Island, Antarctica, during AWARE, Atmos. Chem. Phys., 18, 8571–8587, https://doi.org/10.5194/acp-18-8571-2018, 2018.
McCoy, D. T., Burrows, S. M., Wood, R., Grosvenor, D. P., Elliott, S. M., Ma, P.-L., Rasch, P. J., and Hartmann, D. L.: Natural aerosols explain seasonal and spatial patterns of Southern Ocean cloud albedo, Sci. Adv., 1, e1500157, https://doi.org/10.1126/sciadv.1500157, 2015.
McIlroy, D.: Packaged for R by Ray Brownrigg, Thomas P Minka and transition to Plan 9 codebase by Roger Bivand.mapproj: Map Projections, R package version 1.2.6, available at: https://CRAN.R-project.org/package=mapproj (last access: 10 April 2020), 2018.
Meskhize, N. and Nenes, A.: Phytoplankton and cloudiness in the Southern Ocean, Science, 314, 1419–1423, https://doi.org/10.1126/science.1131779, 2006.
Murphy, D. M., Froyd, K. D., Bian, H., Brock, C. A., Dibb, J. E., DiGangi, J. P., Diskin, G., Dollner, M., Kupc, A., Scheuer, E. M., Schill, G. P., Weinzierl, B., Williamson, C. J., and Yu, P.: The distribution of sea-salt aerosol in the global troposphere, Atmos. Chem. Phys., 19, 4093–4104, https://doi.org/10.5194/acp-19-4093-2019, 2019.
O'Dowd, C. D., Smith, M. H., Consterdine, I. E., and Lowe, J. A.: Marine erosol, sea-salt, and the marinesulphur cycle – a short review, Atmos. Environ. 31, 73–80, 1997a.
O'Dowd, C. D, Lowe, J. A., Smith, M. H., Davison, B., Hewitt, C. N., and Harrison, R. M.: Biogenic sulphur emissions and inferred non-sea-salt-sulphate cloud condensation nuclei in and around Antarctica, J. Geophys. Res.-Atmos. 102, 12839–12854, 1997b.
Quinn, P. K. and Bates, T. S.: The case against climate regulation via oceanic phytoplankton sulphur emissions, Nature, 480, 51–56, https://doi.org/10.1038/nature10580, 2011.
Quinn, P. K., Collins, D. B., Grassian, V. H., Prather, K. A., and Bates, T. S.: Chemistry and Related Properties of FreshlyEmitted Sea Spray Aerosol, Chem. Rev., 115, 4383–4399, https://doi.org/10.1021/cr500713g, 2015.
Quinn, P. K., Coffman, D. J., Johnson, J. E., Upchurch, L. M., and Bates, T. S.: Small fraction of marine cloud condensation nucleimade up of sea spray aerosol, Nat. Geosci., 10, 674–679, https://doi.org/10.1038/ngeo3003, 2017.
Rankin, A. M. and Wolff, E. W.: A year-long record of size-segregated aerosol composition at Halley, Antarctica, J. Geophys. Res., 108, 4775, https://doi.org/10.1029/2003JD003993, 2003.
Reddington, C., Carslaw, K., Stier, P., Schutgens, N., Coe, H., Liu, D., Allan, J., Pringle, K., Lee, L., and Yoshioka, M.: The GlobalAerosol Synthesis and Science Project (GASSP): measurements and modelling to reduce uncertainty, B. Am. Meteorol. Soc., 98, 1857–1877, 2017.
Roscoe, H. K., Jones, A. E., Brough, N., Weller, R., Saiz-Lopez, A., Mahajan, A. S., Schoenhardt, A., Burrows, J. P., and Fleming, Z. L.: Particles and iodine compounds in coastal Antarctica, J. Geophys. Res.-Atmos., 120, 7144–7156, https://doi.org/10.1002/2015JD023301, 2015.
Rousseeuw, P. J.: Silhouettes: a graphical aid to the interpretation and validation of cluster analysis, J. Comput. Appl. Math., 20, 53–65, 1987.
Saiz-Lopez, A., Mahajan, A. S., Salmon, R. A., Bauguitte, S. J.-B., Jones, A. E., Roscoe, H. K., and Plane, J. M. C.: Boundary layer halogens in coastal Antarctica, Science, 317, 348–351, 2007.
Sanchez, K. J., Chen, C.-L., Russell, L. M., Betha, R., Liu, J., Price, D. J., Massoli, P., Ziemba, L. D., Crosbie, E. C., Moore, R. H., Müller, M., Schiller, S. A., Wisthaler, A., Lee, A. K. Y., Quinn, P. K., Bates, T. S., Porter, J., Bell, T. G., Saltzman, E. S., Vaillancourt, R. D., and Behrenfeld, M. J.: Substantial seasonal contribution of observed biogenic sulfate particles to cloud condensation nuclei, Sci. Rep., 8, 3235, https://doi.org/10.1038/s41598-018-21590-9, 2018.
Schmale, J., Schneider, J., Nemitz, E., Tang, Y. S., Dragosits, U., Blackall, T. D., Trathan, P. N., Phillips, G. J., Sutton, M., and Braban, C. F.: Sub-Antarctic marine aerosol: dominant contributions from biogenic sources, Atmos. Chem. Phys., 13, 8669–8694, https://doi.org/10.5194/acp-13-8669-2013, 2013.
Schönhardt, A., Richter, A., Wittrock, F., Kirk, H., Oetjen, H., Roscoe, H. K., and Burrows, J. P.: Observations of iodine monoxide columns from satellite, Atmos. Chem. Phys., 8, 637–653, https://doi.org/10.5194/acp-8-637-2008, 2008.
Shaw, G. E.: Considerations on the Origin and Properties of the Antarctic Aerosol, Rev. Geophys., 17, 1983–1998, 1988.
Sipilä, M., Sarnela, N., Jokinen, T., Henschel, H., Junninen, H., Kontkanen, J., ichters, S., Kangasluoma, J., Franchin, A., Peräkylä, O., Rissanen, M. P., Ehn, M., Vehkamäki, H., Kurten, T., Berndt, T., Petäjä, T., Worsnop, D., Ceburnis, D., Kerminen, V.-M., Kulmala, M., and O'Dowd, C.: Molecular-scale evidence of aerosol particle formation via sequential addition of HIO3, Nature, 537, 532–534, https://doi.org/10.1038/nature19314, 2016.
Teinilä, K., Frey, A., Hillamo, R., Tülp, H. C., and Weller, R.: A study of the sea-salt chemistry using size-segregated aerosol measurements at coastal Antarctic station Neumayer, Atmos. Environ., 96, 11–19, 2014.
Udisti, R., Dayan, U., Becagli, S., Busetto, M., Frosini, D.,Legrand, M., Lucarelli, F., Preunkert, S., Severi, M., Traversi, R., and Vitale, V.: Sea spray aerosol in central Antarctica, Present atmospheric behaviour and implications for paleoclimaticreconstructions, Atmos. Environ., 52, 109–120, https://doi.org/10.1016/j.atmosenv.2011.10.018, 2012.
Vallina, S. M. and Simó, R.: Re-visiting the CLAW hypothesis, Environ. Chem., 4, 384–387, https://doi.org/10.1071/EN07055, 2007.
Vignon, É., Traullé, O., and Berne, A.: On the fine vertical structure of the low troposphere over the coastal margins of East Antarctica, Atmos. Chem. Phys., 19, 4659–4683, https://doi.org/10.5194/acp-19-4659-2019, 2019.
Virkkula, A., Teinilä, K., Hillamo, R., Kerminen, V.-M., Saarikoski, S., Aurela, M., Viidanoja, J., Paatero, J., Koponen, I. K., and Kulmala, M.: Chemical composition of boundary layer aerosol over the Atlantic Ocean and at an Antarctic site, Atmos. Chem. Phys., 6, 3407–3421, https://doi.org/10.5194/acp-6-3407-2006, 2006.
Weller, R., Minikin, A., Wagenbach, D., and Dreiling, V.: Characterization of the inter-annual, seasonal, and diurnal variations of condensation particle concentrations at Neumayer, Antarctica, Atmos. Chem. Phys., 11, 13243–13257, https://doi.org/10.5194/acp-11-13243-2011, 2011.
Weller, R., Schmidt, K., Teinilä, K., and Hillamo, R.: Natural new particle formation at the coastal Antarctic site Neumayer, Atmos. Chem. Phys., 15, 11399–11410, https://doi.org/10.5194/acp-15-11399-2015, 2015.
Weller, R., Legrand, M., and Preunkert, S.: Size distribution and ionic composition of marine summer aerosol at the continental Antarctic site Kohnen, Atmos. Chem. Phys., 18, 2413–2430, https://doi.org/10.5194/acp-18-2413-2018, 2018.
Xu, G. J., Gao, Y., Lin, Q., Li, W., and Chen, L. Q.: Characteristics of water-soluble inorganic and organic ions in aerosols over the Southern Ocean and coastal East Antarctica during austral summer, J. Geophys. Res.-Atmos., 118, 13303–13318, https://doi.org/10.1002/2013jd019496, 2013.
Yang, X., Frey, M. M., Rhodes, R. H., Norris, S. J., Brooks, I. M., Anderson, P. S., Nishimura, K., Jones, A. E., and Wolff, E. W.: Sea salt aerosol production via sublimating wind-blown saline snow particles over sea ice: parameterizations and relevant microphysical mechanisms, Atmos. Chem. Phys., 19, 8407–8424, https://doi.org/10.5194/acp-19-8407-2019, 2019.
Zorn, S. R., Drewnick, F., Schott, M., Hoffmann, T., and Borrmann, S.: Characterization of the South Atlantic marine boundary layer aerosol using an aerodyne aerosol mass spectrometer, Atmos. Chem. Phys., 8, 4711–4728, https://doi.org/10.5194/acp-8-4711-2008, 2008.