the Creative Commons Attribution 4.0 License.
the Creative Commons Attribution 4.0 License.
 | 17 Apr 2020
Variability in cirrus cloud properties using a PollyXT Raman lidar over high and tropical latitudes
Kalliopi Artemis Voudouri
Elina Giannakaki
Mika Komppula
Dimitris Balis
Measurements of geometrical and optical properties of cirrus clouds, performed with a multi-wavelength PollyXT Raman lidar during the period 2008 to 2016, are analysed. The measurements were performed with the same instrument, during sequential periods, in three places at different latitudes, Gwal Pahari (28.43∘ N, 77.15∘ E; 243 m a.s.l.) in India, Elandsfontein (26.25∘ S, 29.43∘ E; 1745 m a.s.l.) in South Africa and Kuopio (62.74∘ N, 27.54∘ E; 190 m a.s.l.) in Finland. The lidar dataset was processed by an automatic cirrus cloud masking algorithm, developed in the frame of this work. In the following, we present a statistical analysis of the lidar-retrieved geometrical characteristics (cloud boundaries, geometrical thickness) and optical properties of cirrus clouds (cloud optical depth, lidar ratio, ice crystal depolarisation ratio) measured over the three areas that correspond to subtropical and subarctic regions as well as their seasonal variability. The effect of multiple scattering from ice particles to the derived optical products is also considered and corrected in this study. Our results show that cirrus layers, which have a noticeable monthly variability, were observed between 6.5 and 13 km, with temperatures ranging from −72 to −27 ∘C. The observed differences on cirrus clouds' geometrical and optical properties over the three regions are discussed in terms of latitudinal and temperature dependence. The latitudinal dependence of the geometrical properties is consistent with satellite observations, following the pattern observed with CloudSat, with decreasing values towards the poles. The geometrical boundaries have their highest values in the subtropical regions, and overall, our results seem to demonstrate that subarctic cirrus clouds are colder, lower and optically thinner than subtropical cirrus clouds. The dependence of cirrus cloud geometrical thickness and optical properties on mid-cirrus temperatures shows a quite similar tendency for the three sites but less variability for the subarctic dataset. Cirrus clouds are geometrically and optically thicker at temperatures between −45 and −35 ∘C, and a second peak is observed at lower temperatures ∘C for the subarctic site. Lidar ratio values also exhibit a pattern, showing higher values moving toward the poles, with higher mean values observed over the subarctic site. The dependency of the mid-cirrus temperatures on the lidar ratio values and the particle depolarisation values is further examined. Our study shows that the highest values of the cirrus lidar ratio correspond to higher values of cirrus depolarisation and warmer cirrus. The kind of information presented here can be rather useful in the cirrus parameterisations required as input to radiative transfer models and can be a complementary tool for satellite products that cannot provide cloud vertical structure. In addition, ground-based statistics of the cirrus properties could be useful in the validation and improvement of the corresponding derived products from satellite retrievals.
- Article
(2085 KB) - Full-text XML
- BibTeX
- EndNote


Cirrus clouds are usually formed in altitudes from 6 to 14 km, with an average thickness of 1.5 km and temperature variability from −80 to −27 ∘C (Westbrook and Illingworth, 2011). Cirrus clouds are made up predominantly, or entirely, of ice particles, and the shape of their hydrometeors varies, affected by air temperature, atmospheric pressure and ice supersaturation (Lynch et al., 2001). Given that cirrus clouds are challenging components in atmospheric and global climatological research, affecting the global radiation budget (e.g. Campbell et al., 2016), detailed monitoring of their properties at different geographical locations is crucial to understanding their effects on climate.
Active remote-sensing techniques, such as lidar and cloud radar instruments, have proved to be useful tools in providing continuous monitoring of high spatial and temporal distributions of cirrus cloud boundaries and their properties and, thus, enhance the opportunity of tracking cloud evolution both in time and height. The capability of a cloud radar to map vertical and temporal structures of cloud layers has already been well recognised in the scientific community (Illingworth et al., 2007). Additionally, elastic backscatter and Raman lidars have also been used for retrieving geometrical and optical properties of cirrus clouds (i.e. Ansmann et al., 1992; Gouveia et al., 2017). Moreover, portable multi-wavelength lidars (PollyXT) allow for 24∕7 monitoring of the atmospheric state (Engelmann et al., 2016) and can be used to establish long time series of aerosol and cloud measurements. Lidar observations also allow the retrieval of detailed hydrometeor properties, such as their sphericity, which is indicative of the shape of targets. The importance of ground-based lidar in monitoring cirrus clouds is based on the mapping of particularly optically thin high-altitude ice clouds which cannot produce sufficient reflectivity and as a consequence can be undetectable from cloud radars (Comstock et al., 2002) or from passive instruments. However, the lidar beam attenuates strongly in liquid water clouds, and, therefore, it is likely that in the case of multiple cloud layers, reliable detection of cirrus clouds cannot be ensured.
In the last decades, observations of cirrus cloud properties have been conducted both in terms of field experiments (e.g. Seifert et al., 2007) and systematic observations (e.g. Dionisi et al., 2013; Pandit et al., 2015) from ground-based lidar systems, providing an estimation of their dependence on the geographical location. Dionisi et al. (2013) presented a methodology for identification and characterisation of cirrus cloud properties, applied to the multi-wavelength Rayleigh Mie–Raman (RMR) lidar in Rome. The study classified the detected cirrus clouds in different categories based on their optical properties. Specifically, the analysis showed that 10 % of the detected cirrus clouds were subvisible clouds (τ<0.03), 49 % were thin () and 41 % were opaque cirrus (τ>0.3). The overall mean value of cirrus optical depth was calculated as 0.37±0.18, while the mean lidar ratio (LR) value, corrected for multiple scattering with a constant factor, was 31±15 sr. Another statistical analysis on optical and geometrical properties of upper-tropospheric cirrus clouds based on a lidar dataset was conducted in Amazonia (Gouveia et al., 2017). The frequency of occurrence of cirrus clouds classified as subvisible was 41.7 %, whilst it was 37.8 % for thin cirrus and 20.5 % for opaque cirrus. The correction of the multiple-scattering effect to the optical products in this study was made following the model of Hogan (2006). Lakkis et al. (2015) revealed that the most commonly observed cirrus clouds were characterised as optically thin cirrus, rather than opaque ones, with a mean optical depth value of 0.26±0.11 over Buenos Aires (34.6∘ S, 58.5∘ W). There are also a number of satellite-based studies from lidar (Cloud-Aerosol Lidar with Orthogonal Polarization – CALIOP; Dupont et al., 2010), cloud radar (Cloud Profiling Radar – CPR), or combined lidar and cloud radar (e.g. Sassen et al., 2008) retrievals that provide a global view concerning the seasonal frequencies of cirrus clouds, their geometrical and optical properties, and their variabilities.
However, there are only a few long-term studies based on ground-based lidar systems, and these have a limited geographical distribution. These kinds of observations that correspond to different areas and atmospheric conditions are crucial to revealing information on the latitudinal dependence of the cirrus properties and can provide indications about the aerosol effect on the geometrical and optical characteristics of the detected cirrus layers. On top of that, these observations can be further used in the validation and improvement of the satellite retrievals, which provide global distribution of cirrus clouds (Sassen et al., 2008). Given that for satellite retrievals, the main input parameter to the optical processing of the cirrus layers is the lidar ratio, the selected lidar ratio value can introduce errors into the retrieved extinction and optical depth values of the cirrus layers, as is illustrated by Young et al., (2018). The optical depth comparison of version 4.10 (V4) of the CALIOP optical depths and the optical depths reported by MODIS collection 6 shows substantial improvements relative to earlier comparisons between CALIOP version 3 and MODIS collection 5; this is a result of extensive upgrades of the extinction retrieval algorithm. New a priori information of the lidar ratio value for the cirrus layers, included in version 4.10 (V4) of the CALIOP data products, led to improvements of the extinction and optical depth estimates of the cirrus cloud layers. Thus, ground-based lidar observations of the cirrus properties that correspond to different areas and atmospheric conditions are crucial to verifying and eventually improving the satellite retrievals.
The aim of this work is to retrieve and analyse the cirrus geometrical, intensive and extensive optical properties at different latitudes (subtropical and subarctic) from observations derived with the same ground-based lidar system, which partly fills the gap concerning the latitudinal coverage of existing ground-based lidar studies. Then the observed differences are discussed in order to identify the possible causes. The information of the lidar ratio is an important parameter for the inversion of lidar signals in instruments that do not have Raman channel and space-borne lidars, such as CALIPSO (Cloud-Aerosol Lidar and Infrared Pathfinder Satellite Observations), that depend on a parameterisation that may vary with location. Thus, information provided by well-calibrated ground-based measurements is quite critical. Analysis of the lidar ratio values derived from lidar measurements in different parts of the world, where different atmospheric and aerosol conditions prevail, will provide results that are more representative of the actual conditions, and thus their use will lead to reductions in the uncertainties of the satellite retrievals.
The paper is structured as follows: after a brief description of the portable lidar system (PollyXT) and the measuring sites in Sect. 2, we present the data analysis algorithm and the methods applied for the optical product retrievals in Sect. 3. The lidar-derived statistical analysis and seasonal variations in geometrical and optical properties of cirrus clouds in both subtropical and subarctic areas over the period 2008–2016 are presented and discussed in Sect. 4. Concluding remarks are presented in Sect. 5.
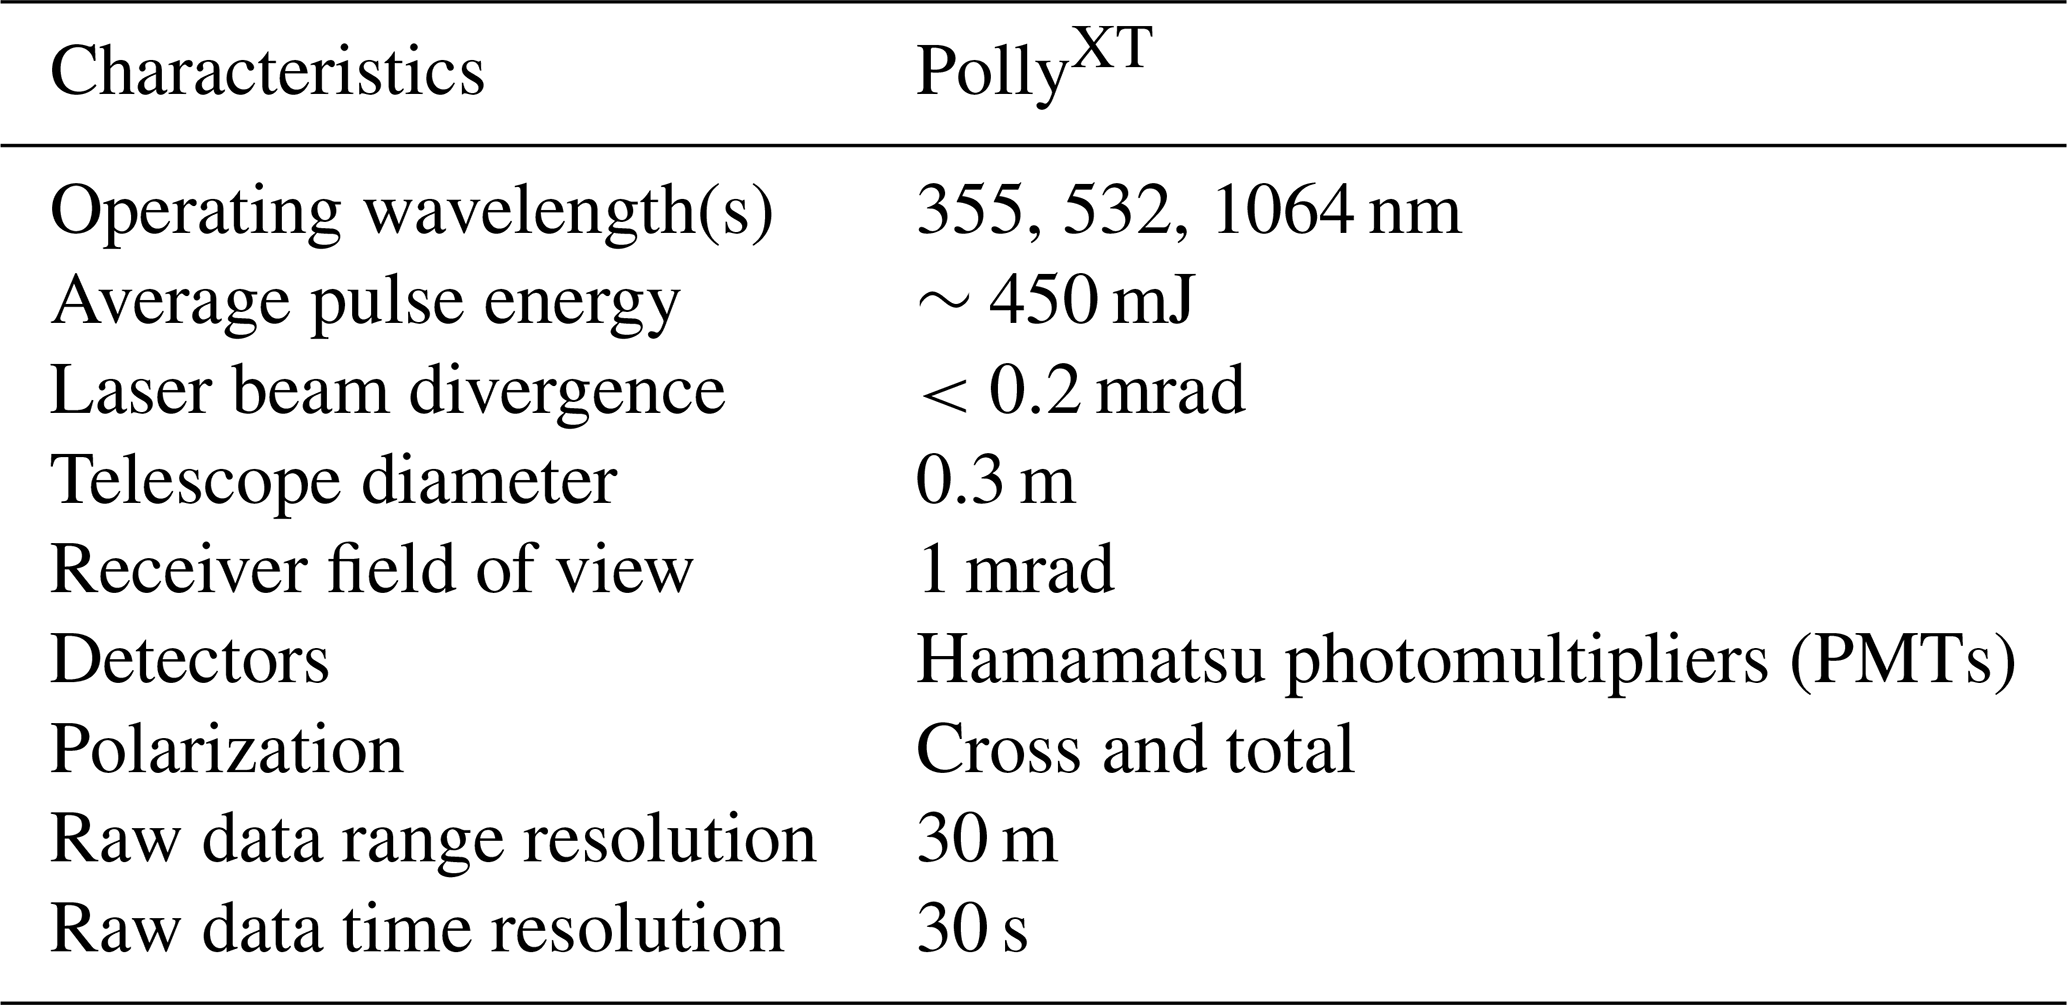
A multi-wavelength depolarisation, Raman lidar PollyXT of the Finnish Meteorological Institute (FMI), performed automated measurements during the period 2008–2016 in three different geographical regions. The system is based on a compact, pulsed Nd:YAG laser, emitting at 355, 532 and 1064 nm at a 20 Hz repetition rate. The laser beam is pointed into the atmosphere at an off-zenith angle of 5∘, so the impact of the specular reflection by ice crystals into cirrus layers on the backscattered signals is negligible. The backscattered signal is collected by a Newtonian telescope with 0.9 m focal length. The vertical resolution of the signal profiles is equal to 30 m, and the temporal resolution is 30 s. The set-up of the system includes two Raman channels at 387 and 607 nm; three elastic channels at 355, 532 and 1064 nm; a depolarisation channel at 355 nm (for India and South Africa); a depolarisation channel at 532 nm (cross polarisation with respect to the initial emitted polarisation plane) for Kuopio; and a water vapour channel at 407 nm. A brief description of the system components is presented in Table 1, while a detailed description is provided in Althausen et al. (2009) and Engelmann et al. (2016). All measurements processed within the period 2008–2016 are available online at http://polly.tropos.de (last access: 28 March 2020).
PollyXT has participated in two campaigns in two subtropical areas, within the framework of EUCAARI (European Integrated project on Aerosol, Cloud, Climate, and Air Quality Interactions) (Kulmala et al., 2011), covering a wide range of cloud types. Measurements have been performed in Gwal Pahari (28.43∘ N, 77.15∘ E; 243 m a.s.l.) in India from March 2008 to March 2009 (Komppula et al., 2012) and in Elandsfontein (26.25∘ S, 29.43∘ E; 1745 m a.s.l.), about 150 km from Johannesburg, in South Africa from December 2009 to January 2011 (Giannakaki et al., 2015). Figure 1 presents the map of the three measuring sites. Measurements in Gwal Pahari were not performed continuously from March 2008 to March 2009. Due to technical problems with the laser, the data coverage from September to January was limited. Measurements were not performed in October 2008 and January 2009, and in September and November–December only a few usable profiles were measured (Komppula et al., 2012). Measurements in Elandsfontein were performed almost continuously, as two periods were dedicated to the maintenance of the system (one from 23 December to 26 January 2009 and the second one from 23 October to 23 November 2010). Since November 2012 PollyXT has been operating in Kuopio (62.74∘ N, 27.54∘ E; 190 m a.s.l.) in Finland, providing continuous measurements of aerosols and clouds (Filioglou et al., 2017).

Figure 1Map of the three measuring sites.
3.1 Description of the cirrus retrieval algorithm
Several steps were followed for the processing of the signal at 1064 nm derived by PollyXT, needed for the estimation of the cirrus boundaries. These are illustrated in Fig. 2. Firstly, the signal-to-noise ratio (SNR; Eq. 1) is calculated according to the following equation (Georgousis et al., 2016):
where Csig represents the raw lidar signal and Cbg represents the background correction. The SNR is selected above 3.5, since the lidar signal is strongly attenuated at higher altitude levels and the noisy parts of the signal should be rejected (above the selected threshold, boundary layer estimation found independent from SNR). Then, we subtract the zero and background levels and we calculate the range-corrected signal (P(z)). In the next step, we normalise the range-corrected signal by its maximum value below 1.5 km. Given that lidar signals are uncalibrated and signal levels from one lidar system to another can be rather different, the normalisation ensures the applicability of the criteria used by Baars et al. (2008).
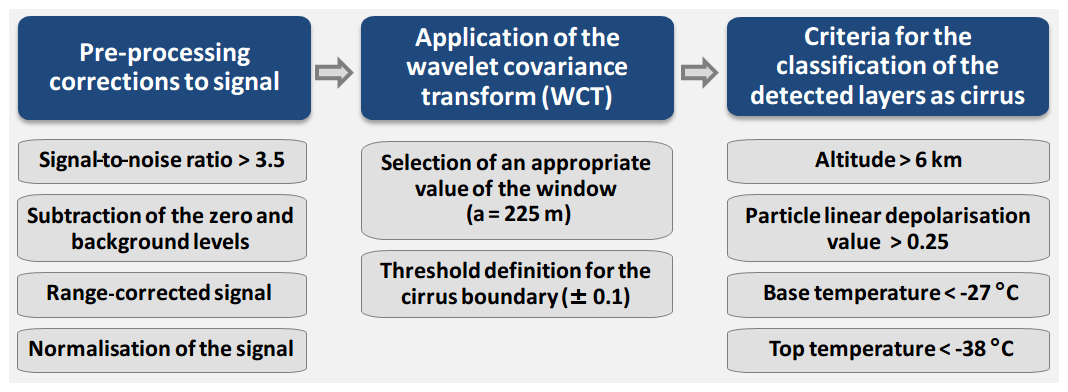
Figure 2Schematic flow chart showing the main steps of the methodology applied in this study to obtain the cirrus geometrical boundaries from the PollyXT measurements.
After the above corrections, the wavelet covariance transform (WCT) is applied to the range-corrected signal. The method (Eq. 2) detects discontinuities in the lidar signal, such as the top of the boundary layer, elevated aerosol layers or cloud boundaries, allowing the detection of the cirrus cloud base and top (Brooks, 2003):
In Eq. (2), WCT is the result of the transformation, P(z) is the range-corrected profile, z is the altitude, b is the height at which a noticeable change in the normalised signal occurs and α is the dilation chosen. A critical step to the accurate WCT application on the signal is the selection of an appropriate value of the window (dilation) so as to distinguish cloud layers from aerosol layers. In our case, a dilation of 225 m is chosen, proportional to the cirrus geometrical depth (Baars et al., 2008). Another critical step is the threshold WCT value for the determination of the cirrus boundary. A threshold value of 0.1 is selected as a detection limit for both the base (−0.1) and the top (+0.1) of cirrus clouds (Baars et al., 2008) after sensitivity studies. The WCT has already been applied successfully on cirrus cloud detection (Dionisi et al., 2013).
An hourly lidar measurement of a cirrus case is defined in this study as follows: to calculate the cirrus boundaries, the wavelet covariance is calculated for every single profile (every 30 s), and a mean value of the cirrus base and top are attributed to the 1 h processing. We also consider that the differences within an hour between the bases and top calculated should not exceed 0.5 km. With this assumption, we exclude cases with large variability in cirrus layers.
Finally, cloud retrievals from the algorithm are classified as cirrus clouds when the following four criteria were met: (i) the particle linear depolarisation value is higher than 0.25 (Chen at al., 2002; Noel et al., 2002), (ii) the altitude is higher than 6 km, (iii) the base temperature is below −27 ∘C (Goldfarb et al., 2001; Westbrook and Illingworth, 2011) and (iv) the top temperature is below −38 ∘C (Campbell et al., 2015). The application of these criteria is made so as to avoid the presence of liquid water. It should be pointed out that lidar measurements were processed only in the absence of lower-tropospheric (below 4 km) thick clouds.
The application of the WCT in a case of a cirrus layer observed on 20 July 2016 at the Kuopio station, for a time period between 00:00 and 01:00 UTC, is presented. The hourly mean wavelet applied to the corrected 1064 signal and the hourly mean particle depolarisation ratio and the backscatter coefficient profile of the cirrus evolution are presented in Fig. 3. The temperature values are also plotted with a white line, and the threshold values are marked with red lines.
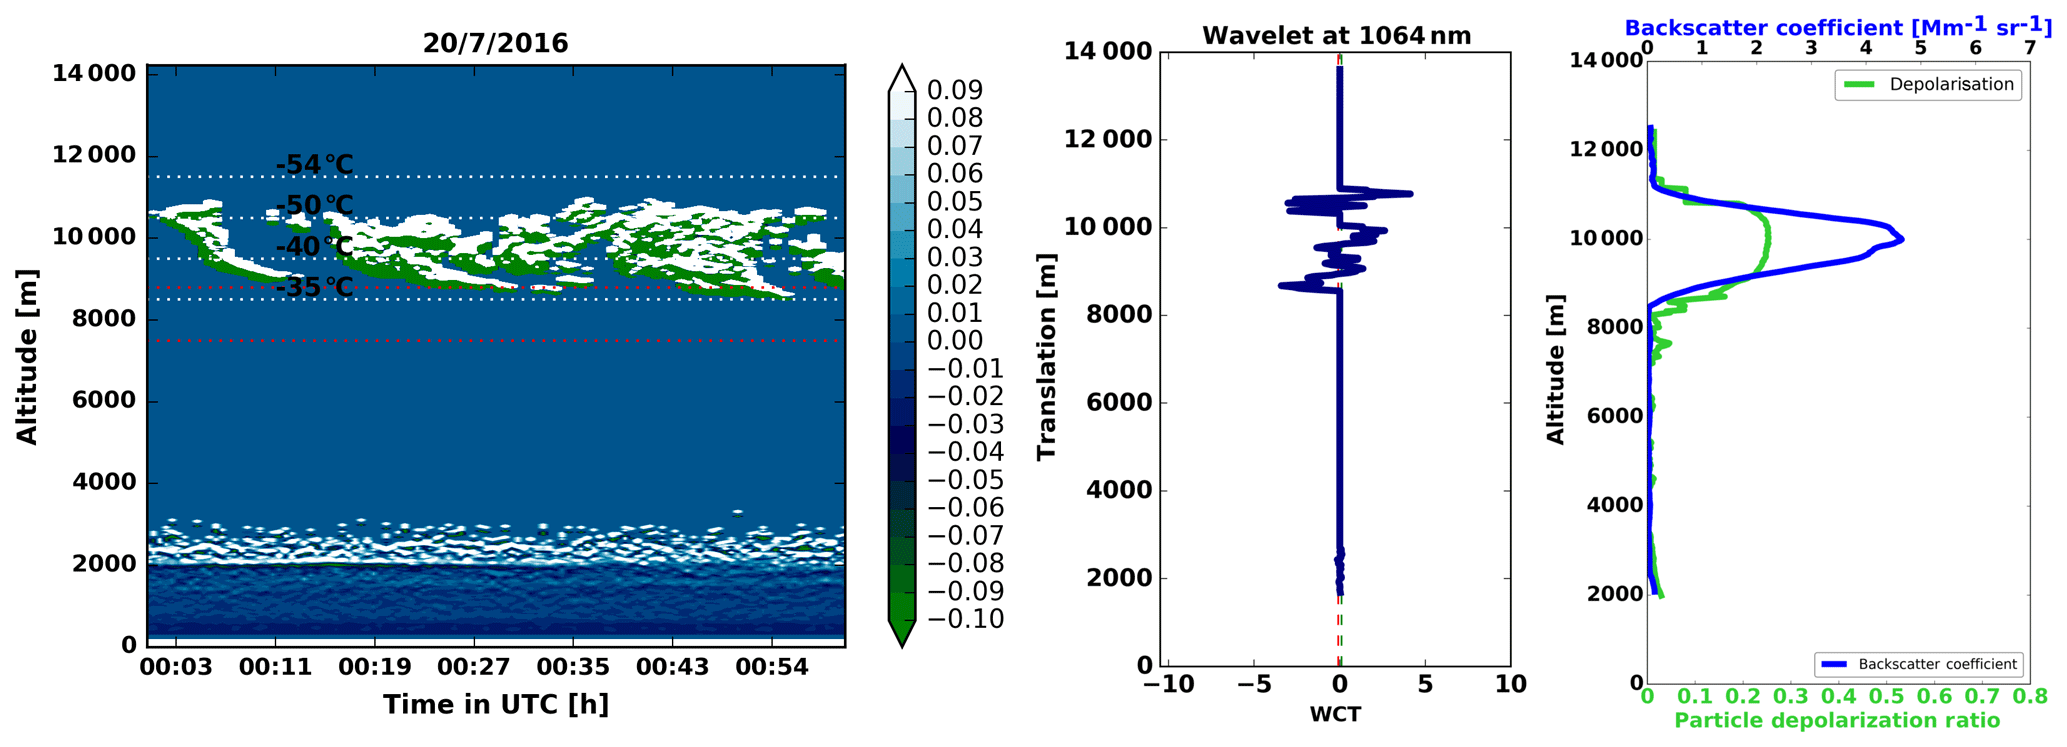
Figure 3Cirrus cloud hourly evolution as determined from PollyXT with temperatures values marked with white lines and the temperature criteria marked with red lines (a), the averaged WCT applied to 1064 nm (b), and the mean particle depolarisation ratio (green) and the backscatter coefficient profile (blue) at 532 nm (c) on 20 July 2016 at Kuopio station.
3.2 Retrieval of the optical properties of cirrus
The integration of the extinction profile (a) between the defined cloud base (zbase) and the top of the cirrus layer (ztop) is calculated to obtain the cirrus optical depth (COD) from the lidar measurements as shown in Eq. (3):
The nighttime measurements from PollyXT were processed by the Raman method, which allows the independent determination of the extinction and backscatter coefficients, thus providing the lidar ratio (extinction-to-backscatter ratio; Ansmann et al., 1992). For the retrieval of the cirrus extinction coefficient profiles obtained from the daytime measurements, the integration of the backscatter profile multiplied by the lidar ratio is calculated. The daytime measurements from PollyXT were processed using the Klett inversion (Klett, 1981; Fernald, 1984) with respect to the ratio of the extinction to the backscatter coefficient. These two unknowns have to be related using either empirical or theoretical methods in order to be able to invert the lidar equation. In our study, the lidar ratio was determined by comparing the forward and backward solution of Klett (1981), and the lidar ratio value was chosen as the value for which the aforementioned profiles tend to coincide (Ansmann et al., 1992).
The calculation of the corresponding molecular backscatter and extinction profiles was made based on temperature and pressure profiles obtained from radio soundings at each site. Radiosonde observations released at Safdarjung Airport (28.58∘ N, 77.20∘ E) in New Delhi, India, twice a day; radiosondes from Upington International Airport (28.40∘ S, 21.25∘ E), South Africa; and radiosondes launched daily at 06:00 and 18:00 UTC at the Jyväskylä Airport, located to the southwest (62.39∘ N, 25.67∘ E) of the lidar station at Kuopio, Finland, were used. The mid-cirrus temperature is also calculated in our study. The mid-cirrus temperature is defined as the mean temperature between the temperature at the base and temperature at top altitude for each cirrus layer.
Another important lidar quantity to be calculated is the particle depolarisation ratio, which constitutes a qualitative way to discriminate particle shapes and to distinguish spherical from non-spherical particles. The calibration of the depolarisation measurements, needed for the calculation of the particle depolarisation ratio, was determined by using the geometric mean of the two ±45∘ measurements, following the procedure described by Freudenthaler et al. (2009). The particle depolarisation ratio is presented only for the dataset of Kuopio; as for the other two sites, only the Rayleigh calibration method for the calibration measurements was available.
3.3 Multiple-scattering correction on optical products
The lidar equation assumes single scattering from the hydrometeor, but eventually the received photons could have been scattered multiple times before reaching the telescope. This effect, named multiple scattering, is considerably important, primarily to the measured extinction coefficient values of cirrus clouds and secondly to the calculated cirrus optical depth and the estimated lidar ratio values. Multiple scattering depends not only on cloud optical depth and cloud extinction but also on the lidar system components, such as the laser beam divergence and the full-angle field of view of the receiver.
The relative influence of multiple scattering decreases with increasing height within the cloud, and the errors of the extinction coefficient can be even equal to 60 % at the cirrus base (Lynch et al., 2001). In general, the multiple-scattering effect cannot be negligible in a receiver field of view equal to 1 mrad (Wandinger, 1998); this effect on cirrus cloud optical properties was considered. In order to calculate the multiple-scattering contribution to the calculated optical products, the Eloranta model (Eloranta, 1998) was used to estimate the ratio between the total received power and the contribution of single scattering, the ratio Ptot(z)∕P1(z) (Eq. 4). The measured extinction coefficient aeff is then related to the actual (single-scattering) coefficient a(z) through the parameter F, as shown in Eq. (5) (Wandinger, 1998):
The model assumes hexagonal ice crystal shapes, and the required inputs are as follows: (i) the laser beam divergence, (ii) the receiver field of view, (iii) the cirrus effective radius, (iv) the measured single-scattering extinction profile (or the lidar ratio multiplied by the backscatter for the daytime measurements) and (v) the order of scattering. The estimation of the cirrus effective radius was taken from Wang and Sassen (2002) based on the linear relation of the effective radius with the cirrus cloud temperature derived from radio soundings. For the multiple-scattering calculation, the code applies an iterative method including the following steps:
- i.
The measured extinction profile of the cirrus layer is provided (aeff).
- ii.
With the provided effective radius profile of the cirrus layer and the measured extinction coefficient, an iterative procedure provides the ratio Ptot(z)∕P1(z).
- iii.
From (ii) a first value for the correcting factor F(z) can be found.
- iv.
The iterative procedure continues until the calculation of a stable correcting factor F(z).
- v.
The corrected extinction can be then calculated from Eq. (5) and hence the value of lidar ratio.
The model has already been validated against other models (Hogan, 2006) and has already been applied in cirrus lidar applications (Giannakaki et al., 2007). In the following sections, the cirrus optical properties (lidar ratio, extinction coefficient and optical depth) derived in the frame of this study were corrected for multiple scattering.
In the following section, we present the mean geometrical and optical properties of the detected cirrus layers within the period 2008–2016 for the three measurement sites, which correspond to subtropical and subarctic regions, and we further discuss the differences between the retrieved properties.
4.1 Cirrus cloud cover detection
In terms of cirrus detection in our study we refer to only lidar-determined cirrus cases, as these are described in Sect. 3.1 and thus cannot be representative of the general seasonal patterns of cirrus occurrence for the areas studied. Generally, PollyXT measured almost continuously (24∕7) under favourable weather conditions, and the profiles that fulfil the criteria for a cirrus detection are averaged hourly, so the pattern presented (not shown) is only an indication and biased by the presence of low clouds and rain. During the year-long measurement period over Gwal Pahari, PollyXT measured on 183 d, corresponding to 2500 h in total. The time periods with technical issues (mentioned above) and the occurrence rate of low clouds observed between March and September led to a limited dataset of cirrus observations. Thus, the detected cirrus clouds cannot provide any monthly trend and cannot be representative of an annual pattern. Concerning the annual pattern observed over Elandsfontein, a total measurement time of about 4935 h, corresponding to 88 cirrus profiles, was obtained during the observation period between 11 December 2009 and 31 January 2011, with the exception of the two periods of maintenance of the system (mentioned above). The maximum detection of cirrus layers is reported during May and December. No data processing could be performed during unfavourable weather conditions, such as the presence of low clouds, observed mainly in the months between January and April, with a percentage of ∼30 % of the total measurement period. The analysis of measurements over Kuopio showed that the cirrus cloud cover is found to vary both diurnally and seasonally. From the available data, the detection of cirrus clouds appears to exhibit an annual pattern, with the maximum detection from February to September and minimum occurrence during the period between October and January, given the favourable meteorological conditions. Layers of low-water clouds were present all year long, with the peak of monthly occurrence between April (28 cases) and November (27 cases). This monthly pattern of low-cloud existence seems to follow the annual temperature cycle over the region (Jylha et al., 2004), with maximum temperature values observed during the period from April to October. Concerning the diurnal pattern, the number of detected cirrus clouds during nighttime is higher from March to September and lower in the period from October to January.
4.2 Geometrical properties of cirrus clouds over the subarctic and tropical sites
Mean cirrus cloud geometrical thickness reported in the literature from satellite retrievals is about 2.0 km globally (Sassen et al., 2008), while a broad distribution of geometrical boundaries from ground-based systems has been reported in the literature (e.g. Gouveia et al., 2017; Seifert et al., 2007; Hoareau et al., 2013). Figure 4 shows the monthly variations in the cirrus base and top height (displayed in monthly boxplots), derived with the automated algorithm, along with the corresponding mean temperatures above each site. The cirrus geometrical properties show a broad monthly distribution ranging from 6790 to 13 070 m, with the larger variability in the two subtropical sites compared to the subarctic site.
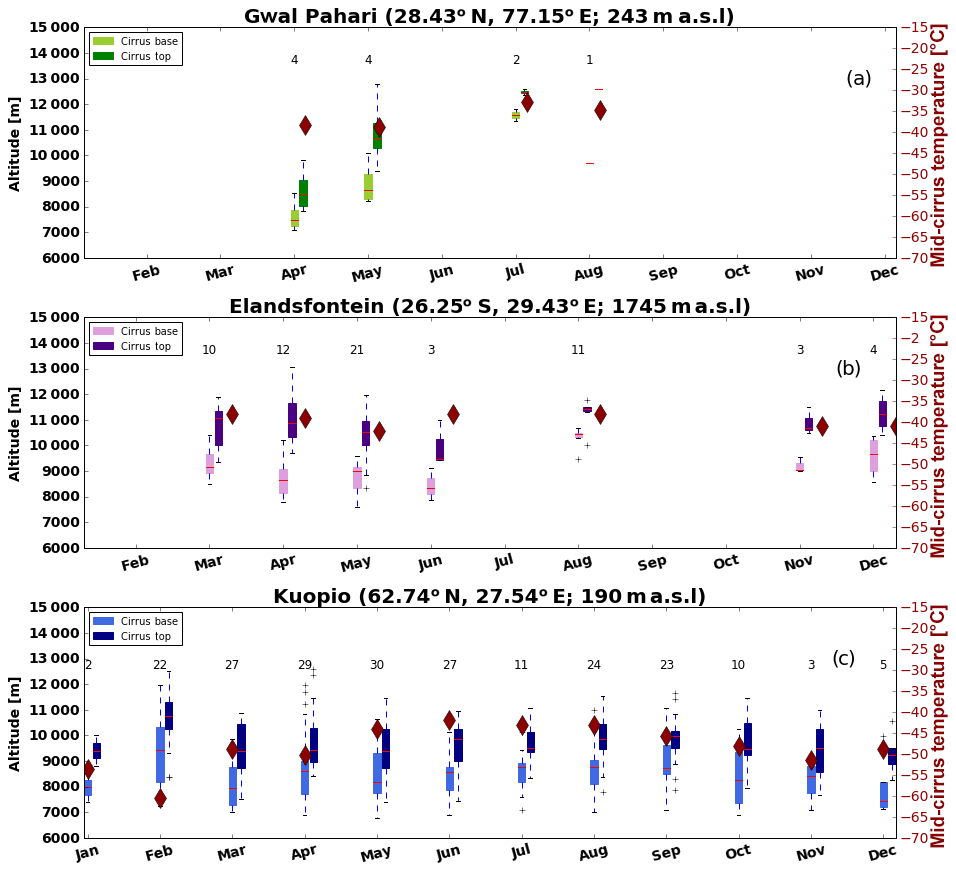
Figure 4Monthly cycle of the mean cirrus base and top and the corresponding middle-temperature values (rhombus) of the cirrus clouds at Gwal Pahari (a), Elandsfontein (b) and Kuopio (c). Horizontal line in box: median. Boxes: the upper and lower quartile. Whisker: extreme values. Numbers labelled indicate the number of cirrus cases per month.
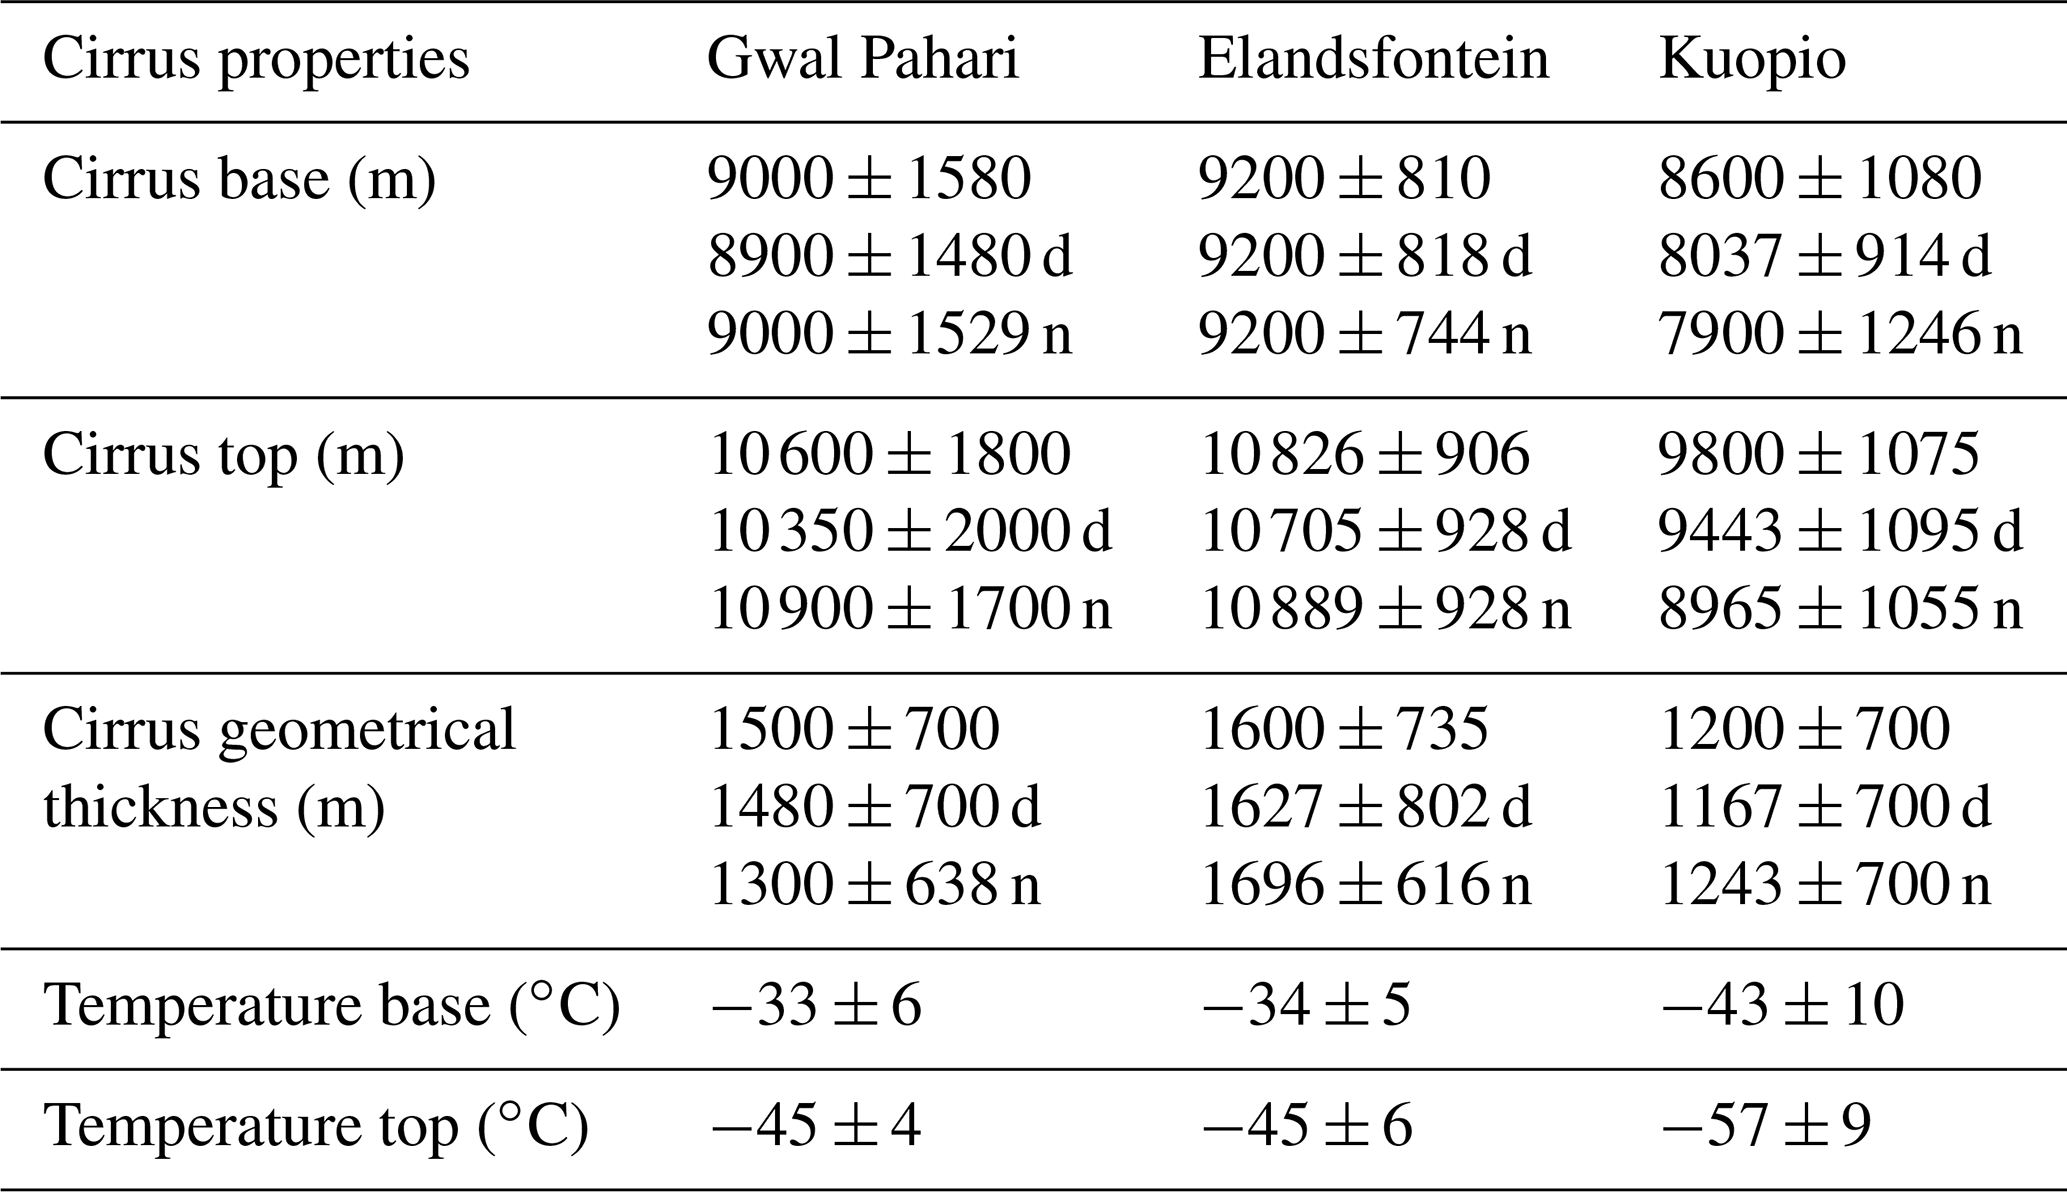
The cirrus lidar dataset in the Gwal Pahari (28.43∘ N, 77.15∘ E; 243 m a.s.l. – Northern Hemisphere) region is the less extensive one compared to the other two sites and limitations due to the low signal-to-noise ratios. Indeed the sampling might not be statistically representative of the cirrus cloud properties, but some first results can be discussed. The mean value of the cirrus base is calculated to be 9000±1580 m, whilst the mean top is found to be 10 600±1800 m, with a mean geometrical thickness of 1500±700 m. The temperature varies from −27 to −50 ∘C. Our results are consistent with another study over northern China (Min et al., 2011), which was based on CALIOP satellite measurements. In this study a value of 1600±1015 m is reported for the cirrus geometrical thickness. According to this study, the cirrus top temperatures were found to be lower than −50 ∘C and higher than −80 ∘C. From the cirrus profiles processed over Elandsfontein (26.25∘ S, 29.43∘ E; 1745 m a.s.l. – Southern Hemisphere), the mean value of the cirrus base is calculated to be 9200±810 m, while the mean top is 10 826±906 m and the mean geometrical thickness is 1626±735 m. For the subarctic station of Kuopio (62.74∘ N, 27.54∘ E; 190 m a.s.l.), the seasonal mean cirrus cloud-base heights are calculated as follows: 8363±1169 m (MAM), 8326±1120 m (JJA), 9173±1100 m (SON) and 8900±1390 m (DJF), with an annual mean value of 8600±1080 m. The annual mean of the upper boundary of cirrus layers is 9800±1075 m, with a maximum value of 12 595 m during April. The mean geometrical thickness is calculated to be 1200±700 m. Base cirrus temperatures range from −71 to −27 ∘C, with a mean value of −43 ∘C. The corresponding temperature values of the top range from −72 to −38 ∘C, with a mean value of −57 ∘C. These values are in accordance with the corresponding ones from the combined data of CloudSat and CALIPSO measurements (Sassen et al., 2008).
Table 2 summarises the mean geometrical values calculated for each site, separating daytime and nighttime measurements. The averaged geometrical properties between daytime and nighttime are found to be nearly identical above all sites, with differences less than 0.3 km.
Table 2Average cirrus properties for the three regions for daytime and nighttime measurements.
4.3 Optical properties of cirrus clouds over the subarctic and tropical sites
This section presents the cirrus optical properties for the three regions, and Fig. 5 shows the monthly variations in the cirrus optical properties (displayed in monthly boxplots) above each site.
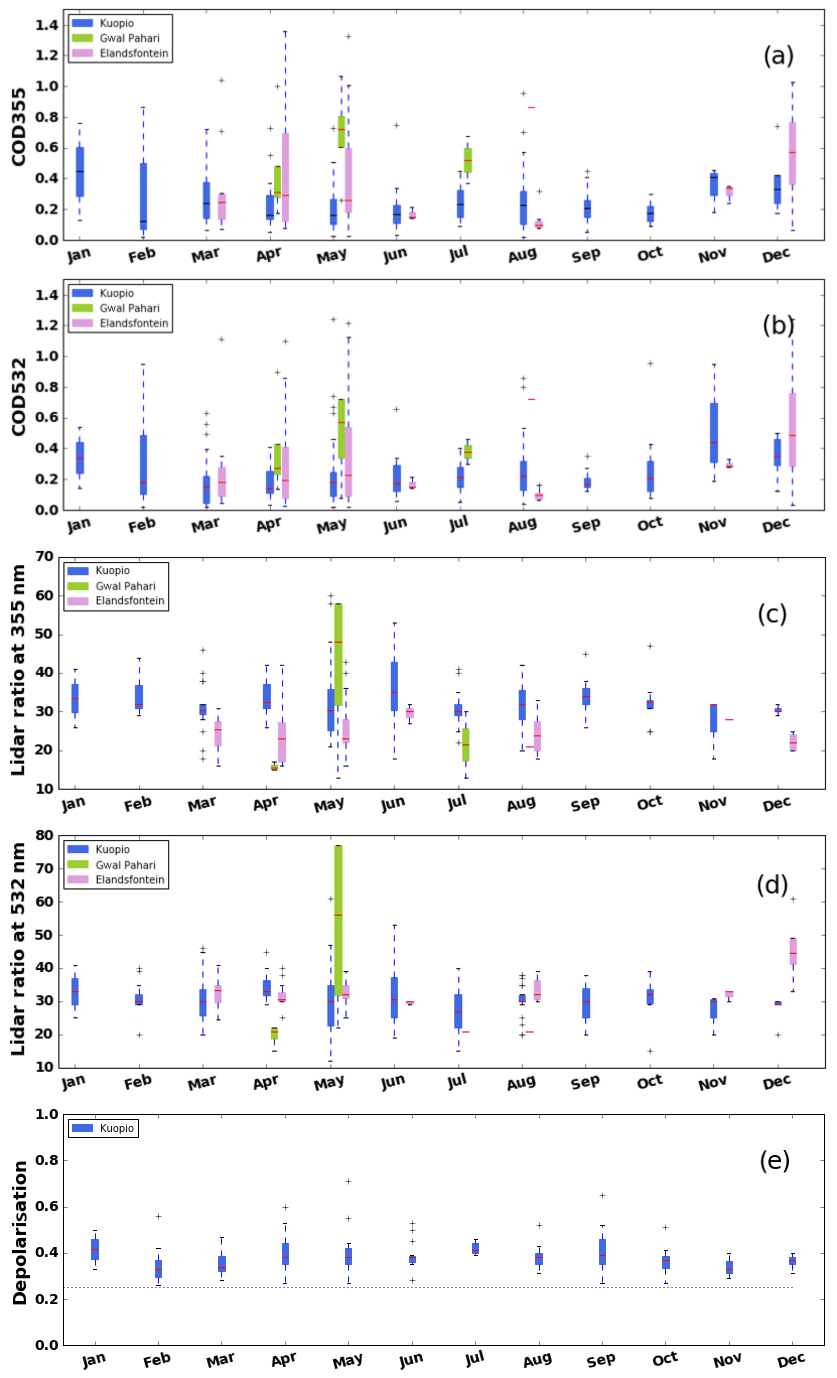
Figure 5Mean optical depth (multiple-scattering-corrected) values at 355 nm (a), mean optical depth (multiple-scattering-corrected) values at 532 nm (b), lidar ratio at 355 nm (c), lidar ratio at 532 nm (d) and particle depolarisation ratio (e) for the detected cirrus layers for the study period for the three regions. Horizontal line in box: median. Boxes: the upper and lower quartile. Whisker: extreme values. Red line stands for the mean values for every month.
The COD values over the three sites are presented in Fig. 5a and b. For the subtropical region of Gwal Pahari, the mean COD at 355 nm is 0.59±0.25, and the mean COD at 532 nm is found to be 0.45±0.30. The classification of clouds according to Sassen and Cho (1992) shows that the detected cirrus layers are classified as follows: subvisible cirrus (0 %), optically thin cirrus (20 %) and opaque cirrus (80 %). One possible reason for the absence of subvisible cirrus clouds in this dataset can be the lower SNR that does not allow for detectability of optically thin clouds at Gwal Pahari. Another study over northern China (Min et al. 2011) reported a mean value of optical depth of 0.41±0.68 at 532 nm, and the classification of the detected cirrus layers was made as follows: subvisible cirrus (30.26 %), optically thin (34.59 %) and opaque cirrus (21.54 %). He et al. (2013), in their study over the region, reported that the optical depth of the cirrus layers varied between 0.0004 and 2.6, with a mean value of 0.33. For the subtropical region of Elandsfontein the mean value of COD at 355 nm is calculated to be 0.35±0.03, and the mean COD at 532 nm is found to be 0.30±0.30. The CODs have their highest values between April (1.36) and May (1.33) and December (1.02); the percentage of 2 % is categorised as subvisible cirrus, 61 % is categorised as thin cirrus and 37 % is categorised as opaque cirrus. For Kuopio, the column-integrated mean corrected COD at 355 nm is 0.25±0.2 and is found to vary between 0.018 and 1.53, while the mean COD at 532 nm is found to be 0.24±0.20. The highest values of COD are found between January and March, with the highest value of 0.95. The mean COD at 355 nm calculated in this study is larger than the value of 0.16±0.27 reported by Das et al. (2010) and smaller than the value of 0.41±0.68 reported by Min et al. (2011) from mid-latitude observations. A number of other studies have reported mean COD values between 0.2 and 0.4 (Gouveia et al., 2017). The classification of the cirrus clouds according to Sassen and Cho (1992) indicates that 3 % of the cirrus clouds measured over Kuopio are subvisible (τ<0.03), 71 % are thin cirrus () and 26 % are opaque cirrus (τ>0.3). The low percentage of the subvisible category of cirrus layers has also been observed over mid-latitude sites (e.g. Kienast-Sjogren et al., 2016), where subvisible cirrus clouds were measured during 6 % of the observation time.
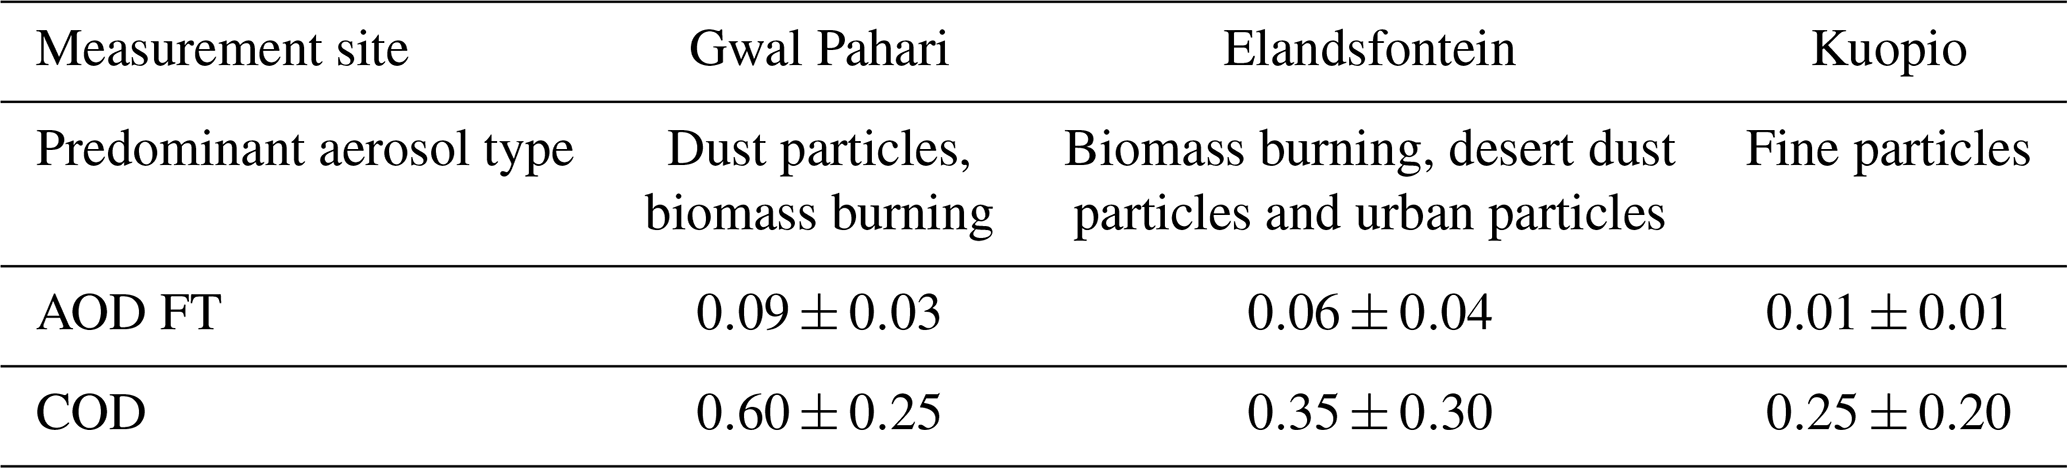
In the following, we examined if there is potential connection between the COD values derived in the different sites and the free tropospheric aerosol optical depth (AOD) load over the regions which are exposed to different aerosol sources. Table 4 lists the predominant aerosol type over each region and the results from the analysis of AOD at 355 nm in the free troposphere and the calculated COD values. We cannot reach any conclusion and only report an indication of the relationship of the aerosol load on the derived cirrus statistics, as the higher AOD values are linked with the higher COD values calculated for the two subtropical regions. More specifically, the 1-year aerosol analysis of lidar observations in Gwal Pahari (Komppula et al., 2012) showed a distinct seasonal pattern of aerosols, with aerosol concentrations slightly higher in summer (June–August) compared to other seasons and particles larger in size. During the summer and autumn, the average lidar ratios were larger than 50 sr, suggesting the presence of absorbing aerosols from biomass burning. The lidar observations that were performed at Elandsfontein and used for aerosol characterisation for the corresponding study period (Giannakaki et al., 2016) showed that the observed layers were classified as urban and industrial, biomass-burning, and mixed aerosols. The analysis showed that the more absorbing (higher lidar ratio at 355 nm) biomass particles were larger in August and October, while the category of urban and industrial aerosols had its peak in January, March and May. On the other hand, cirrus observations had their peak from March to May, with a second peak in August. Kuopio is an urban area and constitutes a low-aerosol-content environment. The columnar analysis of sun photometer observations (Aaltonen et al., 2010) revealed that the high Ångström exponent values observed can be possibly linked with the presence of fine particles, while the seasonal analysis of the optical depth showed that there is no significant variation.
Concerning the lidar ratio values (Fig. 5c and d) observed over Gwal Pahari, the lidar ratio value at 355 nm is calculated at 27±12 sr and the corresponding one for 532 nm is 28±22 sr; the lidar ratios reach their highest values in May. Our results are in agreement with another cirrus cloud studies for the area; He et al. (2013) report a mean lidar ratio value of 28 sr using a micropulse lidar. For the Elandsfontein site, the mean LR at 355 nm is found to be 26±6 sr and the mean LR at 532 nm is 25±6 sr; the lidar ratios reach their highest values during April. A mean value lidar ratio of 33±7 sr at 355 nm is observed for the whole period studied over the Kuopio site, with higher variability observed in June, while the corresponding mean value LR at 532 nm is calculated to be 3±7 sr, without any obvious seasonal cycle. Specifically, the mean LR at 355 nm for the corresponding months is calculated as follows: 33±7 sr (MAA), 34±7 (JJA), 33±7 (SON) and 34±5 (DJF). For opaque, thin and subvisible cirrus clouds, the means are 31±6, 34±7 and 35±7 sr, respectively. Gouveia et al. (2017) found a mean LR at 355 nm of 23.9±8.0 sr (SD) for the tropical region of Amazonia, while Giannakaki et al. (2007) reported a corresponding value of 30±17 sr for a mid-latitude station. Josset et al. (2012) and Garnier et al. (2015) analysed space-borne CALIOP observations. Both studies concluded that the cirrus lidar ratio (corrected for multiple-scattering effects) around the globe has, typically, values of 30–35±5–8 sr at 532 nm.
Concerning the monthly variability in the depolarisation values (Fig. 5e) over Kuopio, no clear tendency is observed. The higher monthly mean value is observed in July, but the variability is less than 0.04 between months, with a mean value of 0.38±0.07.
As the assumption is that the backscatter and extinction coefficients for sufficiently large cirrus particles are spectrally independent, the colour ratio (CR; ratio of backscatter profiles) at 355 and 532 nm is supposed to be equal to 1. This assumption is also used in satellite processing schemes. However, it is reported that the measured variability in cirrus colour ratios is much larger than previously realised and that measured colour ratios are higher in the tropics (Vaughan et al., 2010). For the Kuopio station, the mean CR is found to be 1.1±0.8, for the less extensive dataset of New Delhi, the mean value is found to be 1.5±0.8, and for Elandsfontein, the mean value is 1.4±1.1.
In Fig. 6, we further examine the dependence of the LR at 355 nm on the COD at 355 nm values in intervals of 5 sr. The dashed lines indicate the categories defined by Sassen and Cho (1992). The most common lidar ratio values from 25 to 40 sr are found for quite low COD values (corresponding to thin cirrus) for the subarctic station.

Figure 6Dependence of the lidar ratio on COD at 355 nm (a) and the lidar ratio with COD at 532 nm (b). Numbers labelled indicate the number of cases per lidar ratio bin. Horizontal dashed lines: cirrus categories by Sassen and Cho (1992).
Table 3 summarises the mean optical values discussed above for the three sites, separating daytime and nighttime observations. Generally, the averaged optical property values are found to be nearly identical, except at one site (New Delhi), where average nighttime optical properties are found to be higher (∼4 sr) than those of daytime.
Table 3Average cirrus optical properties for the three regions for daytime and nighttime measurements (days – d; nights – n).

Table 4Predominant aerosol type and AOD FT for the three regions.
4.4 Cirrus classification at Kuopio
Additional analysis on each cirrus category (according to Sassen and Cho, 1992) is also conducted for the Kuopio site, as measurements in this station represent the most extensive dataset between November 2012 and December 2016.
4.4.1 Category “subvisible”
Subvisible cirrus clouds are geometrically thin layers with a mean geometrical thickness of 643±211 m. Generally, subvisible cirrus detection is a challenging component in satellite retrievals. MODIS, for example, is not sensitive to optically thin cirrus clouds due to the insufficient contrast with the surface radiance (Ackerman et al., 2008, 2010), while the CALIPSO and CloudSat observations are more sensitive to the height and presence of subvisible and thin cirrus (Hong et al., 2010). Thus, the mapping of subvisible cirrus can be rather important in climatological studies. In our study, six cases of cirrus with CODs less than 0.03 are analysed, mostly detected during February. Subvisible cirrus geometrical thickness was found to be 750±269 m, less than the mean value of all cirrus clouds, and the cirrus temperature was found to be 2–3 ∘C colder than the mean temperature. These values are consistent with previous studies of subvisible cirrus from space-borne lidar observations, examined at a global scale (Martins et al., 2011). Their mean COD at 355 nm is calculated to be 0.021±0.0031, their mean LR at 355 nm is 34±7 sr and their mean particle depolarisation value is 0.45.
4.4.2 Category “thin”
As mentioned previously, thin cirrus is the most predominant type of cirrus in our study, with 152 observations. Thin cirrus can also be undetectable by passive remote-sensing satellites, especially the ones with CODs less than 0.2, and have so far not systematically been characterised. Their geometrical thickness is found to be 1100±586 m. Their mean COD at 355 nm is calculated to be 0.16±0.07, their mean LR at 355 nm is 34±7 sr and their mean particle depolarisation value is 0.3±0.13.
4.4.3 Category “opaque”
Opaque cirrus clouds are those with the highest value of optical depth that contribute the most to the total radiative forcing (Kienast-Sjogren et al., 2016). In our study, a total of 55 measurements of opaque cirrus are processed. Their mean geometrical thickness is found to be 1462±659 m, higher than the value of all cirrus categories. Their mean COD at 355 nm is calculated to be 0.5±0.21, their mean LR at 355 nm is 31±6 sr and their mean particle depolarisation value is 0.33±0.12.
4.5 Latitudinal and temperature dependence of cirrus properties
In this section we firstly examine the latitudinal dependence of the cirrus geometrical and optical properties. The reported values in the literature from previous studies based on the lidar ground-based dataset and the retrievals of the current ones are listed in Table 5 and plotted in Fig. 7 for comparison. We note that the cirrus geometrical properties and the lidar ratio values may vary greatly depending on the latitude, and a decreasing trend of the geometrical boundaries with the rise of the distance from the Equator is obvious from the ground-based studies. This pattern is in accordance with the CloudSat observations (Sassen et al., 2008). The derived cirrus cloud geometrical properties, based on the satellite information, peak around the Equator and at mid-latitude sites, with generally decreasing amounts as the poles are approached. In our study, cirrus layers were observed up to altitudes of 13 km above the subtropical sites, whereas they were only detected to be about 1 km lower at the subarctic region, following the above pattern. On the other hand, the lidar ratio values seem to follow a diverse relation, showing greater values moving toward the poles. In our study, lower LR values are observed for Gwal Pahari and Elandsfontein, and a higher mean value is observed for Kuopio. Overall, our results seem to demonstrate that subarctic cirrus clouds are colder, lower and optically thinner than subtropical cirrus clouds. However, a more extended database is needed to strengthen these indications.
Table 5Summary of cirrus cloud geometrical and optical properties of ground-based lidar observations reported in literature.
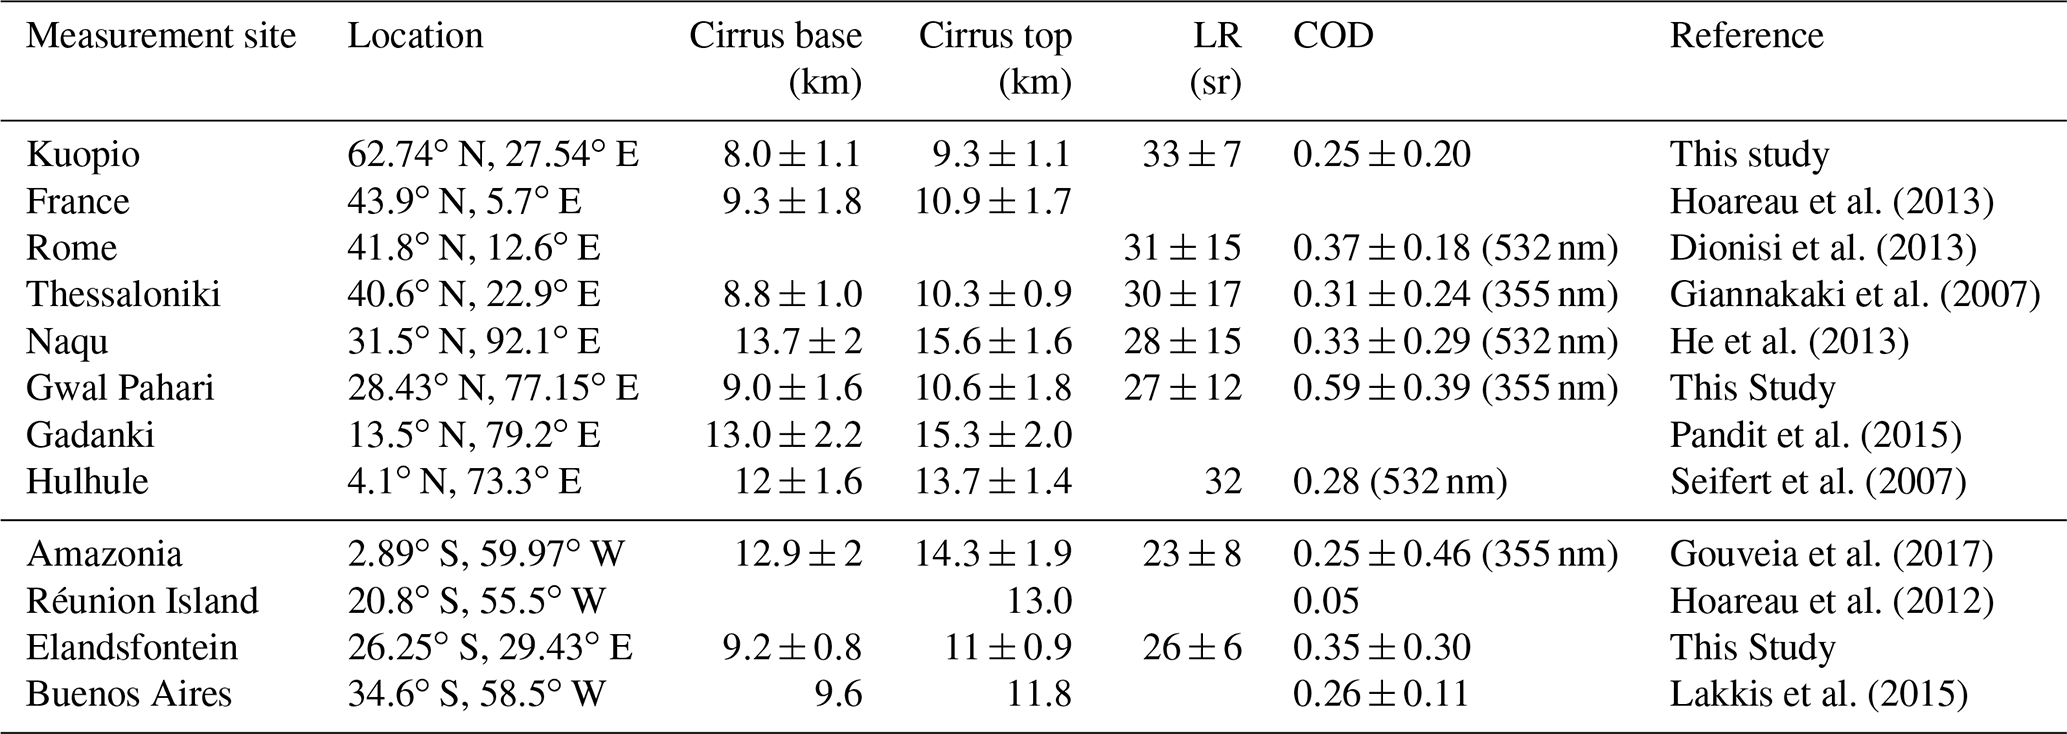
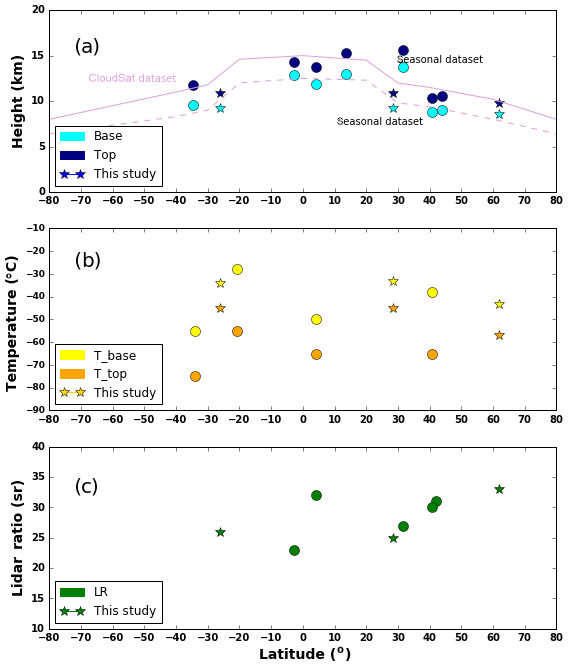
Figure 7Latitudinal dependence of cirrus properties. In (a), which shows latitudinal dependence on cirrus base and top height, circles denote estimations from ground-based lidar from the literature (see Table 5 for references), stars denote estimations from this study, and lines correspond to CloudSat estimations according to Sassen et al. (2008). Panel (b) shows latitudinal dependence on temperature, where circles denote estimations from ground-based lidar from the literature (see Table 5 for references) and stars denote estimations from this study. Panel (c) shows latitudinal dependence on lidar ratio values, where circles denote estimations from ground-based lidar from the literature (see Table 5 for references) and stars denote estimations from this study.
The dependence of geometrical and optical properties on mid-cirrus temperatures is also examined in Fig. 8. In order to investigate this dependence, we grouped cirrus cloud temperatures into 5 ∘C intervals. The number of cases per temperature bin are also labelled. Temperature values are obtained from radio soundings, as mentioned above. Thicker clouds (∼1.5 km) are observed at temperatures between and ∘C, with decreasing thickness reported for lower temperatures for both the subtropical and subarctic regions, and a second peak is found in the range between and ∘C for the subarctic station. A similar trend has been reported for a mid-latitude region by Hoareau et al. (2013), where the thickest cirrus layers were found to be about −42.5 ∘C, and thinner ones were found at both colder and warmer temperatures. Another study (Pandit et al., 2015) reports that the geometrical thickness increases from 1 to 3.5 km as mid-cloud temperature increases from −90 to −60 ∘C, while for the further increase in temperature from −60 to −20 ∘C, the geometrical thickness decreases to less than 1 km. Concerning the optical properties shown in Fig. 8, a steady increase in the lidar ratio from −25 to −40 ∘C is noticed for the two subtropical stations, while the variability in this parameter is relatively constant across months for the subtropical station, with a slight increase at warmer temperatures (Fig. 8b). There are indications that the cloud optical depth increases with the increasing mid-cirrus temperature for the two subtropical sites (Fig. 8c). At cold temperatures ( ∘C), the optical thickness for cirrus layers of the subarctic station is high compared to warmer temperatures, and also cloud thickness for this temperature is similarly high (∼1.5 km). The dependence of the particle depolarisation values on base temperature is also examined (Fig. 8d). No clear tendency is found, as the variability in this parameter is relatively constant, with a slight increase in the particle depolarisation with the increasing mid-cirrus temperature. This behaviour indicates a relation between cirrus ice crystal shape and temperature; however, more studies should be done in order to examine this behaviour in various geographical locations.

Figure 8Dependencies of cirrus geometrical thickness (a), lidar ratio at 355 nm (b), optical depth at 355 nm (c) and particle depolarisation values (d) on 5 ∘C intervals of mid-cirrus temperature. Numbers labelled indicate the number of cases per temperature bin.
Figure 9 presents the colour ratio values on 5 ∘C intervals of the mid-cirrus temperature, indicating an almost stable behaviour with temperature. Generally, we can conclude that for higher altitudes, lower spectral dependence is seen, taking also the number of measurements performed at each site into account.
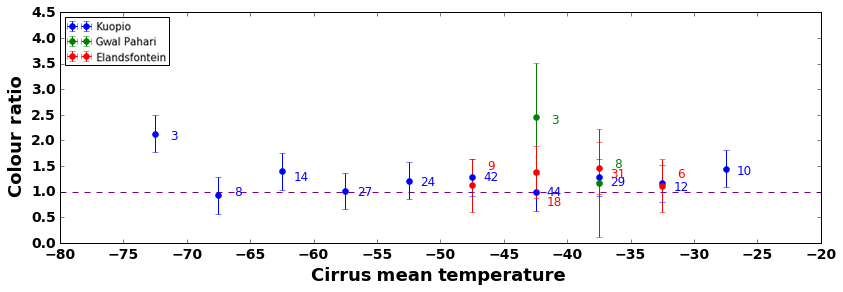
Figure 9Dependencies of colour ratio (355∕532) on 5 ∘C intervals of mid-cirrus temperature. Numbers labelled indicate the number of cases per temperature bin.
The dependency of the mid-cirrus temperature on the lidar ratio values at 355 nm and the particle depolarisation values is further examined (Fig. 10). Figure 10 shows that the highest values of the cirrus lidar ratio (>40) correspond to higher values of cirrus depolarisation (>0.4) and warmer cirrus. Moreover, the variety of depolarisation values that correspond to the mean value of lidar ratio (∼31) can be seen. A similar behaviour is reported in Chen et al. (2002) for lidar ratio values higher than 30 sr. In their study, the relationship between the depolarisation ratio and the lidar ratios shows that the former split into two groups for lidar ratios higher than 30. The first group has high depolarisation ratios of about 0.5, and the second one has ratios of 0.2.
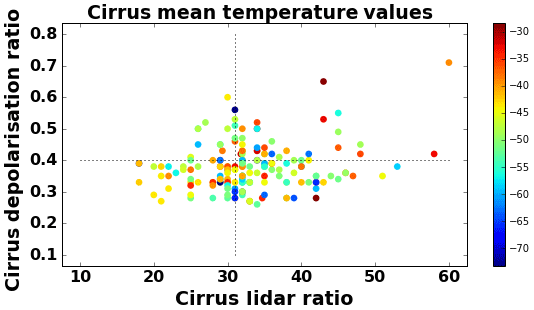
Figure 10Dependencies of the mean temperature on the lidar ratio values at 355 nm and the particle depolarisation values.
Observations of cirrus cloud geometrical and optical properties, performed with a ground-based multi-wavelength PollyXT Raman lidar during the period 2008 to 2016, are analysed and presented in this study. The measurements were performed in three places at different latitudes, Gwal Pahari (28.43∘ N, 77.15∘ E; 243 m a.s.l.) in India, Elandsfontein (26.25∘ S, 29.43∘ E; 1745 m a.s.l.) in South Africa and Kuopio (62.74∘ N; 27.54∘ E; 190 m a.s.l.) in Finland, and an algorithm is developed to automatically define the cirrus cloud boundaries.
The statistical behaviour of the cirrus cloud properties in the different geographical and climatic counterparts shows that the geometrical boundaries display large distribution for the two subtropical regions with higher values of geometrical thickness, with a mean thickness of 1500±700, 1600±735 and 1200±700 m for Gwal Pahari, Elandsfontein and Kuopio, respectively, showing their dependence on the geographical location. The corresponding overall mean value of the COD at 355 nm is calculated to be 0.60±0.25 and 0.35±0.30 for Gwal Pahari and Elandsfontein, respectively, while a slightly lower mean of 0.25±0.2 is calculated for Kuopio. The lidar ratio values at 355 nm show higher values moving toward the poles, with calculated values of 27±12, 26±6, and 33±7 sr for Gwal Pahari, Elandsfontein and Kuopio, respectively. Overall, our results seem to demonstrate that subarctic cirrus clouds are colder, lower and optically thinner than subtropical cirrus clouds. However, a more extended database is needed to strengthen these indications.
The dependence of cirrus cloud geometrical thickness and optical properties on mean temperature is also examined, showing a quite similar tendency but less variability for the subarctic dataset. The dependence of cirrus cloud geometrical thickness and optical properties on the mid-cirrus temperature shows a quite similar tendency but less variability for the subarctic dataset. Cirrus clouds were geometrically and optically thickest at temperatures between −45 and −35 ∘C. At temperatures below −55 ∘C, the optical thickness of cirrus layers becomes high again, and this trend appears only for the subarctic station. However, we should keep in mind that the number of samples corresponding to temperatures below −60 ∘C is limited. The lidar ratio is found to be quite constant with temperature, with a slight increase in the warmer mid-cirrus temperatures, showing larger variability for the subtropical datasets, while the particle depolarisation values seem almost constant at temperatures between −27 and −60 ∘C.
The geometrical and optical properties of cirrus layers are studied in detail, providing information useful in the validation of the cirrus parameterisations in models. Furthermore, our results could be useful for lidar ratio selection schemes needed by satellite optical property retrievals of cirrus layers over different locations, e.g. the upcoming EarthCARE (Earth Cloud, Aerosol and Radiation Explorer) mission. The spectral dependence discussed above is another important issue for the satellite algorithm schemes, given the different wavelengths applied among the different satellites.
In any case, further cirrus observations must be conducted so as to investigate whether differences in the background aerosol load contribute to potential differences in the cirrus cloud geometrical and optical properties and to identify the different atmospheric mechanisms leading to these differences over the different regions.
Lidar data are available upon request from the authors and data quicklooks are available on the PollyNET website (http://polly.tropos.de/, last access: 30 March 2020, Leibniz Institute for Tropospheric Research, 2020).
KAV prepared the automatic algorithm for the cirrus detection and processed the lidar measurements for the optical retrievals during the period 2008–2016. KAV prepared the figures of the paper. EG reviewed parts of the results. MK is the PI of the lidar station, and DB directed the preparation of the paper. KAV prepared the paper, with contributions from all co-authors.
The authors declare that they have no conflict of interest.
This work has been conducted under the European Commission by the framework of EARLINET and EARLINET-ASOS, the European Commission Horizon 2020 Research Infrastructures (ACTRIS-2), and previously by the Seventh Framework Programme (ACTRIS). This work was partly funded by the European Commission Sixth Framework Programme under the European Integrated project on Aerosol, Cloud, Climate, and Air Quality Interactions (EUCAARI). Kalliopi Artemis Voudouri acknowledges the support of the General Secretariat for Research and Technology (GSRT) and Hellenic Foundation for Research and Innovation (HFRI).
This research has been supported by the European Commission Horizon 2020 Research Infrastructures (ACTRIS-2 (grant no. 654109)), previously by the Seventh Framework Programme (ACTRIS (grant no. 262254)) and EARLINET (grant no. EVR1 CT1999-40003) and EARLINET-ASOS (grant no. RICA-025991). This research has been also supported by the Academy of Finland (project no. 270108) and Hellenic Foundation for Research and Innovation (HFRI; scholarship code: 95041).
This paper was edited by Matthias Tesche and reviewed by two anonymous referees.
Aaltonen, V., Rodriguez, E., Kazadzis, S., Sogacheva, L., Arola, A., and de Leeuw, G.: Characteristics of the aerosol climatology over Finland based on the optical columnar propertiesEGU General Assembly, Vienna, Austria, 2–7 May, EGU2010-10788, 2010.
Ackerman, S., Holz, R., Frey, R., and Eloranta, E.: Cloud Detection with MODIS: Part II Validation, J. Atmos. Ocean. Tech., 25, 1073–1086, https://doi.org/10.1175/2007JTECHA1053.1, 2008.
Ackerman, S., Frey, R., Strabala, K., Liu, Y., Gumley, L., Baum, B., and Menzel, P.: Discriminating Clear-Sky From Cloud With MODIS, Algorithm Theoretical Basis Document (MOD35), ATBD Version 6.1, 2010.
Althausen, D., Engelmann, R., Baars, H., Heese, B., Ansmann, A., Muller, D., and Komppula, M.: Portable Raman lidar PollyXT for automated profiling of aerosol backscatter, extinction, and depolarization, J. Atmos. Ocean. Tech., 26, 2366–2378, https://doi.org/10.1175/2009JTECHA1304.1, 2009.
Ansmann, A., Wandinger, U., Riebesell, M., Weitkamp, C., and Michaelis, W.: Independent measurement of extinction and backscatter profiles in cirrus clouds by using a combined Raman elastic-backscatter lidar, Appl. Optics, 31, 7113–7131, 1992.
Baars, H., Ansmann, A., Engelmann, R., and Althausen, D.: Continuous monitoring of the boundary-layer top with lidar, Atmos. Chem. Phys., 8, 7281–7296, https://doi.org/10.5194/acp-8-7281-2008, 2008.
Brooks, I.: Finding Boundary Layer Top: Application of a wavelet covariance transform to lidar backscatter profiles, J. Atmos. Ocean. Tech., 20, 1092–1105, 2003.
Campbell, J., Lolli, S., Lewis, J., Gu, Y., and Welton, E.: Daytime Cirrus Cloud Top-of-the-Atmosphere Radiative Forcing Properties at a Midlatitude Site and Their Global Consequences, J. Appl. Meteorol. Clim., 55, 1667–1679, https://doi.org/10.1175/JAMC-D-15-0217.1, 2016.
Campbell, J. R., Vaughan, M. A., Oo, M., Holz, R. E., Lewis, J. R., and Welton, E. J.: Distinguishing cirrus cloud presence in autonomous lidar measurements, Atmos. Meas. Tech., 8, 435–449, https://doi.org/10.5194/amt-8-435-2015, 2015.
Chen, W.-N., Chiang, C.-W., and Nee, J.: Lidar Ratio and Depolarization Ratio for Cirrus Clouds, Appl. Optics, 41, 6470–6476, https://doi.org/10.1364/AO.41.006470, 2002.
Comstock, J. M., Ackerman, T. P., and Mace, G. G.: Ground-based lidar and radar remote sensing of tropical cirrus clouds at Nauru Island: Cloud Statistics and radiative impacts, J. Geophys. Res., 107, 4714, https://doi.org/10.1029/2002JD002203, 2002.
Das, S. K., Nee, J. B., and Chiang, C. W.: A LiDAR study of the effective size of cirrus ice crystals over Chung-Li, Taiwan, J. Atmos. Terr. Phys., 72, 781–788, https://doi.org/10.1016/j.jastp.2010.03.024, 2010.
Dionisi, D., Keckhut, P., Liberti, G. L., Cardillo, F., and Congeduti, F.: Midlatitude cirrus classification at Rome Tor Vergata through a multichannel Raman–Mie–Rayleigh lidar, Atmos. Chem. Phys., 13, 11853–11868, https://doi.org/10.5194/acp-13-11853-2013, 2013.
Dupont, J.-C., Haeffelin, M., Morille, Y., Noel, V., Keckhut, P., Winker, D., Comstock, J., Chervet, P., and Roblin, A.: Macrophysical and optical properties of midlatitude cirrus clouds from four ground-based lidars and collocated CALIOP observations, J. Geophys. Res., 115, D00H24, https://doi.org/10.1029/2009JD011943, 2010.
Eloranta, E.: Practical model for the calculation of multiply scattered lidar returns, Appl. Optics, 37, 2464–2472, https://doi.org/10.1364/ao.37.002464, 1998.
Engelmann, R., Kanitz, T., Baars, H., Heese, B., Althausen, D., Skupin, A., Wandinger, U., Komppula, M., Stachlewska, I. S., Amiridis, V., Marinou, E., Mattis, I., Linné, H., and Ansmann, A.: The automated multiwavelength Raman polarization and water-vapor lidar PollyXT: the neXT generation, Atmos. Meas. Tech., 9, 1767–1784, https://doi.org/10.5194/amt-9-1767-2016, 2016.
Fernald, F. G.: Analysis of atmospheric lidar observations, some commnets, Appl. Optics, 32, 652–653, 1984.
Filioglou, M., Nikandrova, A., Niemelä, S., Baars, H., Mielonen, T., Leskinen, A., Brus, D., Romakkaniemi, S., Giannakaki, E., and Komppula, M.: Profiling water vapor mixing ratios in Finland by means of a Raman lidar, a satellite and a model, Atmos. Meas. Tech., 10, 4303–4316, https://doi.org/10.5194/amt-10-4303-2017, 2017.
Freudenthaler, V., Esselborn, M., Wiegner, M., Heese, B., Tesche, M., Ansmann, A., Muller, D., Althausen, D., Wirth, M., Andreas, F. I. X., Ehret, G., Knippertz, P., Toledano, C., Gasteiger, J., Garhammer, M., and Seefeldner, M.: Depolarization ratio profiling at several wavelengths in pure saharan dust during SAMUM 2006, Tellus B, 61, 165–179, 2009.
Garnier, A., Pelon, J., Vaughan, M. A., Winker, D. M., Trepte, C. R., and Dubuisson, P.: Lidar multiple scattering factors inferred from CALIPSO lidar and IIR retrievals of semi-transparent cirrus cloud optical depths over oceans, Atmos. Meas. Tech., 8, 2759–2774, https://doi.org/10.5194/amt-8-2759-2015, 2015.
Giannakaki, E., Balis, D. S., Amiridis, V., and Kazadzis, S.: Optical and geometrical characteristics of cirrus clouds over a Southern European lidar station, Atmos. Chem. Phys., 7, 5519–5530, https://doi.org/10.5194/acp-7-5519-2007, 2007.
Giannakaki, E., Pfuller, A., Korhonen, K., Mielonen, T., Laakso, L., Vakkari, V., Baars, H., Engelmann, R., Beukes, J. P., Van Zyl, P. G., Josipovic, M., Tiitta, P., Chiloane, K., Piketh, S., Lihavainen, H., Lehtinen, K. E. J., and Komppula, M.: One year of Raman lidar observations of free-tropospheric aerosol layers over South Africa, Atmos. Chem. Phys., 15, 5429–5442, https://doi.org/10.5194/acp-15-5429-2015, 2015.
Giannakaki, E., van Zyl, P. G., Müller, D., Balis, D., and Komppula, M.: Optical and microphysical characterization of aerosol layers over South Africa by means of multi-wavelength depolarization and Raman lidar measurements, Atmos. Chem. Phys., 16, 8109–8123, https://doi.org/10.5194/acp-16-8109-2016, 2016.
Georgousis, G., Adam, M., and Avdikos, G.: Signal to Noise Ratio Estimations for a Volcanic ASH Detection Lidar. Case Study: The Met Office, EPJ Web Conf., 119, 07002, https://doi.org/10.1051/epjconf/201611907002, 2016.
Goldfarb, L., Keckhut, P., Chanin, M. L., and Hauchecorne, A.: Cirrus climatological results from lidar measurements at OHP (44∘ N, 6∘ E), Geophys. Res. Lett., 28, 1687–1690, 2001.
Gouveia, D. A., Barja, B., Barbosa, H. M. J., Seifert, P., Baars, H., Pauliquevis, T., and Artaxo, P.: Optical and geometrical properties of cirrus clouds in Amazonia derived from 1 year of ground-based lidar measurements, Atmos. Chem. Phys., 17, 3619–3636, https://doi.org/10.5194/acp-17-3619-2017, 2017.
He, Q. S., Li, C. C., Ma, J. Z., Wang, H. Q., Shi, G. M., Liang, Z. R., Luan, Q., Geng, F. H., and Zhou, X. W.: The properties and formation of cirrus clouds over the Tibetan Plateau based on summertime lidar measurements, J. Atmos. Sci., 70, 901–915, https://doi.org/10.1175/JAS-D-12-0171.1, 2013.
Hoareau, C., Keckhut, P., Baray, J.-L., Robert, L., Courcoux, Y., Porteneuve, J., Vömel, H., and Morel, B.: A Raman lidar at La Reunion (20.8∘ S, 55.5∘ E) for monitoring water vapour and cirrus distributions in the subtropical upper troposphere: preliminary analyses and description of a future system, Atmos. Meas. Tech., 5, 1333–1348, https://doi.org/10.5194/amt-5-1333-2012, 2012.
Hoareau, C., Keckhut, P., Noel, V., Chepfer, H., and Baray, J.-L.: A decadal cirrus clouds climatology from ground-based and spaceborne lidars above the south of France (43.9∘ N–5.7∘ E), Atmos. Chem. Phys., 13, 6951–6963, https://doi.org/10.5194/acp-13-6951-2013, 2013.
Hogan, R. J.: Fast approximate calculation of multiply scattered lidar returns, Appl. Optics, 45, 5984–5992, 2006.
Hong, G., Yang, P., Heidinger, A. K., Pavolonis, M. J., Baum, B. A., and Platnick, S. E: Detecting opaque and nonopaque tropical upper tropospheric ice clouds: A trispectral technique based on the MODIS 8–12 µm window bands, J. Geophys. Res., 115, D20214, https://doi.org/10.1029/2010JD014004, 2010.
Illingworth, A. J., Hogan, R. J., O'Connor, E. J., Bouniol, D., Brooks, M. E., Delanoe, J., Donovan, D. P., Eastment, J. D., Gaussiat, N., Goddard, J. W. F., Haeffelin, M., Klein Baltink, H., Krasnov, O. A., Pelon, J., Piriou, J.-M., Protat, A., Russchenberg, H. W. J., Seifert, A., Tompkins, A. M., van Zadelhoff, G.-J., Vinit, F., Willen, U., Wilson, D. R., and Wrench, C. L.: Cloudnet – continuous evaluation of cloud profiles in seven operational models using ground-based observations, B. Am. Meteorol. Soc., 88, 883–898, 2007.
Josset, D., Pelon, J., Garnier, A., Hu, Y., Vaughan, M., Zhai, P.-W., Kuehn, R., and Lucker, P.: Cirrus optical depth and lidar ratio retrieval from combined CALIPSO-CloudSat observations using ocean surface echo, J. Geophys. Res., 117, D05207, https://doi.org/10.1029/2011JD016959, 2012.
Jylha, K., Tuomenvirta, H., and Ruosteenoja, K.: Climate Change projections for Finland during the 21st century, Boreal Environ. Res., 9, 127–152, 2004.
Kienast-Sjögren, E., Rolf, C., Seifert, P., Krieger, U. K., Luo, B. P., Krämer, M., and Peter, T.: Climatological and radiative properties of midlatitude cirrus clouds derived by automatic evaluation of lidar measurements, Atmos. Chem. Phys., 16, 7605–7621, https://doi.org/10.5194/acp-16-7605-2016, 2016.
Klett, J. D.: Stable analytical inversion solution for processing lidar returns, Appl. Optics, 20, 211–220, https://doi.org/10.1364/AO.20.000211, 1981.
Kulmala, M., Asmi, A., Lappalainen, H. K., Baltensperger, U., Brenguier, J.-L., Facchini, M. C., Hansson, H.-C., Hov, Ø., O'Dowd, C. D., Pöschl, U., Wiedensohler, A., Boers, R., Boucher, O., de Leeuw, G., Denier van der Gon, H. A. C., Feichter, J., Krejci, R., Laj, P., Lihavainen, H., Lohmann, U., McFiggans, G., Mentel, T., Pilinis, C., Riipinen, I., Schulz, M., Stohl, A., Swietlicki, E., Vignati, E., Alves, C., Amann, M., Ammann, M., Arabas, S., Artaxo, P., Baars, H., Beddows, D. C. S., Bergström, R., Beukes, J. P., Bilde, M., Burkhart, J. F., Canonaco, F., Clegg, S. L., Coe, H., Crumeyrolle, S., D'Anna, B., Decesari, S., Gilardoni, S., Fischer, M., Fjaeraa, A. M., Fountoukis, C., George, C., Gomes, L., Halloran, P., Hamburger, T., Harrison, R. M., Herrmann, H., Hoffmann, T., Hoose, C., Hu, M., Hyvärinen, A., Hõrrak, U., Iinuma, Y., Iversen, T., Josipovic, M., Kanakidou, M., Kiendler-Scharr, A., Kirkevåg, A., Kiss, G., Klimont, Z., Kolmonen, P., Komppula, M., Kristjánsson, J.-E., Laakso, L., Laaksonen, A., Labonnote, L., Lanz, V. A., Lehtinen, K. E. J., Rizzo, L. V., Makkonen, R., Manninen, H. E., McMeeking, G., Merikanto, J., Minikin, A., Mirme, S., Morgan, W. T., Nemitz, E., O'Donnell, D., Panwar, T. S., Pawlowska, H., Petzold, A., Pienaar, J. J., Pio, C., Plass-Duelmer, C., Prévôt, A. S. H., Pryor, S., Reddington, C. L., Roberts, G., Rosenfeld, D., Schwarz, J., Seland, Ø., Sellegri, K., Shen, X. J., Shiraiwa, M., Siebert, H., Sierau, B., Simpson, D., Sun, J. Y., Topping, D., Tunved, P., Vaattovaara, P., Vakkari, V., Veefkind, J. P., Visschedijk, A., Vuollekoski, H., Vuolo, R., Wehner, B., Wildt, J., Woodward, S., Worsnop, D. R., van Zadelhoff, G.-J., Zardini, A. A., Zhang, K., van Zyl, P. G., Kerminen, V.-M., S Carslaw, K., and Pandis, S. N.: General overview: European Integrated project on Aerosol Cloud Climate and Air Quality interactions (EUCAARI) – integrating aerosol research from nano to global scales, Atmos. Chem. Phys., 11, 13061–13143, https://doi.org/10.5194/acp-11-13061-2011, 2011.
Komppula, M., Mielonen, T., Arola, A., Korhonen, K., Lihavainen, H., Hyvärinen, A.-P., Baars, H., Engelmann, R., Althausen, D., Ansmann, A., Müller, D., Panwar, T. S., Hooda, R. K., Sharma, V. P., Kerminen, V.-M., Lehtinen, K. E. J., and Viisanen, Y.: Technical Note: One year of Raman-lidar measurements in Gual Pahari EUCAARI site close to New Delhi in India – Seasonal characteristics of the aerosol vertical structure, Atmos. Chem. Phys., 12, 4513–4524, https://doi.org/10.5194/acp-12-4513-2012, 2012.
Lakkis, S. G., Lavorato, M., Canziani, P., and Lacomi, H.: Lidar observations of cirrus clouds in Buenos Aires, J. Atmos. Sol.-Terr. Phys., 130–131, 89–95, https://doi.org/10.1016/j.jastp.2015.05.020, 2015.
Leibniz Institute for Tropospheric Research: Worldwide observations with the portable Raman lidar systems (Polly), available at: http://polly.tropos.de/, last access: 30 March 2020.
Lynch, D. K., Sassen, K., Starr, D. O., and Stephens, G. L. (Eds.): Cirrus history and definition, in: Cirrus, 1st edn., Oxford University Press, 2002.
Martins, E., Noel, V., and Chepfer, H., Properties of cirrus and subvisible cirrus from nighttime Cloud-Aerosol Lidar with Orthogonal Polarization (CALIOP), related to atmospheric dynamics and water vapor, J. Geophys. Res., 116, D02208, https://doi.org/10.1029/2010JD014519, 2011.
Min, M., Wang, P., Campbell, J. R., Zong, X., and Xia, J.: Cirrus cloud macrophysical and optical properties over north China from CALIOP measurements, Adv. Atmos. Sci., 28, 653–664, https://doi.org/10.1007/s00376-010-0049-5, 2011.
Noel, V., Chepfer, H., Ledanois, G., Delaval, A., and Flamant, P.: Classification of Particle Effective Shape Ratios in Cirrus Clouds Based on the Lidar Depolarization Ratio, Appl. Optics, 41, 4245–4257, https://doi.org/10.1364/AO.41.004245, 2002.
Pandit, A. K., Gadhavi, H. S., Venkat Ratnam, M., Raghunath, K., Rao, S. V. B., and Jayaraman, A.: Long-term trend analysis and climatology of tropical cirrus clouds using 16 years of lidar data set over Southern India, Atmos. Chem. Phys., 15, 13833–13848, https://doi.org/10.5194/acp-15-13833-2015, 2015.
Sassen, K. and Cho, B. S.: Subvisual-Thin cirrus lidar dataset for satellite verification and climatological research, J. Appl. Meteorol., 31, 1275–1285, https://doi.org/10.1175/1520-0450(1992)031<1275:STCLDF>2.0.CO;2, 1992.
Sassen, K., Wang, Z., and Liu, D.: Global distribution of cirrus clouds from CloudSat/Cloud-Aerosol Lidar and Infrared Pathfinder Satellite Observations (CALIPSO) measurements, J. Geophys. Res., 113, D00A12, https://doi.org/10.1029/2008JD009972, 2008.
Seifert, P., Ansmann, A., Muller, D., Wandinger, U., Althausen, D., Heymsfield, A. J., Massie, S. T., and Schmitt, C.: Cirrus optical properties observed with lidar, radiosonde, and satellite over the tropical Indian Ocean during the aerosol-polluted northeast and clean maritime southwest monsoon, J. Geophys. Res., 112, D17205, https://doi.org/10.1029/2006JD008352, 2007.
Vaughan, M. A., Liu, Z., McGill, M. J., Hu, Y., and Obland, M. D., On the spectral dependence of backscatter from cirrus clouds: Assessing CALIOP's 1064 nm calibration assumptions using cloud physics lidar measurements, J. Geophys. Res., 115, D14206, https://doi.org/10.1029/2009JD013086, 2010.
Wandinger, U.: Multiple-scattering influuence on extinction- and backscatter-coefficient measurements with Raman and high-spectral resolution lidars, Appl. Optics, 37, 417–427, 1998.
Wang, Z. and Sassen, K.: Cirrus cloud microphysical property retrieval using lidar and radar measurements. Part II: Midlatitude cirrus microphysical and radiative properties, J. Atmos. Sci., 59, 2291–2302, 2002.
Westbrook, C. D. and Illingworth, A. J.: Evidence that ice forms primarily in supercooled liquid clouds at temperatures ∘C, Geophys. Res. Lett., 38, L14808, https://doi.org/10.1029/2011GL048021, 2011.
Young, S. A., Vaughan, M. A., Garnier, A., Tackett, J. L., Lambeth, J. D., and Powell, K. A.: Extinction and optical depth retrievals for CALIPSO's Version 4 data release, Atmos. Meas. Tech., 11, 5701–5727, https://doi.org/10.5194/amt-11-5701-2018, 2018.