the Creative Commons Attribution 4.0 License.
the Creative Commons Attribution 4.0 License.
 | 08 Apr 2020
Influence of the dry aerosol particle size distribution and morphology on the cloud condensation nuclei activation. An experimental and theoretical investigation
Junteng Wu
Alessandro Faccinetto
Symphorien Grimonprez
Sébastien Batut
Jérôme Yon
Pascale Desgroux
Denis Petitprez
Combustion and other high-temperature processes frequently result in the emission of aerosols in the form of polydisperse fractal-like aggregates made of condensed-phase nanoparticles (soot for instance). If certain conditions are met, the emitted aerosol particles are known to evolve into important cloud condensation nuclei (CCN) in the atmosphere. In this work, the hygroscopic parameter κ of complex morphology aggregates is calculated from the supersaturation-dependent activated fraction Fa=Fa(SS) in the frame of κ-Köhler theory. The particle size distribution is approximated with the morphology-corrected volume equivalent diameter calculated from the electrical mobility diameter by taking into account the diameter of the primary particle and the fractal dimension of the aggregate experimentally obtained from transmission electron microscopy measurements. Activation experiments are performed in water supersaturation conditions using a commercial CCN-100 condensation nuclei counter. The model is tested in close-to-ideal conditions of size-selected, isolated spherical particles (ammonium sulfate nanoparticles dispersed in nitrogen), then with complex polydisperse fractal-like aggregates (soot particles activated by exposure to ozone with κ as low as ) that represent realistic anthropogenic emissions in the atmosphere.
- Article
(4803 KB) - Full-text XML
- BibTeX
- EndNote


Soot particles formed during the incomplete combustion of hydrocarbons and emitted in exhaust are potentially important contributors to the radiative forcing of the atmosphere as they adsorb and scatter the solar radiation (direct effect), but they can also act as cloud condensation nuclei (CCN) or ice nuclei (IN) and trigger the formation of persistent clouds (indirect effect) (Bond et al., 2013). To date, estimations of the magnitude of the direct and indirect effects are subject to large uncertainty, and commonly accepted values span the range [] W m−2 for the direct effect and [] W m−2 for the indirect effect comprehensive of all aerosol–cloud interactions (Stocker et al., 2014). Such large uncertainties result from the combination of several difficult-to-predict behaviors of the soot particles in the atmosphere when compared to mineral and biogenic aerosols. For instance, their small size and low density enable a long lifetime in the atmosphere, which can reach several weeks (Govardhan et al., 2017). Their complex morphology and large specific surface allow many possible surface interactions that can deeply affect their reactivity (Monge et al., 2010; Browne et al., 2015). Furthermore, their number concentration is subject to high geographic variability and especially in polluted regions can be comparable to the typical number concentration of marine aerosols, which provide the largest contribution to the total mass of aerosols emissions (Rose et al., 2006; Sayer et al., 2012). To better understand the effect of soot particles on the radiative balance of the atmosphere, it is therefore important to understand how their size distribution, morphology and surface composition impact their activity as CCN.
Soot formation in flame combustion is a complex process, strongly affected, among other factors, by the fuel nature, the local fuel-air equivalence ratio and the flame temperature (D'Anna, 2009; Wang, 2011; Karataş and Gülder, 2012). At a short reaction time, equivalently at a low height above the burner (HAB), the oxidation of the fuel generates small radicals that quickly recombine to form larger and larger hydrocarbons, molecular ions and radicals. Small polycyclic aromatic hydrocarbons (PAHs) and their derivatives are long since regarded as the most important soot molecular precursors (Richter and Howard, 2000). At longer reaction time, equivalently at a higher HAB, the soot molecular precursors react to form condensed-phase nascent soot particles. In controlled, low-sooting laboratory flames, nascent soot particles as small as 2 nm can be detected (Betrancourt et al., 2017). The dynamic equilibrium between the heterogeneous reactions at the particle surface (surface growth and oxidation) in concert with coalescence and coagulation phenomena determine whether the newly formed particles increase their size or are re-oxidized into gas-phase products. In sooting flames, nascent soot particles quickly evolve into primary soot particles having a typical diameter in the range 5–30 nm (Apicella et al., 2015). If their number concentration is sufficiently large, condensed-phase particles at any reaction time can coalesce and coagulate into complex morphology aggregates that persist up to the flame exhausts (Kholghy et al., 2013).
A substantial body of literature exists on the characterization of the morphology of soot particles by electron microscopy. Young primary soot particles sampled at low HAB are well known to be characterized by an amorphous core surrounded by a highly structured series of concentric shells, often referred to as an onion-like structure (Kholghy et al., 2016). On the other hand, mature soot particles sampled at high HAB tend to be extremely complex aggregates of hundreds to tens of thousands of primary particles (Santamaría et al., 2007; Kelesidis et al., 2017). The morphology of these aggregates is scale-invariant over a relatively large range (fractal-like aggregates), and therefore some concepts borrowed from fractal geometry can be applied to characterize them. In particular, the fractal dimension Df is considered to be an important descriptor of the soot particle morphology, which links the number of primary particles of an aggregate Npp to the diameter of the primary particle dpp through the power law (Sorensen, 2011; Eggersdorfer and Pratsinis, 2014) as follows:
where kf is the exponential pre-factor and dp is the equivalent particle diameter. Over the years, different approaches have been proposed to estimate dp with quantities easily accessible from experiments including the diameter of gyration from angular light scattering measurements (Köylü et al., 1995; Sorensen et al., 1992) or the size of the aggregate projection from scanning electron microscopy (Colbeck et al., 1997) and transmission electron microscopy (Cai et al., 1995; Hu et al., 2003).
From the chemical point of view, the gas-condensed phase conversion remains to date a poorly understood process (D'Anna, 2009; Wang, 2011; Desgroux et al., 2013; Michelsen, 2017). The molecular precursors participating in soot formation and found adsorbed on the surface of soot particles can be as small as PAHs containing from three to seven aromatic cycles or as large as tens of aromatic cycles depending on the combustion conditions (Irimiea et al., 2019). The availability of surface hydrogen atoms is considered to be a driving force of the surface growth process and is often described by the hydrogen abstraction/acetylene addition mechanism (Frenklach and Wang, 1990; Frenklach, 2002). At the particle surface, reactive young soot is generally rich in small PAHs characterized by a high H∕C ratio (>0.7), in contrast to more inert mature soot that is characterized by a low H∕C ratio (<0.4). Being PAHs thermodynamically stable compounds, they are often found adsorbed on the surface of the soot particles in the exhausts and give a significant contribution to the soot particles reactivity.
Such a large variability in size distribution, morphology and chemical composition strongly impacts the reactivity of soot particles in the atmosphere and their propensity to evolve into CCN. Several studies exist that characterize the CCN activity of soot particles generated in the exhaust of laboratory flames (Lambe et al., 2015) and commercial burners like the miniCAST (Henning et al., 2012; Friebel et al., 2019). Soot particle aging experiments are often performed in laboratory conditions that simulate the atmosphere and make use of flow reactors (Kotzick et al., 1997; Lambe et al., 2015; Zuberi et al., 2005) or atmospheric simulation chambers (Tritscher et al., 2011; Wittbom et al., 2014; Grimonprez et al., 2018). The hygroscopic properties of soot are generally determined at supersaturation conditions provided by instruments such as a variable supersaturation condensation nuclei counter (VSCNC) or a cloud condensation nuclei counter (CCNc). Overall, freshly emitted soot particles are generally considered as poor CCN. However, several studies demonstrate that photochemical aging (Tritscher et al., 2011) or chemical aging that includes exposure to OH radicals (Zuberi et al., 2005; Lambe et al., 2015), O3 (Kotzick et al., 1997; Wittbom et al., 2014; Grimonprez et al., 2018) or NO3 radicals (Zuberi et al., 2005) under atmospheric relevant conditions can efficiently turn soot particles into CCN.
Köhler theory (Köhler, 1936) is widely used to describe the formation process of liquid cloud droplets at supersaturation conditions. Köhler theory is entirely founded on equilibrium thermodynamics and describes the change in the saturation vapor pressure of water induced by the curved surface of the nascent droplet and by the presence of solutes in the liquid phase. A number of recent implementations of Köhler theory have been used to describe the cloud droplet activation of wettable insoluble or partially soluble compounds. Among them, the adsorption activation theory describes the mechanism of droplet growth through multilayer adsorption of water. The number of layers of adsorbed water molecules is calculated using Brunauer, Emmet and Teller isotherms (Henson, 2007) or alternatively the Frenkel–Halsey–Hill isotherms (Sorjamaa and Laaksonen, 2007). In this work, a simpler approach is chosen (Petters and Kreidenweis, 2007) that relies on a single-parameter (κ) representation of the CCN activity to take into account the reduction in the water activity due to the presence of partially soluble components (κ-Köhler theory). According to κ-Köhler theory, at thermodynamic equilibrium the supersaturation over an aqueous solution droplet as a function of the droplet diameter D, of the size of the seeding particle dp and of the hygroscopic parameter κ is given by
where Mw and ρw are the molar mass and density of water, respectively, σs∕a is the surface tension at the solution/air interface, R is the ideal gas constant, and T is the temperature. J m−2 and T=298 K are commonly used for calculations that lead to m.
Even if this approach does not describe explicitly the underlying mechanism of CCN formation, the κ-Köhler theory has been widely used to characterize the activity in supersaturation conditions of isolated nonspherical aerosol particles as a function of κ (Su et al., 2010; Cerully et al., 2011), dp (Snider et al., 2006; Kuwata and Kondo, 2008) or SS (Sullivan et al., 2009; Tang et al., 2015). The particle size distribution has been proven to affect the CCN activation curves (Abdul-Razzak and Ghan, 2000; Snider et al., 2006). However, the (geometric) standard deviation of the particle size distribution alone is not sufficient to completely explain the slope of the CCN activation curves (Snider et al., 2006), and therefore a distribution of values of the parameter κ has been proposed to add the missing degree of freedom (Su et al., 2010; Cerully et al., 2011).
Only a few studies exist on the CCN activity of soot particles compared to non-aggregated aerosol particles (Grimonprez et al., 2018; Lambe et al., 2015; Sullivan et al., 2009; Tang et al., 2015). In these studies, a corrected volume equivalent diameter based on the estimated mass density of the soot particles is used to parameterize the particle size. However, particles characterized by very low activity like fresh soot particles have been reported to have κ<0 (“apparent crossing of the Kelvin limit”) in some instances (Grimonprez et al., 2018; Lambe et al., 2015; Tritscher et al., 2011). To avoid this problem, κ has been obtained from the fitting of the activation curve with generic sigmoid functions that do not take into account the particle size distribution or a distribution of values of κ. In the above-mentioned studies, both for non-aggregated and aggregated aerosol particles, the electrical mobility diameter, experimentally accessed by scanning mobility particle sizer (SMPS) measurements, has often been used to obtain the particle size distribution. In this case, the role of multiply charged particles needs to be taken into account (Petters, 2018).
The main goal of this work is the quantification of the role of the particle morphology on the cloud condensation activity of soot particles in conditions that simulate atmospheric chemical aging. In practice, a morphology-corrected volume equivalent diameter dve is calculated from the electrical mobility diameter dm by including the diameter of the primary particle dpp and the fractal dimension Df obtained from transmission electron microscopy (TEM). κ is calculated from the best fit of the experimental activation data Fa=Fa(SS) obtained in water supersaturation conditions using a commercial CCN-100 condensation nuclei counter. After including the contribution of the morphology in dve, κ is considered to be only representative of the particle chemistry, such as the modification of the surface composition or the formation of soluble compounds due to the chemical aging. To account for the heterogeneity of the particle chemistry and to correct for the differences between experimental and calculated Fa=Fa(SS), κ is treated as a probability distribution rather than a single value. The second main goal of this work is to provide quantitative information on the evolution of κ during the chemical aging of soot particles characterized by different maturity, i.e., sampled at different HAB in a laboratory jet diffusion flame supplied with kerosene. The model is first tested in close-to-ideal conditions of size-selected, isolated spherical particles (ammonium sulfate nanoparticles dispersed in nitrogen), then in the complex case of polydisperse fractal-like aggregates (soot particles activated by exposure to ozone).
2.1 Modification of Fa(SS) to include a distribution of dp and κ
Probability density functions of dp (Abdul-Razzak and Ghan, 2000; Snider et al., 2006) and κ (Cerully et al., 2011; Su et al., 2010) have been widely used in aerosol science and atmospheric research to describe the CCN activity. dp and κ are often treated as uncorrelated variables to avoid double integration (Su et al., 2010; Zhao et al., 2015). The activated fraction Fa(SS) is then calculated as
where μp,geo and σp,geo are the geometric mean (i.e., the median) and the geometric standard deviation of dp, respectively. Lognormal distributions are considered as viable approximations for the probability density function of κ p(κ) (Su et al., 2010) that is given by
where μκ,geo and σκ,geo are the geometric mean (i.e., the median) and the geometric standard deviation of κ, respectively.
2.2 Definition of the morphology-corrected volume equivalent diameter dve
In this section, a relationship to obtain dve from dm for a fractal-like aggregate is derived. dve is the diameter of a sphere having the same volume as the aggregate and, assuming the aggregate is made of identical, spherical primary particles, is defined as
where dpp and Npp are the diameter and number of primary particles per aggregate, respectively. It is worth noticing that often, for practical purposes, the value of dpp used in calculations is the mass equivalent diameter of the primary particle distribution obtained from TEM measurements. On the other hand, dm is directly linked to the aerodynamic force acting on the particle Fdrag (Dahneke, 1973; Sorensen, 2011) and can be directly obtained from SMPS measurements as follows:
where η and vr are the kinematic viscosity of the gas and the particle-gas relative velocity, and Cc is the Cunningham slip factor (Allen and Raabe, 1985):
is the Knudsen number, and λg is the gas mean free path. The drag force acting on an aggregate Fdrag,agg can be approximated using the drag force acting on each primary particle Fdrag,pp, which is considered as a sphere, using the relation (Yon et al., 2015)
The exponential factor Γ=Γ(dpp) has been empirically estimated as a function of the Knudsen number (Yon et al., 2015) for soot particles generated with a miniCAST commercial burner (propane–air diffusion flame). In the range ,
Although the variability range of Df might seem quite restrictive, in practice it covers a region representative of soot aggregates (Yon et al., 2015; Kelesidis et al., 2017). Therefore, we make the additional hypothesis that Eq. (9) can be applied to a variety of experimental investigations including our case. Introducing Eq. (6) in Eq. (8) yields
The dependence on Npp can be removed by using the definition of dve in Eq. (5). Finally, Eq. (10) can be solved for dve to yield
can be calculated once size distribution and morphology of the aerosol are known using Eq. (11). dpp and Df are obtained from TEM imaging as explained below, while dm is easy to access from SMPS measurements.
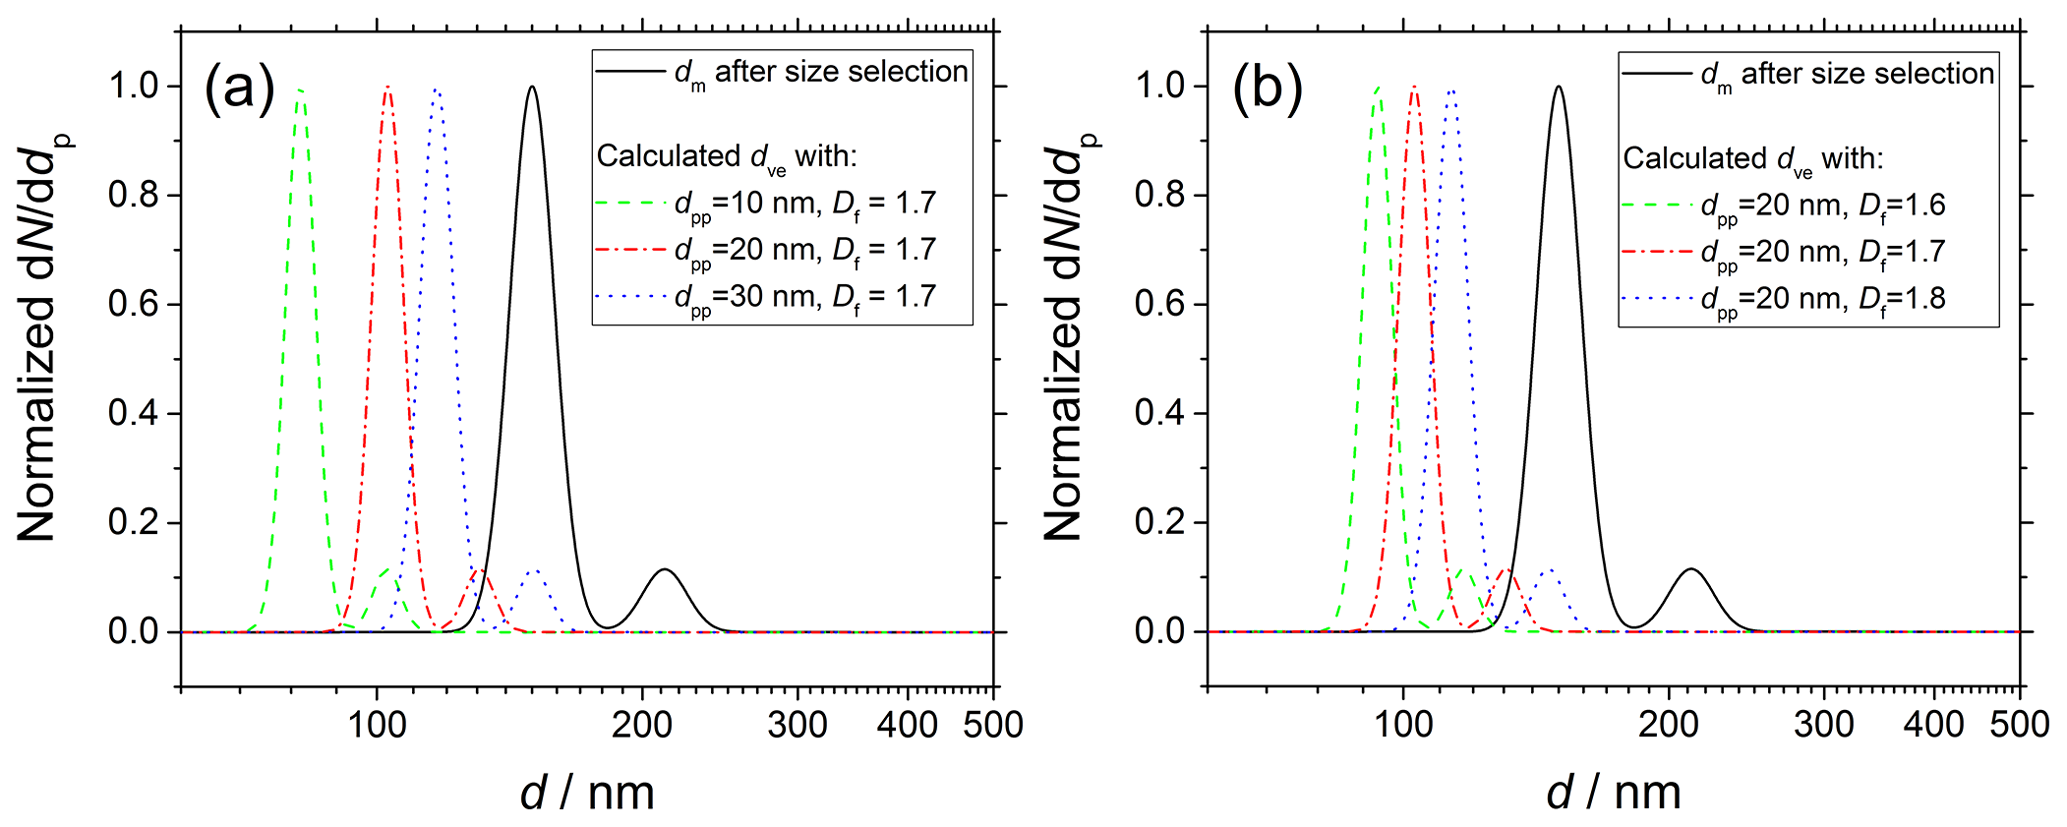
Figure 1dm distribution of soot particles sampled from the kerosene jet diffusion flame at 130 mm HAB and size selected at 150 nm (solid black line) measured immediately before droplet nucleation experiments. Simulations of of soot particles having complex morphology according to Eq. (11). For each series of simulations (colored dashed and dotted lines), (a) dm and Df or alternatively (b) dm and dpp are set as constant, and the remaining parameter is varied in the range indicated in the legend.
Figure 1 shows the functional dependency of dve on (a) dpp and (b) Df. As an example, the experimental dm distribution of soot particles after size selection at 150 nm (solid black line; see Sect. 3 for details on the experimental conditions) is compared to calculated dve (colored dashed and dotted lines). dm is measured immediately before the droplet nucleation experiments in a tandem SMPS configuration. In the cases investigated in this work, is always significantly shifted to smaller values and narrower than the original dm. Increasing dpp from 10 up to 30 nm (Df=1.7) results in dve increasing from 82.0 up to 117.0 nm. Similarly, increasing Df from 1.6 up to 1.8 (dpp=20 nm) results in dve increasing from 93.5 up to 113.3 nm.
2.3 Taking into account the multimodality of dm
Because of the existence of multiple charges, one lognormal fit is generally not sufficient to describe the dm distributions. Therefore, with the aim of maintaining an analytical approach, an empirical multimode lognormal fit is used as a simple solution to describe the dm distribution of the aerosol particles injected in the CCNc as follows:
where and are the geometric mean and standard deviation of each mode.
In this section, the methodological approach is described. An overview of the experimental aerosol generation setup is shown in Fig. 2a for ammonium sulfate and Fig. 2b for soot particles. Ammonium sulfate represents the simplest case that is well known in the literature (Rose et al., 2008) for the isolated, quasi-spherical particles that can be generated by atomization (Sect. 3.1). Freshly generated ammonium sulfate aerosols are size selected then injected in a 50 L Pyrex glass static reactor. From the reactor, particles are sampled for activation experiments, size and morphology measurements. Soot particles are sampled from a jet diffusion flame supplied with kerosene, then chemically aged with ozone (Sect. 3.2). All activation experiments are performed in a CCN-100 commercial nucleation chamber (Sect. 3.3). The particle size and morphology are characterized using SMPS and TEM, respectively (Sect. 3.4).
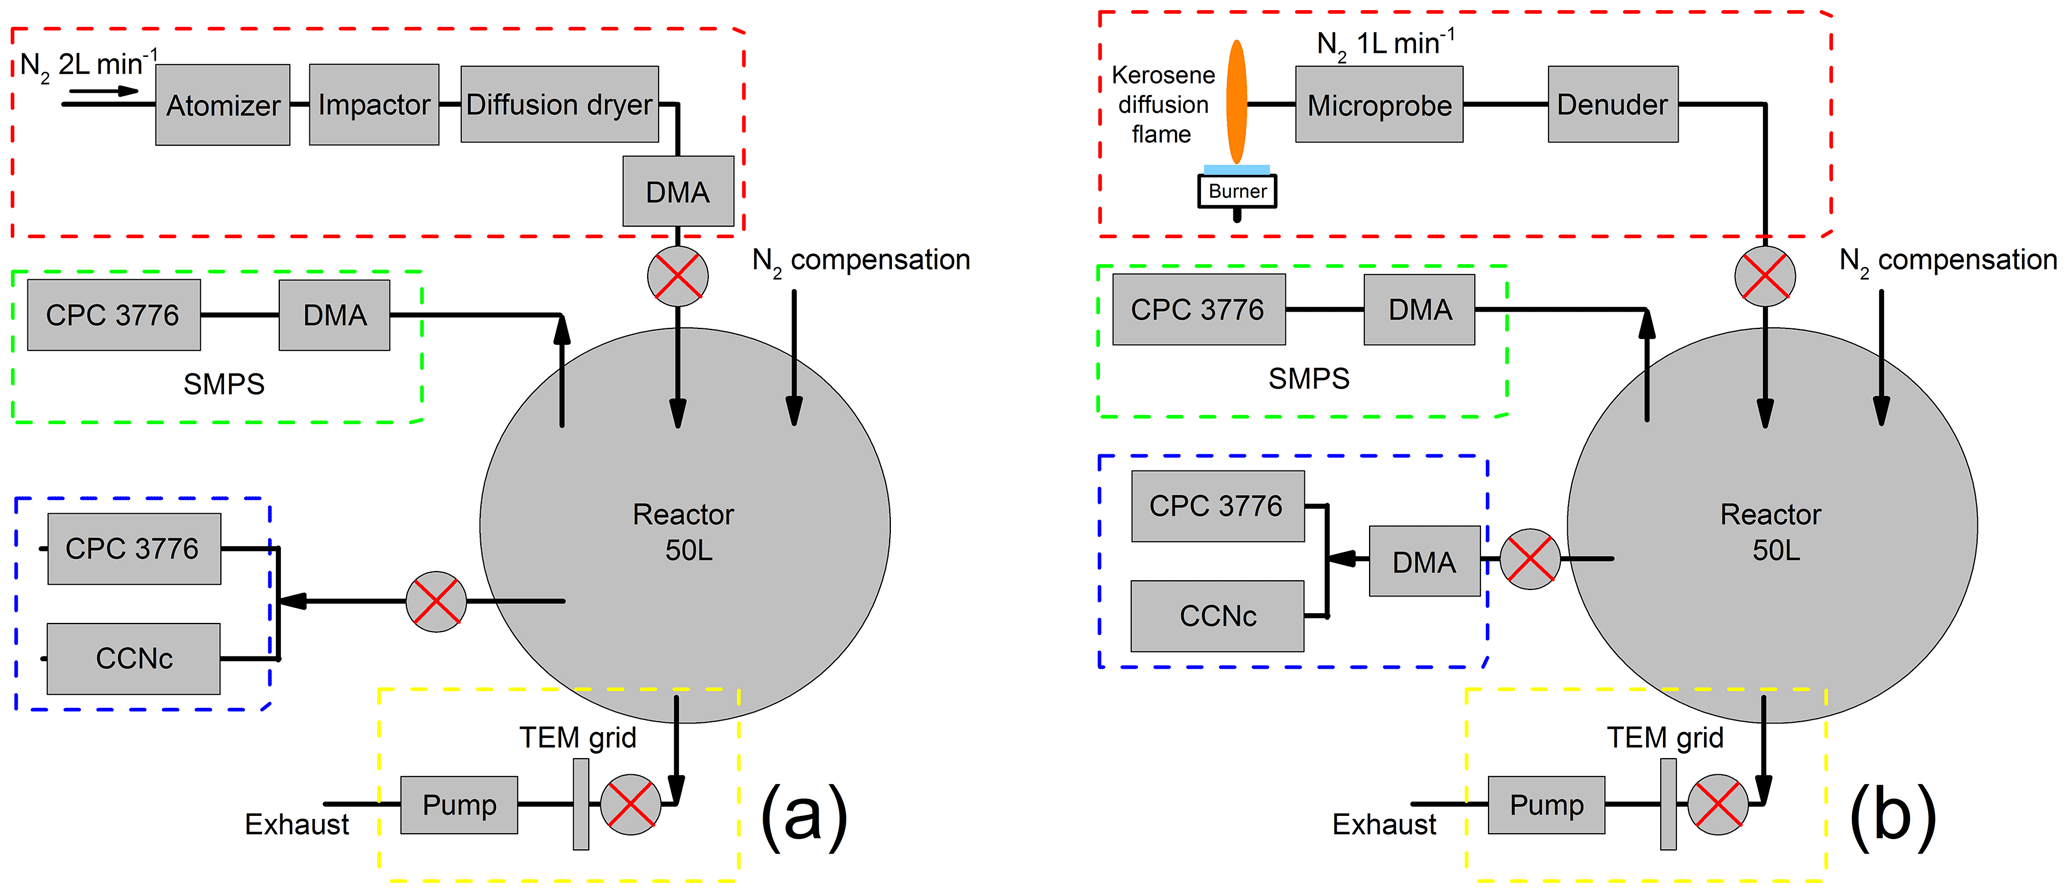
Figure 2Overview of the experimental setup used for (a) ammonium sulfate and (b) soot. Aerosol injection system (red frame), size distribution measurement system (green frame), activated fraction measurements system (blue frame) and collection system for TEM grids (yellow frame).
3.1 Ammonium sulfate aerosols generation
Ammonium sulfate aerosols are generated by atomization using a TSI aerosol generator 3076 loaded with 0.1 g L−1 concentration aqueous solution (98 % purity ammonium sulfate purchased from Sigma Aldrich and 18.2 MΩ cm purity water produced in a laboratory Veolia BIOPURE 15 apparatus). Nitrogen is used for atomization, in the range 2–3 L min−1 depending on the target aerosol concentration. The excess water is removed by flowing the aerosol through a 60 cm long diffusion dryer loaded with orange silica gel.
3.2 Soot aerosol generation, sampling and aging
A detailed description of the burner and sampling system is given elsewhere (Grimonprez et al., 2018). Briefly, a turbulent kerosene jet flame is stabilized on a Holthuis burner modified to allow the installation of a direct injection high-efficiency nebulizer. The high-speed spray of liquid fuel droplets at the exit of the nebulizer is ignited by a pilot, methane flat flame stabilized on the outer ring of the modified burner, resulting in a turbulent diffusion flame approximately 21 cm high. All experiments are performed using kerosene fuel Jet A-1. Soot is extracted from the jet flame at 70 and 130 mm HAB. At 70 mm HAB the particle concentration is small and the gas phase is rich in condensable hydrocarbons. At higher HAB, the particle concentration increases, and both the diameter of the primary particles and the mobility diameter of the aggregates grow due to surface reaction and coagulation. This results in the increase in the soot volume fraction up to a peak at 130 mm HAB. Above 210 mm HAB all the particles are oxidized, resulting in a nonsmoking flame. Soot is sampled with a diluting quartz microprobe. The sampled flow is analyzed online using SMPS or deposited on Lacey grid for TEM analyses. This setup allows a fast dilution of the sampled gas, up to a factor 3×10⁴, that quenches most chemical reactions and limits particle coagulation and aggregation downstream in the sampling line. It is important to notice that the particle concentration in the sampling line has to be larger than the optical counters detection limit but low enough to limit post-sampling aggregation or agglomeration. To avoid the formation of secondary organic aerosol in the reactor, a parallel plate, activated-carbon diffusion denuder is installed downstream from the microprobe.
Freshly emitted soot particles are highly hydrophobic. In this work, the reaction of freshly sampled soot with ozone is used to increase their hydroscopicity following the experimental procedure detailed in our past work (Grimonprez et al., 2018). The experimental variable used to control the surface oxidation of soot particle is the ozone exposure, defined as the product of the ozone concentration and the residence time in the reactor. Briefly, the reactor is first pumped to reduce the background particle count below the lower detection limit of the condensation particle counter (CPC) and then is filled with nitrogen and ozone generated by photolysis of oxygen with a UVP SOG-2 lamp. To inject the soot aerosol, the pressure in the reactor is set to a slightly lower value than the sampling line ( mbar). Therefore, a net sample flow (estimated around 2–5 mL min−1) enters the probe from the flame, is immediately mixed with the nitrogen dilution flow (1–8 L min−1), passes through the denuder and finally arrives to the reactor. The time origin for the calculation of ozone exposure starts 10 s after the end of soot injection. During injections, the SMPS is disconnected from the reactor to avoid acquiring data outside the recommended pressure range and reconnected after the pressure has been raised again up to p=1 bar.
3.3 Activation experiments
Activation experiments aim to measure Fa=Fa(SS) and are performed by means of a commercial Droplet Measurement Technologies Cloud Condensation Nuclei Counter CCN-100 installed in parallel with a TSI condensation particle counter CPC 3776. To study the effect of the particle size distribution on Fa, two different protocols are adopted for ammonium sulfate and soot. Ammonium sulfate particles are size selected by a differential mobility analyzer (DMA), pass through the reactor and then are injected in the CCNc-100. Soot particles are first sampled from the flame and injected in the reactor in which they are aged with ozone (Sect. 3.2). A TSI differential mobility analyzer DMA 3081 is installed immediately downstream from the reactor so that only aerosol particles with a selected electrical mobility and geometric deviation are injected in the CCNc-100. Additional verifications of the size distribution are performed using SMPS at regular time intervals to rule out the presence of coagulation during the aging experiments. More in detail, a 0.8 L min−1 particle-laden flow is sampled from the reactor, split, and used to supply the CCNc (0.5 L min−1) and the CPC (0.3 L min−1) in parallel, which record the concentration of nucleated water droplets and aerosol particles at different supersaturations, respectively, required to plot Fa=Fa(SS). The total flow sampled by the CPC and the CCNc is balanced with nitrogen injected directly into the reactor, and all concentrations are corrected for dilution during measurements. Samples on TEM grids are also collected to get information on the morphology and primary particle size distribution of the test aerosol. All data on activation experiments are taken from our previous work (Grimonprez et al., 2018).
3.4 Diagnostics
SMPS measurements are performed to obtain dm using a TSI 3091 SMPS that consists of a TSI 3080 DMA upstream a TSI 3776 CPC operated with 0.3 L min−1 aerosol flow rate and 1 : 10 sample/sheath flow ratio. Charge neutralization is provided by a TSI 3088 soft X-ray neutralizer.
TEM measurements are performed to obtain dpp and Npp from which Df is calculated (Sect. 4.2). All parameters are estimated from the TEM images by using ImageJ freeware software. TEM measurements are performed on the FEI Tecnai G2 20 microscope (200 kV acceleration voltage) available at the center for electron microscopy of Lille University. All samples are deposited on Lacey carbon meshes.
4.1 Test with ammonium sulfate
Ammonium sulfate is well known for the isolated, quasi-spherical particles that can be generated by atomization of aqueous solution, and for this reason it is often used as a reference material for activation experiments (Petters and Kreidenweis, 2007; Rose et al., 2008) and in this work to test the validity of Eq. (3) before moving to complex morphology aggregates. An example TEM image of the ammonium sulfate particles obtained after size selection is shown in Fig. 3a, and the corresponding particle projection dp (TEM) and electrical mobility dm (SMPS) distributions are shown in Fig. 3b and c, respectively. A single-mode lognormal function is sufficient to fit dp (dashed black line). However, because of the unavoidable generation of multiple charges during aerosol neutralization, Eq. (12) has to be used to accurately fit dm (solid red line). As shown in Fig. 3c, the best result is obtained with a two-mode fit (dotted blue and dashed green lines). The dp and dm distributions are representative of the size-selected distribution of ammonium sulfate particles injected in the CCNc.
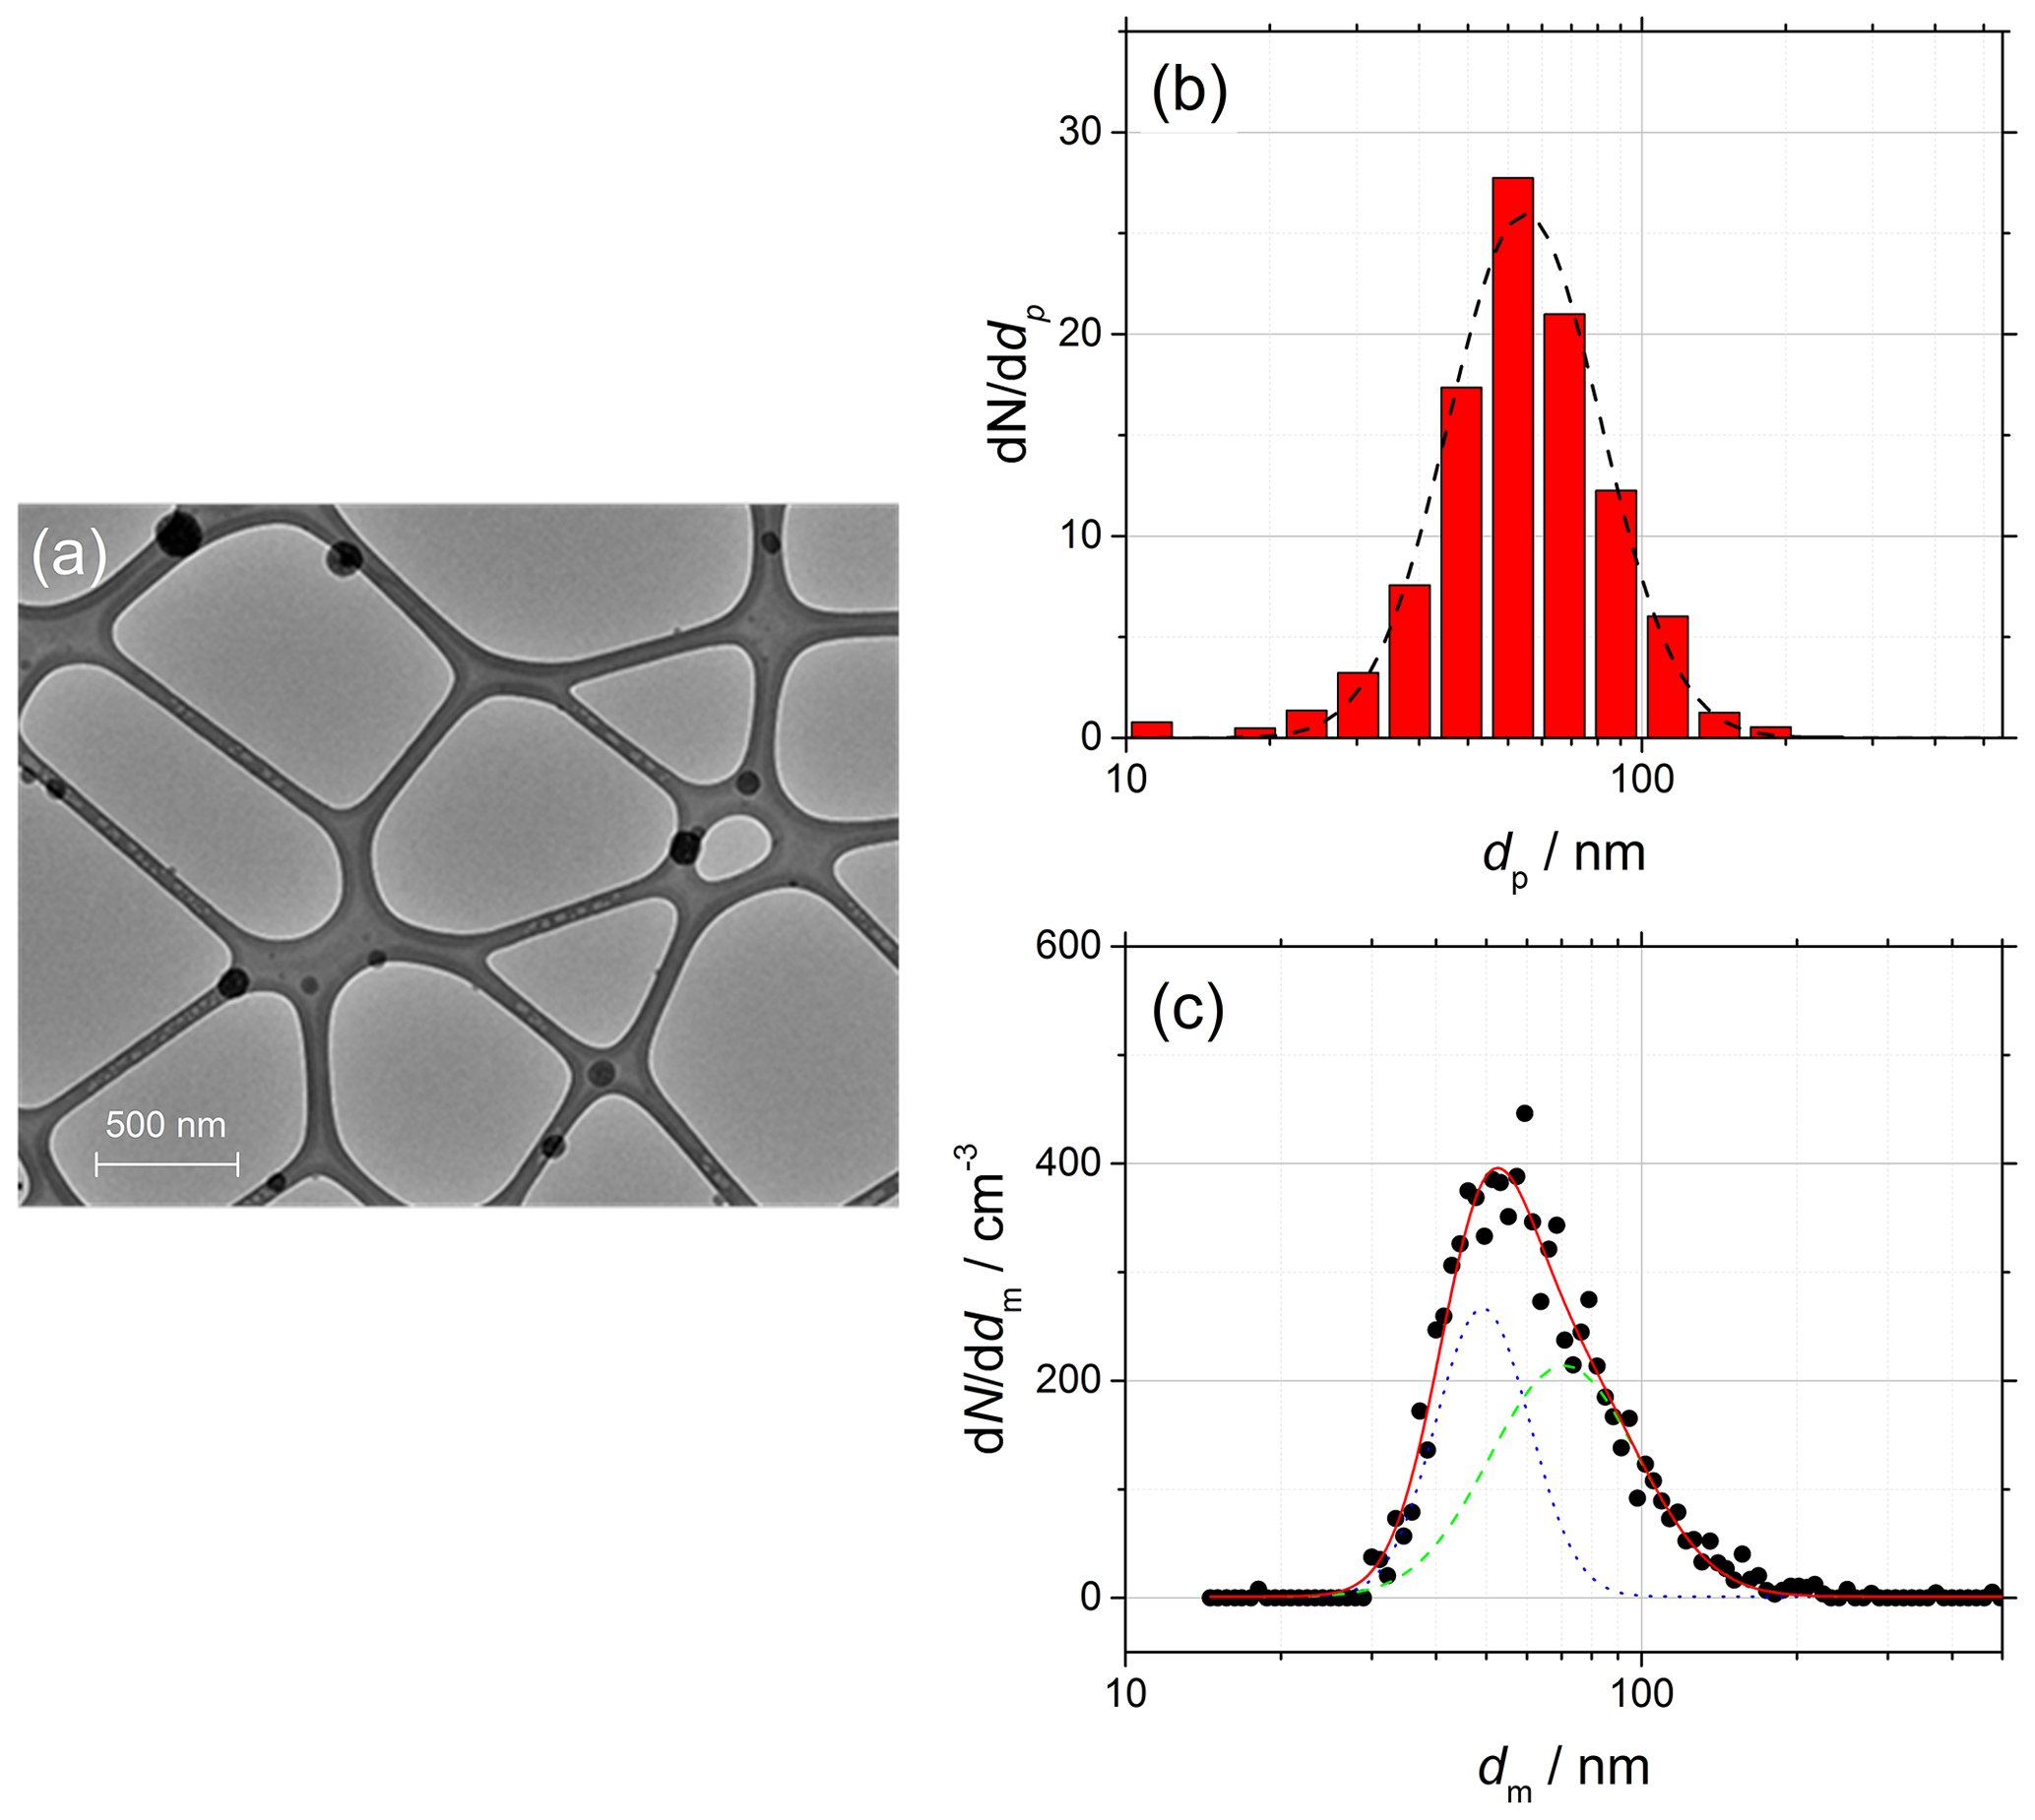
Figure 3(a) TEM image of size-selected ammonium sulfate particles (black quasi-spherical particles) deposited on a Lacey mesh, 6500 magnification. (b) Diameter of the particle projection dp obtained from TEM measurements (red bars) and single-mode lognormal fit (dashed black line). (c) Electrical mobility diameter dm obtained from SMPS measurements (black dots) and two-mode lognormal fit (solid red line) showing the two contributions (dotted blue and dashed green lines) according to Eq. (12).
Table 1Parameters of the lognormal distributions used in the activation experiments of ammonium sulfate particles and shown in Fig. 3. The uncertainties are calculated from the lognormal fit of the distributions. The table also shows the comparison of κSMPS and κTEM.

For isolated, spherical and homogeneous particles, (Eggersdorfer and Pratsinis, 2014; Sorensen, 2011). Although Fig. 3 shows a particularly favorable case, in this work it is found that dm=dp is always true within 20 % uncertainty. A summary of the parameters of the distributions is given in Table 1.
The experimental activation data (black data points) and the calculated activation curves are shown in Fig. 4; μp,geo and σp,geo are used as input parameters and obtained independently from SMPS (dm, solid red line) and TEM (dp, dashed black lines) measurements as shown in Fig. 3. Globally, the experimental data are in good agreement with the calculated curves. In the fit, μκ,geo is set as free parameter, while σκ,geo is forced to unit value as no variability in the chemical composition of ammonium sulfate is expected. A detailed discussion on the impact of σκ,geo on the calculation of Fa=Fa(SS) can be found in Appendix A. The calculations from the independently obtained dm and dp result in close p(κ) having geometric mean and , both in excellent agreement with κ=0.61 found in the literature (Petters and Kreidenweis, 2007).
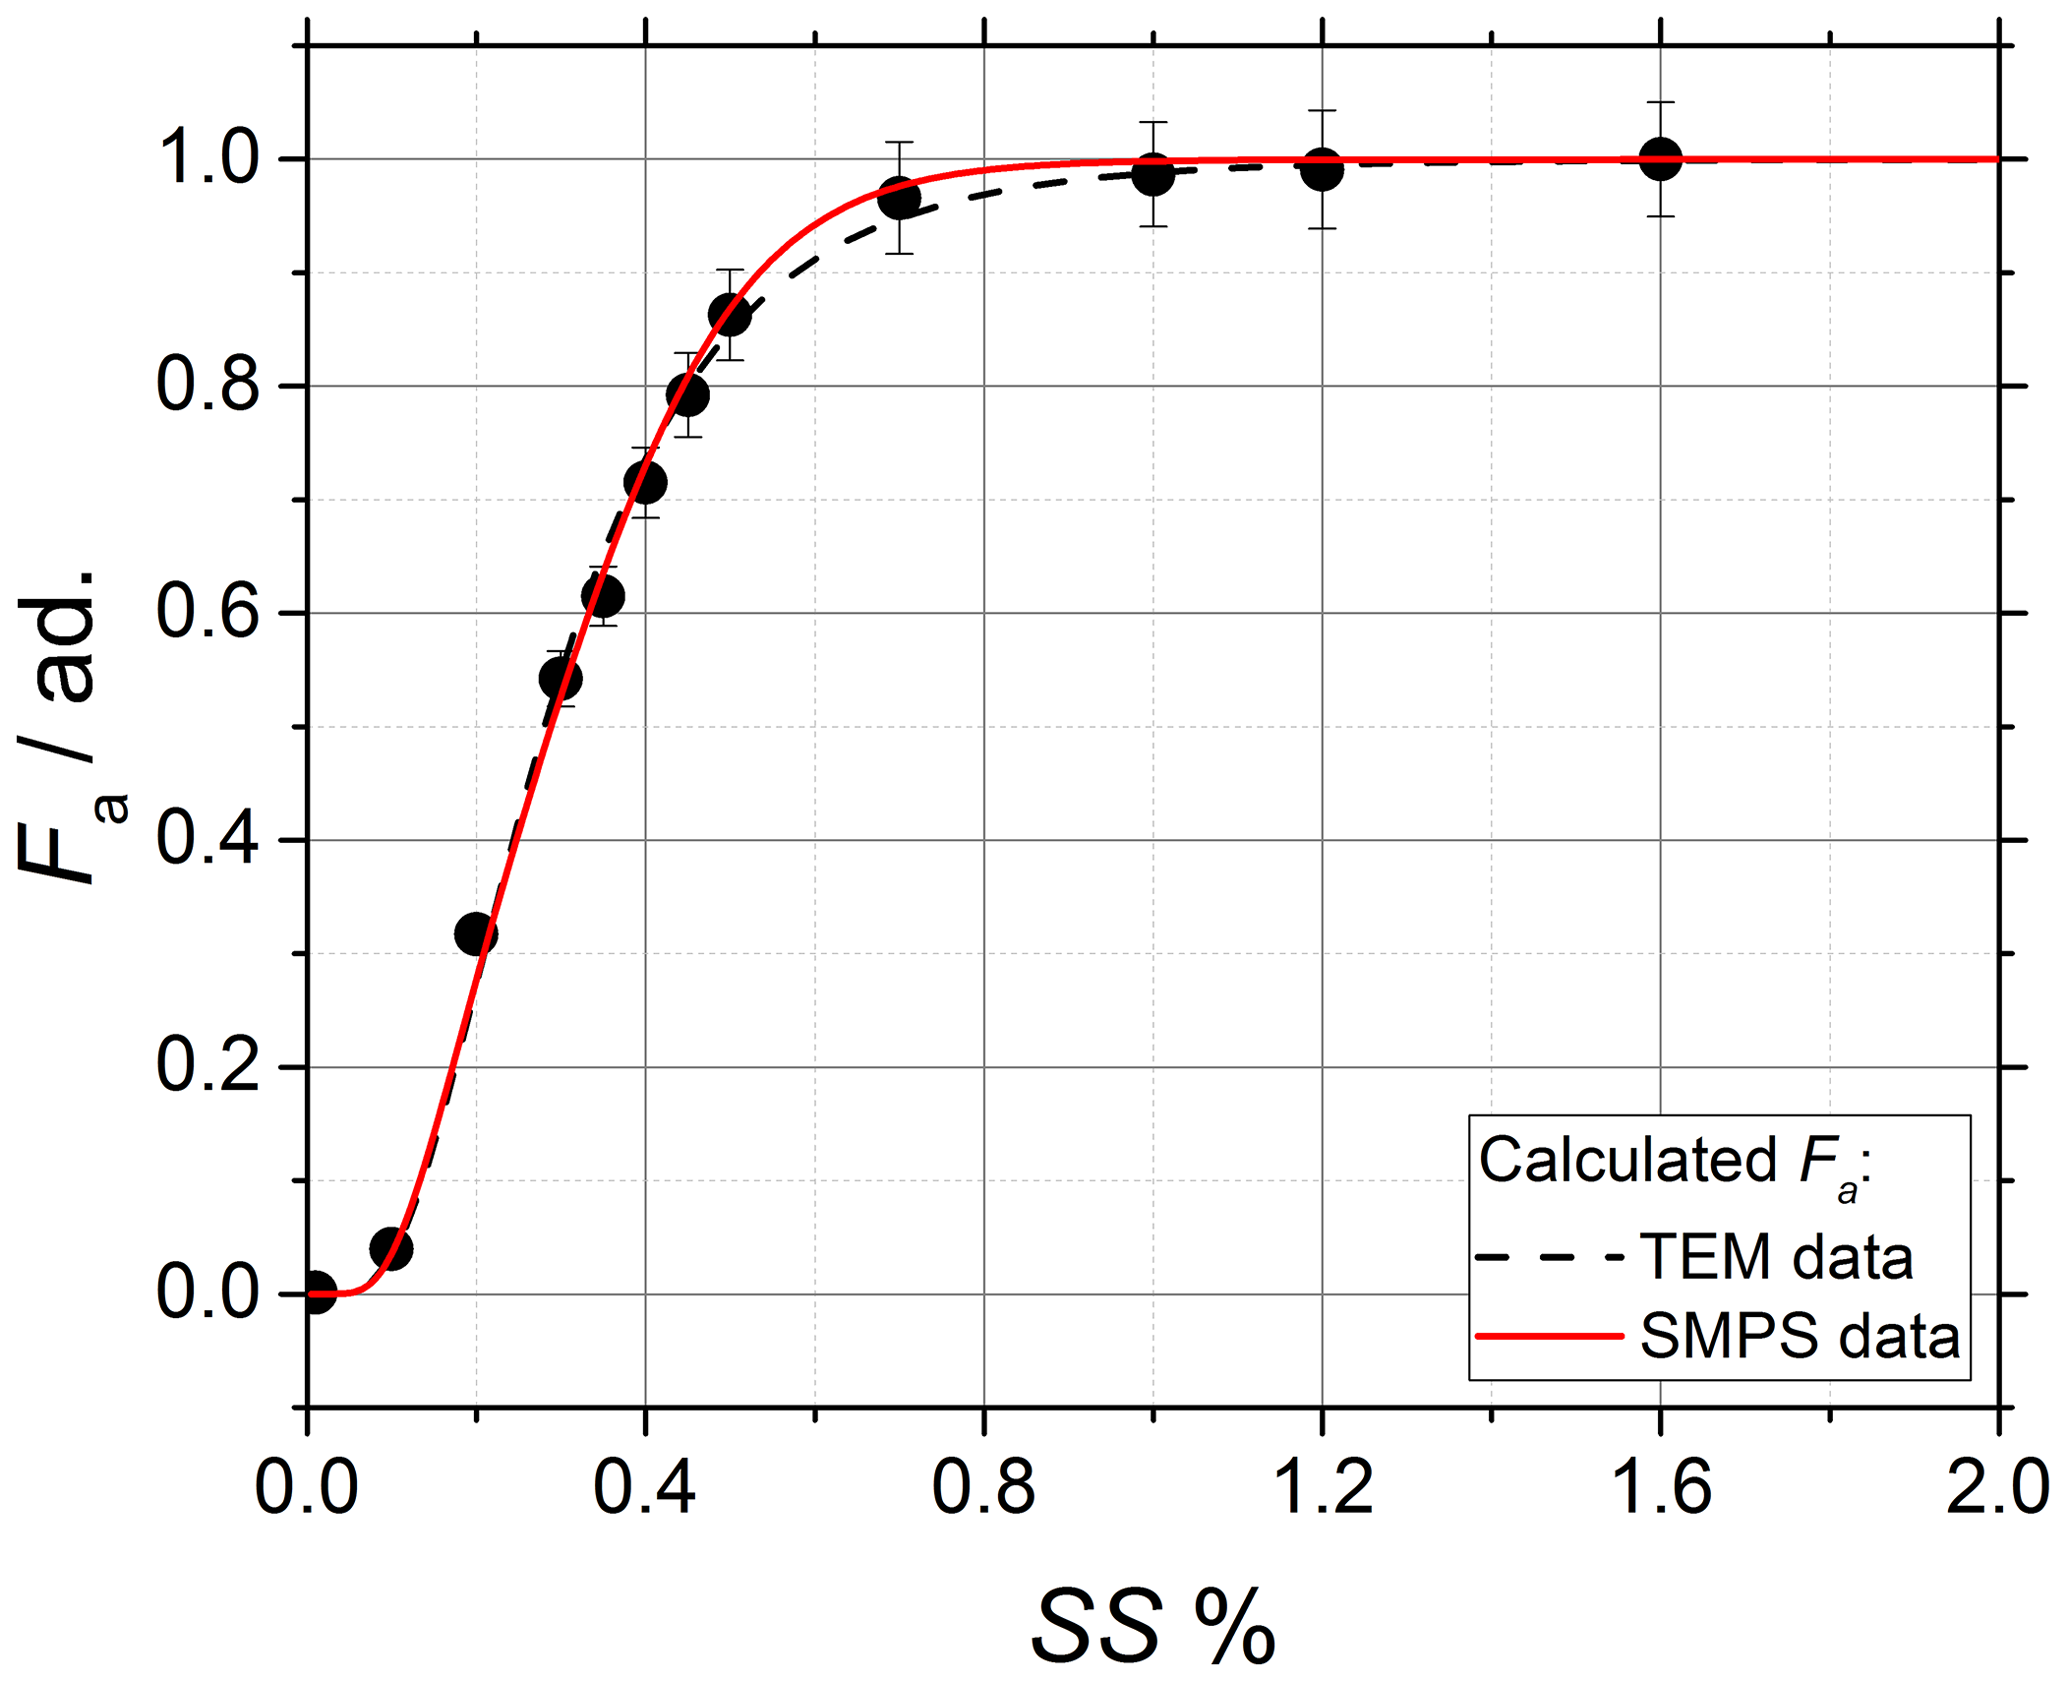
Figure 4Dry ammonium sulfate particles: activation data obtained from CCNc experiments (black dots) and calculated Fa=Fa(SS) using SMPS (solid red line) and TEM (dashed black lines) data as dve.
4.2 Characterization of the soot particles morphology
As mentioned above, dpp and Df of soot aggregates are obtained at the same time from the analysis of TEM images. It is important to notice that Eq. (8) is derived for the mass equivalent diameter and not for the diameter of the projected image (Yon et al., 2015). However, if the soot particles can be considered homogeneous, the mass equivalent diameter and the diameter of the projected image only differ by a scale factor that is easily accounted for.
In this work, dpp is directly obtained by manual counting of the projected images of the soot primary particles.
Df has been obtained in the past by using at least three different experimental techniques: angular light scattering (Sorensen et al., 1992), scanning electron microscopy (Colbeck et al., 1997) and transmission electron microscopy (Köylü and Faeth, 1992; Cai et al., 1995; Hu et al., 2003). In this work, Df is estimated from the images of soot aggregates by measuring the maximum length of the aggregate projection L2D (Cai et al., 1995; Köylü et al., 1995) as follows:
where kg is the coefficient of the maximum length of the aggregate projection, which is treated as a free parameter. As a faster alternative to manual counting, it is possible to estimate Npp from the same set of data used to measure Df with Eq. (13) by also measuring the total surface of the aggregate projection A2D (Köylü et al., 1995) as follows:
where ka and α are the coefficient and exponent of the projection area, respectively, which for soot fractal aggregates can be either calculated (Medalia, 1967) or measured (Samson et al., 1987; Köylü et al., 1995). Df of fresh soot particles measured by following this approach (1.665 at 70 mm HAB and 1.647 at 130 mm HAB) is consistent with typical values found in the literature (Samson et al., 1987; Cai et al., 1995; Köylü et al., 1995; Sorensen and Roberts, 1997; Tian et al., 2006). The analysis of TEM images of soot aggregates before and after exposure to ozone confirms that the fractal dimension does not change significantly during the chemical aging process.
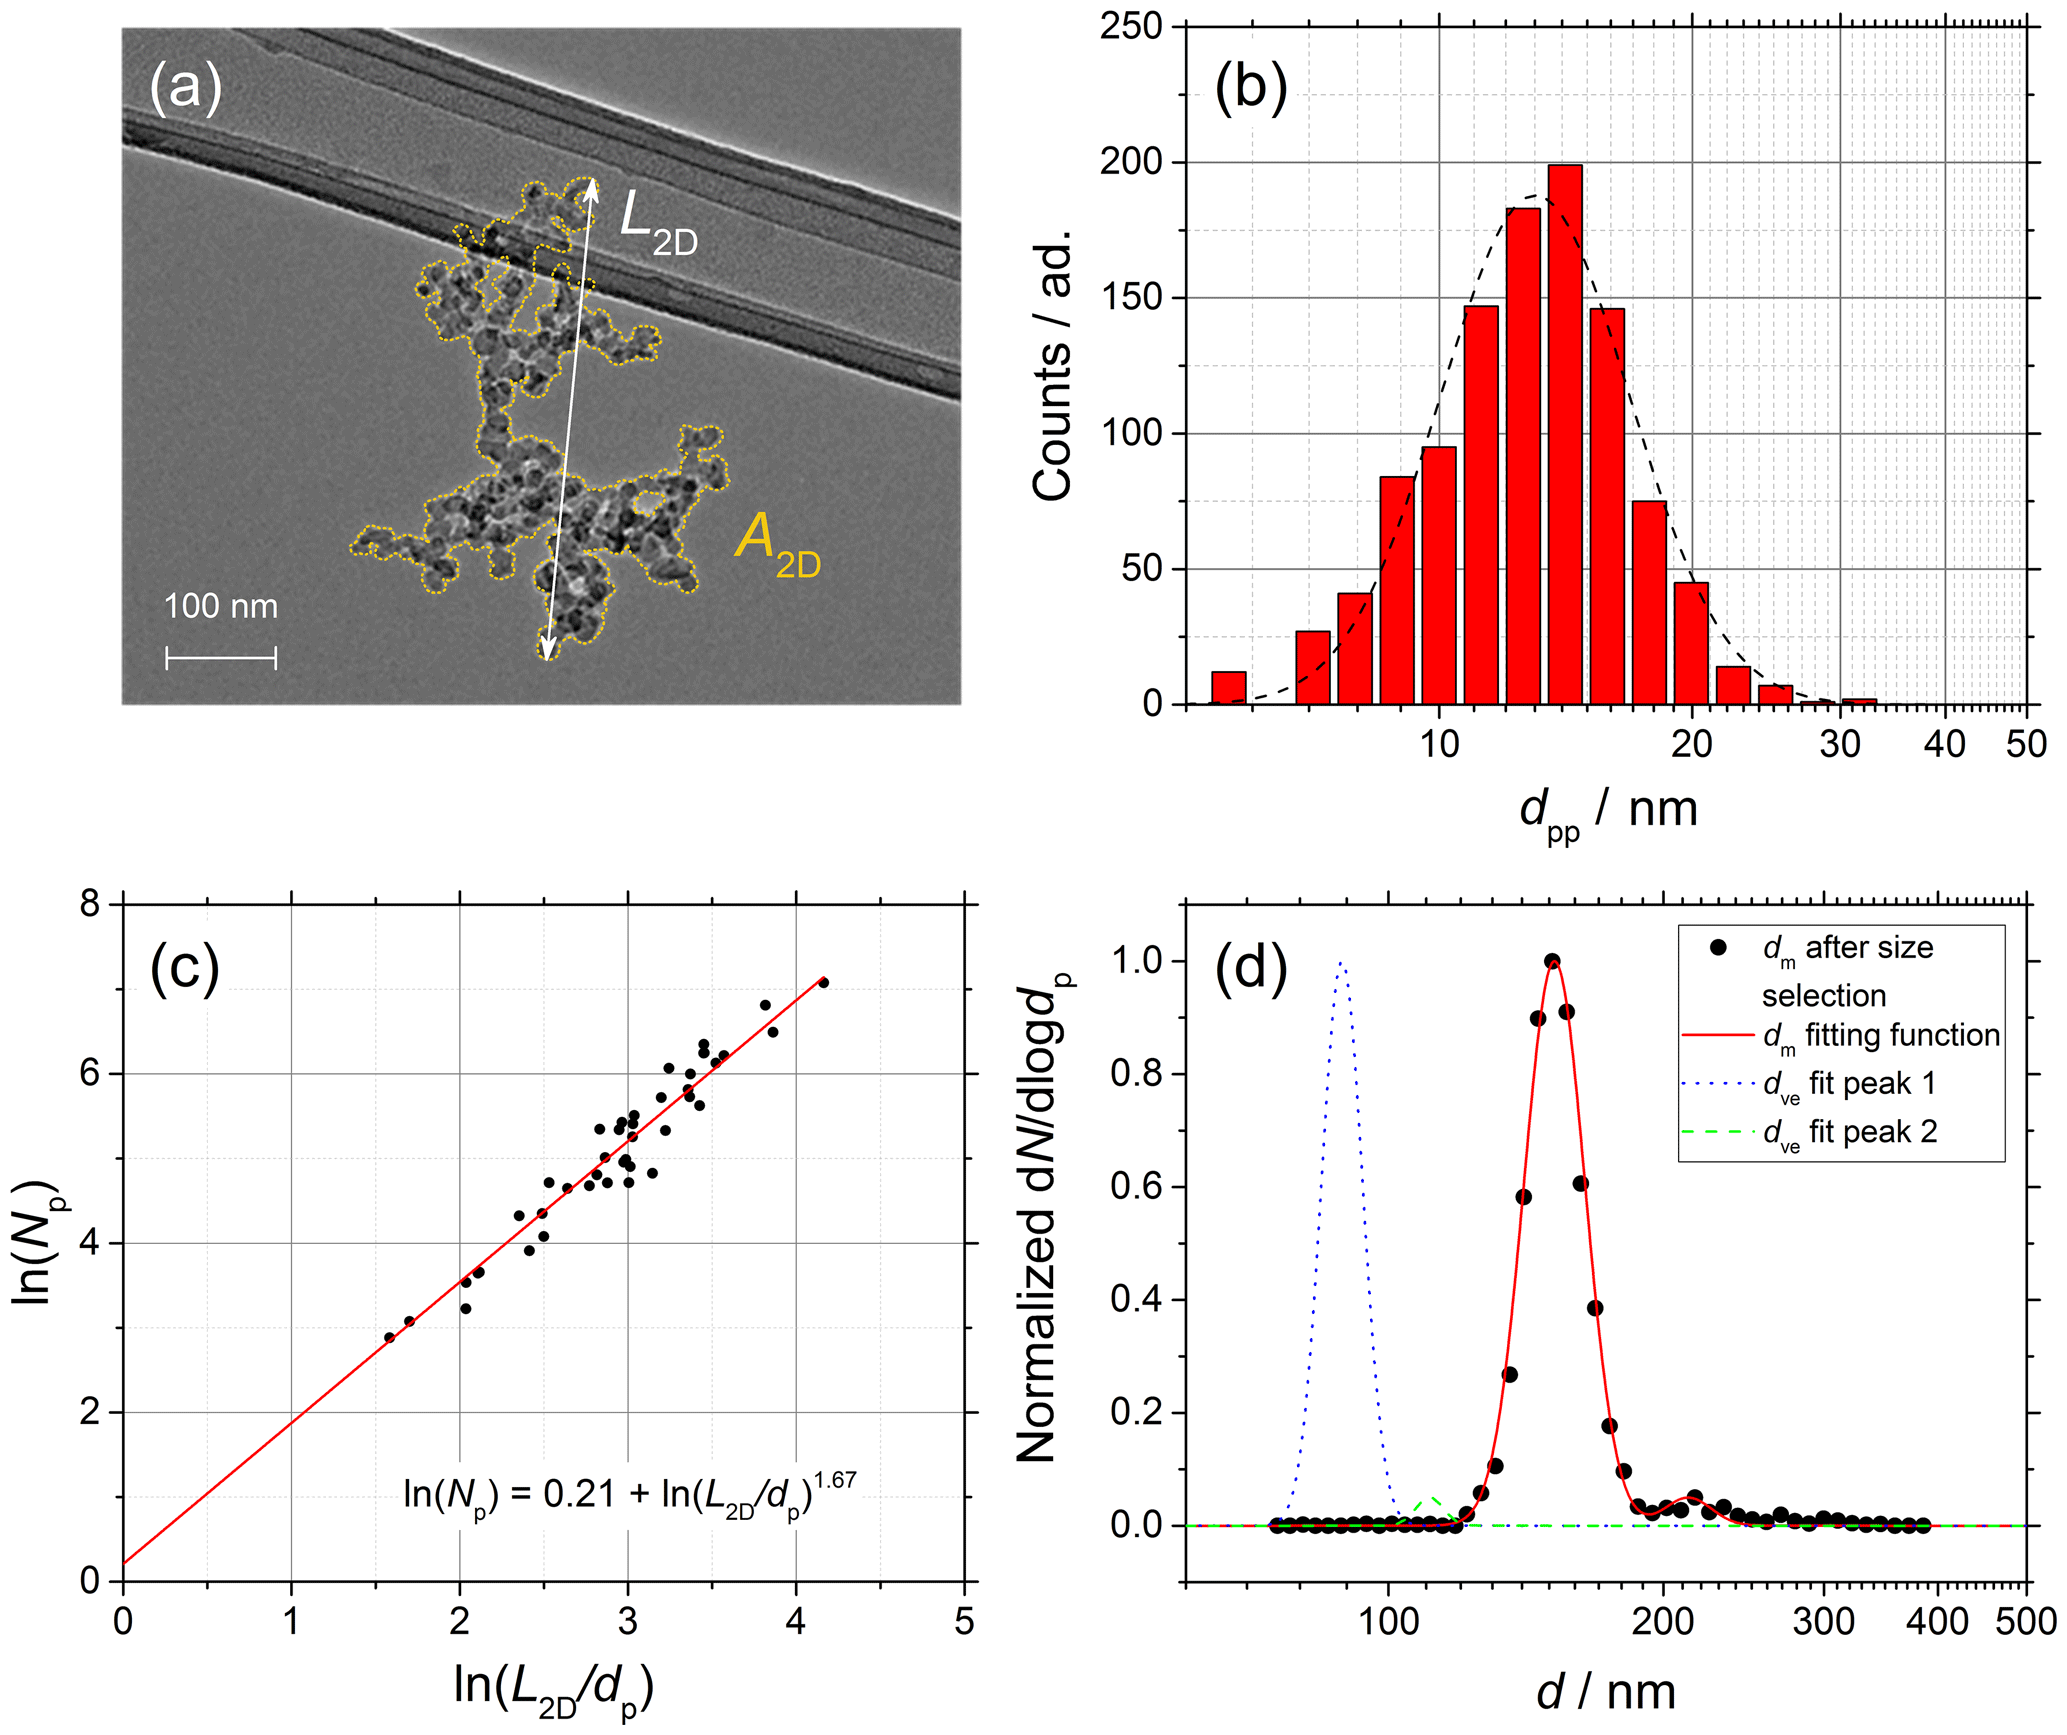
Figure 5Soot sampled from the turbulent jet flame supplied with liquid kerosene at 70 mm HAB. (a) TEM picture of a soot aggregate showing L2D and A2D. (b) dpp size distribution (red bars) and lognormal fit (dashed black line), dpp=13.0 nm (mass equivalent dpp=14.1 nm). (c) ln (Npp) vs. ln (L2D∕dpp) plot from which Df is obtained (42 projections). (d) Normalized SMPS data and dm fit after size selection at 150 nm (black data points and dashed red line) and morphology-corrected dve calculated using Eq. (11) showing a two-mode fit from Eq. (12) (dotted blue and dashed green lines).
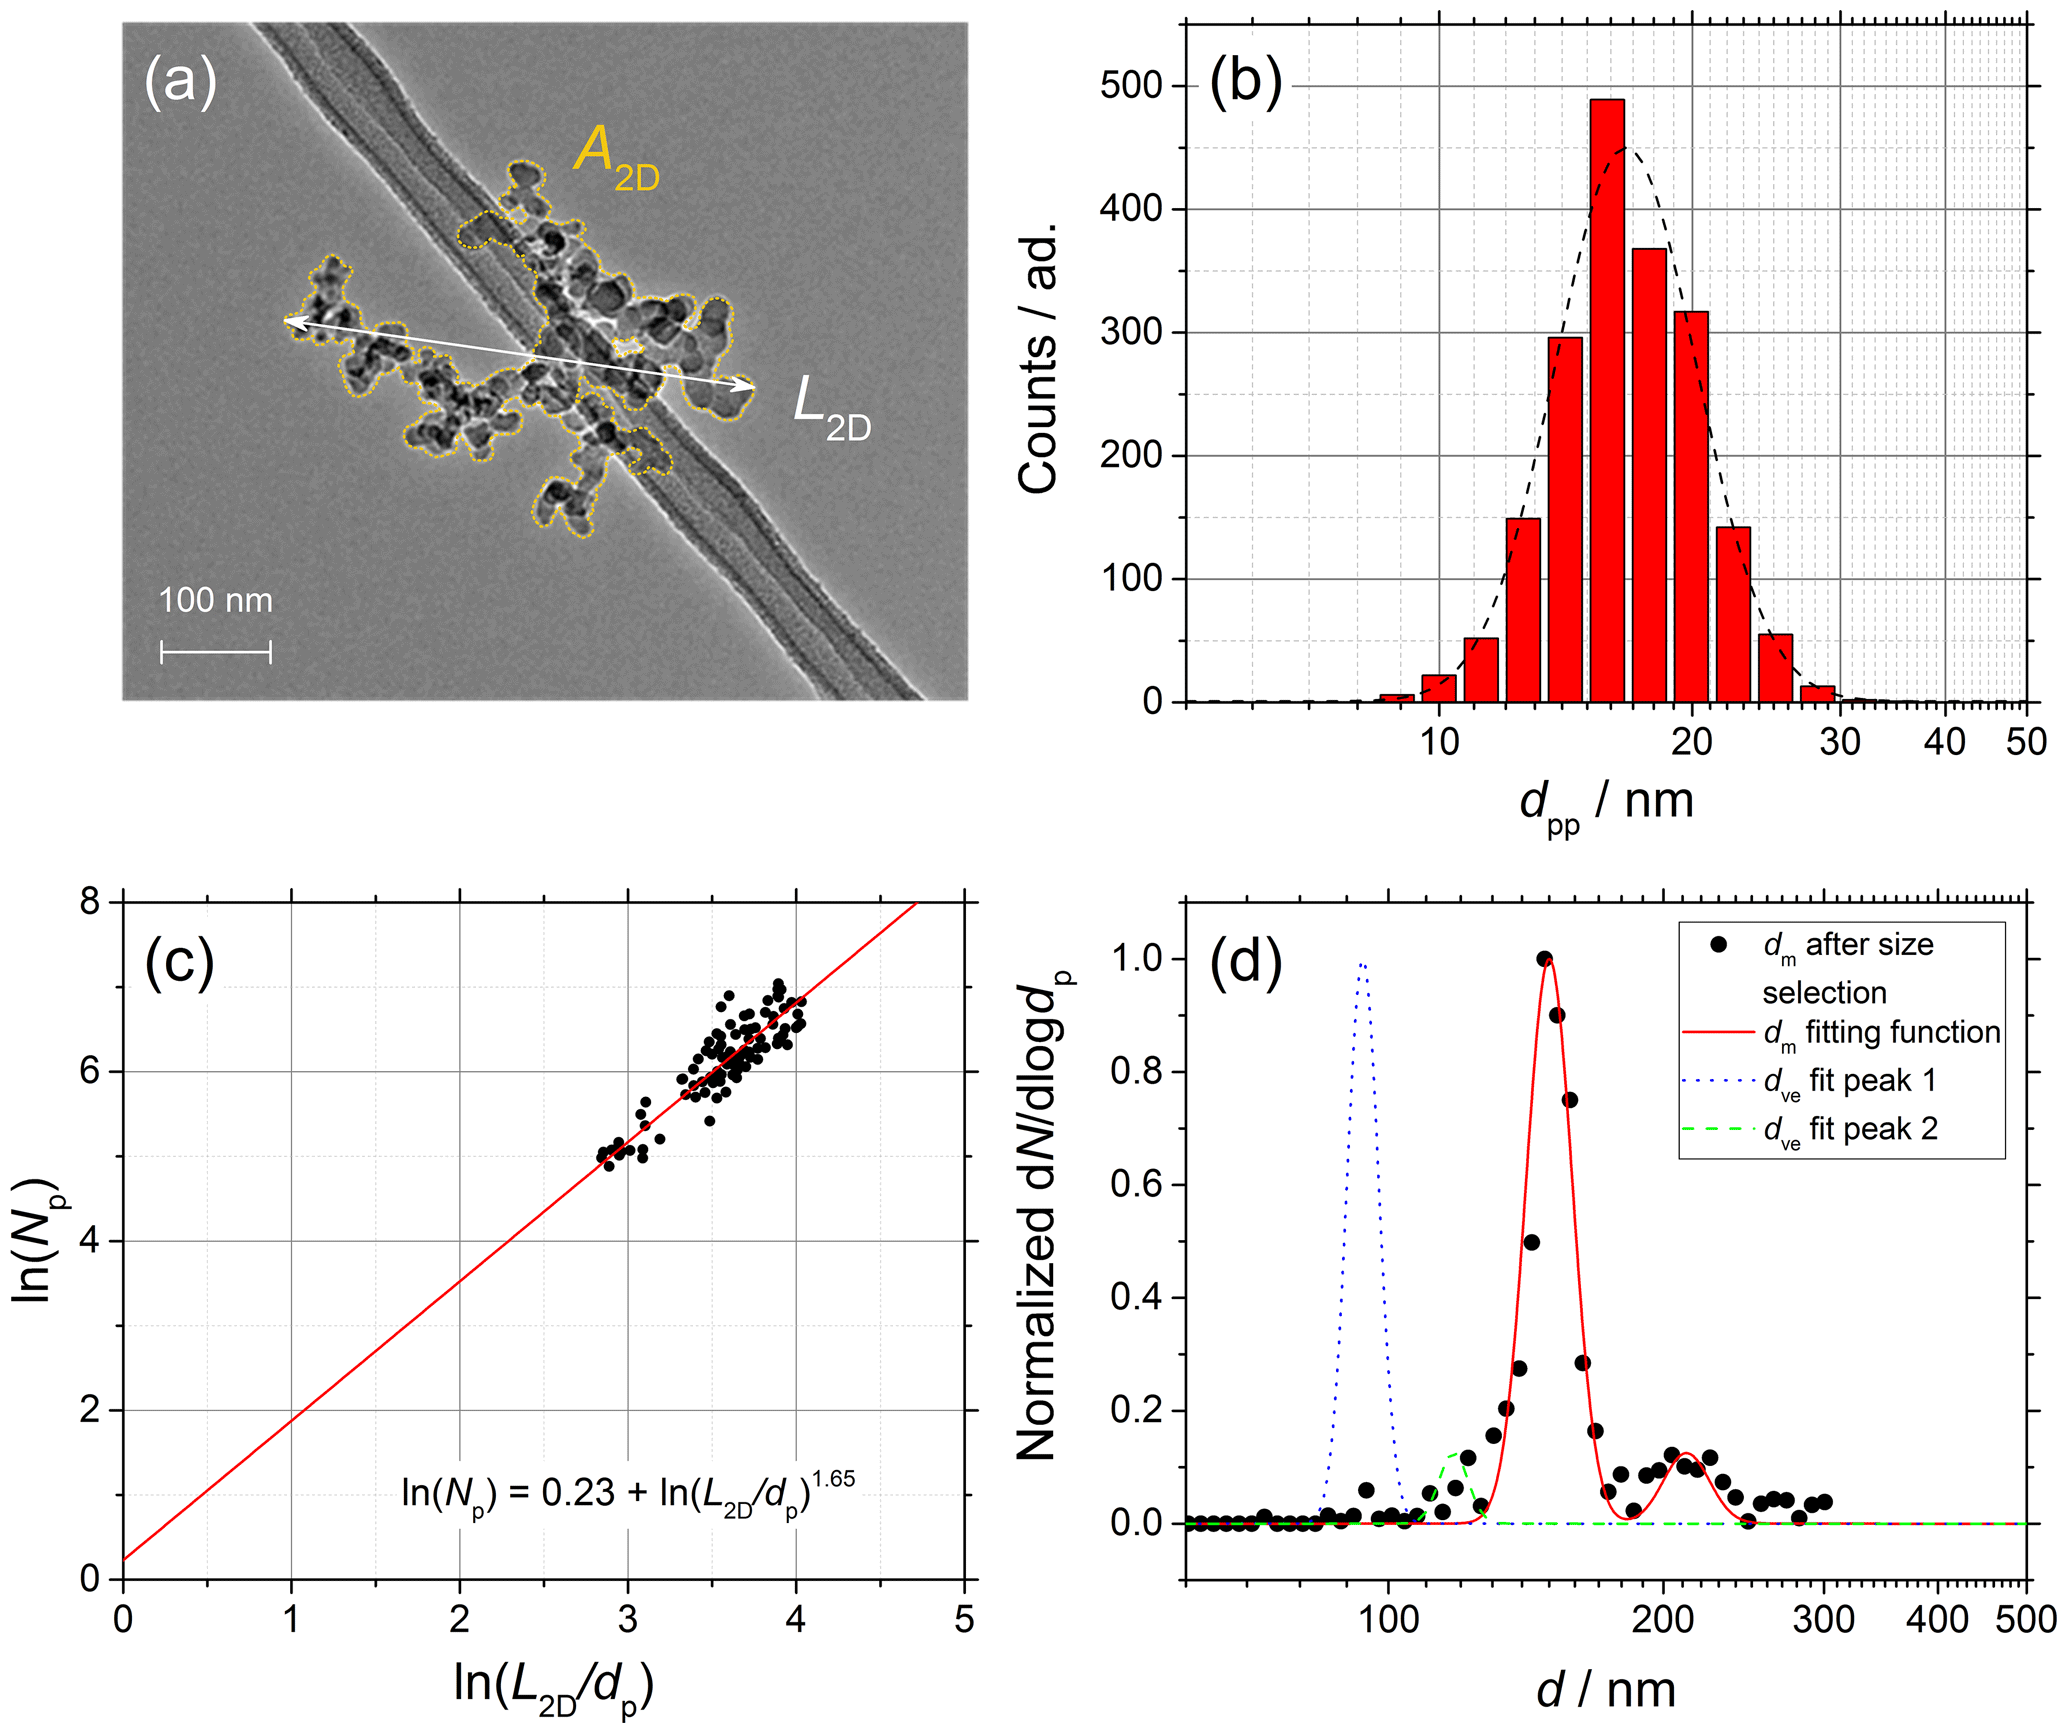
Figure 6Soot sampled from the turbulent jet flame supplied with liquid kerosene at 130 mm HAB. (a) TEM picture of a soot aggregate showing L2D and A2D. (b) dpp size distribution (red bars) and lognormal fit (dashed black line), dpp=16.7 nm (mass equivalent dpp=17.7 nm). (c) ln (Npp) vs. ln (L2D∕dpp) plot from which Df is obtained (100 projections). (d) Normalized SMPS data and dm fit after size selection at 150 nm (black data points and dashed red line) and morphology-corrected dve calculated using Eq. (11) showing a two-mode fit from Eq. (12) (dotted blue and dashed green lines).
The complete characterization of the size and morphology of young soot particles sampled at 70 mm HAB and mature soot particles sampled at 130 mm are shown in Figs. 5 and 6, respectively. The following are shown: (a) TEM pictures of one aggregate, (b) dpp size distributions, (c) ln (Npp) vs. ln (L2D∕dpp) plots from which Df is obtained according to Eq. (13), and (d) SMPS data (black points) and mobility distribution of the soot particles after size selection (dashed black line) and morphology-corrected dve (solid red line) calculated using Eq. (11). dm values measured in SMPS tandem configuration, as well as dve values, are characterized by two well-separated modes that can be accurately fitted using Eq. (12). Although not true in general, in the specific case of soot the two modes can be attributed to particles with +1 (main mode) charge and particles with +2 charge after passing through the first neutralizer that are recharged to +1 after passing through the second neutralizer (smaller mode shifted to the right in the diameter axis, d).
4.3 CCN activity of soot particles
In this section, the data obtained from CCNc activation experiments are used to validate the approach based on the morphology-corrected dve and to determine p(κ). The activation data are reproduced from our past investigation (Grimonprez et al., 2018). Soot is collected from the kerosene jet flame at two HABs to show the different behavior of young and reactive soot (70 mm HAB) and of mature and more inert soot (130 mm HAB) during the chemical aging. The morphology-corrected is considered as representative of both the soot particle size distribution (dm) and morphology (dpp and Df) and used as dp in Eq. (3). p(κ) is obtained from the fitting of Fa=Fa(SS) with Eqs. (3) and (4) with μκ,mode and σκ,geo treated as free parameters.
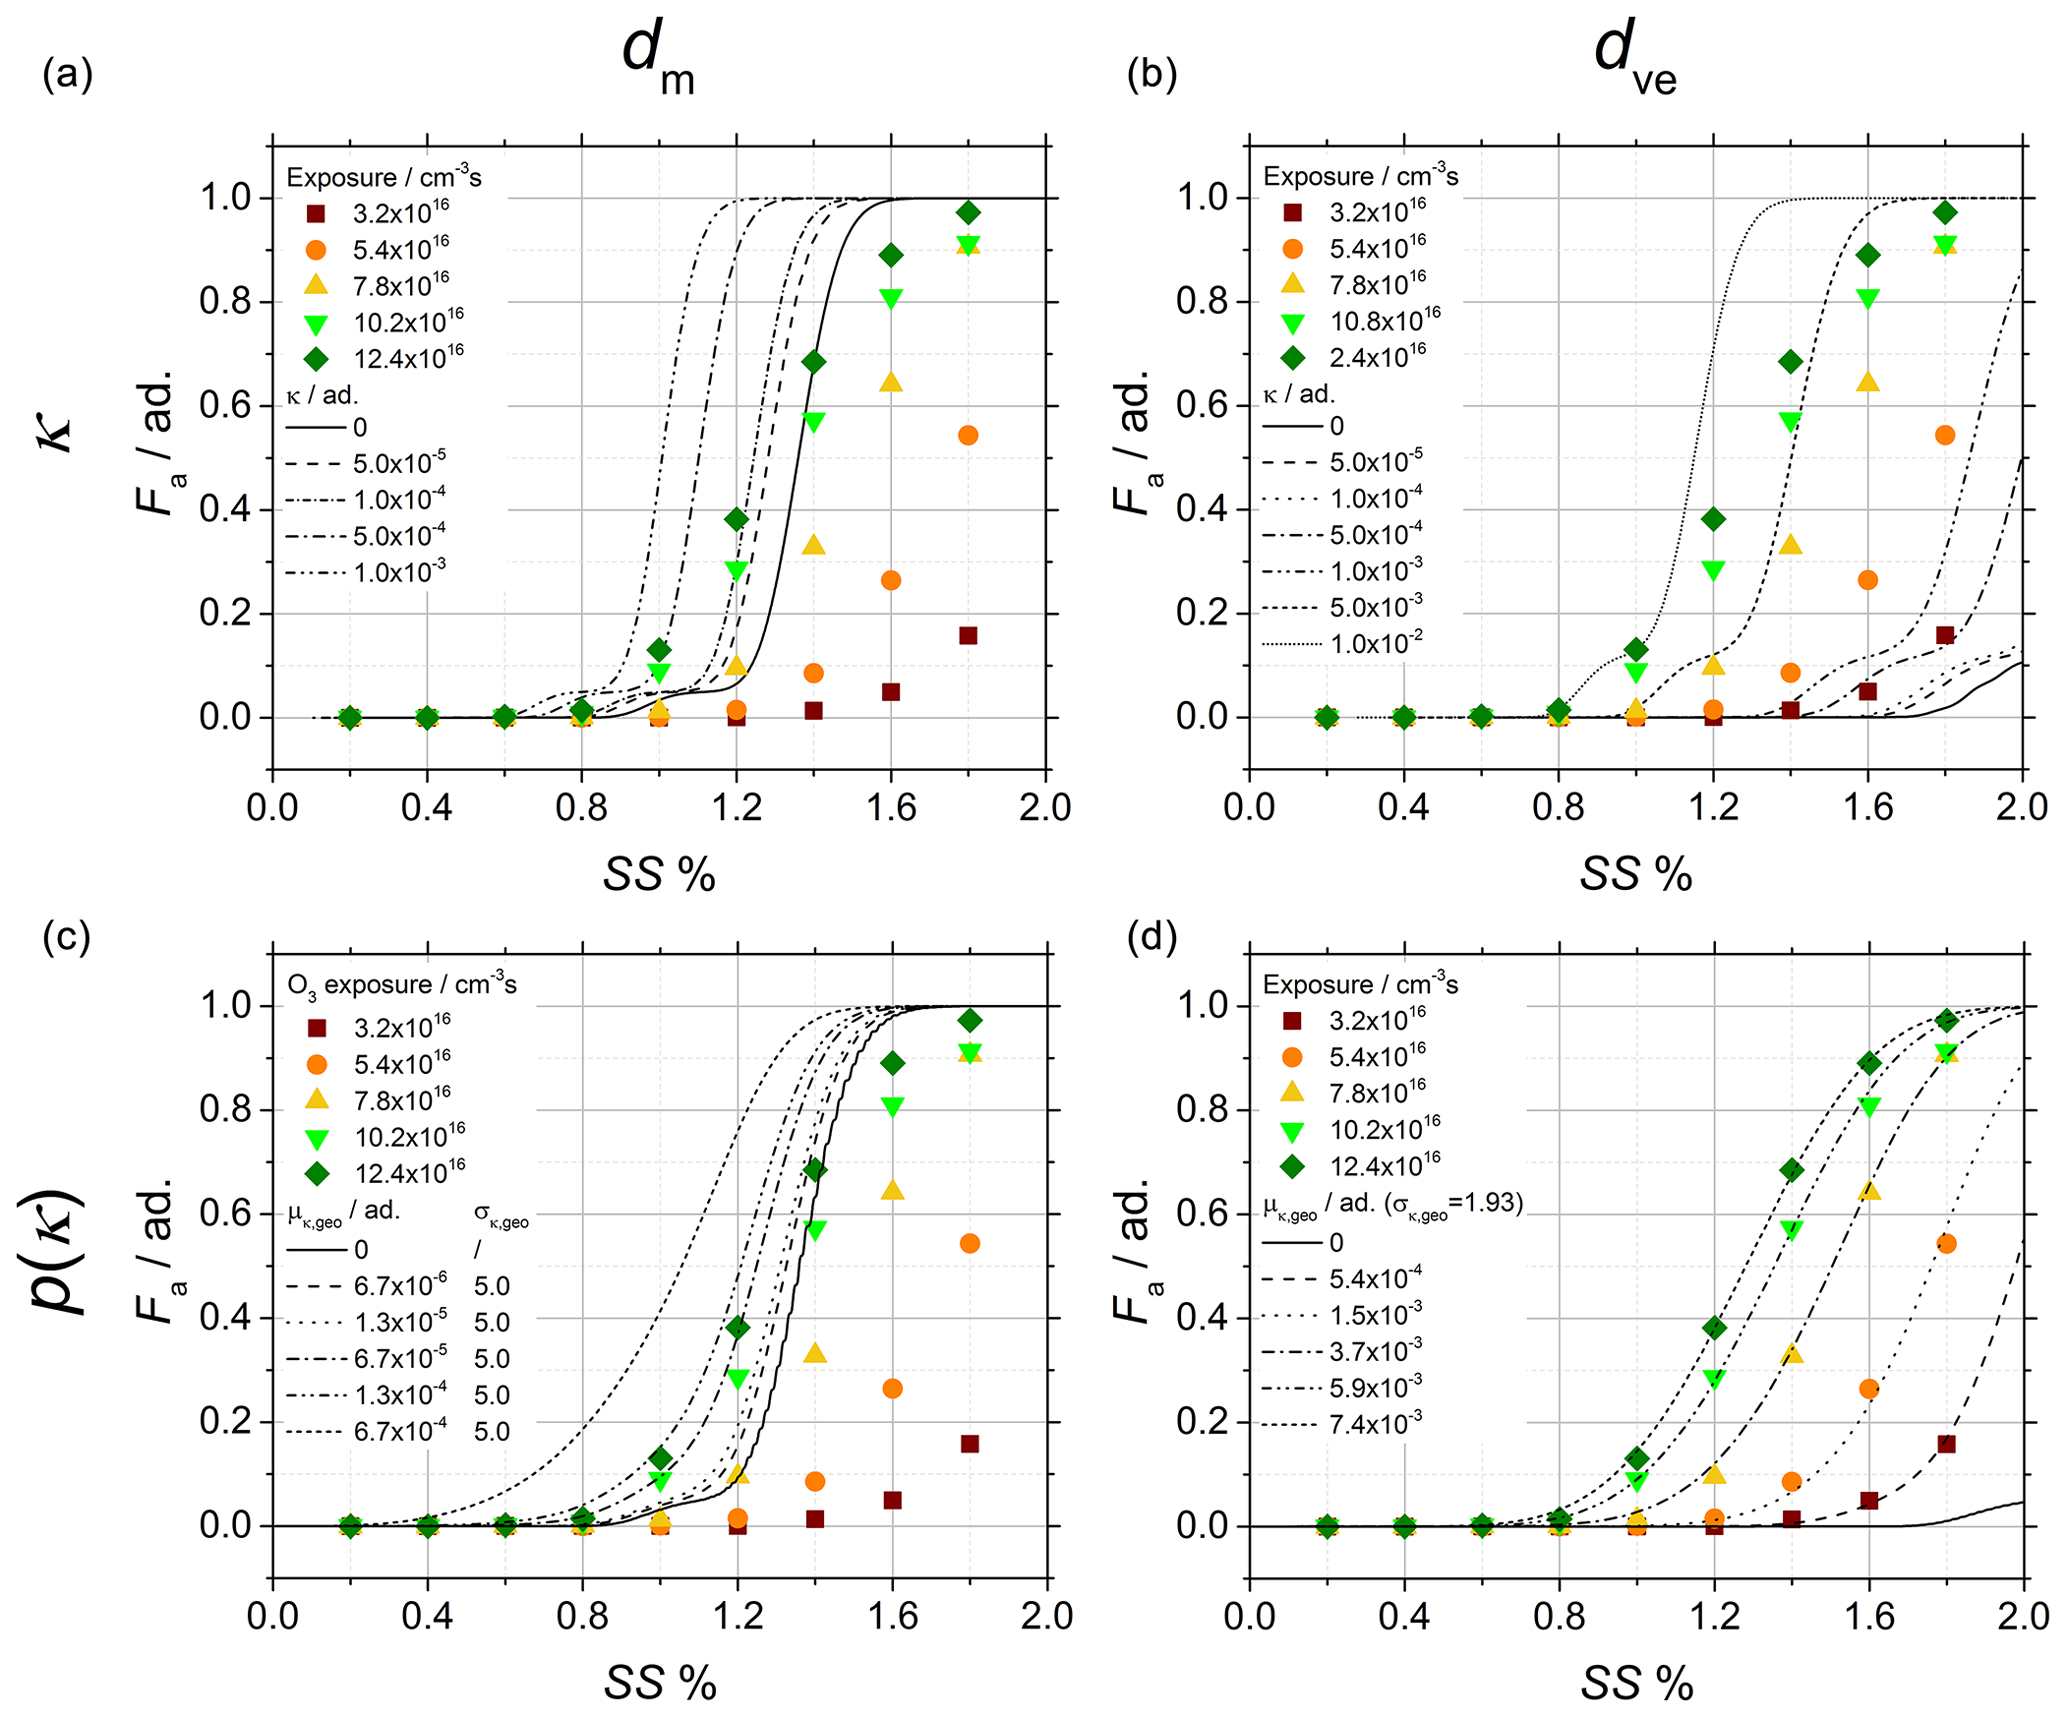
Figure 7Soot sampled from the turbulent jet flame supplied with liquid kerosene at 70 mm HAB. CCNc activation curves of the soot particles obtained after chemical aging with ozone and comparison of the experimental data (data points) to activation curves calculated under four different hypotheses (lines), each of them corresponding to the crossing of one row and one column as follows: (a, b) single κ value, (c, d) p(κ), (a, c) mobility diameter after size selection and (b, d) morphology-corrected dve.
Figure 7 shows the activation data obtained after chemical aging of young soot with ozone and used to quantify p(κ) at different ozone exposure (data points). The activation curves (lines) are calculated in four different scenarios, with each individual plot representing one unique combination of dm or dve with κ or p(κ); to represent the particle size distribution, the mobility diameter after size selection (Fig. 7a, c) or alternatively the morphology-corrected dve (Fig. 7b, d) is used. To represent the particle hygroscopic activity, a single κ value (Fig. 7a, b) or a probability distribution p(κ) (Fig. 7c, d) is used in the fitting function.
As shown in the figure, the calculations based on dm consistently result in a shift in the activation curves to low SS, and as a consequence many activation data are found below the Kelvin limit (κ=0, solid black line). Although using p(κ) instead of κ has a clear effect on the slope of the activation curves as σκ,geo introduces one additional degree of freedom in the fitting function, this effect is not large enough to compensate for the shift. On the other hand, the calculations based on dve result in a significant shift in the Kelvin limit to high SS. The additional degree of freedom of the fitting function obtained by using p(κ) instead of κ further improves the quality of the fitting, and the activation data can now be very convincingly reproduced by the calculated curves. In conclusion, in order to correctly reproduce the activation behavior of soot particles, their fractal-like morphology must be taken into account, and a morphology-corrected dve is a relatively simple and convenient approach. Details on the choice of σκ,geo are given in Appendix A.
The activation data obtained after chemical aging of mature soot at different ozone exposure (data points) are shown in Fig. 8. Unlike the previous case, the activation curves (lines) are directly calculated using the morphology-corrected dve and a probability distribution p(κ). As shown in the figure, the chemical aging with ozone of mature soot particles with exposure below ∼1015 cm−3 s produces particles that are only activated at very high SS, and the plateau of the activation curves is reached outside the dynamic range of the CCNc. Although it is evident that a weak but consistent activation occurs at high SS, this behavior is poorly reproduced by Eq. (3) and cannot be distinguished from the limit case of ideal noninteracting water vapor and soot particles.
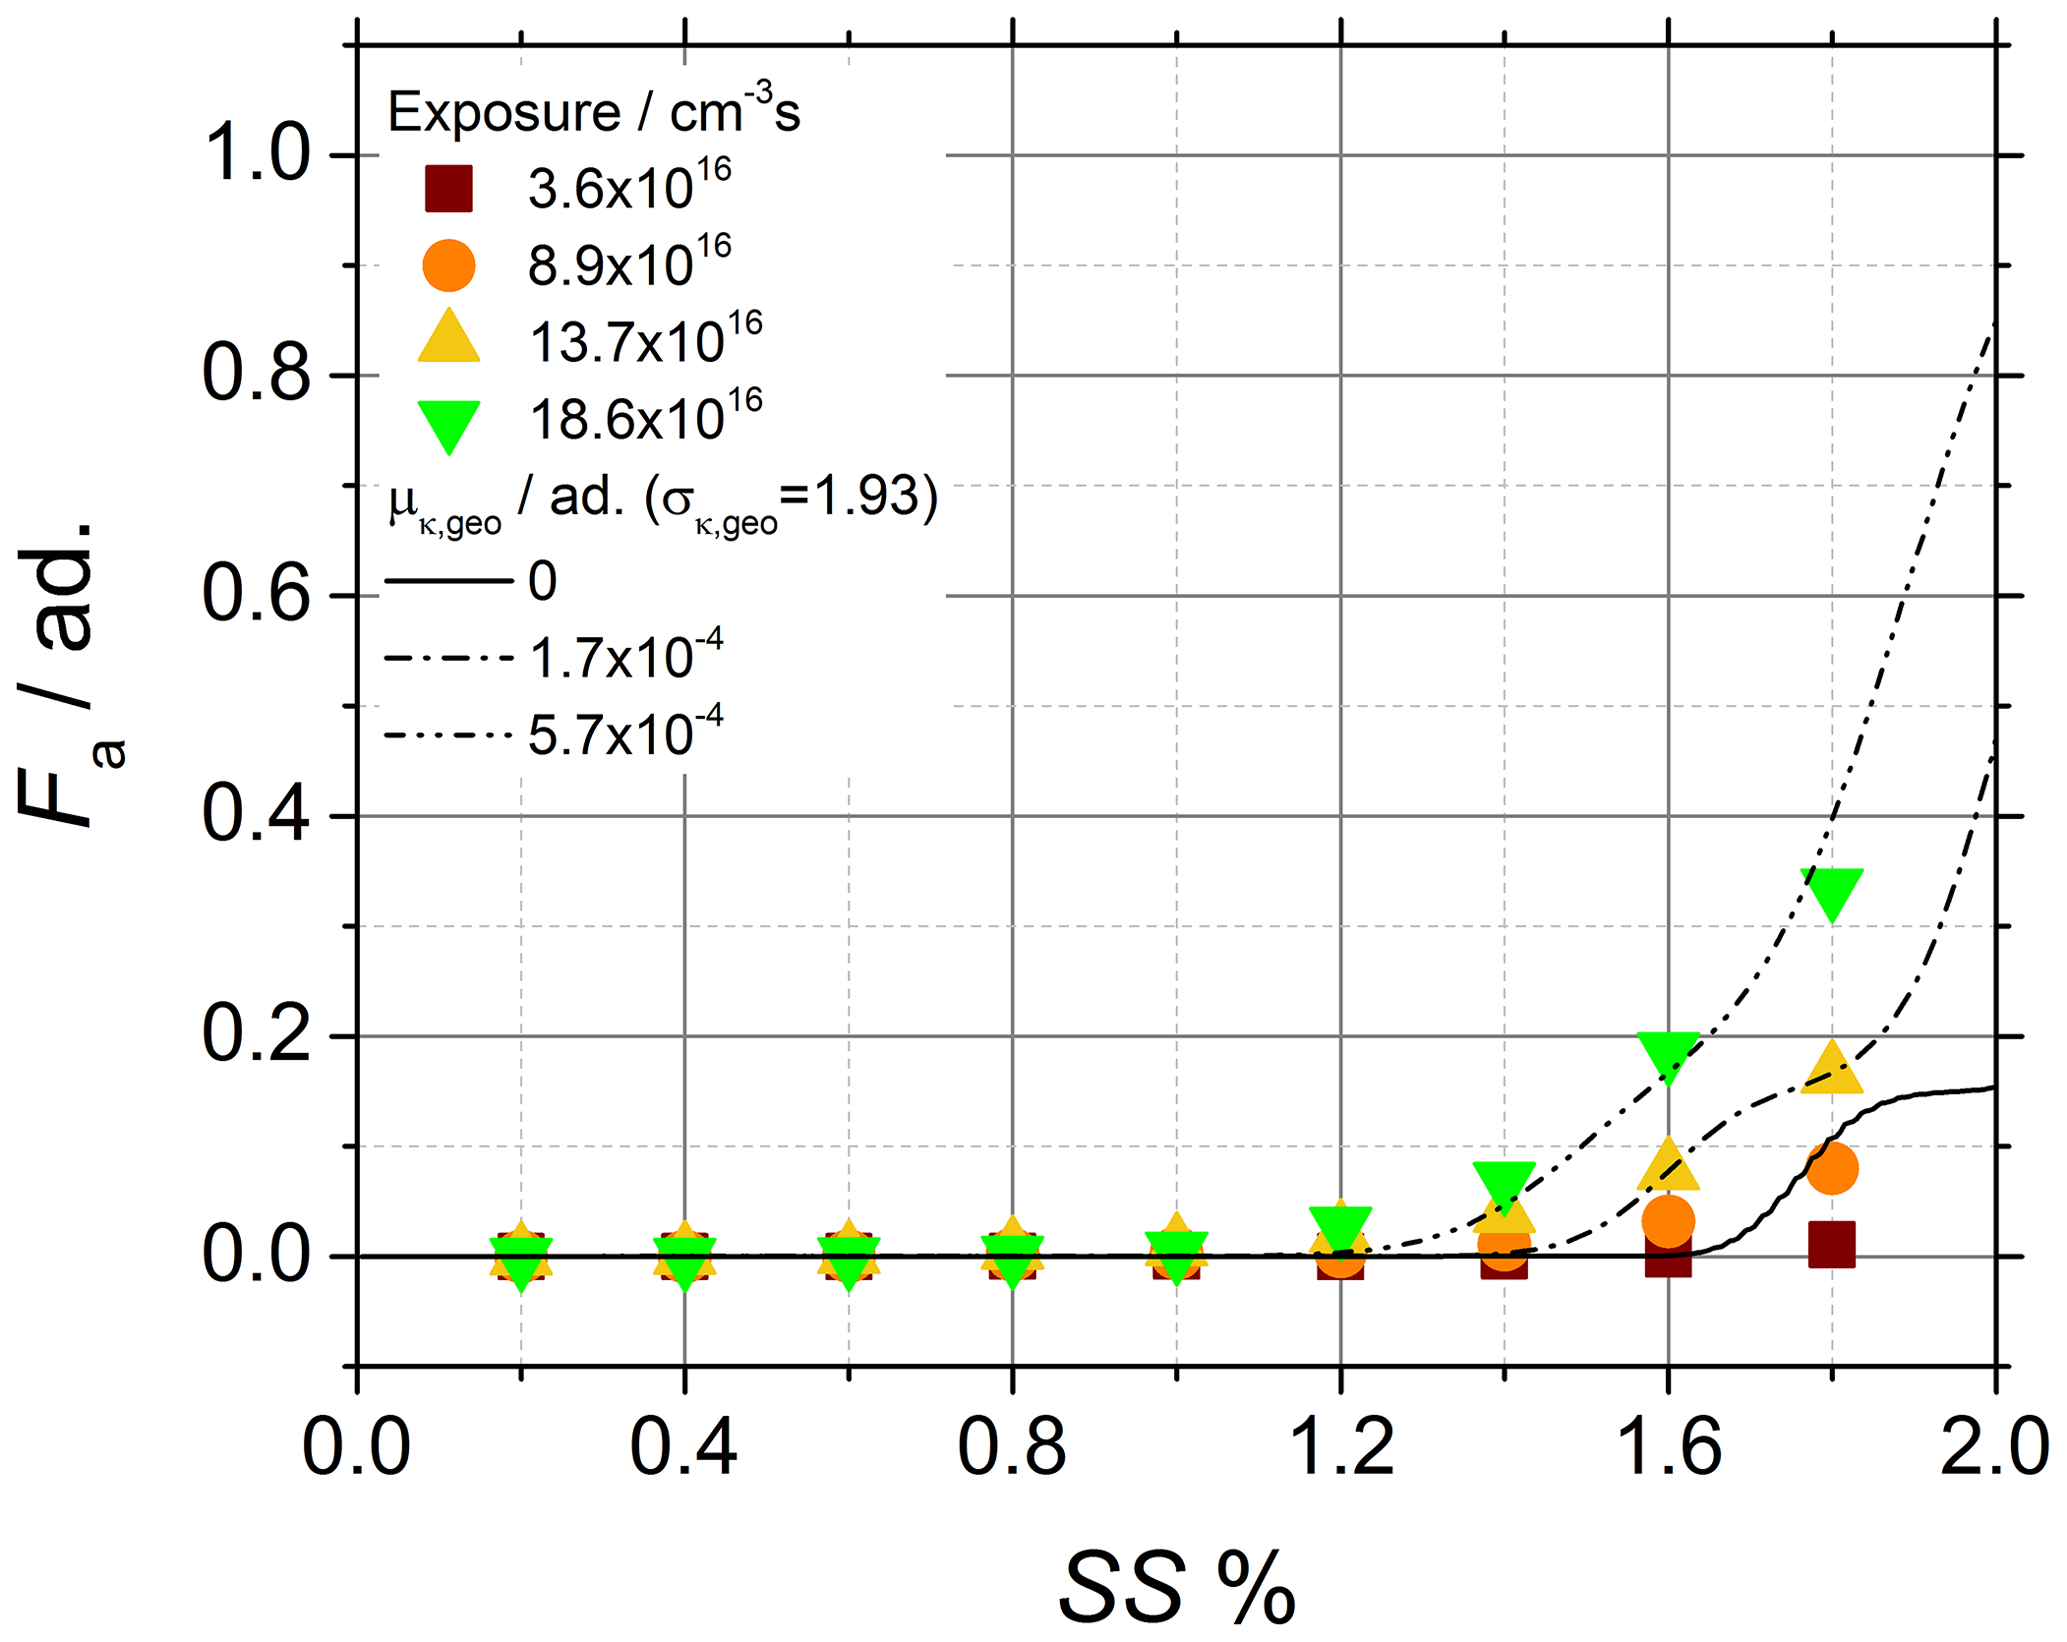
Figure 8Soot sampled from the turbulent jet flame supplied with liquid kerosene at 130 mm HAB. CCNc activation curves of the soot particles obtained after chemical aging with ozone and comparison of the experimental data (data points) to activation curves (lines) calculated by using p(κ) the and morphology-corrected dve.
κ of chemically aged soot particles is typically 2–3 orders of magnitude lower than typical inorganic aerosols used in activation experiments (Petters and Kreidenweis, 2007). Therefore, the activation experiments with chemically aged mature soot are particularly interesting as they offer a unique opportunity to estimate the lower limit of validity of Eq. (3). The activation data shown in Fig. 8 are well reproduced by Eq. (3) only for exposure larger than about 13×1016 cm−3 s and yield κ values in the range of 10−5–10−4, while exposure lower than about 9×1016 cm−3 s results in activation data very close to or below the Kelvin limit. From the comparison of the two situations, it can be estimated that Eq. (3) is only valid for .
Table 2Size and morphology parameters (dpp, Df and dm) used for calculating the morphology-corrected dve of young (70 mm HAB) and mature (130 mm HAB) soot particles. Comparison with the activation data at different ozone exposure; μκ,mode and σκ,geo are calculated from the best fit (the variability range of μκ,mode is provided in brackets).
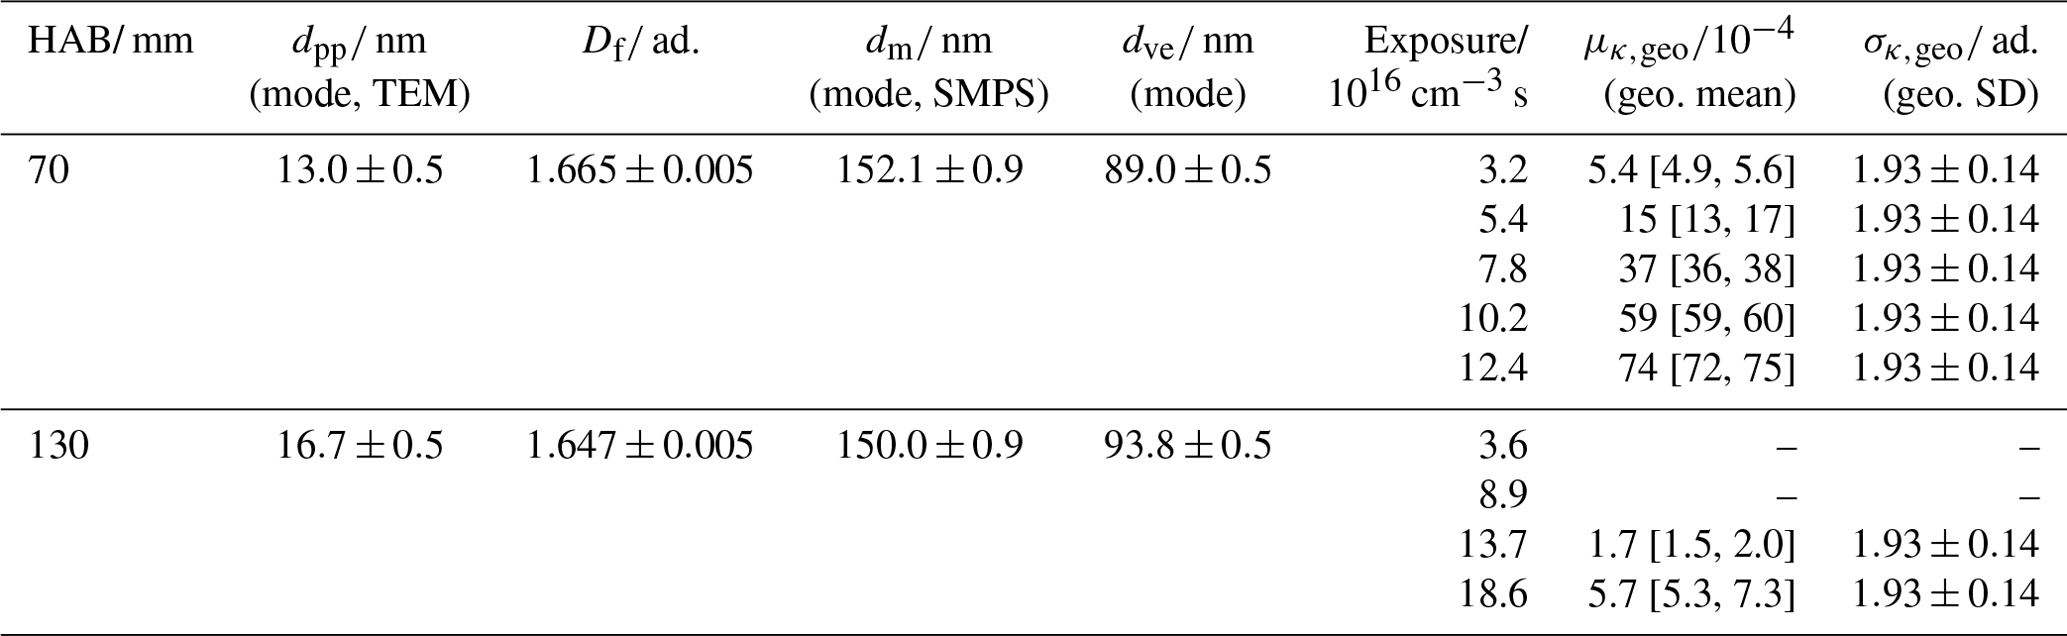
The data on the size distribution and morphology of the tested young and mature soot particles are summarized and compared to the activation data obtained at different ozone exposure in Table 2.
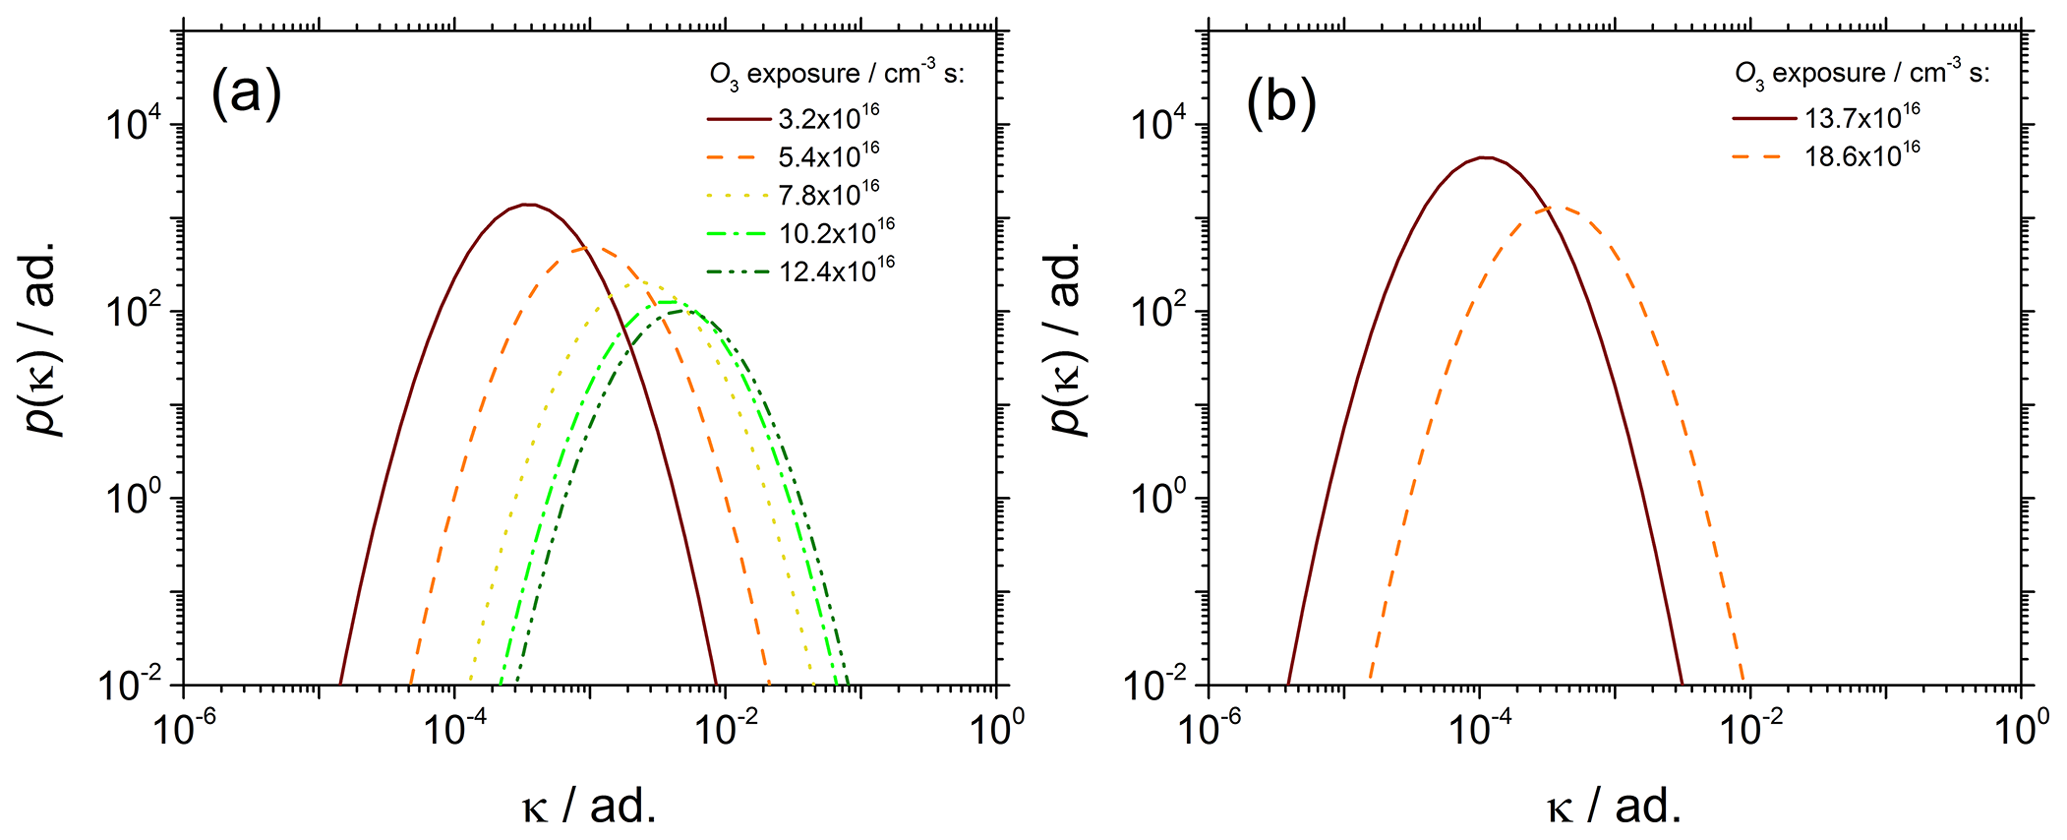
Figure 9Evolution of p(κ) vs. ozone exposure of (a) young soot particles sampled at 70 mm HAB and (b) mature soot particles sampled at 130 mm HAB.
Figure 9 shows the effect of the chemical aging on p(κ). In the literature, κ is often treated as an effective value that folds in all information not explicitly accounted for in the theory, like the change in the water surface tension due to the presence of solutes or the particle morphology for instance. The main advantage of using a morphology-corrected dve is that the effects of the particle size and morphology on activation are decoupled from the particle chemistry, and therefore κ is preserved as a “chemistry-only” indicator.
As shown in Fig. 9a (and b to a lesser extent), as the ozone exposure increases p(κ) shifts to the right (μκ,mode increases). The increasing μκ,mode is strong evidence that the (surface) chemical composition of the soot particles changes significantly with the ozone exposure time. The PAHs adsorbed at the surface of soot particles are likely candidates for explaining the difference in the particle reactivity. Small PAHs typically found adsorbed on the surface of young soot particles have a large H∕C ratio, and therefore large surface concentration of hydrogen atoms available for abstraction reactions. Conversely, large PAHs typically found on mature soot are characterized by a lower H∕C ratio that can explain the overall lower reactivity of mature soot particles. An early discussion based on the analysis of Fa at fixed SS can be found in our previous work (Grimonprez et al., 2018).
The comparison of Fig. 9a and b clearly shows that young and mature soot particles behave very differently to chemical aging and activation experiments. Similar ozone exposure in the range 12–14×1016 cm−3 s result in κ being over 2 orders of magnitude larger at 70 mm HAB () than at 130 mm HAB (). The soot generation process is therefore critically important for aging/activation experiments and must be taken into account to obtain reliable and reproducible data.
As a concluding remark, it is important to remember that κ-Köhler theory is a classical theory entirely founded on equilibrium thermodynamics, and for this very reason it is possibly not adapted to describe nanoscale phenomena. The work presented herein remains a simple extension of κ-Köhler theory that despite not requiring detailed chemical knowledge of the aerosol particles produces rather accurate predictions of the activated fraction of soot particles characterized by complex morphology without adding any ad-hoc hypothesis. A more sophisticated approach is probably required to explain the existence of activation data below the Kelvin limit (adsorption-activation theory for instance). Furthermore, dve is obviously not the only diameter that can be used to parameterize the particle activation but only a very convenient one. Potentially viable alternatives include the aerodynamic or the gyration diameter for instance; however a systematic verification goes beyond the scope of this paper.
Soot particles having fractal-like morphology are well known to become, if certain conditions are met, important cloud condensation nuclei (CCN) in the atmosphere. Experimental data are interpreted not only within the frame of κ-Köhler theory, which allows testing of the methodology with soluble (ammonium sulfate) and insoluble or partially soluble (fresh and chemically aged soot) particles, but also with a comparison of the results with other published studies for which κ data are available. Thereby, it is possible to introduce in the theory all of the parameters needed to describe the size distribution and the complex morphology of soot. In particular, in order to determine the probability distribution p(κ) of the hygroscopic parameter κ of soot particles, a morphology-corrected volume equivalent diameter dve is defined and used to parameterize the particle diameter in κ-Köhler theory. The morphology-corrected dve is calculated from the particle electrical mobility dm and folds in two important descriptors of the particle morphology that are the primary particle diameter dpp and the fractal dimension Df. In practice, dm is measured by scanning mobility particle sizing, while dpp and Df are obtained from the analysis of the projections of soot particles from transmission electron microscopy images.
This simple model, first tested with isolated, quasi-spherical ammonium sulfate particles, reproduces well the activation experiments and provides κ in excellent agreement with the literature. Then, the model is used to determine p(κ) of soot particles sampled at different reaction time, equivalently at a different height above the burner (HAB), from a laboratory jet flame supplied with kerosene. To increase their hygroscopic activity, soot particles are chemically aged with ozone beforehand. The experimental activation data are compared to the activation curves calculated using all combinations of dm or dve with κ or p(κ). The best fitting of the activation data is obtained by using p(κ) along with the morphology-corrected dve. This important conclusion proves that particle morphology plays a non-negligible role in the activation of soot particles and has to be taken into account. Furthermore, using the morphology-corrected dve effectively decouples the effect of the particle morphology on the activation, potentially preserving p(κ) as an indicator of the particle chemistry only.
Young soot particles sampled at 70 mm HAB are more reactive than mature soot particles sampled at 130 mm HAB, resulting in their activation data being shifted by a significant amount to lower SS. The predictive capability of the model is very satisfying in the case of young soot particles that are efficiently converted into CCN after exposure to ozone (κ∼3.7–). At similar ozone exposure, mature soot particles show a much slower reactivity with ozone (κ∼0.5–), which results in the plateau of the activation curves being reached outside the dynamic range of the CCN counter. This approach proved to be viable for .
To better take into account the chemical contribution to the process of activation, the next step would be using a more sophisticated approach like the adsorption activation theory to describe the first steps of water uptake by fresh and chemically aged soot as a function of relative humidity.
In addition to the geometric mean μκ,geo of the p(κ) distribution, the geometric standard deviation σκ,geo of the p(κ) distribution is also an important parameter that influences the activation curve Fa=Fa(SS). However, calculations based on Eqs. (3) and (4) are not always sufficiently sensible to account for small changes in μκ,geo and σκ,geo simultaneously. For instance, Fig. A1a compares the experimental (black dots) and two calculated activation curves (lines) of ammonium sulfate monodisperse spherical particles. In the figure, two extreme cases have been chosen for the sake of clarity; (dashed black line) simulates almost chemically pure aerosol particles, while (solid red line) simulates a large variability in the aerosol particles chemical composition; as clearly shown in the figure, the use of a very different σκ,geo in the calculations leads to a very similar Fa=Fa(SS), as small differences in μκ,geo, which can be easily mistaken for an experimental uncertainly, are able to compensate for a large variability in σκ,geo.

Figure A1Sensitivity analysis performed on ammonium sulfate particles. (a) Comparison of Fa=Fa(SS) calculated from the same aerosol size distribution with (dashed black line) or alternatively (solid red line). (b) LSF = LSF(σκ,geo).
A sensitivity analysis is performed using the least square function (LSF):
where xi values represent the experimental values of the activated fraction obtained from CCN experiments, and yi values represent the calculated values of the activated fraction with fixed μκ,geo and free σκ,geo. As shown in Fig. A1b, especially if Eqs. (3) and (4) are used to fit experimental data, care has to be taken in the choice of the minimum, as the low variability in the LSF in the range and the shallow local minimum around can easily lead to the wrong μκ,geo.
Of course, a variability in the chemical composition of the aerosol particles becomes quite complex to treat since , and furthermore it is not known a priori. In this work, additional calculations have been performed on chemically aged soot. As shown in Fig. A2, the results show that it is not possible to reliably calculate or fit Fa=Fa(SS) by imposing , i.e., by assuming a homogeneous chemical composition of the aerosol particles. Therefore, the hypothesis of , while it holds well for ammonium sulfate, cannot be used for chemically aged soot particles. The stronger impact of μκ,geo and σκ,geo on the calculation of Fa=Fa(SS) on soot when compared to ammonium sulfate indicates that the fitting process has a physical meaning for chemically aged soot, contrary to that for to its application to pure ammonium sulfate particles. Therefore, for the determination of σκ,geo, the average value obtained from the fit of the three curves at high ozone exposure (dark green, light green and yellow in Fig. A2) is used, which leads to . This choice is justified since the three curves clearly reach the plateau at Fa=1 and hence result in more reliable fits than the two curves at lower exposure.
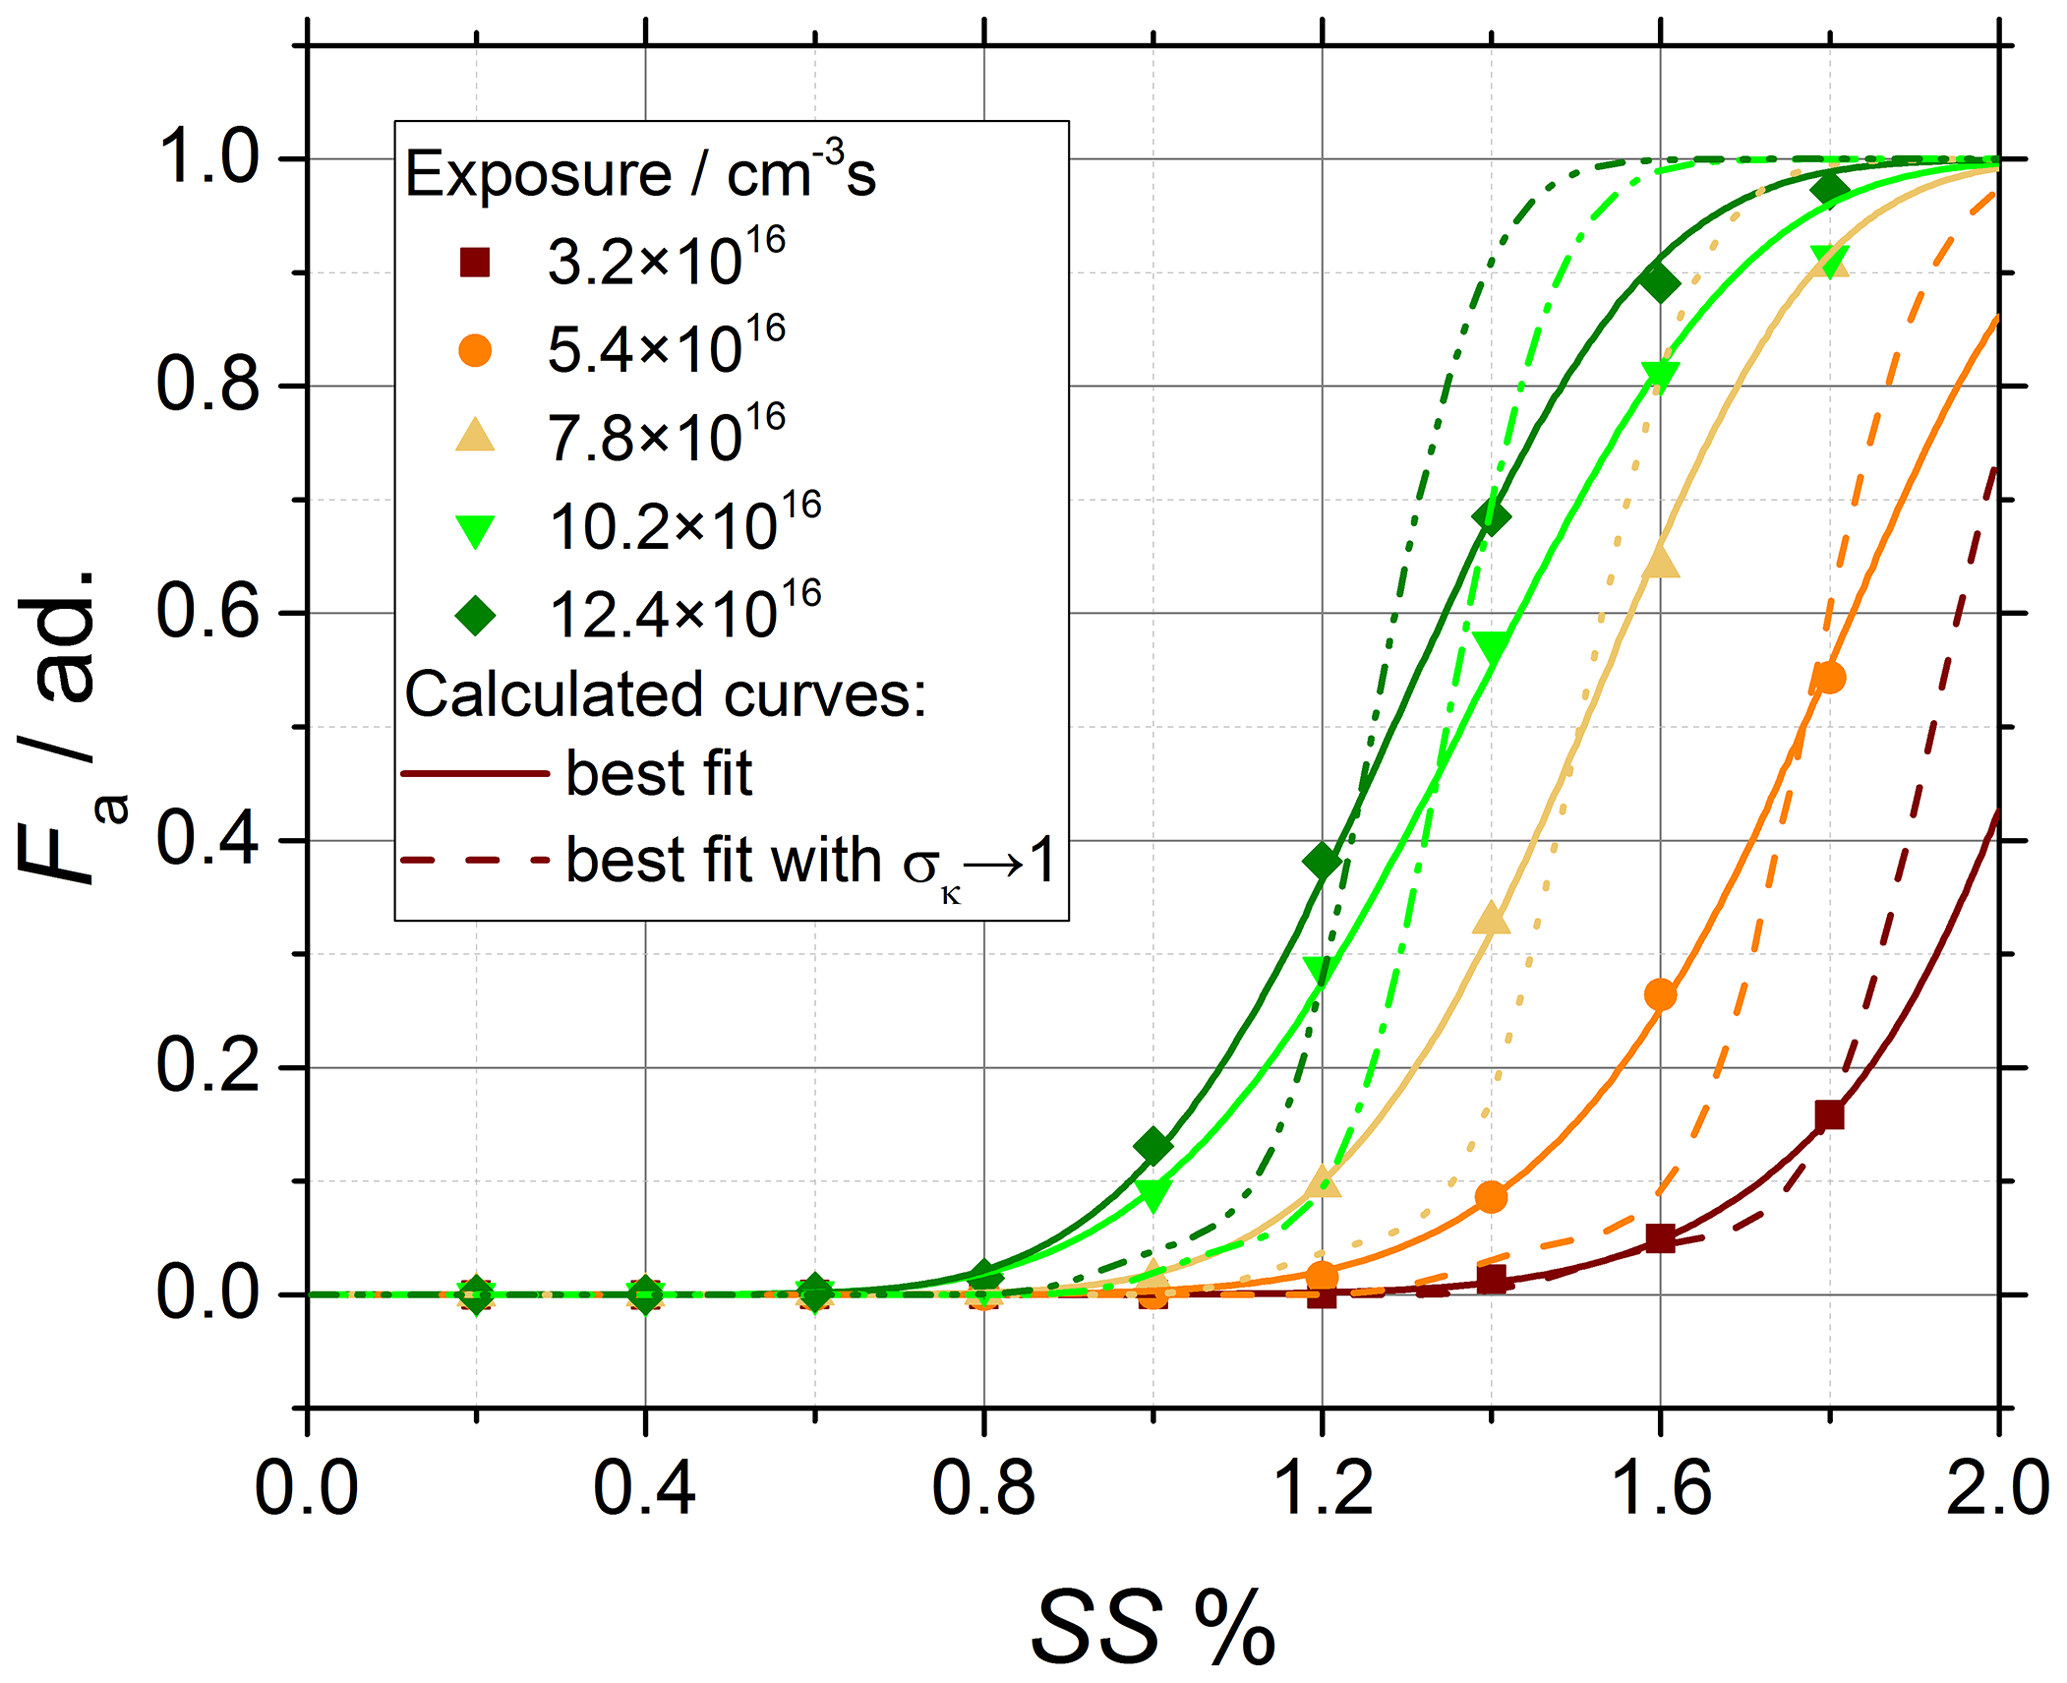
Figure A2Sensitivity analysis performed on chemically aged soot particles sampled from the turbulent jet flame supplied with liquid kerosene at 70 mm HAB. CCNc activation curves of the soot particles obtained after chemical aging with ozone and comparison of the experimental data (data points) to activation curves calculated with (dashed lines) and best fit with (solid lines).
All data used in this study are available at https://doi.org/10.4121/uuid:c2f66d57-0e15-43e0-beeb-3120663b7010 (Faccinetto and Wu, 2019).
JW provided the initial version of the model. JW, SG and SB carried out the research and performed the data analysis. JW, AF, JY, PD and DP improved and refined the model. JW and AF wrote the paper with contributions from all authors. All authors have given approval to the final version of the paper.
The authors declare that they have no conflict of interest.
This research has been supported by the Agence Nationale de la Recherche (ANR) (LABEX CAPPA (grant no. ANR-11-LABX-0005)), the European Regional Development Fund (ERDF) (grant no. CPER CLIMIBIO) and the Direction Générale de l'Aviation Civile (DGAC) (MERMOSE).
This paper was edited by Ari Laaksonen and reviewed by two anonymous referees.
Abdul-Razzak, H. and Ghan, S. J.: A parameterization of aerosol activation: 2. Multiple aerosol types, J. Geophys. Res.-Atmos., 105, 6837–6844, https://doi.org/10.1029/1999JD901161, 2000.
Allen, M. D. and Raabe, O. G.: Slip Correction Measurements of Spherical Solid Aerosol Particles in an Improved Millikan Apparatus, Aerosol Sci. Tech., 4, 269–286, https://doi.org/10.1080/02786828508959055, 1985.
Apicella, B., Pré, P., Alfè, M., Ciajolo, A., Gargiulo, V., Russo, C., Tregrossi, A., Deldique, D., and Rouzaud, J. N.: Soot nanostructure evolution in premixed flames by high resolution electron transmission microscopy (HRTEM), P. Combust. Inst., 35, 1895–1902, https://doi.org/10.1016/j.proci.2014.06.121, 2015.
Betrancourt, C., Liu, F., Desgroux, P., Mercier, X., Faccinetto, A., Salamanca, M., Ruwe, L., Kohse-Höinghaus, K., Emmrich, D., Beyer, A., Gölzhäuser, A., and Tritscher, T.: Investigation of the size of the incandescent incipient soot particles in premixed sooting and nucleation flames of n-butane using LII, HIM, and 1 nm-SMPS, Aerosol Sci. Tech., 51, 916–935, https://doi.org/10.1080/02786826.2017.1325440, 2017.
Bond, T. C., Doherty, S. J., Fahey, D. W., Forster, P. M., Berntsen, T., DeAngelo, B. J., Flanner, M. G., Ghan, S., Kärcher, B., Koch, D., Kinne, S., Kondo, Y., Quinn, P. K., Sarofim, M. C., Schultz, M. G., Schulz, M., Venkataraman, C., Zhang, H., Zhang, S., Bellouin, N., Guttikunda, S. K., Hopke, P. K., Jacobson, M. Z., Kaiser, J. W., Klimont, Z., Lohmann, U., Schwarz, J. P., Shindell, D., Storelvmo, T., Warren, S. G., and Zender, C. S.: Bounding the role of black carbon in the climate system: A scientific assessment, J. Geophys. Res.-Atmos., 118, 5380–5552, https://doi.org/10.1002/jgrd.50171, 2013.
Browne, E. C., Franklin, J. P., Canagaratna, M. R., Massoli, P., Kirchstetter, T. W., Worsnop, D. R., Wilson, K. R., and Kroll, J. H.: Changes to the chemical composition of soot from heterogeneous oxidation reactions, J. Phys. Chem. A, 119, 1154–1163, https://doi.org/10.1021/jp511507d, 2015.
Cai, J., Lu, N.. and Sorensen, C. M.: Analysis of fractal cluster morphology parameters: structural coefficient and density autocorrelation function cutoff, J. Colloid Interf. Sci., 171, 470–473, https://doi.org/10.1006/jcis.1995.1204, 1995.
Cerully, K. M., Raatikainen, T., Lance, S., Tkacik, D., Tiitta, P., Petäjä, T., Ehn, M., Kulmala, M., Worsnop, D. R., Laaksonen, A., Smith, J. N., and Nenes, A.: Aerosol hygroscopicity and CCN activation kinetics in a boreal forest environment during the 2007 EUCAARI campaign, Atmos. Chem. Phys., 11, 12369–12386, https://doi.org/10.5194/acp-11-12369-2011, 2011.
Colbeck, I., Atkinson, B., and Johar, Y.: The morphology and optical properties of soot produced by different fuels, J. Aerosol Sci., 28, 715–723, https://doi.org/10.1016/S0021-8502(96)00466-1, 1997.
Dahneke, B. E.: Slip correction factors for nonspherical bodies – III the form of the general law, J. Aerosol Sci., 4, 163–170, https://doi.org/10.1016/0021-8502(73)90067-0, 1973.
D'Anna, A.: Combustion-formed nanoparticles, P. Combust. Inst., 32, 593–613, https://doi.org/10.1016/j.proci.2008.09.005, 2009.
Desgroux, P., Mercier, X., and Thomson, K. A.: Study of the formation of soot and its precursors in flames using optical diagnostics, P. Combust. Inst., 34, 1713–1738, https://doi.org/10.1016/j.proci.2012.09.004, 2013.
Eggersdorfer, M. L. and Pratsinis, S. E.: Agglomerates and aggregates of nanoparticles made in the gas phase, Adv. Powder Tech., 25, 71–90, https://doi.org/10.1016/j.apt.2013.10.010, 2014.
Faccinetto, A. and Wu, J.: Data underlying the study of the influence of the dry aerosol particle size distribution and morphology on the cloud condensation nuclei activation, Université Lille Department of Chemistry, 4TU.Centre for Research Data, https://doi.org/10.4121/uuid:c2f66d57-0e15-43e0-beeb-3120663b7010, 2019.
Frenklach, M.: Reaction mechanism of soot formation in flames, Phys. Chem. Chem. Phys., 4, 2028–2037, https://doi.org/10.1039/B110045A, 2002.
Frenklach, M. and Wang, H.: Detailed modeling of soot particle nucleation and growth, P. Combust. Inst., 23, 1559–1566, https://doi.org/10.1016/S0082-0784(06)80426-1, 1990.
Friebel, F., Lobo, P., Neubauer, D., Lohmann, U., Drossaart van Dusseldorp, S., Mühlhofer, E., and Mensah, A. A.: Impact of isolated atmospheric aging processes on the cloud condensation nuclei activation of soot particles, Atmos. Chem. Phys., 19, 15545–15567, https://doi.org/10.5194/acp-19-15545-2019, 2019.
Govardhan, G., Satheesh, S. K., Nanjundiah, R., Moorthy, K. K., and Babu, S. S.: Possible climatic implications of high-altitude black carbon emissions, Atmos. Chem. Phys., 17, 9623–9644, https://doi.org/10.5194/acp-17-9623-2017, 2017.
Grimonprez, S., Faccinetto, A., Batut, S., Wu, J., Desgroux, P., and Petitprez, D.: Cloud condensation nuclei from the activation with ozone of soot particles sampled from a kerosene diffusion flame, Aerosol Sci. Tech., 52, 814–827, https://doi.org/10.1080/02786826.2018.1472367, 2018.
Henning, S., Ziese, M., Kiselev, A., Saathoff, H., Möhler, O., Mentel, T. F., Buchholz, A., Spindler, C., Michaud, V., Monier, M., Sellegri, K., and Stratmann, F.: Hygroscopic growth and droplet activation of soot particles: uncoated, succinic or sulfuric acid coated, Atmos. Chem. Phys., 12, 4525–4537, https://doi.org/10.5194/acp-12-4525-2012, 2012.
Henson, B. F.: An adsorption model of insoluble particle activation: Application to black carbon, J. Geophys. Res.-Atmos., 112, D24S16, https://doi.org/10.1029/2007JD008549, 2007.
Hu, B., Yang, B., and Köylü, Ü. Ö.: Soot measurements at the axis of an ethylene/air non-premixed turbulent jet flame, Combust. Flame, 134, 93–106, https://doi.org/10.1016/S0010-2180(03)00085-3, 2003.
Irimiea, C., Faccinetto, A., Mercier, X., Ortega, I.-K., Nuns, N., Therssen, E., Desgroux, P., and Focsa, C.: Unveiling trends in soot nucleation and growth: When secondary ion mass spectrometry meets statistical analysis, Carbon, 144, 815–830, https://doi.org/10.1016/j.carbon.2018.12.015, 2019.
Karataş, A. E. and Gülder, Ö. L.: Soot formation in high pressure laminar diffusion flames, Prog. Energy Combust. Sci., 38, 818–845, https://doi.org/10.1016/j.pecs.2012.04.003, 2012.
Kelesidis, G. A., Goudeli, E., and Pratsinis, S. E.: Morphology and mobility diameter of carbonaceous aerosols during agglomeration and surface growth, Carbon, 121, 527–535, https://doi.org/10.1016/j.carbon.2017.06.004, 2017.
Kholghy, M. R., Saffaripour, M., Yip, C., and Thomson, M. J.: The evolution of soot morphology in a laminar coflow diffusion flame of a surrogate for Jet A-1, Combust. Flame, 160, 2119–2130, https://doi.org/10.1016/j.combustflame.2013.04.008, 2013.
Kholghy, M. R., Veshkini, A., and Thomson, M. J.: The core–shell internal nanostructure of soot – A criterion to model soot maturity, Carbon, 100, 508–536, https://doi.org/10.1016/j.carbon.2016.01.022, 2016.
Köhler, H.: The nucleus in and the growth of hygroscopic droplets, T. Faraday Soc., 32, 1152–1161, https://doi.org/10.1039/TF9363201152, 1936.
Kotzick, R., Panne, U., and Niessner, R.: Changes in condensation properties of ultrafine carbon particles subjected to oxidation by ozone, J. Aerosol Sci., 28, 725–735, https://doi.org/10.1016/S0021-8502(96)00471-5, 1997.
Köylü, Ü. Ö. and Faeth, G. M.: Structure of overfire soot in buoyant turbulent diffusion flames at long residence times, Combust. Flame, 89, 140–156, https://doi.org/10.1016/0010-2180(92)90024-J, 1992.
Köylü, Ü. Ö., Faeth, G. M., Farias, T. L., and Carvalho, M. G.: Fractal and projected structure properties of soot aggregates, Combust. Flame, 100, 621–633, https://doi.org/10.1016/0010-2180(94)00147-K, 1995.
Kuwata, M. and Kondo, Y.: Dependence of size-resolved CCN spectra on the mixing state of nonvolatile cores observed in Tokyo, J. Geophys. Res.-Atmos., 113, D19202, https://doi.org/10.1029/2007JD009761, 2008.
Lambe, A. T., Ahern, A. T., Wright, J. P., Croasdale, D. R., Davidovits, P., and Onasch, T. B.: Oxidative aging and cloud condensation nuclei activation of laboratory combustion soot, J. Aerosol Sci., 79, 31–39, https://doi.org/10.1016/j.jaerosci.2014.10.001, 2015.
Medalia, A. I.: Morphology of aggregates: I. Calculation of shape and bulkiness factors; application to computer-simulated random flocs, J. Colloid Interf. Sci., 24, 393–404, https://doi.org/10.1016/0021-9797(67)90267-6, 1967.
Michelsen, H. A.: Probing soot formation, chemical and physical evolution, and oxidation: A review of in situ diagnostic techniques and needs, P. Combust. Inst., 36, 717–735, https://doi.org/10.1016/j.proci.2016.08.027, 2017.
Monge, M. E., D'Anna, B., Mazri, L., Giroir-Fendler, A., Ammann, M., Donaldson, D. J., and George, C.: Light changes the atmospheric reactivity of soot, P. Natl. Acad. Sci. USA, 107, 6605–6609, https://doi.org/10.1073/pnas.0908341107, 2010.
Petters, M. D.: A language to simplify computation of differential mobility analyzer response functions, Aerosol Sci. Tech., 52, 1437–1451, https://doi.org/10.1080/02786826.2018.1530724, 2018.
Petters, M. D. and Kreidenweis, S. M.: A single parameter representation of hygroscopic growth and cloud condensation nucleus activity, Atmos. Chem. Phys., 7, 1961–1971, https://doi.org/10.5194/acp-7-1961-2007, 2007.
Richter, H. and Howard, J. B.: Formation of polycyclic aromatic hydrocarbons and their growth to soot – a review of chemical reaction pathways, Prog. Energy Combust. Sci., 26, 565–608, https://doi.org/10.1016/S0360-1285(00)00009-5, 2000.
Rose, D., Wehner, B., Ketzel, M., Engler, C., Voigtländer, J., Tuch, T., and Wiedensohler, A.: Atmospheric number size distributions of soot particles and estimation of emission factors, Atmos. Chem. Phys., 6, 1021–1031, https://doi.org/10.5194/acp-6-1021-2006, 2006.
Rose, D., Gunthe, S. S., Mikhailov, E., Frank, G. P., Dusek, U., Andreae, M. O., and Pöschl, U.: Calibration and measurement uncertainties of a continuous-flow cloud condensation nuclei counter (DMT-CCNC): CCN activation of ammonium sulfate and sodium chloride aerosol particles in theory and experiment, Atmos. Chem. Phys., 8, 1153–1179, https://doi.org/10.5194/acp-8-1153-2008, 2008.
Samson, R. J., Mulholland, G. W., and Gentry, J. W.: Structural analysis of soot agglomerates, Langmuir, 3, 272–281, https://doi.org/10.1021/la00074a022, 1987.
Santamaría, A., Mondragón, F., Quiñónez, W., Eddings, E. G., and Sarofim, A. F.: Average structural analysis of the extractable material of young soot gathered in an ethylene inverse diffusion flame, Fuel, 86, 1908–1917, https://doi.org/10.1016/j.fuel.2006.12.002, 2007.
Sayer, A. M., Hsu, N. C., Bettenhausen, C., Jeong, M.-J., Holben, B. N., and Zhang, J.: Global and regional evaluation of over-land spectral aerosol optical depth retrievals from SeaWiFS, Atmos. Meas. Tech., 5, 1761–1778, https://doi.org/10.5194/amt-5-1761-2012, 2012.
Snider, J. R., Petters, M. D., Wechsler, P., and Liu, P. S. K.: Supersaturation in the Wyoming CCN Instrument, J. Atmos. Ocean. Tech., 23, 1323–1339, https://doi.org/10.1175/JTECH1916.1, 2006.
Sorensen, C. M.: The mobility of fractal aggregates: a review, Aerosol Sci. Tech., 45, 765–779, https://doi.org/10.1080/02786826.2011.560909, 2011.
Sorensen, C. M. and Roberts, G. C.: The prefactor of fractal aggregates, J. Colloid Interf. Sci., 186, 447–452, https://doi.org/10.1006/jcis.1996.4664, 1997.
Sorensen, C. M., Cai, J., and Lu, N.: Light-scattering measurements of monomer size, monomers per aggregate, and fractal dimension for soot aggregates in flames, Appl. Optics, 31, 6547–6557, https://doi.org/10.1364/AO.31.006547, 1992.
Sorjamaa, R. and Laaksonen, A.: The effect of H2O adsorption on cloud drop activation of insoluble particles: a theoretical framework, Atmos. Chem. Phys., 7, 6175–6180, https://doi.org/10.5194/acp-7-6175-2007, 2007.
Stocker, T. F., Qin, D., Plattner, G.-K., Tignor, M. M. B., Allen, S. K., Boschung, J., Nauels, A., Xia, Y., Bex, V., and Midgley, P. M.: Climate Change 2013 – The Physical Science Basis: Working Group I Contribution to the Fifth Assessment Report of the Intergovernmental Panel on Climate Change, Cambridge University Press, Cambridge, UK, 2014.
Su, H., Rose, D., Cheng, Y. F., Gunthe, S. S., Massling, A., Stock, M., Wiedensohler, A., Andreae, M. O., and Pöschl, U.: Hygroscopicity distribution concept for measurement data analysis and modeling of aerosol particle mixing state with regard to hygroscopic growth and CCN activation, Atmos. Chem. Phys., 10, 7489–7503, https://doi.org/10.5194/acp-10-7489-2010, 2010.
Sullivan, R. C., Moore, M. J. K., Petters, M. D., Kreidenweis, S. M., Roberts, G. C., and Prather, K. A.: Effect of chemical mixing state on the hygroscopicity and cloud nucleation properties of calcium mineral dust particles, Atmos. Chem. Phys., 9, 3303–3316, https://doi.org/10.5194/acp-9-3303-2009, 2009.
Tang, M. J., Whitehead, J., Davidson, N. M., Pope, F. D., Alfarra, M. R., McFiggans, G., and Kalberer, M.: Cloud condensation nucleation activities of calcium carbonate and its atmospheric ageing products, Phys. Chem. Chem. Phys., 17, 32194–32203, https://doi.org/10.1039/C5CP03795F, 2015.
Tian, K., Thomson, K. A., Liu, F., Snelling, D. R., Smallwood, G. J., and Wang, D.: Determination of the morphology of soot aggregates using the relative optical density method for the analysis of TEM images, Combust. Flame, 144, 782–791, https://doi.org/10.1016/j.combustflame.2005.06.017, 2006.
Tritscher, T., Jurányi, Z., Martin, M., Chirico, R., Gysel, M., Heringa, M. F., DeCarlo, P. F., Sierau, B., Prévôt, A. S. H., Weingartner, E., and Baltensperger, U.: Changes of hygroscopicity and morphology during ageing of diesel soot, Environ. Res. Lett., 6, 034026, https://doi.org/10.1088/1748-9326/6/3/034026, 2011.
Wang, H.: Formation of nascent soot and other condensed-phase materials in flames, P. Combust. Inst., 33, 41–67, https://doi.org/10.1016/j.proci.2010.09.009, 2011.
Wittbom, C., Eriksson, A. C., Rissler, J., Carlsson, J. E., Roldin, P., Nordin, E. Z., Nilsson, P. T., Swietlicki, E., Pagels, J. H., and Svenningsson, B.: Cloud droplet activity changes of soot aerosol upon smog chamber ageing, Atmos. Chem. Phys., 14, 9831–9854, https://doi.org/10.5194/acp-14-9831-2014, 2014.
Yon, J., Bescond, A., and Ouf, F.-X.: A simple semi-empirical model for effective density measurements of fractal aggregates, J. Aerosol Sci., 87, 28–37, https://doi.org/10.1016/j.jaerosci.2015.05.003, 2015.
Zhao, D. F., Buchholz, A., Kortner, B., Schlag, P., Rubach, F., Kiendler-Scharr, A., Tillmann, R., Wahner, A., Flores, J. M., Rudich, Y., Watne, Å. K., Hallquist, M., Wildt, J., and Mentel, Th. F.: Size-dependent hygroscopicity parameter (κ) and chemical composition of secondary organic cloud condensation nuclei, Geophys. Res. Lett., 42, 10920–10928, https://doi.org/10.1002/2015GL066497, 2015.
Zuberi, B., Johnson, K. S., Aleks, G. K., Molina, L. T., Molina, M. J., and Laskin, A.: Hydrophilic properties of aged soot, Geophys. Res. Lett., 32, L01807, https://doi.org/10.1029/2004GL021496, 2005.