the Creative Commons Attribution 4.0 License.
the Creative Commons Attribution 4.0 License.
 | 02 Apr 2020
Vertical profiles of submicron aerosol single scattering albedo over the Indian region immediately before monsoon onset and during its development: research from the SWAAMI field campaign
Sreedharan K. Satheesh
Krishnaswamy K. Moorthy
Vertical structures of aerosol single scattering albedo (SSA), from near the surface through the free troposphere, have been estimated for the first time at distinct geographical locations over the Indian mainland and adjoining oceans, using in situ measurements of aerosol scattering and absorption coefficients aboard the Facility for Airborne Atmospheric Measurements (FAAM) BAe-146 aircraft during the South West Asian Aerosol Monsoon Interactions (SWAAMI) campaign from June to July 2016. These are used to examine the spatial variation of SSA profiles and also to characterize its transformation from just prior to the onset of Indian Summer Monsoon (June 2016) to its active phase (July 2016). Very strong aerosol absorption, with SSA values as low as 0.7, persisted in the lower altitudes (<3 km) over the Indo-Gangetic Plains (IGP), prior to the monsoon onset, with a west-to-east gradient; lower values occurred in the north-western arid regions, peaking in the central IGP and somewhat decreasing towards the eastern end. During the active phase of the monsoon, the SSA is found to increase remarkably, indicating far less absorption. Nevertheless, significant aerosol absorption persisted in the lower and middle troposphere over the IGP. Inputting these SSA and extinction profiles into a radiative transfer model, we examined the effects of using height-resolved information in estimating atmospheric heating rates due to aerosols, over similar estimates made using a single columnar value. It was noted that use of a single SSA value leads to an underestimation (overestimation) of the heating rates over regions with low (high) SSA, emphasizing the importance of height-resolved information. Further, the use of realistic profiles showed significant heating of the atmosphere by submicron aerosol absorption at the middle troposphere, which may have strong implications for clouds and climate.
- Article
(5425 KB) - Full-text XML
-
Supplement
(342 KB) - BibTeX
- EndNote


The Indian Summer Monsoon (ISM) is a large-scale climate system, having direct implications for South Asia. The role of atmospheric aerosols (both natural and anthropogenic) in significantly perturbing the ISM through direct and indirect radiative interactions has been well recognized (Ramanathan et al., 2001; Lau et al., 2006; Gautam et al., 2009; Jones et al., 2009; Vinoj et al., 2014; Solmon et al., 2015; Jin et al., 2016), yet it remains inaccurately quantified, especially due to the complex nature of the interactions on the one hand and the highly complex aerosol system (being a mixture of abundant natural and anthropogenic species) that shows large heterogeneity in space and time (see, for example, Moorthy et al. (2016) and references therein). As such, aerosol–monsoon interaction over South Asia remains a very active topic in climate research (Kuhlmann and Quaas, 2010; Turner and Annamalai, 2012; Bollasina et al., 2014; Li et al., 2016; Nair et al., 2016). Improving the accuracy of the description of aerosol perturbation of atmospheric thermodynamics requires critical information on aerosol properties. Some of the most important of these are spectral optical depth, size distribution and the vertical variation of aerosol single scattering albedo (SSA), the latter being a measure of the relative contribution of scattering and absorption by aerosol to the total light extinction. Absorbing aerosol layers can critically modify the thermal structure of the atmosphere; hence information on both the vertical distribution of aerosols and type of aerosols at various altitudes is essential to understand their net radiative impact. The relative position of clouds with respect to the aerosol layers also is important.
The importance of the information on vertically resolved aerosol properties in improving the accuracy of aerosol direct and indirect radiative forcing has been emphasized by a few regional studies. Clarke et al. (2004) have advocated the need to study the vertical heterogeneities of aerosol properties, as the values estimated for near-surface aerosols poorly represent the variations within the column. Using airborne lidar measurements, Satheesh et al. (2008) have shown the role of elevated aerosol layers over the Indian peninsula in producing the high heating rate at 4 to 5 km altitude, just above low-level clouds, which could even locally affect the environmental lapse rate (Babu et al., 2011). Combining data from ground-based and airborne measurements over oceanic regions adjoining India during the ICARB, Moorthy et al. (2009) have demonstrated large differences in atmospheric heating rates due to aerosols in the lower free troposphere when height resolved scattering and absorption coefficients are used. However, their vertical measurements were confined to about 3 km above ground, over the peninsular landmass and nearby oceans and also limited to pre-monsoon seasons only. In these studies, in situ measurements were limited to about 3 km (Babu et al., 2010, 2016), primarily due to technical limitations of the aircraft sampling system. In 2009, airborne atmospheric measurements of aerosol vertical profiles extending up to 6 km a.s.l. were carried out over different parts of India as part of the Cloud Aerosol Interactions and Precipitation Enhancement EXperiment (CAIPEEX), which revealed the presence of elevated aerosol layers during both the pre-monsoon and monsoon (Padmakumari et al., 2013a).
During the monsoon, ground-based (or even satellite borne) measurements of aerosol optical depth (AOD) and extinction coefficient profiles are limited due to extensive cloudiness and precipitation. Most of the existing measurements were made during the winter/pre-monsoon period (January to April), and hence there are limited measurements on the vertical distribution of aerosol characteristics just before the onset of the monsoon and during its evolving phase, especially over the central Indian regions, where the aerosol abundances and type undergo rapid changes due to changing meteorological conditions. Though the CAIPEEX campaign addressed this to some extent (Kulkarni et al., 2012), only its Phase 1 (2009) covered the evolving phase of the monsoon. During Phase 1, elevated aerosol layers were observed (mainly in the 2–4 km region) over the Indo-Gangetic Plains, which led to large increases in the aerosol and cloud condensation nuclei (CCN) concentrations (Padmakumari et al., 2013b). However, the main focus of CAIPEEX was to understand aerosol–cloud–precipitation linkages from the perspective of precipitation enhancement and as such aerosol properties relevant only towards this have been explored.
To reduce the uncertainties in aerosol–cloud–monsoon interactions, it is necessary to bring together different data sets of aerosol properties from India, including in situ measurements, ground- and space-based remote sensing data and aircraft measurements. In addition, it is important to measure the key aerosol physical and chemical properties required to assess the regional and vertical distribution of aerosol-induced atmospheric heating. This can be accomplished by conducting campaign-mode measurements involving in situ measurements of aerosol properties using aircraft, supplemented with ground- and space-based measurements across the Indian domain, with special focus on the Indo-Gangetic Plains and northern Bay of Bengal, immediately before monsoon onset and during its development.
The joint Indo–UK field experiment, SWAAMI was formulated to meet these goals. During this campaign, extensive airborne measurements of aerosols were made in the altitude range from very close to the surface to as high as 8 km, using the BAe-146-301 atmospheric research aircraft (Highwood et al., 2012; Johnson et al., 2012) over the Indian domain, in June–July 2016, covering the pre-onset and evolving phases of the ISM (Brooks et al., 2018), perhaps for the first time at such detail. This was closely preceded by airborne measurements of aerosol properties across the Indo-Gangetic Plains aboard an Indian aircraft up to an altitude of ∼3.5 km (Vaishya et al., 2017). In this paper, we report the vertical distribution of extinction coefficients and single scattering albedo during SWAAMI campaign and discuss the climate implications.
Table 1The period of measurement from two base stations and details of regions covered during different phases of the monsoon.
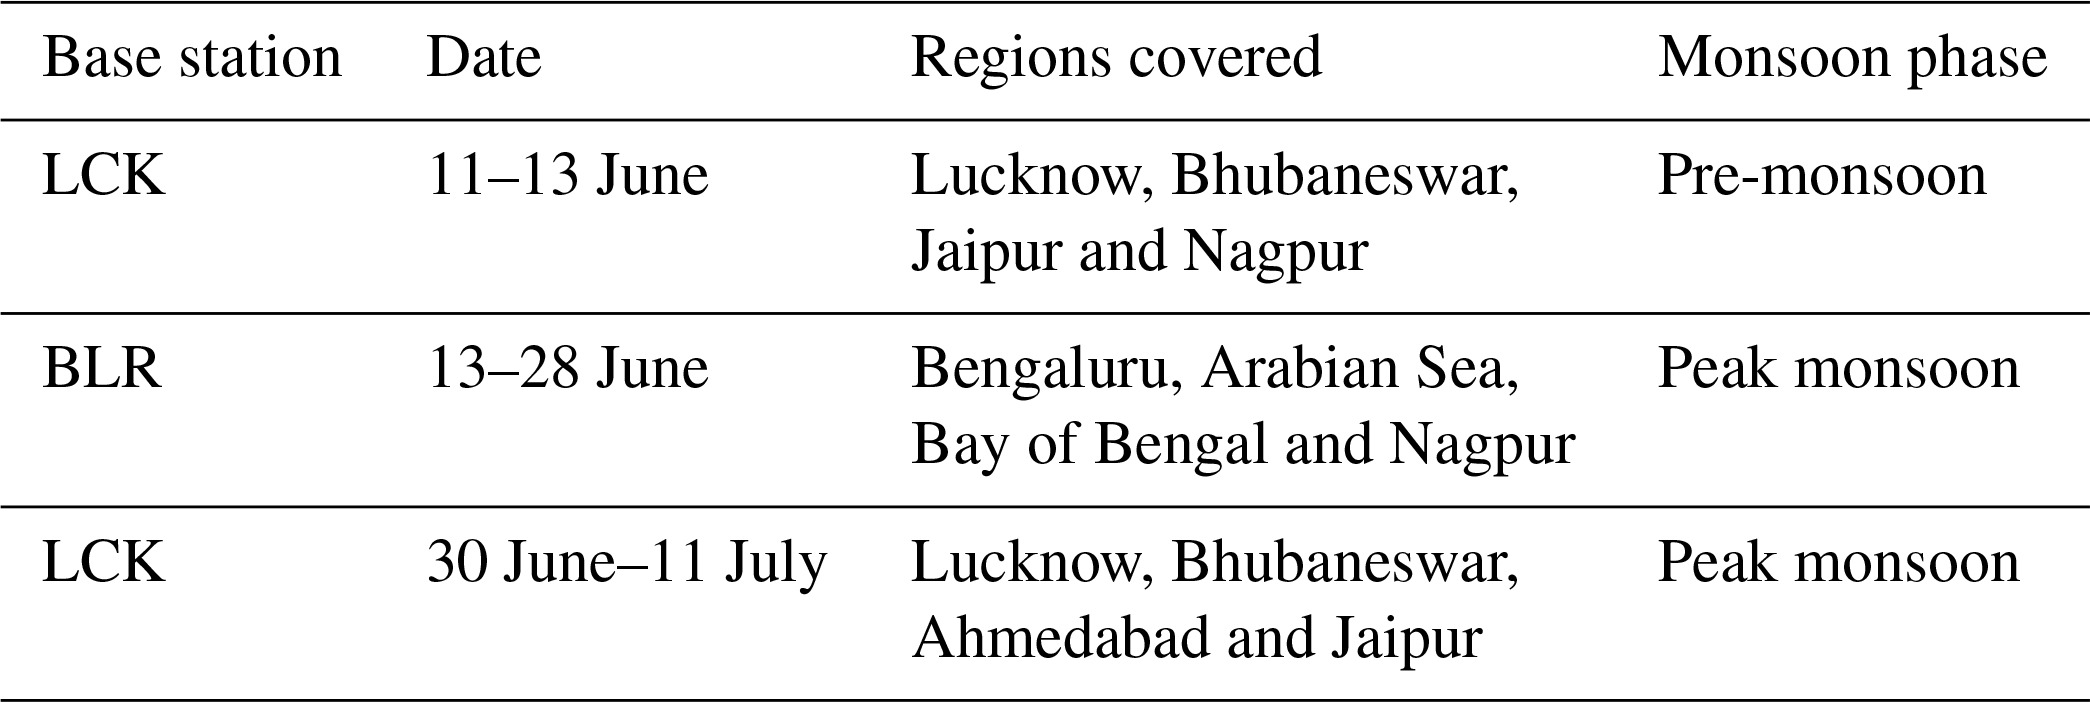
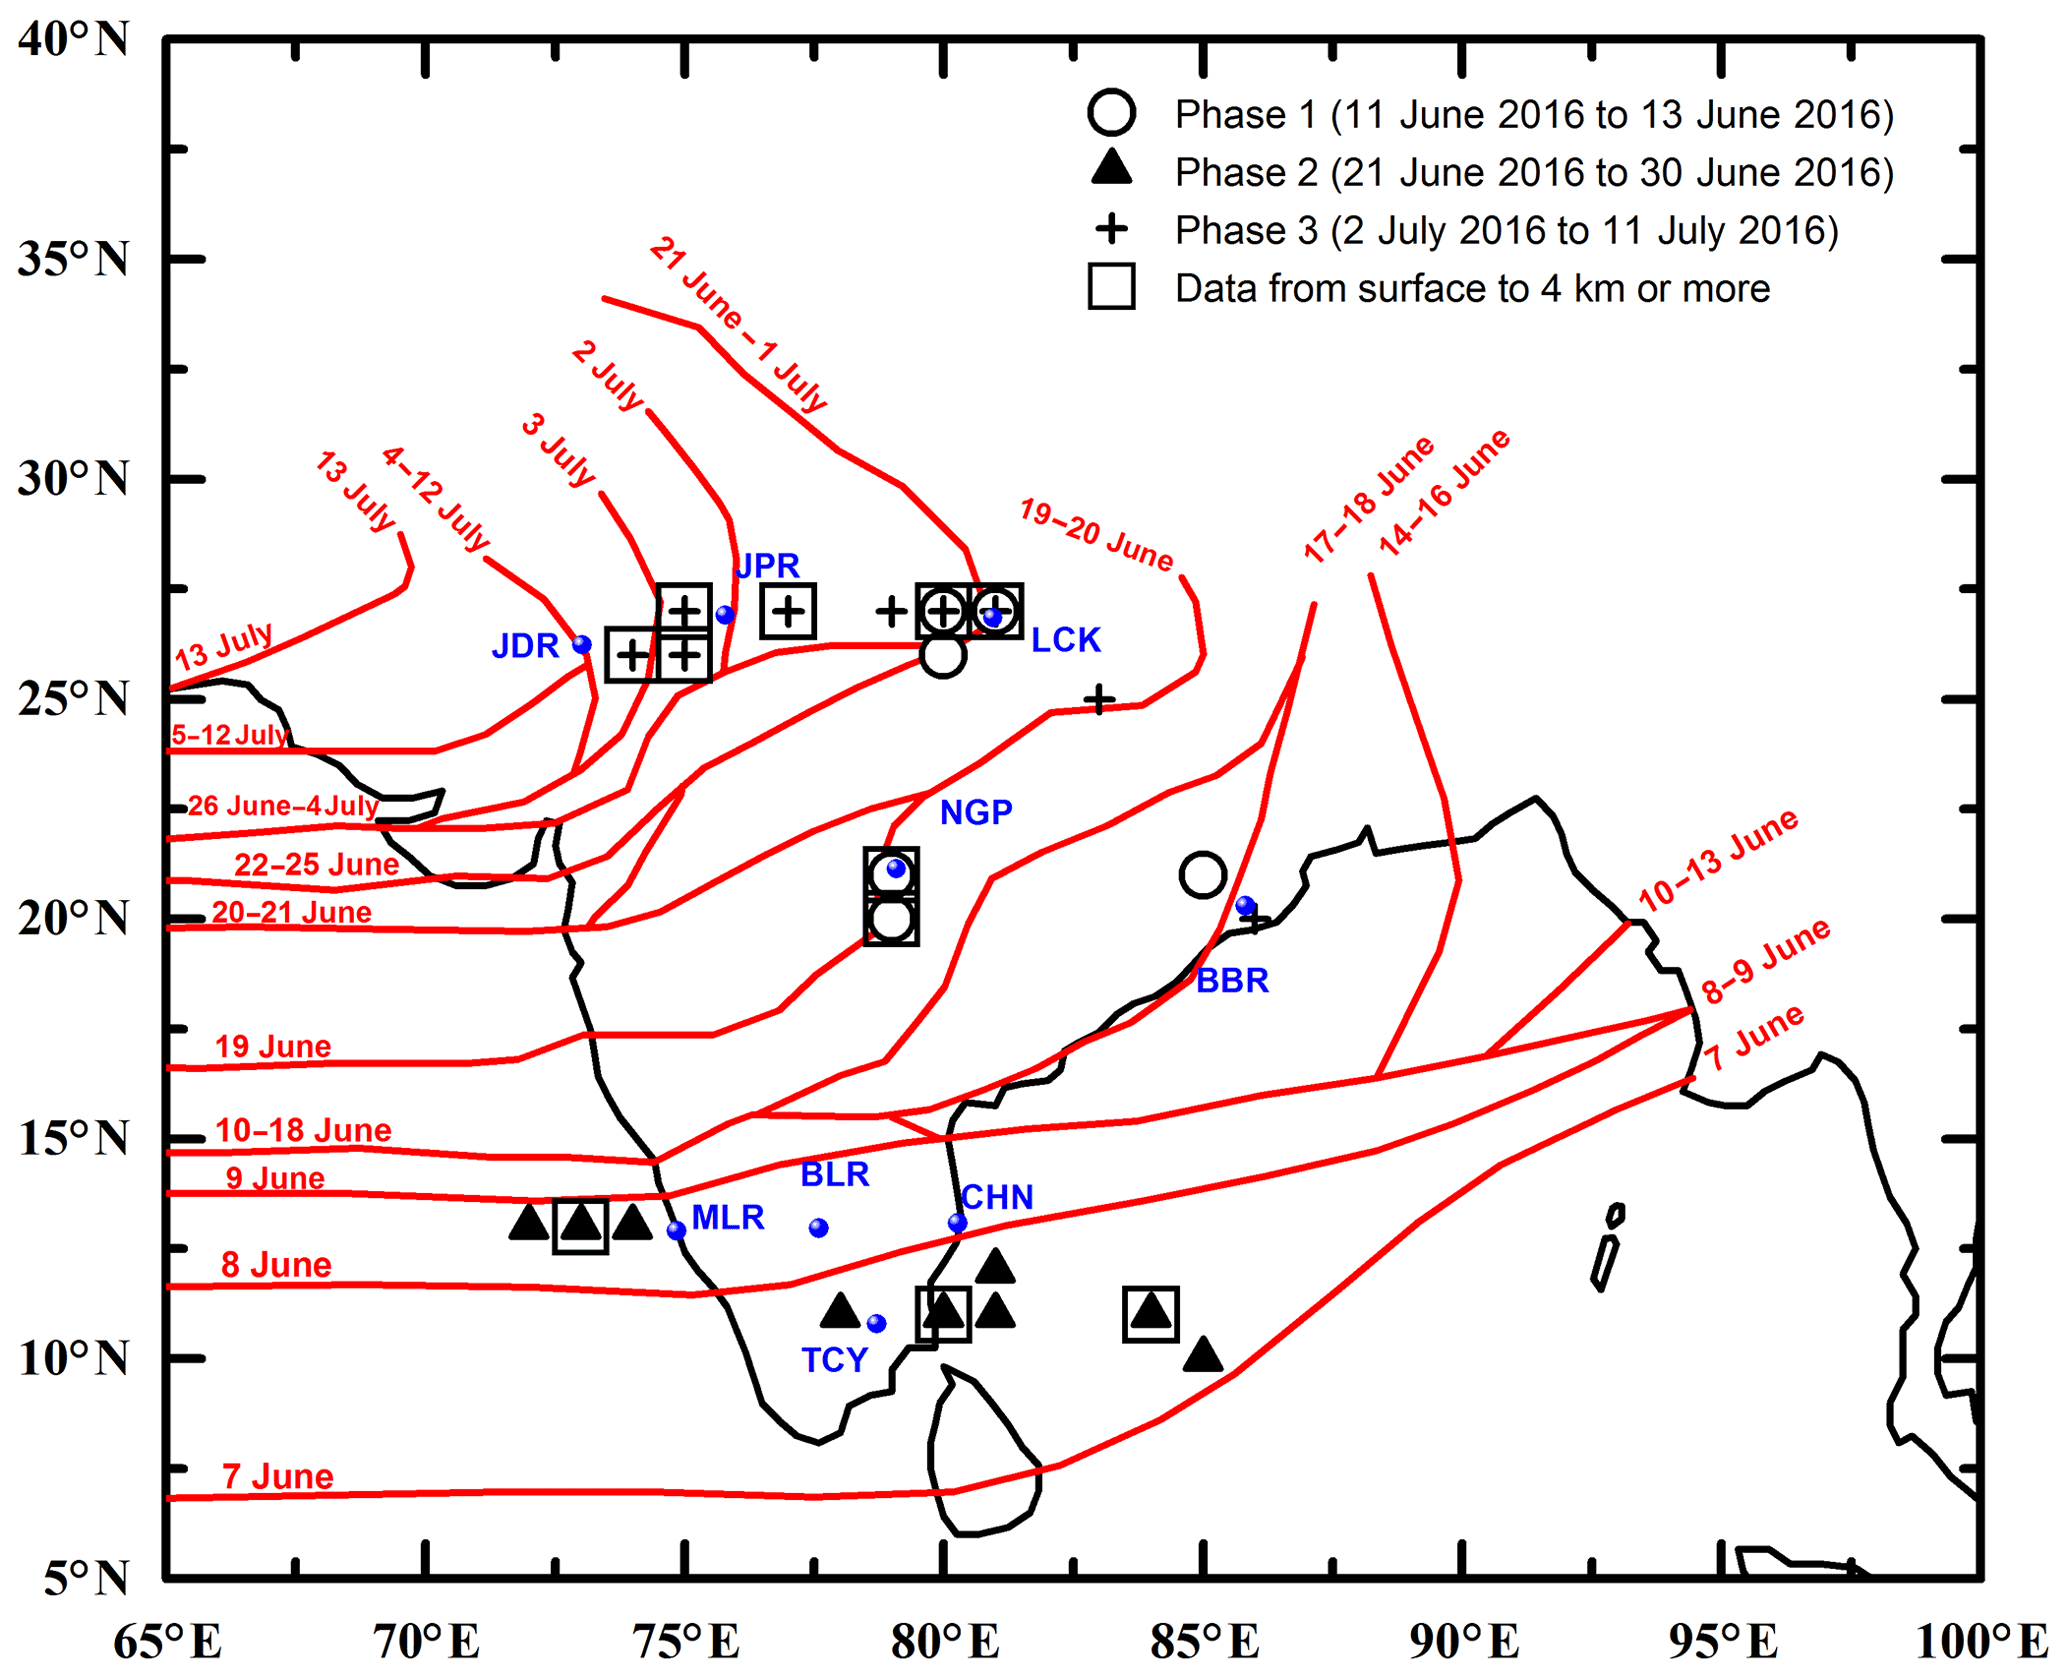
Figure 1The locations corresponding to the vertical profiles are marked in the figure with the symbol indicating the phase of measurement. The locations where high altitude data are available are indicated by the big square. The red lines show the position of the monsoon trough on the dates of the year 2016 shown at the ends of the lines, taken from the India Meteorological Department website (https://metnet.imd.gov.in/imdnews/ar2016.pdf, last access: 30 January 2020) and is used to infer the phase of the monsoon (prior to onset, active, etc.) for the different regions.
The airborne measurements were carried out aboard the BAe-146-301 atmospheric research aircraft operated by the Facility for Airborne Atmospheric Measurements (FAAM). The strategy was to make in situ measurements of aerosols and meteorological fields, for the first time from near the surface to ∼8 km altitude, just prior to the onset of Indian summer monsoon over the Indo-Gangetic Plains and during its progress to the active phase, over the Indian landmass and adjoining oceans. While the observations in the Indo-Gangetic Plains and western India, which covered a range of surface types in the South Asian region, focused on the transition of aerosol properties from dry to wet climatic zones, the observations in the peninsular Indian region focused on the transitions from land to ocean and across the orography (of the Western Ghats). Airborne measurements were carried out over five locations: Lucknow (LCK – 26.84∘ N, 80.94∘ E, 126 m a.s.l.) in the central IGP, Jaipur (JPR – 26.91∘ N, 75.78∘ E, 431 m a.s.l.) in the western IGP, Nagpur (NGP – 21.14∘ N, 79.08∘ E, 310 m a.s.l.) in central India, over the Arabian Sea (AS – 13∘ N, 72∘ E) and the Bay of Bengal (BoB – 11∘ N, 84∘ E). The base stations for the aircraft operations were LCK (26.84∘ N, 80.94∘ E, 126 m a.s.l.) and BLR (77.59∘ N, 12.97∘ E, 920 m a.s.l.; Fig. 1). Of these, the measurements over LCK covered the periods just prior to the monsoon onset and its active phase, while the measurements in the southern peninsula and oceanic regions were carried out during the evolving phase of the monsoon. The details of the measurements from the base stations, the regions covered during the flight and the period of measurements with respect to the phase of the monsoon are summarized in Table 1. More details on the flights during the campaign are provided in the Supplement (Table S1 and Fig. S1). The centre of operations for Phases 1 and 3 was Lucknow and that for Phase 2 was Bengaluru. The Phase 1 measurements covered regions around Lucknow, as well as east–west transects across the IGP covering Jaipur (in the west) and Bhubaneswar (in the east) before moving over to Bengaluru, via Nagpur. Phase 2 focused on monsoon and the measurements were made over the Arabian Sea (to the west of the Indian peninsula) and Bay of Bengal (to the east). Phase 3 covered regions to the west of Lucknow (near Jaipur) and south-east of Lucknow (near Bhubaneswar) similar to Phase 1, and in addition measurements were made near Ahmedabad and over the Ganga en route from Lucknow to Delhi (as far as Kachhla).
During the measurements, the aircraft moved at a typical ascend rate of 5.5 m s−1 and descended at a rate of 6.5 m s−1, making measurements at a vertical resolution of ∼7 m. Thus, during its ascent from near the surface to ∼7 km during profiling, the aircraft covers a horizontal distance of ∼130 km with a horizontal velocity of ∼100 m s−1. In all, the aircraft made 22 dedicated scientific flights spanning approximately 100 h in three phases: Phase 1 from 11 to 13 June 2016 (3 flights), Phase 2 from 21 to 30 June 2016 (10 flights) and Phase 3 from 2 to 11 July 2016 (9 flights). A list of the aerosol instruments aboard, the parameters retrieved from the measurements, the relevant reference to the principle of instrument and data deduction details, general aircraft data and meteorological data are provided in Table 2. The locations of vertical profiling are marked in Fig. 1, along with the important base stations on the ground and the phases of the campaign. The detailed flight track for the three phases are given in the Supplement. The symbols indicate the phase of measurement and the square boxes over symbols indicate the availability of data from surface to >4 km.
Table 2Details of aerosol instruments and aircraft instruments measuring various aerosol, meteorological and aircraft parameters.

Measurements using the particle soot absorption photometer (PSAP) from Radiance Research are used to estimate aerosol absorption coefficients at 567 nm. The measurements were made under ambient pressure and the PSAP data were corrected for pressure, spot size, flow rate and the presence of scattering particles on the filter following Bond et al. (1999) and Ogren (2010). The scattering coefficient required for this correction was taken from the nephelometer. The nephelometer (TSI-3563) gives the scattering coefficients at three wavelengths (450, 550 and 700 nm). The scattering coefficients were corrected for angular truncation (due to the measurement angle being limited to the range of 7 to 170∘), the non-Lambertian nature of the light source and the dependence of the scattering on the particle size following Anderson and Ogren (1998). In addition, the vertical distribution of static pressure from the aircraft reduced vertical separation minima (RVSM) system, temperature from the Rosemount de-iced temperature sensor and water vapour from the Water Vapour Sensing System Version 2 (WVSS-II) fed through a Rosemount inlet are also used in this study. The WVSS-II, which uses a 1.37 µm laser is used to estimate the atmospheric water vapour. This wavelength is chosen as it is not absorbed by ice crystals or aerosols but it can be scattered at cold dry regions of the upper troposphere. To ensure reliable performance, the inlet is aerodynamically designed to prevent particles from reaching the sensing cavity (Fleming and May, 2004; Vance et al., 2015). More details are available in the FAAM website https://www.faam.ac.uk/ (last access: 30 January 2020).
The absorption coefficient at 567 nm, estimated using the PSAP, is extrapolated to 550 nm (where the nephelometer measurements are available) using the inverse dependence (Ångström exponent; Ogren, 2010). The corrected absorption coefficient (σab) at 550 nm is given by
where 0.873 accounts for the difference in the spot area of the PSAP filter spot and the manufacturer's reference instrument, Cspot=1.186 and Cflow=0.909 are the correction factors for PSAP filter spot area and flow respectively specific to the instrument used, 0.98 is the adjustment factor used to convert the σab measured at 567 nm to σab at 550 nm assuming an inverse wavelength dependence , and are the uncorrected absorption and scattering coefficients at 567 and 550 nm respectively and k1=0.02 and k2=1.22 are the coefficients of the empirical relation suggested by Bond et al. (1999) to remove the effect of aerosol scattering from the absorption coefficient measurements.
The scattering coefficients (σsca) obtained from the nephelometer are corrected for angular truncation error and errors arising due to the dependence of light scattering on particle size. This is done following Anderson and Ogren (1998) and assuming no size cut. In practice the nephelometer does not represent the full scattering coefficient from dust due to the limitation set by the inlet. Despite the inlet having a 50 % cut-off efficiency at 3 µm, (Highwood et al., 2012) the assumption of no size-cut was considered for the correction as both submicron and supermicron particles are simultaneously observed by the nephelometer.
The SSA is calculated using the corrected scattering and absorption coefficients at 550 nm the SSA is estimated as
Filter-based absorption measurements generally overestimate absorption by up to 45 % and can lead to underestimations in the SSA (up to 0.07; Davies et al., 2019). The radiative effects of these aerosols are estimated using a radiative transfer scheme taking into account the vertical distribution of extinction coefficient, SSA, pressure, temperature, water vapour and ozone.
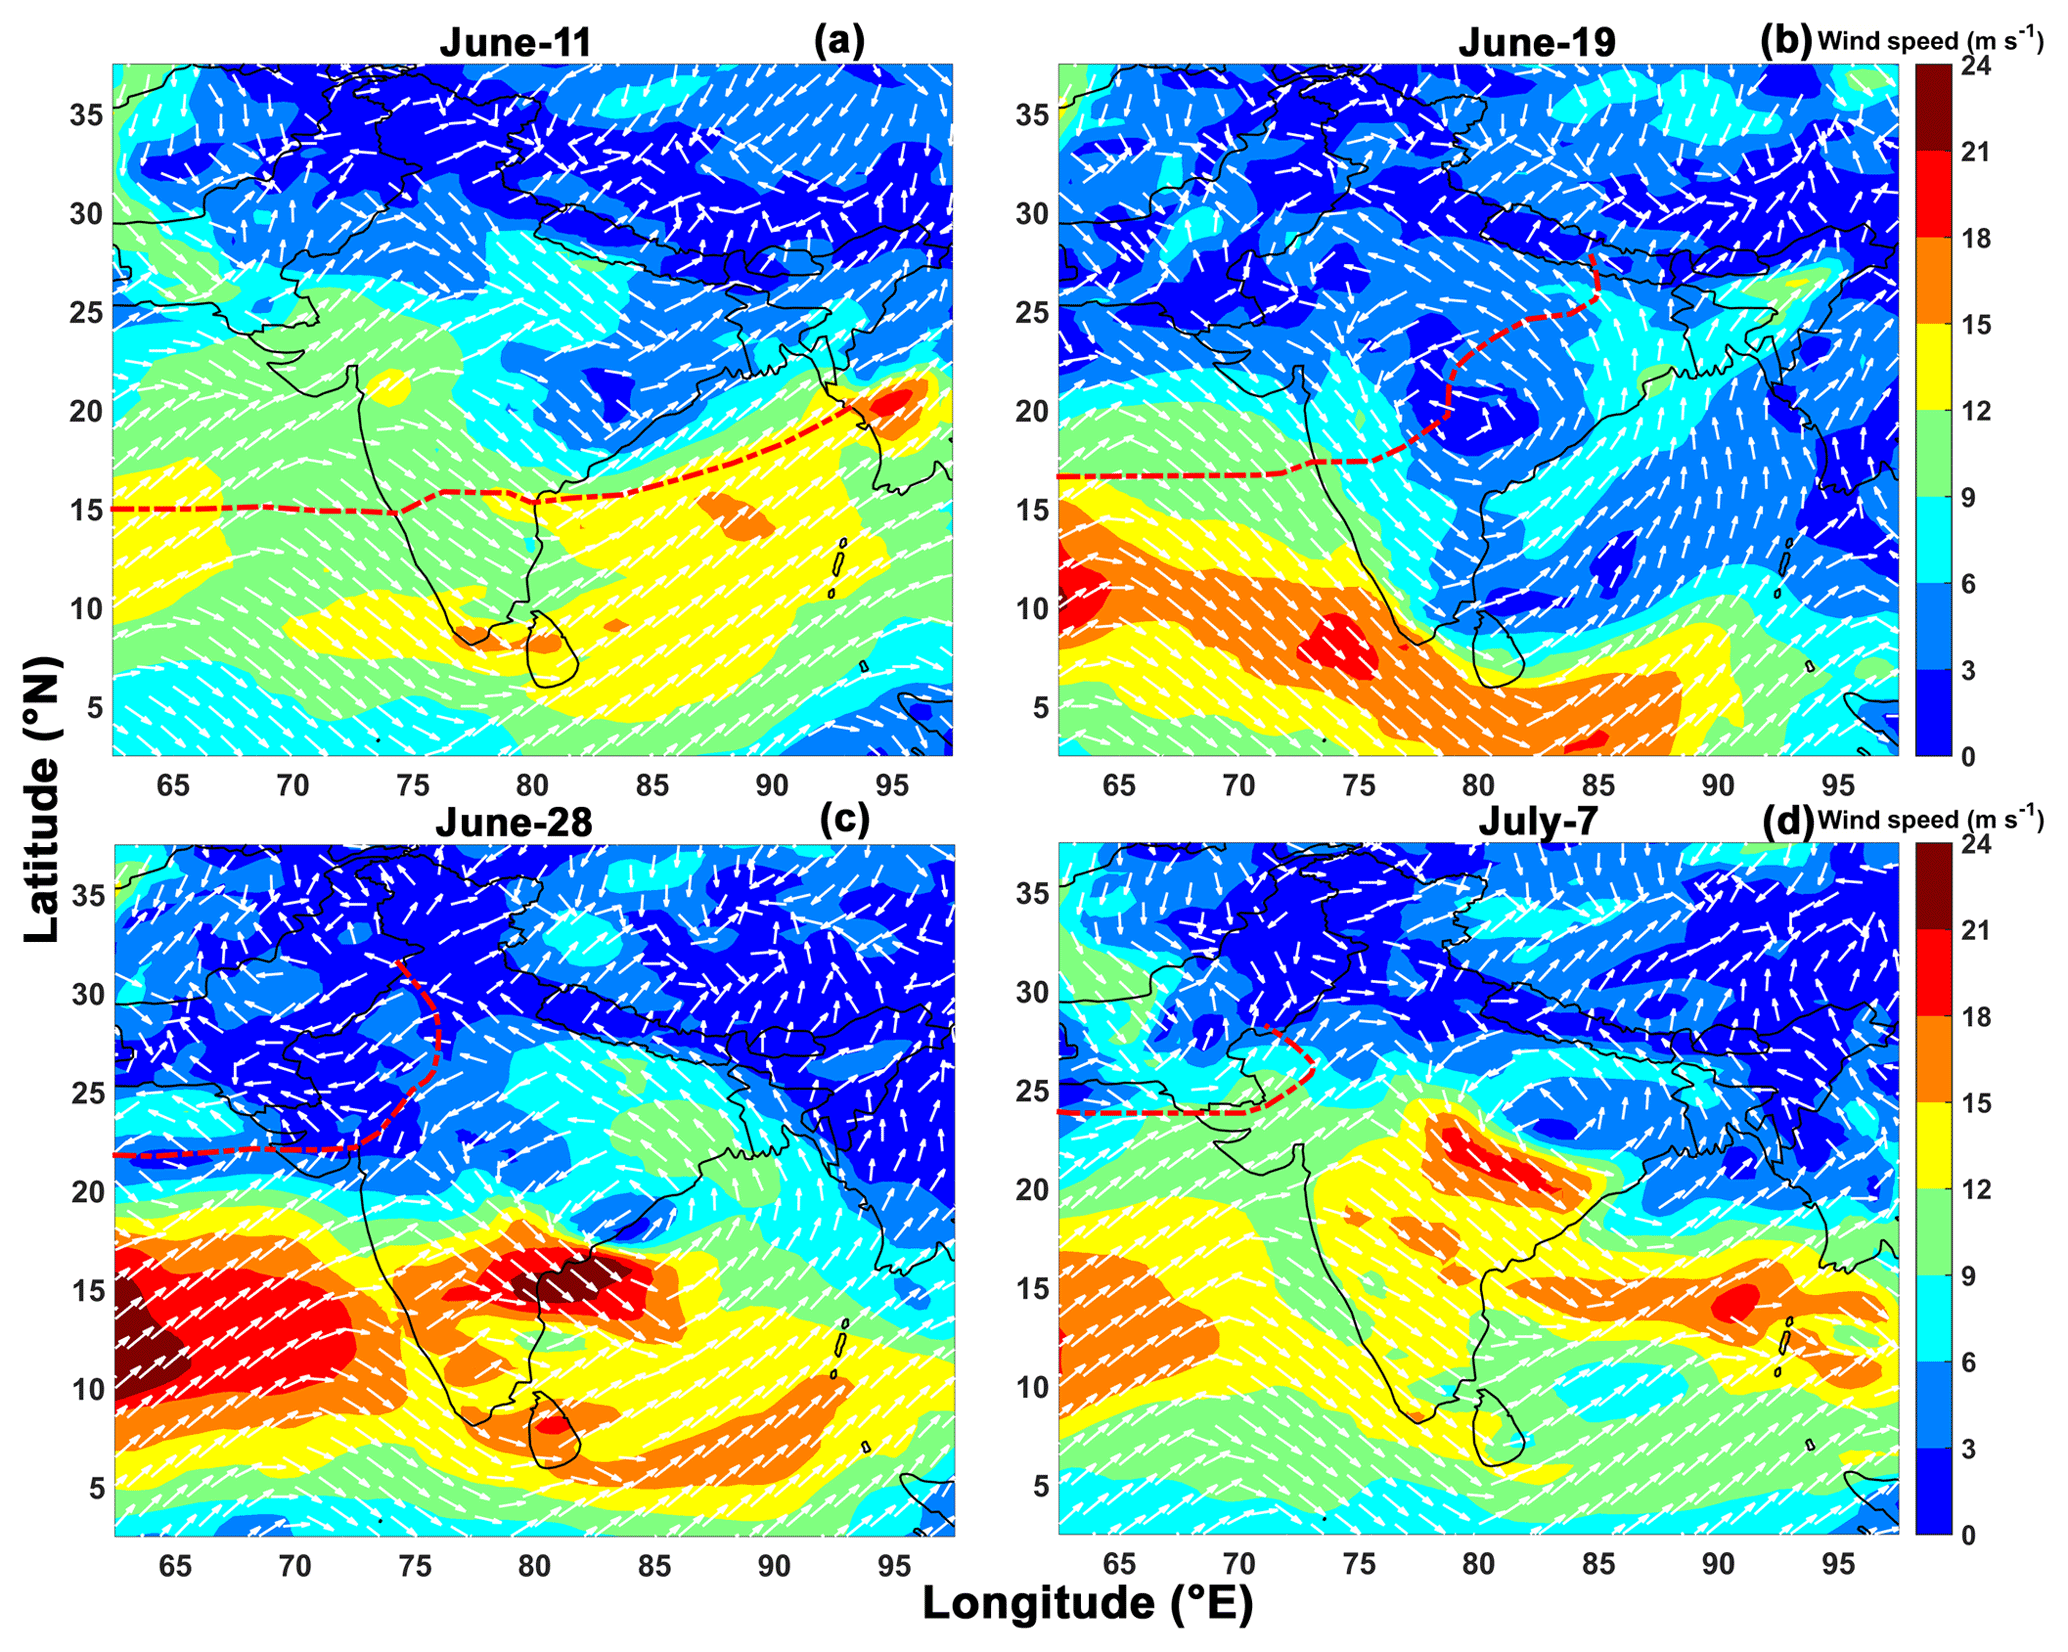
Figure 2The mean wind field at 850 hPa during different days of the campaign period (Dee et al., 2011), with colours representing the magnitude of the wind in m s−1. The arrows indicate the direction of the mean wind. The northernmost position of the monsoon trough for the day is shown by the dashed red line on each panel (data source: https://metnet.imd.gov.in/imdnews/ar2016.pdf, last access: 30 January 2020).
2.1 Synoptic meteorology during the campaign
The year 2016 experienced delayed monsoon onset, occurring at the southern tip of the peninsula on 8 June (instead of the normal date of 1 June). Following the delayed onset, the monsoon reached Nagpur and Lucknow by the 19 and 21 June respectively, and covered the entire Indian region only by 13 July (which normally climatologically happens towards the end of June). The advance of the south-west monsoon is shown in Fig. 1 (red line). Despite this delay, the rainfall for the season was near normal, about 97 % of the long-term average for the season (Purohit and Kaur, 2016). The mean wind field on selected days during the progression of the monsoon throughout the campaign period is shown in Fig. 2. The winds were strong at the start of the campaign (11 June) weakened by 19 June, picked up and reached peak values by 28 June and again weakened by 7 July. The rainfall during the season was close to the long-term average and had two long deficient spells of more than 10 d (Purohit and Kaur, 2016). The maximum rainfall was received during the first week of July with nearly 50 % excess rain during this period, mainly in central, eastern and north-eastern India.

Figure 3The vertical distribution of extinction coefficients (σext) and single scattering albedo (SSA) and the vertical distribution of scattering Ångström exponent (αsca) during the SWAAMI campaign are shown for five locations: Lucknow, Jaipur, Nagpur, Arabian Sea and Bay of Bengal. Data for both the pre-monsoon (a and b) and monsoon (c and d) periods are available only for Lucknow. The data available from Bhubaneswar were limited due to instrument failure during the pre-monsoon (Phase 1), and there were only poor data quality during the monsoon (Phase 3); these are hence not included in the discussion.
3.1 Vertical profiles of SSA and σext: spatial variation
The mean altitude profiles of extinction coefficient (σext), scattering Ångström exponent (αsca) and SSA and their spatial variation across the mainland and oceans, as well as temporal changes from just prior to the monsoon onset to peak monsoon activity are presented in the different panels of Fig. 3. Fig. 3a, c, e, g, i and k show the vertical distributions of σext (bottom axis) and αsca (top axis), while Fig. 3b, d, f, h, j and l show the vertical distribution of SSA. The y axes in all the panels represent the height in kilometres above sea level. Panels a–b and g–h represent the conditions just before the monsoon onset over central IGP (Lucknow) and central India (Nagpur) respectively, while the other panels show the features during the monsoon over central IGP (LCK, panels c–d), north-western India (Jaipur, panels e–f) and the oceanic regions of the Arabian Sea (panels i–j) and Bay of Bengal (panels k–l). Panels c–d show the features at LCK during peak monsoon activity and thus characterize mostly the changes brought about by the monsoon rains. The following results emerge.
-
There is a prevalence of strongly absorbing aerosol layers over most of the locations, as revealed by the low values (≤0.9) of SSA. Profiles of SSA show sharp decrease in the altitude ranges 1–2.5 and 1.5–3 km respectively over Lucknow and Nagpur, especially just prior to the monsoon onset, followed by an increase at higher altitudes. In contrast, SSA over Jaipur (having the strongest influence of dust of all the regions in the figure) keep decreasing steadily with altitude up to 6 km reaching values <0.9 above 5 km. An elevated layer of enhanced absorption is observed over the Arabian Sea near 2 km, while a highly absorbing aerosol layer is observed over the Bay of Bengal at around 1 km and between 3 and 4 km, with SSA going as low as 0.7. Such strongly absorbing aerosol layers at higher altitudes could have stronger implications for aerosol cloud interactions and monsoons, besides indirect atmospheric warming due to absorption of radiation, above low-level monsoon clouds.
-
In general, a sharp decrease in the extinction coefficient, σext, is observed over the entire Indian region with increase in altitude. Over the oceanic regions of the Arabian Sea and Bay of Bengal, an increase in extinction is observed above 2 km, attributed to elevated layers of aerosols. These layers appear to be stronger over the Arabian Sea than over Bay of Bengal. In general, highest values are observed within 3 km from the surface where the aerosol abundance is greater.
-
The scattering Ångström exponent (αsca) indicates a decline in the relative dominance of fine-mode particles at altitudes above 2 km over the entire region (αsca<1). Over the central Gangetic Plains (LCK) strong accumulation abundance is indicated closer to the surface (below 1 km).
-
During the active phase of the monsoon, higher αsca values occur in the entire profile over Lucknow, (Fig. 3c) suggesting the wet removal of coarse particles by rain.
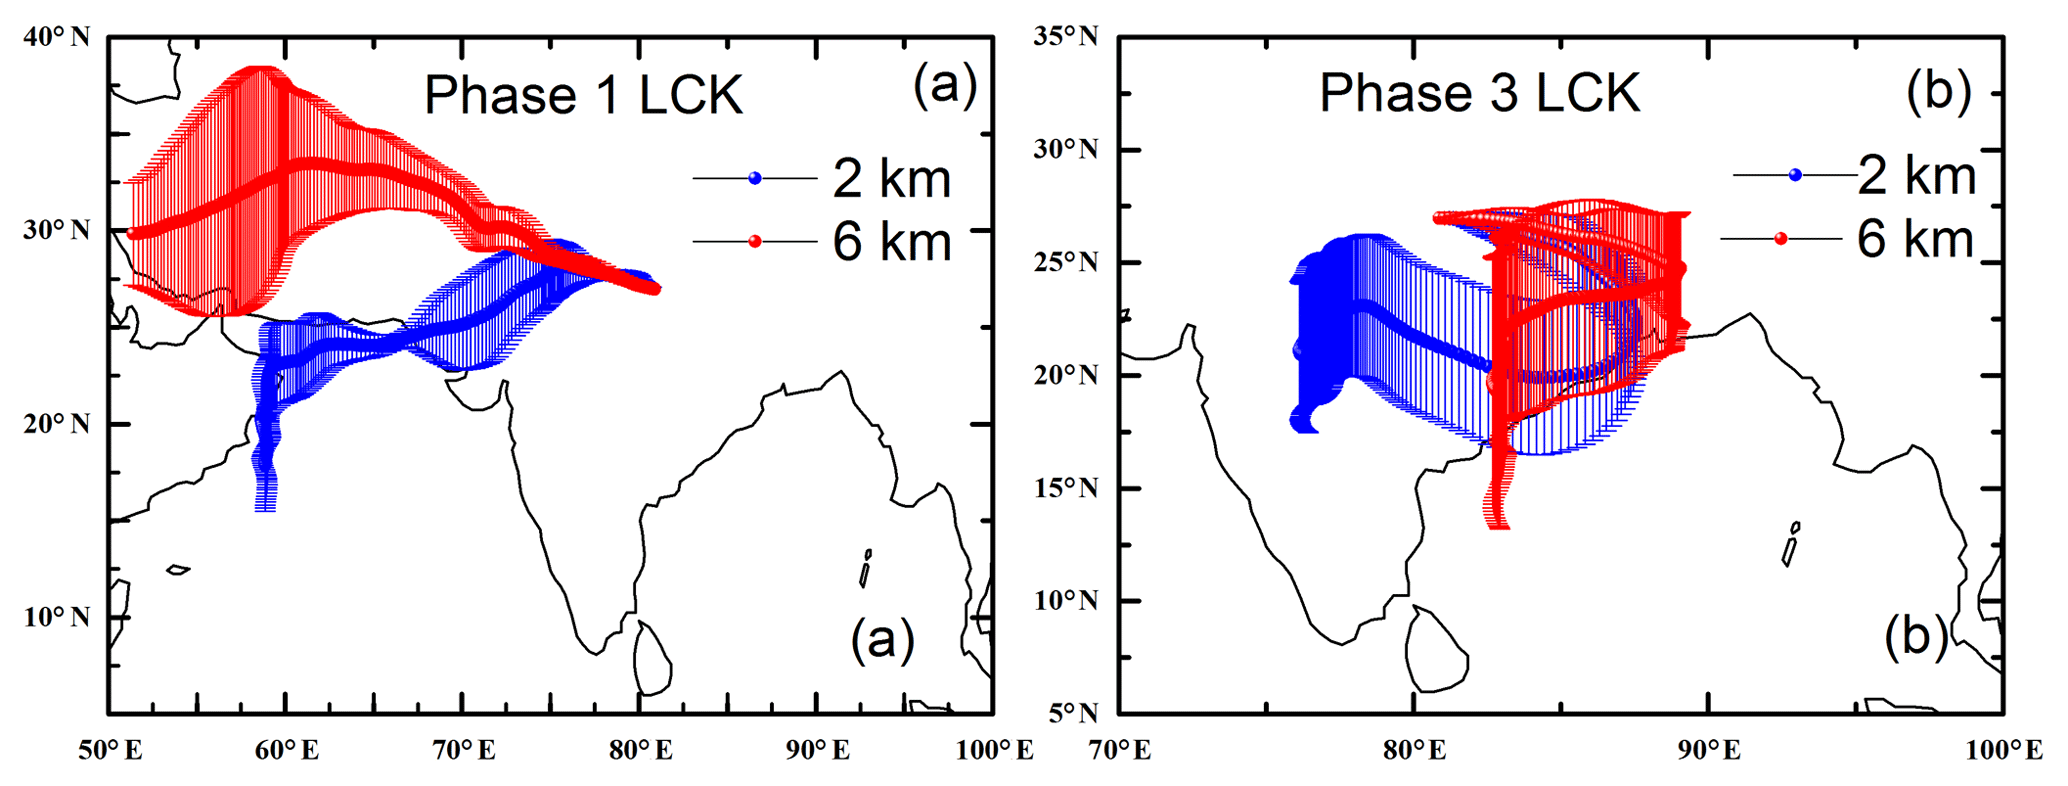
Figure 4Back-trajectories showing the distinct air masses reaching Lucknow during the (a) pre-monsoon period and the (b) monsoon. The altitude indicates the height above sea level at which the air mass reaches the receptor site.
Looking more closely into the details, we see the presence of a strongly absorbing region (layer) over central IGP (represented by Lucknow) at the altitude of 1 to 2.5 km (marked by a dashed oval in Fig. 3b) just before the onset of the monsoon, where the SSA drops to as low as 0.7 from its nearly steady higher values (∼0.93) below. Above this region, the SSA increased steadily to reach ∼0.97 above 5 km. Notwithstanding this, the extinction coefficient decreased rather monotonically from >100 Mm−1 near the surface to reach ∼20 Mm−1 near 5 km. The variation of αsca with altitude indicates the abundance of submicron-mode particles (1.2 ) in the strongly absorbing layer in the altitude range of 1 to 2.5 km, and a decline in the fine-mode dominance above and below this altitude. The 7 d back-trajectories (Fig. 4a) arriving at 2 km (absorbing layer) and 6 km (weaker absorption) over LCK show distinctively different source region influences, respectively from the Persian Gulf, across the northern Arabian Sea, passing across the Thar Desert and from the northern regions of the Middle East. The mineral dust aerosols from the Gulf regions and the Thar Desert, and the alluvial soil over the IGP are known to have higher absorption (Moorthy et al., 2007) due to higher hematite content (Chinnam et al., 2006) in the soil and appear brown compared to the more white African dust. These are also of finer size. This might be, at least partly, responsible for the observed lower SSA and higher αsca in this layer. Additional possibilities are mixing of the absorbing dust (with high porosity) with locally emitted absorbing species such as BC. During peak monsoon activity (Fig. 3c) the same region shows a rapid depletion of aerosols above 3 km. Even within the first 3 km, aerosols are now far less absorbing (Fig. 3d) with SSA hovering around 0.9, until 2.5 km. The decrease above could be at least partly due to the very rapid decrease in the extinction coefficient due the depleted aerosol concentration. Interestingly, this region is dominated by submicron aerosols, of αsca>1.5, throughout the column up to ∼2.5 km during the monsoon, showing probable washout of coarse-mode aerosols by the monsoon rains. Airborne measurements during CAIPEEX has shown cloud base altitude in the range of 0.65 to 1.17 km in the IGP, with a large vertical extent (Konwar et al., 2012). There is a large shift in the back-trajectories arriving at 2 and 6 km over LCK (Fig. 4b) during this period. They are almost confined over the Indian landmass, with little advection of mineral dust from the west, and hence are conducive for advection of anthropogenic aerosols (mostly produced locally) to the receptor site leading to fine-mode dominance (αsca>1.5) over this region. Based on airborne measurements, Babu et al. (2016) reported a columnar (up to 3 km altitude) mean SSA of 0.86 at 520 nm over Lucknow during the pre-monsoon period, while we observed an SSA of 0.83±0.08 at 550 nm (for the altitude range of 0–3 km for the same season).
Above the central Indian region (Nagpur, Fig. 3h), the broad features of the vertical profile of SSA observed over the IGP prior to monsoon onset recurred, although with some differences. It is important to note that even at Nagpur, the profiling took place just prior to the monsoon onset there, which occurred only by 19 June (Fig. 1). While the main features of the profile (higher SSA closer to the ground, an elevated layer of absorbing aerosols above the boundary layer where the SSA drops to lower values followed by a rapid increase to higher altitudes) remained quite similar, the magnitudes were higher than those seen over the IGP. Near the surface (within the boundary layer) a uniform SSA of 0.95 is seen, extending up to almost 2 km, above which there is a layer of reduced SSA (∼0.89) extending up to 3 km. Above that, SSA increases rapidly, approaching values as high as 0.98 at 5 km altitude. The column-integrated SSA (up to 5 km) increases from 0.88±0.08 at LCK to 0.93±0.02 at NGP suggesting an overall change to predominantly scattering aerosols as we move southward of the IGP. Similarly, the magnitudes of the extinction coefficients near the surface are lower than those seen over the IGP (Fig. 3g), decreasing more slowly with altitude and becoming comparable to the IGP values above around 4 km. The scattering Ångström exponent shows values remaining consistently below 1.0. Furthermore, αsca decreases with increase in altitude, reaching values as low as 0.5 at around 5 km, showing very small fraction of submicron aerosols in the composite aerosol system. The back-trajectories (Fig. 5) show strong marine aerosol advection in the lower altitudes (1.5 km), while aerosols advected from Persian Gulf passing over the northern Arabian Sea influence the 2–3 km region, which shows enhanced absorption. Above that (at 4 km) the influence of the Thar Desert becomes significant, the influence of marine aerosols become negligible and the SSA values become comparable to that at LCK. This is the region where there is significant coarse-mode dominance (αsca∼0.5) and high values of SSA (∼0.95). The trajectories reaching NGP at 5 km trace back to the northern Indian landmass and the SSA values are again comparable to those observed over LCK at this altitude.
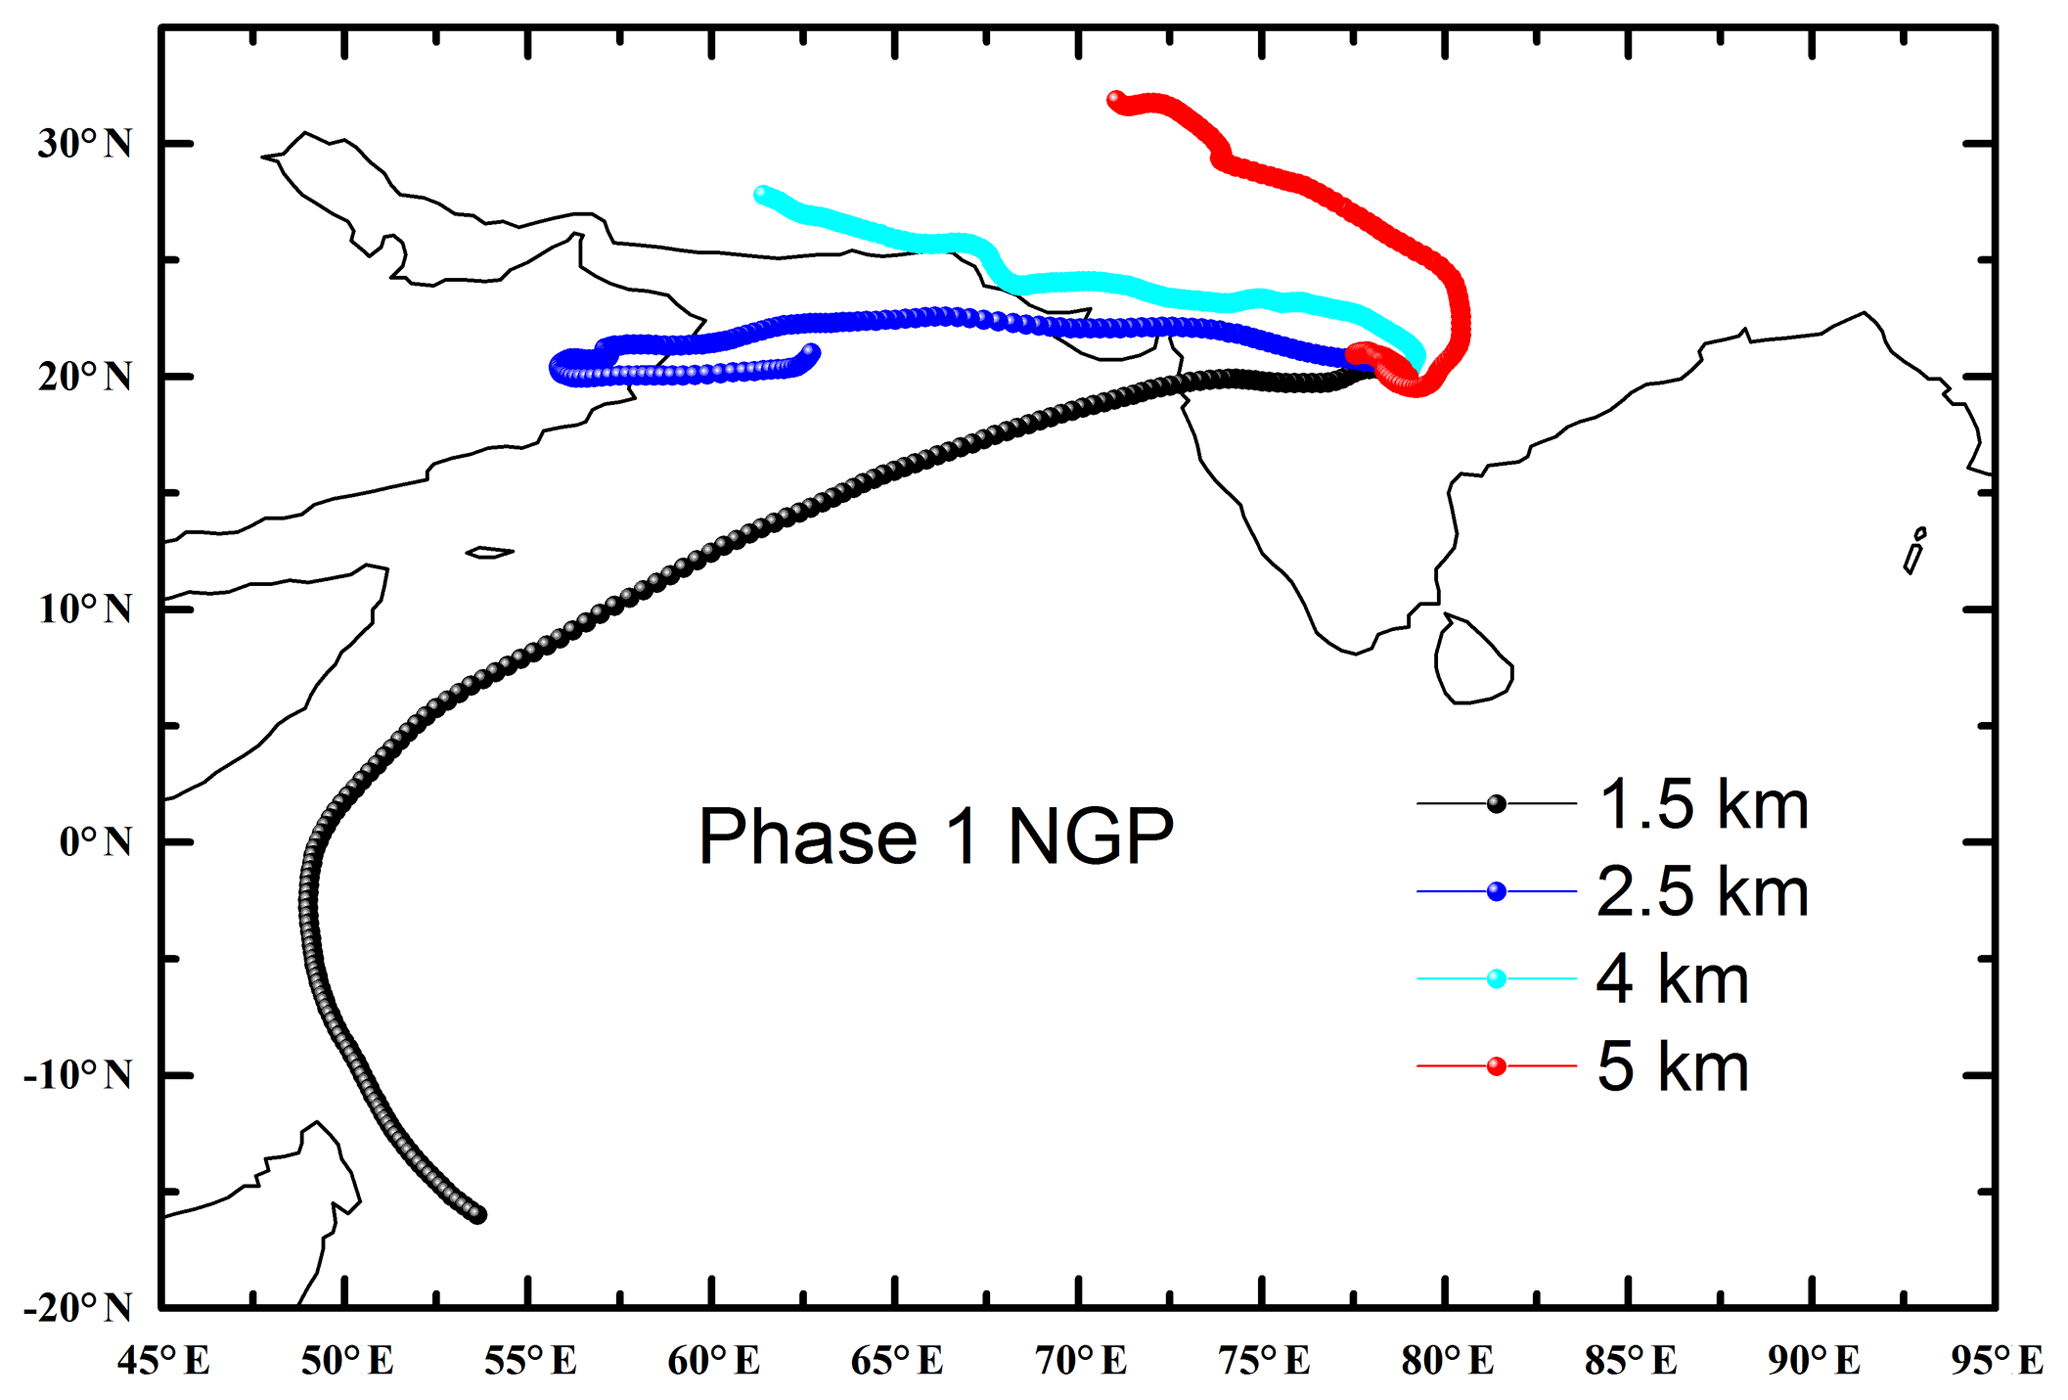
Figure 5Back-trajectories showing the distinct air masses reaching Nagpur during the period of observation. The altitude indicates the height above sea level at which the air mass reaches the receptor site.
By the start of Phase 2, which mainly covered the oceanic regions on either side of the peninsula (Arabian Sea to the west and Bay of Bengal to the east), monsoon winds were fully established over the regions and rainfall covered the entire domain. The measurements in this phase were limited to ∼4 km a.s.l. partly due to the focus on cloud characteristics during this period and partly due to the poor quality of data above this altitude due to extensive cloudiness.
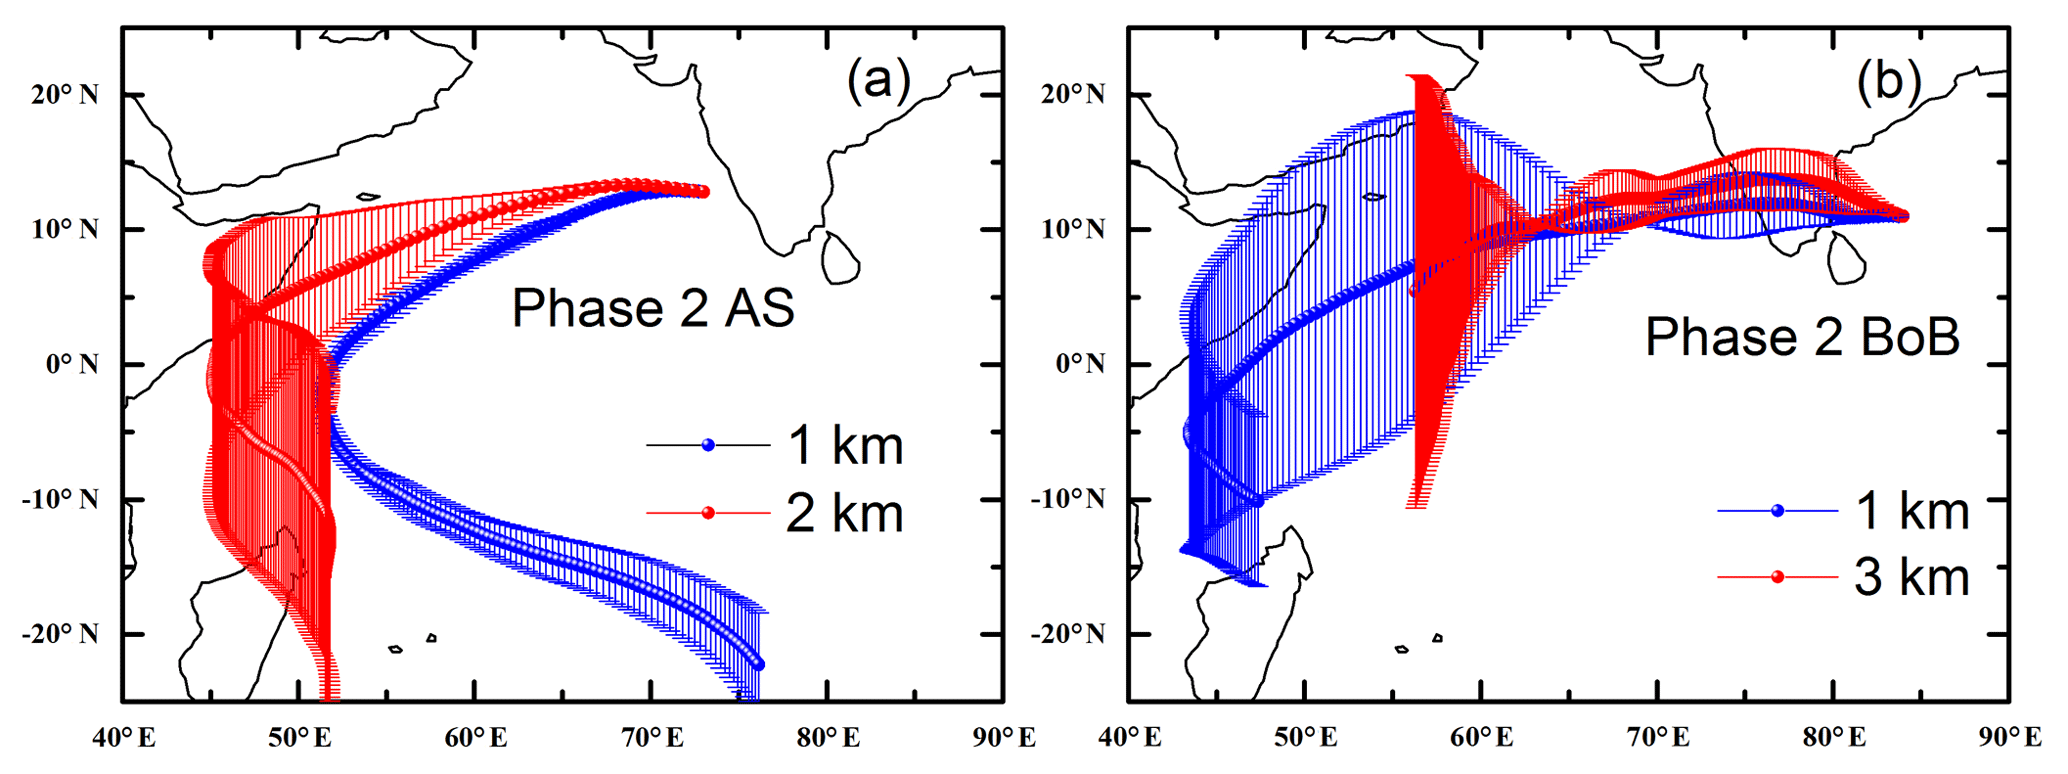
Figure 6Back-trajectories showing the distinct air masses reaching (a) Arabian Sea and (b) Bay of Bengal during the period of observation. The altitude indicates the height above sea level at which the air mass reaches the receptor site.
The vertical structure of extinction and SSA show distinctive differences over the two oceans, primarily attributed to the differences in the advected components. Over the Arabian Sea, the aerosols near the surface are almost entirely scattering in nature (SSA very close to 1, Fig. 3j). The SSA decreases towards higher altitudes, with a well-defined and strongly absorbing layer occurring between 1.5 and 2 km, where the SSA drops to as low as 0.8., followed by a gradual increase to reach ∼0.95 at 4 km, indicating prevalence of absorbing aerosols aloft. This feature is quite similar to what was seen over the IGP (LCK), except that the SSA values are slightly higher over the ocean, probably due to absence of local emissions of absorbing species such as BC or fine dust and the presence of sea-salt. However, most important to note is the perseverance of the rather strongly absorbing layer in the altitude range of 1.5 to 3 km over the entire region (IGP, central India and Arabian Sea), in which the particles are more coarse in nature as revealed by the lower value of the Ångström exponent (values ∼0.6 within the first 2 km range, while the values decrease to ∼0.5 near the 2–3 km region where the lowest values of SSA are observed). The values again increase to ∼0.6 above this region. Examining the back-trajectories over this region (Fig. 6a), it is interesting to note that those arriving at 2 km altitude (where the strongly absorbing layer is seen) pass across the Somali and Horn of Africa regions, where the absorption efficiency of dust has been observed to be very high (Deepshikha et al., 2005). For the SSA at 500 nm over New Delhi (which also lies in the IGP), both desert dust and anthropogenic aerosols have been shown to decrease from 0.84 in March to 0.74 in June (Pandithurai et al., 2008). Similar values of SSA were also reported by Ge et al. (2010) for Zhangye, north-west China (a semi-arid area), where the mean SSA at 500 nm was reported to be 0.75±0.02 in April–May.
Over the BoB (Fig. 3k), the most striking feature is the low values of SSA (0.9) even near the surface, which are in sharp contrast with Arabian Sea having an SSA of ∼0.98 near the surface. There are two absorbing layers: one just below 1 km (SSA∼0.8) and another strongly absorbing layer above 3 km (SSA∼0.7), with higher values (SSA∼0.9) in between. The extinction coefficient (Fig. 3j) decreased from ∼45 Mm−1 at the surface to a lowest value of ∼15 Mm−1 at 2 km above which σext values sharply increase to ∼30 and remain more or less constant (weak decrease) above this altitude. The αsca remains <1, indicating the dominance of coarse-mode particles throughout the column. The values are close to 1 near the surface, while the lowest values (αsca∼0.6) are observed in the 2–3 km range, again within the layer of strong absorption as seen in the earlier cases. Again the αsca values increase to ∼1 above 3.5 km where an absorbing layer is observed (SSA of ∼0.7). It is interesting to note that the back-trajectories (Fig. 6b) reaching this region at 1 km originate close to the Persian Gulf region. Coincidentally, low SSA was observed (near 2 km) over the Arabian Sea also when the trajectories originated from this region. It is likely that both these regions receive the same aerosol type from the same region. This is also supported by the occurrence of this layer at lower altitude (∼1 km) over BoB (compared to ∼2 km over the Arabian Sea) and with an extinction coefficient of a comparable magnitude. It is interesting to note that the elevated layer of a higher extinction coefficient (between 3.5 and 4 km) over BoB has similar properties to that seen over the Arabian Sea, but is less intense. These differences in the positions of the sharp decrease in SSA and decrease in the magnitude of the extinction coefficients are likely to be a result of washout by the extensive monsoon rains, aided by the sinking motion of air while reaching BoB. The role of the low-level monsoon jets across the Arabian Sea in maintaining the elevated absorbing aerosol layers over the whole of the southern peninsula has been reported recently by Ratnam et al. (2018).
Despite these linkages, on average the columnar and near-surface values of SSA over BoB remains much lower than that over the Arabian Sea. The column-integrated values of SSA over BoB and AS are 0.84±0.07 and 0.89±0.04 respectively during this campaign. This is perhaps the first time the vertical structure of SSA over oceanic regions around the Indian peninsula has been reported. However, a few shipboard measurements earlier (mostly in winter and in the pre-monsoon period) have shown that aerosols over BoB are generally more absorbing (lower SSA) than over the Arabian Sea, and also show a sharp north–south gradient (Nair et al., 2008; Satheesh et al., 2010). The SSA values reported by Nair et al. (2008) based on extensive cruise measurements during the pre-monsoon season are very close to our values near the surface. The back-trajectory analysis in Fig. 6b shows significant advection across the peninsular landmass at lower levels, supporting higher extinction coefficients and lower SSA. The αsca values in the range of 0.5–0.8 suggest that the relative dominance of fine-mode particles is weak over this region, and the σext values are found to increase when air masses arrive from continental regions. The additional continental input as the air mass transits across the peninsula is likely to lead to the lower SSA over BoB, consistent with several previous shipboard measurements (Nair et al., 2008; Babu et al., 2012).
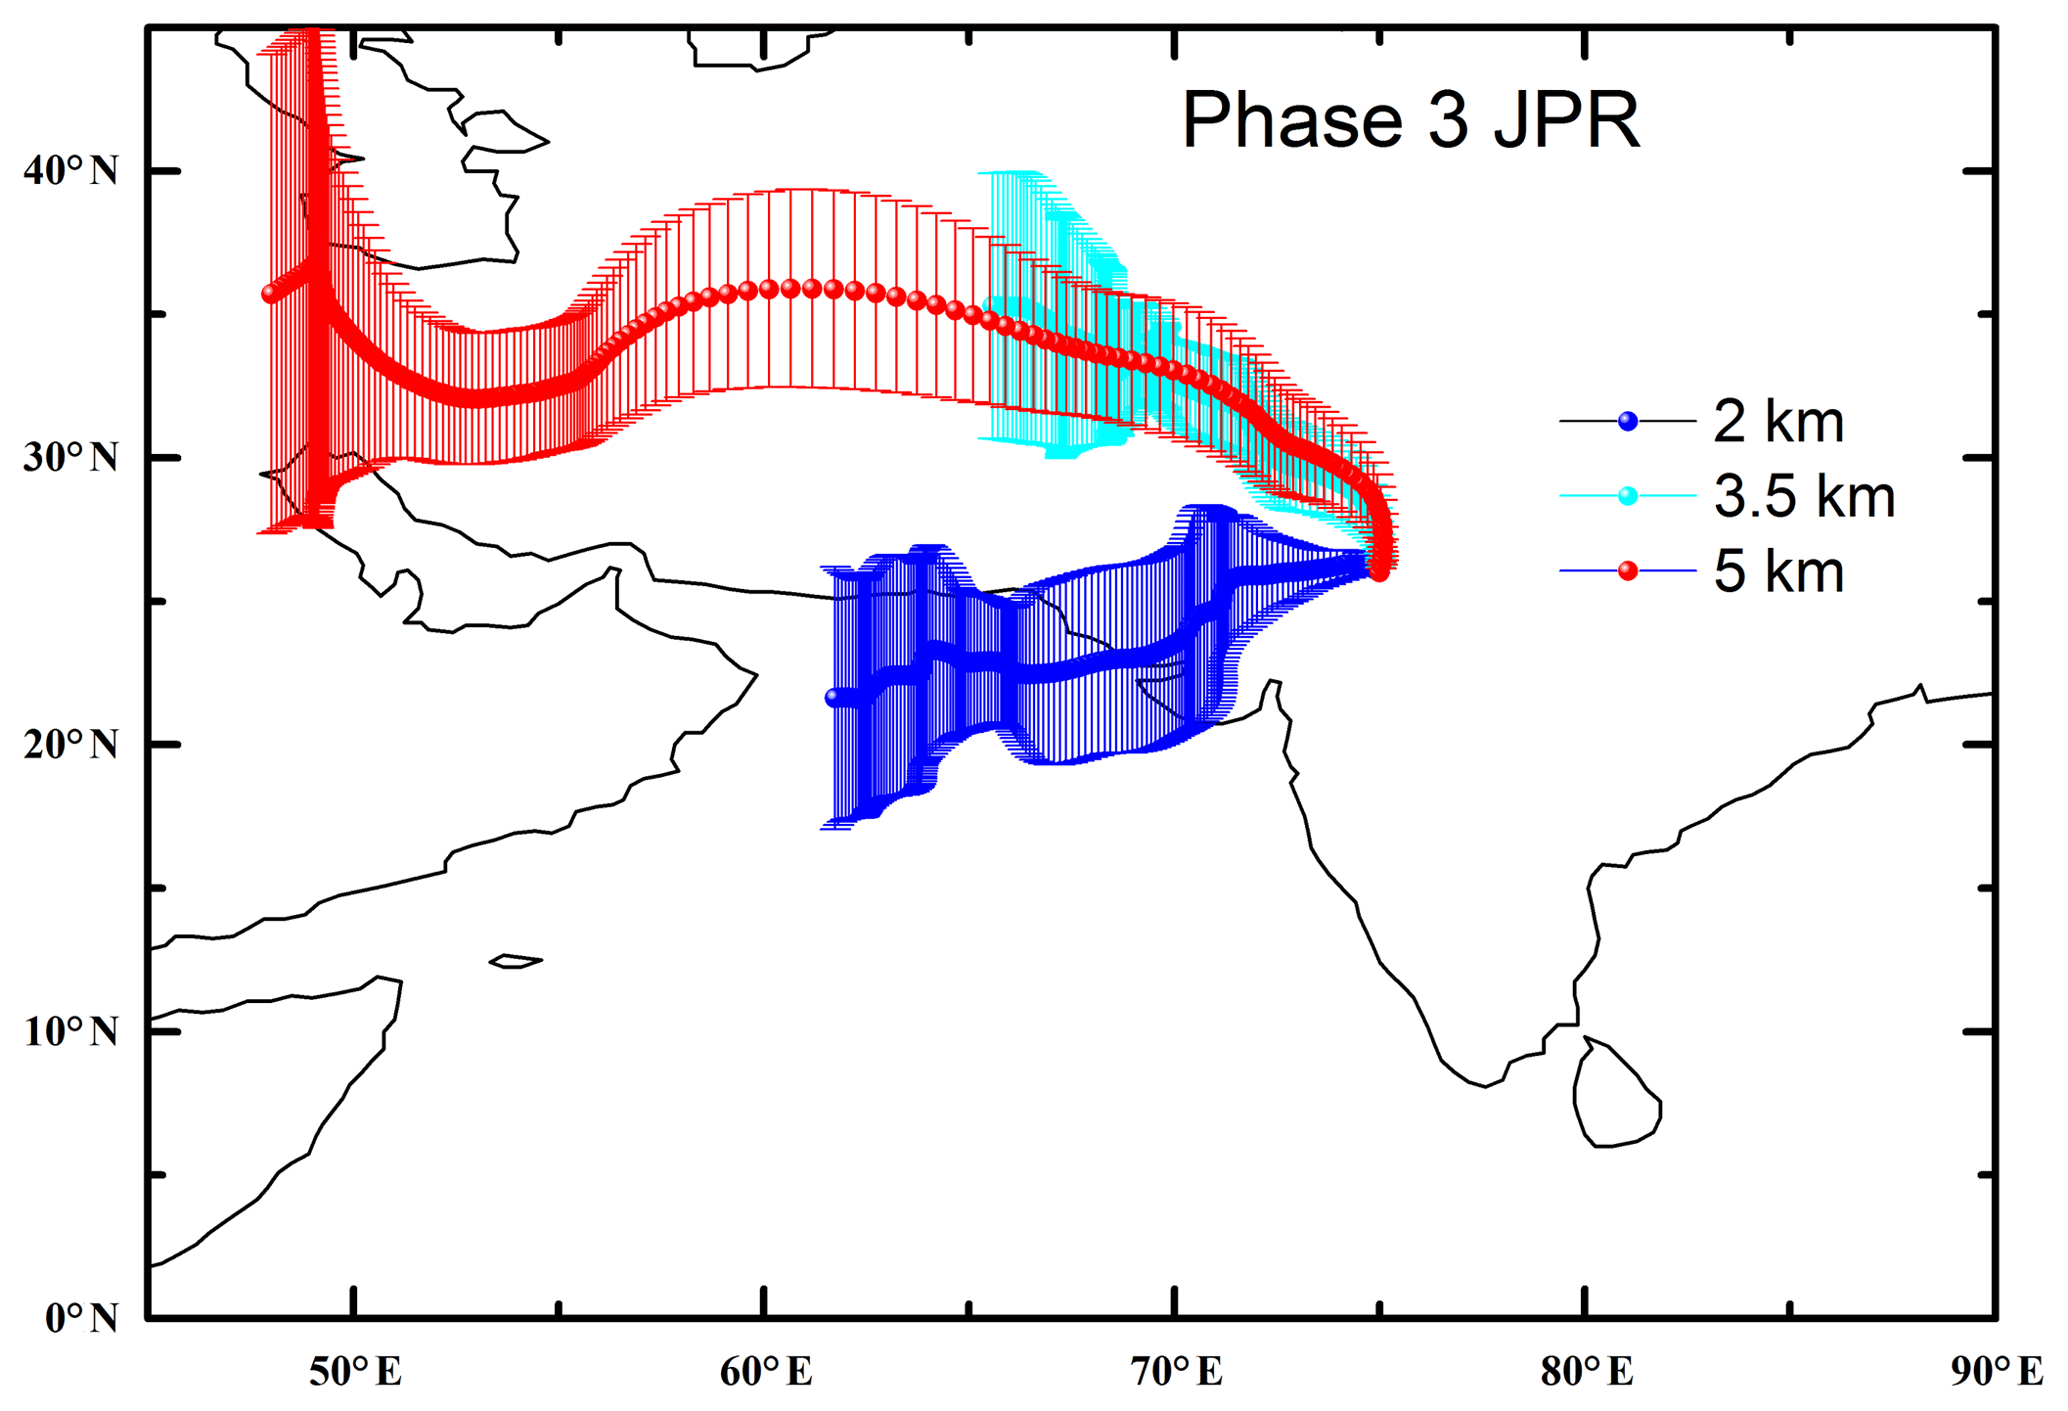
Figure 7Back-trajectories showing the distinct air masses reaching Jaipur during the period of observation. The altitude indicates the height above sea level at which the air mass reaches the receptor site.
During the final phase (Phase 3) of the campaign when the Indian monsoon was in its active phase, in July, the measurements were repeated over the IGP at locations near Jaipur (JPR) and Lucknow (LCK). Jaipur is located in north-west India, characterized by arid/semi-arid terrain and is weakly influenced by the monsoon, while LCK is now well within the monsoon trough region. The vertical variation of SSA over JPR still shows the presence of absorbing aerosols (mostly dust), with SSA decreasing gradually from its value close to 0.95 near the surface to ∼0.88 at 6 km altitude, with a weak dip around 3.5 km where SSA goes down to ∼0.85 (the shape resembles the IGP profile prior to the onset of the monsoon, but the magnitudes are higher). The back-trajectories (Fig. 7) show two distinct branches with one arriving from the north-west from the continental region or from the northern Arabian Sea, and another from Southeast Asia travelling across the IGP region. The low values of αsca(<1) show again the low concentrations of fine-mode aerosols over this region at all altitudes up to 7 km. At Lucknow, as stated earlier, significant washout leads to very low extinction above 3 km, where the replenishment is slow. At the lower altitudes, the SSA has increased compared to the pre-monsoon with values remaining around 0.9 up to 2 km and decreasing thereafter to less than 0.8 at 3 km.
In summary, all the measurements have revealed a vertical heterogeneity in SSA over the IGP, AS and BoB, with an indication of lower SSA (higher aerosol absorption) in the lower free troposphere (2 to 3 km), which would remain below the convective clouds during the pre-monsoon, but just above low-level clouds (cloud base around 1 km during the monsoon season; Konwar et al., 2012) during peak monsoon activity. The back-trajectory and spectral scattering suggest that these layers are dominated by (if not entirely due to) advected absorbing dust. Such absorbing layers at higher altitudes (below low-level monsoon clouds) are very important due to two processes: (1) amplification of absorption due to the reflective clouds underneath and (2) higher warming for the same amount of radiation absorbed, due to thinner air at higher altitudes. The radiative implications are examined below.

Figure 8The instantaneous aerosol forcing for selected profiles estimated for local noon and averaged for the locations is shown. The first two pairs of bars correspond to pre-monsoon measurements and the rest correspond to monsoon conditions.
3.2 Radiative forcing estimates using measured extinction and SSA profiles
The radiative effects were estimated using the measured vertical distribution of aerosol properties (σext, SSA) and atmospheric parameters (pressure, temperature and water vapour) from six locations LCK, NGP, AS, BoB, Bhubaneswar (BBR) and JPR. The instantaneous atmospheric forcing corresponding to local noon was calculated. In most of the existing studies the aerosol forcing is estimated assuming a constant value of SSA throughout the atmosphere, and very often SSA values obtained from either near-surface measurements (Ganguly et al., 2005; Moorthy et al., 2009) or columnar SSA retrieved from sky radiance measurements (Dubovik et al., 2000; Choi and Chung, 2014) are used. However, these do not consider the vertical heterogeneity, which is important. To examine this aspect, we estimated the atmospheric radiative forcing due to aerosols (difference between the surface and top-of-atmosphere forcing) using the measured SSA and extinction profiles along with the concurrent atmospheric parameters (measured during the experiment) using the SBDART radiative transfer scheme (Ricchiazzi et al., 1998). We also evaluated the atmospheric forcing by replacing the SSA profile with a single SSA value, computed as the weighted average of the profile.
The results are shown in Fig. 8, in which the black bars represent the values estimated using the weighted-mean SSA and the red bars represent the values obtained using the measured SSA profiles. The uncertainty in the instantaneous atmospheric forcing for the cases shown in Fig. 9 is ∼4.2 W m−2. The magnitudes of the atmospheric forcing estimated with and without the use of SSA profiles are shown in Fig. 9. The atmospheric forcing estimates increased by ∼14.6 % (8.7 % to 24.09 %) on average, when using the measured SSA profiles. It can be clearly seen that, with exception of the Arabian Sea, the use of a single SSA value (even after weighting for vertical variation) results in forcing estimates that are lower by 2–6 W m−2 than the estimate making use of the actual SSA profile, with higher differences over the IGP. As the monsoon progresses to its active phase, atmospheric forcing decreases significantly by as much as 10 W m−2 from the values that persisted just prior to the monsoon onset. Nevertheless, the forcing is significant over the IGP with the monsoon values at LCK being nearly the same as the pre-monsoon value over NGP. However, most interestingly, the pattern is significantly reversed over the Arabian Sea, with a higher forcing value when a constant SSA is used. It has to be recalled that this location has absorbing aerosol layers at high altitudes and also high values of extinction coefficients (higher than that near the surface) at higher altitudes.
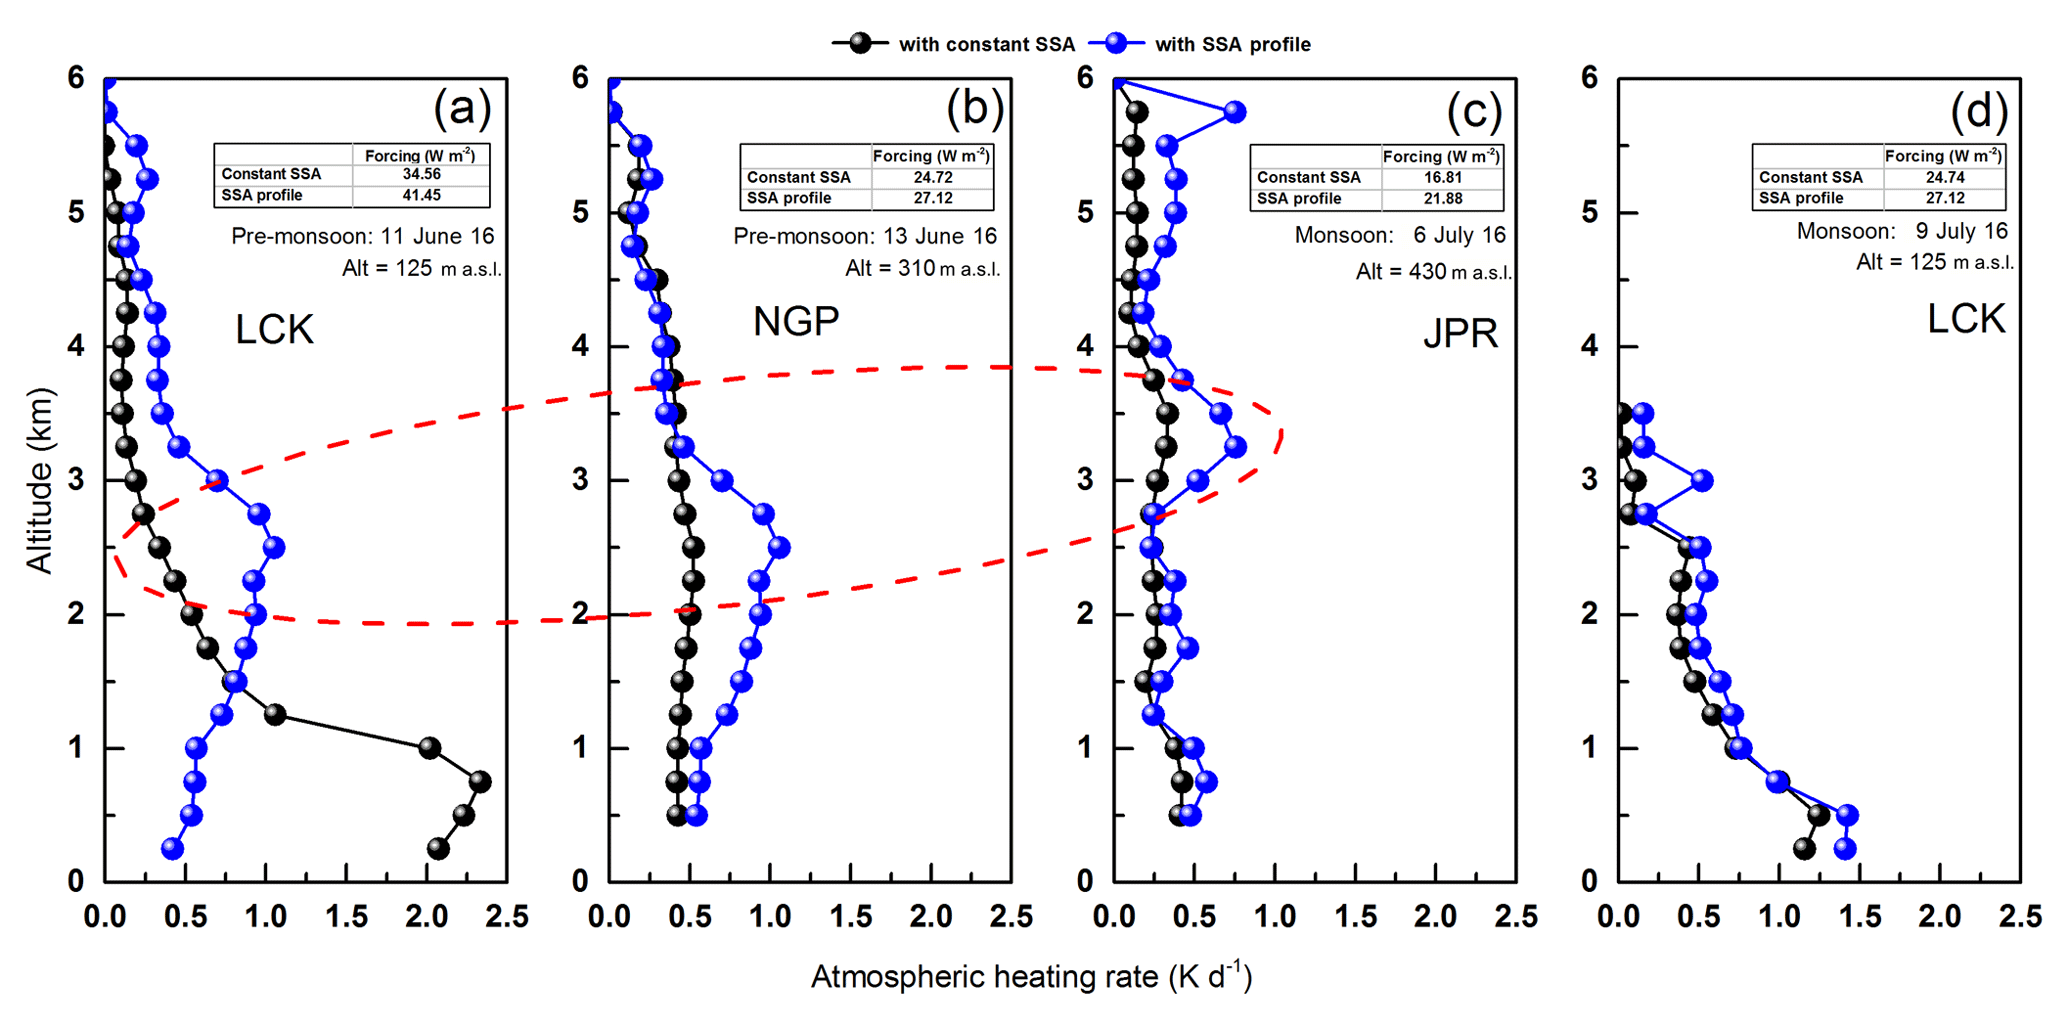
Figure 9Equivalent heating profiles (corresponding to local noon) for central IGP (a) and central India (Nagpur, b) just before the monsoon onset and profiles during the active monsoon phase in the western IGP (Jaipur, c) and central IGP (Lucknow, d). The black lines joining the black spheres represent the heating rate profile estimated using altitude-resolved extinction coefficients and columnar SSA, for the realistic atmosphere (measured pressure, temperature and water vapour) in the RT computation, while the blue lines joining the blue spheres represent the heating rate profile altitude-resolved SSA values, used in place of columnar values. The occurrence of the elevated layers of enhanced aerosol heating of the atmosphere is clearly seen in the latter case, emphasizing the importance of using realistic SSA profile. It is also interesting to note that the enhanced heating occurs at cloud layer altitude.
3.3 Estimation of heating rates and their vertical profiles
To examine the possible effects of the elevated aerosol layer and elevated heating on atmospheric heating rates, we have estimated the vertical distribution of the aerosol-induced atmospheric heating rate for all the locations, using height-resolved SSA and a constant weighted-mean SSA. The aerosol-induced heating rates were calculated as
where g is the acceleration due to gravity, Cp is the specific heat capacity of air at constant pressure and ΔF and ΔP are the aerosol-induced layer forcing and change in pressure between the top and bottom of the layer respectively.
The estimated heating rate profiles for the locations Lucknow, Nagpur and Jaipur are shown in Fig. 9. The black lines represent the cases where mean SSA is used, and the blue lines represent the cases where the SSA profile is used for the heating rate estimation. Figure 9a and b represent the heating rate profiles prior to the monsoon onset, while Fig. 9c and d represent the heating rates profiles during the active phase of the monsoon. The striking feature revealed is that the elevated heating layers which exist during both the pre-monsoon and monsoon periods, when the height-resolved measured SSA has been used, are totally absent when a single weighted-mean SSA was used (despite both being location and season specific). This implies that wherever the weighted-mean SSA is greater than the height-resolved (actual) SSA, there is an underestimation in the layer heating and vice versa. Hence, the heating induced by elevated absorbing layers would not be captured properly by simply using extinction coefficient profiles and a single SSA value, even if it is station and season specific. Hence, it emerges that the higher forcing over the Arabian Sea when a single SSA value is used (in contrast with other locations) is due to the high extinction coefficients at higher altitude (Fig. 3i) and the low SSA at high altitude (Fig. 3j). While using the profiles of σext and SSA, the region where the SSA is lower does not show a significant increase in heating due to low σext, while the region where σext is high has less heating due to high SSA. This very clearly emphasizes the importance of using height-resolved extinction coefficients and SSA for improving the atmospheric heating due to aerosols and assessing their climate implications.
Similarly, from Fig. 9a it can be seen that the high heating rate below 1 km, which resulted from using the weighted-mean SSA in the region where high extinction coefficients were present (Fig. 3a), instead of using realistic SSAs, which when used produce much higher heating rates (blue line). Using the realistic SSA results in the peak in the heating rate occurring close to 2 km where the highly absorbing elevated layer was present. A similar peak coincident with the absorbing layer above 2 km (Fig. 3h) is also seen in NGP (Fig. 9b). At JPR (Fig. 9c) and LCK (Fig. 9d) we also note an enhancement in the heating rate close to the absorbing layers. The observed heights of peak heating rates match well with those reported to have a peak in the extinction coefficient by Satheesh et al. (2009) for the pre-monsoon season. Using modelling studies Kuhlmann and Quaas (2010) also obtained a peak shortwave heating rate in the 2–4 km range in the IGP region; however, their estimates were much smaller in magnitude than those seen in this study. It has to be noted that in cases where a single SSA value is used, the heating rates profiles would tend to show higher values at altitudes where extinction is higher, rather than where SSA is lower. The advantage of using SSA vertical profiles over the use of single SSA values is demonstrated in the Supplement (Fig. S2). At LCK it can be seen that during the pre-monsoon period more heating occurs at higher altitudes, while during the monsoon, higher values occur near the surface and are influenced by the near-surface absorbing aerosols arising from local emissions. Even so, during peak monsoon, a weak peak of elevated aerosol heating persists at around 3 km (Fig. 9d), which appears to be due to the advected dust that manifested as a stronger peak above 3 km at Jaipur during the monsoon (Fig. 7). Such elevated heating layers may well affect the water cycle dynamics and the surface energy feedback leading to strong impact on the Indian Summer Monsoon and would support the elevated heat pump hypothesis (Lau et al., 2006). The results from the Indian aircraft measurements (Vaishya et al., 2018), which culminated during Phase 1 of the FAAM, fall close to our observations for the western and central IGP; however, their measurements were limited to ∼3.5 km due to limitations with the aircraft being flown in unpressurized mode. The existence of a meridional gradient in SSA and atmospheric heating, increasing gradually from the northern Indian Ocean to central India and over both AS and BoB, has been reported by Satheesh et al. (2010). Using extensive shipboard measurements, Nair et al. (2013) have reported strong meridional and zonal gradients in aerosol induced heating rates over AS and BoB across the peninsular landmass (from <0.1 K d−1 over the south-western Arabian Sea, increasing to 0.5 K d−1 over the north-eastern Bay of Bengal), estimating the heating rate using a single SSA value. The lack of height-resolved measurements in these studies was recognized as a major gap area and SWAAMI made special efforts to close this gap as much as possible. Our study provides for the first time the vertical profiles of SSA and aerosol heating rate, their spatial variation across the Indian landmass and temporal changes during the evolution of monsoon. This information may be important in better modelling aerosol–cloud–monsoon interactions.
Vertical distributions of submicron aerosol properties at five locations Lucknow (LCK), Nagpur (NGP), Arabian Sea (AS), Bay of Bengal (BoB) and Jaipur (JPR) were studied in the period of June–July 2016 using in situ measurements made from an aircraft. This study depicts the spatial variations of aerosol properties over the Indian region immediately prior and during the onset of the monsoon. This is the first study where high resolution vertical profiles of SSA and extinction coefficients extending from the surface to ∼6 km have been used to estimate the aerosol radiative forcing over the Indian region. The major findings are given below.
-
Strongly absorbing aerosol layers prevailed over the Indian region throughout the campaign period. These layers were mostly observed in the 1–3 km region, over the Indian mainland and the surrounding oceans. On average, a drop of ∼0.2 was observed in the submicron aerosol SSA values near these absorbing layers, which were associated with long-range transport of aerosols from the Middle East and Thar Desert.
-
During the monsoon period, large spatial variation was observed in the SSA over the Indian region. In the central IGP (LCK), the near-surface SSA was lower compared to the western IGP (JPR), revealing an east-to-west gradient in the SSA over this region.
-
The relative dominance of fine-mode aerosols declined (αsca<1) above 2 km over the entire Indian region indicating significant influence of dust. Following the monsoon onset, dust transport over LCK declined (αsca increased), while dust aerosols continued to dominate over JPR. It was also observed that the coarse-mode aerosols over JPR extended up to 6 km even during the monsoon period, asserting the rather minor influence of the monsoon at removing aerosol in this region. As a result, a steady decrease in the SSA values with increasing altitude was observed over JPR during the monsoon.
-
Meanwhile, over the oceanic region, near-surface SSA values over the BoB were lower compared to those over the AS, conforming to earlier studies. We found that the low values of SSA were not restricted to lower altitudes, but extended throughout the column.
-
The observed absorbing layers have a significant influence on the regional radiative balance. The use of SSA profiles to estimate the aerosol forcing revealed significant differences (2–6 W m−2) in the forcing estimates compared to those obtained by using constant SSA.
-
The atmospheric heating rate profiles revealed an underestimation of the heating rates in those layers where the measured SSA was lower than the average value and vice versa. The magnitude of the difference in the estimated heating rates in each layer also depends on the extinction coefficients of these layers. This difference becomes significantly large if low SSA and high extinction coefficients coexist in these atmospheric layers. While the maximum heating rates in the absorbing layers (near 3 km) can be as high as 1 K d−1, the underestimation in these layers can be greater than 0.5 K d−1. Such large elevated warming layers have significant climate implications as they can perturb the monsoon onset through their impact on atmospheric stability. Incorporating such realistic aerosol profiles into climate models will significantly reduce uncertainties in modelled climatic impacts.
Processed data are available through the SWAAMI and parent FAAM archives at the Centre for Environmental Data Analysis (CEDA) (http://data.ceda.ac.uk/badc/faam, last access: 31 January 2020).
The supplement related to this article is available online at: https://doi.org/10.5194/acp-20-4031-2020-supplement.
SKS, KKM and HC together conceived of the experiment; MRM and HC participated in the field campaign. MRM carried out the scientific data analysis and prepared the draft of the manuscript. KKM and SKS were involved in the scientific interpretation of the results, leading to the formulation of the manuscript, and along with HC reviewed and revised the manuscript.
The authors declare that they have no conflict of interest.
This article is part of the special issue “Interactions between aerosols and the South West Asian monsoon”. It is not associated with a conference.
A number of institutions were involved in logistics, planning, and support of the campaign: the Indian Institute of Science, Vikram Sarabhai Space Centre, University of Reading and the Met Office, UK. We gratefully acknowledge support from all. We also thank the Facility for Airborne Atmospheric Measurements (FAAM) and Airtask, who manage and operate the BAe-146 atmospheric research aircraft. We thank Divecha Centre for Climate Change for the support. ERA-Interim wind field data were provided courtesy of ECMWF. Sreedharan Krishnakumari Satheesh acknowledges the support of the JC Bose Fellowship from the Department of Science and Technology, New Delhi.
This research has been supported by the Ministry of Earth Sciences (grant no. MM/NERC-MoES-1/2014/002).
This paper was edited by B.V. Krishna Murthy and reviewed by two anonymous referees.
Anderson, T. L. and Ogren, J. A.: Determining aerosol radiative properties using the TSI 3563 integrating nephelometer, Aerosol Sci. Tech., 29, 57–69, 1998.
Babu, S. S., Krishna Moorthy, K., and Satheesh, S. K.: Vertical and horizontal gradients in aerosol black carbon and its mass fraction to composite aerosols over the east coast of Peninsular India from Aircraft measurements, Adv. Meteorol., 2010, 812075, https://doi.org/10.1155/2010/812075, 2010.
Babu, S. S., Moorthy, K. K., Manchanda, R. K., Sinha, P. R., Satheesh, S. K., Vajja, D. P., Srinivasan, S., and Kumar, V. H. A.: Free tropospheric black carbon aerosol measurements using high altitude balloon: Do BC layers build “their own homes” up in the atmosphere?, Geophys. Res. Lett., 38, L08803, https://doi.org/10.1029/2011GL046654, 2011.
Babu, S. S., Nair, V. S., Gogoi, M. M., and Moorthy, K. K.: Seasonal variation of vertical distribution of aerosol single scattering albedo over Indian sub-continent: RAWEX aircraft observations, Atmos. Environ., 125, 312–323, https://doi.org/10.1016/j.atmosenv.2015.09.041, 2016.
Bollasina, M. A., Ming, Y., Ramaswamy, V., Schwarzkopf, M. D., and Naik, V.: Contribution of local and remote anthropogenic aerosols to the twentieth century weakening of the South Asian Monsoon, Geophys. Res. Lett., 41, 680–687, https://doi.org/10.1002/2013gl058183, 2014.
Bond, T. C., Anderson, T. L., and Campbell, D.: Calibration and intercomparison of filter-based measurements of visible light absorption by aerosols, Aerosol Sci. Tech., 30, 582–600, 1999.
Brooks, J., Allan, J. D., Williams, P. I., Liu, D., Fox, C., Haywood, J., Langridge, J. M., Highwood, E. J., Kompalli, S. K., O'Sullivan, D., Babu, S. S., Satheesh, S. K., Turner, A. G., and Coe, H.: Vertical and horizontal distribution of submicron aerosol chemical composition and physical characteristics across northern India during pre-monsoon and monsoon seasons, Atmos. Chem. Phys., 19, 5615–5634, https://doi.org/10.5194/acp-19-5615-2019, 2019.
Chinnam, N., Dey, S., Tripathi, S. N., and Sharma, M.: Dust events in Kanpur, northern India: Chemical evidence for source and implications to radiative forcing, Geophys. Res. Lett., 33, L08803, https://doi.org/10.1029/2005GL025278, 2006.
Choi, J.-O. and Chung, C. E.: Sensitivity of aerosol direct radiative forcing to aerosol vertical profile, Tellus B, 66, 24376, https://doi.org/10.3402/tellusb.v66.24376, 2014.
Clarke, A. D., Shinozuka, Y., Kapustin, V. N., Howell, S., Huebert, B., Doherty, S., Anderson, T., Covert, D., Anderson, J., and Hua, X.: Size distributions and mixtures of dust and black carbon aerosol in Asian outflow: Physiochemistry and optical properties, J. Geophys. Res.-Atmos., 109, D15S09, https://doi.org/10.1029/2003JD004378, 2004.
Davies, N. W., Fox, C., Szpek, K., Cotterell, M. I., Taylor, J. W., Allan, J. D., Williams, P. I., Trembath, J., Haywood, J. M., and Langridge, J. M.: Evaluating biases in filter-based aerosol absorption measurements using photoacoustic spectroscopy, Atmos. Meas. Tech., 12, 3417–3434, https://doi.org/10.5194/amt-12-3417-2019, 2019.
Dee, D. P., Uppala, S. M., Simmons, A. J., Berrisford, P., Poli, P., Kobayashi, S., Andrae, U., Balmaseda, M. A., Balsamo, G., and Bauer, D. P.: The ERA-Interim reanalysis: Configuration and performance of the data assimilation system, Q. J. Roy. Meteor. Soc., 137, 553–597, 2011.
Deepshikha, S., Satheesh, S. K., and Srinivasan, J.: Regional distribution of absorbing efficiency of dust aerosols over India and adjacent continents inferred using satellite remote sensing, Geophys. Res. Lett., 32, L03811, https://doi.org/10.1029/2004gl022091, 2005.
Dubovik, O., Smirnov, A., Holben, B., King, M., Kaufman, Y., Eck, T., and Slutsker, I.: Accuracy assessments of aerosol optical properties retrieved from Aerosol Robotic Network(AERONET) Sun and sky radiance measurements, J. Geophys. Res., 105, 9791–9806, 2000.
Fleming, R. J. and May, R. D.: The 2nd generation water vapor sensing system and benefits of its use on commercial aircraft for air carriers and society, UCAR, Boulder, CO, available at: https://www.eol.ucar.edu/system/?les/spectrasensors.pdf, last access: 16 December 2014.
Ganguly, D., Gadhavi, H., Jayaraman, A., Rajesh, T. A., and Misra, A.: Single scattering albedo of aerosols over the central India: Implications for the regional aerosol radiative forcing, Geophys. Res. Lett., 32, L18803, https://doi.org/10.1029/2005GL023903, 2005.
Gautam, R., Hsu, N. C., Lau, K. M., and Kafatos, M.: Aerosol and rainfall variability over the Indian monsoon region: distributions, trends and coupling, Ann. Geophys., 27, 3691–3703, 2009.
Ge, J. M., Su, J., Ackerman, T. P., Fu, Q., Huang, J. P., and Shi, J. S.: Dust aerosol optical properties retrieval and radiative forcing over northwestern China during the 2008 China-US joint field experiment, J. Geophys. Res.-Atmos., 115, D00K12, https://doi.org/10.1029/2009JD013263, 2010.
Haywood, J. M., Pelon, J., Formenti, P., Bharmal, N., Brooks, M., Capes, G., Chazette, P., Chou, C., Christopher, S., and Coe, H.: Overview of the dust and biomass-burning experiment and African monsoon multidisciplinary analysis special observing period-0, J. Geophys. Res.-Atmos., 113, D00C17, https://doi.org/10.1029/2008JD010077, 2008.
Highwood, E. J., Northway, M. J., McMeeking, G. R., Morgan, W. T., Liu, D., Osborne, S., Bower, K., Coe, H., Ryder, C., and Williams, P.: Aerosol scattering and absorption during the EUCAARI-LONGREX flights of the Facility for Airborne Atmospheric Measurements (FAAM) BAe-146: can measurements and models agree?, Atmos. Chem. Phys., 12, 7251–7267, https://doi.org/10.5194/acp-12-7251-2012, 2012.
Jin, Q., Yang, Z.-L., and Wei, J.: Seasonal Responses of Indian Summer Monsoon to Dust Aerosols in the Middle East, India, and China, J. Climate, 29, 6329–6349, https://doi.org/10.1175/JCLI-D-15-0622.1, 2016.
Johnson, B., Turnbull, K., Brown, P., Burgess, R., Dorsey, J., Baran, A. J., Webster, H., Haywood, J., Cotton, R., Ulanowski, Z., Hesse, E., Woolley, A., and Rosenberg, P.: In situ observations of volcanic ash clouds from the FAAM aircraft during the eruption of Eyjafjallajökull in 2010, J. Geophys. Res.-Atmos., 117, D00U24, https://doi.org/10.1029/2011JD016760, 2012.
Jones, T. A., Christopher, S. A., and Quaas, J.: A six year satellite-based assessment of the regional variations in aerosol indirect effects, Atmos. Chem. Phys., 9, 4091–4114, https://doi.org/10.5194/acp-9-4091-2009, 2009.
Konwar, M., Maheskumar, R. S., Kulkarni, J. R., Freud, E., Goswami, B. N., and Rosenfeld, D.: Aerosol control on depth of warm rain in convective clouds, J. Geophys. Res.-Atmos., 117, D13204, https://doi.org/10.1029/2012JD017585, 2012.
Kuhlmann, J. and Quaas, J.: How can aerosols affect the Asian summer monsoon? Assessment during three consecutive pre-monsoon seasons from CALIPSO satellite data, Atmos. Chem. Phys., 10, 4673–4688, https://doi.org/10.5194/acp-10-4673-2010, 2010.
Kulkarni, J. R., Maheskumar, R. S., Morwal, S. B., Padmakumari, B., Konwar, M., Deshpande, C. G., Joshi, R. R., Bhalwankar, R. V., Pandithurai, G., and Safai, P. D.: The cloud aerosol interactions and precipitation enhancement experiment (CAIPEEX): overview and preliminary results, Curr. Sci. India, 102, 3, 413–425, 2012.
Lau, W. K. M., Kim, M. K., and Kim, K. M.: Asian summer monsoon anomalies induced by aerosol direct forcing: the role of the Tibetan Plateau, Clim. Dynam., 26, 855–864, https://doi.org/10.1007/s00382-006-0114-z, 2006.
Li, Z., Lau, W. M., Ramanathan, V., Wu, G., Ding, Y., Manoj, M. G., Liu, J., Qian, Y., Li, J., and Zhou, T.: Aerosol and monsoon climate interactions over Asia, Rev. Geophys., 54, 866–929, 2016.
Marenco, F., Johnson, B., Turnbull, K., Newman, S., Haywood, J., Webster, H., and Ricketts, H.: Airborne lidar observations of the 2010 Eyjafjallajökull volcanic ash plume, J. Geophys. Res., 116, 11871–11881, https://doi.org/10.1029/2011jd016396, 2011.
Moorthy, K. K., Babu, S. S., Satheesh, S. K., Srinivasan, J., and Dutt, C. B. S.: Dust absorption over the “Great Indian Desert” inferred using ground-based and satellite remote sensing, J. Geophys. Res.-Atmos., 112, D09206, https://doi.org/10.1029/2006jd007690, 2007.
Moorthy, K. K., Nair, V. S., Babu, S. S., and Satheesh, S. K.: Spatial and vertical heterogeneities in aerosol properties over oceanic regions around India: Implications for radiative forcing, Q. J. Roy. Meteor. Soc., 135, 2131–2145, https://doi.org/10.1002/qj.525, 2009.
Moorthy, K. K., Satheesh, S. K., and Kotamarthi, V. R.: Evolution of aerosol research in India and the RAWEX–GVAX: an overview, Curr. Sci. India, 1, 111, 53–75, 2016.
Nair, V. S., Babu, S. S., and Moorthy, K. K.: Spatial distribution and spectral characteristics of aerosol single scattering albedo over the Bay of Bengal inferred from shipborne measurements, Geophys. Res. Lett., 35, L10806, https://doi.org/10.1029/2008gl033687, 2008.
Nair, V. S., Babu, S. S., Moorthy, K. K., and Prijith, S. S.: Spatial Gradients in Aerosol-Induced Atmospheric Heating and Surface Dimming over the Oceanic Regions around India: Anthropogenic or Natural?, J. Climate, 26, 7611–7621, https://doi.org/10.1175/JCLI-D-12-00616.1, 2013.
Nair, V. S., Babu, S. S., Manoj, M. R., Moorthy, K. K., and Chin, M.: Direct radiative effects of aerosols over South Asia from observations and modeling, Clim. Dynam., 49, 1411–1428, 2016.
Ogren, J. A.: Comment on “Calibration and intercomparison of filter-based measurements of visible light absorption by aerosols”, Aerosol Sci. Tech., 44, 589–591, 2010.
Padmakumari, B., Maheskumar, R. S., Harikishan, G., Morwal, S. B., Prabha, T. V., and Kulkarni, J. R.: In situ measurements of aerosol vertical and spatial distributions over continental India during the major drought year 2009, Atmos. Environ., 80, 107–121, https://doi.org/10.1016/j.atmosenv.2013.07.064, 2013a.
Padmakumari, B., Maheskumar, R. S., Morwal, S. B., Harikishan, G., Konwar, M., Kulkarni, J. R., and Goswami, B. N.: Aircraft observations of elevated pollution layers near the foothills of the Himalayas during CAIPEEX-2009, Q. J. Roy. Meteor. Soc., 139, 625–638, https://doi.org/10.1002/qj.1989, 2013b.
Pandithurai, G., Dipu, S., Dani, K. K., Tiwari, S., Bisht, D. S., Devara, P. C. S., and Pinker, R. T.: Aerosol radiative forcing during dust events over New Delhi, India, J. Geophys. Res.-Atmos., 113, D13209, https://doi.org/10.1029/2008JD009804, 2008.
Purohit, M. K. and Kaur, S.: Rainfall Statistics of India – 2016, Hydromet Division, India Meteorological Department (Ministry of Earth Sciences), New Delhi, 105 pp., 2016.
Ramanathan, V., Crutzen, P. J., Kiehl, J. T., and Rosenfeld, D.: Aerosols, Climate, and the Hydrological Cycle, Science, 294, 2119–2124, 2001.
Ratnam, M. V., Prasad, P., Roja Raman, M., Ravikiran, V., Bhaskara Rao, S. V., Krishna Murthy, B. V., and Jayaraman, A.: Role of dynamics on the formation and maintenance of the elevated aerosol layer during monsoon season over south-east peninsular India, Atmos. Environ., 188, 43–49, https://doi.org/10.1016/j.atmosenv.2018.06.023, 2018.
Ricchiazzi, P., Yang, S., Gautier, C., and Sowle, D.: SBDART: A research and teaching software tool for plane-parallel radiative transfer in the Earth's atmosphere, B. Am. Meteorol. Soc., 79, 2101–2114, 1998.
Satheesh, S. K., Moorthy, K. K., Babu, S. S., Vinoj, V., and Dutt, C. B. S.: Climate implications of large warming by elevated aerosol over India, Geophys. Res. Lett., 35, L19809, https://doi.org/10.1029/2008gl034944, 2008.
Satheesh, S. K., Vinoj, V., Suresh Babu, S., Krishna Moorthy, K., and Nair, V. S.: Vertical distribution of aerosols over the east coast of India inferred from airborne LIDAR measurements, Ann. Geophys., 27, 4157–4169, https://doi.org/10.5194/angeo-27-4157-2009, 2009.
Satheesh, S. K., Vinoj, V., and Krishnamoorthy, K.: Assessment of aerosol radiative impact over oceanic regions adjacent to Indian subcontinent using multisatellite analysis, Adv. Meteorol., 2010, 139186, https://doi.org/10.1155/2010/139186, 2010.
Solmon, F., Nair, V. S., and Mallet, M.: Increasing Arabian dust activity and the Indian summer monsoon, Atmos. Chem. Phys., 15, 8051–8064, https://doi.org/10.5194/acp-15-8051-2015, 2015.
Trembath, J.: Airborne CCN measurements, PhD thesis submitted to The University of Manchester, 2013.
Turner, A. G. and Annamalai, H.: Climate change and the South Asian summer monsoon, Nat. Clim. Change, 2, 587–595, https://doi.org/10.1038/nclimate1495, 2012.
Vaishya, A., Singh, P., Rastogi, S., and Babu, S. S.: Aerosol black carbon quantification in the central Indo-Gangetic Plain: Seasonal heterogeneity and source apportionment, Atmos. Res., 185, 13–21, https://doi.org/10.1016/j.atmosres.2016.10.001, 2017.
Vaishya, A., Babu, S. N. S., Jayachandran, V., Gogoi, M. M., Lakshmi, N. B., Moorthy, K. K., and Satheesh, S. K.: Large contrast in the vertical distribution of aerosol optical properties and radiative effects across the Indo-Gangetic Plain during the SWAAMI–RAWEX campaign, Atmos. Chem. Phys., 18, 17669–17685, https://doi.org/10.5194/acp-18-17669-2018, 2018.
Vance, A. K., Abel, S. J., Cotton, R. J., and Woolley, A. M.: Performance of WVSS-II hygrometers on the FAAM research aircraft, Atmos. Meas. Tech., 8, 1617–1625, https://doi.org/10.5194/amt-8-1617-2015, 2015.
Vinoj, V., Rasch, P. J., Wang, H., Yoon, J.-H., Ma, P.-L., Landu, K., and Singh, B.: Short-term modulation of Indian summer monsoon rainfall by West Asian dust, Nat. Geosci., 7, 308–313, 2014.