the Creative Commons Attribution 4.0 License.
the Creative Commons Attribution 4.0 License.
 | 02 Apr 2020
Seasonal contrast in size distributions and mixing state of black carbon and its association with PM1.0 chemical composition from the eastern coast of India
Sobhan Kumar Kompalli
Surendran Nair Suresh Babu
Sreedharan Krishnakumari Satheesh
Krishnaswamy Krishna Moorthy
Trupti Das
Ramasamy Boopathy
Dantong Liu
Eoghan Darbyshire
James D. Allan
James Brooks
Michael J. Flynn
Over the Indian region, aerosol absorption is considered to have a potential impact on the regional climate, monsoon and hydrological cycle. Black carbon (BC) is the dominant absorbing aerosol, whose absorption potential is determined mainly by its microphysical properties, including its concentration, size and mixing state with other aerosol components. The Indo-Gangetic Plain (IGP) is one of the regional aerosol hot spots with diverse sources, both natural and anthropogenic, but still the information on the mixing state of the IGP aerosols, especially BC, is limited and a significant source of uncertainty in understanding their climatic implications. In this context, we present the results from intensive measurements of refractory BC (rBC) carried out over Bhubaneswar, an urban site in the eastern coast of India, which experiences contrasting air masses (the IGP outflow or coastal/marine air masses) in different seasons. This study helps to elucidate the microphysical characteristics of BC over this region and delineates the IGP outflow from the other air masses. The observations were carried out as part of South West Asian Aerosol Monsoon Interactions (SWAAMI) collaborative field experiment during July 2016–May 2017, using a single-particle soot photometer (SP2) that uses a laser-induced incandescence technique to measure the mass and mixing state of individual BC particles and an aerosol chemical speciation monitor (ACSM) to infer the possible coating material. Results highlighted the distinctiveness in aerosol microphysical properties in the IGP air masses. BC mass concentration was highest during winter (December–February) ( µg m−3), when the prevailing air masses were mostly of IGP origin, followed by post-monsoon (October–November) (mean µg m−3). The mass median diameter (MMD) of the BC mass size distributions was in the range 0.190–0.195 µm, suggesting mixed sources of BC, and, further, higher values (∼ 1.3–1.8) of bulk relative coating thickness (RCT) (ratio of optical and core diameters) were seen, indicating a significant fraction of highly coated BC aerosols in the IGP outflow. During the pre-monsoon (March–May), when marine/coastal air masses prevailed, BC mass concentration was lowest ( µg m−3), and larger BC cores (MMD > 0.210 µm) were seen, suggesting distinct source processes, while RCT was ∼ 1.2–1.3, which may translate into higher extent of absolute coating on BC cores, which may have crucial regional climate implications. During the summer monsoon (July–September), BC size distributions were dominated by smaller cores (MMD ≤ 0.185 µm), with the lowest coating indicating fresher BC, likely from fossil fuel sources. A clear diurnal variation pattern of BC and RCT was noticed in all the seasons, and daytime peak in RCT suggested enhanced coating on BC due to the condensable coating material originating from photochemistry. Examination of submicrometre aerosol chemical composition highlighted that the IGP outflow was dominated by organics (47 %–49 %), and marine/coastal air masses contained higher amounts of sulfate (41 %–47 %), while ammonium and nitrate were seen in minor amounts, with significant concentrations only during the IGP air mass periods. The diurnal pattern of sulfate resembled that of the RCT of rBC particles, whereas organic mass showed a pattern similar to that of the rBC mass concentration. Seasonally, the coating on BC showed a negative association with the mass concentration of sulfate during the pre-monsoon season and with organics during the post-monsoon season. These are the first experimental data on the mixing state of BC from a long time series over the Indian region and include new information on black carbon in the IGP outflow region. These data help in improving the understanding of regional BC microphysical characteristics and their climate implications.
- Article
(8247 KB) - Full-text XML
-
Supplement
(710 KB) - BibTeX
- EndNote


The state of mixing of aerosols, especially that of absorbing aerosols, remains poorly quantified, despite its important role in determining the regional and global radiative impacts of aerosols and aerosol–cloud interactions (Bond et al., 2013; Liu et al., 2013; IPCC, 2013). The importance of the south-western Asia region need not be overemphasized in this context, where the two most-absorbing aerosol species, black carbon (BC) from a wide variety of sources in the locale and dust, coexist along with a broad spectrum of other aerosol species such as sulfates, nitrates, phosphates and secondary organic aerosols (SOAs) originating from volatile organic compounds (VOCs) (Lee et al., 2002; Shiraiwa et al., 2007; Moteki et al., 2007; Moffet and Prather, 2009; Zhang et al., 2015). Significant seasonal changes in synoptic meteorology occur in this region throughout the year associated with the Asian monsoon system and the associated changes in atmospheric humidity and thermal convection, which is modulated by the local (mesoscale) meteorology and the regional orography. This interplay confines the aerosol between the Bihar Plateau to the south and the high Himalayan ranges to the north. Such a strong variation is therefore likely to lead to significant changes in the aerosol characteristics, especially the state of mixing (Lawrence and Lelieveld, 2010; Srivastava and Ramachandran, 2013; Srinivas and Sarin, 2014; Moorthy et al., 2016; Raatikainen et al., 2017).
BC is highly porous in nature (Adachi et al., 2010, 2014; China et al., 2013; Bond et al., 2013; Scarnato et al., 2015) and provides a surface area for adhesion of other particulate and gaseous species, paving the way for surface-based chemical reactions. Nascent BC is hydrophobic and is comprised of chain aggregates with diameters of the order of few tens of nanometres (Köylü et al., 1995; Bond et al., 2013; Bhandari et al., 2016, and references therein). However, it collapses to a compact BC particle with its core being coated with other components via coagulation among aggregates and (or) via condensation of atmospheric vapours while ageing in the atmosphere (Weingartner et al., 1997; Zuberi et al., 2005). Coatings of non-absorbing components on the BC core alter the morphology of the BC and enhance the absorption potential of the resultant mixed-phase particle to varying magnitudes through the so-called “lensing effect” (e.g., Shiraiwa et al., 2010; Cappa et al., 2012; Peng et al., 2016; Ueda et al., 2016; Wang et al., 2016). In addition, the coating of other soluble species on BC affects its hygroscopic properties (Weingartner et al., 1997; McMeeking et al., 2011; Liu et al., 2013; Laborde et al., 2013) and atmospheric lifetime and makes it more cloud condensation nuclei (CCN) active (Liu et al., 2013; IPCC, 2013).
All the aforementioned processes have implications for direct and indirect radiative forcing of BC. In the last few decades a rapid growth in the human population, a substantial increase in vehicle use, and large-scale industrialization and anthropogenic activities have taken place over the Indian region. These factors resulted in a significant increasing trend in the regional aerosol burden (Babu et al., 2013; Moorthy, 2016). The Indo-Gangetic Plain (IGP) region is one of the aerosol hot spots with potential implications for regional radiative forcing (Nair et al., 2017) and circulation (Lawrence and Lelieveld, 2010; Gautam et al., 2009) and has attracted wide attention. Large heterogeneity in the nature of aerosol sources over the IGP (industrial and vehicular emissions, crop residue, and residential fuel burning) results in BC particles with varying microphysical properties (size, concentrations and mixing state) which determine BC's absorption potential and radiative effects (Jacobson, 2001; Cappa et al., 2012; Petzold et al., 2013; Bond et al., 2013). Hence it is essential to gather information on BC microphysical properties including BC's mixing state to understand its effect on absorption enhancement and further BC climatic implications (both direct and indirect effects).
Detailed characterization of the state of mixing of aerosols over the Indo-Gangetic Plain, which is recognized as one of the most complex regions as far as aerosols are concerned (Moorthy et al., 2016), remains virtually non-existent. There have been a few limited and isolated studies (Thamban et al., 2017, and references therein) that have been mainly based on chemical composition and theoretical/model calculations (Dey et al., 2008; Srivastava and Ramachandran, 2013) and did not explore BC mixing state due to inherent limitations of the methodologies employed. While characterization of BC spectral absorption properties and their mass loading over India are numerous (e.g., Beegum et al., 2009; Kompalli et al., 2014; Prasad et al., 2018, and references therein), reports on the size distribution of BC and its mixing state are extremely limited and site/season-specific (Raatikainen et al., 2017; Thamban et al., 2017). The non-availability of state-of-the-art instruments for near-real-time estimating of the coating of the BC core with other species has been one of the main reasons for such limited exploration. In this context, the single-particle soot photometer (SP2), a laser-induced incandescence technique, offers a powerful tool for long-term measurements at the single-particle level (Moteki and Kondo, 2007; Schwarz et al., 2008, 2013; Laborde et al., 2012; Liu et al., 2014). Along with this, information on the condensable materials, which act as coating substances and constantly alter the physiochemical properties of the BC-containing particles, is also essential.
Recognizing the need for the above information for better understanding aerosol–radiation–cloud–monsoon interactions over the South Asian region, a super site (first of three) was established in July 2016 at Bhubaneswar, located in the eastern IGP, as part of the joint Indo-UK experiment, South West Asian Aerosol Monsoon Interactions (SWAAMI), executed by the Space Physics Laboratory of Indian Space Research Organisation (ISRO); the Indian Institute of Science (IISc), Bengaluru; and the University of Manchester, United Kingdom. The key objectives have been (a) the assessment of the impact of BC and co-emitted organic/inorganic species on the radiation budget via the direct, semi-direct and indirect effects, and (b) the evaluation of the effects of the aerosol radiative forcing on the local energy budget, atmospheric dynamics and hydrological cycle over India. To meet these objectives, state-of-the-art instruments were installed at Bhubaneswar, which included a single-particle soot photometer for characterization of refractory BC (rBC) aerosols and an aerosol chemical speciation monitor (ACSM) for the measurements of non-refractory submicrometre aerosol chemical composition for long-term measurements. The present study provides results from a combination of these instruments over a full annual cycle, perhaps for the first time over the Indian region. This paper includes the details of the measurement and analysis; presents the results on the concentrations (mass and number), size distribution, and mixing state in terms of coating thickness of BC; and investigates the seasonality and responses to contrasting air mass types. The contributions from distinct sources to BC concentrations and the association of coating on BC with possible condensable coating material are also examined, and the implications are discussed.
2.1 Observational site, general meteorology and data period
The measurements were carried out from Bhubaneswar, the capital city of Odisha state, in the eastern part of India (denoted by the star symbol in Fig. 1), which is at a distance of 53 km from the western coastline of the Bay of Bengal. It is a moderately industrialized city, typically urbanized and with the consequent anthropogenic emissions (industrial, traffic and household). It receives outflow from the Indo-Gangetic Plain (indicated by dotted lines in the figure), lying to its west, through advection by the synoptic westerlies for most of the year. The urban area is surrounded by rural regions along an approximate radius of 70 km that host a variety of anthropogenic activities involving burning of solid fuel (wood, dung cake, etc.) for household cooking and small-scale industries such as brick kilns and coal-fired thermal power plants. It also hosts a major shipping harbour (Mahapatra et al., 2013a; Venkatraman et al., 2005; Verma et al., 2012).
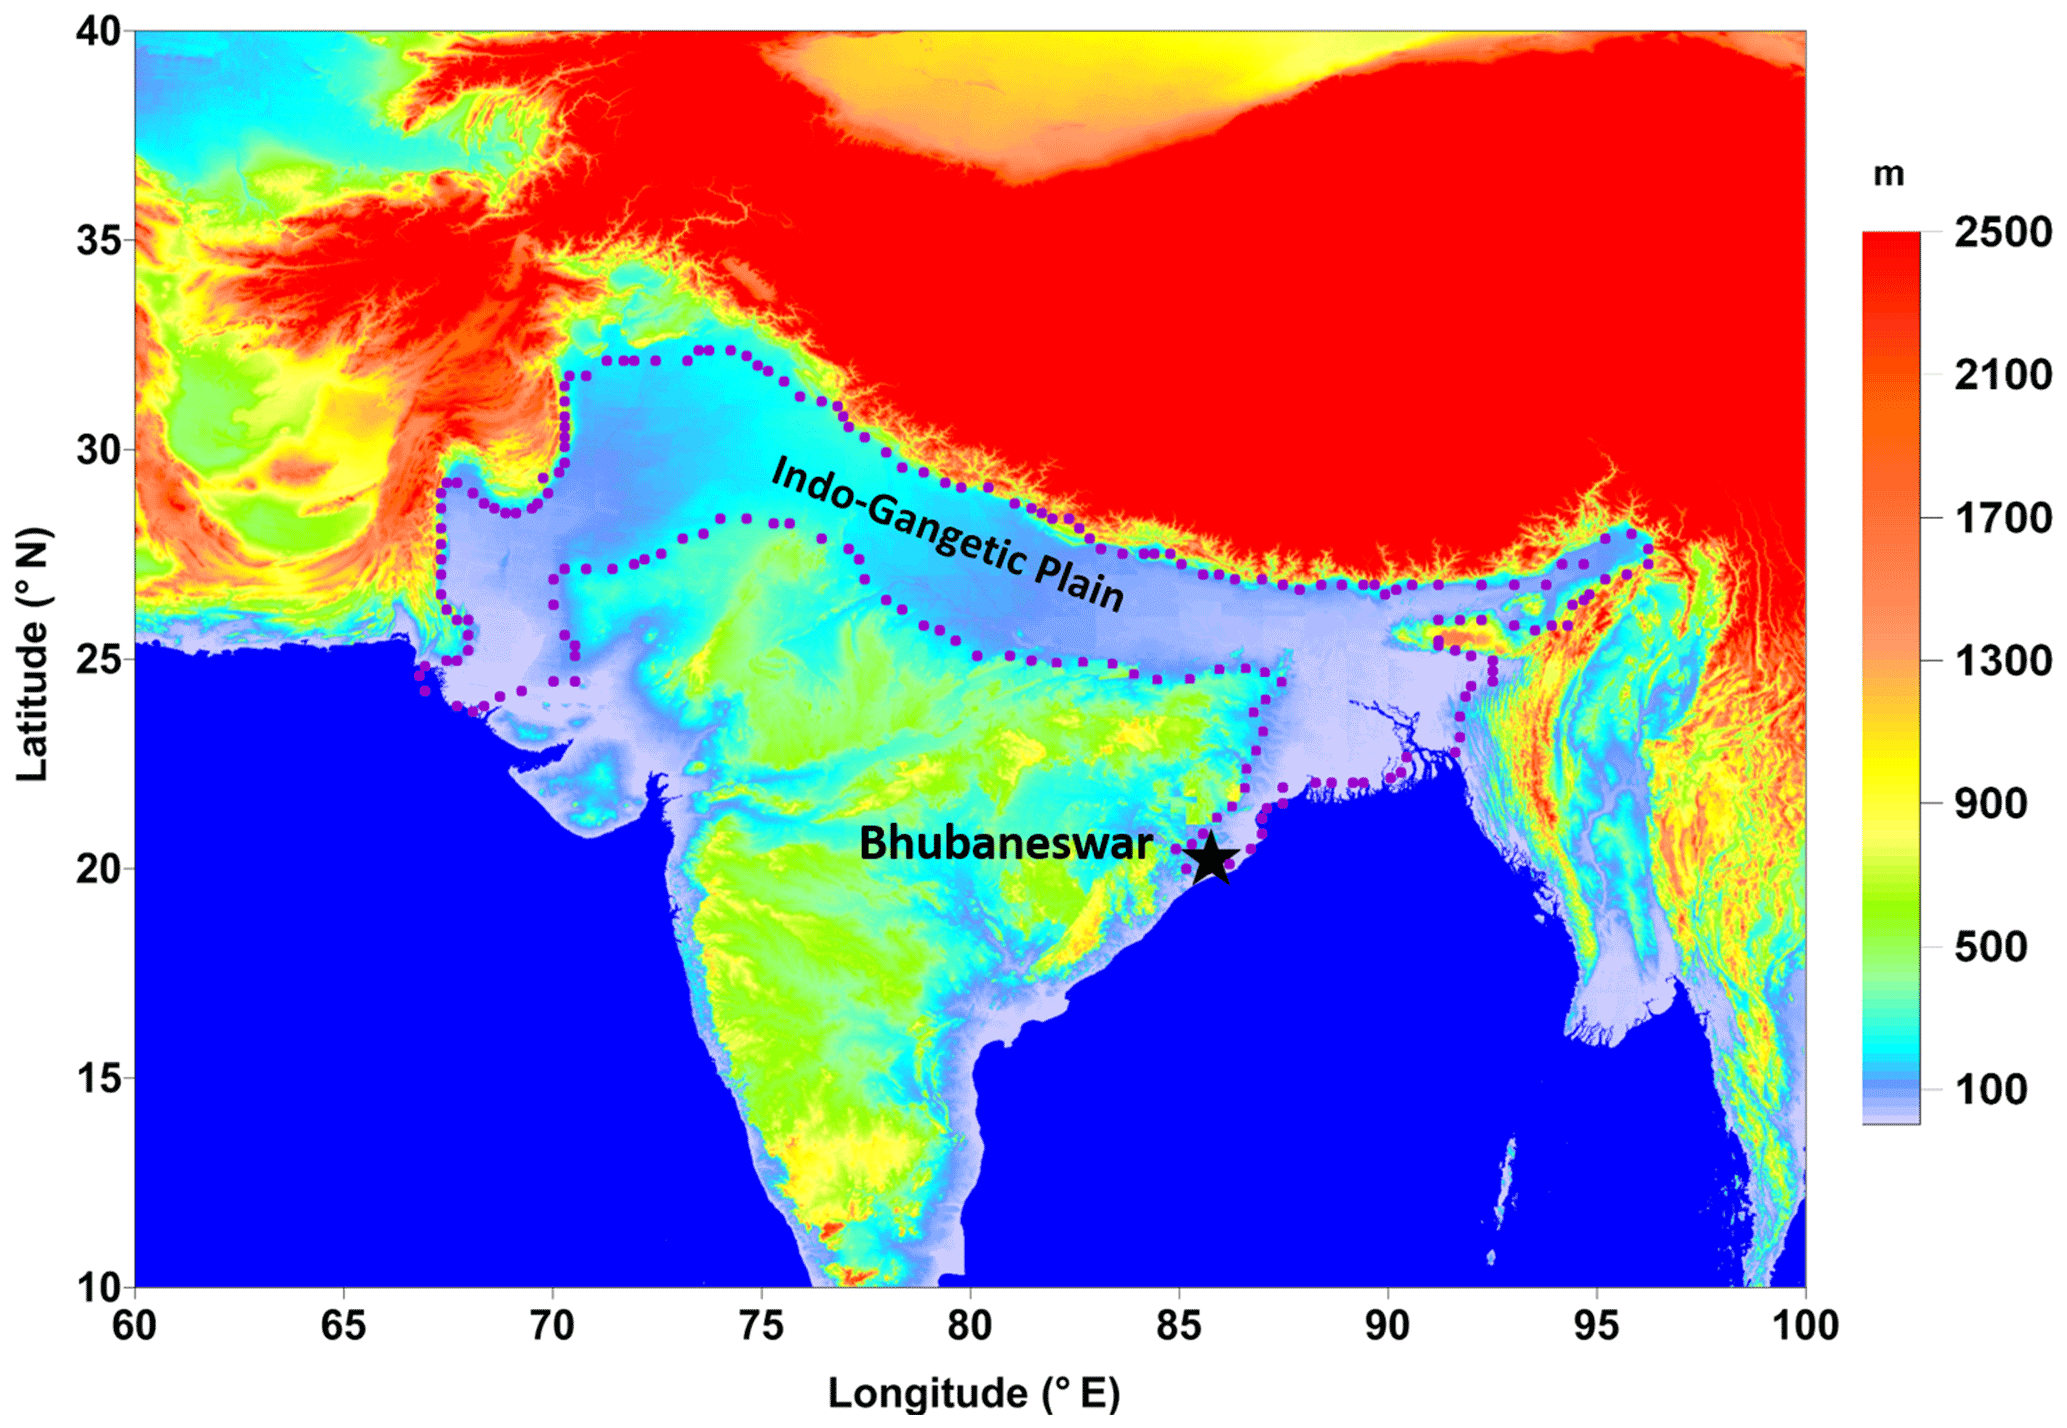
Figure 1Geographic location of Bhubaneswar marked by a star symbol on the topographic map; the boundary of the Indo-Gangetic Plain (IGP) region is indicated with dotted lines.
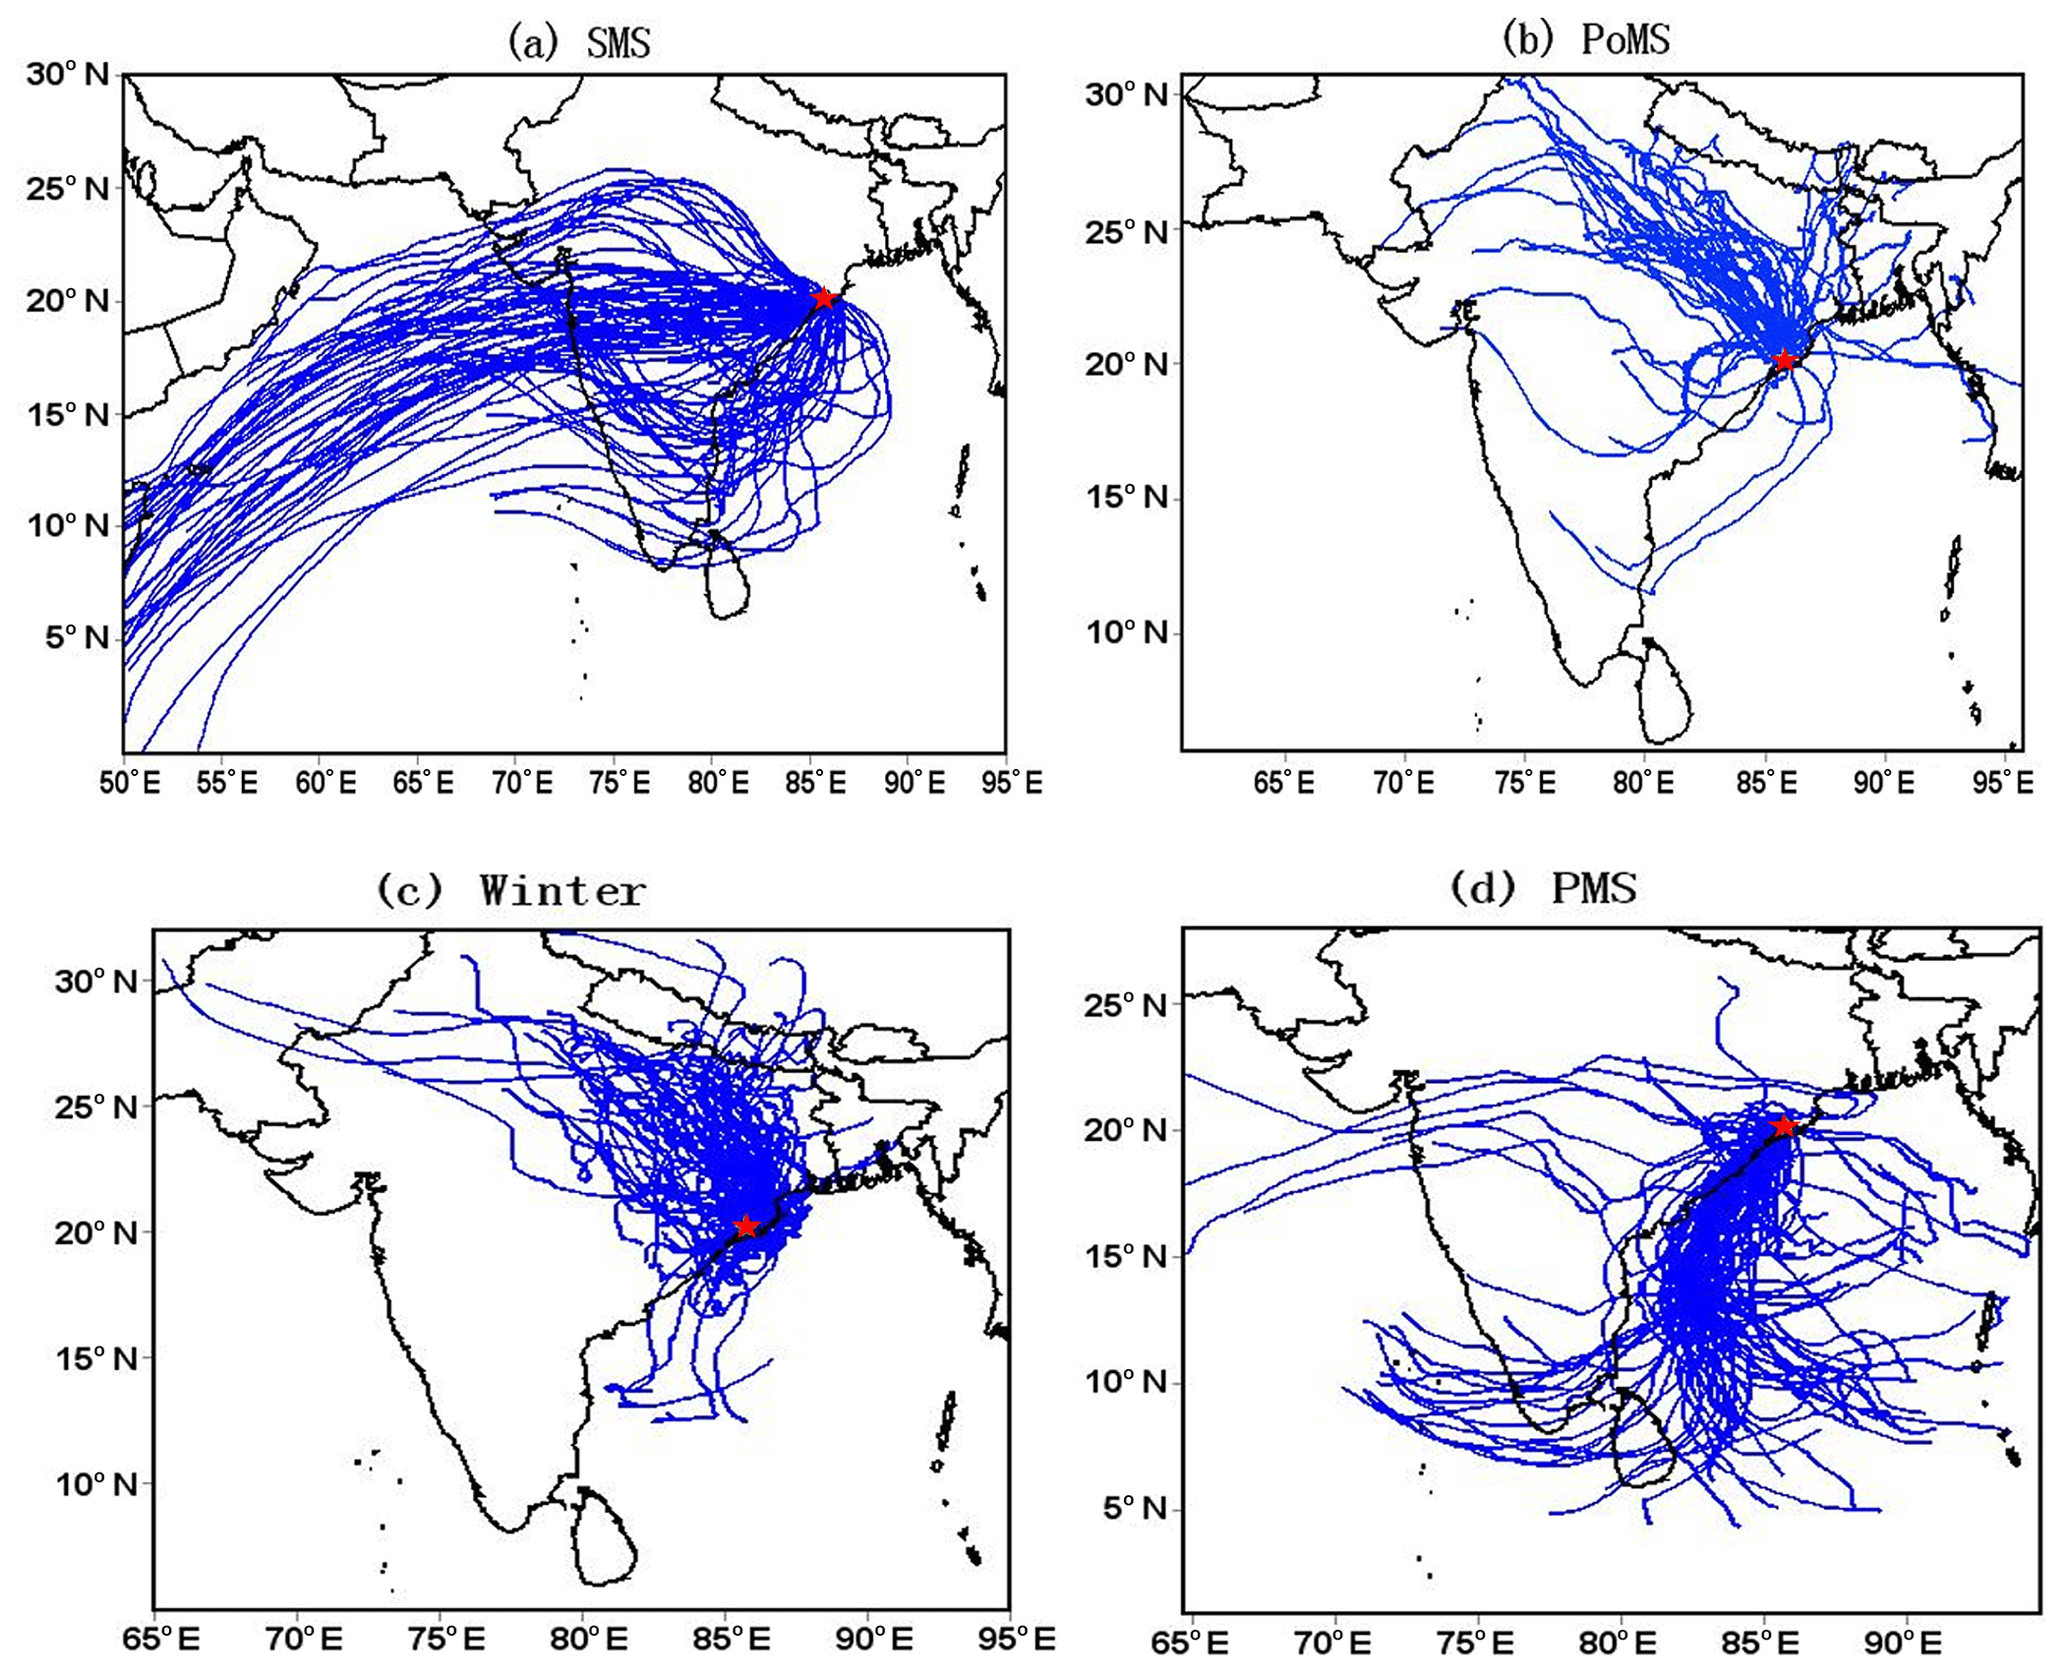
Figure 2Isentropic 5 d air mass back trajectories arriving at 100 m above the surface over the observational location (identified with a star symbol) in different seasons.
Aerosol measurements are carried out at this supersite from a custom-built container installed on the premises of the Institute of Minerals and Materials Technology (IMMT), Bhubaneswar (20.20∘ N, 85.80∘ E; 78 m above mean sea level), which is not near any major industrial and urban activities. The sampling of ambient aerosols is done by drawing air at 16.67 L min−1 from a height of ∼ 3 m above ground level (a.g.l.) through a stainless-steel tube fitted with a PM10 inlet. Another stainless-steel tube, with an inner diameter of ∼ 0.635 cm and 30 cm length, was used for isokinetic subsampling from this main flow inside the stack. To keep the relative humidity of the sample flow under 50 %, a Nafion membrane dryer was installed downstream in the sample flow, after which this flow was distributed among the various aerosol instruments using isokinetic flow splitters. Data collection commenced in July 2016, and the data collected until May 2017 are used in this work.
Bhubaneswar experiences contrasting seasonal air masses linked with the Asian monsoon system (Asnani, 1993). In Fig. 2, isentropic 5 d air mass back trajectories arriving at 100 m a.g.l. at the sampling site are shown, which were computed for all the individual days during the (a) summer monsoon season (SMS) (June–September), (b) post-monsoon season (PoMS) (October–November), (c) winter (December–February) and (d) pre-monsoon season (PMS) (March–May). It clearly reveals the dominance of the IGP outflow during the PoMS and winter season, while mixed (continental and marine/coastal) air masses prevailed during the SMS and predominantly coastal transit/marine air masses during the PMS. Thus, the examination of the seasonal characteristics will help in delineating the distinctiveness of the IGP air masses and characterizing various source, sink and transformation (ageing) processes. While the contribution from fossil fuel sources will be less variant, the contribution from biomass burning sources varies seasonally. In Fig. S1 in the Supplement, the spatial distribution of fires from the Moderate Resolution Imaging Spectroradiometer (MODIS) fire radiative power (MODIS Thermal Anomalies/Fire locations, Collection 6 product obtained from: https://earthdata.nasa.gov/firms, last access: 16 December 2017) is shown for the representative months of different seasons – (a) August 2016 (SMS), (b) October 2016 (PoMS), (c) January 2017 (winter) and (d) May 2017 (PMS) – which depict the seasonal variation in the distribution of fires. The greatest number of fire events across the Indian region occur during the PMS. However, during other seasons, less intense fires are noticeable at the subregional scale, which are confined mostly to the north-western IGP during the PoMS and to the western and north-eastern regions during winter. Table 1 depicts the seasonal average of several important meteorological parameters: temperature (T), relative humidity (RH), pressure (P), and wind speed (WS) (along with maximum and minimum values) as well as total accumulated rainfall recorded in that season, measured using a collocated automatic weather station. During the SMS, the prevailing wind speed and temperature were moderate, and relative humidity (RH) was high (Table 1), while rainfall, associated with the monsoon, was extensive. Compared to the SMS, lower temperatures, winds and RH prevailed during the PoMS, with lower total rainfall. The lowest temperatures and RH of the year were seen during winter, when calm wind conditions prevailed with negligible rainfall. The PMS witnessed the highest temperatures of the year (as high as 41 ∘C), a moderately humid atmosphere and relatively higher wind speed compared to winter. During this season the region witnessed thundershower events that led to high-velocity local winds and rainfall.
Table 1Seasonal average of meteorological parameters, temperature (T), relative humidity (RH), pressure (P), and wind speed (WS) and total accumulated rainfall. Maximum and minimum values (except for rainfall, which is the seasonal total value) recorded in that season are also listed.
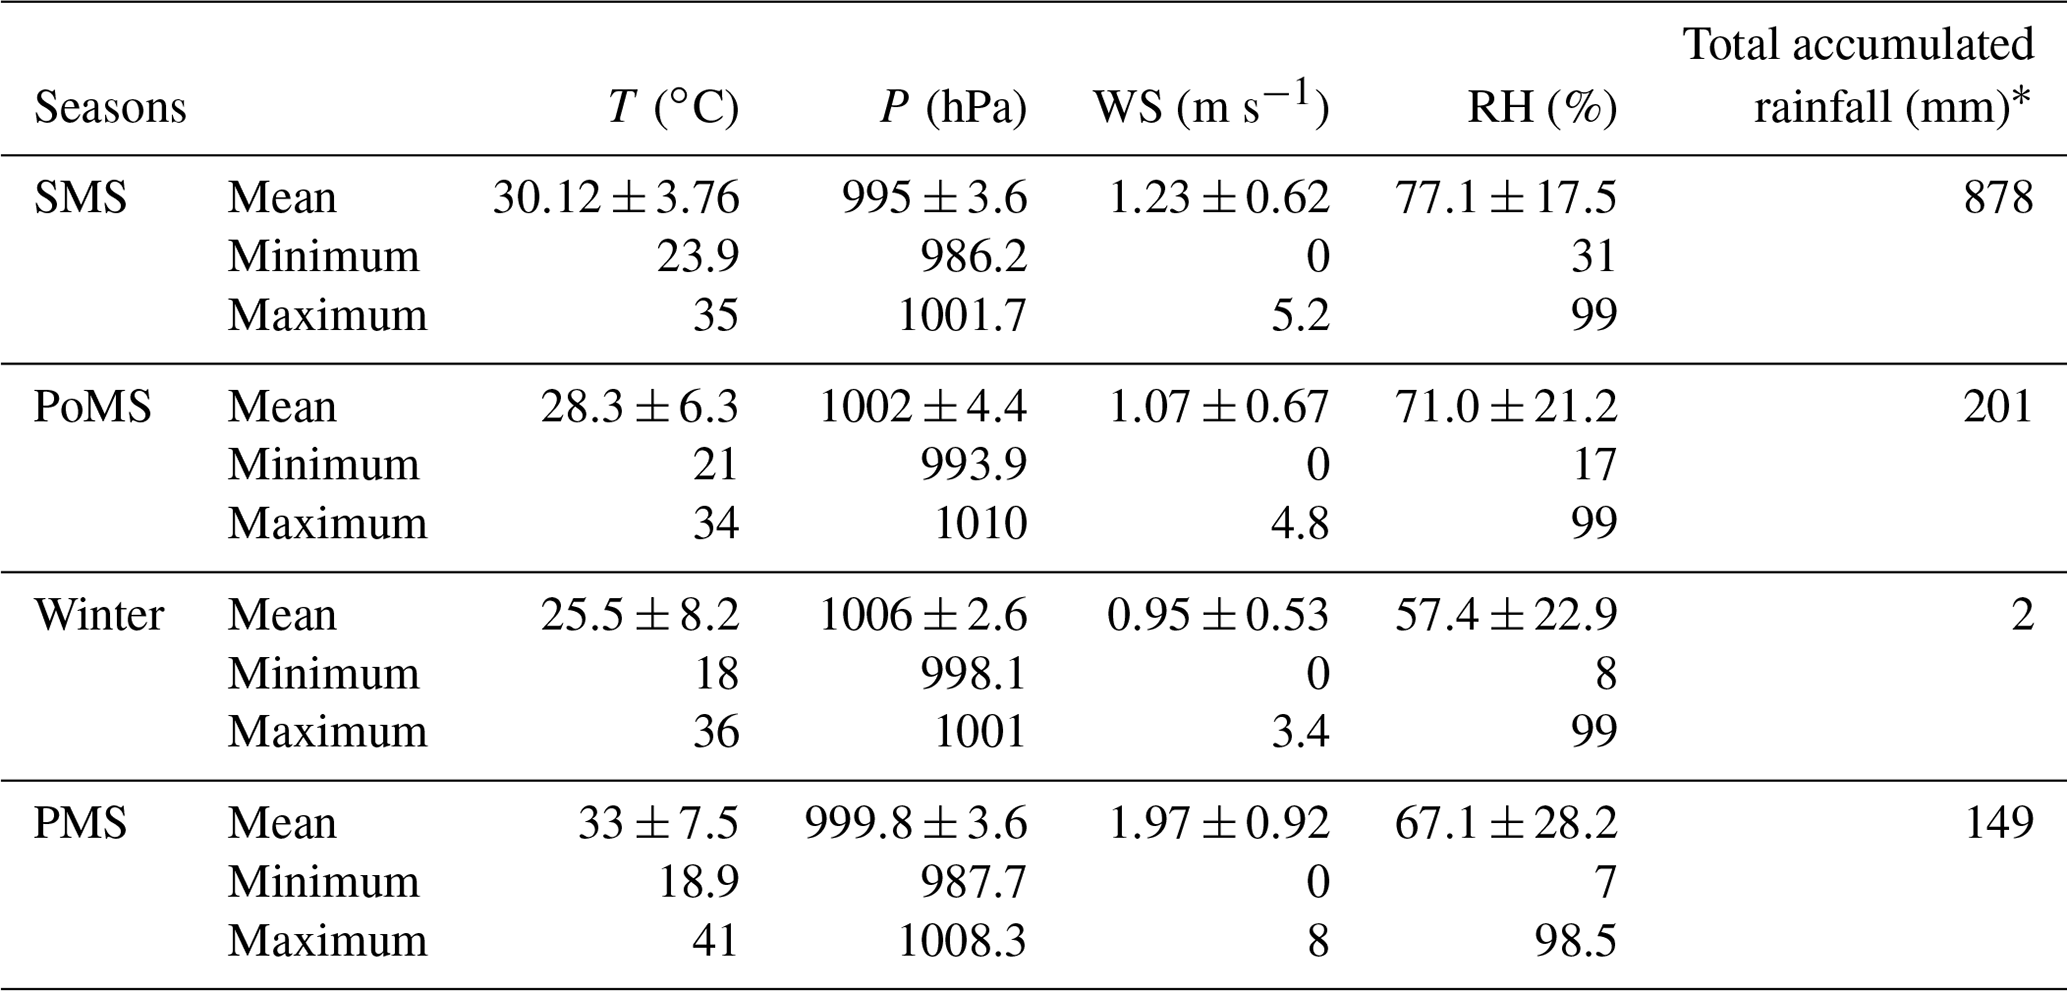
* This value is the total rainfall amount.
The sampling period spanned from 27 July 2016 to 22 May 2017, representing all the seasons of the year, atmospheric conditions and distinct prevailing air masses. The data have been collected continuously, except for brief gaps during calibration, system checks (flow rate, chamber temperatures, etc.), and preventive maintenance of the instruments or minor technical issues. The only major gap in the data occurred during 11 November to 27 December 2016, when measurements were paused due to logistical issues at the experimental site.
2.2 Instrumentation
In the present study, data were collected using a single-particle soot photometer (SP2) (model SP2-D; Droplet Measurement Technologies, Boulder, USA) and an aerosol chemical speciation monitor (ACSM) (model 140; Aerodyne Research Inc., USA).
The SP2 allows the characterization of the mixing state of refractory BC (rBC) in single particles by employing a laser-induced incandescence technique and obtaining the scattering properties based on excitation by a 1064 nm Nd:YAG intracavity laser (Moteki and Kondo, 2007; Schwarz 2013, 2008; Laborde et al., 2012; Liu et al., 2014; Shiraiwa 2007). It also provides information about the number/mass concentrations and size distribution of rBC. While the amplitude of the scattering signal provides the information about the optical size (Dp) of the particle, the amplitude of the incandescence signal is proportional to the mass of the rBC. The mass equivalent diameter, or BC core diameter (Dc), is defined as the diameter of a sphere containing the same mass of rBC as measured in the particle using a density ρ∼1.8 g cm−3 for atmospheric BC (Bond and Bergstrom, 2006; Moteki and Kondo, 2010; Moteki et al., 2010; McMeeking et al., 2011). Additionally, the scattering signal from the BC-containing particles provides information about the scattering cross section of the particle. However, since the particle is subjected to intense thermal heating and evaporation of the coating while passing through the laser beam, the scattering signal gets perturbed. This signal is reconstructed using the leading edge only (LEO) fitting technique, which uses the leading edge of the unperturbed scattering signal before volatilization of the coating material becomes significant. This is used to reconstruct the full scattering signal (Liu et al., 2014).
The reconstructed scattering signal and the BC core size (Dc) are used to derive the optical diameter of the BC particle or the coated BC size (Dp) by employing Mie calculations, where the whole particle is idealized as a two-component sphere with a concentric core–shell morphology. In the present study, we have used a core (rBC) refractive index value of 2.26–1.26i (Moteki et al., 2010; Liu et al., 2014; Taylor et al., 2014) and a coating refractive index of 1.5+0i, which is representative of the corresponding values determined for inorganic salts (e.g., ammonium sulfate) and secondary organic aerosol (Schnaiter et al., 2005; Lambe et al., 2013). To quantify the extent of coating on the BC particle, relative coating thickness (RCT) and absolute coating thickness (ACT), defined as Dp∕Dc and ( respectively, were used. These are calculated as the total volume of coated BC particles divided by the total volume of the rBC cores in a given time window (5 min) following Liu et al. (2014), which has been used by subsequent studies (Liu et al., 2019; Brooks et al., 2019a). It may be noted that the RCT and ACT used in this study come from derived parameters that require Mie calculations based on a core–shell model that may not bear relation to reality, and the RCT (and ACT) is not an actual ratio of diameters. The coating thickness for individual particles is dependent on core sizes. However, we have used the volume-weighted bulk RCT and ACT as representative diagnostics for the overall mixing state of the whole population of BC particles (Gong et al., 2016; Cheng et al., 2018; Liu et al., 2019).
As described by Liu et al. (2019), since the contribution from smaller particles to the integrated volume is small, the bulk coating thickness values are generally independent of the uncertainties arising due to the presence of smaller particles. Further, the information on the morphology of the BC, which would be different for fresh and aged emissions, is not available in this study. The important caveat here is that we assume that the particles are spherical and their coatings are uniform (coated particles are also spherical). The RCT (and ACT) parameter provides a qualitative measure of the amount of condensed material that is present on the same particle as the rBC core. We use this to examine the extent of rBC mixing with other components in different seasons and compared to different regions.
Further, using correlations with the bulk NR-PM1.0 composition, we obtain some insights into the coating material associated with rBC in different periods. Liu et al. (2010, 2014) described the configuration, operation, data interpretation procedures and uncertainties of this specific instrument in detail. Taylor et al. (2014) described the methodology to determine the Dp∕Dc in detail and examined the sensitivity of the derived parameters to the density and refractive index values. Recently, Sedlacek III et al. (2018) have cautioned that rBC may be produced by laser-induced charring of organic substances in the SP2, which depends on the laser power. Such laser-induced charring could result in an overestimate of rBC. During our measurements, the laser power varied in the range 2.1–3.7 V, which is above the threshold to detect rBC with high efficiency (> 2 V) (Sedlacek III et al., 2018). Though we cannot rule out an additional rBC contribution from charring of organic matter, it is likely this occurs in circumstances when the laser voltage is higher than that used in our study. Further, Sedlacek III et al. (2012) examined the structure of rBC-containing particles using the lag time technique and suggested that the core–shell model does not apply to all rBC-containing particles. A situation when the BC core is located off-centre in the particle and so has a non-core–shell structure arising due to the complex mixing state of BC may lead to uncertainty in determining the coating thickness of BC. Our study assumes BC to be at the centre of the particle surrounded by a uniform coating, in the absence of other measurements to understand the complex coating. A recent study by Liu et al. (2017) demonstrated good agreement between Mie-modelled scattering values using the core–shell approximation and the SP2-measured scattering cross section for the BC with thicker coatings as is the case for the majority of particles in this study. In addition, the particle scattering is relatively independent of particle morphology at the SP2 wavelength 1064 nm (Moteki et al., 2010). The SP2 was operated at a flow rate of 0.08 L min−1 and was periodically calibrated. Aquadag® black carbon particle standards (Aqueous Deflocculated Acheson Graphite, manufactured by Acheson Inc., USA) were used for the calibration of the SP2. However, as Aquadag®-generated particle standards do not represent ambient BC, a correction factor of 0.75 is incorporated (e.g., Moteki and Kondo, 2010; Laborde et al., 2012).
Real-time characterization of the non-refractory PM1.0 aerosol mass and composition was carried out using the ACSM (Ng et al., 2011). The ACSM data were recorded with 30 min sampling intervals alongside the SP2. The ACSM uses quadrupole mass spectrometry to chemically characterize the submicrometre (vacuum aerodynamic diameter ∼ 40–1000 nm range) particulate composition of the organics, sulfate, nitrate, ammonium and chloride components. Initially, the particles are focused onto a resistively heated thermal vaporizer operating at 600 ∘C using an aerodynamic particle focusing lens in a high vacuum environment. The evaporated gas stream from the particle evaporation is detected after ionization via electron impact by the mass spectrometer. The mass spectra are used to extract chemical composition information. From the main flow rate of 3 L min−1, the ACSM draws a sample flow of 0.1 L min−1 using a 100 µm diameter critical aperture. The instrument is periodically calibrated, and all the corrections described in Ng et al. (2011) were applied during the data post-processing. A real-time and composition-dependent collection efficiency (CE) correction based on Middlebrook et al. (2012) was applied to account for the uncertainties arising due to the usage of a standard vaporizer.
3.1 BC mass and number concentrations
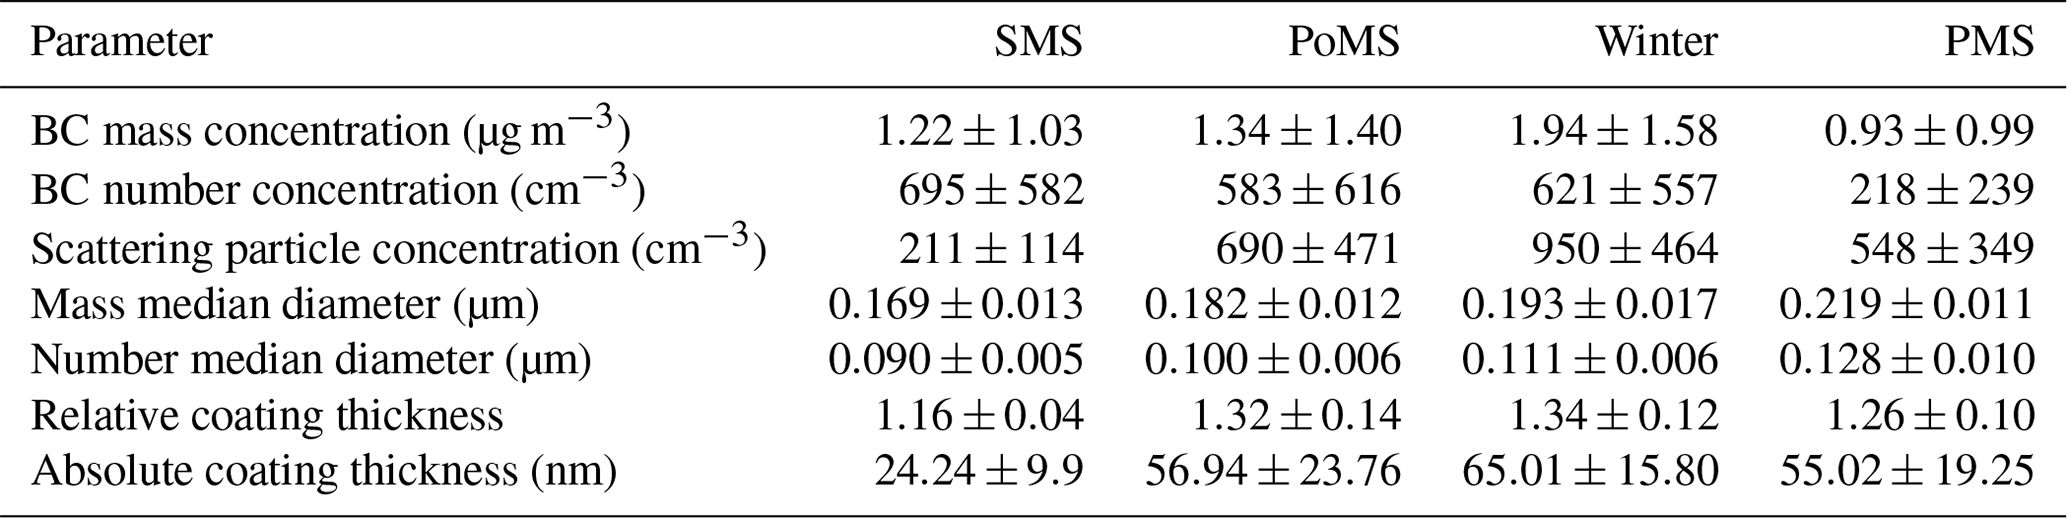
Temporal variation of daily mean mass concentration of BC and number concentrations of BC and non-BC scattering particles (individual data points are available with 5 min time resolution) are shown respectively in Fig. 3a and b. A summary of the properties of the rBC concentrations, BC size distributions, its mixing state and scattering particle concentrations in different seasons during this study are presented in Table 2. Number concentrations of BC and scattering particles peak in winter, while they are the lowest in the PMS with moderate values through the PoMS. The overall annual mean number concentrations (and their standard deviation) of rBC and non-BC particles (that are in the detection range of the SP2 (200–400 nm) only) are ∼ 496(±536) cm−3 and 702(±458) cm−3 respectively, suggesting a large variability (and a skewed distribution), and the median values of rBC and non-BC particles are 333 and 595 cm−3 respectively.
Table 2A summary of the properties of the rBC concentrations, size distributions, and its mixing state and scattering particle concentrations in different seasons: summer monsoon (SMS), post-monsoon (PoMS), winter and pre-monsoon (PMS). The values after the ± symbol are the standard deviations.
Similarly, the BC mass concentration also showed significant temporal variation with high values during winter and low values during the PMS. During the SMS the daily mean mass concentration ranged between 0.31 and 2.6 µg m−3 with a seasonal mean µg m−3, and during the PoMS the seasonal mean was µg m−3 with daily mean values varying between 0.36 and 2.87 µg m−3. Winter witnessed enhanced BC mass concentrations with daily mean values ranging between 0.28 and 3.68 µg m−3 and a seasonal mean of µg m−3, whereas the lowest concentrations were found during the PMS with daily mean values varying between 0.05 and 3.07 µg m−3 and a seasonal mean of µg m−3. Lower values during the SMS may be attributed to widespread precipitation across the region and decreased source strength during rainy periods. Conversely, the decrease in rainfall and prevailing calm wind conditions, coupled with reduced ventilation due to the shallow boundary layer as a result of prevailing lower temperatures, contributed to the build-up of aerosols during the PoMS, which continued and was further enhanced during winter. During the PMS, strong thermal convection resulting from increased solar heating of the dry land lifts the boundary layer to higher altitudes, and with winds gaining speed, there is greater dispersion of the aerosols (Kompalli et al., 2014), leading to a substantial reduction in the surface concentrations. The annual mean rBC mass concentration over Bhubaneswar during the present study is 1.34±1.32 µg m−3, and a comparison of rBC mass concentrations reported from selected locations is available in Table 3. In an earlier experiment during winter at Kanpur, a polluted urban area in the central IGP, Thamban et al. (2017) reported rBC mass concentration in the range ∼0.73 to 17.05 µg m−3 with a mean (± standard deviation) µg m−3, which is about twice as high as we have seen at Bhubaneswar at the eastern fringe of the IGP. In a short experimental campaign during pre-monsoon season 2014, Raatikainen et al. (2017) reported average rBC mass concentrations of 11±11 µg m−3 for Gual Pahari (an IGP site close to Delhi) and 1.0±0.6 µg m−3 for the high-altitude site Mukteshwar, in the foothills of the central Himalayas. The significantly higher values seen over the central IGP stations were attributed to the proximity of local emissions. However, our values at Bhubaneswar are comparable to the mean rBC values reported by Liu et al. (2014) over London ( µg m−3) and higher than the values over Paris ( µg m−3, Laborde et al., 2013) but are significantly lower than those reported over several Chinese cities: Beijing (∼5.5 µg m−3, Wu et al., 2016), Shanghai (∼3.2 µg m−3, Gong et al., 2016), Shenzhen ( µg m−3, Huang et al., 2012) and Kaiping (∼3.3 µg m−3, Huang et al., 2011). Our values are higher than the values reported by Wang et al. (2018) over a remote site in the southern Tibetan Plateau ( µg m−3).
Table 3Average refractory black carbon (rBC) mass concentrations at selected locations.
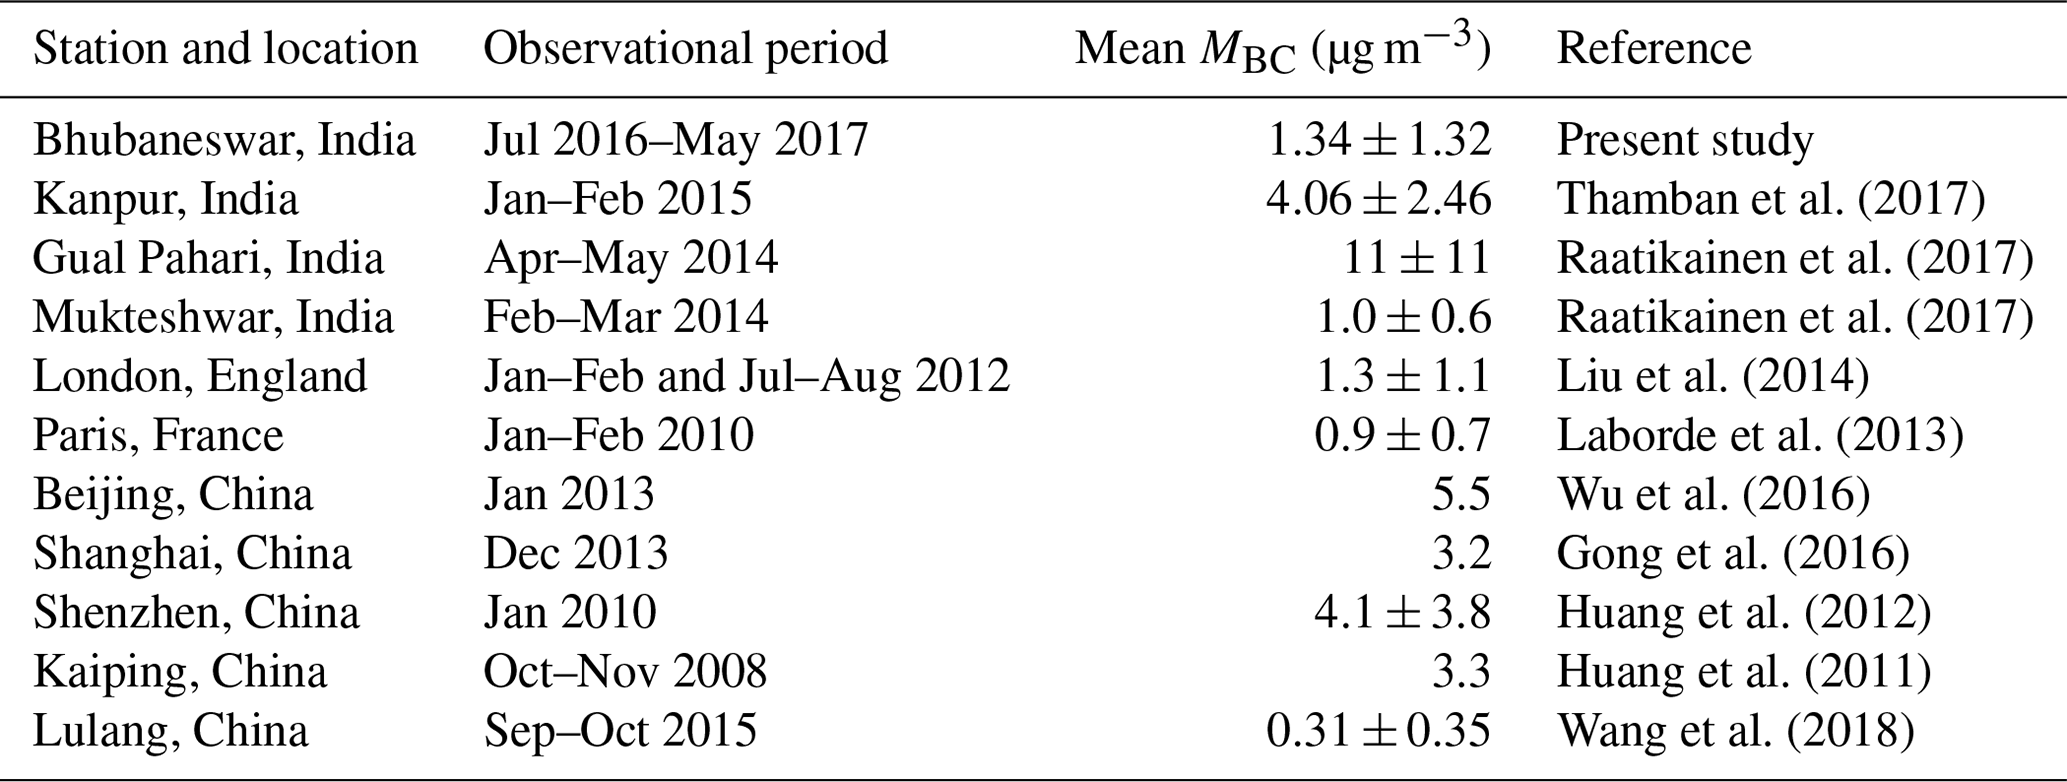
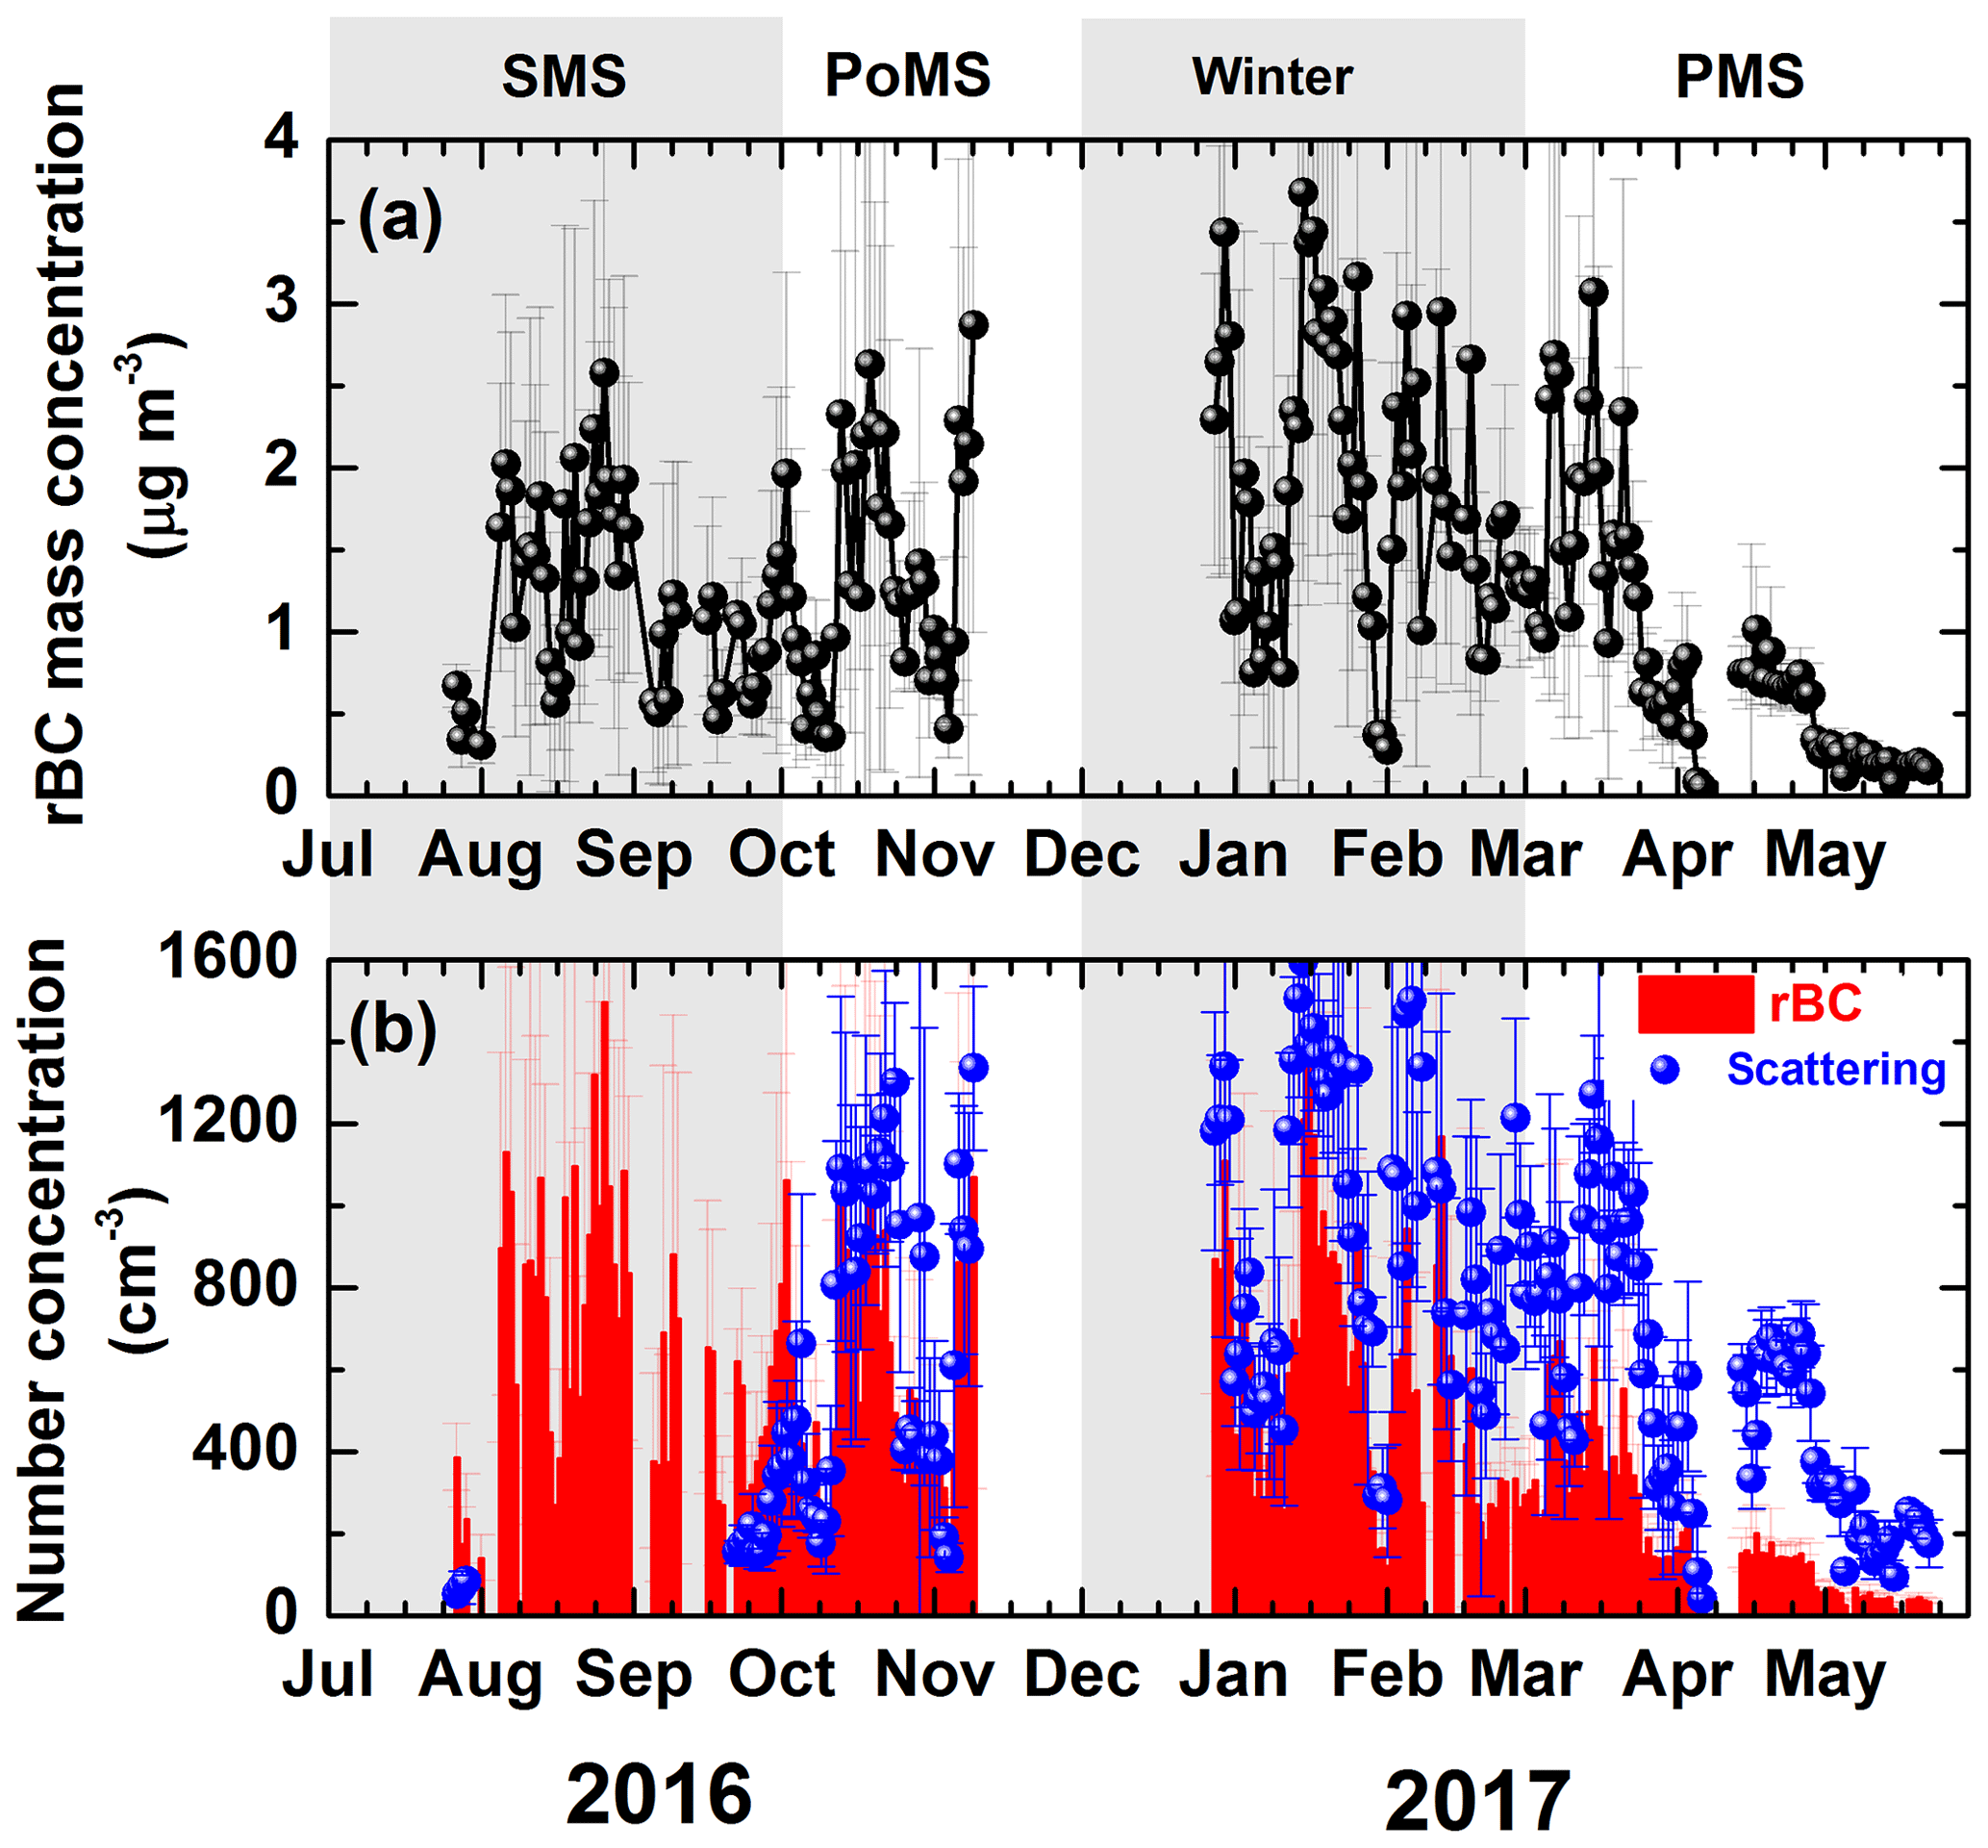
Figure 3Temporal variation of daily mean (a) rBC mass concentration, and (b) number concentration of BC (bars) and non-BC scattering particles (filled circle). The vertical line passing through them is the standard deviation. The shaded areas demarcate the seasons.
3.2 Seasonal distinctiveness of BC size distribution and modal parameters
The size distribution of BC cores is one of the critical factors when determining light absorption characteristics of the aerosols and direct radiative forcing (Reddington et al., 2013). Knowing the BC size distribution (in addition to its coating information) is also vital to understanding the BC life cycle, as BC from different sources would have different sizes and different scavenging mechanisms display different size- and composition-dependent efficiencies which can affect BC ageing process. In the present study, modal parameters (mass median diameter, MMD; and number median diameter, NMD) were determined for each of the BC size distributions by representing them using mono-modal log-normal fits (e.g., Shiraiwa et al., 2007; Schwarz et al., 2008; Liu et al., 2010; Wang et al., 2016) of the following form:
Here A0 corresponds to the mass/number concentration of the mode, Dm is the mass/number median diameter, Dp is the particle diameter, A is the mass/number concentration and σm is the geometric standard deviation. Typical mass and number size distributions and the corresponding modal fit are shown in Fig. 4a, and the temporal variations of daily mean MMD (NMD) values derived from individual size distributions are shown in Fig. 4b and c. Each symbol represents the mean value for the day, and the vertical line passing through it is the corresponding standard deviation. The solid continuous line shows the 30 d smoothed variation, and the dotted vertical lines separate different seasons. Both MMD and NMD gradually increase from their respective minimum values during the summer monsoon season (SMS) through post-monsoon and winter season to reach the highest values during the pre-monsoon season, indicating the progressively dominating share of larger particles in the size distribution.
Previous studies suggested that different sources emit BC particles with varying diameters of core, where smaller modes indicate urban outflow with dominance of fossil fuel sources, and larger modes (> 0.20 µm) are more likely to be associated with solid fuel sources including biomass/coal burning (Schwarz et al., 2008; Liu et al., 2010, 2014; Sahu et al., 2012; Reddington et al., 2013).
Viewed in the light of the above, the lowest seasonal mean MMD µm (NMD µm), occurring during the SMS, highlights the possible dominance of fresh emissions containing smaller-sized particles (and/or externally mixed particles), when washout is also quite significant. As the season advances, MMD and NMD increase, due to ageing processes (including the coagulation of the agglomerates), as the removal mechanism is weakened (significantly low precipitation) during these seasons. The modal values during the post-monsoon and winter seasons (MMD and µm and NMD and µm respectively) are comparable with those reported from continental outflows (McMeeking et al., 2010, 2011; Ueda et al., 2016), suggesting mixed sources and/or aged BC. By the pre-monsoon season, the MMD values reached beyond 0.20 µm and continued to remain so throughout the PMS, highlighting the dominance of larger BC core particles (likely solid fuel, e.g., coal/biomass burning emissions). These seasonally changing size distributions (and MMD values) reflect the combined effect of the nature of sources, the efficiency of sinks and the role of transport. It is challenging to delineate local sources from those in far-field regions that transport BC to the receptor sites. The smaller MMD during the SMS suggests the effective wet removal of larger-sized BC particles, whereas weaker wet removal in the other seasons led to larger MMD values. As evident from Fig. S1, extreme fire events occur over the Indian region during the PMS, which are emitted into deeper boundary layers due to increased temperatures enabling effective dispersion of pollutants both horizontally and vertically, and this results in larger BC cores being observed.
Table 4A Summary of BC mass median diameter from a few selected studies representing different sources in distinct environments.
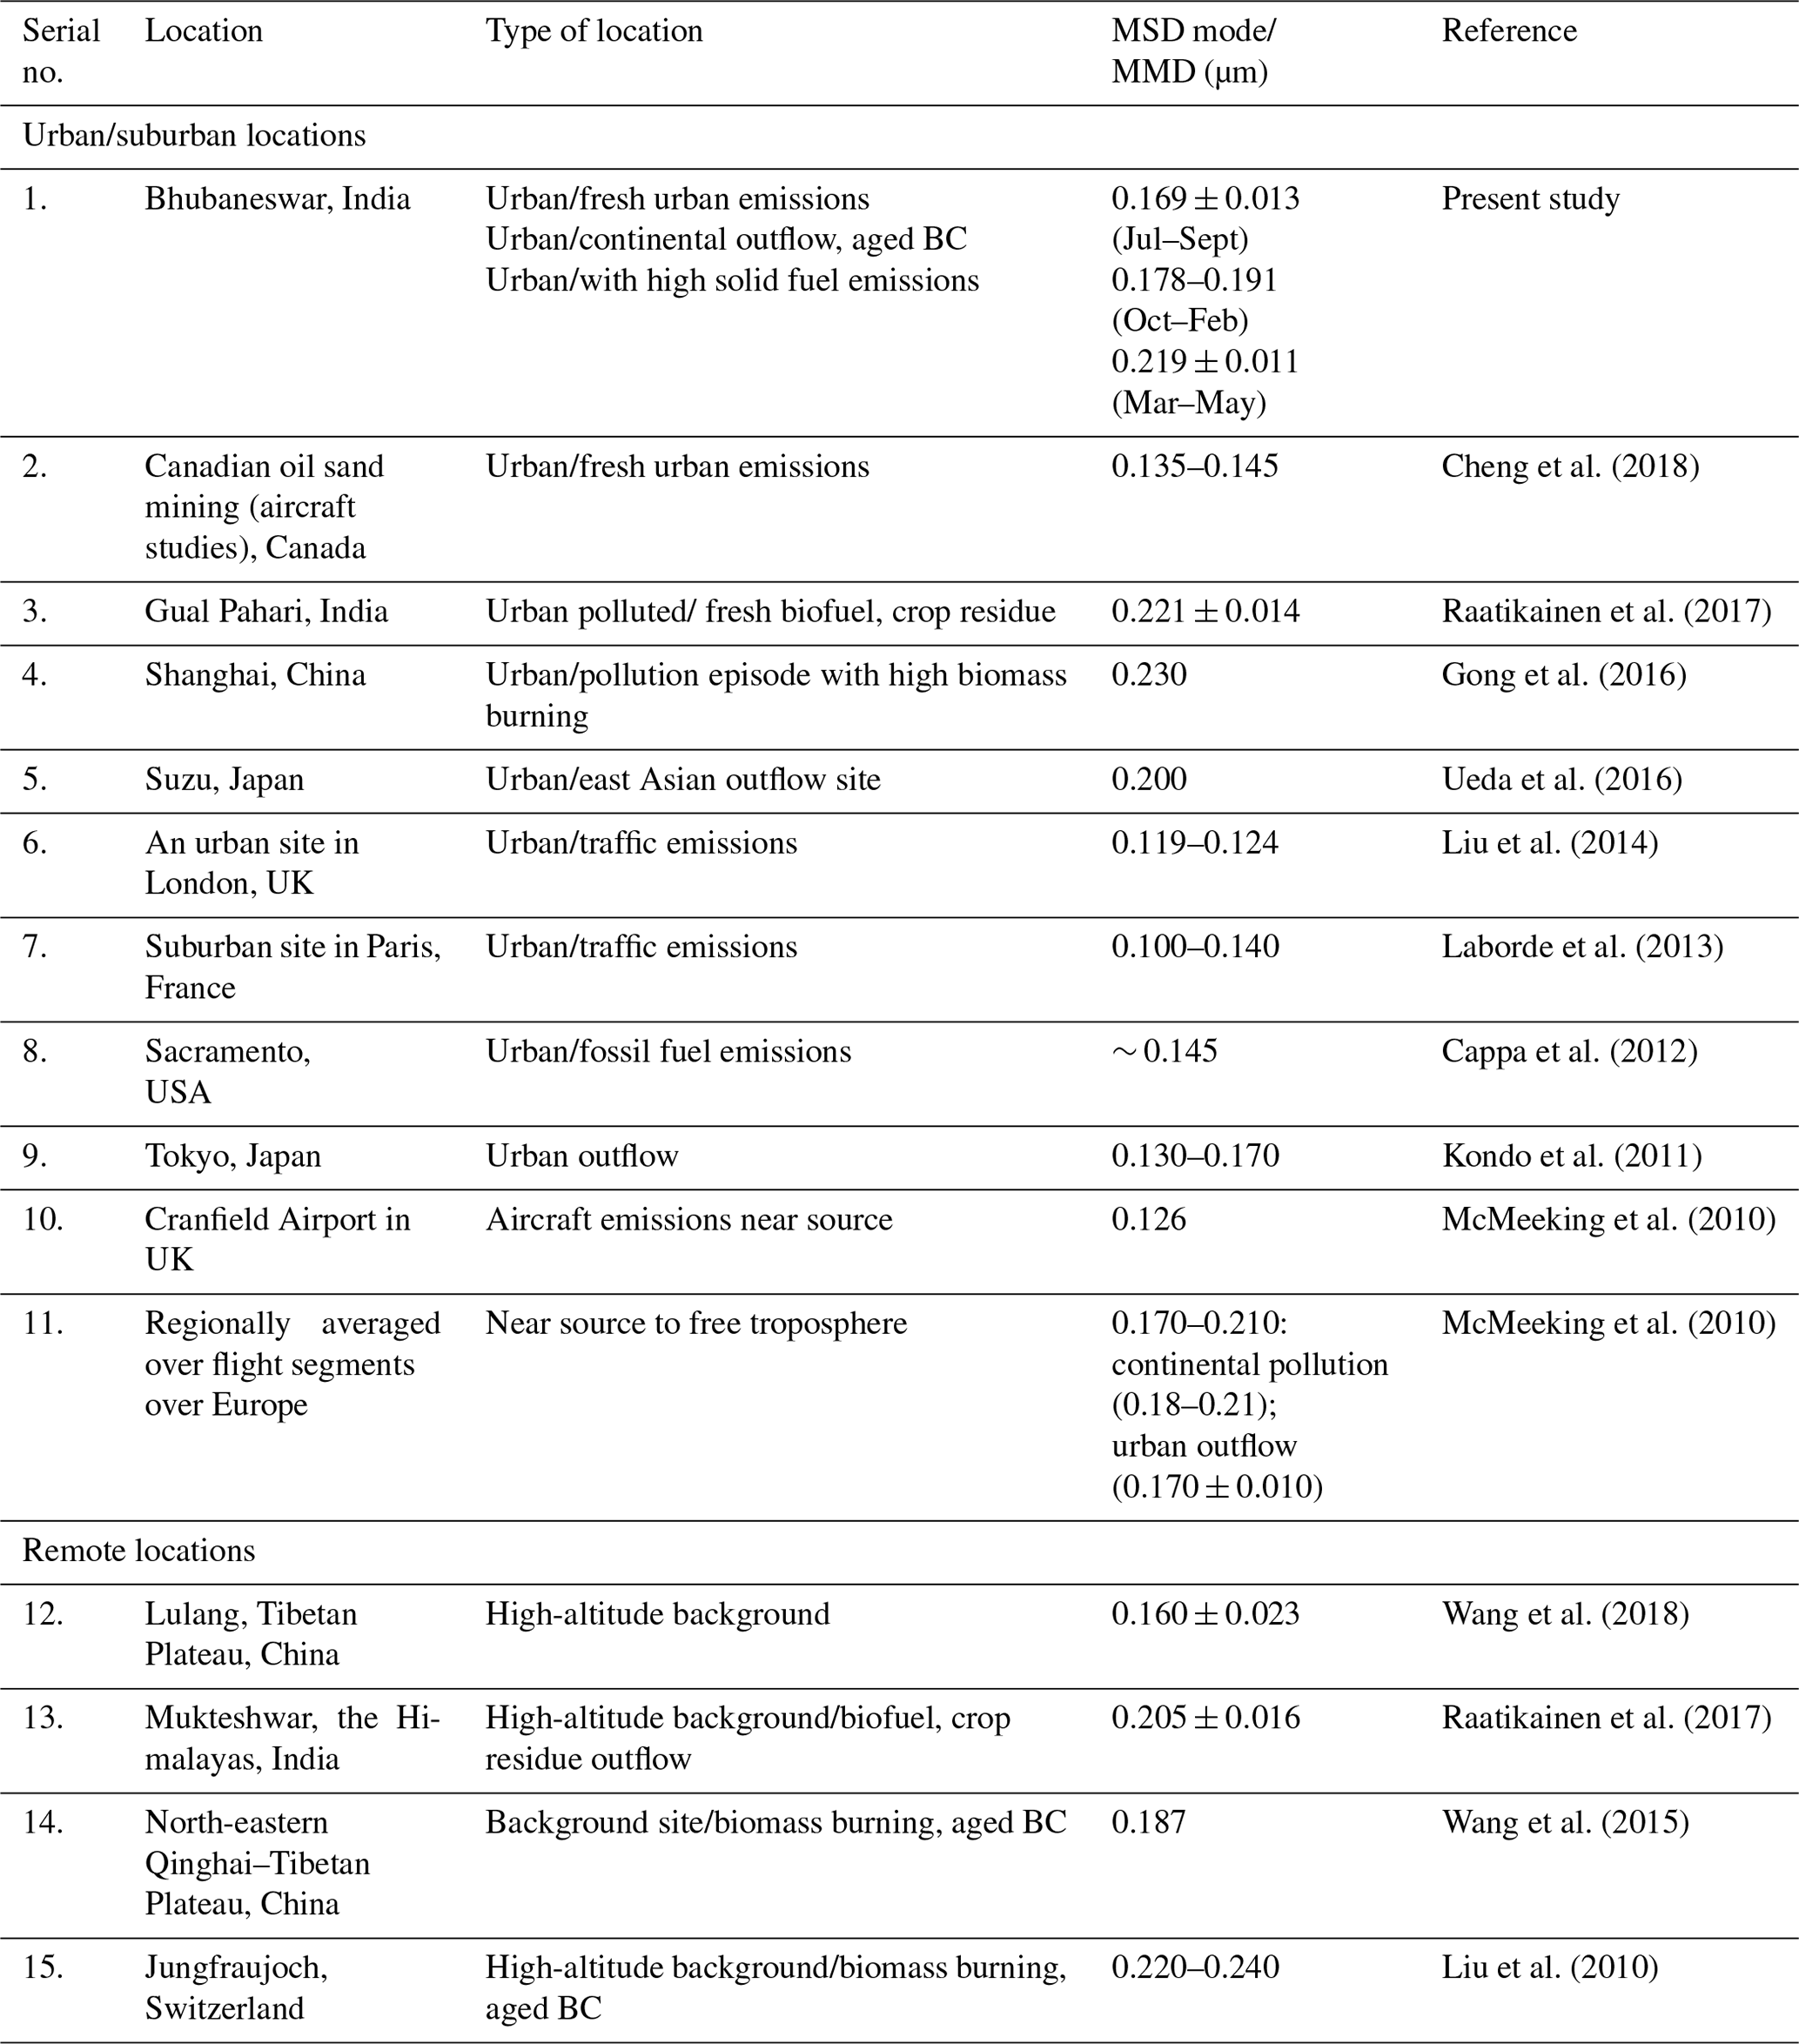
A summary of MMD values that have been reported in the literature with different emission sources and atmospheric conditions along with the present values is shown in Table 4. Several earlier publications reported a range of MMD values (0.100–0.170 µm) for urban regions with near-source fossil fuel emissions (McMeeking et al., 2010; Liu et al., 2014; Laborde et al., 2013; Cappa et al., 2012; Kondo et al., 2011; Cheng et al., 2018), whereas urban/continental outflows are characterized by MMDs in the range of 0.140–0.180 µm (Shiraiwa et al., 2007; Wang et al., 2018). The MMD values are µm for fresh biofuel/crop residue sources (Raatikainen et al., 2017) and in the range ∼ 0.220–0.240 µm for aged BC from biomass burning sources (Liu et al., 2010) or high urban pollution episodes with high biomass burning (Gong et al., 2016). Table 4 highlights the fact that MMD values depend strongly on the nature of BC sources and reiterates that present values depict seasonally changing sources, from fossil fuel dominance in the SMS to solid fuel (biomass or coal burning) dominance in the PMS through mixed sources typical for outflow during the PoMS and winter.
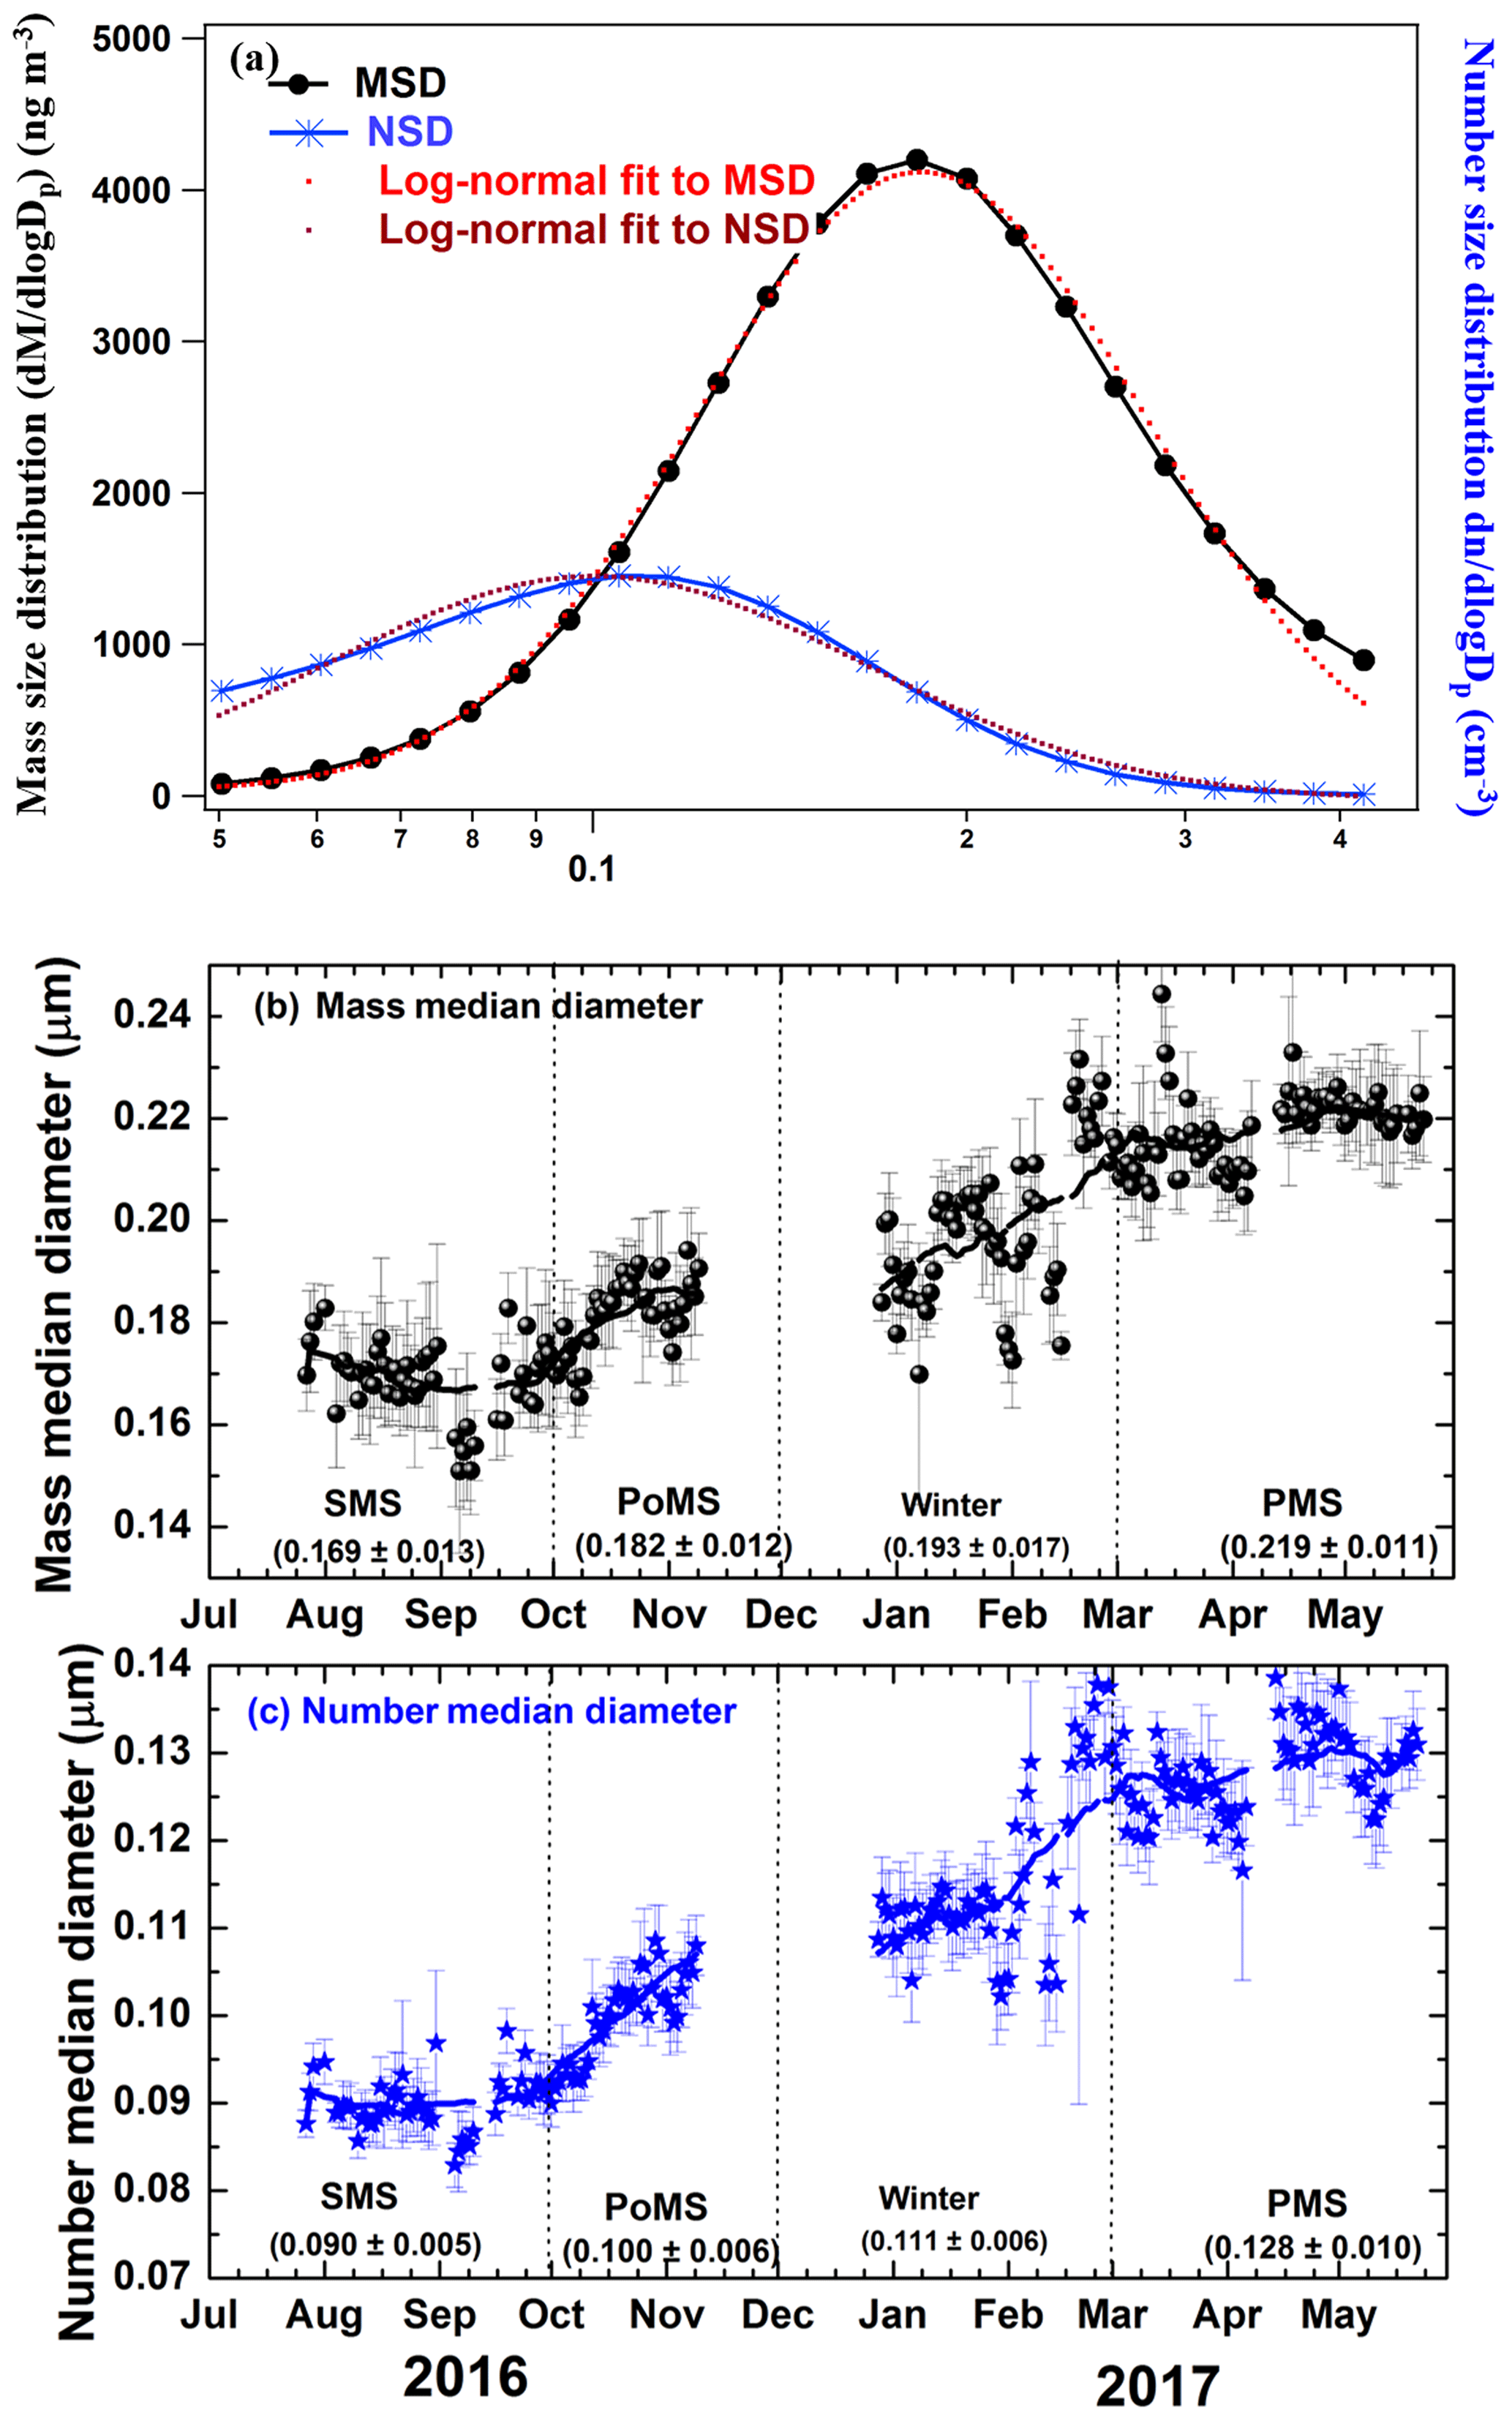
Figure 4(a) Typical mass (number) size distributions along with least-squares fitting to mono-modal log-normal distribution (in dotted lines) used to derive MMD and NMD. (b) Temporal variation of daily mean mass median diameter (filled circle) and (c) temporal variation of daily mean number median diameter (star) of BC; the symbols present the mean value for the day, and the vertical line passing through them is the standard deviation. The solid continuous line shows the 30 d smoothed variation. Dotted vertical lines demarcate different seasons.
3.3 Seasonal changes in mixing state of BC
The mixing state of BC depends on several parameters such as the concentration of condensable species that adsorb or condense on to the BC core, atmospheric humidity, the atmospheric lifetime of BC cores (including photochemical ageing) and the size distributions (Liu et al., 2013; Ueda et al., 2016; Cheng et al., 2018). As the source strengths of condensable species are likely to vary with season (due to seasonality of local emissions, prevailing meteorology and long-range transport), the mixing state of BC would respond to such changes. With a view to examining this, we have quantified the mixing state of BC in terms of the (a) volume-weighted bulk relative coating thickness (RCT ) and (b) absolute coating thickness (ACT ), where Dp and Dc respectively represent the particle diameter and the core diameter. Both of these parameters (RCT and ACT) were determined from BC mass equivalent diameters that depend only on the emission source characteristics and not on the morphology or mixing state of the particles (Liu et al., 2014, 2019; Brooks et al., 2019a). They help to evaluate the changes in physiochemical properties of BC during its atmospheric transit lifetime. While RCT quantifies the extent of coating on a BC core, ACT provides a measure of the thickness of the coating in nanometres. The temporal variations of daily mean values of RCT (half circles) and ACT (star symbol) are shown in Fig. 5, where the solid line represents the 30 d running-mean smoothed variation revealing the seasonality.
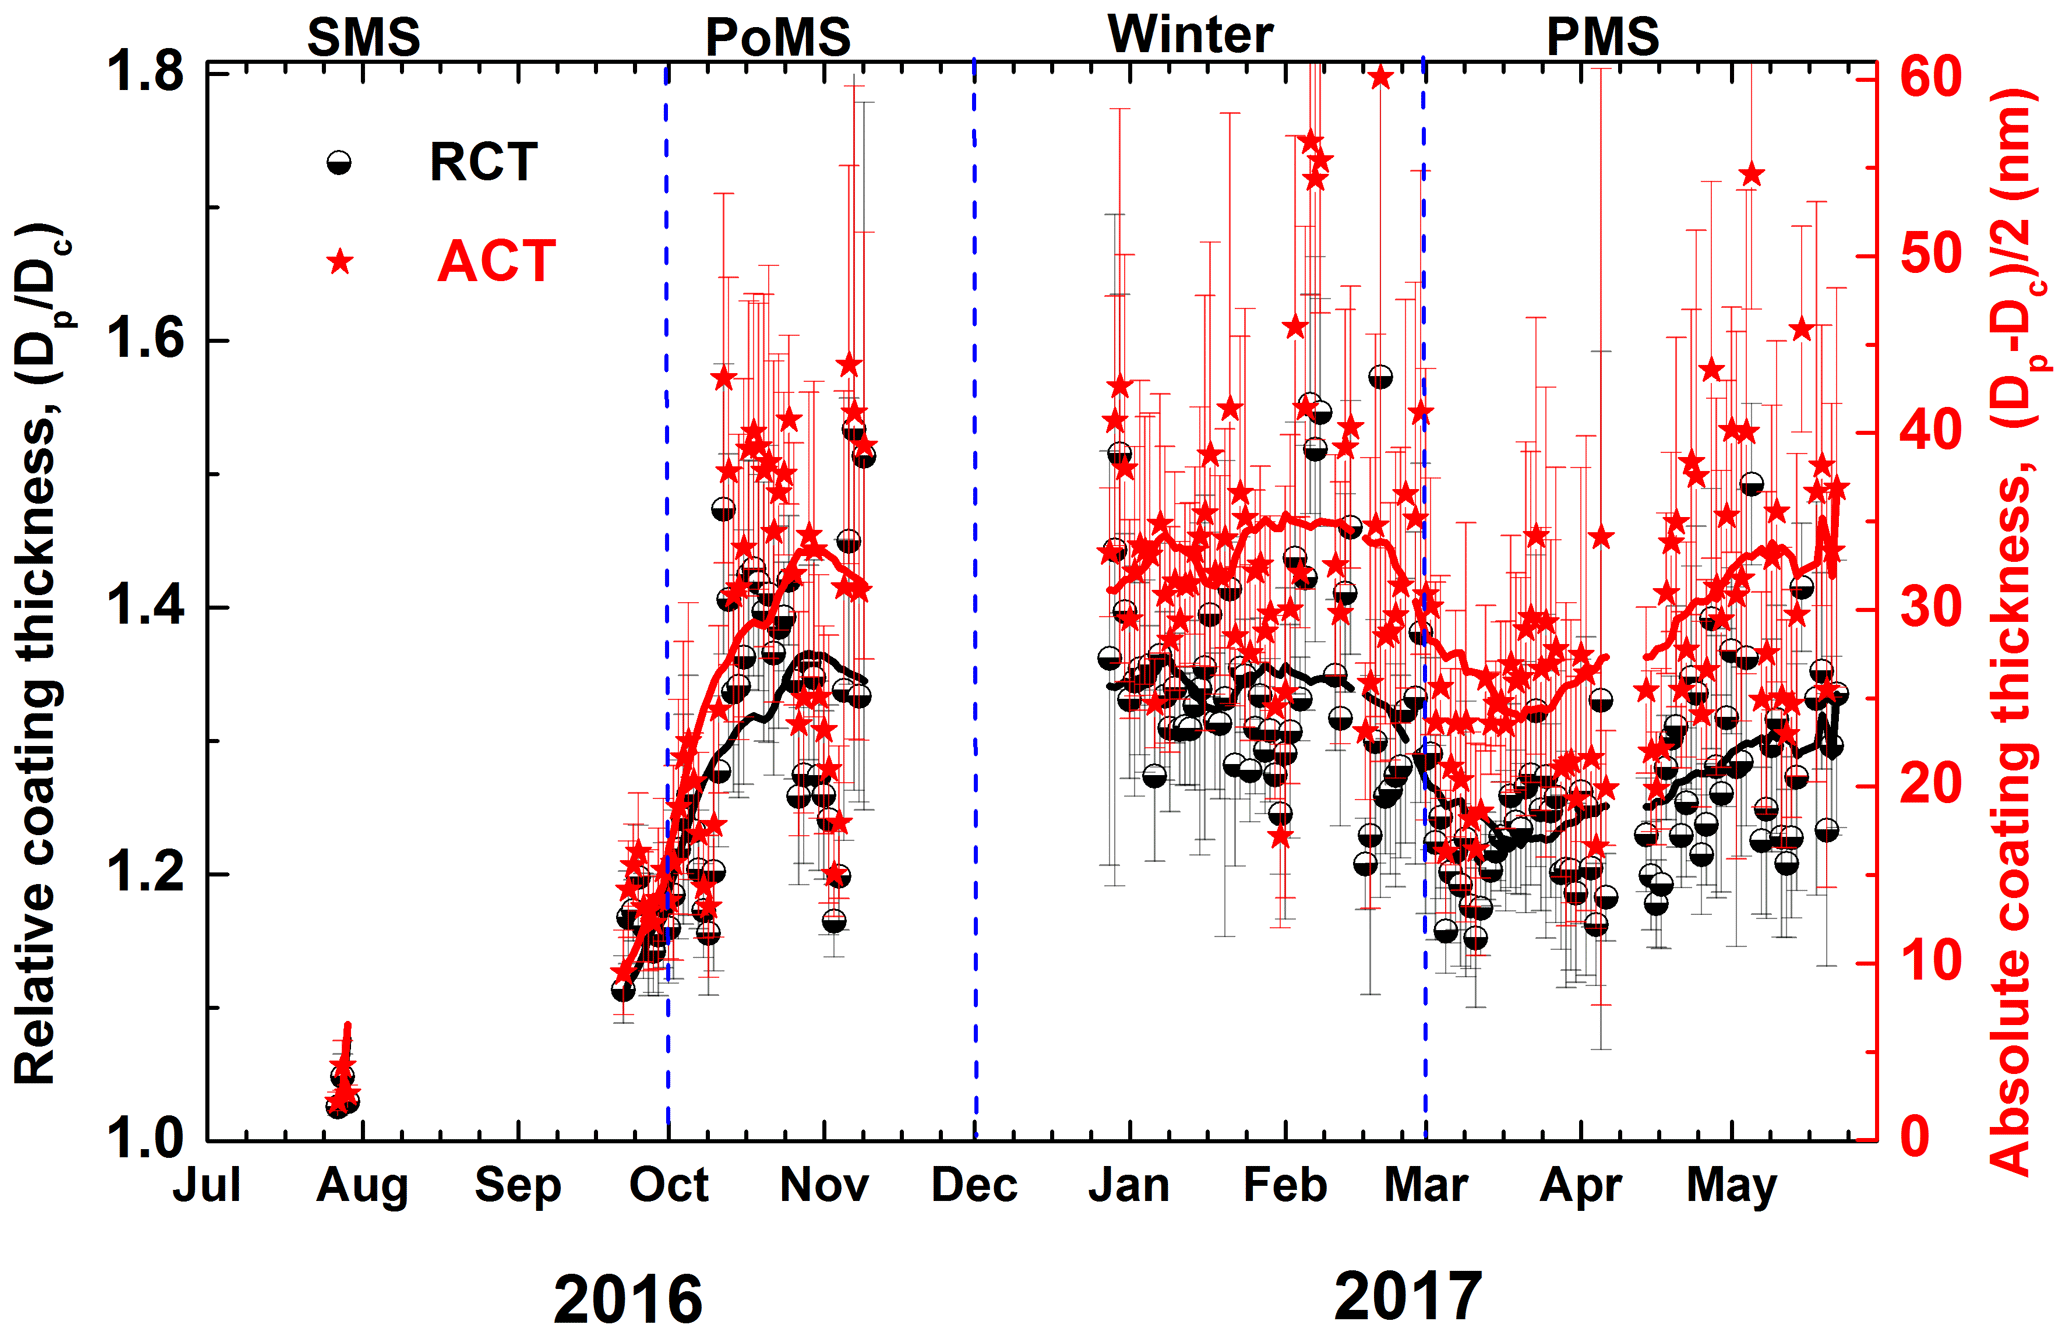
Figure 5Temporal variation of daily mean relative coating thickness (hall filled circle) and absolute coating thickness (star). The symbols present the mean value for the day, and the vertical line passing through them is the standard deviation. The solid continuous line shows the 30 d smoothed variation. Dotted vertical lines highlight different seasons. Due to the failure of the scattering detector between 31 July and 20 September 2016, mixing state parameters could not be estimated.
The figure shows strong seasonality in the coating on BC owing to the effects of the multiple processes discussed above. Both relative and absolute coating thicknesses are very low during the monsoon season and increase gradually towards winter through the post-monsoon (though the increase is not entirely depicted due to a gap in the data). Further, the values slightly dropped during February–March (seasonal transformation from winter to the PMS) and also increased again towards summer. The low values of RCT and ACT during the SMS (seasonal mean RCT and ACT nm) indicate thin coating on freshly emitted small BC cores. This is attributed to (a) the short lifetime of BC in this season due to efficient washout by the widespread monsoon rainfall, (b) the lower concentration of condensable gas-phase precursors also caused by wet removal, and (c) south-westerly/westerly air masses prevailing during this period which advect cleaner marine air to the sample station. Thus, the nascent BC particles which emanated from fossil fuel emissions (as indicated by the lower mass/number median diameters seen in Fig. 4) with reduced coatings prevailed during the SMS. As the season advances to the PoMS, the monsoon activity is subdued, leading to an increased lifetime of BC and a change in air mass (Fig. 2b), resulting in the advection of different types of aerosols and gaseous species from the more polluted north-western IGP (rather than the predominantly oceanic nature of the air mass in the SMS). The air mass is drier than during the monsoon. The particle size distribution shows the increased presence of larger particles and consequently higher median diameters (as seen in Fig. 4) indicating a change in the nature of sources. All these resulted in an increase in the overall coating during the PoMS with seasonal mean values of 1.32±0.14 for RCT and 28.74±12.31 nm for ACT highlighting an enhancement of ∼32 % of the particle sizes due to thick coating of condensable vapours on BC cores during this season. Intra-seasonal variability (as highlighted by the wide range of frequency of occurrence of RCT and ACT values during the PoMS seen in Fig. S2) is also higher during the PoMS. During winter, in general, the RCT values are higher (mean RCT ), and the extent of absolute coating on the cores is also highest (mean ACT nm), suggesting thickly coated BC particles. This is attributed to the availability of condensable vapours advected by the continental air masses (Fig. 2c) and the longer residence time of BC and the larger mode diameters. In winter, the air mass pathways originating from the highly polluted IGP region prevail over Bhubaneswar, with an abundance of condensable species. The combination of prevailing calm weather conditions and absence of precipitation enhanced the life of aerosols, and this resulted in thickly coated BC aerosols. As the season changes to summer/pre-monsoon, the RCT decreased (mean RCT ) because of the larger BC cores (highest MMD values as seen in Fig. 4), while the absolute coating thickness remained high (mean nm). This occurred as a result of the relative increase in larger particles, which for the same RCT leads to higher ACT.
The seasonality of the coating characteristics in the present study is further demonstrated in Fig. S2 and described in the relevant discussion in the Supplement. Based on their study during a heavy-air-pollution episode in Shanghai, Gong et al. (2016) reported instantaneous ACT values ranging between 50 and 300 nm in different number size regimes with distinct sources and ageing processes of BC. Such high magnitudes of ACT are possible in the extremely polluted air masses in the immediate vicinity of sources. The coating on BC particles enlarges the available absorption cross section and results in absorption enhancement. Moffet and Prather (2009) examined the sensitivity of optical properties to the microphysical properties of BC and found absorption enhancement in the ranges from 1 (for no coating) to 3.4 (for largest particle sizes). They reported more substantial absorption enhancements (1.6) for larger shell / core ratios (RCT ∼ 1.75) obtained for the aged BC, compared to fresh BC (absorption enhancement of 1.4 and RCT ∼ 1.07). Direct comparison of the coating parameters (RCT and ACT) in the present study with other studies is not possible. This is because of the difficulties in comparison across studies as detailed by Cheng et al. (2018), which include different system configurations, the difference in techniques used in the fitting of scattering amplitudes and the range of mass equivalent diameters.
3.4 Diurnal variations of rBC mass concentration and RCT
At shorter times scales (within a day), the mesoscale processes and atmospheric boundary layer (ABL) dynamics are influential in modulating the mixing characteristics of BC (for example, Liu et al., 2014; Laborde et al., 2013). The seasonal mean diurnal variations of BC mass concentration (red star symbol) and relative coating thickness (RCT) (blue filled circle) shown in Fig. 6 reflect these processes. The vertical lines in each panel in the figure mark the local sunrise and sunset times for the season.
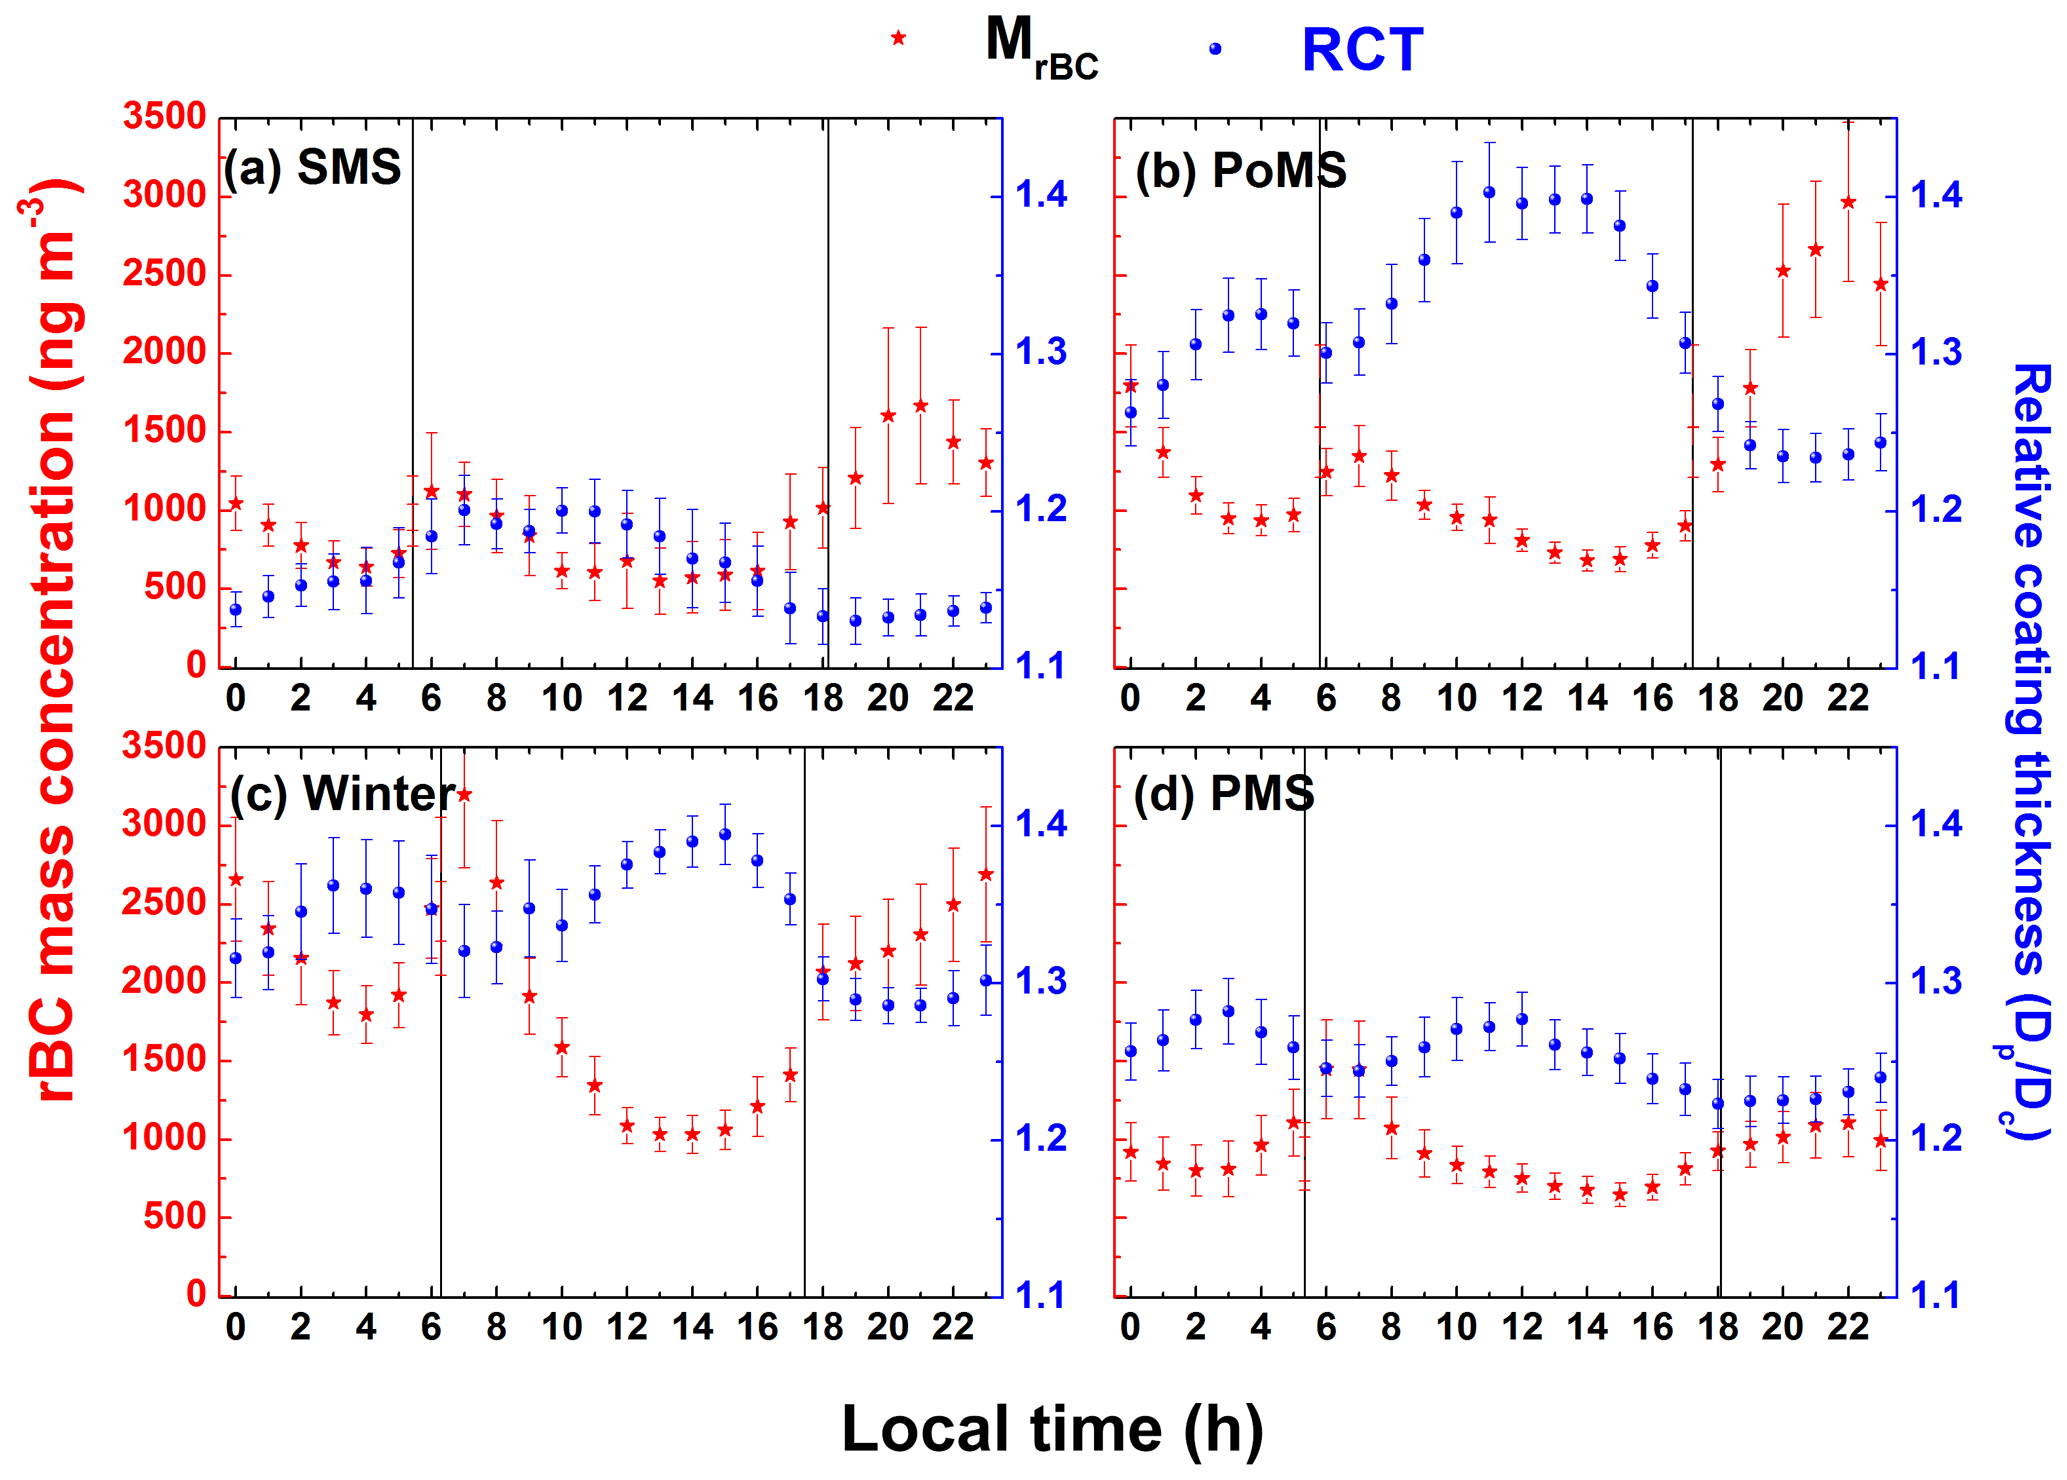
Figure 6Diurnal variation of (a–d) rBC mass concentrations and relative coating thickness (RCT) in different seasons. The vertical lines denote the sunrise and sunset. The vertical bars through solid points are the standard errors from the mean.
In addition to the typical double-humped diurnal variation of BC mass concentration, which arises due to the combined effects of atmospheric boundary layer (ABL) dynamics (Kompalli et al., 2014) and diurnal variation of the anthropogenic activities, very interesting links between BC core and relative coating thickness are noticeable from the figure. While BC and RCT depict the double-humped diurnal variation, they were almost in the opposite sense, and the amplitude of the BC variation has a marked seasonality. It is caused by the seasonal change in the diurnal variation of the ABL driven by seasonal changes in surface heating and resulting thermal convection. The highest amplitude occurs in winter since the diurnal variation of the ABL is greatest due to the high variation in surface temperature, with ΔT (i.e., Tmax−Tmin) ∼ 12 ∘C over a 24 h period (Tmax and Tmin are maximum and minimum temperatures). Conversely, the lowest amplitude occurs during the monsoon season, when thermal convection is highly suppressed due to the overcast sky; low surface heating and the surface energy balance is dominated by latent heat (the average diurnal amplitude of temperature variation, ΔT∼4.9 ∘C). The diurnal variation in BC mass concentrations and the factors determining it over the Indian region have been widely reported (e.g., Beegum et al., 2009; Mahapatra et al., 2013a; Kompalli et al., 2014); however, the diurnal pattern of the BC mixing state has not been previously observed. More intriguing is the sense of variation opposite to that of BC, with peaks occurring around 02:00 to 04:00 and 12:00 to 15:00 local time with troughs in between.
As previously discussed, the increased RCT values are associated with ageing of BC cores and availability of condensable vapours (which are generally co-emitted with BC or produced photochemically from species that are co-emitted). As a result, the peak in RCT during daytime can be attributed to the abundance of condensable material originating due to photochemistry and thus gas-phase photochemical processing leading to enhancement in the extent of coating (Liu et al., 2014; Chakraborty et al., 2018; Brooks et al., 2019b). The second peak occurring during late-night–early-morning periods is more likely to be linked to the increased ageing of BC that arises because of the lack of fresh emissions on the one hand and a reduced condensation sink due to a decrease in the concentration of pre-existing non-BC particles (e.g., Babu et al., 2016, and references therein) on the other. The amplitude of the daytime peak in RCT is greater than, or equal to, the early morning (dawn) peak due to two factors: (a) enhanced dispersion during daytime due to increased convective mixing results in reduced particle abundance, thus increasing the probability of enhanced vapour adsorption on individual particles; and (b) daytime build-up of possible coating material due to photochemistry (which is a stronger factor than the first one) – both of these conducive conditions are not available during early morning. ACT also showed a similar pattern to RCT but with a much more pronounced diurnal variation, whereas there is no discernible variation in the diurnal pattern of MMD (Fig. S3).
The morning peak in BC mass concentration, occurring shortly after sunrise, is due to the well-known fumigation effect, i.e., when the thermals generated after the sunrise break the inversion and bring down the pollutants from the residual layer, as has been discussed in several papers (Beegum et al., 2009; Kompalli et al., 2014; Babu et al., 2016). Also, rush hour concentration due to the build-up of vehicular traffic contributes to this. The succeeding trough is due to enhanced convective mixing and deepening of the ABL. After sunset, as the thermals subside, the shallow nocturnal boundary layer sets in, and the resulting stable conditions lead to the second peak due to confinement of the aerosols near the surface. Further, lower temperatures and wind speeds coupled with reduced emissions result in a gradual decrease in BC mass concentration leading to a night-time minimum.
Interestingly, during the morning period when the BC mass concentration peaks due to the combined effect of the boundary layer dynamics (fumigation effect) and sources (rush hour traffic contribution), RCT was at a minimum. This suggests that fresh emissions from rush hour traffic, which would push up the BC concentration and lower the RCT, outweigh the fumigation effect, though both may be occurring around the same period. The diurnal variation is more pronounced during the PoMS and winter (Fig. 6b, c) and subdued during the SMS and the PMS (Fig. 6a and d), owing to varying strength of ventilation of aerosols due to changes in the atmospheric boundary layer dynamics in different seasons (Kompalli et al., 2014). Similarly, the amplitude in the diurnal variation of RCT is highest in the PoMS (RCT changing from 1.42 to 1.25), followed by winter, and mostly subdued during the SMS and PMS. The diurnal variations in RCT are suppressed in the SMS and PMS compared to the winter and PoMS due to the seasonality of the boundary layer dynamics that modulates the concentrations of BC and the other condensing species. In addition to this, the wet scavenging by intense rains during the SMS ensures that a greater proportion of the remaining BC in the atmosphere is likely to be freshly emitted. Such extensive precipitation also leads to a reduction in concentrations of the coating substances. During the PMS, BC particles generally have larger core sizes, and the relative coating thickness is reduced in magnitude. These effects also play a role in shaping the diurnal pattern.
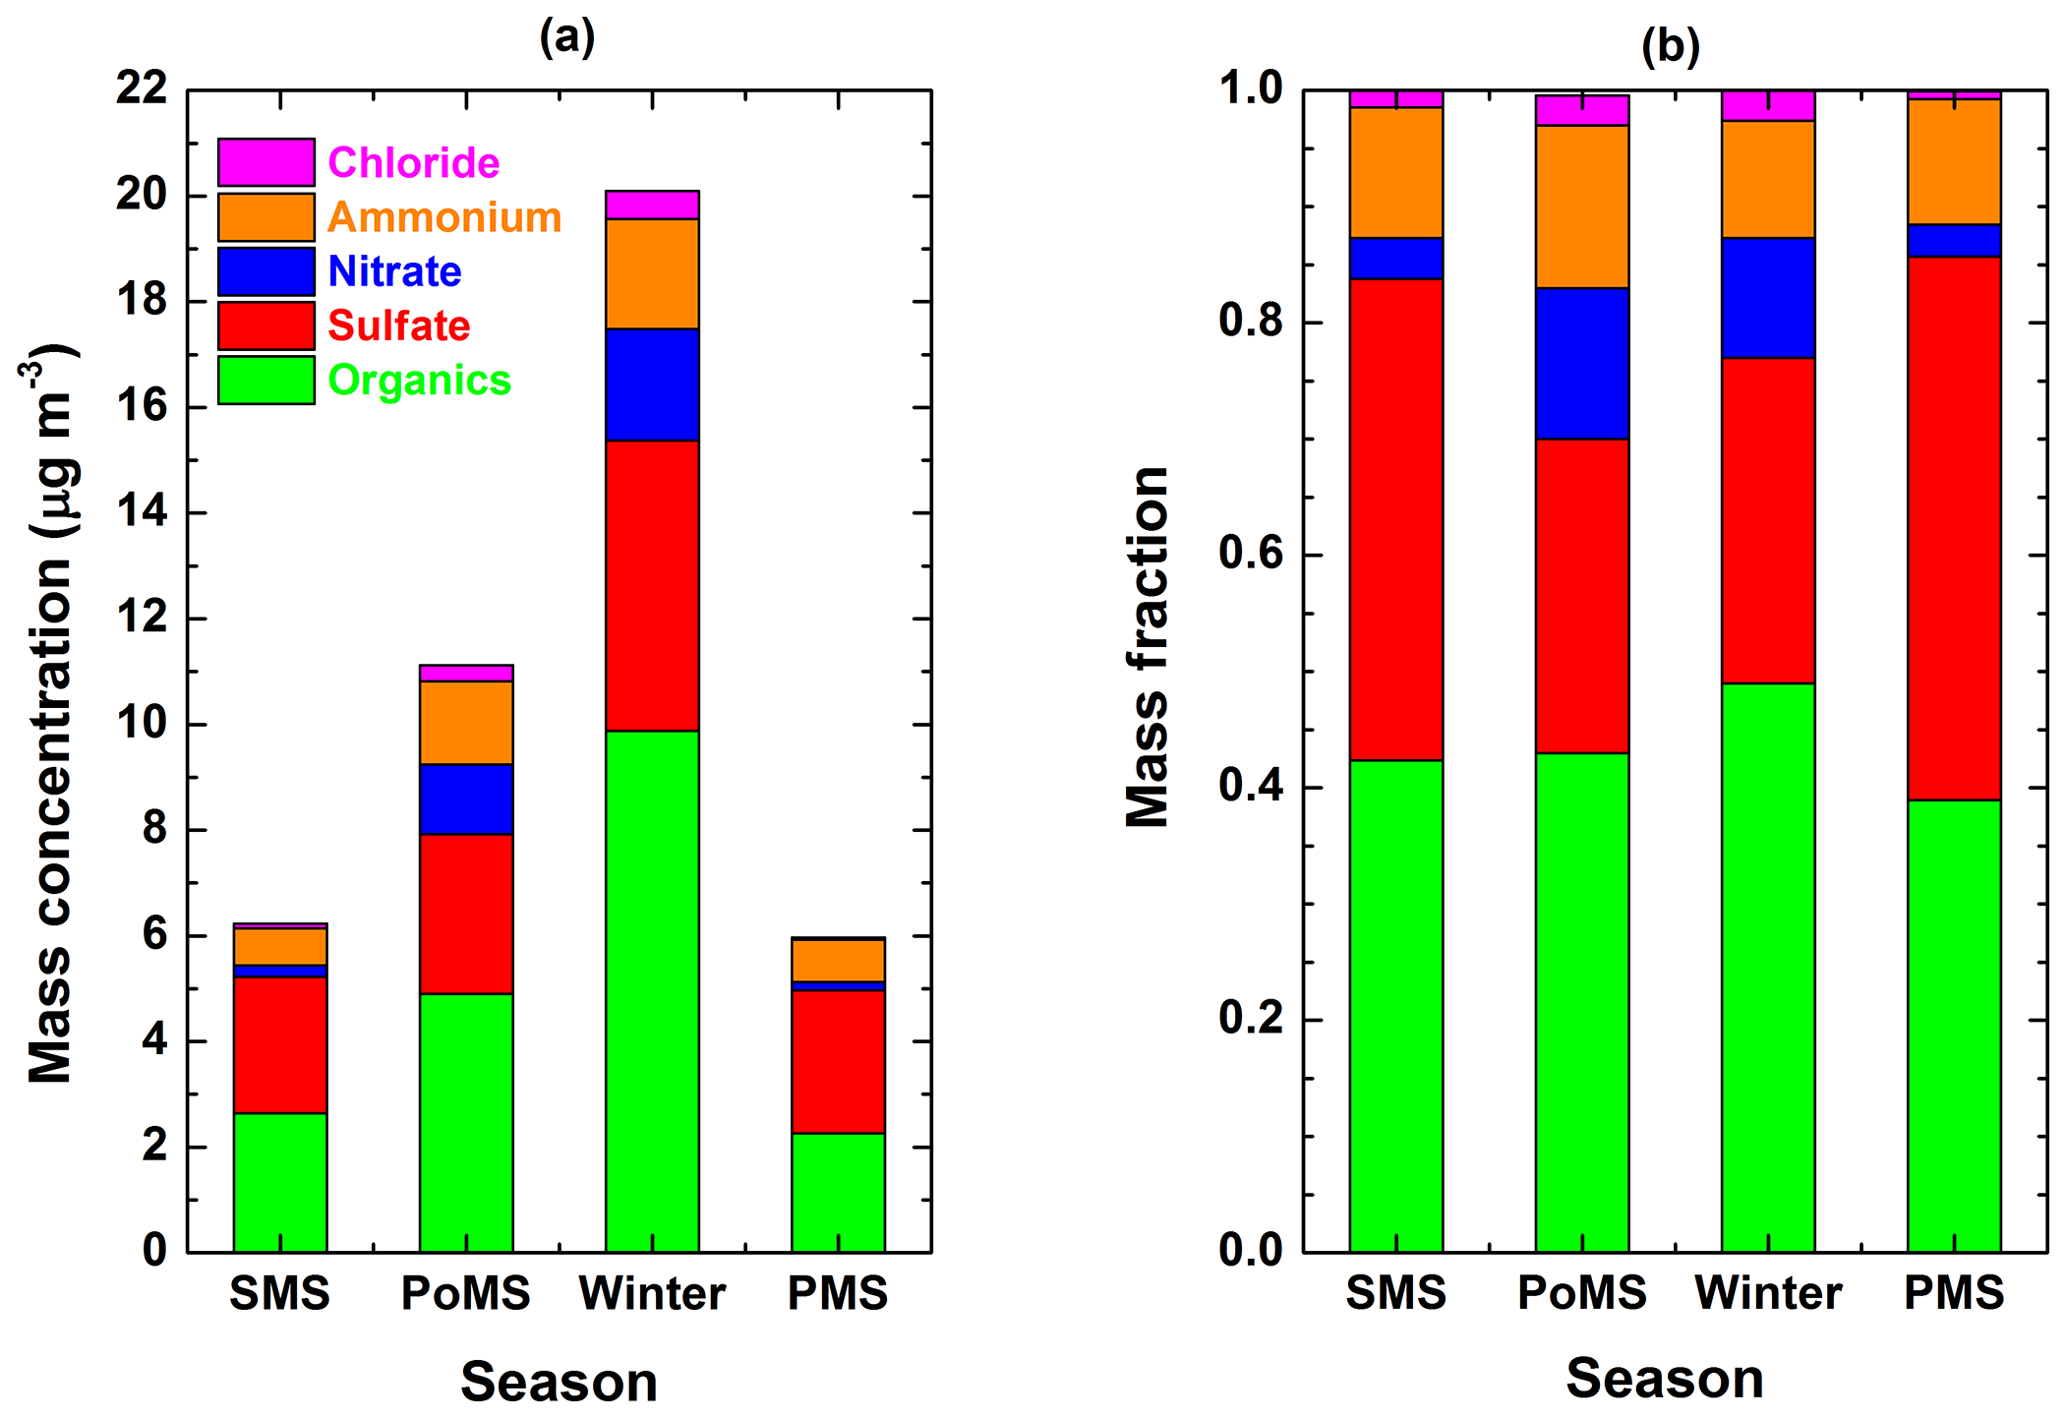
Figure 7Seasonal variation of (a) mass concentrations and (b) percentage contributions to the total mass concentration of different species (organics, sulfate, nitrate, ammonium and chloride).
3.5 Non-refractory PM1.0 mass concentrations
To identify the likely coating material on BC cores, mass concentration and chemical composition of non-refractory PM1.0 (NR-PM1) aerosols obtained from the measurements of the ACSM are examined.
The seasonal mean mass concentrations and fractional contribution of different species (organics, sulfate, nitrate, ammonium and chloride), as deduced from the ACSM measurements, are shown in Fig. 7. There is a clear seasonal change in chemical composition associated with distinct air masses and a wide variety of sources. As expected, the mass concentration was highest during winter (20.45±22.55 µg m−3) followed by the PoMS (13.90±10.62 µg m−3) due to the combined effects of reduced removal, confinement of aerosols near the surface due to the shallow boundary layer and change in characteristics of long-range transport. Examination of the mass fraction (MF) revealed that organics (0.39–0.49) were the dominant component, with the highest fraction in winter (0.49). Sulfate, the next major contributor (MF varied in the range 0.27 to 0.47), showed strong seasonality, being highest in the PMS (0.47), followed by the SMS (0.41), and lowest in winter (0.27) and the PoMS (0.28). It is further corroborated by the airborne aerosol mass spectrometer (AMS) measurements during SWAAMI (Brooks et al., 2019b), which have shown significant presence of sulfate in the central IGP extending to higher altitudes even during the monsoon season. Ammonium, nitrate and chloride are only minor components of the NR-PM1 mass loading. The significant presence of nitrate during the PoMS and winter (14 %) likely arises as a result of advection of anthropogenic emissions from the central IGP and from enhanced ammonia emissions during the growing season and colder temperatures, favouring NH4NO3 formation.
It is clear that when the IGP air masses prevailed (PoMS and winter) organics dominated the NR-PM1 mass concentration, while during mixed/coastal air masses (SMS and PMS) sulfate was either equally important or prominently contributed to NR-PM1 mass concentration, clearly depicting seasonal contrast in the mass concentrations with the changing nature of sources in distinct air masses.
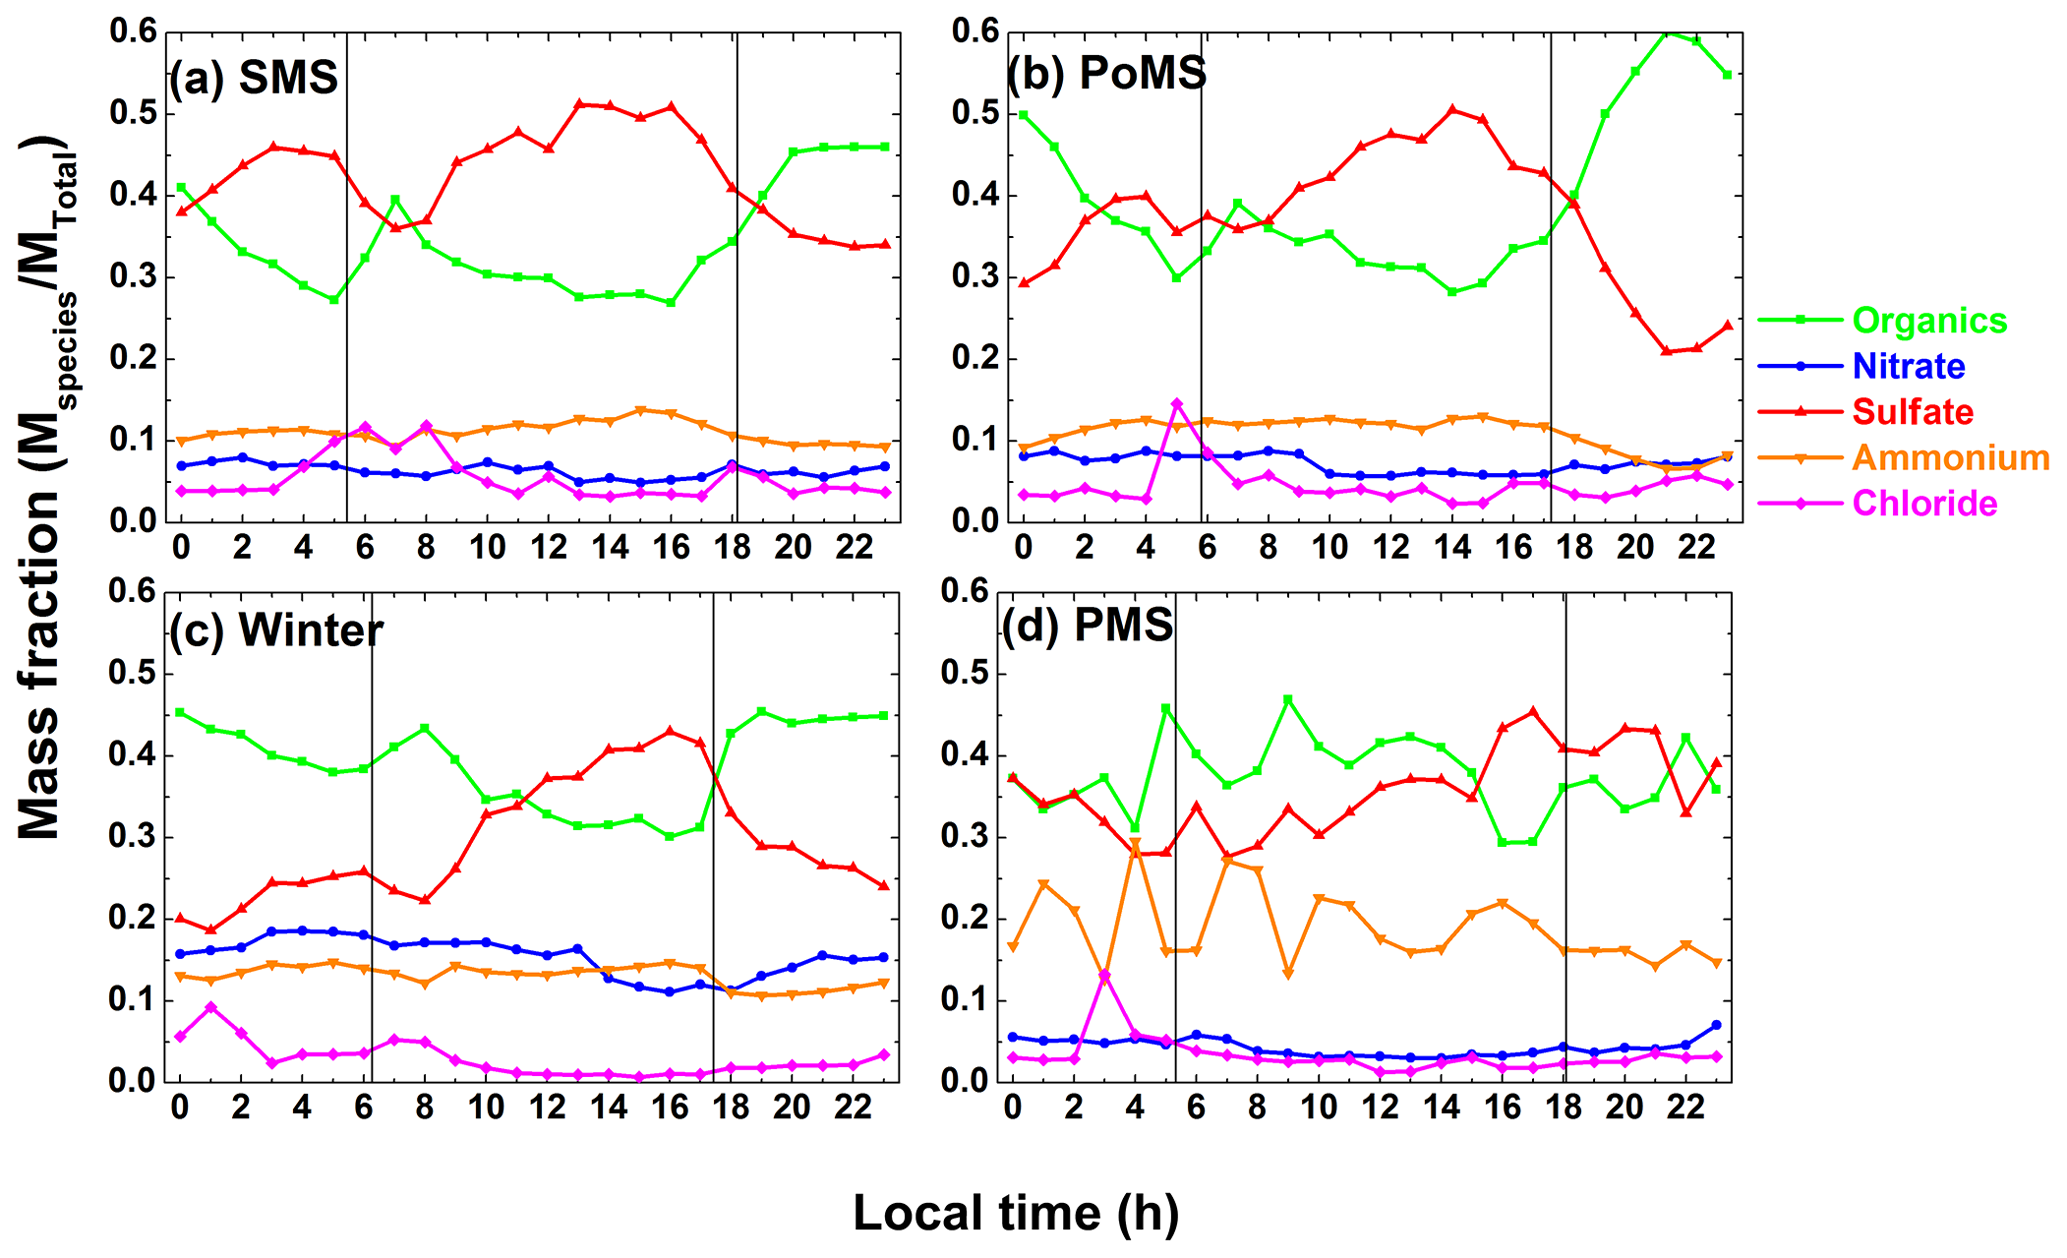
Figure 8Diurnal variation of mass fraction of different species (organics, sulfate, nitrate, ammonium and chloride) of NR-PM1 in different seasons.
Earlier studies (e.g., Kumar et al., 2016; Thamban et al., 2017; Chakraborty et al., 2018, and references therein) have examined the NR-PM1 chemical composition over Kanpur, an urban location in the central IGP, using an aerosol mass spectrometer (AMS), and reported the dominance of organics during the PoMS and winter. Pandey et al. (2014) developed a multi-pollutant emission inventory for different sectors of India and reported that residential biomass burning (cooking stoves) is the most significant contributor for PM2.5 and organic carbon aerosols. Recently, from the molecular analysis of the PM2.5 emissions over a village in the IGP, Fleming et al. (2018) have characterized a wide range of particle-phase compounds produced by traditional cook stoves and pointed out that various organic compounds originate from these sources. Viewed in this context, the dominance of organics in the IGP outflow is not surprising. From their filter-based chemical composition measurements over Bhubaneswar, Mahapatra et al. (2013b) have suggested that the sources of were anthropogenic, crustal and marine, with the major contributor being the anthropogenic sources. So sulfate is possibly of mixed origin and present in significant proportions, more so during non-IGP air mass periods (SMS and PMS).
3.6 Association between rBC relative coating thickness and NR-PM1 chemical species
In this section we examine the association between BC mixing state and NR-PM1 chemical species on diurnal and seasonal timescales. It is worthwhile to examine the diurnal pattern of NR-PM1 species which are likely to act as coating substances and understand any possible association with that of RCT. To evaluate this in terms of the relative magnitude of each species, hourly averaged mass fractions of organics, sulfate, nitrate, ammonium and chloride aerosols are considered, and the seasonal mean diurnal variation of these species is shown in Fig. 8. It is seen that sulfate dominated during the daytime in the PoMS, winter and the PMS, with a diurnal variation that resembled that of the RCT (Fig. 6) during these seasons. The diurnal variation indicates strong photochemical production of sulfate from gas-phase chemistry. The weak nature of the daytime peak in sulfate during the PMS may be attributed to enhanced dispersion resulting in lower near-surface concentrations which overcomes photochemical production. The organics dominated during the night, which is due to a combination of factors including source processes and photochemistry, and their diurnal variation is almost opposite to that of the RCT. The diurnal variations of organics depict two pronounced peaks occurring during the morning (06:00–08:00) and late evening (20:00–22:00), similar to the rBC mass loading.
The diurnal pattern of other species (nitrate, ammonium and chloride, whose concentrations were lower except in winter) followed a pattern similar to organics but with less variation. Absence of daytime enhancement of nitrate and ammonium indicated that photochemical production might not be significant or possibly gas-particle partitioning favoured the gas phase at higher temperatures.
It is challenging to determine the exact coating material on the atmospheric BC particles in a multi-component system containing organic and inorganic aerosols, as well as gaseous vapours. The association between the diurnal variations of organics and sulfate and BC mixing state as represented by RCT presents two possibilities of having different coating material on BC during a day. Similar diurnal variations in RCT (as seen in Fig. 6) and sulfate suggest the possibility of sulfate serving as the most probable material. However, organic matter can also contribute to the BC coating material due to its huge abundance in particles of submicrometre sizes. This is particularly true during the late evening periods, when concurrent peaks in the mass fraction of organics and rBC mass loading occur, a significant fraction of which could be secondary in nature. The extent of contribution of each species depends on processes such as gas-phase chemistry, production of condensable vapours and strength of the condensation sink.
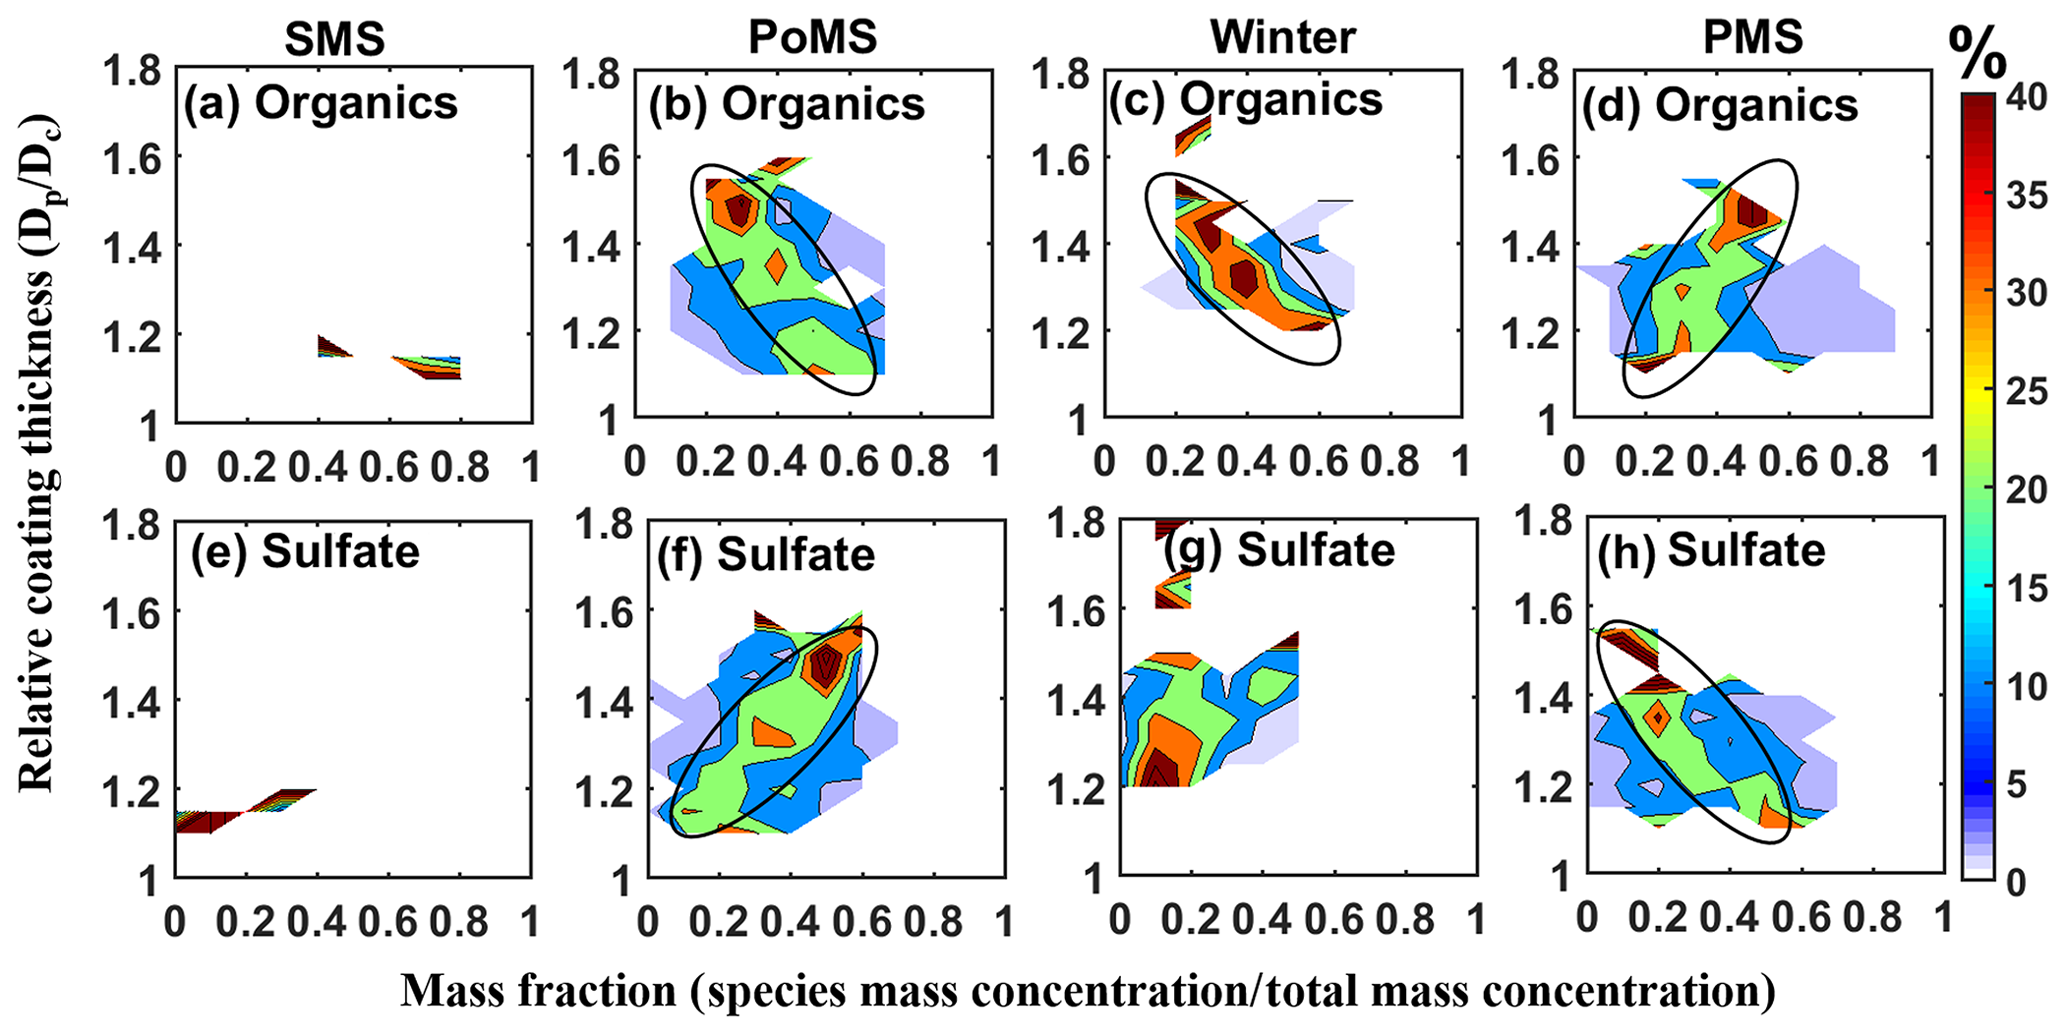
Figure 9Association between mass fraction of organics (a–d) and sulfate (e–h) with relative coating thickness during different seasons. The colour bar indicates the percentage of occurrence of RCT for corresponding MF values of the species.
Boundary layer dynamics and source processes play an essential role not only on particle loading but also in determining the coating (Liu et al., 2014; Gong et al., 2016; Thamban et al., 2017; Wang et al., 2018). Increased ventilation during daytime due to enhanced boundary layer heights dilutes aerosol concentrations, thereby reducing competition among particles for adsorption of condensable vapours. The concentrations of freshly produced particles with little or no coating arising from primary as well as secondary sources are, in general, greater during day. Since condensable species are greater in the daytime, this enables more efficient adsorption on these particles compared to relatively aged particles during the night which are already coated or internally mixed due to ageing. A greater fractional change can occur more quickly on fresh BC particles compared to particles which are already thickly coated since a much smaller amount of condensable material is required. Further, the distinct nature of sources of various species is also a key factor. The majority of the BC and organic aerosol is produced in locations away from the sulfate sources. At night in a collapsed ABL with stable conditions local sources predominate, leading to enhanced BC and organics but with reduced sulfate. In contrast, during the day in a well-developed ABL both near-field and far-field sources contribute. This process changes the balance of sulfate to organics mass concentrations and also the RCT of the BC.
Our observations indicate enhanced sulfate occurs due to photochemistry. Besides, the possibility of organic matter acting as a coating material is not ruled out since secondary organic aerosol is known to have a photochemical origin (Chakraborthy et al., 2018). Thamban et al. (2017) reported an increase in oxygenated organic species during the daytime, with a diurnal trend similar to the fraction of thickly coated BC.
Further, we examined the seasonal variation in the association between the mass fractions of different species with simultaneous RCT values by considering hourly mean values of both parameters. The association between hourly mean RCT and MF of organics and sulfate (the dominant NR-PM1 species) for different seasons is shown in Figure 9 (other species did not show any perceptible association). The colour bar indicates the percentage of occurrence of a particular value of RCT for a corresponding MF value of the species considering the entire data set for that season. During the SMS (Fig. 9a and e), since there are very few available simultaneous observations of RCT and MF, no conclusion about their association can be drawn, and also the extent of coating is very much reduced during this season. During the PoMS, when the IGP outflow air masses prevailed, instances of higher RCT decreased with increasing MF of organics, whereas the association is the opposite between RCT and MF of sulfate (Fig. 9b and f). This suggests that sulfate may be the possible preferential coating substance, as increasing fractions of sulfate in the total mass concentrations contributed to the enhanced coating on BC particles.
During winter (Fig. 9c and g), similar to the PoMS, increasing MF of organics has a negative correlation with RCT, whereas the MF of sulfate did not show any clear association. As the season changes to the PMS, the association between RCT and MF is reversed to what it was during the PoMS, with the population of highly coated particles decreasing with increasing MF of sulfate, while RCT increased with increasing MF of organics. It is known that the nature of the initial coating and mixing state of BC particles is dependent on the type of BC sources (Liu et al., 2013) and also on the nature of prevalent semi-volatile vapours and heterogeneous interactions with gas-phase species that act as condensable material. The observed association of organics and sulfate with RCT suggests possible preferential coating, which is not dependent on the mass loading of the dominant species in the PM1.0 but rather dependent on the nature of dominant sources (gaseous precursors from the similar sources that produce BC are important). The extent of coating depends more on the strength of the sources, number/surface area size distribution of the particles and concentration of condensable vapours coupled with atmospheric dynamical processes.
As discussed in the previous sections, BC in the highly polluted IGP outflow is characterized by higher mass loadings and mixed sources (MMD ∼ 0.180–0.190 µm) which include vehicular, industrial emissions (fossil fuel sources) and widespread thermal power plants over the IGP (Thamban et al., 2017; Brooks et al., 2019a, b) that co-emit gaseous SO2 along with BC. Enhanced RCT with increased MF of sulfate indicates the possibility that sulfate resulting from the vapour-phase chemistry of SO2 emissions may be a key condensable species on BC particles during their extended atmospheric transit in the outflow (Takami et al., 2013; Miyakawa et al., 2017). Larger BC cores (MMD ∼ 0.200–0.220 µm) during the pre-monsoon indicate that solid fuel sources (including biomass/coal burning processes) which also emit organic material (vapours as well as particulates) along with BC and sulfate in primary particulate form (Pandey et al., 2014; Fleming et al., 2018) are significant during this period. As seen from Fig. S1, increased fire counts during the PMS indicate sources of significant amounts of organic material apart from BC. This, combined with the enhanced dilution of the species due to ABL dynamics modulating both particle and condensable species concentrations during the atmospheric transit, contributes to a positive association between RCT and MF of organics. Such a positive association suggests that organic vapours were possibly added to the enhanced coating on BC during the PMS.
It may be noted that it is difficult to decipher the exact coating on BC with the present approach, since the SP2 retrieves black carbon mass and provides a measure of coexisting material within the same particles (as measured by RCT), whereas the ACSM measures the mass of refractory material in the total submicrometre population. An examination of coating material can only be directly achieved by employing instruments such as the soot particle aerosol mass spectrometer (Aerodyne SP-AMS) (Gong et al., 2016). However, the SP2 can determine both the rBC content of single particles and the optical size by light scattering for diameters between 200 and 400 nm. The coating thickness estimated within this range represents most of the particles which contribute significantly to the light extinction. A comparison of the proportion of rBC-containing particles within the total population as a function of season sheds some light on interpreting variation throughout the year. In our study, the fraction of particles containing BC, i.e., the ratio of BC number concentration and total number concentration (BC number concentration + scattering number concentration), showed a clear seasonal variation. The fraction of BC-containing particles was highest during the SMS (mean ) and decreased through winter () and the PoMS () to reach the lowest value () during the PMS. This shows a gradual decrease in the overlap between the particle population detected with the ACSM and the population detected with the SP2 with changing seasons from the SMS to the PMS. This should be borne in mind while examining the association between the ACSM-detected particle mass concentrations and the SP2-derived coating parameters. While the present work highlighted the microphysical properties of the refractory BC aerosols and brought out the difference between the IGP outflow and other air mass regimes, further investigations (both experimental and theoretical) are needed to ascertain the possible radiative (including absorption enhancement) and climatic implications due to the observed microphysical properties, extent of coating and changes in the mixing state of the BC due to various host coating materials. This will form the focus of future work.
The present study has determined the mass concentration, size distributions and mixing state of refractory BC particles from the single-particle soot photometer observations carried out over Bhubaneswar, located in the eastern coast of India. The major findings from our study are as follows.
-
The rBC mass concentration is higher during winter ( µg m−3), followed by post-monsoon ( µg m−3). Reduced rainfall and calm wind conditions, coupled with decreased ventilation due to the shallow boundary layer, resulted in such build-up of aerosols. The lowest rBC mass loading ( µg m−3) is seen during the pre-monsoon, possibly due to enhanced convective mixing leading to significant dispersion of the near-surface aerosols.
-
BC size distributions indicated the seasonally changing nature of sources with smaller BC cores (MMD ∼ 0.150–0.170 µm) in the summer monsoon highlighting fossil fuel sources, whereas larger BC cores (MMD > 0.210 µm) arose in the pre-monsoon, suggesting the prominence of solid fuel sources. rBC that originated from mixed sources (both fossil fuel and solid fuel) (MMD ∼ 0.190–0.195 µm) prevailed when the air mass pathways originated from the highly polluted IGP region.
-
Further, the IGP outflow is characterized by highly coated BC particles with bulk relative coating thickness (RCT) in the range ∼ 1.3–1.8 and absolute coatings of 50–70 nm on the BC cores. The abundance of condensable species, combined with prevailing calm weather conditions and absence of precipitation, resulted in an extended lifetime and thus thickly coated BC particles. During the SMS efficient wet scavenging restricts the lifetime of aerosols and results in the lowest coatings observed throughout the year (median ACT ∼ 12.35 nm and RCT ∼ 1.15), indicating relatively nascent BC aerosols. During the PMS, significantly coated (RCT ∼ 1.2–1.3) and larger BC core particles prevailed, which may have significant regional climatic implications.
-
BC particles with relatively thicker coating are observed during the daytime in all seasons, which is due to the abundance of photochemically produced condensable species and thus gas-phase photochemical processing. The diurnal amplitude is highest in winter and lowest in the SMS, and this highlighted the role played by ABL dynamics in modulating rBC microphysical properties.
-
Diurnal variation of sulfate resembled that of the RCT of rBC, with a clear daytime dominance in the PoMS, winter and SMS, indicating strong photochemical production of sulfate from gas-phase chemistry. During the PMS, the daytime peak in sulfate is weak, which may be attributed to enhanced dispersion which overcomes photochemical production resulting in lower near-surface concentrations. Diurnal variation of the organics resembled that of BC mass concentrations with typical double maxima.
-
Examination of diurnal variations presented two contrasting possibilities of coating material on BC: (a) sulfate acting as the most probable material coating the BC core due to its abundance during the daytime; and (b) organics serving as condensable species during late evenings, where a possible of loss of organic vapours through condensation on a large number of pre-existing BC particles can contribute to coating on BC.
-
Examination of NR-PM1 mass fractions in conjunction with BC coating thickness suggests that the coating on BC is positively associated with sulfate during the IGP outflow (March to September), while the association is stronger with organics during the PMS when coastal air masses prevailed, thereby highlighting preferential coating in different seasons with conducive species availability through advection.
Our study provides insight into the seasonally varying source processes and changes in the microphysical properties of BC over Bhubaneswar and highlights the delineation between the IGP outflow and the non-IGP air masses. Further investigations are needed to understand the sensitivity of the optical and hygroscopic properties of BC to such seasonally varying microphysical properties and atmospheric processing of BC over the Indian region.
Data are available upon request from the corresponding author, Surendran Nair Suresh Babu (s_sureshbabu@vssc.gov.in).
The supplement related to this article is available online at: https://doi.org/10.5194/acp-20-3965-2020-supplement.
SSB, SKS, KKM and HC conceptualized the experiment and finalized the methodology. SKK, TD and RB were responsible for the maintenance and operation of the SP2 and the ACSM. SKK carried out the scientific analysis of the data supported by MF, DL, ED, JB and JA. SKK drafted the manuscript. SSB, KKM, SKS and HC carried out the review and editing of the manuscript.
The authors declare that they have no conflict of interest.
This article is part of the special issue “Interactions between aerosols and the South West Asian monsoon”. It is not associated with a conference.
This study was carried out as part of the collaborative South West Asian Aerosol Monsoon Interactions (SWAAMI) experiment under the joint Indo-UK (NERC) project Drivers of variability in the South Asian Monsoon under the National Monsoon Mission (NMM) of the Ministry of Earth Sciences (MoES), Government of India, in which the ISRO; the Indian Institute of Science (IISc), Bengaluru; and the University of Manchester, UK, are partners. The University of Manchester's contribution was supported by NERC through the grant NE/L013886/1. Bhubaneswar station is a supersite setup under SWAAMI for long-term characterization of the IGP outflow. It also is a part of the network under the Aerosol Radiative Forcing over India (ARFI) project of the Indian Space Research Organisation Geosphere Biosphere Program. The authors are thankful to the director of the Institute of Minerals and Materials Technology (CSIR-IMMT) for the support. We acknowledge the NOAA Air Resources Laboratory for the provision of the HYSPLIT transport and dispersion model and READY website (https://www.arl.noaa.gov/hysplit/ready/, last access: 5 September 2017) used in this study. We acknowledge the use of data and imagery from LANCE FIRMS operated by NASA's Earth Science Data and Information System (ESDIS) with funding provided by NASA Headquarters (http://earthdata.nasa.gov/firms, last access: 16 December 2017). We sincerely thank the anonymous reviewers for the extensive review, which significantly improved the quality of the paper.
This paper was edited by Manvendra K. Dubey and reviewed by two anonymous referees.
Adachi, K., Chung, S. H., and Buseck, P. R.: Shapes of soot aerosol particles and implications for their effects on climate, J. Geophys. Res.-Atmos., 115, D15206, https://doi.org/10.1029/2009JD012868, 2010.
Adachi, K., Zaizen, Y., Kajino, M., and Igarashi, Y.: Mixing state of regionally transported soot particles and the coating effect on their size and shape at a mountain site in Japan, J. Geophys. Res.-Atmos., 119, 5386–5396, https://doi.org/10.1002/2013JD020880, 2014.
Asnani, G.C., Tropical Meteorology, Vol.1 and Vol.2, 1012 pp, 1993. Indian Institute of Tropical Meteorology, Pashan, Pune.
Babu, S. S., Manoj, M. R., Moorthy, K. K., Gogoi, M. M., Nair, V. S., Kompalli, S. K., Satheesh, S. K., Niranjan, K., Ramagopal, K., Bhuyan, P. K., and Singh, D.: Trends in aerosol optical depth over Indian region: Potential causes and impact indicators, J. Geophys. Res., 118, 11794–11806, 2013.
Babu, S. S., Kompalli, S. K., and Moorthy, K. K.: Aerosol number size distributions over a coastal semi urban location: Seasonal changes and ultrafine particle bursts, Sci. Total Environ., 563–564, 351–365, https://doi.org/10.1016/j.scitotenv.2016.03.246, 2016.
Beegum, S. N., Moorthy, K. K., Babu, S. S., Satheesh, S. K., Vinoj, V., Badarinath, K. V. S., Safai, P. D., Devara, P. C. S., Singh, S. N., Vinod, Dumka, U. C., and Pant, P.: Spatial distribution of aerosol black carbon over India during premonsoon season, Atmos. Environ., 43, 1071–1078, 2009.
Bhandari, J., China, S., Onasch, T., Wolff, L., Lambe, A., Davidovits, P., Cross, E., Ahern, A., Olfert, J., Dubey, M., and Mazzoleni, C.: Effect of thermodenuding on the structure of nascent flame soot aggregates, Atmos. Meas. Tech. Discuss., https://doi.org/10.5194/amt-2016-270, 2016.
Bond, T. C. and Bergstrom, R. W.: Light absorption by carbonaceous particles: An investigative review, Aerosol Sci. Tech., 40, 27–67, https://doi.org/10.1080/02786820500421521, 2006.
Bond, T. C., Doherty, S. J., Fahey, D. W., Forster, P. M., Berntsen, T., DeAngelo, B. J., Flanner, M. G., Ghan, S., Karcher, B., Koch, D., Kinne, S., Kondo, Y., Quinn, P. K., Sarofim, M. C., Schultz, M. G., Schulz, M., Venkataraman, C., Zhang, H., Zhang, S., Bellouin, N., Guttikunda, S. K., Hopke, P. K., Jacobson, M. Z., Kaiser, J. W., Klimont, Z., Lohmann, U., Schwarz, J. P., Shindell, D., Storelvmo, T., Warren, S. G., and Zender, C. S.: Bounding the role of black carbon in the climate system: A scientific assessment, J. Geophys. Res.-Atmos., 118, 5380–5552, https://doi.org/10.1002/jgrd.50171, 2013.
Brooks, J., Liu, D., Allan, J. D., Williams, P. I., Haywood, J., Highwood, E. J., Kompalli, S. K., Babu, S. S., Satheesh, S. K., Turner, A. G., and Coe, H.: Black carbon physical and optical properties across northern India during pre-monsoon and monsoon seasons, Atmos. Chem. Phys., 19, 13079–13096, https://doi.org/10.5194/acp-19-13079-2019, 2019a.
Brooks, J., Allan, J. D., Williams, P. I., Liu, D., Fox, C., Haywood, J., Langridge, J. M., Highwood, E. J., Kompalli, S. K., O'Sullivan, D., Babu, S. S., Satheesh, S. K., Turner, A. G., and Coe, H.: Vertical and horizontal distribution of submicron aerosol chemical composition and physical characteristics across northern India during pre-monsoon and monsoon seasons, Atmos. Chem. Phys., 19, 5615–5634, https://doi.org/10.5194/acp-19-5615-2019, 2019b.
Cappa, C. D., Onasch, T. B., Massoli, P., Worsnop, D. R., Bates, T. S., Cross, E. S., Davidovits, P., Hakala, J., Hayden, K. L., Jobson, B. T., Kolesar, K. R., Lack, D. A., Lerner, B. M., Li, S.-M., Mellon, D., Nuaaman, I., Olfert, J. S., Petäjä, T., Quinn, P. K., Song, C., Subramanian, R., Williams, E. J., and Zaveri, R. A.: Radiative Absorption Enhancements Due to the Mixing State of Atmospheric Black Carbon, Science, 337, 1078–1081, https://doi.org/10.1126/science.1223447, 2012.
Chakraborty, A., Mandariya, A. K., Chakraborti, R., Gupta, T., and Tripathi, S. N.: Realtime chemical characterization of post monsoon organic aerosols in a polluted urban city: sources, composition, and comparison with other seasons, Environ. Pollu., 232, 310–321, https://doi.org/10.1016/j.envpol.2017.09.079, 2018.
Cheng, Y., Li, S.-M., Gordon, M., and Liu, P.: Size distribution and coating thickness of black carbon from the Canadian oil sands operations, Atmos. Chem. Phys., 18, 2653–2667, https://doi.org/10.5194/acp-18-2653-2018, 2018.
China, S., Mazzoleni, C., Gorkowski, K., Aiken, A. C., and Dubey, M. K.: Morphology and mixing state of individual freshly emitted wildfire carbonaceous particles, Nat. Commun., 4, 2122, https://doi.org/10.1038/ncomms3122, 2013.
Dey, S., Tripathi, S. N., and Mishra, S. K.: Probable mixing state of aerosols in the Indo-Gangetic Basin, northern India, Geophys. Res. Lett., 35, L03808, https://doi.org/10.1029/2007GL032622, 2008.
Fleming, L. T., Lin, P., Laskin, A., Laskin, J., Weltman, R., Edwards, R. D., Arora, N. K., Yadav, A., Meinardi, S., Blake, D. R., and Pillarisetti, A.: Molecular composition of particulate matter emissions from dung and brushwood burning household cookstoves in Haryana, India, Atmos. Chem. Phys., 18, 2461–2480, 2018.
Gautam, R., Hsu, N. C., Lau, K. M., Tsay, S. C., and Kafatos, M.: Enhanced premonsoon warming over the Himalayan-Gangetic region from 1979 to 2007, Geophys. Res. Lett., 36, L07704, https://doi.org/10.1029/2009GL037641, 2009.
Gong, X., Zhang, C., Chen, H., Nizkorodov, S. A., Chen, J., and Yang, X.: Size distribution and mixing state of black carbon particles during a heavy air pollution episode in Shanghai, Atmos. Chem. Phys., 16, 5399–5411, https://doi.org/10.5194/acp-16-5399-2016, 2016.
Huang, X. F., Gao, R. S., Schwarz, J. P., He, L. Y., Fahey, D. W., Watts, L. A., McComiskey, A., Cooper, O. R., Sun, T. L., Zeng, L. W., Hu, M., and Zhang, Y. H.: Black carbon measurements in the Pearl River Delta region of China, J. Geophys. Res.-Atmos., 116, D12208, https://doi.org/10.1029/2010jd014933, 2011.
Huang, X. F., Sun, T. L., Zeng, L. W., Yu, G. H., and Luan, S. J.: Black carbon aerosol characterization in a coastal city in South China using a single particle soot photometer, Atmos. Environ., 51, 21–28, https://doi.org/10.1016/j.atmosenv.2012.01.056, 2012.
IPCC: Climate Change 2013: The Physical Science Basis, Contribution of Working Group I to the Fifth Assessment Report of the Intergovernmental Panel on Climate Change, edited by: Stocker, T. F., Qin, D., Plattner, G.-K., Tignor, M., Allen, S. K., Boschung, J., Nauels, A., Xia, Y., Bex, V., and Midgley, P. M., Cambridge University Press, Cambridge, UK, New York, NY, USA, 2013.
Jacobson, M. Z.: Strong Radiative Heating Due to the Mixing State of Black Carbon in Atmospheric Aerosols, Nature, 409, 695–697, 2001.
Kompalli, S. K., Babu, S. S., Moorthy, K. K., Manoj, M. R., Kirankumar, N. V. P., Shaeb, K. H. B., and Joshi, A. K.: Aerosol black carbon characteristics over central India: temporal variation and its dependence on mixed layer height, Atmos. Res., 147–148, 27–37, https://doi.org/10.1016/j.atmosres.2014.04.015, 2014.
Kondo, Y., Matsui, H., Moteki, N., Sahu, L., Takegawa, N., Kajino, M., Zhao, Y., Cubison, M. J., Jimenez, J. L., Vay, S., Diskin, G. S., Anderson, B., Wisthaler, A., Mikoviny, T., Fuelberg, H. E., Blake, D. R., Huey, G., Weinheimer, A. J., Knapp, D. J., and Brune, W. H.: Emissions of black carbon, organic, and inorganic aerosols from biomass burning in North America and Asia in 2008, J. Geophys. Res., 116, D08204, https://doi.org/10.1029/2010JD015152, 2011.
Köylü, Ü.Ö., Faeth, G. M., Farias, T. L., and Carvalho, M. G.: Fractal and projected structure properties of soot aggregates, Combust. Flame, 100, 621–633, https://doi.org/10.1016/0010-2180(94)00147-K, 1995.
Kumar, B., Chakraborty, A., Tripathi, S. N., and Bhattu, D.: Highly time resolved chemical characterization of submicron organic aerosols at a polluted urban location, Environ. Sci.: Process. Imp., 18, 1285–1296, 2016.
Laborde, M., Mertes, P., Zieger, P., Dommen, J., Baltensperger, U., and Gysel, M.: Sensitivity of the Single Particle Soot Photometer to different black carbon types, Atmos. Meas. Tech., 5, 1031–1043, https://doi.org/10.5194/amt-5-1031-2012, 2012.
Laborde, M., Crippa, M., Tritscher, T., Jurányi, Z., Decarlo, P. F., Temime-Roussel, B., Marchand, N., Eckhardt, S., Stohl, A., Baltensperger, U., Prévôt, A. S. H., Weingartner, E., and Gysel, M.: Black carbon physical properties and mixing state in the European megacity Paris, Atmos. Chem. Phys., 13, 5831–5856, https://doi.org/10.5194/acp-13-5831-2013, 2013.
Lambe, A. T., Cappa, C. D., Massoli, P., Onasch, T. B., Forestieri, S. D., Martin, A. T., Cummings, M. J., Croasdale, D. R., Brune, W. H.,Worsnop, D. R., and Davidovits, P.: Relationship between oxidation level and optical properties of secondary organic aerosol, Environ. Sci. Technol., 47, 6349–6357, 2013.
Lawrence, M. G. and Lelieveld, J.: Atmospheric pollutant outflow from southern Asia: a review, Atmos. Chem. Phys., 10, 11017–11096, https://doi.org/10.5194/acp-10-11017-2010, 2010.
Lee, S. H., Murphy, D. M., Thomson, D. S., and Middlebrook, A. M.: Chemical components of single particles measured with Particle Analysis by Laser Mass Spectrometry (PALMS) during the Atlanta SuperSite Project: Focus on organic/sulfate, lead, soot, and mineral particles, J. Geophys. Res., 107, 4003, https://doi.org/10.1029/2000JD000011,2002.
Liu, D., Flynn, M., Gysel, M., Targino, A., Crawford, I., Bower, K., Choularton, T., Jurányi, Z., Steinbacher, M., Hüglin, C., Curtius, J., Kampus, M., Petzold, A., Weingartner, E., Baltensperger, U., and Coe, H.: Single particle characterization of black carbon aerosols at a tropospheric alpine site in Switzerland, Atmos. Chem. Phys., 10, 7389–7407, https://doi.org/10.5194/acp-10-7389-2010, 2010.
Liu, D., Allan, J., Whitehead, J., Young, D., Flynn, M., Coe, H., McFiggans, G., Fleming, Z. L., and Bandy, B.: Ambient black carbon particle hygroscopic properties controlled by mixing state and composition, Atmos. Chem. Phys., 13, 2015–2029, https://doi.org/10.5194/acp-13-2015-2013, 2013.
Liu, D., Allan, J. D., Young, D. E., Coe, H., Beddows, D., Fleming, Z. L., Flynn, M. J., Gallagher, M. W., Harrison, R. M., Lee, J., Prevot, A. S. H., Taylor, J. W., Yin, J., Williams, P. I., and Zotter, P.: Size distribution, mixing state and source apportionment of black carbon aerosol in London during wintertime, Atmos. Chem. Phys., 14, 10061–10084, https://doi.org/10.5194/acp-14-10061-2014, 2014.
Liu, D., Whitehead, J., Alfarra, M. R., Reyes-Villegas, E., Spracklen, D. V., Reddington, C. L., Kong, S., Williams, P. I., Ting, Y.-C., Haslett, S., Taylor, J. W., Flynn, M. J., Morgan, W. T., McFiggans, G., Coe, H., and Allan, J. D.: Black-carbon absorption enhancement in the atmosphere determined by particle mixing state, Nat. Geosci., 10, 184–188, 10.1038/ngeo2901, 2017.
Liu, D., Taylor, J. W., Crosier, J., Marsden, N., Bower, K. N., Lloyd, G., Ryder, C. L., Brooke, J. K., Cotton, R., Marenco, F., Blyth, A., Cui, Z., Estelles, V., Gallagher, M., Coe, H., and Choularton, T. W.: Aircraft and ground measurements of dust aerosols over the west African coast in summer 2015 during ICE-D and AER-D, Atmos. Chem. Phys., 18, 3817–3838, https://doi.org/10.5194/acp-18-3817-2018, 2018.
Liu, D., Joshi, R., Wang, J., Yu, C., Allan, J. D., Coe, H., Flynn, M. J., Xie, C., Lee, J., Squires, F., Kotthaus, S., Grimmond, S., Ge, X., Sun, Y., and Fu, P.: Contrasting physical properties of black carbon in urban Beijing between winter and summer, Atmos. Chem. Phys., 19, 6749–6769, https://doi.org/10.5194/acp-19-6749-2019, 2019.
Mahapatra, P. S., Panda, S., Das, N., Rath, S., and Das T.: Variation in black carbon mass concentration over an urban site in the eastern coastal plains of the Indian sub-continent, Theor. Appl. Climatol., 117, 133-147, https://doi.org/10.1007/s00704-013-0984-z, 2013a.
Mahapatra, P. S., Ray, S., Das, N., Mohanty, A., Ramulu, T. S., Das, T., Chaudhury, G. R., and Das, S. N.: Urban air-quality assessment and source apportionment studies for Bhubaneshwar, Odisha, Theor. Appl. Clim., 112, 243–251, 2013b.
McMeeking, G. R., Hamburger, T., Liu, D., Flynn, M., Morgan, W. T., Northway, M., Highwood, E. J., Krejci, R., Allan, J. D., Minikin, A., and Coe, H.: Black carbon measurements in the boundary layer over western and northern Europe, Atmos. Chem. Phys., 10, 9393–9414, https://doi.org/10.5194/acp-10-9393-2010, 2010.
McMeeking, G. R., Morgan, W. T., Flynn, M., Highwood, E. J., Turnbull, K., Haywood, J., and Coe, H.: Black carbon aerosol mixing state, organic aerosols and aerosol optical properties over the United Kingdom, Atmos. Chem. Phys., 11, 9037–9052, https://doi.org/10.5194/acp-11-9037-2011, 2011.
Middlebrook, A. M., Bahreini, R., Jimenez, J. L., and Canagaratna, M. R.: Evaluation of Composition-Dependent Collection Efficiencies for the Aerodyne Aerosol Mass Spectrometer using Field Data, Aerosol Sci. Tech., 46, 258–271, https://doi.org/10.1080/02786826.2011.620041, 2012.
Miyakawa, T., Oshima, N., Taketani, F., Komazaki, Y., Yoshino, A., Takami, A., Kondo, Y., and Kanaya, Y.: Alteration of the size distributions and mixing states of black carbon through transport in the boundary layer in east Asia, Atmos. Chem. Phys., 17, 5851–5864, https://doi.org/10.5194/acp-17-5851-2017, 2017.
Moffet, R. C. and Prather, K. A.: In-situ measurements of the mixing state and optical properties of soot with implications for radiative forcing estimates, P. Natl. Acad. Sci. USA, 106, 11872–11877, 2009.
Moorthy, K. K.: South Asian aerosols in perspective: Preface to the special issue, Atmos. Environ, 125, 307–311, https://doi.org/10.1016/j.atmosenv.2015.10.073, 2016.
Moorthy, K. K., Babu, S. S., Satheesh, S. K., Srinivasan, J., and Dutt, C. B. S.: Dust absorption over the “Great Indian Desert” inferred using ground-based and satellite remote sensing, J. Geophys. Res., 112, D09206, https://doi.org/10.1029/2006JD007690, 2007.
Moorthy, K. K., Satheesh, S. K., and Kotamarthi, V. R.: Evolution of aerosol research in India and the RAWEX–GVAX: an overview, Curr. Sci., 111, 53–75, https://doi.org/10.18520/cs/v111/i1/53-75, 2016.
Moteki, N. and Kondo, Y.: Effects of mixing state on black carbon measurements by laser-induced incandescence, Aerosol Sci. Technol., 41, 398–417, 2007.
Moteki, N. and Kondo, Y.: Dependence of laser-induced incandescence on physical properties of black carbon aerosols: Measurements and theoretical interpretation, Aerosol Sci. Tech., 44, 663–675, 2010.
Moteki, N., Kondo, Y, Miyazaki, Y., Takegawa, N., Komazaki, Y., Kurata, G., Shirai, T., Blake, D. R., Miyakawa, T., and Koike, M.: Evolution of mixing state of black carbon particles: Aircraft measurements over the western Pacific in March 2004, Geophys. Res. Lett., 34, L11803, https://doi.org/10.1029/2006GL028943, 2007.
Moteki, N., Kondo, Y., and Nakamura, S.-I.: Method to measure refractive indices of small nonspherical particles: Application to black carbon particles, J. Aerosol Sci., 41, 513–521, 2010.
Ng, N. L., Herndon, S. C., Trimborn, A., Canagaratna, M. R., Croteau, P. L., Onasch, T. B., Sueper, D., Worsnop, D.R., Zhang, Q. , Sun, Y. L., and Jayne, J. T.: An Aerosol Chemical Speciation Monitor (ACSM) for Routine Monitoring of the Composition and Mass Concentrations of Ambient Aerosol, Aerosol Sci. Technol., 45, 780–794, https://doi.org/10.1080/02786826.2011.560211, 2011.
Pandey, A., Sadavarte, P., Rao, A. B., and Venkataraman, C.: Trends in multi-pollutant emissions from a technology-linked inventory for India: II. Residential, agricultural and informal industry sectors, Atmos. Environ., 99, 341–352, 2014.
Peng, J., Hu, M., Guo, S., Du, Z., Zheng, J., Shang, D., Levy Zamora, M., Zeng, L., Shao, M., Wu, Y.-S., Zheng, J., Wang, Y., Glen, C. R., Collins, D. R., Molina, M. J., and Zhang, R.: Markedly enhanced absorption and direct radiative forcing of black carbon under polluted urban environments, P. Natl. Acad. Sci. USA, 113, 4266–4271, https://doi.org/10.1073/pnas.1602310113, 2016.
Petzold, A., Ogren, J. A., Fiebig, M., Laj, P., Li, S.-M., Baltensperger, U., Holzer-Popp, T., Kinne, S., Pappalardo, G., Sugimoto, N., Wehrli, C., Wiedensohler, A., and Zhang, X.-Y.: Recommendations for reporting ”black carbon” measurements, Atmos. Chem. Phys., 13, 8365–8379, https://doi.org/10.5194/acp-13-8365-2013, 2013.
Prasad, P., Ramana, R., Venkat Ratnam, M., Chen, W., Vijaya Bhaskara Rao, S., Gogoi, M. M., Kompalli, S. K., Kumar, K. S., and Babu, S. S.: Characterization of atmospheric Black Carbon over a semi-urban site of Southeast India: Local sources and long-range transport, Atmos. Res., 213, 411–421, https://doi.org/10.1016/j.atmosres.2018.06.024, 2018.
Raatikainen, T., Brus, D., Hyvärinen, A.-P., Svensson, J., Asmi, E., and Lihavainen, H.: Black carbon concentrations and mixing state in the Finnish Arctic, Atmos. Chem. Phys., 15, 10057–10070, https://doi.org/10.5194/acp-15-10057-2015, 2015.
Raatikainen, T., Brus, D., Hooda, R. K., Hyvärinen, A.-P., Asmi, E., Sharma, V. P., Arola, A., and Lihavainen, H.: Size-selected black carbon mass distributions and mixing state in polluted and clean environments of northern India, Atmos. Chem. Phys., 17, 371–383, https://doi.org/10.5194/acp-17-371-2017, 2017.
Reddington, C. L., McMeeking, G., Mann, G. W., Coe, H., Frontoso, M. G., Liu, D., Flynn, M., Spracklen, D. V., and Carslaw, K. S.: The mass and number size distributions of black carbon aerosol over Europe, Atmos. Chem. Phys., 13, 4917–4939, https://doi.org/10.5194/acp-13-4917-2013, 2013.
Scarnato, B. V., China, S., Nielsen, K., and Mazzoleni, C.: Perturbations of the optical properties of mineral dust particles by mixing with black carbon: a numerical simulation study, Atmos. Chem. Phys., 15, 6913–6928, https://doi.org/10.5194/acp-15-6913-2015, 2015.
Schnaiter, M., Linke, C., Möhler, O., Naumann, K. H., Saathoff, H., Wagner, R., Schurath, U., and Wehner, B.: Absorption amplification of black carbon internally mixed with secondary organic aerosol, J. Geophys. Res., 110, D19204, https://doi.org/10.1029/2005JD006046, 2005.
Schwarz, J. P., Gao, R. S., Spackman, J. R., Watts, L. A., Thomson, D. S., Fahey, D. W., Ryerson, T. B., Peischl, J., Holloway, J. S., Trainer, M., Frost, G. J., Baynard, T., Lack, D. A., de Gouw, J. A., Warneke, C., and Del Negro, L. A.: Measurement of the mixing state, mass, and optical size of individual black carbon particles in urban and biomass burning emissions, Geophys. Res. Lett., 35, L13810, https://doi.org/10.1029/2008GL033968, 2008.
Schwarz, J. P., Gao, R. S., Perring, A. E., Spackman, J. R., and Fahey, D. W.: Black carbon aerosol size in snow, Sci. Rep., 3, 1356, https://doi.org/10.1038/srep01356, 2013.
Sedlacek III, A. J., Lewis, E. R., Kleinman, L., Xu, J., and Zhang, Q.: Determination of and evidence for noncore-shell structure of particles containing black carbon using the Single-Particle Soot Photometer (SP2), Geophys. Res. Lett., 39, L06802, https://doi.org/10.1029/2012GL050905, 2012.
Sedlacek III, A. J., Onasch, T. B., Nichman, L., Lewis, E. R., Davidovits, P., Freedman, A., and Williams, L.: Formation of refractory black carbon by SP2-induced charring of organic aerosol, Aerosol Sci. Technol., 52, 1345–1350, https://doi.org/10.1080/02786826.2018.1531107, 2018.
Shiraiwa, M., Kondo, Y., Moteki, N., Takegawa, N., Miyazaki, Y., and Blake, D. R.: Evolution of mixing state of black carbon in polluted air from Tokyo, Geophys. Res. Lett., 34, L16803, https://doi.org/10.1029/2007GL029819, 2007.
Shiraiwa, M., Kondo, Y., Iwamoto, T., and Kita, K.: Amplification of light absorption of black carbon by organic coating, Aerosol Sci. Technol., 44, 46–54, 2010.
Srinivas, B. and Sarin, M. M.: PM2.5, EC and OC in atmospheric outflow from the Indo-Gangetic Plain: Temporal variability and aerosol organic carbon-to-organic mass conversion factor, Sci. Total Environ., 487, 196–205, https://doi.org/10.1016/j.scitotenv.2014.04.002, 2014.
Srivastava, R. and Ramachandran, S.: The mixing state of aerosols over the Indo-Gangetic Plain and its impact on radiative forcing, Q. J. Roy. Meteor. Soc., 139, 137–151, https://doi.org/10.1002/qj.1958, 2013.
Takami, A., Mayama, N., Sakamoto, T., Ohishi, K., Irei, S., Yoshino, A., Hatakeyama, S., Murano, K., Sadanaga, Y., Bandow, H., Misawa, K., and Fujii, M.: Structural analysis of aerosol particles by microscopic observation using a time of flight secondary ion mass spectrometer, J. Geophys. Res.-Atmos., 118, 6726–6737, https://doi.org/10.1002/jgrd.50477, 2013.
Thamban, N. M., Tripathi, S. N., Shamjad P. M., Kuntamukkala, P., and Kanawade, V. P.: Internally mixed black carbon in the Indo-Gangetic Plain and its effect on absorption enhancement, Atmos. Res., 197, 211–223, https://doi.org/10.1016/j.atmosres.2017.07.007, 2017.
Taylor, J. W., Allan, J. D., Liu, D., Flynn, M., Weber, R., Zhang, X., Lefer, B. L., Grossberg, N., Flynn, J., and Coe, H.: Assessment of the sensitivity of core / shell parameters derived using the single-particle soot photometer to density and refractive index, Atmos. Meas. Tech., 8, 1701–1718, https://doi.org/10.5194/amt-8-1701-2015, 2015.
Ueda, S., Nakayama, T., Taketani, F., Adachi, K., Matsuki, A., Iwamoto, Y., Sadanaga, Y., and Matsumi, Y.: Light absorption and morphological properties of soot-containing aerosols observed at an East Asian outflow site, Noto Peninsula, Japan, Atmos. Chem. Phys., 16, 2525–2541, https://doi.org/10.5194/acp-16-2525-2016, 2016.
Venkatraman, C., Habib, G., Eiguren-Fernandez, A., Mignel, A. H., and Friedlander, S. K.: Residential biofuels in South Asia: carbonaceous aerosol emissions and climate impacts, Science, 307, 1454–1456, 2005.
Verma, S., Pani, S. K., and Bhanja, S. N.: Sources and radiative effects of wintertime black carbon aerosols in an urban atmosphere in east India, Chemosphere, 90, 260–269, https://doi.org/10.1016/j.chemosphere.2012.06.063, 2012.
Wang, Q., Cao, J., Han, Y., Tian, J., Zhu, C., Zhang, Y., Zhang, N., Shen, Z., Ni, H., Zhao, S., and Wu, J.: Sources and physicochemical characteristics of black carbon aerosol from the southeastern Tibetan Plateau: internal mixing enhances light absorption, Atmos. Chem. Phys., 18, 4639–4656, https://doi.org/10.5194/acp-18-4639-2018, 2018.
Wang, Q. Y., Huang, R.-J., Cao, J. J., Tie, X. X., Ni, H. Y., Zhou, Y. Q., Han, Y. M., Hu, T. F., Zhu, C. S., Feng, T., Li, N., and Li, J. D.: Black carbon aerosol in winter northeastern Qinghai–Tibetan Plateau, China: the source, mixing state and optical property, Atmos. Chem. Phys., 15, 13059–13069, https://doi.org/10.5194/acp-15-13059-2015, 2015.
Wang, Q. Y., Huang, R. J., Zhao, Z. Z., Cao, J. J., Ni, H. Y., Tie, X. X., Zhao, S. Y., Su, X. L., Han, Y. M., Shen, Z. X., Wang, Y. C., Zhang, N. N., Zhou, Y. Q., and Corbin, J. C.: Physicochemical characteristics of black carbon aerosol and its radiative impact in a polluted urban area of China, J. Geophys. Res.-Atmos., 121, 12505–12519, https://doi.org/10.1002/2016JD024748, 2016.
Weingartner, E., Burtscher, H., and Baltensperger, U.: Hygroscopic properties of carbon and diesel soot particles, Atmos. Environ., 31, 2311–2327, 1997.
Wu, Y., Zhang, R., Tian, P., Tao, J., Hsu, S.-C., Yan, P., Wang, Q., Cao, J., Zhang, X., and Xia, X.: Effect of ambient humidity on the light absorption amplification of black carbon in Beijing during January 2013, Atmos. Environ., 124, 217–223, 2016.
Zhang, J., Liu, J., Tao, S., and Ban-Weiss, G. A.: Long-range transport of black carbon to the Pacific Ocean and its dependence on aging timescale, Atmos. Chem. Phys., 15, 11521–11535, https://doi.org/10.5194/acp-15-11521-2015, 2015.
Zuberi, B., Johnson, K. S., Aleks, G. K., Molina, L. T., and Molina, M. J.: Hydrophilic properties of aged soot, Geophys. Res. Lett., 32, L01807, https://doi.org/10.1029/2004GL021496, 2005.