the Creative Commons Attribution 4.0 License.
the Creative Commons Attribution 4.0 License.
 | 01 Apr 2020
The diurnal cycle of the clouds extending above the tropical tropopause observed by spaceborne lidar
Thibaut Dauhut
Vincent Noel
Iris-Amata Dion
The presence of clouds above the tropopause over tropical convection centers has so far been documented by spaceborne instruments that are either sun-synchronous or insensitive to thin cloud layers. Here we document, for the first time through direct observation by spaceborne lidar, how the tropical cloud fraction evolves above the tropopause throughout the day. After confirming previous studies that found such clouds most frequently above convection centers, we show that stratospheric clouds and their vertical extent above the tropopause follow a diurnal rhythm linked to convective activity. The diurnal cycle of the stratospheric clouds displays two maxima: one in the early night (19:00–20:00 LT) and a later one (00:00–01:00 LT). Stratospheric clouds extend up to 0.5–1 km above the tropopause during nighttime, when they are the most frequent. The frequency and the vertical extent of stratospheric clouds is very limited during daytime, and when present they are found very close to the tropopause. Results are similar over the major convection centers (Africa, South America and the Warm Pool), with more clouds above land in DJF (December–January–February) and less above the ocean and in JJA (June–July–August).
- Article
(1304 KB) - Full-text XML
- BibTeX
- EndNote


Low-stratospheric clouds impact the atmospheric system in several ways. First, their larger heating rate than in the clear sky (Corti et al., 2006) increases the upward mass flux and fosters the large-scale upward transport of water above the tropopause. At the hour timescale, the cloud particles penetrating the stratosphere via overshooting convection leads, on the one hand, to a direct stratospheric humidification (Schoeberl et al., 2019; Dauhut et al., 2018). On the other hand, these particles can serve as support for ice scavenging: under saturated conditions, the water vapor deposits on the particles, which grow and fall out (Corti et al., 2008), decreasing low-stratosphere humidity (Jensen et al., 2013). By all these effects the stratospheric clouds modulate the stratospheric water vapor concentrations (Iwasaki et al., 2015) and affect the overall dynamical structure near the tropopause (Corti et al., 2006), at timescales down to 1 h. This is why it is important to understand the formation and the sub-daily evolution of such clouds.
The presence of ice clouds near the tropical tropopause has long been documented by in situ measurements (e.g., Thomas et al., 2002; Jensen et al., 2013; Frey et al., 2014). Detecting occurrences of clouds extending above the tropopause by remote sensing requires documenting the vertical cloud profile with a fine resolution and a high sensitivity to optically thin clouds, which few instruments can reach. Lidar measurements are able to document such occurrences (e.g., Nee et al., 1998; Dupont et al., 2010; Gouveia et al., 2017), but for a long time they were limited to local case studies. Dessler (2009) was the first to use the cloud detections by the CALIPSO lidar (Cloud-Aerosol Lidar Infrared Pathfinder Satellite Observations) to investigate how clouds extend above the tropopause on a global scale. Pan and Munchak (2011) refined the results by using an advanced tropopause dataset. Both studies found that clouds extending into the stratosphere are frequent above seasonal deep-convection centers and rarely elsewhere, especially in midlatitudes. Both studies deplored that the fixed overpass local time of the CALIPSO dataset is far from the late afternoon, when land convection is at its maximum. More recently, Wang et al. (2019) documented the presence of laminar cirrus in 10 years of CALIPSO data and reported a non-negligible cloud amount above the tropopause. Because of the sun-synchronous orbit of CALIPSO, none of these studies were able to document the diurnal cycle of the stratospheric clouds.
The diurnal evolution of the high-altitude cirrus clouds has been documented over some specific sites using ground-based lidars (Sassen et al., 2003; Dupont et al., 2010; Gouveia et al., 2017). Gouveia et al. (2017) documented the evolution of the integrated cloud fraction (no vertical distribution) over Amazonia; Sassen et al. (2003) documented the diurnal evolution of the composition of cirrus clouds over Salt Lake City; and Dupont et al. (2010) did the same over four observatories in France and in the United States. However, using ground-based lidar to document optically thin clouds extending above the tropopause is difficult for two reasons: (1) as the studies based on CALIPSO observations show, these clouds occur primarily in regions where operational ground-based sites are absent or very few (Pacific Ocean, Equatorial Africa and South America), and (2) these clouds are mainly associated with deep convection, which implies the presence of optically thick cloud systems in the troposphere beneath that will make the successful probing of optically thin clouds near the tropopause impossible in most cases due to the attenuation of lidar signals. This explains why the ground-based lidars do not document the diurnal cycle of the stratospheric clouds with a satisfying spatial and temporal coverage.
Describing the diurnal evolution of the high-altitude clouds from a global perspective becomes possible with the CATS (Cloud-Aerosol Transport System) lidar operated from the International Space Station (ISS) between February 2015 and November 2017 (McGill et al., 2015). Thanks to the ISS non-synchronous orbit, CATS was able to probe the vertical cloud distribution of a particular region at different times of the day (not only at 01:30 and 13:30 local time like the instruments on CALIPSO). Aggregating CATS detections over a region of interest and over enough time provides a statistical overview of the diurnal evolution of cloud vertical profiles over that region (Noel et al., 2018). Our work aims at using CATS observations to describe and better understand the diurnal evolution of the cloud fraction in the tropical stratosphere.
Finding the processes responsible for the formation of tropical stratospheric clouds proves difficult, just like with high-tropospheric clouds (Reverdy et al., 2012). Two processes have been mainly proposed. Overshooting convection can lead to the injection of ice crystals into the stratosphere (Dauhut et al., 2018; Lee et al., 2019). Stratospheric cooling triggered by gravity waves (Pfister et al., 2010) could also lead to so-called cloud in situ formation (Pan and Munchak, 2011). The ratio of stratospheric clouds that are formed in situ has not been estimated yet. The current study does not provide a further estimate, but by describing the spatiotemporal evolution of the stratospheric clouds, it highlights how important the convective activity is to drive the stratospheric cloudiness and how the twice-daily sampling by lidars on board sun-synchronous platforms can miss the highest and largest stratospheric cloud fraction over certain regions.
In this paper, we document for the first time the diurnal cycle of clouds above the tropopause in the Tropics and the extent of their penetration in the stratosphere thanks to the high vertical and temporal resolution of the cloud detection by the CATS lidar. After describing CATS cloud data and the method to retrieve the tropopause heights used to detect clouds extending in the stratosphere (Sect. 2), we present maps of stratospheric clouds and document their diurnal cycle in regions of interest (Sect. 3). We then summarize our results and conclude (Sect. 4).
2.1 CATS cloud data
Between February 2015 and November 2017, the CATS lidar reported profiles at a vertical resolution of 60 m every 350 m along-track, with an average repeat cycle of nearly 3 d (Yorks et al., 2016). CATS Level 2 Operational layer files (L2O files; Palm et al., 2016) describe altitudes where cloud layers were detected within profiles of backscatter coefficients measured at 1064 nm by the CATS lidar (Pauly et al., 2019), averaged 5 km along-track. We considered all such files over the CATS operation period and inspected each 5 km profile within. For profiles located in the Tropics (30∘ S–30∘ N), we inspected each atmospheric layer therein identified as a cloud layer according to the CATS layer type information. As in Noel et al. (2018), we considered layers with a feature type score above 6, to avoid any possibly mislabeled aerosol layers. We flagged the cloud layers with a top altitude above the tropopause. Since any CATS L2O layer entirely above the tropopause is labeled as an aerosol layer (like in CALIPSO; Pan and Munchak, 2011), our study will not include clouds with their base in the stratosphere.
Davis et al. (2010) noted that lidars in space may miss the thinnest subvisible cirrus clouds, but with enough spatial averaging cirrus clouds with optical depths near 0.001 can be detected (Martins et al., 2011). Lidar cloud detections also suffer from a lower sensitivity in the presence of sunlight, which induces significant additional noise in the lidar signal, but climatologies are still relevant (Noel et al., 2018).
2.2 Tropopause heights
To obtain the tropopause height, we considered profiles of temperature and pressure from the ERA5 (European Centre for Medium-Range Weather Forecasts – ECMWF – reanalysis) reanalysis dataset (Albergel et al., 2018). These profiles are available every 6 h, on 37 vertical levels and on a horizontal grid. Such profiles in the ERA5 reanalysis agree well with observations in the high tropical troposphere (Podglajen et al., 2014). Using these profiles, we computed the vertical lapse rate profile (as in Reichler et al., 2003) and interpolated it on a 100 m vertical grid. We then applied the World Meteorological Organization (WMO) criteria defining the presence of a tropopause – i.e., the lowest altitude at which the lapse rate falls below 2 ∘C km−1, provided the lapse rate between this altitude and all higher altitudes within 2 km does not exceed 2 ∘C km−1 (WMO, 1957). Following the WMO definition, we also allowed for the possibility of a second tropopause if the lapse rate exceeds 3 ∘C km−1 at least 1 km above the first tropopause. In such a case, we started to look for another tropopause above. To limit computation overhead, we constrained the search below 22 km. Using the WMO tropopause definition further allows us to compare our results to previous efforts based on the CALIPSO database that used the same definition (Pan and Munchak, 2011).
2.3 Stratospheric cloud detection
For a given CATS 5 km profile (Sect. 2.1), we identified the ERA5 tropopause height (Sect. 2.2) closest in time and location. Given the 6 h time resolution of the ERA5 reanalysis, there is at most a 3 h difference between the observation time and the thermodynamic information used to retrieve the tropopause height. We used the cloud information contained in the 5 km profiles in two ways. First, in latitude–longitude bins we counted how many profiles contained a cloud extending above the tropopause, compared to the total number of profiles in the bins. Aggregating such numbers observed in JJA (June–July–August) and DJF (December–January–February) over the CATS operation period produced seasonal maps of above-tropopause cloud amounts (Sect. 3.1). Second, from each CATS 5 km profile we built a vertical cloud mask, using the tropopause height as the vertical reference and considering clouds that extend above it. Within regions chosen based on the seasonal maps, we aggregated such cloud masks over the same periods as above, keeping also track of the local time of observation for the considered mask. This produced regional vertical cloud fraction profiles above the tropopause, with one profile for each local time of observation (Sect. 3.2).
3.1 Stratospheric cloud distributions
Figure 1 shows the fraction of CATS profiles in which a cloud is detected above the tropopause, in all DJF (top) and JJA (bottom) months of CATS operation.
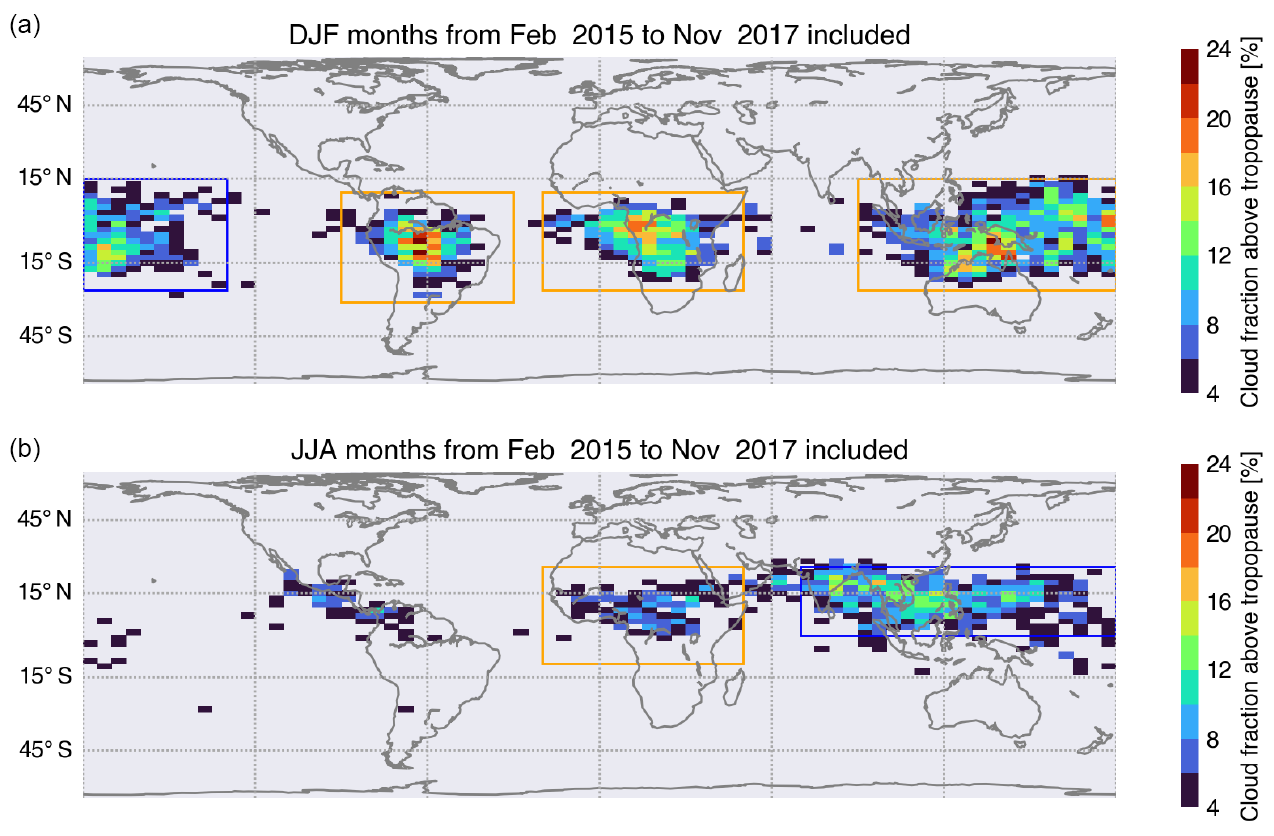
Figure 1Tropical low-stratosphere cloud fraction for (a) DJF and (b) JJA. CATS measurements between February 2015 and November 2017, calculated by considering all profiles in latitude–longitude boxes. The rectangles are the regions in which cloud detections are aggregated in the rest of the study. In DJF, from left to right: the West Pacific (25∘ S–15∘ N, 180–130∘ W), South America (30∘ S–10∘ N, 90–30∘ W), Equatorial Africa (25∘ S–10∘ N, 20∘ W–50∘ E) and the South Warm Pool (25∘ S–15∘ N, 90–180∘ E). In JJA, from left to right: Central Africa (10∘ S–25∘ N, 20∘ W–50∘ E) and the North Warm Pool (0–25∘ N, 70–180∘ E). Only detections in the region are shown here. In the rest of the study, we considered profiles over the ocean in blue boxes and profiles over land in orange boxes.
Figure 1 shows that clouds in the tropical stratosphere are mostly detected over continents (South America, Equatorial Africa and land masses in the South Warm Pool in DJF; Central America, Central Africa and land masses in the North Warm Pool in JJA). The cloud fraction in the lower stratosphere is largest in DJF, up to 24 % over central Amazonia and coastal areas in the South Warm Pool and up to 20 % over Equatorial Africa. It is significantly lower in JJA, up to 12 % over Africa and 16 % over the North Warm Pool, even though the lowermost stratosphere (380–420 K potential temperature) is moister in JJA than in DJF (cf. e.g., Fig. 8c in Fueglistaler et al., 2009). The seasonal variation of the stratospheric cloud fraction is neither due to changes in the tropopause height, as the tropopause is lower in JJA than in DJF, over all regions (0.2 to 0.9 km altitude difference; see Appendix A), in line with the zonally averaged tropopause heights presented by Fueglistaler et al. (2009) and Rieckh et al. (2014). Several factors may contribute to this seasonal variation: the density and strength of the convective systems (Liu and Zipser, 2005), their propensity to propagate or to be stationary (Houze et al., 2015), and the activity and efficiency of the in situ formation processes (Jensen et al., 2001; Jensen and Pfister, 2004).
The spatiotemporal distribution of the stratospheric clouds is in very good agreement with the 4-year climatology of Pan and Munchak (2011) from CALIPSO observations. The DJF distribution also matches the CALIPSO cirrus detection at 100 hPa reported by Wang et al. (2019) for January 2009 very well. We report lower cloud frequencies than Wang et al. (2019), which can be explained by the fact that we investigated slightly higher altitudes. Both CATS and CALIPSO datasets find (1) significantly weaker stratospheric cloud fraction in JJA than in DJF and (2) near-zero stratospheric clouds in the subtropics. These results are also consistent with the CALIPSO cloud fractions near 16 km reported by Schoeberl et al. (2019). Since those studies consider cloud detections derived from a spaceborne lidar instrument, over several years for most, their good agreement suggests that the CATS stratospheric cloud detections at 1064 nm are as reliable as the CALIPSO ones at 532 nm. A first conclusion of our results is therefore that CATS measurements strongly support the findings of all other studies using detections of high clouds from CALIPSO data.
Our CATS results are also in very good agreement with the distributions of clouds near the tropopause from other space instruments: 2006–2007 HIRDLS (High-resolution dynamics limb sounder) observations reported by Massie et al. (2010), 2006–2014 CloudSat observations (Kim et al., 2018) and the pioneering 1989 passive Stratospheric Aerosol and Gas Experiment (SAGE) II observations (Jensen et al., 1996). Besides the specificity in the cloud detection method employed by each instrument (occultation for HIRDLS and SAGE II and radar backscattering for CloudSat), the small differences between the distributions mostly come from the year-to-year variability. Larger differences can be found with the distributions of clouds penetrating the tropical tropopause derived from the 1998–2000 and 2002–2003 observations by the Tropical Rainfall Measuring Mission (TRMM) Precipitation Radar (Liu and Zipser, 2005). The densities of overshooting systems with tops in the lower stratosphere (on which Liu and Zipser, 2005, focused rather than all stratospheric clouds) are remarkably larger in Central America and Central Africa than over the Warm Pool. Since TRMM precipitation radar reflectivities are less sensitive to thin ice particles than CATS and CALIPSO lidars, we can interpret this difference by the fact that the American and African systems, though frequently overshooting the stratosphere, produce less thin stratospheric clouds than the Asian systems or other in situ processes (like gravity wave cooling) are more efficient to produce stratospheric clouds over Asia than America and Africa.
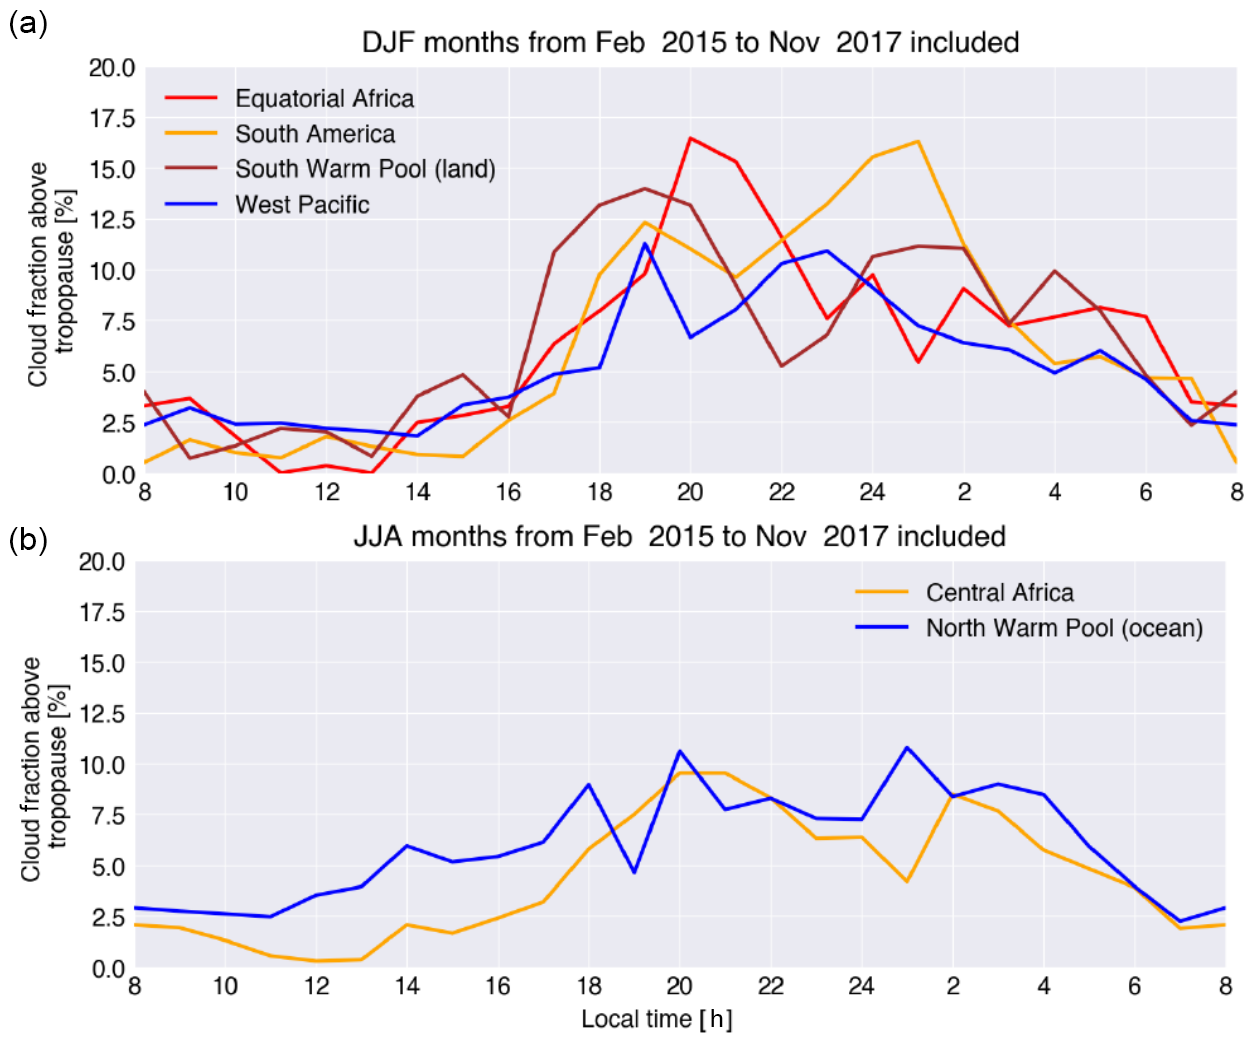
Figure 2Diurnal cycle of stratospheric cloud fraction, by tropical region as in Fig. 1, averaged over DJF (a) and JJA (b).
3.2 Diurnal cycle of cloud fractions in the tropical stratosphere
In contrast with the previous studies, the CATS dataset allows us to analyze the diurnal cycle of the cloud fraction in stratosphere. The cloud fraction at a regional scale shows a consistent diurnal cycle, robust over the different regions identified in the previous section (Fig. 2). In particular and in contrast to the diurnal cycle of surface precipitation, there is no land–ocean difference. All exhibit a pronounced minimum of about 2 %–4 % during the daytime, from 07:00 to 16:00 LT. They all present a first maximum at 19:00 or 20:00 LT (early-night peak), up to 16.5 % over Equatorial Africa. For all regions except South America and the North Warm Pool, this maximum is the largest cloud fraction of the day. All regions also present a second peak (late-night peak) at 00:00 or 01:00 LT (23:00 LT for the West Pacific and 02:00 LT for Central Africa), up to 16.5 % over South America. The midnight peak over Equatorial Africa is less clear than over the other regions because of the large variations between 23:00 and 03:00 LT. The capability of a longer dataset to produce a clearer signal is to be investigated.
The cirrus clouds observed over Amazonia by ground-based lidar (Gouveia et al., 2017) shows a very similar diurnal cycle: a first peak in the early night (at 18:00–19:00 LT) and a second peak later in the night (at 02:00–03:00 LT). Although Gouveia et al. (2017) do not consider the cloud above the tropopause only, their distinction between subvisible, thin and opaque cirrus clouds indicates that the opaque cirrus clouds are predominant during the early night (18:00–21:00 LT) and that the thin cirrus (and subvisible ones during the dry season) dominate during the later night (from 00:00 and 02:00 LT onward, in wet and dry seasons, respectively).
The very deep convection transports cloudy air masses beyond the tropopause via overshoots and then directly contributes to the stratospheric cloud fraction (Dauhut et al., 2016, 2018). The diurnal cycle of the stratospheric cloud fraction observed by CATS can at the first order be explained by the diurnal cycle of very deep convection over land (Liu and Zipser, 2005), especially (i) the minimal value during daytime and (ii) the first peak in the early evening. This first peak occurs with a delay of 3 to 4 h compared to the very-deep-convection maximum. As the dataset used by Liu and Zipser (2005) is more sensitive to overshoots freshly developed into the stratosphere, this delay can be explained by the subsequent horizontal expansion of the overshoots and their spread by the winds (Dauhut et al., 2018; Lee et al., 2019). The convective generation of gravity waves, which produce transient cooling off the convective centers and in some conditions trigger cloud formation, can also contribute to the increase of the stratospheric cloud fraction after the maximum of the very deep convection and then explain the delay of the first peak and potentially the second peak. It may also explain the similar diurnal cycle over the ocean regions, either close (South Warm Pool) or remote (West Pacific) from land masses. This process remains to be investigated.
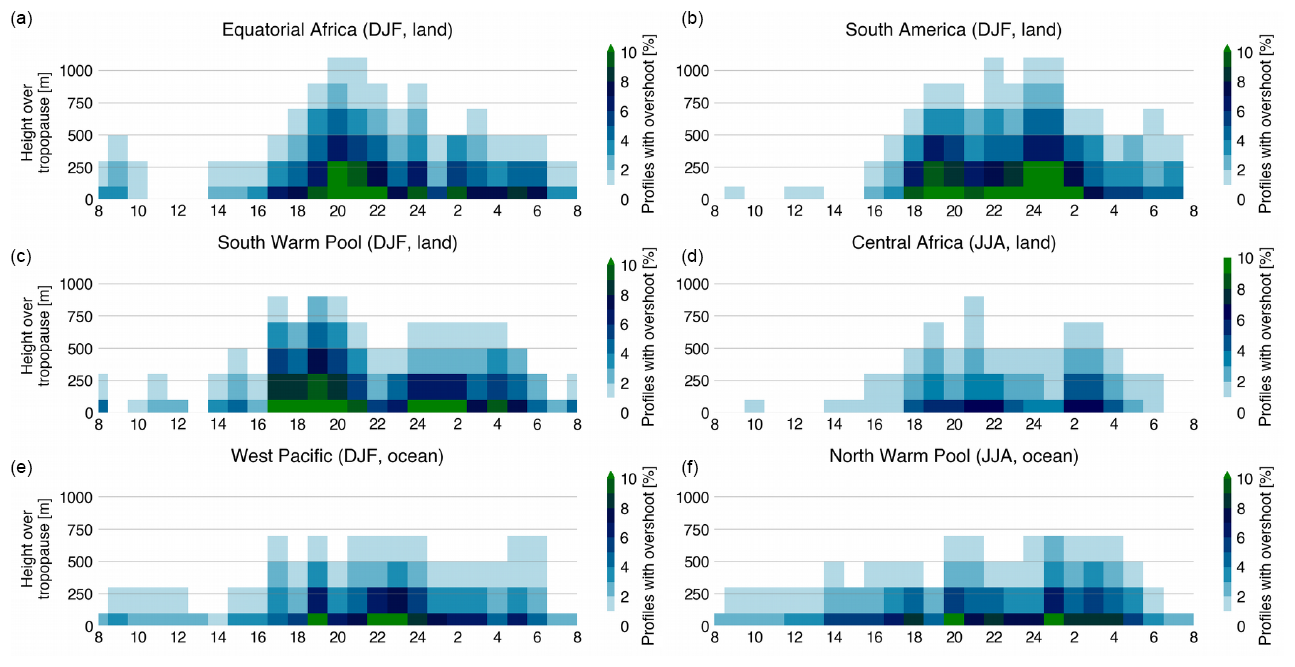
Figure 3Diurnal cycle of cloud fraction as a function of height above the tropopause, by tropical region as in Fig. 1, in DJF (a, b, c, e) and JJA (d, f).
Figure 3 shows how far above the tropopause the clouds extend, depending on the local time in each tropical region (Sect. 3.1). Some regions are considered in DJF, while others are considered in JJA, because the stratospheric cloud distribution changes throughout the year (Fig. 1), following the ITCZ (Intertropical Convergence Zone) position. Patterns appear very consistent in all the regions considered. In all regions the largest cloud fractions are found near the tropopause, with few clouds extending higher. Cloud fractions extend relatively high (up to 1 km above the tropopause) during the early night. The first peak of cloud fraction, near 19:00–20:00 LT (Fig. 2), is associated with the all-day maximum of cloud vertical extent, with clouds in 5 % of profiles reaching 1 km above the tropopause in DJF regions. During the rest of the night (after 00:00 LT) clouds are still present but extend less high (except over South America). During daytime (06:00–18:00) clouds appear very close to the tropopause. Cloud fractions are overall much smaller in JJA (maximum of 5 %–10 %; Fig. 3d, f) than in DJF (max 10 %–12 %, Fig. 3,a, b, c, e), even if the tropopause is lower in JJA than in DJF (Appendix A).
In addition to describing the evolution of the stratospheric cloud cover at hourly timescales, these observations help interpret observations with limited temporal sampling (Noel et al., 2018). The Microwave Limb Sounder (MLS), like CALIPSO and all other instruments on board platforms of the A-train (Afternoon Train), samples the atmosphere at 01:30 and 13:30 LT, providing one single night and one single day observation. Some authors (e.g., Dion et al., 2019) attempt to retrieve the diurnal cycle of the observed water contents in the tropopause region, combining MLS observations with higher-temporal-resolution observations of convective activity based on TRMM observations of precipitation. Dion et al. (2019) assumed an in-phase relationship between precipitation and ice water content in the upper troposphere and at the tropopause level. For the stratospheric ice water content, MLS data still provide a signal-to-noise ratio that is too low. For future investigations, our results indicate that the stratospheric cloud fraction at 13:30 LT is, whatever the region, close to the minimal value of its diurnal cycle, whereas at 01:30 LT it is more typical of the second maximum. Carminati et al. (2014) investigated, from MLS measurements between 2005 and 2012, the differences between day and night ice water contents in the upper troposphere and the tropopause level. Unlike the stratospheric cloud fraction, tropopause ice water contents are larger at 13:30 LT than at 01:30 LT over Equatorial Africa during DJF, over Central Africa during JJA and over South America during both seasons. A possible explanation to reconcile our results is that tropopause ice water content is more sensitive to fresh convective activity (very-deep-convection occurrence), whereas the stratospheric cloud cover is more sensitive to the diffusion of the injected ice in the stratosphere.
Our results show how clouds in the tropical stratosphere are strongly concentrated above deep-convection centers, are almost absent in subtropical regions, and are more frequent in DJF than JJA and over land than over the ocean. In addition to these results, which are consistent with most previous studies, we also show that both the cloud fraction and its extension above the tropopause follow a diurnal rhythm with a maximum during the early nighttime and a near-zero minimum during daytime. During daytime, the stratospheric clouds are limited to the first 100 m above the tropopause. During nighttime, a significant average cloud fraction is found up to 1 km above the tropopause. A second maximum of stratospheric cloud fraction is observed over all regions, generally a little after midnight. These results highlight how much the evolution of stratospheric clouds can be undersampled by other spatial instruments restricted to 01:30 and 13:30 LT, which then miss for instance the first maximum and the deepest development of stratospheric clouds in the early night. The very-deep-convective activity over tropical lands drives most of this diurnal cycle and leads in particular to the minimal stratospheric cloud fraction during daytime and the second peak during nighttime, both consistent over all regions. Further investigation is necessary to describe how convection contributes to this diurnal cycle and to assess the role of other processes leading to stratospheric cloud formation like the gravity waves. Finally further research is needed to understand why the timing of this diurnal cycle is very similar over land and over the ocean.
The tropopause altitude over each considered region shows no diurnal cycle but a significant seasonal variation: the tropopause is higher in DJF than in JJA whatever the region (Fig. A1). On the one hand this insures that the diurnal cycle of the stratospheric clouds is not due to variations in tropopause altitude. On the other hand, the larger stratospheric cloud fractions in DJF cannot be explained by a lower tropopause and a stratosphere easier to reach for the convection: on the contrary, the higher tropopause and the significant cloud fraction at a higher altitude above it in DJF suggest that the convection is deeper over the DJF-active regions than over the JJA-active regions.
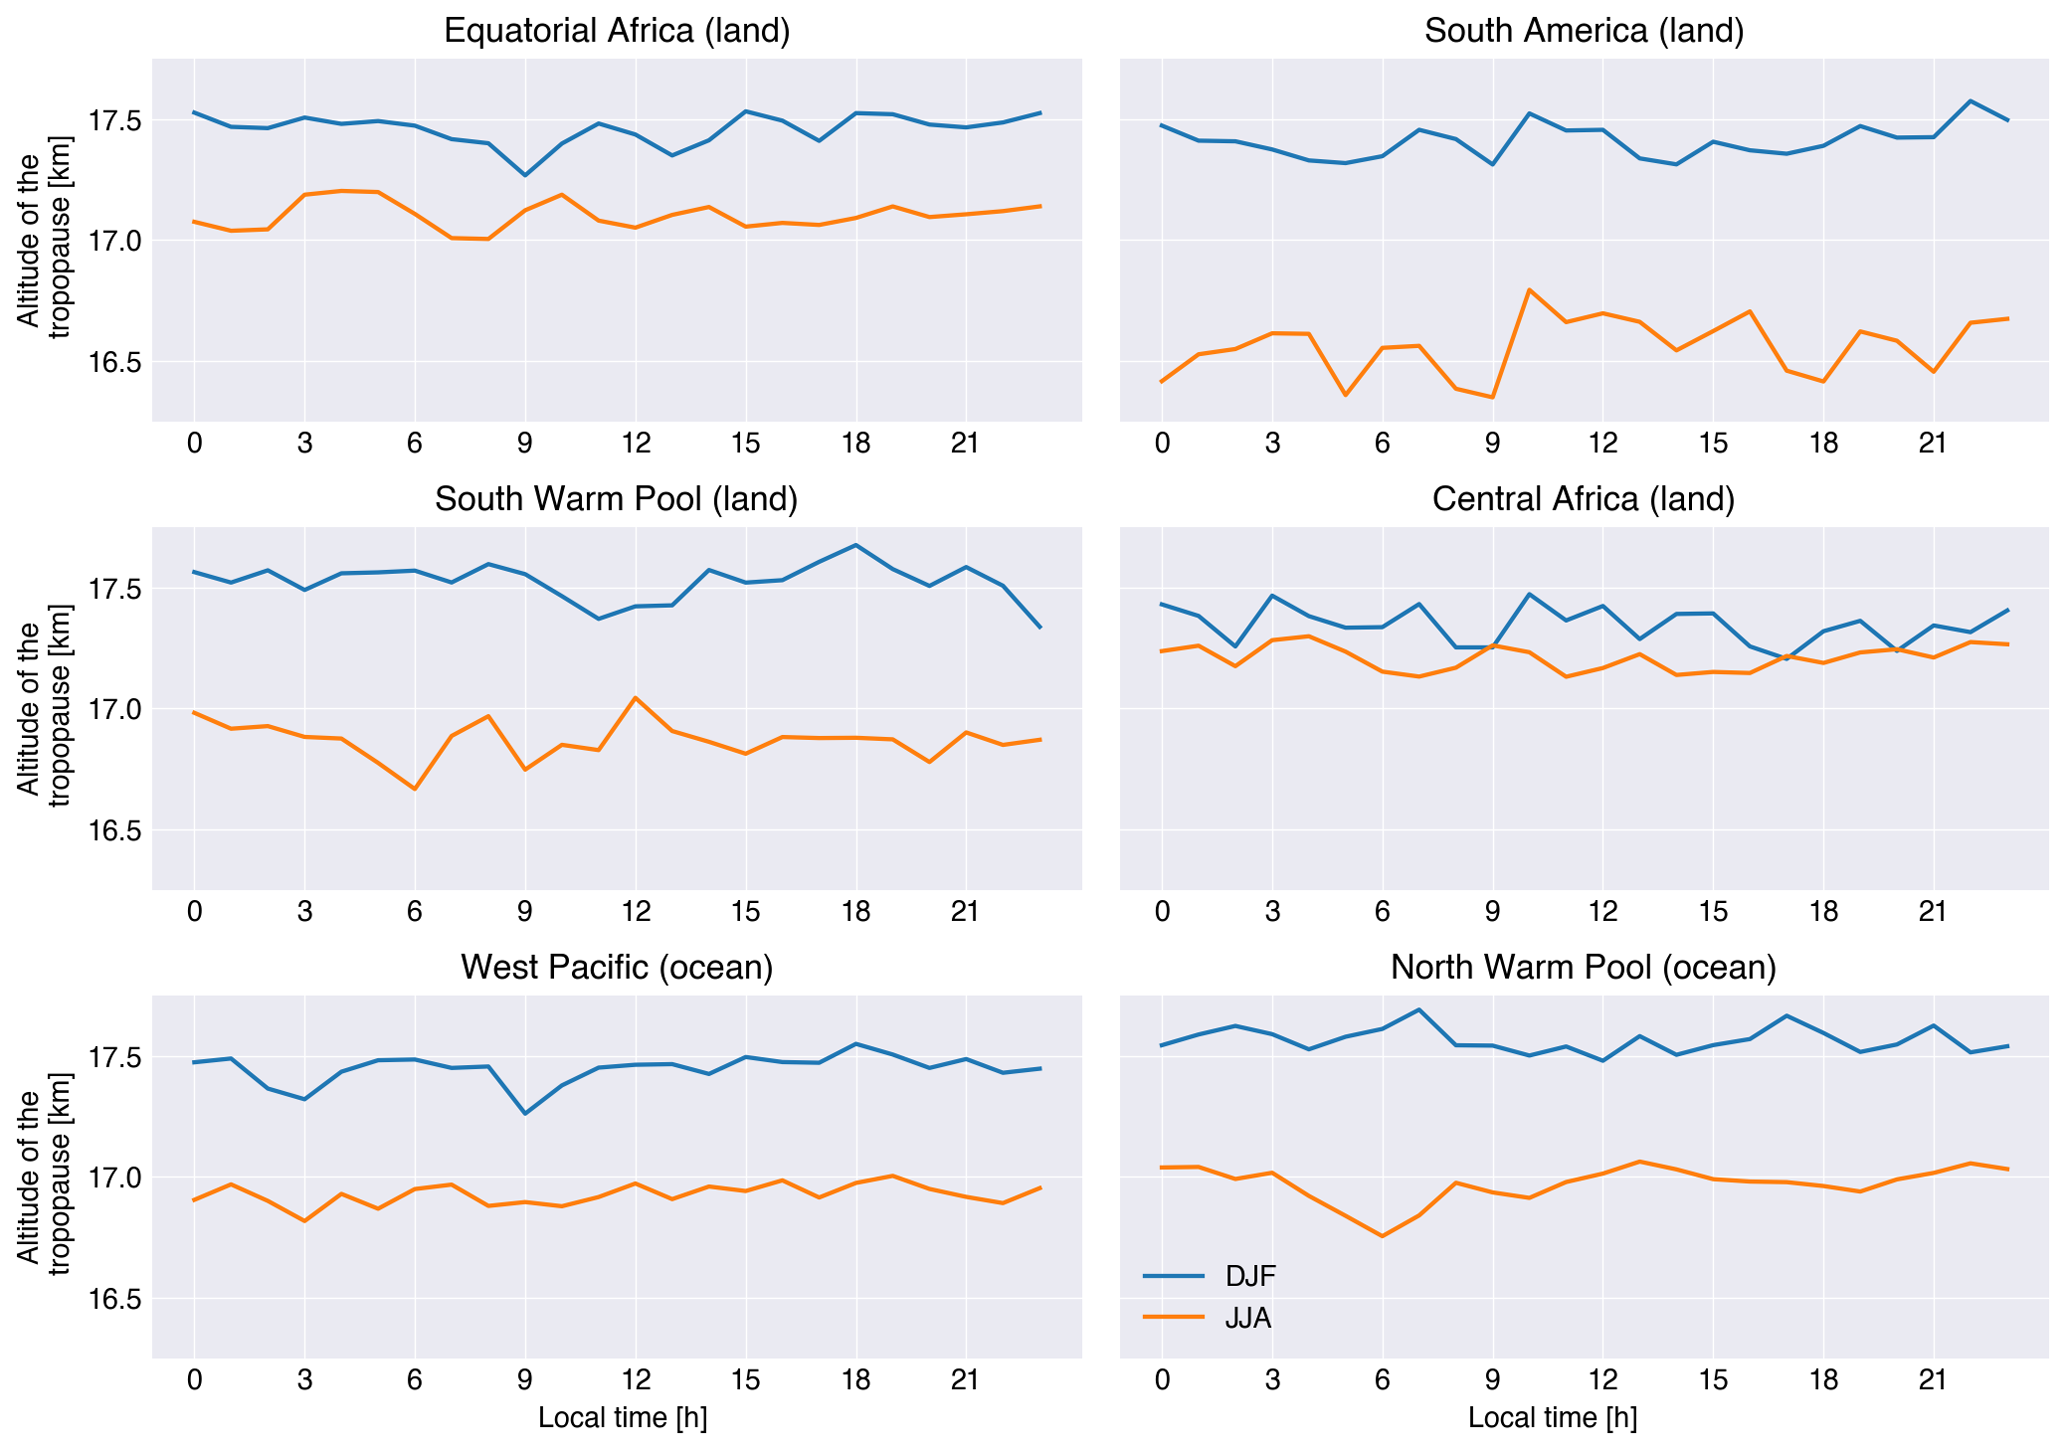
Figure A1Diurnal cycle of the tropopause altitude over each considered tropical region (DJF in blue and JJA in orange).
Primary data and scripts used in the analysis and other supplementary information that may be useful for reproducing the author's work are archived by the Max Planck Institute for Meteorology and can be obtained by contacting publications@mpimet.mpg.de.
TD and VN designed the data analyses, and VN carried them out. TD prepared the paper with contributions from VN and IAD.
The authors declare that they have no conflict of interest.
The authors would like to thank Bernard Legras (LMD) and Florian Pantillon (LA) for useful discussions on the quality of tropopause altitudes from various sources. They thank the two anonymous reviewers for their comments and suggestions, which greatly helped to improve the paper. They also thank NASA Earthdata for access to CATS data and ECMWF for access to the ERA5 reanalysis dataset. They processed CATS and ERA5 data using the storage and computing facilities of Climserv (part of the IPSL ESPRI Mesocenter) and ICARE from AERIS.
This research has been supported by the IDEX University of Toulouse (TEASAO project).
The article processing charges for this open-access
publication were covered by the Max Planck Society.
This paper was edited by Michael Pitts and reviewed by two anonymous referees.
Albergel, C., Dutra, E., Munier, S., Calvet, J.-C., Munoz-Sabater, J., de Rosnay, P., and Balsamo, G.: ERA-5 and ERA-Interim driven ISBA land surface model simulations: which one performs better?, Hydrol. Earth Syst. Sci., 22, 3515–3532, https://doi.org/10.5194/hess-22-3515-2018, 2018.
Carminati, F., Ricaud, P., Pommereau, J.-P., Rivière, E., Khaykin, S., Attié, J.-L., and Warner, J.: Impact of tropical land convection on the water vapour budget in the tropical tropopause layer, Atmos. Chem. Phys., 14, 6195–6211, https://doi.org/10.5194/acp-14-6195-2014, 2014.
Corti, T., Luo, B. P., Fu, Q., Vömel, H., and Peter, T.: The impact of cirrus clouds on tropical troposphere-to-stratosphere transport, Atmos. Chem. Phys., 6, 2539–2547, https://doi.org/10.5194/acp-6-2539-2006, 2006.
Corti, T., Luo, B. P., de Reus, M., Brunner, D., Cairo, F., Mahoney, M. J., Martucci, G., Matthey, R., Mitev, V., dos Santos, F. H., Schiller, C., Shur, G., Sitnikov, N. M., Spelten, N., Vössing, H. J., Borrmann, S., and Peter, T.: Unprecedented evidence for deep convection hydrating the tropical stratosphere, Geophys. Res. Lett., 35, L10810, https://doi.org/10.1029/2008GL033641, 2008.
Dauhut, T., Chaboureau, J. P., Escobar, J., and Mascart, P.: Giga-LES of hector the convector and its two tallest updrafts up to the stratosphere, J. Atmos. Sci., 73, 5041–5060, https://doi.org/10.1175/JAS-D-16-0083.1, 2016.
Dauhut, T., Chaboureau, J., Haynes, P. H., and Lane, T. P.: The Mechanisms Leading to a Stratospheric Hydration by Overshooting Convection, J. Atmos. Sci., 75, 4383–4398, https://doi.org/10.1175/JAS-D-18-0176.1, 2018.
Davis, S., Hlavka, D., Jensen, E., Rosenlof, K., Yang, Q., Schmidt, S., Borrmann, S., Frey, W., Lawson, P., Voemel, H., and Bui, T. P.: In situ and lidar observations of tropopause subvisible cirrus clouds during TC4, J. Geophys. Res., 115, D00J17, https://doi.org/10.1029/2009JD013093, 2010.
Dessler, A. E.: Clouds and Water Vapor in the Northern Hemisphere Summertime Stratosphere, 114, J. Geophys. Res., 114, D00H09, https://doi.org/10.1029/2009JD012075, 2009.
Dion, I.-A., Ricaud, P., Haynes, P., Carminati, F., and Dauhut, T.: Ice injected into the tropopause by deep convection – Part 1: In the austral convective tropics, Atmos. Chem. Phys., 19, 6459–6479, https://doi.org/10.5194/acp-19-6459-2019, 2019.
Dupont, J.-C., Haeffelin, M., Morille, Y., Noel, V., Keckhut, P., Winker, D., Comstock, J., Chervet, P., and Roblin, A.: Macrophysical and optical properties of midlatitude cirrus clouds from four ground-based lidars and collocated CALIOP observations, J. Geophys. Res., 115, D00H24, https://doi.org/10.1029/2009JD011943, 2010.
Frey, W., Borrmann, S., Fierli, F., Weigel, R., Mitev, V., Matthey, R., Ravegnani, F., Sitnikov, N. M., Ulanovsky, A., and Cairo, F.: Tropical deep convective life cycle: Cb-anvil cloud microphysics from high-altitude aircraft observations, Atmos. Chem. Phys., 14, 13223–13240, https://doi.org/10.5194/acp-14-13223-2014, 2014.
Fueglistaler, S., Dessler, A. E., Dunkerton, T. J., Folkins, I., Fu, Q., and Mote, P. W.: Tropical tropopause layer, Rev. Geophys., 47, RG1004, https://doi.org/10.1029/2008RG000267, 2009.
Gouveia, D. A., Barja, B., Barbosa, H. M. J., Seifert, P., Baars, H., Pauliquevis, T., and Artaxo, P.: Optical and geometrical properties of cirrus clouds in Amazonia derived from 1 year of groundbased lidar measurements, Atmos. Chem. Phys., 17, 3619–3636, https://doi.org/10.5194/acp-17-3619-2017, 2017.
Houze, R. A., Rasmussen, K. L., Zuluaga, M. D., and Brodzik, S. R.: The variable nature of convection in the tropics and subtropics: A legacy of 16-years of the Tropical Rainfall Measuring Mission satellite, Rev. Geophys., 53, 994–1021, https://doi.org/10.1002/2015RG000488, 2015.
Iwasaki, S., Luo, Z. J., Kubota, H., Shibata, T., Okamoto, H., and Ishimoto, H.: Characteristics of cirrus clouds in the tropical lower stratosphere, Atmos. Res., 164–165, 358–368, https://doi.org/10.1016/j.atmosres.2015.06.009, 2015.
Jensen, E. and Pfister, L.: Transport and freeze-drying in the tropical tropopause layer, J. Geophys. Res., 109, D02207, https://doi.org/10.1029/2003JD004022, 2004.
Jensen, E. J., Toon, O. B., Selkirk, H. B., Spinhirne, J. D., and Schoeberl, M. R.: On the formation and persistence of subvisible cirrus clouds near the tropical tropopause, J. Geophys. Res., 101, 21361–21375, https://doi.org/10.1029/95JD03575, 1996.
Jensen, E. J., Pfister, L., Ackerman, A. S., Tabazadeh, A., and Toon, O. B.: A conceptual model of the dehydration of air due to freeze-drying by optically thin, laminar cirrus rising slowly across the tropical tropopause, J. Geophys. Res., 106, 17237–17252, https://doi.org/10.1029/2000JD900649, 2001.
Jensen, E. J., Diskin, G., Lawson, R. P., Lance, S., Bui, T. P., Hlavka, D., McGill, M., Pfister, L., Toon, O. B., and Gao, R.: Ice nucleation and dehydration in the Tropical Tropopause Layer, P. Natl. Acad. Sci. USA, 110, 2041–2046, https://doi.org/10.1073/pnas.1217104110, 2013.
Kim, J., Randel, W. J., and Birner, T.: Convectively driven tropopause-level cooling and its influences on stratospheric moisture, J. Geophys. Res.-Atmos., 123, 590–606, https://doi.org/10.1002/2017JD027080, 2018.
Lee, K.-O., Dauhut, T., Chaboureau, J.-P., Khaykin, S., Krämer, M., and Rolf, C.: Convective hydration in the tropical tropopause layer during the StratoClim aircraft campaign: pathway of an observed hydration patch, Atmos. Chem. Phys., 19, 11803–11820, https://doi.org/10.5194/acp-19-11803-2019, 2019.
Liu, C. and Zipser, E. J.: Global distribution of convection penetrating the tropical tropopause, J. Geophys. Res., 110, D23104, https://doi.org/10.1029/2005JD006063, 2005.
Martins, E., Noel, V., and Chepfer, H.: Properties of cirrus and subvisible cirrus from nighttime Cloud-Aerosol Lidar with Orthogonal Polarization (CALIOP), related to atmospheric dynamics and water vapor, J. Geophys. Res., 116, D02208, https://doi.org/10.1029/2010JD014519, 2011.
Massie, S. T., Gille, J., Craig, C., Khosravi, R., Barnett, J., Read, W., and Winker, D.: HIRDLS and CALIPSO observations of tropical cirrus, J. Geophys. Res., 115, D00H11, https://doi.org/10.1029/2009JD012100, 2010.
McGill, M. J., Yorks, J. E., Scott, V. S., Kupchock, A. W., and Selmer, P. A.: The Cloud-Aerosol Transport System (CATS): A technology demonstration on the International Space Station, Proc. SPIE 9612, Lidar Remote Sensing for Environmental Monitoring XV, 96120A, https://doi.org/10.1117/12.2190841, 2015.
Nee, J. B., Len, C. N., Chen, W. N., and Lin, C. I.: Lidar observation of the cirrus cloud in the tropopause at Chung Li (25∘ N, 121∘ E), J. Atmos. Sci., 55, 2249–2257, 1998.
Noel, V., Chepfer, H., Chiriaco, M., and Yorks, J.: The diurnal cycle of cloud profiles over land and ocean between 51∘ S and 51∘ N, seen by the CATS spaceborne lidar from the International Space Station, Atmos. Chem. Phys., 18, 9457–9473, https://doi.org/10.5194/acp-18-9457-2018, 2018.
Palm, S. P., Hlavka, D. L., Selmer, P., and Pauly, R.: the Cloud Aerosol Transport System (CATS) Data Product Catalog release 3.0, available at: https://cats.gsfc.nasa.gov/media/docs/CATS_Data_Products_Catalog.pdf (last access: 23 January 2018), 2016.
Pan, L. L. and Munchak, L. A.: Relationship of Cloud Top to the Tropopause and Jet Structure from CALIPSO Data, J. Geophys. Res., 116, D12201, https://doi.org/10.1029/2010JD015462, 2011.
Pauly, R. M., Yorks, J. E., Hlavka, D. L., McGill, M. J., Amiridis, V., Palm, S. P., Rodier, S. D., Vaughan, M. A., Selmer, P. A., Kupchock, A. W., Baars, H., and Gialitaki, A.: Cloud-Aerosol Transport System (CATS) 1064 nm calibration and validation, Atmos. Meas. Tech., 12, 6241–6258, https://doi.org/10.5194/amt-12-6241-2019, 2019.
Pfister, L., Selkirk, H. B., Starr, D. O., Rosenlof, K., and Newman, P. A.: A meteorological overview of the TC4 mission, J. Geophys. Res., 115, D00J12, https://doi.org/10.1029/2009JD013316, 2010.
Podglajen, A., Hertzog, A., Plougonven, R., and Žagar, N.: Assessment of the accuracy of (re)analyses in the equatorial lower stratosphere, J. Geophys. Res.-Atmos., 119, 11166–11188, https://doi.org/10.1002/2014JD021849, 2014.
Reichler, T., Dameris, M., and Sausen, R.: Determining the Tropopause Height from Gridded Data, Geophys. Res. Lett., 30, 2042, https://doi.org/10.1029/2003GL018240, 2003.
Reverdy, M., Noel, V., Chepfer, H., and Legras, B.: On the origin of subvisible cirrus clouds in the tropical upper troposphere, Atmos. Chem. Phys., 12, 12081–12101, https://doi.org/10.5194/acp-12-12081-2012, 2012.
Rieckh, T., Scherllin-Pirscher, B., Ladstädter, F., and Foelsche, U.: Characteristics of tropopause parameters as observed with GPS radio occultation, Atmos. Meas. Tech., 7, 3947–3958, https://doi.org/10.5194/amt-7-3947-2014, 2014.
Sassen, K., Liou, K.-N., Takano, Y., and Khvorostyanov, V. I.: Diurnal effects in the composition of cirrus clouds, Geophys. Res. Lett., 30, 1539, https://doi.org/10.1029/2003GL017034, 2003.
Schoeberl, M. R., Jensen, E. J., Pfister, L., Ueyama, R., Wang, T., Selkirk, H., Avery, M., Thornberry, T., and Dessler, A. E.: Water vapor, clouds, and saturation in the tropical tropopause layer, J. Geophys. Res.-Atmos., 124, 3984–4003, https://doi.org/10.1029/2018JD029849, 2019.
Thomas, A., Borrmann, S., Kiemle, C., Cairo, F., Volk, M., Beuermann, J., Lepuchov, B., Santacesaria, V., Matthey, R., Rudakov, V., Yushkov, V., MacKenzie, A. R., and Stefanutti, L.: In situ measurements of background aerosol and subvisible cirrus in the tropical tropopause region, J. Geophys. Res., 107, 4763, https://doi.org/10.1029/2001JD001385, 2002.
Wang, T., Wu, D. L., Gong, J., and Tsai, V.: Tropopause laminar cirrus and its role in the lower stratosphere total water budge, J. Geophys. Res.-Atmos., 124, 7034–7052, https://doi.org/10.1029/2018JD029845, 2019.
World Meteorological Organization (WMO): Meteorology – A three-dimensional science: Second session for the commission for aerology, WMO Bull., 6, 134–138, 1957.
Yorks, J. E., McGill, M. J., Palm, S. P., Hlavka, D. L., Selmer, P. A., Nowottnick, E. P., Vaughan, M. A., Rodier, S. D., and Hart, W. D.: An overview of the CATS level 1 processing algorithms and data products, Geophys. Res. Lett., 43, 4632–4639, https://doi.org/10.1002/2016GL068006, 2016.