the Creative Commons Attribution 4.0 License.
the Creative Commons Attribution 4.0 License.
Methane emissions from the Munich Oktoberfest
Hossein Maazallahi
Andreas Forstmaier
Dominik Winkler
Magdalena E. G. Hofmann
Hugo Denier van der Gon
Thomas Röckmann
This study presents the first investigation of the methane (CH4) emissions of a large festival. Munich Oktoberfest, the world's largest folk festival, is a potential source of CH4 as a large amount of natural gas for cooking and heating is used.
In 2018 we measured the CH4 emissions of Oktoberfest using in situ measurements combined with a Gaussian plume dispersion model. Measurements were taken while walking and biking around the perimeter of the Oktoberfest premises (Theresienwiese) at different times of the day, during the week and at the weekend. The measurements showed enhancements of up to 100 ppb compared to background values and measurements after Oktoberfest. The average emission flux of Oktoberfest is determined as (6.7±0.6) µg (m2 s)−1. Additional analyses, including the daily emission cycle and comparisons between emissions and the number of visitors, suggest that CH4 emissions of Oktoberfest are not due solely to the human biogenic emissions. Instead, fossil fuel CH4 emissions, such as incomplete combustion or loss in the gas appliances, appear to be the major contributors to Oktoberfest emissions.
Our results can help to develop CH4 reduction policies and measures to reduce emissions at festivals and other major events in cities. Furthermore, events with a limited duration have not yet been included in the state-of-the-art emission inventories, such as TNO-MACC, EDGAR or IER. Our investigations show that these emissions are not negligible. Therefore, these events should be included in future emission inventories.
- Article
(5129 KB) - Full-text XML
- BibTeX
- EndNote
Climate change is a global problem that is having a profound impact on living conditions and human societies. The present global warming is very likely due to strong anthropogenic greenhouse gas (GHG) emissions. The Paris Agreement establishes an international effort to limit the temperature increase to well below 2 ∘C above preindustrial levels. A global stocktake will revisit emission reduction goals every 5 years starting in 2023. The EU aims to cut its GHG emissions by 40 % by 2030 and by 80 % to 100 % by 2050, compared to the 1990 level. The German climate action plan (Klimaschutzplan 2050) contains similar goals, i.e., to cut at least 55 % of German GHG emissions by 2030 and at least 80 % to 95 % by 2050.
Methane (CH4) is the second-most prevalent GHG emitted by human activities (Allen et al., 2018; Etminan et al., 2016; Myhre et al., 2013). It is estimated to have a global warming potential (GWP) that is 28 to 34 times larger than that of CO2 over the 100-year horizon (IPCC, 2013). According to Etminan et al. (2016) the GWP is even 14 % higher than the values reported by IPCC. CH4 has been responsible for around 20 % of the global warming by anthropogenic greenhouse gases since 1750 (Nisbet et al., 2014; Kirschke et al., 2013). Current atmospheric CH4 concentrations are 2.5 times as high as the preindustrial levels, and since the industrial revolution relative concentration growth of CH4 has been 3 times faster than that of CO2. After experiencing a nearly constant CH4 concentration (total amount of CH4 in the atmosphere) from 1999 to 2006, CH4 concentrations have started to increase again (Saunois et al., 2016; Nisbet et al., 2014). The reasons for the renewed growth are not fully understood; fossil fuel methane emissions are largely underestimated (Schwietzke et al., 2016) and could play a major role in the increase (Hausmann et al., 2016; Worden et al., 2017). Natural gas is a growing source of energy, but its unwanted release into the atmosphere is a significant component of anthropogenic CH4 emissions (Schwietzke et al., 2014; McKain et al., 2015), and its reduction may be essential for attaining the goal of the Paris agreement.
Therefore, recent investigations have concentrated on detecting and quantifying CH4 emissions from city gas pipelines, power plants, and other gas and oil facilities using various methods. Phillips et al. (2013) mapped CH4 leaks across all urban roads in the city of Boston using a cavity ring-down mobile analyzer. They identified 3356 leaks with concentrations exceeding up to 15 times the global background level and used their isotopic signatures to show that the leaks are associated with natural gas. Roscioli et al. (2015) described a method using dual-tracer flux ratio measurements complemented by on-site observations to determine CH4 emissions from natural gas gathering facilities and processing plants. Toja-Silva et al. (2017) used differential column measurements (Chen et al., 2016) and a computational fluid dynamics (CFD) model to quantify emissions from a natural-gas-based power plant in Munich. Atherton et al. (2017) conducted mobile surveys of CH4 emissions from oil and gas infrastructures in northeastern British Columbia, Canada, and used the CO2∕CH4 ratios to identify these emissions. Weller et al. (2018) evaluated the ability of mobile survey methodology (von Fischer et al., 2017) to find natural gas leaks and quantified their emissions. Yacovitch et al. (2015) measured CH4 and ethane (C2H6) concentrations downwind of natural gas facilities in the Barnett Shale region using a mobile laboratory. A couple of years later, Yacovitch et al. (2018) investigated the Groningen natural gas field, one of Europe's major gas fields, using their mobile laboratory in combination with airborne measurements. Luther et al. (2019) deployed a mobile sun-viewing Fourier transform spectrometer to quantify CH4 emissions from hard coal mines. Other studies laid a special focus on city and regional emissions of fossil fuel CH4. McKain et al. (2015) determined natural gas emission rates for the Boston urban area using a network of in situ measurements of CH4 and C2H6 and a high-resolution modeling framework. Lamb et al. (2016) quantified the total CH4 emissions from Indianapolis using the aircraft mass balance method and inverse modeling of tower observations, and they distinguished the fossil fuel component using C2H6∕CH4 tower data. Wunch et al. (2016) used total column measurements of CH4 and C2H6 recorded since the late 1980s to quantify the loss of natural gas within California's South Coast Air Basin. Most recently, Plant et al. (2019) reported aircraft observations of CH4, CO2, C2H6, and carbon monoxide (CO) of six old and leak‐prone major cities along the East Coast of the United States. They found emissions attributed to natural gas are about a factor of 10 larger than the values provided by the EPA inventory.
Large folk festivals are also likely sources of anthropogenic emissions of air pollutants, such as nitrogen oxides (NOx), CO, particulate matter (PM2.5, PM10), sulfur dioxide (SO2), etc. Huang et al. (2012) investigated the impact of human activity on air quality before, during, and after the Chinese Spring Festival, the most important festival in China. They used potential source contribution function analysis to illustrate the possible source for air pollutants in Shanghai. Shi et al. (2014) measured concentrations of particulate matter and polycyclic aromatic hydrocarbons (PAHs) during the Chinese New Year's Festival 2013 and estimated the source attributions from cooking, vehicles, and biomass and coal combustion. Kuo et al. (2006) investigated PAH and lead emissions from cooking during the Chinese mid-autumn festival. Nishanth et al. (2012) reported elevated concentrations of various air pollutants such as ozone (O3), NOx, and PM10 after the traditional Vishu festival in southern India. Nevertheless, up to now, festivals have not been considered a significant source of CH4 emissions and accordingly, to the best of our knowledge, CH4 emissions from large festivals have not yet been studied.
Oktoberfest, the world's largest folk festival with over 6 million visitors annually, is held in Munich. In 2018, during the 16 d of Oktoberfest, approximately 8 million L of beer was consumed. For cleaning, dish washing, toilet flushing, etc., 107 million L of water was needed. The use of energy added up to 2.9 million kWh of electricity and 200 937 m3 of natural gas, 79 % of which is used for cooking and 21 % for heating (München, 2018a).
The measurements during our 2017 Munich city campaign indicated Oktoberfest as a possible source for CH4 for the first time (Chen et al., 2018). For a better source attribution and a quantitative emission assessment, we have investigated the CH4 emissions from Oktoberfest 2018 by carrying out mobile in situ measurements and incorporating a Gaussian plume dispersion model. These measurements and modeling approaches are described in Sect. 2. The results of these investigations show that Oktoberfest is an anthropogenic source of CH4 that has not been accounted for until now. We have compared the determined total emission flux with bottom-up estimates of biogenic emissions from humans, and we also present the daily cycle of the emissions. In addition, the week and weekend variations are shown. From these findings we can draw conclusions about the origins of the Oktoberfest CH4 emissions, which are presented in Sect. 3.
We conducted a mobile survey around the perimeter of Oktoberfest to obtain the CH4 concentration values around the festival area (Theresienwiese) and incorporated a Gaussian plume model consisting of 16 different point sources to determine the CH4 emission strength.
2.1 Measurement approach and instrumentation
The measurements include both CH4 and wind measurements. The sensors and the way they are used are described in the following.
2.1.1 Concentration measurements
Mobile in situ measurements were conducted to quantify CH4 enhancements. To this end, two portable Picarro GasScouter G4302 instruments for measuring CH4 and C2H6 were used. The sensor is based on the cavity ring-down measurement principle (O'Keefe and Deacon, 1988), using a laser as a light source and a high-finesse optical cavity for measuring gas concentrations with high precision, which is 3 ppb for CH4 mode with 1 s integration time (Picarro, 2017). We applied a moving-average filter with a window size of 10 s and a step size of 5 s to the 1 s raw measurements. Since the data are averaged over 10 s, the precision is improved to 1 ppb. To distinguish between fossil-fuel-related and biogenic emissions, the instrument can be switched to CH4∕C2H6 mode and measure C2H6 with a precision of 10 ppb for an integration time of 1 s.
Since we were not allowed to enter the festival area due to safety concerns, the measurements were carried out by walking and biking many times around the perimeter of Oktoberfest next to the security fences, wearing the analyzer as a backpack. The measurements were taken on several days during and after the time of the festival to compare the differences in emission strength and distribution. Additionally, to observe the hourly dependency of the emissions, the measurements were distributed over the course of the day. In the end, we covered the period between 08:00 and 19:00 (local time) hourly.
For the study, two identical GasScouter G4302 instruments were deployed. One instrument was provided by TNO and the other by Picarro Inc. The former was used in the first week while the latter was used in the second week of Oktoberfest as well as the time after the festival. Although the measurement approach is based on determining the enhancements and not on comparing absolute concentration values, the two instruments were calibrated at the beginning of the campaign.
2.1.2 Wind measurements
In addition to the gas concentrations, wind measurements are vital for estimating the emissions of Oktoberfest using atmospheric models. To this end, a 2D ultrasonic wind sensor (Gill WindObserver II) was placed on a roof close by (48.148∘ N, 11.573∘ E, 24 m a.g.l.). These wind measurements were utilized for the emission estimates.
To assess the uncertainty of the wind measurements, we compared these measurements with the values reported by an official station of Germany's National Meteorological Service (Deutscher Wetterdienst, DWD). The DWD station (48.163∘ N, 11.543∘ E, 28.5 m a.g.l.) is located about 2.8 km away. As this distance is about the radius of the Munich inner city, we assumed that the difference between the two stations is representative for the uncertainty of two arbitrary measurement points in the downtown area, which is also home to Oktoberfest.
2.2 Modeling approach
To quantify the emissions of Oktoberfest, we used the measured concentration values as input for an atmospheric transport model.
2.2.1 Selection algorithm
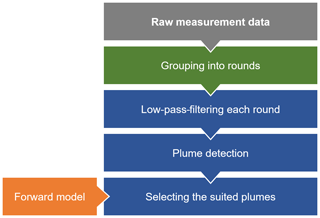
For our modeling approach, the plumes of individual surveys (hereafter referred to as “rounds”) around the Theresienwiese were evaluated. In total, we completed 94 rounds (69 during and 25 after Oktoberfest). For every round the individual plumes were determined by analyzing a low-pass-filtered version of the measurement time series. A Kaiser window (Kaiser and Schafer, 1980) was utilized for the low-pass filtering.
Once the signal was filtered, a signal section between two adjacent minima was defined as a plume signal if it had an enhancement of more than 5 ppb. We chose this threshold to be equal to the combined uncertainty of the instrument (3 ppb) and background (4 ppb) (see Sect. 2.2.6). This process is illustrated in Fig. 1.
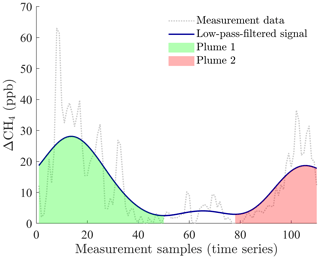
Figure 1The preprocessed measurement signal (dotted line, moving average with window size of 10 s and step size of 5 s) is shown along with a low-pass-filtered version (blue line), which is used to obtain the single plumes (green and red area). The signal in the center is not detected as a plume, as the enhancement is not high enough. The round shown was recorded by bike and took 550 s (9.2 min).
When the initial plume selection phase was completed, the identified plumes were further analyzed. As the path of a measurement around the Oktoberfest premises was predefined by the security fence, the location of each point on that route can be converted into a fixed angle, which simplifies the comparison between the measurements and the model. For that purpose, a center point of the Theresienwiese was defined (see green dot in Fig. 2, 48.1315∘ N, 11.5496∘ E). With the help of this point, an angle was assigned to all measurement and model values. This angle was defined similarly to the wind angles, meaning that 0∘ is in the north and 90∘ is in the east.
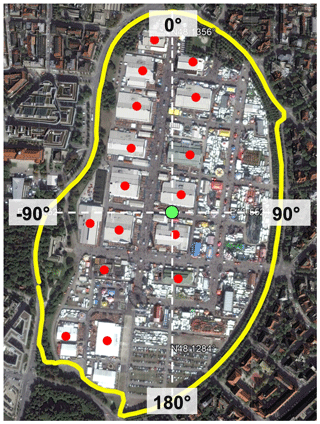
Figure 2Standard route around Oktoberfest (yellow) including the locations of the 16 tents (red) and the center point (green). Map data are from © Google, DigitalGlobe.
In order to decide whether a measured plume is attributable to emissions from Oktoberfest, a forward model uses the measured wind direction (with uncertainty) to calculate at which angles a plume from Oktoberfest should occur. As can be seen in Fig. 3, only plume 1 was selected because the angle range of this plume (green) largely overlaps with the accepted angle range (grey) computed by the forward model of this plume. In contrast, plume 2 (red) has no overlap with the range computed by the forward model; hence, plume 2 was discarded.
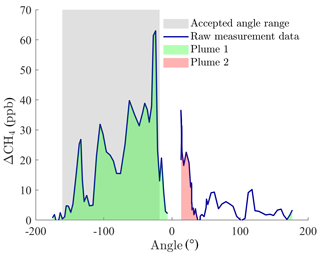
Figure 3Measurement signal mapped onto the standard route with the angle on the abscissa. Two detected plumes and the accepted angle range computed by the forward model are highlighted. Plume 2 has no overlap with the accepted range and is therefore discarded.
Additionally, the standard deviation of the wind direction over the time the plume was recorded is taken into account. If the standard deviation is higher than 24∘, the plume is not considered, as our approach requires stable wind conditions. Those 24∘ represent the measurement uncertainty in the wind direction (see Sect. 2.2.6) and are therefore well suited as a lower limit for filtering out too variable wind conditions.
The selection algorithm described above is visually summarized in Fig. 4.
2.2.2 Baseline determination
As one measurement round can take up to 1 h (when walking), the atmospheric conditions can vary during that time period, which will result in a changing background concentration. Therefore, the baseline for determining the concentration enhancements cannot be calculated solely using a constant value.
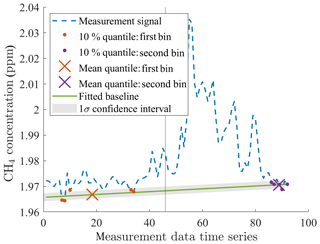
In our approach, we assume that the baseline during one round is either rising or falling and that there is a linear behavior. Such a straight line is clearly defined by two points. For that reason, the time series for each round was divided into two equally sized bins (first and second half). For each half, we determined the lowest 10 % quantile. Afterwards, the mean values of the smallest 10 % of concentration values of each bin were used to define one straight line, which was used as the background for that specific round (see Fig. 5). The uncertainty of that baseline was determined using the CH4 concentration deviations of the smallest 10 % of values from the baseline.
2.2.3 Gaussian plume model
The framework of our modeling approach is based on a Gaussian plume model described in Sutton (1932), Briggs (1973), and Hanna et al. (1982) and widely used to access local source emissions (Bovensmann et al., 2010; Yacovitch et al., 2015; Atherton et al., 2017; Nassar et al., 2017; Kiemle et al., 2017). It is a steady-state model that simulates the diffusion and the transport of emitted trace gases from a point source. The gas disperses such that its concentration distributions fit well to Gaussian curves in the vertical and horizontal directions.
For a point source emitting continuously with strength Q (mol s−1) at effective height H above the ground and uniform wind speed, the expression for the time-averaged concentration (mol m−3) is given by the formula below:
with x, y, and z describing the downwind distance, horizontal/cross-wind distance to the x axis, and the height above the ground, respectively. is the time-averaged wind speed, σy(x) is the standard deviation of the concentration in the cross-wind direction, and σz(x) is the standard deviation of the concentration in the vertical direction. These dispersion coefficients describe the spreading of a plume increasing with x, which is the downwind distance from the source.
To determine the dependency of σy and σz on x, diffusion experiments were carried out (Haugen, 1959), which resulted in Pasquill's curves (Pasquill, 1961; Gifford, 1976). Smith (1968) worked out an analytic power-law formula for the relationship between σy, σz, and x. Briggs (1973) combined the aforementioned curves and used theoretical concepts to produce the widely used formulas presented in Hanna et al. (1982).
During the measurement periods, the surface wind was lower than 4 m s−1 and the insolation was strong to moderate. Therefore, stability class A or B was chosen according to the Pasquill turbulence types (Gifford, 1976).
Based on Briggs' recommendations for urban conditions (Briggs, 1973; Hanna et al., 1982), the relationships between the dispersion parameters and the downwind distance are described as
These relationships were used in our study.
2.2.4 Multiple-Gaussian-plume model
The concentration measurements using the backpack instrument were performed close to the festival area (<500 m), which is why the emissions of Oktoberfest cannot be seen as a single point source. Accordingly, multiple point sources were used, which were modeled as Gaussian plumes before they were superimposed. The spatially superimposed plumes were detected as a continuous plume signal in our measurement. Later on, these plume signals were utilized for the emission assessment.
Since the emission sources of Oktoberfest were unknown, the locations with the highest density of visitors and with the highest energy consumption were chosen as the main sources for the model. Those locations are represented by the 16 biggest beer tents (>1000 seats) on the festival premises (see red dots in Fig. 2). To achieve a good correlation between the model and reality, these 16 tents were not treated equally in the final model. Instead, they were linearly weighted according to their maximum number of visitors. Therefore, the largest tent (about 8500 visitors) has, in the end, a greater than 8 times higher influence on the total emission number than the smallest tent (about 1000 visitors).
2.2.5 Forward modeling approach
The multiple Gaussian plume model was used in a forward approach to compare the measured and modeled concentration signals with each other. For this, a predefined route around Oktoberfest was used (see yellow route in Fig. 2) to determine the concentrations for each angle.
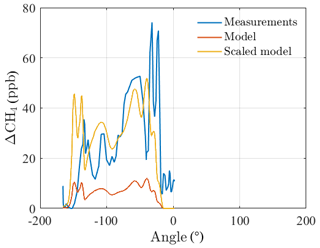
The actual shape of the concentration vs. angle graph c(α) for every selected plume i are considered for the determination of the emission of Oktoberfest EOkt,i (see Fig. 6, blue curve). The optimization procedure can be expressed mathematically as follows:
where M represents the model. The emission number Ei was varied until the areas underneath the modeled and measured curves are the same, and thus the sum of the absolute difference between the model and measurement is minimized.
Specifically, we computed the forward model using the averaged wind information at this time and a prior emission number Eprior of 3 µg (m2 s)−1 and compared it with the measurement curve. If the shapes look similar (high cross-correlation coefficient), a scaling factor is applied to the prior emission number and varied until the forward model matches the measurements. This procedure is illustrated for one exemplary plume signal in Fig. 6. There, the prior modeled concentrations (orange) are smaller than the measured concentrations (blue). Therefore, the model has to be multiplied with a scaling factor until the areas underneath the modeled and measured curve are the same (yellow). By multiplying the scaling factor kscaling,i with the Eprior, the emission number of Oktoberfest EOkt,i for every plume signal i can be determined as
2.2.6 Uncertainty assessment
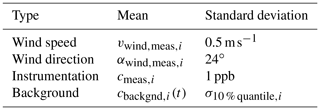
To determine the uncertainty of the final emission numbers, we considered the uncertainties of our input parameters. These include uncertainties in the wind and concentration measurements as well as uncertainties in the determined baseline. These input parameters were each modeled as a Gaussian distribution. Afterwards, the emission number was determined by running our modeling approach 1000 times using those four parameters (wind speed, wind direction, measured CH4 concentration, background concentration) as input. In each run, slightly different input values were chosen randomly and independent from each other out of those four distributions.
The concentration measurement uncertainty is indicated by the manufacturer Picarro to be about 1 ppb for an integration time of 10 s. This value was used as the standard deviation of the modeled input distribution.
For the wind speed and direction, the instrument uncertainty as well as the spatial variations in the winds were taken into account. For that reason, the uncertainty of the wind measurements was determined by comparing two measurement stations within the inner city of Munich (see Sect. 2.1.2). We determined the differences in wind speed and direction throughout September and October 2018. The differences are representative of the heterogeneity of the wind within the inner city of Munich and, therefore, represent an upper bound for the uncertainty of the wind within the Oktoberfest premises. The comparison of both the wind speed and direction resulted in Gaussian-shaped distributions with mean values each around zero. The standard deviations of the differences between the reported wind directions and speeds of the two stations are 24∘ and 0.5 m s−1 throughout September and October 2018.
The baseline approach described in Sect. 2.2.2 introduces a further error which has to be considered as well. The background concentration was modeled as a linear baseline where the offset follows a Gaussian distribution. Its standard deviation was calculated from the differences between the smallest 10 % of concentration values of each bin and the baseline (see Fig. 5).
The parameters used for the uncertainty assessment are summarized in Table 1.
3.1 Concentration mapping
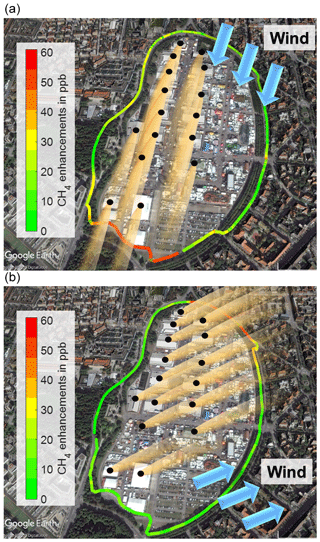
The measured CH4 concentrations were plotted for each round on a map of the Oktoberfest premises to show that there is a clear correlation between the wind directions and the enhancements. As the variations in the boundary layer height should not be taken into account, these plots do not show the absolute concentration values but just the enhancements above the determined background concentrations (see Sect. 2.2.2). Two such plots for two different wind directions are shown in Fig. 7. In addition to the concentration enhancements and the wind direction, the 16 emission sources are shown as black dots on top of each tent. The Gaussian plumes themselves are also represented. These two plots reveal that the highest concentration enhancements can be observed downwind of the Oktoberfest premises.
3.2 Emission number
The average emission of the Oktoberfest 2018 EOkt,avg is determined by averaging the emission numbers of the N plume signals EOkt,i during the complete Oktoberfest time period (including the weekdays and weekends), accordingly:
To make the final emission number more robust and to determine an uncertainty, the basic approach of Eq. (6) was improved. Instead of just using the actual measured data, an uncertainty range was applied to the four main input parameters, each using Gaussian distributions (see Sect. 2.2.6).
For every plume signal i, 1000 samples of randomly chosen input datasets from the aforementioned normal distributions of the input parameters were used to determine 1000 slightly different emission numbers . Using Eq. (6), an average emission number for each realization was calculated:
The average emission number including an uncertainty assessment can be obtained by determining the mean μOkt and standard deviation σOkt of those 1000 realizations:
The result for the total emission number of Oktoberfest 2018 is shown in Fig. 8 and has a value of
To verify whether those emissions were caused by Oktoberfest, Fig. 8 also shows the emissions determined for the time after Oktoberfest (from 8 October through 25 October). This number (1.1±0.3) µg (m2 s)−1 is significantly smaller than the one during Oktoberfest but still not zero. It indicates that the emissions are caused by Oktoberfest, and the disassembling of all the facilities, which takes several weeks, still produces emissions after Oktoberfest.
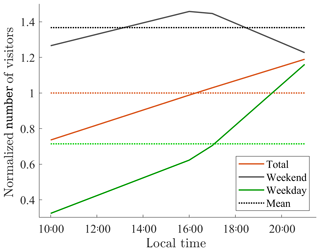
After grouping the emission numbers into the two categories, weekday (in total 47 valid plumes) and weekend (27 valid plumes), two separated distributions are visible in Fig. 9. The average emission for the weekend (8.5±0.7) µg (m2 s)−1 is higher than the averaged emission for the weekdays (4.6±0.9) µg (m2 s)−1, almost by a factor of 2. To interpret this result, the visitor trend of Oktoberfest was investigated. This trend is based on the officially estimated numbers of visitors (muenchen.de, 2018) and was linearly interpolated (see Fig. 10). Besides the daily trend, it also shows the mean values of the weekdays and weekend days (dotted lines). As the number of visitors at Oktoberfest was also significantly higher on a weekend day than on a weekday (approximately a factor of 2; see Fig. 10), a higher number of visitors results in higher emissions, which indicates the CH4 emissions are anthropogenic.
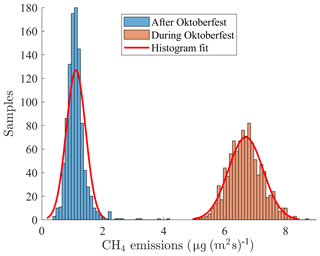
Figure 8Total CH4 emission estimates during (light red) and after (blue) the Oktoberfest 2018 including a fitted normal distribution (red line).
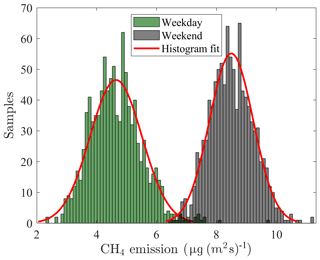
Figure 9CH4 emission estimates for a weekday (green) and a weekend day (black) including a fitted normal distribution (red line).
3.3 Daily emission cycle
To assess the daily cycle of the CH4 emissions, the emission numbers of the plume signals are grouped into hourly bins. Then, for each bin an average emission is calculated. Afterwards, these numbers are averaged for the 1000 realizations to obtain robust results including an uncertainty estimate:
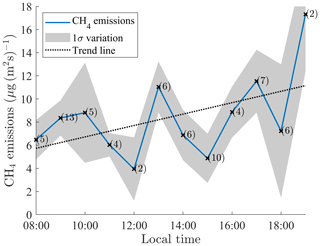
In Fig. 11, the variation in the hourly emission mean μOkt,hour is shown as a blue line. The grey shaded area shows the uncertainty σOkt,hour of the emission numbers within that hour. The daily emission cycle shows an oscillating behavior overlaid on an increasing trend towards the evening.
The linear increasing trend is in agreement with Fig. 10, which shows a linearly increasing visitor amount throughout the day, confirming the anthropogenic nature of the emissions. The oscillating behavior indicates that the emissions are related to time-dependent events, such as cooking, heating, and cleaning, which tend to show peaks in the morning, noon, and evening.
3.4 Biogenic human CH4 emissions
To address the question of whether the people themselves caused the emissions or whether the emissions were caused by processes related to the number of visitors, such as cooking, heating, sewage, etc., we took a closer look at human biogenic emissions.
Most of the previous studies define a methane producer as a person that has a breath CH4 mixing ratio at least 1 ppm above ambient air (Polag and Keppler, 2019). Keppler et al. (2016), however, used laser absorption spectroscopy to confirm that all humans exhale CH4. In that study, the mean of the breath CH4 enhancements above the background from 112 test persons between 1 and 80 years of age is 2316 ppb and the values vary from 26 ppb to 40.9 ppm.
In addition, we have considered the values reported in Polag and Keppler (2019). The authors provided a summary of various studies of human CH4 emissions in Table 1 and Sect. 3.2, and we used these results to calculate average human CH4 emissions, which are 2.3 mmol d−1 via breath and 7 mmol d−1 via flatus. We multiplied these values with the 300 000 persons that visit the Oktoberfest premises () every day. This represents an upper limit of people who are at the Oktoberfest at the same time, as most visitors do not stay all day long. Please note the average emission numbers are not factor weighted by ethnicity, age, and sex, because we do not have those statistics for Oktoberfest. The expected CH4 emission from the human breath and flatulence in total was calculated as
Although we assumed the maximum possible number of visitors, the resulting biogenic component is 22 % of the emissions we determined for Oktoberfest. Therefore, the emissions are not solely produced by the humans themselves, but by processes that are related to the number of visitors.
3.5 Emissions from sewage
Besides the direct biogenic human emissions, CH4 emissions from sewer systems are also possible sources. These emissions are a product of bacterial metabolism within waste water, whose emission strength depends in particular on the hydraulic retention time (Liu et al., 2015; Guisasola et al., 2008) which represents the time the waste water stays in the system. This time decreases with a higher amount of waste water, as the flow increases in such a case.
At Oktoberfest, the amount of waste water is very high as the 107 million L of water and the 8 million L of beer consumed have to flow into the sewer system at some time (München, 2018a). Therefore, the retention time in the sewer system underneath the Theresienwiese is quite low, which makes high CH4 emissions from sewage unlikely. Furthermore, the waste water consists primarily of dirty water and urine but not feces, which contain many carbon compounds necessary to produce CH4.
3.6 Fossil fuel CH4 emissions
The biogenic emissions can likely not fully explain the determined emissions of Oktoberfest. Therefore, fossil-fuel-related emissions, such as leakages and incomplete burning in the gas appliances, have to be considered as well. According to the weekday–weekend emission comparison (see Fig. 9) and the daily emission cycle (see Fig. 11 compared with Fig. 10), there is, in general, a visitor-dependent linear increase in CH4 emissions throughout the day that is superimposed with time-dependent events such as cooking, cleaning, or heating. These events can cause CH4 emissions, as about 40 % of the energy used at Oktoberfest is provided by natural gas used for cooking (79 %) and heating (21 %).
C2H6 is a tracer of thermogenic CH4 and therefore can be used to indicate a natural-gas-related source (Yacovitch et al., 2014; McKain et al., 2015). For that reason, we deployed a portable instrument designed to measure CH4 and C2H6. Due to the aforementioned safety reasons, the distance between the measurements and the closest point source (tent) was 50 to 250 m. Therefore, the CH4 concentration was relatively low (max. 100 ppb). According to the Munich municipal utilities, the C2H6∕CH4 ratio of natural gas used in Munich is about 3 % (München, 2018b), which results in an C2H6 concentration lower than 3 ppb, assuming that all of the measured CH4 is sourced from natural gas. Such a small concentration value is lower than the detection limit of the GasScouter (about 3 ppb with 10 s integration time), which is why we were not able to determine the C2H6∕CH4 ratio of the measured gas.
Nevertheless, it is possible to determine an upper bound for the loss rate of natural gas if one assumes that all the emissions are fossil fuel based. The natural gas consumption at Oktoberfest 2018 added up to 200 937 m3. Therefore, the total weight of the consumed CH4 at Oktoberfest yields
In this study, the CH4 flux of Oktoberfest has been determined to be 6.7 µg (m2 s)−1. If we assume that the emission is continuous throughout the day (about 11 h opening time per day) and homogeneous throughout the entire Oktoberfest premises, the total amount of CH4 lost to the atmosphere would be
The CH4 share of the natural gas in Munich is on average about 96 % (München, 2018b). If we assume all of the CH4 emissions are fossil fuel related, the maximum loss rate can be determined as
This loss rate of 1.1 % is smaller than the gas leaks reported in the literature, such as a 2.7 % loss rate for the urban region of Boston (McKain et al., 2015) or 2.3 % for the US oil and gas supply chain (Alvarez et al., 2018).
3.7 Comparison with existing CH4 emission estimates
To the best of our knowledge, there is no comparable CH4 study dealing with festivals. For a better illustration, we compared the emission flux of the Oktoberfest premises to the emission flux of Boston, which is known as a very leaky city. In the Boston study, McKain et al. (2015) quantified the regional averaged emission flux of CH4 there as (18.5±3.7) g (m2 a)−1 (95 % confidence interval), which corresponds to (0.6±0.1) µg (m2 s)−1 and is less than a tenth of the emissions that we determined for the Oktoberfest premises. Although it is difficult to compare the small and densely populated Oktoberfest premises with the entire city area of Boston, the comparison shows that the emission flux of Oktoberfest is significant.
Furthermore, we compared the Oktoberfest emission flux to the state-of-the-art emission inventory fluxes of that quarter of Munich. For that purpose, the annual emission fluxes of TNO-MACC III (2015) (Denier van der Gon et al., 2017; Kuenen et al., 2014), EDGAR v4.3.2 (2012) (Janssens-Maenhout et al., 2019), and IER (2008) (Pregger et al., 2007) are converted to the common unit of micrograms per square meter per second. In Table 2, the converted values are shown. Furthermore, the different inventories have different spatial resolutions. Therefore, the fluxes are averaged over areas that represent not only the Oktoberfest premises but also additional urban districts. Nevertheless, the Oktoberfest emissions are significantly higher than all three inventories considered. Therefore, festivals such as Oktoberfest can be significant CH4 sources. Although only present for a limited time each year, they should be included in the inventories.
This is the first study that deals with the methane emissions of a big festival. We investigated Oktoberfest as it is the world's largest folk festival and a methane source that had not yet been taken into account in the emission inventories.
Combining the in situ measurements with a Gaussian plume dispersion model, the average emission of Oktoberfest was determined to be (6.7±0.6) µg (m2 s)−1 (1σ standard deviation). A comparison between weekdays (4.6 µg (m2 s)−1) and weekend days (8.5 µg (m2 s)−1) shows that the emission strength at the weekend was almost twice as high compared to during the week. It demonstrates that a higher number of visitors results in higher emissions. However, the daily emission cycle has an oscillating behavior that cannot be explained by the number of visitors. These results suggest that CH4 emissions at Oktoberfest do not come solely from the human biogenic emissions, which were 5 times smaller than the emissions determined for the Oktoberfest according to our calculations. Fossil-fuel-related emissions, such as incomplete combustion or loss in the gas appliances, are more likely the major contributors to Oktoberfest emissions.
Due to safety reasons, we were not allowed to enter the festival premises with the instrument. Therefore, the distance from the measurement points to the suspected sources on the festival terrain was large, which resulted in low CH4 and C2H6 concentrations. The latter were even below the detection limit of the instrument. This limited the possibilities to attribute the emissions to specific sources. To improve this aspect, several additional approaches are possible for future studies. As we are not aware of a more sensitive portable C2H6 analyzer, discrete air sampling using sample bags within the tents for C2H6 is an option. Furthermore, the measurement of isotope ratios, such as δ13C and δD, is a useful option to improve the source attribution. For other festivals, researchers might be allowed to get closer to the sources.
The method introduced in this paper is comparatively straightforward; it can be applied widely to discover and quantify overlapping methane sources: groups of small cow barns, uncovered heaps in landfills, or wetlands made of groups of ponds and swamps, etc.
In summary, this study uses Oktoberfest as an exemplary event to show, for the first time, that large festivals can be significant CH4 emitters. Therefore, these events should be included in future emission inventories. Furthermore, our results provide the foundation to develop reduction policies for such events and a new pathway to mitigate fossil fuel CH4 emissions.
All raw data can be provided by the corresponding authors upon request.
JC, FD, and HM planned the campaign; JC, FD, HM, AF, and DW performed the measurements; JC, FD, AF, and DW analyzed the data; JC and FD wrote the manuscript draft; AF, MEGH, HDvdG, and TR reviewed and edited the manuscript.
The authors declare that they have no conflict of interest.
We thank Peter Swinkels and his colleagues from Picarro Inc. who made it possible for us to borrow the GasScouter; Jörg Ochs (Munich municipal utilities, SWM) for providing us with helpful information about the Munich gas distribution system; Hanns-Erik Endres, Manfred Engl, and colleagues from Fraunhofer EMFT, Martin Christ (LMU), and the colleagues from Klenze Gymnasium Munich for providing access to measurement sites; Markus Garhammer, Matthias Wiegner, and Mark Wenig (LMU) for providing us wind and boundary layer height data; Anna-Leah Nickl and Mariano Mertens (DLR) for running high-resolution wind forecasts; Konrad Koch (TUM) for providing us detailed information about the Munich sewer system and helpful discussions; Rachel Chang and Frank Keppler for fruitful discussions; our students Ankit Shekhar, Xiao Bi, and Homa Ghasemifard for helping with the measurements; the reviewers for their valuable comments; and Stephen Starck, Ankit Shekhar, and Rita von Grafenstein for proofreading a previous version of the paper. Jia Chen and Florian Dietrich are supported by Technische Universität München – Institute for Advanced Study, funded by the German Excellence Initiative and the European Union Seventh Framework Programme under grant agreement no. 291763.
This work was supported by the German Research Foundation (DFG) and the Technical University of Munich (TUM) in the framework of the Open Access Publishing Program.
This paper was edited by Rolf Müller and reviewed by Euan Nisbet and one anonymous referee.
Allen, M. R., Shine, K. P., Fuglestvedt, J. S., Millar, R. J., Cain, M., Frame, D. J., and Macey, A. H.: A solution to the misrepresentations of CO2-equivalent emissions of short-lived climate pollutants under ambitious mitigation, NPJ Clim. Atmos. Sci., 1, 16, https://doi.org/10.1038/s41612-018-0026-8, 2018. a
Alvarez, R. A., Zavala-Araiza, D., Lyon, D. R., Allen, D. T., Barkley, Z. R., Brandt, A. R., Davis, K. J., Herndon, S. C., Jacob, D. J., Karion, A., Kort, E. A., Lamb, B. K., Lauvaux, T., Maasakkers, J. D., Marchese, A. J., Omara, M., Pacala, S. W., Peischl, J., Robinson, A. L., Shepson, P. B., Sweeney, C., Townsend-Small, A., Wofsy, S. C., and Hamburg, S. P.: Assessment of methane emissions from the U.S. oil and gas supply chain, Science, 361, 186–188, https://doi.org/10.1126/science.aar7204, 2018. a
Atherton, E., Risk, D., Fougère, C., Lavoie, M., Marshall, A., Werring, J., Williams, J. P., and Minions, C.: Mobile measurement of methane emissions from natural gas developments in northeastern British Columbia, Canada, Atmos. Chem. Phys., 17, 12405–12420, https://doi.org/10.5194/acp-17-12405-2017, 2017. a, b
Bovensmann, H., Buchwitz, M., Burrows, J. P., Reuter, M., Krings, T., Gerilowski, K., Schneising, O., Heymann, J., Tretner, A., and Erzinger, J.: A remote sensing technique for global monitoring of power plant CO2 emissions from space and related applications, Atmos. Meas. Tech., 3, 781–811, https://doi.org/10.5194/amt-3-781-2010, 2010. a
Briggs, G. A.: Diffusion estimation for small emissions. Preliminary report, Tech. Rep. TID-28289, National Oceanic and Atmospheric Administration, Oak Ridge, Tenn. (USA), Atmospheric Turbulence and Diffusion Lab., https://doi.org/10.2172/5118833, 1973. a, b, c
Chen, J., Viatte, C., Hedelius, J. K., Jones, T., Franklin, J. E., Parker, H., Gottlieb, E. W., Wennberg, P. O., Dubey, M. K., and Wofsy, S. C.: Differential column measurements using compact solar-tracking spectrometers, Atmos. Chem. Phys., 16, 8479–8498, https://doi.org/10.5194/acp-16-8479-2016, 2016. a
Chen, J., Dietrich, F., Franklin, J., Jones, T., Butz, A., Luther, A., Kleinschek, R., Hase, F., Wenig, M., Ye, S., Nouri, A., Frey, M., Knote, C., Alberti, C., and Wofsy, S.: Mesoscale Column Network for Assessing GHG and NOx Emissions in Munich, in: Geophysical Research Abstracts, 20, EGU2018–10192–2, 2018. a
Denier van der Gon, H. A. C., Kuenen, J. J. P., Janssens-Maenhout, G., Döring, U., Jonkers, S., and Visschedijk, A.: TNO_CAMS high resolution European emission inventory 2000–2014 for anthropogenic CO2 and future years following two different pathways, Earth Syst. Sci. Data Discuss., https://doi.org/10.5194/essd-2017-124, in review, 2017. a
Etminan, M., Myhre, G., Highwood, E. J., and Shine, K. P.: Radiative forcing of carbon dioxide, methane, and nitrous oxide: A significant revision of the methane radiative forcing, Geophys. Res. Lett., 43, 12614–12623, https://doi.org/10.1002/2016GL071930, 2016. a, b
Gifford, F. A.: Turbulent diffusion-typing schemes: a review, Nucl. Saf., 17, 68–86, 1976. a, b
Guisasola, A., de Haas, D., Keller, J., and Yuan, Z.: Methane formation in sewer systems, Water Res., 42, 1421–1430, https://doi.org/10.1016/j.watres.2007.10.014, 2008. a
Hanna, S. R., Briggs, G. A., and Hosker Jr., R. P.: Handbook on atmospheric diffusion, Tech. Rep. DOE/TIC-11223, National Oceanic and Atmospheric Administration, Oak Ridge, TN (USA), Atmospheric Turbulence and Diffusion Lab., https://doi.org/10.2172/5591108, 1982. a, b, c
Haugen, D. A.: Project Prairie Grass: A Field Program in Diffusion, Geophysical Research Papers, III, Report AFCRC-TR-58-235, Air Force Cambridge Research Center, 1959. a
Hausmann, P., Sussmann, R., and Smale, D.: Contribution of oil and natural gas production to renewed increase in atmospheric methane (2007–2014): top–down estimate from ethane and methane column observations, Atmos. Chem. Phys., 16, 3227–3244, https://doi.org/10.5194/acp-16-3227-2016, 2016. a
Huang, K., Zhuang, G., Lin, Y., Wang, Q., Fu, J. S., Zhang, R., Li, J., Deng, C., and Fu, Q.: Impact of anthropogenic emission on air quality over a megacity – revealed from an intensive atmospheric campaign during the Chinese Spring Festival, Atmos. Chem. Phys., 12, 11631–11645, https://doi.org/10.5194/acp-12-11631-2012, 2012. a
IPCC: Climate Change 2013: The Physical Science Basis. Contribution of Working Group I to the Fifth Assessment Report of the Intergovernmental Panel on Climate Change, edited by: Stocker, T. F., Qin, D., Plattner, G.-K., Tignor, M., Allen, S. K. Boschung,, J., Nauels, A., Xia, Y., Bex, V., and Midgley, P. M., Cambridge University Press, Cambridge, United Kingdom and New York, NY, USA, 1535 pp., doi:10.1017/CBO9781107415324, 2013. a
Janssens-Maenhout, G., Crippa, M., Guizzardi, D., Muntean, M., Schaaf, E., Dentener, F., Bergamaschi, P., Pagliari, V., Olivier, J. G. J., Peters, J. A. H. W., van Aardenne, J. A., Monni, S., Doering, U., Petrescu, A. M. R., Solazzo, E., and Oreggioni, G. D.: EDGAR v4.3.2 Global Atlas of the three major greenhouse gas emissions for the period 1970–2012, Earth Syst. Sci. Data, 11, 959–1002, https://doi.org/10.5194/essd-11-959-2019, 2019. a
Kaiser, J. and Schafer, R.: On the use of the I0-sinh window for spectrum analysis, IEEE Transactions on Acoustics, Speech, and Signal Processing, 28, 105–107, https://doi.org/10.1109/TASSP.1980.1163349, 1980. a
Keppler, F., Schiller, A., Ehehalt, R., Greule, M., Hartmann, J., and Polag, D.: Stable isotope and high precision concentration measurements confirm that all humans produce and exhale methane, J. Breath Res., 10, 016003, https://doi.org/10.1088/1752-7155/10/1/016003, 2016. a
Kiemle, C., Ehret, G., Amediek, A., Fix, A., Quatrevalet, M., and Wirth, M.: Potential of Spaceborne Lidar Measurements of Carbon Dioxide and Methane Emissions from Strong Point Sources, Remote Sens., 9, 1137, https://doi.org/10.3390/rs9111137, 2017. a
Kirschke, S., Bousquet, P., Ciais, P., Saunois, M., Canadell, J. G., Dlugokencky, E. J., Bergamaschi, P., Bergmann, D., Blake, D. R., Bruhwiler, L., Cameron-Smith, P., Castaldi, S., Chevallier, F., Feng, L., Fraser, A., Heimann, M., Hodson, E. L., Houweling, S., Josse, B., Fraser, P. J., Krummel, P. B., Lamarque, J.-F., Langenfelds, R. L., Le Quéré, C., Naik, V., O'Doherty, S., Palmer, P. I., Pison, I., Plummer, D., Poulter, B., Prinn, R. G., Rigby, M., Ringeval, B., Santini, M., Schmidt, M., Shindell, D. T., Simpson, I. J., Spahni, R., Steele, L. P., Strode, S. A., Sudo, K., Szopa, S., van der Werf, G. R., Voulgarakis, A., van Weele, M., Weiss, R. F., Williams, J. E., and Zeng, G.: Three decades of global methane sources and sinks, Nat. Geosci., 6, 813–823, https://doi.org/10.1038/ngeo1955, 2013. a
Kuenen, J. J. P., Visschedijk, A. J. H., Jozwicka, M., and Denier van der Gon, H. A. C.: TNO-MACC_II emission inventory; a multi-year (2003–2009) consistent high-resolution European emission inventory for air quality modelling, Atmos. Chem. Phys., 14, 10963–10976, https://doi.org/10.5194/acp-14-10963-2014, 2014. a
Kuo, C.-Y., Lee, H.-S., and Lai, J.-H.: Emission of polycyclic aromatic hydrocarbons and lead during Chinese mid-autumn festival, Sci. Total Environ., 366, 233–241, https://doi.org/10.1016/j.scitotenv.2005.08.006, 2006. a
Lamb, B. K., Cambaliza, M. O. L., Davis, K. J., Edburg, S. L., Ferrara, T. W., Floerchinger, C., Heimburger, A. M. F., Herndon, S., Lauvaux, T., Lavoie, T., Lyon, D. R., Miles, N., Prasad, K. R., Richardson, S., Roscioli, J. R., Salmon, O. E., Shepson, P. B., Stirm, B. H., and Whetstone, J.: Direct and Indirect Measurements and Modeling of Methane Emissions in Indianapolis, Indiana, Environ. Sci. Technol., 50, 8910–8917, https://doi.org/10.1021/acs.est.6b01198, 2016. a
Liu, Y., Ni, B.-J., Sharma, K. R., and Yuan, Z.: Methane emission from sewers, Sci. Total Environ., 524–525, 40–51, https://doi.org/10.1016/j.scitotenv.2015.04.029, 2015. a
Luther, A., Kleinschek, R., Scheidweiler, L., Defratyka, S., Stanisavljevic, M., Forstmaier, A., Dandocsi, A., Wolff, S., Dubravica, D., Wildmann, N., Kostinek, J., Jöckel, P., Nickl, A.-L., Klausner, T., Hase, F., Frey, M., Chen, J., Dietrich, F., Nȩcki, J., Swolkień, J., Fix, A., Roiger, A., and Butz, A.: Quantifying CH4 emissions from hard coal mines using mobile sun-viewing Fourier transform spectrometry, Atmos. Meas. Tech., 12, 5217–5230, https://doi.org/10.5194/amt-12-5217-2019, 2019. a
McKain, K., Down, A., Raciti, S. M., Budney, J., Hutyra, L. R., Floerchinger, C., Herndon, S. C., Nehrkorn, T., Zahniser, M. S., Jackson, R. B., Phillips, N., and Wofsy, S. C.: Methane emissions from natural gas infrastructure and use in the urban region of Boston, Massachusetts, P. Natl. Acad. Sci. USA, 112, 1941–1946, 2015. a, b, c, d, e
muenchen.de: Oktoberfest-Barometer: Die beste Zeit für den Wiesnbesuch, available at: https://www.muenchen.de/veranstaltungen/oktoberfest/besucher-service/wiesnbarometer.html (last access: 9 July 2019), 2018. a
München: Oktoberfest 2018 Schlussbericht, available at: https://www.ris-muenchen.de/RII/RII/DOK/SITZUNGSVORLAGE/5440803.pdf (last access: 13 March 2020), 2018a. a, b
München: Erdgasbeschaffenheit: Jahresmittel für 2018, available at: https://www.swm-infrastruktur-region.de/dam/swm-infrastruktur-region/dokumente/erdgas/netzstrukturdaten/erdgasbeschaffenheit-jahresmittel-2018.pdf (last access: 13 March 2020), 2018b. a, b
Myhre, G., Samset, B. H., Schulz, M., Balkanski, Y., Bauer, S., Berntsen, T. K., Bian, H., Bellouin, N., Chin, M., Diehl, T., Easter, R. C., Feichter, J., Ghan, S. J., Hauglustaine, D., Iversen, T., Kinne, S., Kirkevåg, A., Lamarque, J.-F., Lin, G., Liu, X., Lund, M. T., Luo, G., Ma, X., van Noije, T., Penner, J. E., Rasch, P. J., Ruiz, A., Seland, Ø., Skeie, R. B., Stier, P., Takemura, T., Tsigaridis, K., Wang, P., Wang, Z., Xu, L., Yu, H., Yu, F., Yoon, J.-H., Zhang, K., Zhang, H., and Zhou, C.: Radiative forcing of the direct aerosol effect from AeroCom Phase II simulations, Atmos. Chem. Phys., 13, 1853–1877, https://doi.org/10.5194/acp-13-1853-2013, 2013. a
Nassar, R., Hill, T. G., McLinden, C. A., Wunch, D., Jones, D. B. A., and Crisp, D.: Quantifying CO2 Emissions From Individual Power Plants From Space, Geophys. Res. Lett., 44, 10045–10053, https://doi.org/10.1002/2017GL074702, 2017. a
Nisbet, E. G., Dlugokencky, E. J., and Bousquet, P.: Methane on the Rise–Again, Science, 343, 493–495, https://doi.org/10.1126/science.1247828, 2014. a, b
Nishanth, T., Praseed, K. M., Rathnakaran, K., Satheesh Kumar, M. K., Ravi Krishna, R., and Valsaraj, K. T.: Atmospheric pollution in a semi-urban, coastal region in India following festival seasons, Atmos. Environ., 47, 295–306, https://doi.org/10.1016/j.atmosenv.2011.10.062, 2012. a
O'Keefe, A. and Deacon, D. A. G.: Cavity ring‐down optical spectrometer for absorption measurements using pulsed laser sources, Rev. Sci. Instr., 59, 2544–2551, https://doi.org/10.1063/1.1139895, 1988. a
Pasquill, F.: The estimation of the dispersion of windborne material, Meteorol. Mag., 90, 33–49, 1961. a
Phillips, N. G., Ackley, R., Crosson, E. R., Down, A., Hutyra, L. R., Brondfield, M., Karr, J. D., Zhao, K., and Jackson, R. B.: Mapping urban pipeline leaks: Methane leaks across Boston, Environ. Pollut., 173, 1–4, https://doi.org/10.1016/j.envpol.2012.11.003, 2013. a
Picarro: Datasheet GasScouter G4302 CH4, C2H6 and H2O Analyzer, available at: https://www.picarro.com/support/library/documents/gasscoutertm_g4302_analyzer_data_sheet (last access: 13 March 2020), 2017. a
Plant, G., Kort, E. A., Floerchinger, C., Gvakharia, A., Vimont, I., and Sweeney, C.: Large Fugitive Methane Emissions From Urban Centers Along the U.S. East Coast, Geophys. Res. Lett., 46, 8500–8507, https://doi.org/10.1029/2019GL082635, 2019. a
Polag, D. and Keppler, F.: Global methane emissions from the human body: Past, present and future, Atmos. Environ., 214, 116823, https://doi.org/10.1016/j.atmosenv.2019.116823, 2019. a, b
Pregger, T., Scholz, Y., and Friedrich, R.: Documentation of the Anthropogenic GHG Emission Data for Europe Provided in the Frame of CarboEurope GHG and CarboEurope IP, available at: http://carboeurope.org/ceip/products/files/Pregger_IER_Final_Report_Feb2007.pdf (last access: 13 March 2020), 2007. a
Roscioli, J. R., Yacovitch, T. I., Floerchinger, C., Mitchell, A. L., Tkacik, D. S., Subramanian, R., Martinez, D. M., Vaughn, T. L., Williams, L., Zimmerle, D., Robinson, A. L., Herndon, S. C., and Marchese, A. J.: Measurements of methane emissions from natural gas gathering facilities and processing plants: measurement methods, Atmos. Meas. Tech., 8, 2017–2035, https://doi.org/10.5194/amt-8-2017-2015, 2015. a
Saunois, M., Jackson, R. B., Bousquet, P., Poulter, B., and Canadell, J. G.: The growing role of methane in anthropogenic climate change, Environ. Res. Lett., 11, 120207, https://doi.org/10.1088/1748-9326/11/12/120207, 2016. a
Schwietzke, S., Griffin, W. M., Matthews, H. S., and Bruhwiler, L. M. P.: Natural Gas Fugitive Emissions Rates Constrained by Global Atmospheric Methane and Ethane, Environ. Sci. Technol., 48, 7714–7722, https://doi.org/10.1021/es501204c, 2014. a
Schwietzke, S., Sherwood, O. A., Bruhwiler, L. M. P., Miller, J. B., Etiope, G., Dlugokencky, E. J., Michel, S. E., Arling, V. A., Vaughn, B. H., White, J. W. C., and Tans, P. P.: Upward revision of global fossil fuel methane emissions based on isotope database, Nature, 538, 88–91, https://doi.org/10.1038/nature19797, 2016. a
Shi, G.-L., Liu, G.-R., Tian, Y.-Z., Zhou, X.-Y., Peng, X., and Feng, Y.-C.: Chemical characteristic and toxicity assessment of particle associated PAHs for the short-term anthropogenic activity event: During the Chinese New Year's Festival in 2013, Sci. Total Environ., 482–483, 8–14, https://doi.org/10.1016/j.scitotenv.2014.02.107, 2014. a
Smith, M. E.: Recommended Guide for the Prediction of the Dispersion of Airborne Effluents, 1st edition, American Society of Mechanical Engineers, New York, 1968. a
Sutton, O. G.: A Theory of Eddy Diffusion in the Atmosphere, P. Roy. Soc. Lond. A, 135, 143–165, https://doi.org/10.1098/rspa.1932.0025, 1932. a
Toja-Silva, F., Chen, J., Hachinger, S., and Hase, F.: CFD simulation of CO2 dispersion from urban thermal power plant: Analysis of turbulent Schmidt number and comparison with Gaussian plume model and measurements, J. Wind Eng. Ind. Aerod., 169, 177–193, https://doi.org/10.1016/j.jweia.2017.07.015, 2017. a
von Fischer, J. C., Cooley, D., Chamberlain, S., Gaylord, A., Griebenow, C. J., Hamburg, S. P., Salo, J., Schumacher, R., Theobald, D., and Ham, J.: Rapid, Vehicle-Based Identification of Location and Magnitude of Urban Natural Gas Pipeline Leaks, Environ. Sci. Technol., 51, 4091–4099, https://doi.org/10.1021/acs.est.6b06095, 2017. a
Weller, Z. D., Roscioli, J. R., Daube, W. C., Lamb, B. K., Ferrara, T. W., Brewer, P. E., and von Fischer, J. C.: Vehicle-Based Methane Surveys for Finding Natural Gas Leaks and Estimating Their Size: Validation and Uncertainty, Environ. Sci. Technol., 52, 11922–11930, https://doi.org/10.1021/acs.est.8b03135, 2018. a
Worden, J. R., Bloom, A. A., Pandey, S., Jiang, Z., Worden, H. M., Walker, T. W., Houweling, S., and Röckmann, T.: Reduced biomass burning emissions reconcile conflicting estimates of the post-2006 atmospheric methane budget, Nat. Commun., 8, 2227, https://doi.org/10.1038/s41467-017-02246-0, 2017. a
Wunch, D., Toon, G. C., Hedelius, J. K., Vizenor, N., Roehl, C. M., Saad, K. M., Blavier, J.-F. L., Blake, D. R., and Wennberg, P. O.: Quantifying the loss of processed natural gas within California's South Coast Air Basin using long-term measurements of ethane and methane, Atmos. Chem. Phys., 16, 14091–14105, https://doi.org/10.5194/acp-16-14091-2016, 2016. a
Yacovitch, T. I., Herndon, S. C., Roscioli, J. R., Floerchinger, C., McGovern, R. M., Agnese, M., Pétron, G., Kofler, J., Sweeney, C., Karion, A., Conley, S. A., Kort, E. A., Nähle, L., Fischer, M., Hildebrandt, L., Koeth, J., McManus, J. B., Nelson, D. D., Zahniser, M. S., and Kolb, C. E.: Demonstration of an ethane spectrometer for methane source identification, Environ. Sci. Technol., 48, 8028–8034, https://doi.org/10.1021/es501475q, 2014. a
Yacovitch, T. I., Herndon, S. C., Pétron, G., Kofler, J., Lyon, D., Zahniser, M. S., and Kolb, C. E.: Mobile Laboratory Observations of Methane Emissions in the Barnett Shale Region, Environ. Sci. Technol., 49, 7889–7895, https://doi.org/10.1021/es506352j, 2015. a, b
Yacovitch, T. I., Neininger, B., Herndon, S. C., Denier van der Gon, H., Jonkers, S., Hulskotte, J., Roscioli, J. R., and Zavala-Araiza, D.: Methane emissions in the Netherlands: The Groningen field, Elem. Sci. Anth., 6, 57, https://doi.org/10.1525/elementa.308, 2018. a


