the Creative Commons Attribution 4.0 License.
the Creative Commons Attribution 4.0 License.
Modeling stratospheric intrusion and trans-Pacific transport on tropospheric ozone using hemispheric CMAQ during April 2010 – Part 1: Model evaluation and air mass characterization for stratosphere–troposphere transport
Syuichi Itahashi
Rohit Mathur
Christian Hogrefe
Yang Zhang
Stratospheric intrusion and trans-Pacific transport have been recognized as a potential source of tropospheric ozone over the US. The state-of-the-science Community Multiscale Air Quality (CMAQ) modeling system has recently been extended for hemispheric-scale modeling applications (referred to as H-CMAQ). In this study, H-CMAQ is applied to study the stratospheric intrusion and trans-Pacific transport during April 2010. The results will be presented in two companion papers. In this Part 1 paper, model evaluation for tropospheric ozone (O3) is presented. Observations at the surface, by ozonesondes and airplane, and by satellite across the Northern Hemisphere are used to evaluate the model performance for O3. H-CMAQ is able to capture surface and boundary layer (defined as surface to 750 hPa) O3 with a normalized mean bias (NMB) of −10 %; however, a systematic underestimation with an NMB up to −30 % is found in the free troposphere (defined as 750–250 hPa). In addition, a new air mass characterization method is developed to distinguish influences of stratosphere–troposphere transport (STT) from the effects of photochemistry on O3 levels. This method is developed based on the ratio of O3 and an inert tracer indicating stratospheric O3 to examine the importance of photochemistry, and sequential intrusion from upper layer. During April 2010, on a monthly average basis, the relationship between surface O3 mixing ratios and estimated stratospheric air masses in the troposphere show a slight negative slope, indicating that high surface O3 values are primarily affected by other factors (i.e., emissions), whereas this relationship shows a slight positive slope at elevated sites, indicating that STT has a possible impact at elevated sites. STT shows large day-to-day variations, and STT impacts can either originate from the same air mass over the entire US with an eastward movement found during early April, or stem from different air masses at different locations indicated during late April. Based on this newly established air mass characterization technique, this study can contribute to understanding the role of STT and also the implied importance of emissions leading to high surface O3. Further research focused on emissions is discussed in a subsequent paper (Part 2).
- Article
(10991 KB) - Full-text XML
- Companion paper
-
Supplement
(20622 KB) - BibTeX
- EndNote
Tropospheric ozone (O3) is a secondary air pollutant produced by a chain of reactions involving photochemical oxidation of volatile organic compounds (VOCs) in the presence of nitrogen oxides (NOx) (Haagen-Smit and Fox, 1954). Ozone plays a key role in tropospheric chemistry by controlling the oxidizing capacity through the production of hydroxyl (OH) radicals and is an important greenhouse gas throughout the troposphere (Logan, 1985). Ground-level O3 poses significant risks to human health, and therefore many countries regulate it as a criterion pollutant with an ambient air quality standard. In the US, the National Ambient Air Quality Standard (NAAQS) for O3 is based on the annual fourth highest maximum daily 8 h concentration (MD8O3) averaged over 3 years, and its threshold values have been decreasing from 80 ppbv in 1997 to 75 ppbv in 2008, and 70 ppbv in 2015 (U.S. EPA, 2018). Long-term trends of rural O3 during 1990–2010 revealed significant O3 decreases in the eastern US during spring and summer, whereas no significant O3 decrease was found in the western US during spring (Cooper et al., 2012). Analysis of trends in surface O3 levels between 1998 and 2013 showed that the highest O3 concentration in the US has been reduced in response to substantial decline of precursors (Simon et al., 2015). It was also shown that the O3 concentration on low-O3 days had increased and led to the narrowing of the O3 concentration range across the US.
From the viewpoint of global air quality changes, the dramatic variation of anthropogenic emissions in east Asia (Itahashi et al., 2013, 2014, 2015) may impact atmospheric composition at not only the local and regional scales but also the global scale. By combining trajectory analysis with detailed chemical and meteorological data, it was suggested that the emissions were lifted into the free troposphere over Asia and then transported to North America in about 5–8 d (Jaffe et al., 1999). Trans-Pacific transport has been studied over the past decade because of its potential impact on rising background O3 concentrations (Cooper et al., 2010). Asian contributions to surface O3 levels in the US pose an additional challenge to meeting more stringent NAAQS for O3 (Fiore et al., 2002). A typical case of trans-Pacific transport occurred during the so-called “perfect dust storm” during April 2001, transporting Asian dust to North America (Huebert et al., 2003). From an air pollutant perspective, it was reported that the impact of Asian emissions increased background concentration of O3 by 1 ppbv (2.5 %) on a monthly average basis and up to 2.5 ppbv on a daily average basis over the western US in April 2001 (Wang et al., 2009). Background O3 levels entering western North America in spring have increased by approximately 10 ppbv between 1984 and 2002 based on a compilation of observations over the west coast of the US, and the possible cause for this increase was thought to be Asian emission trends (Jaffe et al., 2003). Asian air pollution can enhance surface O3 mixing ratios by 5–7 ppbv over western North America in April–May 2006, and the doubled Asian anthropogenic emissions increase during 2000–2006 was estimated to raise the impact by 1–2 ppbv (Zhang et al., 2008). The global model simulation assuming the tripling of Asian anthropogenic emissions from 1985 to 2010 indicated an increase in O3 mixing ratios by 2–6 ppbv in the western US and by 1–3 ppbv in the eastern US on a monthly mean basis, with the maximum effect occurring during April–June; this increase was suggested to more than offset the benefits of 25 % domestic reduction in the western US (Jacob et al., 1999). Based on the Emission Database for Global Atmospheric Research (EDGAR) version 4.3.1, anthropogenic emissions of NOx and VOCs in China are estimated to have increased by 3.2 and 2.1 times during 1985–2010, respectively (Crippa et al., 2016), which is generally consistent with the assumption by Jacob et al. (1999).
The occurrence of trans-Pacific transport can be inferred from variations in the jet stream related to La Niña and El Niño. The springtime Asian outflow may be enhanced following an El Niño winter due to the eastward extension of the atmospheric circulation over the Pacific North American sector and the southward shift of the subtropical jet stream (Koumoutsaris et al., 2008; Lin et al., 2015). According to the NOAA Climate Prediction Center (CPC), the 2009–2010 winter was influenced by strong El Niño conditions (NOAA and CPC, 2018). Because of the favorable conditions for trans-Pacific transport, it was reported that Asian dust reached North America on at least five occasions during April 2010 (Uno et al., 2011). During May–June 2010, the Asian enhancement of MD8O3 in the western US was estimated to reach 8–15 ppbv in high-elevation regions during strong trans-Pacific transport events (Lin et al., 2012a).
Another process affecting tropospheric O3 is stratosphere–troposphere transport (STT), which is known to be a significant contributor to the tropospheric O3 budget (Lelieveld and Dentener, 2000). The tightening of the O3 NAAQS and a continuous decrease of anthropogenic emissions have led to an increased focus on STT. On one hand, stratospheric intrusion was found to contribute less than 20 ppbv of O3 during March–October 2001 over the entire US (Fiore et al., 2003). On the other hand, a total of 13 events were identified during April–June 2010 when stratospheric intrusion impacts reached 20–40 ppbv while accounting for 50 %–60 % of total O3 at 15 high-elevation (> 1.4 km above sea level; a.s.l.) sites in the western US (Lin et al., 2012b). From the perspective of interannual variability, springtime stratospheric intrusions may be enhanced following a La Niña winter due to a meandering of the jet stream, and a large variability in terms of magnitude and frequency has been shown from 1990 to 2012 (Lin et al., 2015). The fraction of O3 in the troposphere that originates from the stratosphere is still uncertain due to its strong dependence on season and location, which affect tropopause heights, and is therefore still an area of active research (Mathur et al., 2017).
Table 1 summarizes the studies that provided the motivation for evaluating the impacts of both precursor emissions and STT on tropospheric O3. April 2010 is selected as the study period because enhancement of trans-Pacific transport is expected during the 2009–2010 El Niño winter. Along with the gradual reduction of precursor emissions of NOx and VOCs in the US, a gradual decrease of MD8O3 mixing ratios can be expected and showed a decreasing trend by 0.4 % yr−1; however, mean MD8O3 mixing ratios in 2010 showed a local maximum, and the number of NAAQS threshold exceedances was larger than usual, as shown in Fig. S1 in the Supplement. The variation in monthly mean and percentile distribution of observed MD8O3 during 2010 are shown in Fig. S2. Although high MD8O3 concentration for 95th percentiles and the number of NAAQS exceedances were found during summertime, it is also apparent that mean MD8O3 during April 2010 was higher than that during any other month. The 5th and 25th percentiles of MD8O3 were also noted to be comparatively high during April 2010, indicating widespread enhancement of low-level O3, further suggesting the possible impacts of trans-Pacific transport on O3 levels across the US during this month. This period has already been the subject of other studies (e.g., Uno et al., 2011; Lin et al, 2012a); however, the methods used in this study to investigate the impacts of trans-Pacific transport differ from previous studies. The objective of this study is to better understand the relative contributions of precursor emissions from east Asia and the US because the trans-Pacific transport has been recognized as an important factor. Previous studies primarily focused on Asian impacts on the western US, while this study investigates impacts across the entire US. In addition, some stratospheric intrusion events have been reported during spring 2010 (Lin et al., 2012b); therefore, this period is suitable to examine not only trans-Pacific transport but also stratospheric intrusion, and both processes may contribute to the observed high-O3 episodes in the US. Examination of the impacts of both processes will shed light on the atmospheric pathways underlying such high-O3 episodes, thus improving our understanding of their relative importance in leading to these high-O3 episodes. The results of this work will be presented in two parts. Part 1 of the paper focuses on characterizing the influence of stratosphere–troposphere transport on O3 distribution in the lower to middle troposphere. A sequential paper (Part 2) focuses on the contributions of emissions leading to higher O3 mixing ratios through trans-Pacific transport. In this Part 1 paper, we present the model evaluation and introduce a new method to identify and characterize periods during which lower tropospheric and potentially ground-level O3 may be influenced by stratospheric intrusions. This paper is organized as follows. In Sect. 2, the modeling system and simulation setup are described; details on the surface, ozonesonde, airplane, and satellite observations used to evaluate the model performance are presented; and evaluation protocols are defined. In Sect. 3, the analysis of model results and comparisons with observations are documented, and the newly developed air mass characterization method is introduced and applied to investigate stratospheric intrusions. Finally, the conclusion section includes limitations of this work, future perspectives, and a brief introduction to the companion paper (Part 2).
Table 1Literature review of previous studies on estimated impacts of (upper) emissions from Asia and (lower) stratospheric intrusion.
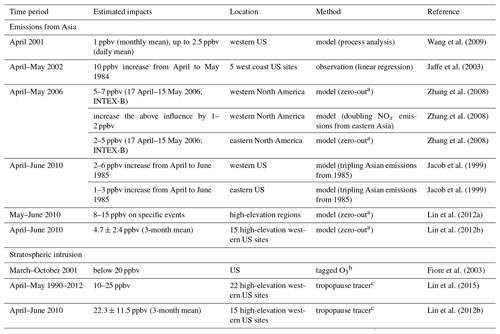
a This estimates the impact from the difference between the standard simulation and a simulation with eastern Asian anthropogenic sources shut off. b This tagged method divides simulated O3 into individual O3 tracer to track O3 produced in different region. c This tracer method accounts for STT contribution to O3 using e90 tracer, which differentiates tropospheric air mass based on the globally uniform surface source and 90 d folding lifetime; both have been spun up for 3 years.
2.1 Modeling system and simulation setup
The model used in this work is the Community Multiscale Air Quality (CMAQ) version 5.2 extended for hemispheric applications (H-CMAQ) (Mathur et al., 2017). To investigate the impact of emissions from east Asia, H-CMAQ is configured to cover the entire Northern Hemisphere, utilizing a horizontal discretization of 187×187 grid points with a grid spacing of 108 km. Information on longitude and latitude is presented in Fig. S3. While the use of finer horizontal grid spacing can better resolve the STT processes, it will substantially increase computational demands. Cristofanelli et al. (2003) analyzed STT by combining analysis of data from a measurement network and predictions from a total of seven model simulations over Europe, and reported the advantages of the Lagrangian models in capturing the STT. In terms of the Eulerian model, another study over Europe investigated the cross-tropopause transport in terms of resolution and diffusion coefficient using horizontal resolutions of , , and , and showed that the simulation with the resolution has difficulty to capture the tracer transport across the tropopause (Gray, 2003). Based on these findings and the model evaluation results (see Sect. 3.1), in this work, using a grid resolution of 108 km provides a good compromise between numerical accuracy and computational constraints. The terrain-following vertical coordinate utilizes 44 layers of variable thickness to resolve the model vertical extent between the surface and 50 hPa based on the extension of the previous 35-layer system (Xing et al., 2015; Mathur et al., 2017). The revised layer structure using 44 layers with significantly finer resolution above the boundary layer (BL) better represents long-range transport in the free troposphere (FT) as well as STT processes, and influences from cloud mixing on both the subgrid and resolved scales. As indicated in Mathur et al. (2017), the 44-layer configuration employed in the H-CMAQ configuration helps to better capture dynamics in the vicinity of the tropopause and reduce excessive diffusion relative to coarser vertical resolution configurations. The emission inputs are based on the Hemispheric Transport of Air Pollution version 2 (HTAP2) modeling experiments, and a detailed description can be found in previous studies (Janssens-Maenhout et al., 2015; Pouliot et al., 2015; Galmarini et al., 2017; Hogrefe et al., 2018). The lightning emissions are prescribed using climatological averages as estimated in the Global Emission Inventory Activity (GEIA) dataset (Price et al., 1997). For gas-phase chemistry, cb05e51 is used (Appel et al., 2017). This gas-phase mechanism includes the condensed halogen chemistry that leads to O3 loss in marine environments (Sarwar et al., 2015). For aerosol chemistry, aero6 with nonvolatile primary organic aerosol (POA) (Simon and Bhave, 2012) is adopted. The boundary conditions of H-CMAQ are taken from the clean tropospheric background values with updates to the physical and chemical sinks for organic nitrate species (Mathur et al., 2017).
Potential vorticity (PV) has been shown to be a robust indicator of air mass exchange between the stratosphere and the troposphere. The value of PV itself generally increases with altitude, and previous studies suggested that a value of 2 PVU (1 PVU m2 K kg−1 s−1) is an indicator of stratospheric air (Hoskins et al., 1985; Wernli and Bourqui, 2002; Itoh and Narazaki, 2016). Through this study, the tropopause is diagnosed by 2 PVU. The tropopause altitudes can be also diagnosed by the traditional approach based on the lapse rate (i.e., thermal tropopause) defined by World Meteorological Organization (WMO) (WMO, 1992), and the comparison with that diagnosed using PV (i.e., dynamical tropopause) has been reported (Hoering et al., 1991). As shown in Fig. S4, estimated tropopause altitudes averaged over April 2010 using PV in this work and the traditional approach of WMO are overall similar, with below 10 km over high-latitude region and above 16 km over low-latitude region. PV shows a strong positive correlation with O3 (Danielsen, 1968), and modeling studies have used this correlation to develop scaling factors that specify O3 in the modeled upper troposphere/lower stratosphere (UTLS) based on estimated PV. The reported O3∕PV ratios exhibited a wide range from 20 to 100 ppbv∕PVU depending on location, altitude, and season (e.g., Ebel et al, 1991; Carmichael et al, 1998; McCaffery et al, 2004). To account for the seasonal, latitudinal, and altitude dependencies in the O3∕PV relationship, a dynamic O3∕PV function was developed to consider latitude, altitude, and time based on 21-year ozonesonde records from the World Ozone and Ultraviolet Radiation Data Centre (WOUDC) and corresponding PV values from WRF-CMAQ simulations across the Northern Hemisphere from 1990 to 2010 and is used in H-CMAQ (Xing et al., 2016). This parameterization of O3∕PV is constructed at three topmost vertical levels of 58, 76, and 95 hPa fitted as a fifth-order polynomial function, and is applicable in the range between 50 and 100 hPa. Thus, model O3 values in layers between 100 and 50 hPa are scaled to space- and time-varying PV fields. The model dynamics (3-D advection, cloud mixing, and turbulent transport) then transport this O3 which is nominally representative of stratospheric origin through the modeled troposphere, as detailed in Mathur et al. (2017). Based on this new parameterization, it was demonstrated that UTLS O3 agreed much better with observation in terms of its magnitude and seasonality (Xing et al., 2016). Mathur et al. (2017) further demonstrated improvements in representation of seasonal variations in surface O3 using the parameterization. To track stratospheric air masses, the O3 estimated using the O3∕PV relationship in the three layers listed above is also added as a chemically inert tracer species in the H-CMAQ simulations, hereafter denoted as the O3PV tracer. The O3PV tracer undergoes the same transport, scavenging, and deposition processes as O3, but its mixing ratios are not affected by chemical production or loss processes.
The meteorological fields are simulated by the Weather Research and Forecasting (WRF) model version 3.6.1 using the same vertical configuration as H-CMAQ. The WRF simulation started from 1 March 2009 with more than 1 year of spin-up time prior to the analysis period of April 2010. The WRF model is configured to use the rapid radiative transfer model for global climate models (RRTMG) radiation scheme for both longwave and shortwave (Iacono et al., 2008), the Morrison double-moment scheme (Morrison et al., 2009) and Grell convective parameterization (Grell, 1993; Grell and Devenyi, 2002) for microphysics and cumulus parameterization, and the Mellor–Yamada–Janjić scheme for planetary boundary layer (Janjic et al., 1994). Wind, temperature, and water vapor fields are nudged towards NCEP final analysis (FNL) data for all layers; these analysis data have 1∘ spatial and 6 h temporal resolution (NCEP, 2018). The WRF meteorological fields are converted to the format required by H-CMAQ using the meteorology–chemistry interface processor (MCIP) version 4.3 (Otte and Pleim, 2010), and then used for the H-CMAQ simulation. Relative humidity (RH) can also be used to diagnose stratospheric air masses because the stratosphere is characterized by dry air. CMAQ used the meteorological fields simulated by WRF and calculated RH based on the improved Magnus form approximation for saturation vapor pressure (Alduchov and Eskridge, 1996), and internally set the maximum value at 99 % and minimum value at 0.5 %. The CMAQ simulation started from 1 March 2010 and initialized with three-dimensional chemical fields from prior model simulations for 2010 by Hogrefe et al. (2018); March is discarded as a spin-up period and April is used as the analysis period. The O3PV tracer is also initialized by this prior model simulations of Hogrefe et al. (2018).
2.2 Observations and evaluation protocols
2.2.1 Ground-based surface O3 observations
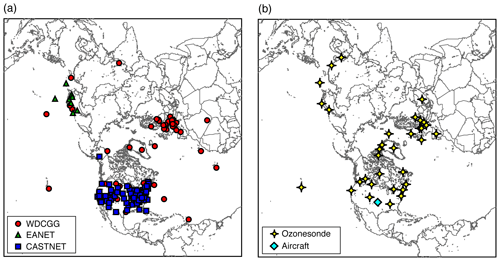
The Northern Hemisphere modeling domain and ground-based observations used in this study are shown on the map in Fig. 1. Global ground-based surface O3 observations were obtained from the World Data Centre for Greenhouse Gases (WDCGG; shown as red circles in Fig. 1). For the study period of April 2010, this dataset contained 52 sites in North America, Europe, and several remote locations with only limited coverage over Asia (WDCGG, 2018). To overcome this limitation, surface O3 observations are also obtained from the Acid Deposition Monitoring Network in East Asia (EANET) program which provides measurements at 12 sites in Japan, 3 sites in South Korea, 1 site in Russia, and 4 sites in Thailand. However, the observed data are only available on a daily mean basis for Russia, and a monthly mean basis for South Korea and Thailand. Therefore, the only EANET monitors used in this study (EANET, 2018) are those located in Japan; these nine sites with available data for April 2010 are shown as green triangles in Fig. 1. In addition, surface O3 observations over the US were obtained from the Clean Air Status and Trends Network (CASTNET) and are shown as blue squares in Fig. 1. CASTNET monitors (CASTNET, 2018) are located mostly in rural and remote areas, which makes them appropriate for comparison to O3 fields from the coarse-resolution H-CMAQ simulations. CASTNET data are available at 81 sites during April 2010. MD8O3 values for April 2010 are calculated from the hourly observations at these WDCGG, EANET, and CASTNET stations.
2.2.2 Ozonesondes
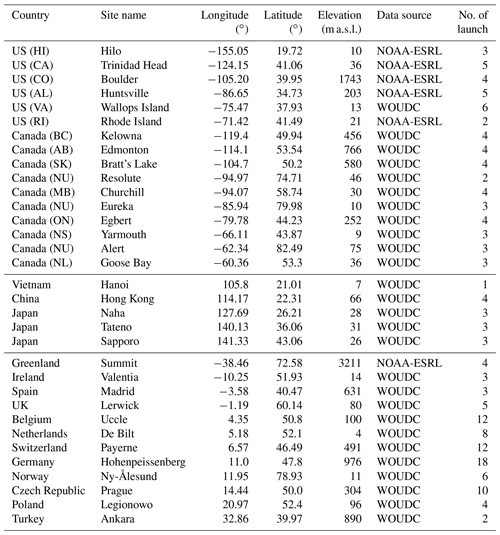
An evaluation of simulated vertical O3 profiles is needed to analyze the model's ability to capture the behavior of aloft O3. To this end, we obtained ozonesonde data distributed by the WOUDC as well as additional ozonesonde soundings available over the US and Greenland that are collected and distributed by the National Oceanic and Atmospheric Administration Earth System Research Laboratory (NOAA-ESRL) (NOAA, ESRL and GMD, 2018a). The total number of available ozonesonde sites during April 2010 was 33 (locations shown as yellow stars in Fig. 1). The data for Hilo and Boulder are available in both the WOUDC and NOAA-ESRL databases; the NOAA-ESRL data are used because they include information on uncertainties of the O3 measurements. Detailed information for each site, including country, site name, latitude (∘), longitude (∘), elevation (m a.s.l.), and the number of launches during April 2010, is provided in Table 2. There are 6 sites located in the US, 10 sites in Canada, 5 sites in Asia, and 12 sites in Europe. In addition to measured O3 mixing ratios, observed RH vertical profiles are used to evaluate the model performance.
2.2.3 Airplane
In addition to ozonesonde data to evaluate the vertical O3 distribution, observations from research aircraft for three sites located in the US (Cape May, New Jersey; Homer, Illinois; and Southern Great Plains, Oklahoma) are available from NOAA-ESRL (NOAA, ESRL, and GMD, 2018b) for April 2010. Because the observations at Cape May and Homer are only available for a single day during April 2010, we only used the NOAA-ESRL aircraft data at Southern Great Plains, which is shown as a sky blue diamond in Fig. 1. A total of seven flights were conducted at this site during April 2010. In addition to O3 mixing ratios, RH was used to evaluate the model performance.
2.2.4 Satellite
Tropospheric column O3 observed by the Ozone Monitoring Instrument (OMI) onboard the National Aeronautics and Space Administration (NASA) Earth Observing System Aura satellite is used in this study. The methodology to estimate the tropospheric column has been developed (Ziemke et al., 2006) and consists of taking the differences between total column O3 observed by OMI and stratospheric column O3 observed by the Microwave Limb Sounder (MLS). The monthly mean tropospheric O3 column data are available between 60∘ S and 60∘ N (NASA and GSFC, 2018a). Because these tropospheric column O3 data are monthly mean data, in order to take into account the daily missing data by OMI, total column data (OMTO3d) are utilized to obtain the information on daily missing data in order to compare with the model (NASA and GSFC, 2018b). These total column data are the products of averaging only the good-quality flag of level-2 swath data and then gridded into . Such an approach considering daily deficit data has also been applied in a previous study (e.g., Chatani et al., 2014). To diagnose the tropopause in the model, PV with a value of 2 PVU is used as threshold. This diagnosis is applied above the boundary layer to avoid the misdiagnosis near the surface due to the high value of PV caused by turbulence.
2.2.5 Evaluation protocol
To evaluate model performance, Pearson's correlation coefficient (R) with Student's t test is used for assessing the statistical significance level. The normalized mean bias (NMB) and the normalized mean error (NME) are calculated using the following equations (e.g., Zhang et al., 2006):
where N is the total observation number, Oi and Mi represent each individual observation and model value, respectively, and and represent the arithmetical mean of observations and model values, respectively. Based on a compilation of model evaluation reports, Emery et al. (2017) suggested threshold values of R > 0.75, NMB < ±5 %, and NME < 15 % as performance goals, and threshold values of R > 0.50, ±5 % < NMB < ±15 %, and 15 % < NME < 25 % as performance criteria for 1 h O3 or MD8O3 simulated by regional-scale air quality models. Although these recommendations were developed for regional-scale air quality models and suggested to apply over time–space averaging scales of no longer than 1 month and no more than 1000 km, these three criteria are applied in this work to judge the performance of the April 2010 H-CMAQ simulations due to the lack of other commonly accepted model performance criteria for hemispheric or global-scale O3 simulations. Evaluation of surface O3 simulated by global models indicated a somewhat loose threshold might be required because of the use of a coarse grid resolution (Zhang et al., 2012; He et al., 2015a, b).
3.1 Model evaluation
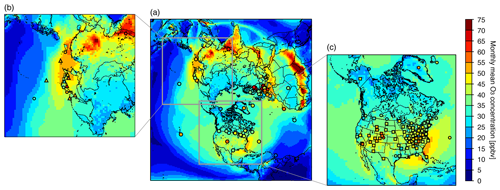
A scatter plot of modeled vs. observed MD8O3 at WDCGG, EANET, and CASTNET, sites during April 2010 is shown in Fig. 2 using colors and symbols that are consistent with Fig. 1. A summary of the statistical analysis is provided in Table 3. Almost all of the EANET (green triangles) and CASTNET (blue squares) MD8O3 data pairs were within the 1:2 lines across the entire O3 mixing ratio range. The comparison of H-CMAQ values with EANET observations over Asia shows an R value of 0.49, which is statistically significant at a level of p < 0.001, an NMB of −12.6 %, and an NME of 20.6 % (Table 3). A comparison to CASTNET observations over the US shows that the mean observed and modeled values are close, with an NMB of −0.9 % and an NME of 12.6 %, and that R had a value of 0.61 with p < 0.001. This indicates that the H-CMAQ simulations captured the CASTNET observational data within the model criteria performance suggested by Emery et al. (2017). A comparison to WDCGG data across the Northern Hemisphere shows an R of 0.49 with p < 0.001, an NMB of −19.3 %, and an NME of 23.7 %. The mean model value is approximately 10 ppbv less than the mean of the observations. This feature is also evident in the scatter plot shown in Fig. 2. While observed values reach more than 100 ppbv of MD8O3, the corresponding model values are only about half of these high MD8O3 mixing ratios, indicated by a clustering of WDCGG pairs on the 2:1 line. To investigate this model underestimation further, the spatial distributions of monthly mean modeled and observed O3 mixing ratios are examined in Fig. 3, which shows observed high mixing ratios over eastern Europe. In particular, the four WDCGG monitors at Košetice, Czech Republic (49.58∘ N, 15.08∘ E; 534 m a.s.l.), K-puszta, Hungary (46.97∘ N, 19.55∘ E; 125 m a.s.l.), Rucava, Latvia (56.16∘ N, 21.17∘ E; 18 m a.s.l.), and Zoseni, Latvia (57.08∘ N, 25.54∘ E; 182 m a.s.l.) measured MD8O3 mixing ratios larger than 100 ppbv on 14, 10, 5, and 4 d, respectively, during April 2010. An analysis of data collected during an airborne measurement campaign during 15–18 April 2010 over Siberia reported enhanced O3 mixing ratios influenced by long-range transport, biomass burning plumes, and stratospheric intrusion (Berchet et al., 2013). Since the biomass burning emissions used in the current H-CMAQ simulations are based on climatological averages rather than year-specific events, the model underestimation may at least partially be due to the representation of these emissions. Another possible reason may stem from the use of a coarse horizontal resolution. From the viewpoint of meteorology, the blocking events over European Russia during spring–summer 2010 were reported, and positive anomalies of O3 total column over the regions adjacent to the anticyclones (i.e., Europe) were analyzed (Sitnov et al., 2017). Removing the data of these four sites from the analysis yields model performance metrics of an R of 0.63 with p < 0.001, an NMB of −14.4 %, and an NME of 19.5 %; which are comparable to performance at the EANET sites. Aside from the underestimation of high observed MD8O3 mixing ratios at these four European sites, H-CMAQ generally captured the WDCGG observations. Summarizing the model evaluation with surface observations, it is confirmed that the model reasonably captures MD8O3 almost within the model performance criteria of Emery et al. (2017).
Table 3Statistical analysis of modeled O3 concentration using surface, ozonesonde, aircraft, and satellite observations.
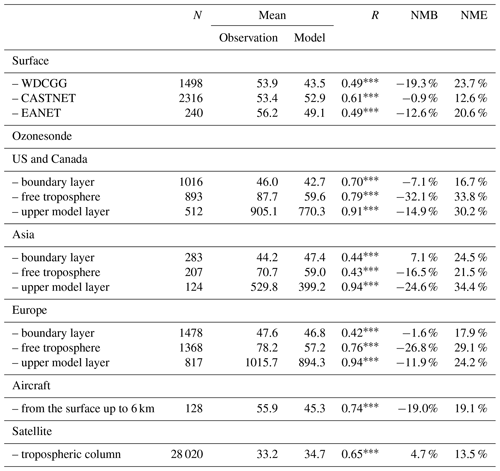
Note: the unit of mean for observations and simulations is ppbv except satellite observation, which is expressed as DU. Maximum daily 8 h average ozone (MD8O3) is used for surface observational data of WDCGG, CASTNET, and EANET. Corresponding hourly modeled O3 is used for ozonesonde data. The 2–4 h averaged hourly modeled O3 is used for aircraft data to fully cover each observation time. Significance levels by Student's t test for correlation coefficients between observations and simulations are marked as *p < 0.05, , and , and lack of a mark indicates no significance.
To investigate the vertical profiles of O3, ozonesonde and airplane data are used in this study. In Figs. 4 and S5, time–height cross sections (“curtain plots”) of hourly modeled O3, O3PV, and RH values during April 2010 are shown at the location of the ozonesonde sites in the US, i.e., at Hilo, HI; Trinidad Head, CA; Boulder, CO; Huntsville, AL; Wallops Island, VA; and Rhode Island. The plots also show contour lines of modeled PV for PV values of 1.0, 1.5, 2.0, 2.5, and 3.0 PVU, with the thick red lines indicating a value of 2.0 PVU that can be used to diagnose the tropopause. Generally, O3 and O3PV mixing ratios are very similar in the upper layers, especially above the 2.0 PVU line, indicating that O3 mixing ratios in these layers are dominated by stratospheric air mass. Below the tropopause, as diagnosed by the PV =2.0 PVU line, O3 mixing ratios are generally higher than O3PV mixing ratios, suggesting that O3 was photochemically produced in the troposphere. On the other hand, instances of O3 mixing ratios lower than O3PV mixing ratios are indicative of photochemical loss. One typical example of such photochemical loss can be seen at Hilo (Fig. S5a). At that location, O3 mixing ratios are less than 30 ppbv below 2 km, whereas the O3PV mixing ratios are larger than 40 ppbv. A likely driver of this strong O3 loss is the halogen chemistry in marine environments implemented in H-CMAQ (Sarwar et al., 2015) because the Hilo site is surrounded by ocean. The impact of photochemical processes is further discussed in Sect. 3.2. Ozone mixing ratios at the level of the tropopause as diagnosed by the 2 PVU lines generally are around 100 ppbv (light blue colors in Figs. 4 and S5). Although high values of PV are typically seen in the upper layers above 10 km, it should be noted that high PV can occasionally also be found in the lower troposphere where it could be associated with convection. RH values are below 10 % (white colors in Figs. 4 and S5) above the tropopause and steeply increased near or below the tropopause, as diagnosed by the 2.0 PVU lines. Based on the rough estimation shown in the curtain plots of Figs. 4 and S5, RH values at the level of the tropopause are typically on the order of 30 %–40 %. In Figs. 4 and S5, the launch times of available ozonesonde measurements are indicated by yellow stars, and we discuss below the comparison of model profiles to measurements from these launches.
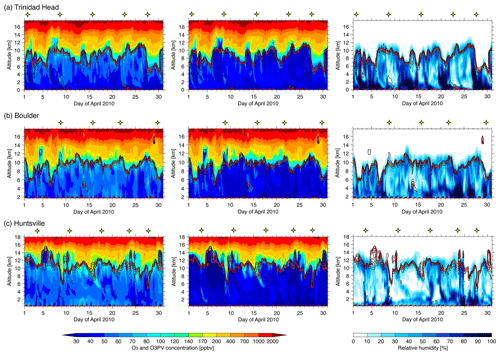
Figure 4Curtain plots of modeled (left) O3, (center) O3PV, and (right) RH at US ozonesonde sites of (a) Trinidad Head (CA), (b) Boulder (CO), and (c) Huntsville (AL) during April 2010. Yellow stars indicate the time of available ozonesonde measurements. Contour lines of modeled PV are also inserted for contours of 1.0, 1.5, 2.0, 2.5, and 3.0 PVU, with thick red lines denoting the 2.0 PVU contour as an index to diagnose the tropopause.
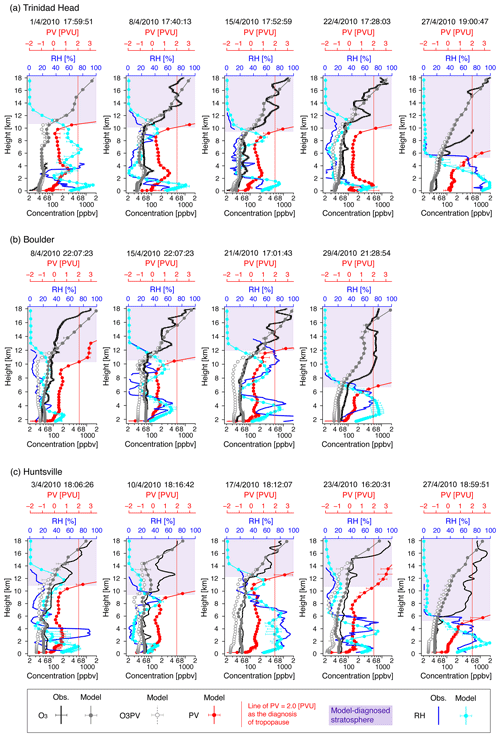
Figure 5Vertical profiles of observed and modeled O3 and RH at US ozonesonde sites of (a) Trinidad Head (CA), (b) Boulder (CO), and (c) Huntsville (AL). Also see Fig. 4 for ozonesonde measurement times. For modeled O3 and RH, the hourly result corresponding to the ozonesonde measurement time is shown by circles, and the maximum and minimum model results within ±2 h of the measurement time are shown by whiskers. For observed O3 at Hilo and Boulder, the range of uncertainties of the O3 observations is shown by whiskers. Modeled O3PV and PV are also shown. Modeled PV profiles are plotted in red, and vertical lines corresponding to a PV value of 2 PVU are inserted as an index of the tropopause, and the layer range diagnosed as stratospheric air mass is colored in purple.
The vertical profiles of observed and modeled O3 and RH, as well as modeled O3PV and PV are shown in Figs. 5 and S6. In these figures, vertical red lines corresponding to a PV value of 2.0 PVU are inserted as an index of stratospheric air masses, and the diagnosed stratosphere is colored in purple. A quantitative comparison between simulations and observations is conducted by averaging the observations onto the vertical grid spacing used by the model. The vertical layers are then assigned to three vertical ranges based on typical pressure values, i.e., the boundary layer (surface to approximately 750 hPa), the free troposphere (approximately 750–250 hPa), and the upper model layers (approximately 250–50 hPa) following the same approach used in our previous study (Hogrefe et al., 2018). Furthermore, the statistical analysis is performed separately for the three regions of the US and Canada, Asia, and Europe and the three layers ranges defined above. As shown in Figs. 4 and S5, O3 and O3PV show similar variations in the upper model layer; however, O3 is greater than O3PV near the tropopause, indicated by 2.0 PVU, and this suggests the presence of photochemical production near the tropopause. Results of this statistical analysis for O3 mixing ratios are shown in Table 3 and reveal that over all three regions the model performed the best for the boundary layer in terms of NMB and NME. The observed mean boundary layer values of around 45 ppbv over the three regions are well captured by the model. Over the US and Canada, model performance in the boundary layer satisfies the performance criteria for all three metrics (R, NMB, and NME), and over Asia and Europe, NMB and NME also satisfy the performance criteria, whereas R is less than 0.5. Compared to the results for the boundary layer, the model tends to underestimate the observed O3 mixing ratios in the free troposphere and the upper model layers. In the free troposphere, the mean observed value is around 80 ppbv, while the mean model value is below 60 ppbv. As a result, NMB values are greater than −15 % and NME values are greater than 20 %. This underestimation is also present in the upper model layers; the mean observed values of 500–1000 ppbv are consistently underestimated by about 100 ppbv by the model across the three regions as shown in Table 3. R values tend to increase from the boundary layer to the free troposphere and the upper model layers due to model's ability to capture the increase of O3 mixing ratios with height. The higher R values in the free troposphere, a region where impacts of photochemistry on O3 variability are smaller, also suggest greater confidence in the model dynamics, which drive O3 variations in this part of the atmosphere. Table S1 in the Supplement shows the statistical results that are obtained when grouping stations into latitude ranges. The results indicate that model performance is similar to that shown in Table 3 and discussed above. These results suggest that although the revision of the dynamic PV approach described in Xing et al. (2016) led to improved results compared to earlier implementations of the scaling approach, there is a need for further refinement of the approach to better capture high mixing ratios of stratospheric O3. Using a finer vertical resolution for the upper layers and extending the model top beyond 50 hPa to cover larger portions of the stratosphere could be potential strategies to address this need. In addition, the uncertainty of the lightning emissions prescribed as climatological averages in the current simulations may also contribute to the underestimation of O3 in the free troposphere.
To investigate the effect of horizontal grid resolution on the representation of STT, additional WRF simulations were conducted over the continental US (CONUS) domain with 36 and 12 km horizontal grid resolutions, and temporal and vertical variations in simulated PV fields across the different resolutions (108, 36, and 12 km) were compared. These results are shown in Fig. S7. Generally, the modeled PV fields estimated with different horizontal grid resolutions showed similar features. The differences are displayed in Fig. S8. It was revealed that higher (lower) PV at upper (lower) altitude is enhanced (weakened) by increasing horizontal grid resolution. As expected, larger differences are noted between the 108 and 12 km fields than those between the 108 and 36 km fields. Although the enhancement of PV at upper altitudes could lead to increase in estimated O3 through the O3∕PV relationship used in the model, no systematic differences are noted in the estimated O3 in the model's UTLS across the three resolutions, at least at the ozonesonde observation sites where our analysis is focused. A comparison of the altitude of 2 PVU which is used to diagnose the tropopause is also plotted in Fig. S8. As noted by the similarity of the altitude of the 2 PVU across the three different resolutions, the interpretation of STT events is not strongly influenced by the horizontal resolution employed in this study. This is because all model calculations employ assimilation of analyzed meteorological fields in the model's UTLS, resulting in comparable representation of STT events. Finally, a comparison of estimated O3 at the model top layer based on the O3∕PV relation (Xing et al., 2016) by using different PV simulated from different horizontal grid resolutions is illustrated through scatter plots in Fig. S9. These comparisons indicate good correspondence in the magnitude of O3 at the model top using PV estimates from the three different resolutions. At the Boulder site (Fig. S9b), the use of finer grid resolutions could sometimes lead to higher O3 concentrations. Collectively, the comparisons in Figs. S7–S9 suggest that the 108 km horizontal grid resolution in H-CMAQ modeling system in conjunction with the physics and data assimilation options employed in the driving WRF model can capture the variability in the PV fields and associated STT O3 impacts.
Although RH is a diagnostic variable, it may also provide an indication for stratospheric air mass; it is thus included in the model evaluation. As expected, Fig. 5 shows that RH has higher values and large variations in the troposphere and lower values in the stratosphere. For the analysis of modeled vertical profiles, model results of maximum and minimum values within ±2 h from observation time are also shown, and the range of RH showed large variations at lower altitude. Table 4 summarizes the statistical analysis divided into the three regions and three vertical domains for RH. It was found that the model generally overestimates RH over all regions and all three layers' ranges. Although the NME value seems high for the upper layers, this is caused by the low absolute values of RH. The mean absolute differences between observed and modeled RH values are 1 %–2 % over the US, Canada, and Europe, and 8 % over Asia. In Table S2, model and observed RH are further compared across different altitudes and latitude bands in the same fashion as the O3 results in Table S1. Results show that model performance is similar to that discussed for Table 4. The systematic positive bias of RH occurs despite using analysis nudging for wind, temperature, and water vapor in the WRF simulations. Positive bias in predicted RH is also found in meteorological simulations performed for the Air Quality Modelling Evaluation International Initiative (AQMEII) (Vautard et al., 2012).
Table 4Statistical analysis of modeled RH using ozonesonde and aircraft observations.
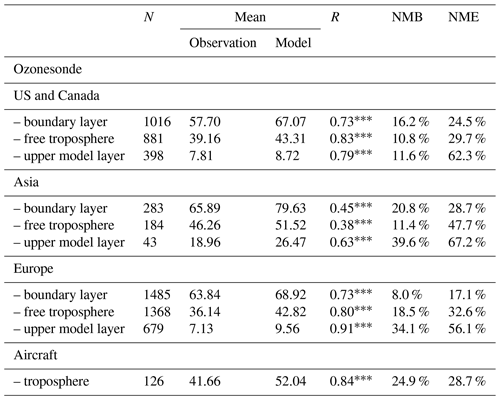
Note: significance levels by Student's t test for correlation coefficients between observations and simulations are marked as *p < 0.05, , and , and lack of a mark indicates no significance. The 5 h averaged hourly modeled relative humidity is used for ozonesonde data. The 2–4 h averaged hourly modeled relative humidity is used for aircraft data to fully cover each observation time, and original aircraft data are averaged into 100 m resolution to be compared with the model.
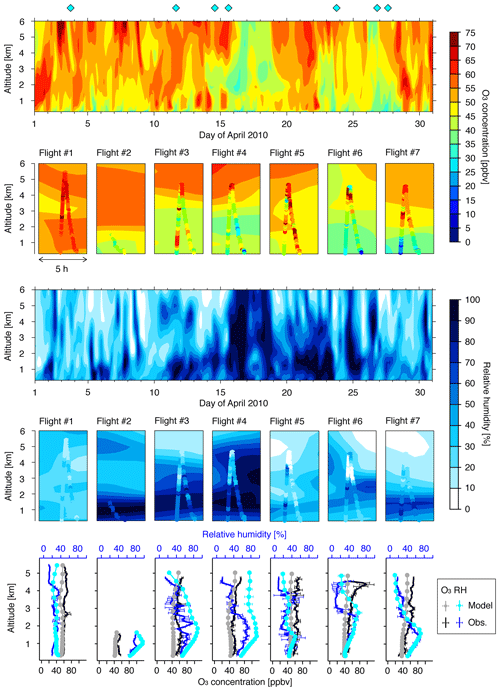
Figure 6Curtain plot and vertical profiles of O3 and RH at the aircraft observational site: Southern Great Plains, Oklahoma. Gray diamonds indicate the times of the seven aircraft flights, and results for these flights are shown in the expanded boxes for 5 h time windows overlaid with observations. Observed ascent and descent profile data are averaged into 100 m grid resolution, and profiles of the mean and standard deviations are shown. Modeled ascent and descent data corresponding to the observation times are averaged on original modeled layers, and the mean and standard deviations are shown.
The tropopause diagnosed by PV =2.0 PVU is located around 10–12 km at five ozonesonde sites in the US, except Hilo where it is located around 16 km. Observations in late April show instances of tropopause heights at or below 6 km, e.g., 27 April at Trinidad Head (Fig. 5a), 29 April at Boulder (Fig. 5b), and 27 April at Huntsville (Fig. 5c). These cases illustrate large impacts of episodic STT, with observed O3 mixing ratios steeply increasing from 100 ppbv at around 6 km to over 500 ppbv at around 8 km. The profiles obtained from the H-CMAQ simulations do not capture this steep increase and only show a gradual increase. This finding further supports a need for further refinement of representing high stratospheric O3 mixing ratios as discussed above in the context of Table 3. In terms of RH, observed RH values show a sudden decline from around 60 % to near 0 % at Trinidad Head and Huntsville, whereas modeled RH values show a gradual decrease with large temporal variations. This contributes to the modeled positive RH bias shown in Table 4.
The comparison of model 3-D O3 structure at Southern Great Plains, Oklahoma, with research aircraft measurements is illustrated in Fig. 6. At this site, the curtain plot of modeled O3 is shown for the entire month of April 2010 in the top row and zoomed inserts for the seven observational times indicated by sky blue diamonds above those plots are shown in the second row with each box showing airplane observations overlaid on H-CMAQ values. For O3, observed and modeled mixing ratios increased from about 30 ppbv at 1 km to about 55 ppbv at 5 km, except for flight no. 1 which shows persistently high mixing ratios of 50–60 ppbv throughout this altitude range. However, observed high mixing ratios of O3 over 70 ppbv during flight nos. 5, 6, and 7 are not captured by H-CMAQ. In contrast to O3, observed and modeled RH generally decreased from 1 to 5 km as shown in rows 3 and 4. Overestimation in model RH is noted for flight nos. 3, 4, and 6 above 3 km. Considering the profiles of O3 and RH, flight no. 6 might be a case of STT because observed RH is less than 10 % and observed O3 mixing ratios exceed 75 ppbv; however, the model fails to reproduce this behavior, the tropopause as diagnosed by the PV =2.0 PVU locates near 10 km. The profile data averaged over all airplane ascents and descents are plotted in the bottom panel of Fig. 6, and statistical analysis of these profiles is included in Table 3 for O3 and Table 4 for RH. Similar to the evaluation results for ozonesondes, the model could reasonably capture observed O3 and RH profiles, but O3 mixing ratios are generally underestimated and RH is overestimated.
The observed and modeled tropospheric column O3 values are compared in Fig. 7. The observed latitudinal gradients in tropospheric column O3 with values greater than 40 DU over midlatitudes, column values around 30 DU over high and low latitudes, and values below 20 DU over the Pacific Ocean near the Equator are captured well by H-CMAQ. To illustrate the differences between observations and simulations, the normalized bias is also shown in Fig. 7. This normalized bias map shows model tropospheric column O3 overestimation over Russia and Africa and a slight underestimation over the Pacific Ocean. While the comparison with surface observations from WDCGG shows model underestimation at four sites over eastern Europe, the model slightly overestimates tropospheric column O3 in this region. In addition, the model underestimation especially in the free troposphere is noted through comparison with ozonesonde measurements (Table 3); however, this comparison showed model overestimation. The evaluation of satellite data compared to ozonesonde exhibited scattered correspondence and slight overestimation by satellite-derived column O3. Therefore, the model performance could differ from that for column O3. The results of the statistical analysis for tropospheric column O3 are also listed in Table 3. The mean of observed and modeled tropospheric column O3 across the Northern Hemisphere is close on average, with an R of 0.65, an NMB of 4.7 %, and an NME of 13.5 %. The performance of tropospheric column O3 judged based on the evaluation protocol developed for mixing ratios suggests that the model satisfies the performance criteria proposed by Emery et al. (2017).
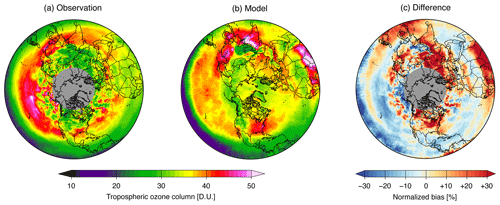
Figure 7Tropospheric ozone column of (a) satellite observation, (b) H-CMAQ simulation, and (c) their differences shown as normalized bias. Areas filled in gray color indicate missing observations.
3.2 Air mass characterization method
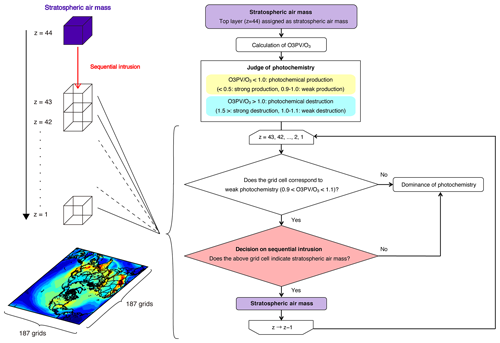
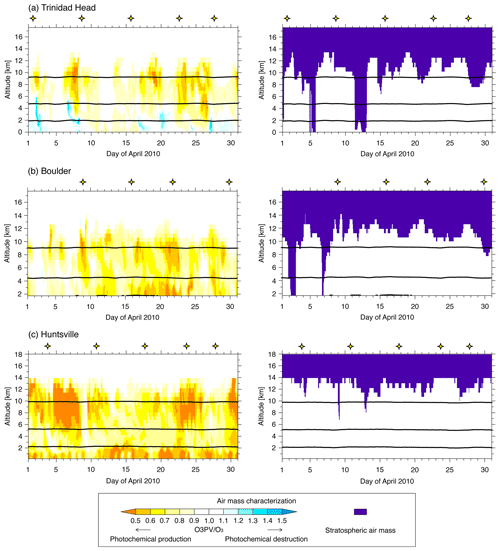
In order to characterize whether O3 in a given air mass is dominated by photochemistry or stratospheric intrusion, and to further estimate the impacts of STT, a new air mass characterization method is established here. Figure 8 illustrates a flowchart of the air mass characterization method. The method relies on the modeled O3PV∕O3 ratio to calculate the intensity of photochemistry. Because the top layer is set to 50 hPa in these H-CMAQ simulations, the uppermost layer (layer number is 44) is always regarded as a stratospheric air mass in this method. For all layers below (i.e., layer 43 down to the lowermost layer), the importance of photochemistry is determined based on the ratio of the O3PV∕O3 mixing ratios. As noted in the discussion related to Figs. 4 and S5, and 5 and S6, if the O3 mixing ratio is higher than the O3PV mixing ratio, it implies that photochemical production affected the air mass, and vice versa. Therefore, a O3PV∕O3 ratio of less (more) than 1.0 is classified as photochemical production (destruction), and a value near 1.0 can be classified as weakly impacted by photochemistry. The O3PV∕O3 ratio is illustrated in Fig. 9 (left) and Fig. S10 (left), wherein locations and times colored as orange (blue) represent air masses influenced by photochemical production (destruction), while ratios near 1.0 (ranging from 0.9 to 1.1) are colored as white. In Figs. 9 and S10, horizontal lines indicating 750, 500, and 250 hPa are also shown. The next step in the classification scheme is to determine whether an air mass is of stratospheric origin. The concept of a sequential intrusion from upper layers to lower layers is considered. When the grid cell directly above is also diagnosed as stratospheric air mass, the grid is determined as being dominated by stratospheric air mass. Applying this concept of a sequential stratospheric air mass intrusion is repeatedly used in the air mass characterization scheme to determine whether an air mass is dominated by photochemistry or stratospheric intrusion. It is important to note that characterizing a grid cell as being dominated by a process does not mean that other processes do not impact O3 mixing ratios as well. For example, O3 in a grid cell near the tropopause can be dominated by a stratospheric air mass, but it can also be affected by photochemical production and destruction. Similarly, although O3 in a grid cell near the surface layer is often dominated by photochemical processes, it can also be affected by a stratospheric air mass.
An illustration of applying this method to determine stratospheric influences at the six ozonesonde sites in the US is presented in Fig. 9 (right) and Fig. S10 (right). Stratospheric influences are dominant above 250 hPa and vary day to day with episodic influences down to 750 hPa. Deep stratospheric intrusions are clearly seen in some cases in which stratospheric air reaches to the surface, such as during early to mid-April at Trinidad Head (Fig. 9a) and early April at Boulder (Fig. 9b). It should be noted that since the classification scheme is based on the most dominant process, a grid cell classified as being dominated by photochemistry can still be influenced by stratospheric air. Therefore, these estimated impacts of stratospheric air masses on the troposphere can be viewed as a lower bound.
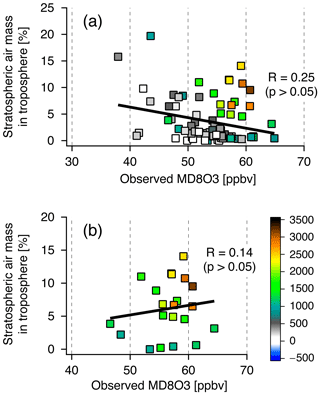
Figure 10Relationship between observed MD8O3 at the surface and the estimated stratospheric air mass contributed to total tropospheric O3 column as a monthly average during April 2010. The points are color coded based on elevation of each site. (a) All CASTNET sites (except Alaska) and (b) elevated CASTNET sites defined as having an elevation greater than 1000 m (see also Table S3).
3.3 Investigation of stratospheric intrusion
The relationship between the model-estimated stratospheric contribution to the total tropospheric O3 column and observed surface O3 levels at CASTNET sites is investigated in Fig. 10 on a monthly average basis. To estimate this stratospheric contribution to the O3 tropospheric column burden, we first estimate the tropospheric column burden as the O3 mass between the surface and 250 hPa. The O3 mass between the lowest model level of stratospheric influence and 250 hPa is the estimated stratospheric O3 mass contribution. The ratio of these two quantities (expressed as percent) yields the estimated stratospheric air mass in the troposphere illustrated in Fig. 10. Using data from all CASTNET locations, the relationship shows a slightly negative slope in the R value of 0.25 with non-significance (p > 0.05), indicating that the influence of stratospheric air decreased with increasing surface MD8O3 mixing ratios. To further focus on this relationship at elevated sites in the US, the analysis is repeated using data from sites with an elevation higher than 1000 m as listed in Table S3. The result shows a slightly positive slope in the R value of 0.14 with non-significance (p > 0.05), which indicates that at elevated sites, STT has a possible effect on the surface-level O3 mixing ratio values. The finding of a negative slope using the entire dataset over the US is consistent with a previous investigation focused on relatively polluted areas over the western US such as the Central Valley, southern California, and Las Vegas (Lin et al., 2012b). For elevated sites, they also reported a positive slope indicating higher contributions of stratospheric air masses during periods of elevated surface O3. The reason for the relatively weak relation found in this study seems to stem from differences in simulated stratospheric O3 mixing ratios. Lin et al. (2012b) used the fully coupled Geophysical Fluid Dynamics Laboratory (GFDL) AM3 stratosphere–troposphere chemistry model, which tended to overestimate O3 mixing ratios; therefore, they employed a bias correction approach (assuming that when the estimated stratospheric contribution exceeds the model bias, the bias is caused entirely by excessive stratospheric O3) for estimating the stratospheric impacts on surface O3. On the other hand, the H-CMAQ simulation analyzed in this study tends to underestimate tropospheric O3 levels, especially during STT events, which may suggest that its estimates of stratospheric contributions to high surface O3 events may also be too low.
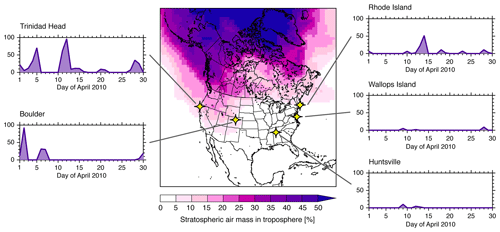
Figure 11Spatial distributions of monthly averaged stratospheric air mass contributions to total tropospheric O3 column over the US during April 2010. Yellow stars indicate the ozonesonde observational sites, and the daily variations are plotted.
The monthly averaged spatial distribution of the stratospheric air mass is shown in Fig. 11. It indicates higher stratospheric impacts over high-latitude regions and varies between 5 % and 25 % on a monthly average basis over the western US. Time series of model-estimated daily averaged stratospheric air mass in the troposphere at five ozonesonde sites across the contiguous US are also shown in Fig. 11. These time series reveal large temporal variations of stratospheric air mass in the troposphere. On a monthly mean basis during April 2010, air masses classified as being dominated by stratospheric intrusion contribute about 5 %–25 % to the total tropospheric O3 column at five of the ozonesonde sites and 25 % at Trinidad Head. However, on specific days, O3 masses from the stratosphere contribute up to 50 %–90 % of the total tropospheric O3 column.
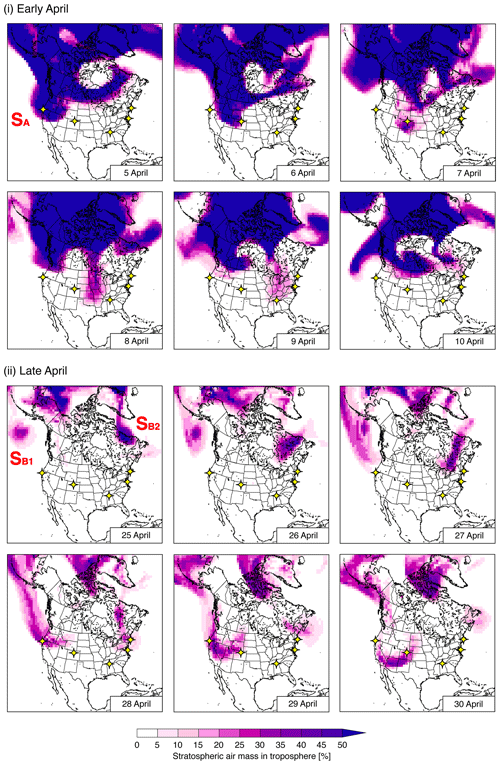
Figure 12Spatial distributions of day-to-day variations of stratospheric air mass contributions to total tropospheric O3 column over the US during (i) early and (ii) late April 2010. Yellow stars indicate the ozonesonde observational sites. Red character strings (SA and SB1−SB2) denote the different stratospheric air masses discussed in the text.
The previous section introduced an approach to identify cases when stratospheric air masses impact tropospheric O3. Results of the O3 column mass analysis identify periods in early, middle, and late April 2010 that are affected by stratospheric intrusions over the contiguous US, and in this section these events are further analyzed. Daily maps of the spatial patterns of the percentage of tropospheric O3 column diagnosed as being of stratospheric origin during (i) early and (ii) late April are presented in Fig. 12, while maps for mid-April are presented in Fig. S11. On 5 April, a large impact from the stratosphere was seen over the western US (indicated as point SA on the map) and covered Trinidad Head, where the contribution of O3 from the stratosphere to the tropospheric O3 mass is greater than 50 %. This air mass moved eastward on 6 April, when the impact at Boulder was also greater than 50 %. During 7–8 April, this air mass was located over the central US and then moved further to the east, with contributions extending southwards to Huntsville on 9 April. Finally, this air mass moved towards the northeast US with an impact at Wallops Island and Rhode Island. The stratospheric impacts in early April are associated with an air mass movement from west to east within 5 d, corresponding to an average speed of about 8–9 m s−1. Compared to the early April case, the case in late April is different. On 25 April, large impacts from the stratosphere were found over western (marked as SB1) and eastern (marked as SB2) Canada. The SB1 air mass moved towards the western US on 27 April and had large impacts at Trinidad Head from 27 to 30 April, affected Boulder on 29 and 30 April, and finally moved towards the southwestern US in a U-shaped pattern on 30 April. The other air mass (denoted as SB2, located over eastern Canada on 26 April) moved slowly southward and impacted Wallops Island and Rhode Island, then moved eastward. Thus, for the late April case, stratospheric air was present in different air masses, impacting different locations on different days. In contrast, during early April 2010, a single air mass moving from west to east impacted a large homogeneous region covering Canada and northern portions of the US. Contrasting the early and late April cases illustrates that different synoptic flow scenarios influence how stratospheric air can impact tropospheric O3 column over the US. The impacts of STT during the middle of April are shown in Fig. S11. From 12 to 15 April, tropospheric O3 columns over the western (i.e., Trinidad Head) and eastern (i.e., Wallops Island and Rhode Island) US were dominated by stratospheric intrusion, and these impacts largely disappeared after 17 April. Previous studies (e.g., Lin et al., 2012b) estimated 13 STT events during April–June 2010, and 7, 9, 12–15, 21–23, and 28–29 April 2010 were reported as STT events. Our investigations based on the air mass characterization method match with these earlier findings. The impact of STT at Huntsville has been previously investigated by combining ozonesonde and ozone lidar data by Kuang et al. (2012), who identified the period of 27–29 April to be associated with STT. Though our model simulations also indicated high PV and dry air at low altitudes, the simulated mid-tropospheric O3 was underestimated relative to the ozonesonde measurements (Fig. 5c), and the air mass characterization scheme limited stratospheric influences to above 750 hPa (Fig. 9c). Finer horizontal and vertical resolution could potentially better resolve the complex transport features in this case and improve the modeled 3-D O3 variations relative to the observations.
In this study, the regional chemical transport model CMAQ recently extended for hemispheric applications (H-CMAQ) is applied to investigate the relative importance of trans-Pacific and stratospheric transport on tropospheric O3 distributions across the US during April 2010. This Part 1 paper presents results from comprehensive evaluation against surface and aloft measurements and a new air mass characterization method to help distinguish influences of stratosphere–troposphere transport from those of photochemistry on O3. The comparison of modeled and observed O3 at the surface shows good performance, with NMBs around −10 %. Comparisons of vertical O3 distributions against ozonesonde and aircraft-based observations show that the model can capture O3 variations well within boundary layer, similar to those at the surface, although systematic underestimations of free troposphere O3 occur with NMBs up to −30 %, especially during events that are characterized to have strong STT during late April. Modeled RH exhibits a positive bias, with NMBs of +10 % or greater at all altitudes. Comparisons of modeled tropospheric O3 column with satellite observations suggest that the model can represent the general feature with lower column O3 over the equatorial Pacific and a higher column in the midlatitudes.
Using ozonesonde measurements, the relationship between PV and RH is examined to examine stratospheric air masses. The PV–RH relation indicates that PV of 2.0 PVU (1 PVU m2 K kg−1 s−1) generally corresponds to RH values of 30 %–40 %. A new air mass characterization method is further developed based on the ratio of modeled concentrations of O3 and a stratospheric O3 tracer. This enables an examination of the relative importance of photochemistry and stratospheric influences on tropospheric O3 distributions. The estimated STT impacts show significant day-to-day variations both in the magnitude of the contribution and the origin of the air mass. The relationship between surface O3 levels and estimated stratospheric air mass in troposphere exhibits a slightly negative slope, indicating that at most locations across the US, high surface O3 mixing ratios typically result from other factors (e.g., emissions). In contrast, at elevated sites, the relationship exhibits a slightly positive slope, indicating a more prominent STT contribution to O3 levels at these locations.
Despite the use of a coarse horizontal grid resolution for H-CMAQ simulations in this work, model performance statistics for comparisons with measurements at the surface and in the boundary layer were within the model performance criteria suggested from regional-scale applications. However, comparisons of modeled vertical O3 distributions with ozonesonde measurements indicate that the model has difficulty capturing higher O3 mixing ratios in the free troposphere. This result suggests a need for model improvements to accurately represent the STT process. While finer horizontal and vertical resolution could potentially help better represent atmospheric dynamics and 3-D transport of O3, improvements in model parameterizations of cloud and turbulent transport and the quality and resolution of the analysis fields used in the WRF model assimilation may also be needed to better represent STT. While this analysis focused on a short period during April 2010, seasonal and interannual variations in STT are also important and should be considered for future studies. In a companion paper (Part 2; Itahashi et al., 2020), we examine the relative contributions of trans-Pacific transport of O3 originating from NOx and VOC emissions in east Asia versus local emissions on O3 distributions across the US.
Source code for version 5.2 of the CMAQ model can be downloaded from https://github.com/USEPA/CMAQ/tree/5.2 (U.S. EPA and ORD, 2017a, b). For further information, please visit the US Environmental Protection Agency website for the CMAQ system: https://www.epa.gov/cmaq (U.S. EPA, 2020) .
The surface observational datasets used in this study are available from their respective websites: http://ds.data.jma.go.jp/gmd/wdcgg/ (WDCGG, 2018), http://www.eanet.asia (EANET, 2018), and https://www.epa.gov/castnet (CASTNET, 2018); for ozonesonde: https://woudc.org/data/explore.php?lang=en (WOUDC, 2020) and https://www.esrl.noaa.gov/gmd/ozwv/ozsondes/ (NOAA, ESRL and GMD, 2018a); for airplane: https://www.esrl.noaa.gov/gmd/ozwv/aircraft/index.html (NOAA, ESRL and GMD, 2018b); and for satellite: https://acd-ext.gsfc.nasa.gov/Data_services/cloud_slice/index.html (NASA and GSFC, 2018a).
The supplement related to this article is available online at: https://doi.org/10.5194/acp-20-3373-2020-supplement.
SI performed the analysis of observation and model simulation and prepared the manuscript with contributions from all co-authors. RM and CH contributed to establish the hemispheric modeling application for this study and prepared the emission dataset, initial condition, and lateral boundary condition from previous long-term simulation results. YZ contributed to the literature review of trans-Pacific transport and refined this research through simulation designs and results' interpretation.
The authors declare that they have no conflict of interest.
The views expressed in this paper are those of the authors and do not necessarily reflects the views or policies of the US Environmental Protection Agency.
The authors are grateful for the observation datasets of surface (WDCGG, EANET, and CASTNET), ozonesonde (WOUDC and NOAA-ESRL), airplane (NOAA-ESRL), and satellite (NASA). Yang Zhang acknowledges support from the 2017–2018 NC State Internationalization Seed Grant and the 2019–2020 NC State Kelly Memorial Fund for US-Japan Scientific Cooperation.
This paper was edited by Pedro Jimenez-Guerrero and reviewed by three anonymous referees.
Acid Deposition Monitoring Network in East Asia (EANET): available at: http://www.eanet.asia/, last access: 19 April 2018.
Alduchov, O. A. and Eskridge, R. E.: Improved Magnus form approximation of saturation vapor pressure, J. Appl. Meteorol., 35, 601–609, 1996.
Appel, K. W., Napelenok, S. L., Foley, K. M., Pye, H. O. T., Hogrefe, C., Luecken, D. J., Bash, J. O., Roselle, S. J., Pleim, J. E., Foroutan, H., Hutzell, W. T., Pouliot, G. A., Sarwar, G., Fahey, K. M., Gantt, B., Gilliam, R. C., Heath, N. K., Kang, D., Mathur, R., Schwede, D. B., Spero, T. L., Wong, D. C., and Young, J. O.: Description and evaluation of the Community Multiscale Air Quality (CMAQ) modeling system version 5.1, Geosci. Model Dev., 10, 1703–1732, https://doi.org/10.5194/gmd-10-1703-2017, 2017.
Berchet, A., Paris, J.-D., Ancellet, G., Law, K. S., Stohl, A., Nedelec, P., Arshinov, M. Y., Belan, B. D., and Ciais, P.: Tropospheric ozone over Siberia in spring 2010: remote influences and stratospheric intrusion, Tellus B, 65, 19688, https://doi.org/10.3402/tellusb.v65i0.19688, 2013.
Carmichael, G., Uno, I., Phadnis, M. J., Zhang, Y., and Sunwoo, Y.: Tropospheric ozone production and transport in the springtime in east Asia, J. Geophys. Res., 103, 10649–10671, 1998.
Chatani, S., Amann, M., Goel, A., Hao, J., Klimont, Z., Kumar, A., Mishra, A., Sharma, S., Wang, S. X., Wang, Y. X., and Zhao, B.: Photochemical roles of rapid economic growth and potential abatement strategies on tropospheric ozone over South and East Asia in 2030, Atmos. Chem. Phys., 14, 9259–9277, https://doi.org/10.5194/acp-14-9259-2014, 2014.
Clean Air Status and Trends Network (CASTNET), U.S. Environmental Protection Agency Clean Air Markets Division: available at: https://www.epa.gov/castnet, last access: 26 April 2018.
Cooper, O. R., Gao, R.-S., Tarasick, D., Leblanc, T., and Sweeney, C.: Long-term ozone trends at rural ozone monitoring sites across the United States, 1990–2010, J. Geophys. Res., 117, D22307, https://doi.org/10.1029/2012JD018261, 2012.
Cooper, O. R., Parrish, D. D., Stohl, A., Trainer, M., Nédélec, P., Thouret, V., Cammas, J. P., Oltmans, S. J., Johunson, B. J., Trasock, D., Leblanc, T., McDermid, I. S., Jaffe, D., Gao, R., Stith, J., Ryerson, T., Aikin, K., Campos, T., Weinheimer, A., and Avery, M. A.: Increasing springtime ozone mixing rations in the free troposphere over western North America, Nature, 463, 344–348, https://doi.org/10.1038/nature08708, 2010.
Crippa, M., Janssens-Maenhout, G., Dentener, F., Guizzardi, D., Sindelarova, K., Muntean, M., Van Dingenen, R., and Granier, C.: Forty years of improvements in European air quality: regional policy-industry interactions with global impacts, Atmos. Chem. Phys., 16, 3825–3841, https://doi.org/10.5194/acp-16-3825-2016, 2016.
Cristofanelli, P., Bonasoni, P., Collins, W., Feichter, J., Forster, C., James, P., Kentarchos, A., Kubik, P. W., Land, C., Meloen, J., Roelofs, G. J., Siegmund, P., Sprenger, M., Schnabel, C., Stohl, A., Tobler, L., Tositti, L., Trickl, T., and Zanis, P.: Stratosphere-to-troposhere transport: A model and method evaluation, J. Geophys. Res., 108, 8525, https://doi.org/10.1029/2002JD002600, 2003.
Danielsen, E. F.: Stratosphere-Troposphere exchange based on radioactivity, ozone and potential vorticity, J. Atmos. Sci., 25, 502–518, 1968.
Ebel, A., Hass, H.m Jakobs, H., J., Laubem M., Memmesheimer, M., Oberreuter, A., Geiss, H., and Kuo, Y.-H.: Simulation of ozone intrusion caused by a tropopause fold and cut-off low, Atmos. Environ., 25, 2131–2144, 1991.
Emery, C., Liu, Z., Russell, A. G., Odman, M. T., Yarwood, G., and Kumar, N.: Recommendations on statistics and benchmarks to assess photochemical model performance, J. Air Waste Manage., 67, 582–598, https://doi.org/10.1080/10962247.2016.1265027, 2017.
Fiore, A., Jacob, D. J., Liu, H., Yantosca, R. M., Fairlie, T. D., and Li, Q.: Varaiability in surface ozone background over the United States: Implications for air quality policy, J. Geophys. Res., 108, 4787, https://doi.org/10.1029/2003JD003855, 2003.
Fiore, A. M., Jacob, D. J., Bey, I., Yantosca, R. M., Field, B. D.,Fusco, A. C., and Wilkinson, J. G.: Background ozone over the United States in summer: Origin, trend, and contribution to pollution episodes, J. Geophys. Res., 107, 4275, https://doi.org/10.1029/2001JD000982, 2002.
Galmarini, S., Koffi, B., Solazzo, E., Keating, T., Hogrefe, C., Schulz, M., Benedictow, A., Griesfeller, J. J., Janssens-Maenhout, G., Carmichael, G., Fu, J., and Dentener, F.: Technical note: Coordination and harmonization of the multi-scale, multi-model activities HTAP2, AQMEII3, and MICS-Asia3: simulations, emission inventories, boundary conditions, and model output formats, Atmos. Chem. Phys., 17, 1543–1555, https://doi.org/10.5194/acp-17-1543-2017, 2017.
Gray, S. L.: A case study of stratosphere to troposphere transport: The role of convective transport and the sensitivity to model resolution, J. Geophys. Res., 108, 4590, https://doi.org/10.1029/2002JD003317, 2003.
Grell, G. A.: Prognostic evaluation of assumptions used by cumulus parameterizations, Month. Weather Rev., 121, 764–787, 1993.
Grell, G. A. and Devenyi, D.: A generalized approach to parameterizing convection combining ensemble and data assimilation techniques, Geophys. Res. Lett., 29, 1613, https://doi.org/10.1029/2002GL015311, 2002.
Haagen-Smit, A. J. and Fox, M. M.: Photochemical Ozone Formation with Hydrocarbons and Automobile Exhaust, Air Repair, 4, 105–136, https://doi.org/10.1080/00966665.1954.10467649, 1954.
He, J., Zhang, Y., Tilmes, S., Emmons, L., Lamarque, J.-F., Glotfelty, T., Hodzic, A., and Vitt, F.: CESM/CAM5 improvement and application: comparison and evaluation of updated CB05_GE and MOZART-4 gas-phase mechanisms and associated impacts on global air quality and climate, Geosci. Model Dev., 8, 3999–4025, https://doi.org/10.5194/gmd-8-3999-2015, 2015a.
He, J., Zhang, Y., Glotfelty, T., He, R., Bennartz, R. Rausch, J., and Sartelet, K.: Decadal Simulation and Comprehensive Evaluation of CESM/CAM5.1 with Advanced Chemistry, Aerosol Microphysics, and Aerosol-Cloud Interactions, J. Adv. Model. Earth Sy., 7, 110–141, https://doi.org/10.1002/2014MS000360, 2015b.
Hoering, M. P., Schaack, T. K., and Lenzen, A. J.: Global objective tropopause analysis, Mon. Weather Rev., 119, 1816–1831, 1991.
Hogrefe, C., Liu, P., Pouliot, G., Mathur, R., Roselle, S., Flemming, J., Lin, M., and Park, R. J.: Impacts of different characterizations of large-scale background on simulated regional-scale ozone over the continental United States, Atmos. Chem. Phys., 18, 3839–3864, https://doi.org/10.5194/acp-18-3839-2018, 2018.
Hoskins, B. J., McIntyre., M. E., and Robertson, A. W.: On the use and significance of isentropic potential vorticity maps, Q. J. Roy. Meteor. Soc., 111, 877–946, 1985.
Huebert, B. J., Bates., T., Russell, P. B., Shi, G., Kim, Y. J., Kawamura, K., Carmichael, G., and Nakajima, T.: An overview of ACE-Asia: Strategies for quantifying the relationships between Asian aerosols and their climatic impacts, J. Geophys. Res., 108, 8633, https://doi.org/10.1029/2003JD003550, 2003.
Iacono, M. J., Delamere, J. S., Mlawer, E. J., Shephard, M. W., Clough, S. A., and Collins, W. D.: Radiative forcing by long-lived greenhouse gases: Calculations with the AER radiative transfer models, J. Geophys. Res., 113, D13103, https://doi.org/10.1029/2008JD009944, 2008.
Itahashi, S., Uno, I., and Kim, S.-T.: Seasonal source contributions of tropospheric ozone over East Asia based on CMAQ-HDDM, Atmos. Environ., 70, 204–217, https://doi.org/10.1016/j.atmosenv.2013.01.026, 2013.
Itahashi, S., Uno, I., Irie, H., Kurokawa, J.-I., and Ohara, T.: Regional modeling of tropospheric NO2 vertical column density over East Asia during the period 2000–2010: comparison with multisatellite observations, Atmos. Chem. Phys., 14, 3623–3635, https://doi.org/10.5194/acp-14-3623-2014, 2014.
Itahashi, S., Hayami, H., and Uno, I.: Comprehensive study of emission source contributions for tropospheric ozone formation over East Asia, J. Geophys. Res., 120, 331–358, https://doi.org/10.1002/2014JD022117, 2015.
Itahashi, S., Mathur, R. Hogrefe, C. Napelenok, S. L., and Zhang, Y.: Modeling stratospheric intrusion and trans-Pacific transport on tropospheric ozone using hemispheric CMAQ during April 2010 – Part 2: Examination of emission impacts based on the higher-order decoupled direct method, Atmos. Chem. Phys., 20, 3397–3413, https://doi.org/10.5194/acp-20-3397-2020, 2020.
Itoh, H. and Narazaki, Y.: Fast descent routes from within or near the stratosphere to the surface at Fukuoka, Japan, studied using 7Be measurements and trajectory calculations, Atmos. Chem. Phys., 16, 6241–6261, https://doi.org/10.5194/acp-16-6241-2016, 2016.
Jacob, D. J., Logan, J. A., and Murti, P.: Effect of rising Asia emissions on surface ozone in the United States, Geophys. Res. Lett., 26, 2175–2178, 1999.
Jaffe, D., Anderson, T, Covert, D., Kotchenruther, R., Trost, B., Danielson, J., Simpson, W., Berntsen, T., Karlsdottir, S., Blake, D., Harris, J., Carmichael, G., and Uno, I.: Transport of Asian air pollution to North America, Geophys. Res. Lett., 26, 711–714, 1999.
Jaffe, D., Price, H., Parrish, D., Glodstein, A., and Harris, J.: Increasing background ozone during spring on the west cost of North America, Geophys. Res. Lett., 30, 1613, https://doi.org/10.1029/2003GL017024, 2003.
Janjic, Z.: The step-mountain Eta coordinate Model: Further developments of the convection, viscous sublayer, and turbulence closure schemes, Mon. Weeather Rev., 122, 927–945, 1994.
Janssens-Maenhout, G., Crippa, M., Guizzardi, D., Dentener, F., Muntean, M., Pouliot, G., Keating, T., Zhang, Q., Kurokawa, J., Wankmüller, R., Denier van der Gon, H., Kuenen, J. J. P., Klimont, Z., Frost, G., Darras, S., Koffi, B., and Li, M.: HTAP_v2.2: a mosaic of regional and global emission grid maps for 2008 and 2010 to study hemispheric transport of air pollution, Atmos. Chem. Phys., 15, 11411–11432, https://doi.org/10.5194/acp-15-11411-2015, 2015.
Koumoutsaris, S., Bey, I., Generoso, S., and Thouret, V.: Influence of El Niño-Southern Oscillation on the interannual variability of tropospheric ozone in the northern midlatitudes, J. Geophys. Res., 113, D19301, https://doi.org/10.1029/2007JD009753, 2008.
Kuang, S., Newchurch, M. J., Burris, J., Wang, L., Knupp, K., and Huang, G.: Stratosphere-to-troposphere transport revealed by ground-based lidar and ozonesonde at a midlatitude site, J. Geophys. Res., 117, D18305, https://doi.org/10.1029/2012JD017695, 2012.
Lelieveld, J. and Dentener, F. J.: What controls tropospheric ozone?, J. Geophys. Res., 105, 3531–3551, 2000.
Lin, M., Fiore, A. M., Horowitz, L. W., Cooper, O. R., Naik, V., Holloway, J., Johnson, B. J., Middlebrook, A. M., Oltmans, S. J., Pollack, I. B., Ryerson, T. B., Warner, J. X., Wiedinmyer, C., Wilson, J., and Wyman, B.: Transport of Asian ozone pollution into surface air over the western United States in spring, J. Geophys. Res., 117, D00V07, https://doi.org/10.1029/2011JD016961, 2012a.
Lin, M., Fiore, A. M., Cooper, O. R., Horowitz, L. W., Langford, A. O., Levy II, H., Johnson, B. J., Naik, V., Oltmans, S. J., and Senff, C. J.: Springtime high surface ozone events over the western United States: Quantifying the role of stratospheric intrusions, J. Geophys. Res., 117, D00V22, https://doi.org/10.1029/2012JD018151, 2012b.
Lin, M., Fiore, A. M., Horowitz, L. W., Langford, A. O., Oltmans, S. J., Tarasick, D., and Rieder, H. E.: Climate variability modulates western US ozone air quality in spring via deep stratospheric intrusions, Nat. Commun., 6, 7105, https://doi.org/10.1038/ncomms8105, 2015.
Logan, J. A.: Tropospheric ozone: Seasonal behavior, trends and anthropogenic influences, J. Geophys. Res., 90, 10463–10482, 1985.
Mathur, R., Xing, J., Gilliam, R., Sarwar, G., Hogrefe, C., Pleim, J., Pouliot, G., Roselle, S., Spero, T. L., Wong, D. C., and Young, J.: Extending the Community Multiscale Air Quality (CMAQ) modeling system to hemispheric scales: overview of process considerations and initial applications, Atmos. Chem. Phys., 17, 12449–12474, https://doi.org/10.5194/acp-17-12449-2017, 2017.
McCaffery, S. J., McKeen, S. A., Hsie, E.-Y., Parrish, D. D., Cooper, O. R., Holloway, J. S., Hubler, G., Fehsenfeld, F. C., and Trainer, M.: A case study of stratosphere-troposphere exchange during the 1996 North Atlantic Regional Experiment, J. Geophys. Res., 109, D14103, https://doi.org/10.1029/2003JD004007, 2004.
Morrison, H., Thompson, G., and Tatarskii, V.: Impacts of cloud microphysics on the development of trailing stratiform precipitation in a simulated squall line: comparison of one- and two-moment schemes, Mon. Weather Rev., 137, 991–1007, 2009.
National Centers for Environmental Prediction (NCEP): Final (FNL) Operational Global Analysis data, available at: available at: https://rda.ucar.edu/datasets/ds083.2/, last access: 15 October 2018.
National Oceanic and Atmospheric Administration (NOAA), Climate Prediction Center (CPC): available at: http://www.cpc.ncep.noaa.gov, last access: 10 October 2018.
National Oceanic and Atmospheric Administration (NOAA), Earth System Research Laboratory (ESRL), Global Monitoring Division (GMD): ESRL/GMD Ozonesondes: available at: https://www.esrl.noaa.gov/gmd/ozwv/ozsondes/, last access: 31 August 2018a.
National Oceanic and Atmospheric Administration (NOAA), Earth System Research Laboratory (ESRL), Global Monitoring Division (GMD): ESRL/GMD Tropospheric Aircraft Ozone Measurement Program, available at: https://www.esrl.noaa.gov/gmd/ozwv/aircraft/index.html, last access: 31 August 2018b.
National Aeronautics and Space Administration (NASA), Goddard Space Flight Center (GSFC): Chemistry and Dynamics Branch available at: https://acd-ext.gsfc.nasa.gov/Data_services/cloud_slice/index.html, last access: 31 August 2018a.
National Aeronautics and Space Administration (NASA), Goddard Earth Sciences Data and Information Services Center: GES DISC, available at: https://disc.gsfc.nasa.gov/datasets/OMTO3d_003/summary, last access: 31 August 2018b.
Otte, T. L. and Pleim, J. E.: The Meteorology-Chemistry Interface Processor (MCIP) for the CMAQ modeling system: updates through MCIPv3.4.1, Geosci. Model Dev., 3, 243–256, https://doi.org/10.5194/gmd-3-243-2010, 2010.
Pouliot, G., Denier van der Gon, H. A. C., Kuenen, J., Zhang, J., Moran, M. D., and Maker, P. A.: Analysis of the emission inventories and model-ready emission datasets of Europe and North America for phase 2 of the AQMEII project, Atmos. Environ., 115, 345–360, https://doi.org/10.1016/j.atmosenv.2014.10.061, 2015.
Price, C., Penner, J., and Prather, M.: NOx from lightning 1: Global distribution based on lightning physics, J. Geophys. Res., 102, 5929–5941, 1997.
Sarwar, G., Gantt, B., Schwede, D., Foley, K., Mathur, R., and Saiz-Lopez, A.: Impact of enhanced ozone deposition and halogen chemistry on tropospheric ozone over the Northern Hemisphere, Environ. Sci. Technol., 49, 9203–9211, https://doi.org/10.1021/acs.est.5b01657, 2015.
Simon, H. and Bhave, P. V.: Simulating the degree of oxidation in atmospheric organic particles, Environ. Sci. Technol., 46, 331–339. https://doi.org/10.1021/es202361w, 2012.
Simon, H., Reff, A., Wells, B., Xing, J., and Frank, N.: Ozone trends acriss the United States over a period of decreasing NOx and VOC emissons, Environ. Sci. Technol., 49, 186–195, https://doi.org/10.1021/es504514z, 2015.
Sitnov, S. A, Mokhov, I. I., and Lupo, A. R.: Ozone, water vapor, and temperature anomalies associated with atmospheric blocking events over Easytern Europei spring-summer 2010, Atmos. Environ., 164, 180–194, https://doi.org/10.1016/j.atmosenv.2017.06.004, 2017.
Uno, I., Eguchi, K., Yumimoto, K., Liu, Z., Hara, Y., Sugimoto, N., Shimizu, A., and Takemura, T.: Large Asian dust layers continuously reached North America in April 2010, Atmos. Chem. Phys., 11, 7333–7341, https://doi.org/10.5194/acp-11-7333-2011, 2011.
U.S. Environmental Protection Agency (EPA): Ground-level Ozone Pollution, available at: https://www.epa.gov/ozone-pollution/table-historical-ozone-national-ambient-air-quality-standards-naaqs, last access: 1 April 2018.
Environmental Protection Agency (EPA), Office of Research and Development (ORD): Community Multiscale Air Quality (CMAQ) Model Version 5.2, available at: https://github.com/USEPA/CMAQ/tree/5.2, 2017a.
U.S. Environmental Protection Agency (EPA), Office of Research and Development (ORD): CMAQ, https://doi.org/10.5281/zenodo.1167892, Washington, DC, USA, 2017b.
U.S. Environmental Protection Agency (EPA), Office of Research and Development (ORD): CMAQ: The Community Multiscale Air Quality Modeling System, available at: https://www.epa.gov/cmaq, last access: 3 March 2020.
Vautard, R., Moran, M. D., Solazzo, E., Gilliam, R. C., Matthias, V., Bianconi, R., Chemel, C., Ferreira, J., Geyer, B., Hansen, A. B., Jericevic, A., Prank, M., Segers, A., Silver, J. D., Werhahn, J., Wolke, R., Rao, S. T., and Galmarini, S.: Evaluation of the meteorological forcing used for the Air Quality Model Evaluation International Intiative (AQMEII) air quality simulations, Atmos. Environ., 53, 15–37, https://doi.org/10.1016/j.atmosenv.2011.10.065, 2012.
Wang, K., Zhang, Y., Jang, C., Phillips, S., and Wang, B.: Modeling intercontinental air pollution transport over the trans-Pacific region in 2001 using the Community Multiscale Air Quality modeling system, J. Geophys. Res., 114, D04307, https://doi.org/10.1029/2008JD010807, 2009.
Wernli, H. and Bourqui, M.: A Lagrangian “1-year climatology” of (deep) cross-tropopause exchange in the extratropical Northern Hemisphere, J. Geophys. Res., 107, 4021, https://doi.org/10.1029/2001JD000812, 2002.
World Data Centre for Greenhouse Gases (WDCGG): available at: http://ds.data.jma.go.jp/gmd/wdcgg/, last access: 26 April 2018.
World Meteorological Organization (WMO): International Meteorological Vocabulary, Secretariat of the World Meteorological Organization, Geneve, 2nd edn., 1992.
World Ozone and Ultraviolet Radiation Data Centre (WOUDC): Data Search/Download, available at: https://woudc.org/data/explore.php?lang=en, last access: 3 March 2020.
Xing, J., Mathur, R., Pleim, J., Hogrefe, C., Gan, C.-M., Wong, D. C., Wei, C., Gilliam, R., and Pouliot, G.: Observations and modeling of air quality trends over 1990–2010 across the Northern Hemisphere: China, the United States and Europe, Atmos. Chem. Phys., 15, 2723–2747, https://doi.org/10.5194/acp-15-2723-2015, 2015.
Xing, J., Mathur, R., Pleim, J., Hogrefe, C., Wang, J., Gan, C.-M., Sarwar, G., Wong, D. C., and McKeen, S.: Representing the effects of stratosphere–troposphere exchange on 3-D O3 distributions in chemistry transport models using a potential vorticity-based parameterization, Atmos. Chem. Phys., 16, 10865–10877, https://doi.org/10.5194/acp-16-10865-2016, 2016.
Zhang, L., Jacob, D. J., Boersma, K. F., Jaffe, D. A., Olson, J. R., Bowman, K. W., Worden, J. R., Thompson, A. M., Avery, M. A., Cohen, R. C., Dibb, J. E., Flock, F. M., Fuelberg, H. E., Huey, L. G., McMillan, W. W., Singh, H. B., and Weinheimer, A. J.: Transpacific transport of ozone pollution and the effect of recent Asian emission increases on air quality in North America: an integrated analysis using satellite, aircraft, ozonesonde, and surface observations, Atmos. Chem. Phys., 8, 6117–6136, https://doi.org/10.5194/acp-8-6117-2008, 2008.
Zhang, Y., Liu, P., Pun, B., and Seigneur, C.: A Comprehensive Performance Evaluation of MM5-CMAQ for the Summer 1999 Southern Oxidants Study Episode, Part-I. Evaluation Protocols, Databases and Meteorological Predictions, Atmos. Environ., 40, 4825–4838, https://doi.org/10.1016/j.atmosenv.2005.12.043, 2006.
Zhang, Y., Karamchandani, P., Glotfelty, T., Streets, D. G., Grell,G., Nenes, A., Yu, F.-Q., and Bennartz, R.: Development and Initial Application of the Global-Through-Urban Weather Research and Forecasting Model with Chemistry (GU-WRF/Chem), J. Geophys. Res., 117, D20206, https://doi.org/10.1029/2012JD017966, 2012.
Ziemke, J. R., Chandra, S., Duncan, B. N., Froidevaux, L., Bharita, P. K., Levelt, P. F., and Waters, J. W.: Tropospheric ozone determined from Aura OMI and MLS: Evaluation of measurements and comparison with the Global Modeling Initiative's Chemical Transport Model, J. Geophys. Res. Atmosphere, 111, D19303, https://doi.org/10.1029/2006JD007089, 2006.


