the Creative Commons Attribution 4.0 License.
the Creative Commons Attribution 4.0 License.
Examination of effects of aerosols on a pyroCb and their dependence on fire intensity and aerosol perturbation
George Kablick III
Zhanqing Li
Chang Hoon Jung
Yong-Sang Choi
Junshik Um
Won Jun Choi
Using a modeling framework, this study investigates how a pyrocumulonimbus (pyroCb) event influences water vapor concentrations and cirrus-cloud properties near the tropopause, specifically focusing on how fire-produced aerosols affect this role. Results from a case study show that when observed fire intensity is high, there is an insignificant impact of fire-produced aerosols on the development of the pyroCb and associated changes in water vapor and cirrus clouds near the tropopause. However, as fire intensity weakens, effects of those aerosols on microphysical variables and processes such as droplet size and autoconversion increase. Due to this, aerosol-induced invigoration of convection is significant for pyroCb with weak-intensity fires and associated weak surface heat fluxes. This leads to a situation where there is a greater aerosol effect on the transport of water vapor to the upper troposphere and the production of cirrus clouds with weak-intensity fires, whereas this effect is muted with strong-intensity fires.
- Article
(4600 KB) - Full-text XML
- BibTeX
- EndNote
Recent studies (e.g., Pumphrey et al., 2011; Kablick et al., 2018) have shown that pyrocumulonimbus (pyroCb) may transport significant amounts of water vapor to the upper troposphere and the lower stratosphere (UTLS) and can possibly have an impact on seasonal UTLS water vapor budgets. Any change in water vapor in the UTLS has an exceptionally strong influence on the global radiation budget and thus Earth's climate (Solomon et al., 2010). PyroCbs develop cirrus clouds associated with overshooting convective tops that reach the UTLS. Changes in cirrus clouds in the UTLS are known to have a strong influence on the global radiation budget (Solomon et al., 2010). The level of our understanding of impacts of pyroCbs on water vapor and cirrus clouds in the UTLS on a global scale is very low, and studies have been conducted to improve this understanding (Fromm et al., 2010). However, this paper does not focus on these pyroCb impacts at the global scale. Instead, this paper aims to gain a process-level understanding of mechanisms that control local impacts of individual pyroCbs on water vapor and cirrus clouds in the UTLS. The examination of these mechanisms can provide useful information to parameterize interactions among pyroCbs, water vapor and cirrus clouds in climate models.
PyroCbs initiate over a fire, and the large surface energy release mainly through fire-induced latent- and sensible-heat fluxes at and near the surface affects the dynamic, thermodynamic and microphysical development of pyroCbs (Fromm et al., 2010; Peterson et al., 2017). However, questions remain about what role the large concentration of cloud condensation nuclei (CCN) contained in smoke has on the vertical development and microphysical properties of pyroCbs. Studies (e.g., Koren et al., 2005, 2008; Rosenfeld et al., 2008; Storer et al., 2010; Tao et al., 2012) showed that aerosols affected cumulonimbus clouds, thus raising the possibility that fire-generated aerosols may affect pyroCb development. As an example of aerosol impacts on cumulonimbus clouds, these studies have demonstrated that increases in aerosol loading can decrease the size of droplets (i.e., cloud-liquid particles). Individual aerosol particles act as seeds for the formation of droplets, so increasing aerosol loading leads to more droplets formed. More droplets mean more competition among them for available water vapor needed for their condensational growth, decreasing the size of individual droplets (Twomey, 1977; Albrecht, 1989). Aerosol-induced smaller droplet sizes reduce the efficiency of the growth of cloud-liquid particles to raindrops via autoconversion, a collection process among cloud-liquid particles in which they become raindrops (Pruppacher and Klett, 1978; Rogers and Yau, 1991). This reduced efficiency leads to less cloud liquid converted to rain and thus more cloud liquid available for transport by updrafts to altitudes above the freezing level. This eventually induces more freezing of cloud liquid, enhanced parcel buoyancy and the invigoration of updrafts and associated convection (Koren et al., 2005, 2008; Rosenfeld et al., 2008).
The role of fire-generated aerosols in the development of pyroCbs and their effects on water vapor and cirrus clouds in the UTLS lacks firm scientific understanding, and hence this paper focuses on this role of these aerosols. To examine the role, this study extends the previous modeling work by Kablick et al. (2018). The modeling work therein showed that the effects of fire-generated aerosols on the development of a specific pyroCb and its impacts on the UTLS water vapor and cirrus clouds were negligible compared to the effects of fire-generated heat fluxes. However, aerosol effects on cloud development vary with cloud properties such as typical updraft speeds (e.g., Khain et al., 2008; Lee et al., 2008; Tao et al., 2012). For simplicity herein, an “updraft” refers to the general upward motion of convective air, or to the actual updraft speed representing the updraft or convective intensity, depending on the context. Typical updrafts are determined by environmental instability as represented by convective available potential energy (CAPE). Lee et al. (2008) demonstrated that different clouds with different typical updrafts showed a different sensitivity of cloud microphysical and thermodynamic development to aerosol concentration. Hence, it is hypothesized that aerosol effects on pyroCb development and its impacts on the UTLS water vapor and cirrus clouds vary depending on the typical pyroCb updraft.
To examine the potential variation of aerosol effects on pyroCb development and its impacts on the UTLS water vapor and cirrus clouds with typical updrafts of pyroCbs, numerical simulations are performed. Simulated is the pyroCb case examined by Kablick et al. (2018) using a cloud-system resolving model (CSRM). The CSRM is capable of resolving cloud-scale dynamic and thermodynamic processes. The basic modeling methodology in this study is similar to that used by Kablick et al. (2018). However, this study uses a more sophisticated microphysical scheme, i.e., a bin scheme, rather than the two-moment bulk scheme used by Kablick et al. (2018).
Note that Kablick et al. (2018) examined aerosol effects on the convective development of a specific pyroCb case with a typical updraft framework. The present study expands upon that work by performing sensitivity simulations in which typical updrafts in the pyroCb vary, enabling us to ascertain the dependence of aerosol effects on typical updrafts. Note that CAPE, which determines typical updrafts in convective clouds, is strongly dependent on surface latent and sensible heat fluxes (e.g., Houze, 1993), and in the case of pyroCbs, these fluxes are strongly controlled by fire intensity. Therefore, the present sensitivity simulations enable us to study the dependence of those aerosol effects on fire intensity. Since fire intensity is the dominant driver of the pyroCb typical updrafts, these are henceforth referred to as fire-driven updrafts.
The effects of fire-induced increases in aerosol concentration on pyroCbs are likely dependent on how much aerosol concentration increases (aerosol perturbation; e.g., Koren et al., 2005, 2008, 2012; Rosenfeld et al., 2008). This study examines this dependence, not studied by Kablick et al. (2018).
We use the Advanced Research Weather Research and Forecasting (ARW) model, a nonhydrostatic compressible model, as the CSRM. Prognostic microphysical variables are transported with a fifth-order monotonic advection scheme (Wang et al., 2009). Shortwave and longwave radiation is parameterized by the Rapid Radiation Transfer Model (RRTM; Mlawer et al., 1997; Fouquart and Bonnel, 1980).
To represent microphysical processes, the CSRM adopts a bin scheme based on the Hebrew University Cloud Model described by Khain (2009). The bin scheme solves a system of kinetic equations for the size distribution functions of water drops, ice crystals (plate, columnar and branch types), snow aggregates, graupel and hail, as well as cloud condensation nuclei (CCN) and ice nuclei (IN). Each size distribution is represented by 33 mass doubling bins, i.e., the mass of a particle mk in the kth bin is determined as mk=2 mk-1.
A cloud-droplet nucleation parameterization based on Köhler theory represents cloud-droplet nucleation. Arbitrary aerosol mixing states and aerosol size distributions can be fed to this parameterization. To represent heterogeneous ice-crystal nucleation, the parameterizations by Lohmann and Diehl (2006) and Möhler et al. (2006) are used. In these parameterizations, contact, immersion, condensation–freezing, and deposition nucleation paths are all considered by taking into account the size distribution of IN, temperature and supersaturation. Homogeneous aerosol (or haze particle) and droplet freezing are also considered following the theory developed by Koop et al. (2000).
3.1 Control run
The control run for an observed pyroCb case involved a forested site in the Canadian Northwest Territories (60.03∘ N, 115.45∘ W). Kablick et al. (2018) give details about the site and pyroCb case. The control run is identical to the Full Simulation in Kablick et al. (2018) except for the different microphysical schemes. The period covered by the control run is from 12:00 GMT on 5 August to 12:00 GMT on 6 August in 2014 and captures the initial, mature and decaying stages of the pyroCb. As described by Kablick et al. (2018), balloon soundings of winds, temperature and dew-point temperature were obtained every 6 h from the Fort Smith observation station near the forested site. Sounding data at 12:00 GMT on 5 August prescribe the initial atmospheric conditions. Temperature and humidity tendencies at each altitude from sequential soundings are obtained and applied to the control run every time step by interpolation in a horizontally homogeneous manner. These tendencies represent the impacts of synoptic- or large-scale motion on temperature and humidity (Grabowski et al., 1996; Lee et al., 2018). The control run is performed in a three-dimensional domain with horizontal and vertical extents of 300 and 20 km, respectively. The simulation horizontal and vertical resolutions are 500 and 200 m, respectively, to resolve cloud dynamic and thermodynamic processes.
Figure 1 shows a satellite image of the observed pyroCb and the fire spot (spatial length is ∼40 km) when the cloud is about to advance to its mature stage. To emulate this in the simulation, a fire spot with a diameter of 40 km is placed at the center of the simulation domain (Fig. 2). In the fire spot, the surface latent and sensible heat fluxes are set at 1800 and 15 000 W m−2, respectively. In areas outside of the fire spot, the surface latent and sensible heat fluxes are set at 310 and 150 W m−2, respectively. These surface heat-flux values follow previous studies which adopt boreal forest emissions (Trentmann et al., 2006; Luderer et al., 2006). Following Kablick et al. (2018), the surface heat-flux values are prescribed with no temporal variation and no consideration of interactions between heat fluxes and the atmosphere in the control run. Thus, the setup for the surface heat fluxes is idealized, enabling a better isolation of aerosol effects on pyroCb development and its impacts on the UTLS water vapor and cirrus clouds by excluding effects of interactions between the surface heat fluxes and atmosphere on this development and its impacts.
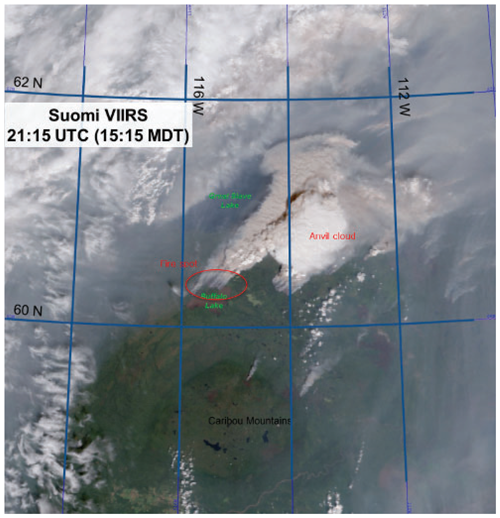
Figure 1Visible image of the fire, smoke and cirrus cloud in association with the selected pyroCb. This image was taken by the visible infrared imaging radiometer suite onboard the Suomi spacecraft. Bright white represents cirrus (anvil) at the top of the pyroCb, and the red circle marks the fire spot. Dark white represents smoke produced by the fire. Adapted from Kablick et al. (2018).
For the selected pyroCb case, aerosol chemical composition, size distribution and concentration are unknown. Hence, inside (outside) the fire spot at the first time step, the concentration of aerosols acting as CCN is prescribed to be 15 000 (150) cm−3. This prescription is for the planetary boundary layer (PBL) and the concentration decreases exponentially with height above the PBL top. These prescribed aerosol concentrations are typically observed over fire spots and their background (Pruppacher and Klett, 1978; Seinfeld and Pandis, 1998; Reid et al., 1999, 2005; Andreae et al., 2004; Luderer et al., 2009).
Reid et al. (2005) showed that aerosol mass produced by forest fires was generally composed of (by mass) ∼50 %–70 % organic-carbon (OC) compounds, ∼5 %–10 % black-carbon (BC) material and ∼20 %–45 % inorganic species. The approximate median value of each of these chemical component percentage ranges determines the aerosol particle composition in the control run, i.e., 60 % OC, 8 % BC and 32 % inorganic species. OC is assumed to be water soluble and composed of 18 % levoglucosan (C6H10O5, density = 1600 kg m−3, van 't Hoff factor = 1), 41 % succinic acid (C4H6O4, density = 1572 kg m−3, van 't Hoff factor = 3) and 41 % fulvic acid (C33H32O19, density = 1500 kg m−3, van 't Hoff factor = 5) based on typically observed chemical composition of OC compounds over fire sites (Reid et al., 2005). In the control run, the inorganic species is assumed to be ammonium sulfate, a representative inorganic species associated with fires (Reid et al., 2005). This chemical composition taken for aerosol particles is assumed to be spatiotemporally unvarying in the control run.
The control run adopts the unimodal lognormal distribution as an initial aerosol size distribution, a reasonable assumption for fire sites (Reid et al., 2005; Knobelspiessel et al., 2011; Lee et al., 2014). Those studies reported that in general, median and standard deviation aerosol diameters range from ∼0.01 to ∼0.03 µm and from ∼2.0 to ∼2.2 µm, respectively, for aerosols as CCN. The approximate median values of these ranges determine median and standard deviation diameters of aerosols as CCN in the control run, i.e., 0.02 and 2.1 µm, respectively. In the control run the IN and CCN aerosol properties are assumed to be identical except that at the first time step, (1) their median and standard deviation aerosol diameters differ, and (2) the IN concentration is 100 times lower than the CCN concentration (Pruppacher and Klett, 1978; Fan et al., 2014, 2017). Following Seinfeld and Pandis (1998) and Phillips et al. (2007), for aerosols as IN, median and standard deviation aerosol diameters are assumed to be 0.1 and 1.6 µm, respectively, which are typical values on the continent.
Airflow in clouds diffuses and advects aerosols. After activation or capture by precipitating hydrometeors, aerosols are transported within hydrometeors and removed from the atmosphere once these hydrometeors reach the surface. Once clouds disappear completely at any grid point, aerosol size distribution and number concentration recover to the background values at the first time step. This assumption simulates overall aerosol properties and their impacts on clouds and precipitation reasonably well (Morrison and Grabowski, 2011; Lebo and Morrison, 2014; Lee et al., 2016). This assumption means that fire continuously produces aerosols to maintain the initial background aerosol concentration.
Located to the northeast of the fire spot is the observed cirrus cloud at the top of the pyroCb, since winds advect the cloud northeastward (Fig. 1). The extent of the observed cirrus cloud is ∼100 km. Figure 2 shows the simulated field of cloud-ice mass density at the time that corresponds to the satellite image in Fig. 1, representing the simulated cirrus cloud in the control run. Located to the northeast of the fire spot is the simulated cirrus cloud, and the extent of this cloud is ∼100 km. The morphologies of the observed and simulated cirrus clouds agree well.
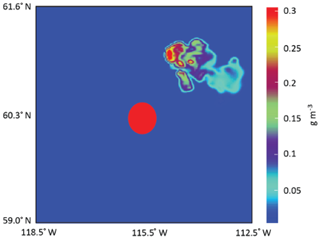
Figure 2The simulated fire spot (red circle) and the field of cloud-ice mass density (cirrus cloud) at the top of the simulated pyroCb when it is about to enter its mature stage.
The average liquid-water path (LWP) over areas with non-zero LWP in the control run is 960 g m−2, and the average ice-water path (IWP) over areas with non-zero IWP in the control run is 202 g m−2. These simulated LWP and IWP are ∼10 % different from the satellite-retrieved values. In this study, droplet mass, but not raindrop mass, is used to obtain liquid-water content (LWC) and LWP, and the mass of ice crystals, but not the mass of snow aggregates, graupel and hail, is used to obtain ice-water content (IWC) and IWP. Drops with radii smaller (greater) than 20 µm are classified as droplets (raindrops). The average cloud-top and cloud-base heights over the life span of the pyroCb are 10.3 and 3.6 km in the control run, respectively, and these simulated heights are ∼7 % different from the satellite-retrieved values. Overall, cloud macro-physical structures, as represented by LWP, IWP and cloud-top and cloud-base heights, are simulated reasonably well compared to the observation.
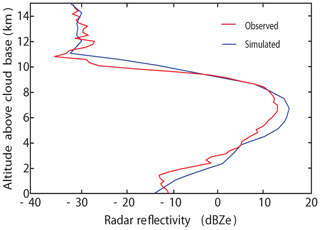
Compared are the control-run and observed reflectivity fields. Kablick et al. (2018) provide details about the reflectivity field observed by CloudSat. Observations and the control run both show increasing reflectivity up to ∼7 km, decreasing reflectivity between ∼7 and ∼11 km and insignificant changes in reflectivity above ∼11 km in altitude (Fig. 3). The average reflectivity over altitudes along the Cloudsat path in the control run is −8.1 dBZe, ∼15 % different from the observed value. Hence, the reflectivity field is simulated fairly well compared to the observation. These favorable comparisons between the observed and simulated cirrus clouds, cloud macro-physical and reflectivity fields demonstrate that the pyroCb-case simulation reasonably reproduces the event.
3.2 Low-aerosol run
To see the role played by fire-generated aerosols in the development of the pyroCb and its effects on the UTLS water vapor and cirrus clouds, we repeat the control run by reducing aerosol concentration inside the fire spot from 15 000 cm−3 to the background aerosol concentration (i.e., 150 cm−3). This reduction removes fire-generated aerosols inside the fire spot. Hence, comparisons between the control run and this repeated run, referred to as the low-aerosol run, will identify the role played by fire-generated aerosols. The low-aerosol run is identical to the Low Aerosol Simulation in Kablick et al. (2018) except for the different microphysical schemes between them.
3.3 Additional runs
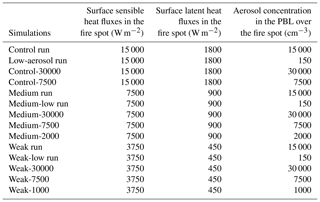
For the examination of the potential variation of effects of fire-generated aerosols on pyroCb development and its impacts on the UTLS water vapor and cirrus clouds with fire intensity and associated fire-driven updrafts, we repeat the control run by varying fire intensity. Remember that fire intensity controls surface latent and sensible heat fluxes on which fire-driven updrafts are strongly dependent. Therefore, variations in fire-induced surface latent and sensible heat fluxes can represent variations in fire intensity. As a first step, the control run is repeated by reducing fire-induced surface latent and sensible heat fluxes by factors of 2 and 4, respectively. The first repeated run represents a case with medium fire intensity, referred to as “the medium run”. The second repeated run represents a case with weak fire intensity, referred to as “the weak run”. Relative to these repeated runs, the control run represents a case with strong fire intensity. Then, to see effects of fire-generated aerosols on pyroCb development for each of those different fire intensities, the medium and weak runs are repeated with the identical initial aerosol concentration to that in the low-aerosol run. The repeated medium and weak runs are referred to as “the medium-low run” and “the weak-low run”, respectively. The control, medium and weak runs are the polluted-scenario runs, and the low-aerosol, medium-low and weak-low runs are the clean-scenario runs.
The effects of fire-generated aerosols on pyroCb development and its impacts on the UTLS water vapor and cirrus clouds can also depend on the magnitude of fire-induced increases in aerosol concentration in a fire spot. To test this dependence, for each fire intensity, we repeat the polluted-scenario run by increasing and decreasing the magnitude by a factor of 2 inside the fire spot but not outside of the fire spot. The simulations with the increased magnitude have an aerosol concentration of 30 000 cm−3 at the first time step over the fire spot in the PBL, referred to as the control-30000, medium-30000 and weak-30000 runs for strong, medium and weak fire intensities, respectively. The simulations with the decreased magnitude have an aerosol concentration of 7500 cm−3 at the first time step over the fire spot in the PBL, referred to as the control-7500, medium-7500 and weak-7500 runs for strong, medium and weak fire intensities, respectively. Motivated by the analysis described in Sect. 4.3, we additionally repeat the medium and weak runs with aerosol concentrations of 2000 and 1000 cm−3, respectively, at the first time step over the fire spot in the PBL. The repeated medium (weak) run is referred to as the medium-2000 (weak-1000) run. Table 1 summarizes the simulations.
The aerosol concentration of 30 000 cm−3 (7500, 2000 and 1000 cm−3) over the fire spot corresponds to a situation where fire produces a larger (lower) concentration of aerosols than what is typically observed, i.e., 10 000 to 20 000 cm−3 (Reid et al., 1999, 2005; Andreae et al., 2004; Luderer et al., 2009).
4.1 The control and low-aerosol runs
The updraft mass flux was averaged over the simulation period between 17:00 GMT on 5 August, approximately when the pyroCb started to form, and 12:00 GMT on 6 August (Fig. 4). The updraft mass flux is one of the most indicative variables of the upward air motion and magnitude of convective invigoration. Since the updraft mass flux is updraft speed multiplied by air density, and air density at each altitude varies negligibly, differences in updraft mass fluxes are mostly explained by those in updraft speeds among the simulations. Hence, with good confidence, differences in updraft mass fluxes mean those in updraft speeds.
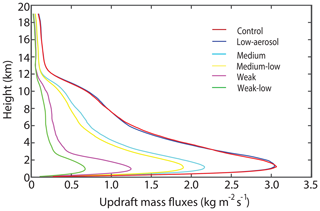
Figure 4Vertical distributions of the average updraft mass fluxes at all altitudes in cloudy areas (i.e., where the sum of LWC and IWC is non-zero) over the simulation period between 17:00 GMT on 5 August and 12:00 GMT on 6 August.
The upper troposphere is defined here to be between ∼9 km in altitude and the tropopause, which is ∼13 km in altitude. The equilibrium level where the buoyancy of a rising air parcel becomes zero above the level of free convection is the tropopause (Emanuel, 1994). The lower stratosphere is defined here to be between the tropopause and an altitude 10 km above the tropopause. The UTLS is thus between ∼9 and ∼23 km in this study. The defined upper troposphere and lower stratosphere occupy around a quarter of the total vertical extent of the troposphere and stratosphere, respectively.
Updraft mass fluxes in the control run are only ∼3 % greater than those in the low-aerosol run (Fig. 4 and Table 2). Given the 100-fold difference in aerosol loading over the fire spot between the runs, this 3 % difference in updraft fluxes is negligible. The comparison between water-vapor mass density over the cloudy and non-cloudy columns in the control run demonstrates that there is a substantial 5-fold increase in the amount of water vapor in the part of the UTLS at and above the tropopause due to the pyroCb (Fig. 5 and Table 2). Henceforth, the UTLS water vapor means water vapor in the part of the UTLS at and above the tropopause.
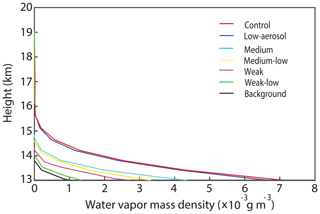
Figure 5Vertical distributions of the average water-vapor mass density at altitudes above 13 km and over the simulation period between 17:00 GMT on 5 August and 12:00 GMT on 6 August. Colored lines represent the average values over cloudy grid columns (non-zero sum of LWP and IWP). The black line represents those values over non-cloudy columns (zero sum of LWP and IWP) in the control run.
Table 2Shown here are the average updraft mass fluxes at all altitudes in cloudy areas, the average water-vapor mass density over altitudes between 13 and 16 km and over cloudy columns except for the average background water-vapor mass density which is also over altitudes between 13 and 16 km but over non-cloudy columns and the average cirrus-cloud mass density between 9 and 13 km in cloudy areas. The non-zero water-vapor mass density over cloudy columns extends to 16 km altitude (Fig. 5). These average values are obtained over the simulation period between 17:00 GMT on 5 August and 12:00 GMT on 6 August. “Difference” is the percentage difference between the polluted-scenario and clean-scenario runs for each fire intensity .

For the simulation period between 17:00 GMT on 5 August and 12:00 GMT on 6 August, the average water-vapor mass fluxes at the tropopause over cloudy and non-cloudy grid columns are and kg m−2 s−1, respectively. Due to the presence of the pyroCb and associated updrafts in cloudy grid columns, there are substantial increases in fluxes at the tropopause over cloudy grid columns compared to fluxes in the background over non-cloudy grid columns. This explains the larger amount of the UTLS water vapor over the pyroCb than in the background in the control run. The vertical extent of water vapor reaches further up to ∼16 km by the pyroCb beyond ∼14 km in the background (Fig. 5). This means that air parcels that include water vapor overshoot the tropopause by ∼3 km in the pyroCb, while those parcels in the background do so by ∼1 km. This implies that air parcels and associated updrafts in the pyroCb are stronger, reaching higher altitudes. Those stronger air parcels enable water-vapor layers to be deepened in the lower stratosphere. These deepened layers and their greater water-vapor mass contribute to more interception of longwave radiation by water vapor in the UTLS over the pyroCb.
Similar to the situation with updraft mass fluxes, there is only a small (∼2 %) increase in the average mass of the UTLS water vapor in the control run versus the low-aerosol run for strong fire intensity (Fig. 5 and Table 2). The small variation in updraft mass fluxes between the runs results in a small variation in the average water-vapor fluxes at the tropopause from kg m−2 s−1 in the control run to kg m−2 s−1 in the low-aerosol run over cloudy columns for the simulation period between 17:00 GMT on 5 August and 12:00 GMT on 6 August.
The altitude of homogeneous freezing is 9 km, so cirrus clouds composed of ice crystals (or cloud ice) are between 9 and 13 km in the control run (Fig. 6). The amount of cirrus clouds in the control run, represented by the average cloud-ice mass density, ranges from 0.028 to 0.037 g m−3 between 9 and 13 km (Fig. 6). The average cloud-ice number concentration and size, represented by ice-crystal volume mean radius, between 9 and 13 km range from 6 to 20 cm−3 and from 10 to 20 µm, respectively. Henceforth, “the UTLS cirrus clouds” refer to clouds in the upper troposphere.
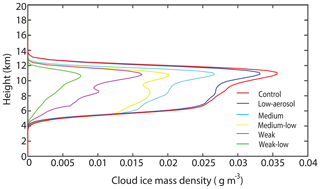
Figure 6Vertical distributions of the average cloud-ice mass density at all altitudes in cloudy areas (non-zero sum of LWC and IWC) over the simulation period between 17:00 GMT on 5 August and 12:00 GMT on 6 August.
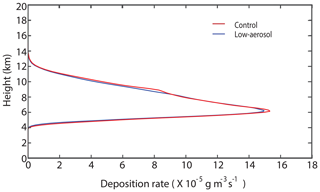
Updrafts produce supersaturation, which leads to the primary source of cloud-ice mass and associated cirrus clouds via deposition. Due to the negligible variation of updraft mass fluxes, there are negligible variations of supersaturation and deposition (Fig. 7). So, there is only a negligible increase (∼4 %) in UTLS cirrus-cloud mass in the control run compared to that in the low-aerosol run (Fig. 6 and Table 2). However, mainly due to larger aerosol concentrations, and associated greater homogeneous aerosol and droplet freezing, there is a significant, ∼20-fold increase in cloud-ice number concentration; associated with this is a significant, ∼2-fold decrease in cloud-ice size in the control run between 9 and 13 km.
In summary, the pyroCb and associated updrafts cause a substantial enhancement of the transport of water vapor to the UTLS at and above the tropopause. Wang (2019) also reported this enhancement. Using modeling work and satellite observation, Wang (2019) indicated that the upward transport of water vapor in deep convective storms was possibly a major pathway through which water substance entered the stratosphere. Wang (2019) showed that the upward transport of water vapor was aided by a gravity wave and its breaking in overshooting convective parcels. The pyroCb and its updrafts also produce cirrus clouds. The effects of fire-generated aerosols on the pyroCb updrafts, cirrus-cloud mass and the enhancement of the water vapor transport are insignificant when fire intensity is strong.
4.2 Dependence of aerosol effects on fire intensity
When fire-generated surface heat fluxes and fire intensity increase, in-cloud latent heat is also likely to increase because a major source of in-cloud latent heating is surface heat flux. Therefore, aerosol-induced perturbations of latent heating may be relatively small compared with large in-cloud latent heat contributed by surface fluxes with very intense burning. Thus, aerosol-induced increases in parcel buoyancy, updrafts and their impacts on water vapor and the amount of cirrus clouds are relatively small compared with the large buoyancy, strong fire-driven updrafts produced by strong fire intensity and their associated impacts on water vapor and the amount of cirrus clouds.
When fire intensity and fire-generated surface heat fluxes decrease, in-cloud latent heat is also likely to be smaller. Here, we are interested in how the magnitude of an aerosol-induced perturbation of latent heating for a pyroCb with weak fire intensity compares to that with strong fire intensity. This is to evaluate the possibility that with background in-cloud latent heat varying with fire intensity, the relative magnitudes of aerosol-induced perturbations of latent heat and surface flux-dominated latent heat may vary.
4.2.1 Effects of updrafts on the UTLS water vapor and cirrus clouds
The average updraft mass fluxes in the low-aerosol, medium-low and weak-low runs represent fire-driven updrafts for strong, medium and weak fire intensities, respectively (Fig. 4). Due to different fire intensity and associated CAPE, fire-driven updrafts vary between these runs. All weak, medium and strong fire intensity cases show aerosol-induced increases in updraft mass fluxes (Fig. 4 and Table 2). Of interest is that the greatest percentage increase in updraft mass flux is in the case of weak fire (weak-low to weak runs), the smallest increase is in the case of strong fire (low-aerosol to control runs), and intermediate increase is in the case of medium fire (medium-low to medium runs; Fig. 4 and Table 2). Here, the percentage difference, including both the percentage increase and decrease, is the relative difference in the value of variables between the polluted-scenario and clean-scenario runs for each fire intensity. The following equation determines this percentage difference for the strong fire intensity case:
Replacing the control run with the medium (weak) run, and the low-aerosol run with the medium-low (weak-low) run in Eq. (1) determines the percentage difference for the medium (weak) fire intensity case. Associated with the greater increases in updraft mass fluxes, the percentage increases in the UTLS water vapor and cloud-ice mass (Eq. 1) are greater in the case of weaker fire (Figs. 5 and 6 and Table 2).
In this section, we see that although fire-produced aerosols invigorate updrafts in all three types of fire intensity, the invigoration-induced increases in the UTLS water-vapor and cloud-ice mass increase as fire intensity weakens.
4.2.2 Volume mean radius of droplets (Rv)
Cloud droplet number concentration (Nd) and LWC
The simulation period is divided into four sub-periods for this next analysis: period 1 is between 17:00 and 19:00 GMT on 5 August (initial formation of the pyroCb), period 2 is between 19:00 and 21:00 GMT on 5 August, period 3 is between 21:00 and 23:00 GMT on 5 August (initial stages of cloud development) and period 4 between 23:00 GMT on 5 August and 12:00 GMT on 6 August (mature and decaying stages). The average Nd over period 1 decreases as the fire intensity and updrafts decrease (Fig. 8). The polluted-scenario run has higher aerosol concentrations over the fire spot (Table 1), leading to the much higher average Nd in the polluted-scenario run than in the clean-scenario run for each fire intensity. Increasing Nd enhances competition among droplets for a given amount of water vapor. Enhanced competition eventually curbs the condensational growth and reduces droplet size (Rv). This explains why the average Rv over period 1 is smaller in the polluted-scenario run (Fig. 8). Of interest is that as fire intensity weakens, although the average Nd decreases, the average Rv decreases not only among the polluted-scenario runs but also among the clean-scenario runs over the fire spot (Fig. 8). This is because Rv is proportional to based on Eq. (2):
Here, ρw represents water density at a constant value of 1000 kg m−3, so has a constant value. LWC represents the given amount of water available for the condensational growth of droplets. This proportionality means that for a given Nd, a decrease in LWC decreases Rv. The average LWC over period 1 also decreases with weakening fire intensity not only among the polluted-scenario runs but also among the clean-scenario runs (Fig. 8). The effects of LWC on Rv outweigh those of Nd, leading to the decrease in the average Rv with weakening fire intensity (Fig. 8).
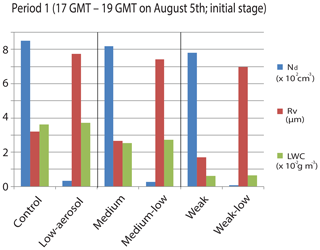
Figure 8Average Nd, Rv and LWC at all altitudes in cloudy areas over the period between 17:00 and 19:00 GMT on 5 August.
Using the average LWC and Nd from Fig. 8, decreases by from kg in the control run to kg in the weak run, while it decreases by from kg in the low-aerosol run to kg in the weak-low run. Associated with this, the average Rv shows a 47 % reduction from the control to weak runs, while it shows a 10 % reduction from the low-aerosol to weak-low runs during period 1 (Fig. 8).
In summary, the simulated LWC, Nd, their variations with fire intensity and the functional relation between LWC, Nd and Rv lead to a situation where Rv decreases much more among the polluted-scenario runs than among the clean-scenario runs during the period when the pyroCb initially forms.
Equilibrium supersaturation
During period 1, as fire intensity weakens and updraft speed decreases, parcel equilibrium supersaturation decreases and thus, the minimum size of activated aerosol particles increases not only among the clean-scenario runs but also among the polluted-scenario runs. When the production of parcel supersaturation by updrafts and the consumption of supersaturation by droplets balance out, parcel supersaturation reaches parcel equilibrium supersaturation (Rogers and Yau, 1991). Mostly due to greater aerosol concentrations, associated average equilibrium supersaturation and minimum size of activated aerosol particles over areas with positive updraft speeds and period 1 are lower and larger, respectively, in the polluted-scenario run than in the clean-scenario run for each fire intensity (Rogers and Yau, 1991).
The average equilibrium supersaturation decreases from 0.21 % in the control run to 0.10 % in the weak run. Associated with this, the average minimum diameter increases from 0.09 µm in the control run to 0.12 µm in the weak run over period 1. The average equilibrium supersaturation decreases from 0.55 % in the low-aerosol run to 0.31 % in the weak-low run, and the average minimum size increases from 0.04 µm in the low-aerosol run to 0.07 µm in the weak-low run over period 1.
The increase in the minimum activation size with weakening fire intensity occurs closer to the right tail of the assumed unimodal aerosol size distribution among the polluted-scenario runs than among the clean-scenario runs. A smaller portion of the total aerosol concentration is in the size range closer to the right tail of the distribution as long as the range is on the right-hand side of the distribution peak where most aerosol activation occurs. So, a similar increase in the average minimum activation size for a weakened fire results in a smaller percentage reduction in the total activated aerosol concentration and thus Nd among the polluted-scenario runs during period 1. The average Nd over period 1 decreases by 8 % from the control to weak runs. The average Nd decreases by 76 % from the low-aerosol to weak-low runs (Fig. 8). This contributes to a greater reduction in Rv as fire intensity weakens among the polluted-scenario runs during period 1. This is for a similar LWC between the polluted-scenario and clean-scenario runs for each fire intensity (Fig. 8).
In association with larger aerosol concentration and the assumed aerosol size distribution, a smaller percentage variation of the number of activated aerosols and Nd with fire intensity is simulated in the polluted-scenario runs than in the clean-scenario runs. This smaller variation of Nd aids the greater reduction in Rv among the polluted-scenario runs.
4.2.3 Autoconversion, freezing, deposition and condensation
Autoconversion is proportional to the size of cloud droplets (Pruppacher and Klett, 1978; Rogers and Yau, 1991; Khairoutdinov and Kogan, 2000; Liu and Daum, 2004; Lee and Baik, 2017). Due to the larger Rv during period 1, the subsequent average autoconversion rates over period 2 are higher in the clean-scenario run than in the polluted-scenario run for each fire intensity (Fig. 9a). Due to the larger absolute and percentage reduction in Rv among the polluted-scenario runs than among the clean-scenario runs with weakening fire intensity during period 2, the average autoconversion rates decrease by 74 % (14 %) from the control (low-aerosol) to weak (weak-low) runs (Fig. 9a). Associated with this, differences in the average autoconversion rates between the polluted-scenario and clean-scenario runs increase as fire intensity weakens during period 2 (Fig. 9a).
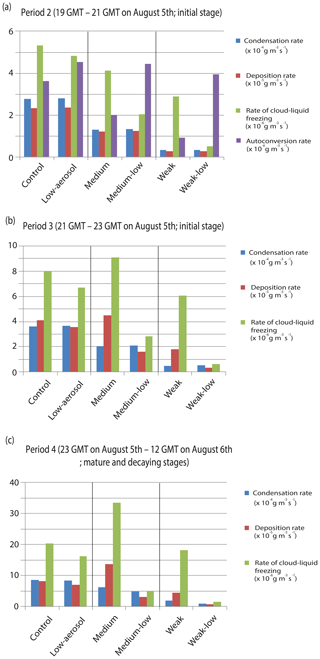
Figure 9Average rates of condensation, deposition and cloud-liquid freezing at all altitudes in cloudy areas and over periods (a) 2, (b) 3 and (c) 4. In panel (a), average autoconversion rates are also shown.
The increasing differences in autoconversion rates between the polluted-scenario and clean-scenario runs increase those differences in the amount of cloud liquid available for freezing with weakening fire intensity (Fig. 9a). Thus, differences in the average rate of cloud-liquid freezing and freezing-related latent heat over the period 2 between the runs increase with weakening fire intensity (Fig. 9a). Enhanced freezing-related latent heat strengthens updrafts in places where freezing occurs and this, in turn, enhances deposition and deposition-related latent heat (Lee et al., 2017). Although the average deposition over period 2 is slightly lower, those strengthened updrafts enable the average deposition and deposition-related latent heat to be greater in the polluted-scenario run than in the clean-scenario run for each fire intensity during period 3 (Fig. 9a and b). Differences in the average freezing rate (and thus the average freezing-related latent heating) between the runs do not change much up to ∼20:30 GMT (Fig. 10). However, after ∼20:30 GMT, these differences start to increase as time goes by for each fire intensity. This is because as convection intensifies, the transport of cloud liquid to places above the freezing level starts to be effective around 20:30 GMT. The greater freezing and thus freezing-related latent heat eventually cause updrafts to be stronger in the polluted-scenario run starting at ∼21:00 GMT (Fig. 10). Then, the stronger updrafts induce deposition to be greater in the polluted-scenario run around 21:10 GMT (Fig. 10). Note that deposition-related latent heat is about 1 order of magnitude greater than freezing-related latent heat for a unit mass of hydrometeors involved in phase-transition processes. This contributes to much greater differences in deposition-related latent heat during period 3 than those in freezing-related latent heat between the runs during period 2 or 3 (Fig. 9a and b).
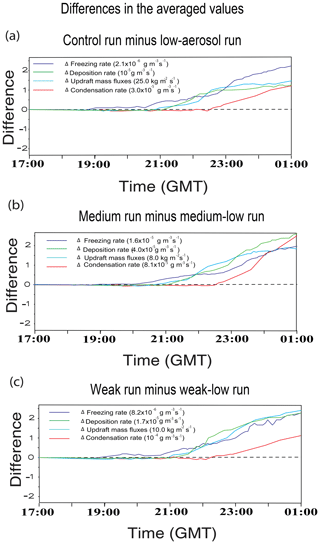
Figure 10Time series of differences in average values of variables related to aerosol-induced invigoration of convection at all altitudes in cloudy areas between the (a) control and low-aerosol runs for strong fire intensity, (b) medium and medium-low runs for medium fire intensity and (c) weak and weak-low runs for weak fire intensity.
To satisfy mass conservation, the freezing- and deposition-enhanced updrafts above the freezing level induce more updraft mass fluxes below the freezing level in the polluted-scenario run than in the clean-scenario run for each fire intensity. This leads to more convergence around and below the cloud base in the polluted-scenario run. The higher mass fluxes and convergence below the freezing level, in turn, increase condensation starting around 22:30 GMT in the polluted-scenario run (Fig. 10). This induces greater average condensation and condensation-related latent heat in the polluted-scenario run during period 4 (Fig. 9c). Enhanced condensation in turn enhances updrafts, establishing a positive feedback between freezing, deposition, condensation and updrafts, thus further enhancing freezing, deposition, condensation and updrafts. This enhancement, due to the feedback, eventually determines the overall differences in the pyroCb properties and their impacts on the UTLS water vapor and cloud ice between the runs.
Due to the increasing differences in freezing-related latent heat between the polluted-scenario and clean-scenario runs with weakening fire intensity during period 2, those differences in the average freezing-affected updrafts and subsequently in deposition-related latent heat over period 3 increase with weakening fire intensity (Figs. 9a, b and 10). Those differences, calculated using Eq. (1), in deposition-related latent heat are 16 %, 181 % and 417 % for strong, medium and weak fire intensities, respectively (Figs. 9b and 10). Since percentage increases in deposition-related latent heat increase, the subsequent percentage increases in updrafts in the polluted-scenario run increase with weakening fire intensity, particularly during period 3 (Fig. 10). During period 4, due to these greater increases in updrafts in the polluted-scenario run with weaker fire intensity, the percentage increases in condensation in the polluted-scenario run increase with weakening fire intensity (Figs. 9c and 10). The greater increases in condensation cause the greater further enhancement of the increases in updrafts in the polluted-scenario run with weaker fire intensity. This leads to the overall greater effects of fire-produced aerosols on the UTLS water vapor and ice with weaker fire intensity.
This section shows that the smaller Rv leads to lower autoconversion rates and a larger amount of cloud liquid as a source of freezing, which in turn induces higher freezing rates and stronger feedbacks between freezing, deposition, condensation and updrafts in the polluted-scenario run than in the clean-scenario run for each fire intensity. This results in stronger updrafts and their impacts on the UTLS water vapor and ice in the polluted-scenario run. The greater Rv reduction among the polluted-scenario runs than among the clean-scenario runs with weakening fire intensity increases the differences in autoconversion, freezing and the feedbacks between the polluted-scenario and clean-scenario runs as fire intensity weakens. This results in the greater impacts of aerosol-induced stronger updrafts on the UTLS water vapor and ice with weaker fire intensity.
4.3 Dependence of aerosol effects on the magnitude of aerosol perturbation
Table 3 shows that for each of the strong-, medium- and weak-fire cases, there are increases in the UTLS water-vapor and cirrus-cloud mass in the run with fire-induced aerosol perturbations of 30 000 or 7500 cm−3. These increases are relative to the mass in the low-aerosol run for the strong-fire case, in the medium-low run for the medium-fire case and in the weak-low run for the weak-fire case. Note that for each of the three types of fire-induced aerosol perturbations of 30 000, 15 000 and 7500 cm−3, aerosol-perturbation-induced percentage increases in the UTLS water-vapor and cirrus-cloud mass increase as fire intensity weakens (Tables 2 and 3). The qualitative nature of the results regarding the dependence of the percentage increases in the UTLS water-vapor and cirrus-cloud mass on fire intensity thus does not depend on the magnitude of the fire-induced aerosol perturbation.
Table 3Average water-vapor mass density between 13 and 16 km over cloudy columns and the average cirrus-cloud mass density between 9 and 13 km in cloudy areas over the simulation period between 17:00 GMT on 5 August and 12:00 GMT on 6 August. The numbers in parentheses are the percentage differences: for strong fire intensity, (%) for medium fire intensity and (%) for weak fire intensity.

Until now, we have taken interest in the sensitivity to fire intensity of an aerosol perturbation on pyroCb development, the UTLS water vapor and cirrus clouds. To isolate the sensitivity, we have shown comparisons among sensitivity simulations by varying only fire intensity while maintaining a constant aerosol perturbation. While working well for the isolation aspect, this strategy does not reflect reality well. It may be that weaker fire intensity produces a lower aerosol concentration. This possibility is not that unrealistic, since stronger fires likely involve more material burnt and higher aerosol emissions.
With this in mind, we make comparisons among three pairs of simulations: the low-aerosol and control-30000 runs for strong fire vs. the medium-low and medium runs for medium fire vs. the weak-low and weak-7500 runs for weak fire. Among these three pairs, the magnitude of the fire-induced aerosol perturbation decreases with weakening fire, emulating the possibility that weaker fire intensity involves a lower amount of aerosols. The perturbation-related aerosol concentration is 30 000 cm−3 for strong fire, 15 000 cm−3 for medium fire and 7500 cm−3 for weak fire. Comparisons among these three pairs show that relative importance of aerosol effects on pyroCb development and its impacts on the UTLS water vapor and cirrus clouds increase for weaker fires, and that it does not matter if the aerosol perturbation decreases or stays constant with weakening fire intensity (Tables 2 and 3). In these comparisons, it is also possible that when the fire-induced aerosol perturbation is very low for medium or weak fire intensity, the latent heat perturbation by aerosol perturbation can be very low. This very low latent heat is not large enough to increase the relative importance of those aerosol effects with weakening fire intensity. Based on this, the medium run is repeated with a fire-induced aerosol perturbation of 2000 cm−3 down from 15000 cm−3 (the medium-2000 run). The weak run is repeated with a fire-induced aerosol perturbation of 1000 cm−3 down from 7500 cm−3 (the weak-1000 run). The percentage increases in the UTLS water-vapor and cirrus-cloud mass from the medium-low to medium-2000 runs or from the weak-low to weak-1000 runs are smaller than the increases from the low-aerosol to control-30000 runs for the case of strong fire. This indicates that when the fire-induced aerosol perturbation decreases too much with weakening fire intensity, the relative importance of aerosol effects on pyroCb development and its impacts on the UTLS water vapor and cirrus clouds no longer increase with weakening fire intensity.
Results in this section show that the increasing impacts of the fire-induced aerosol perturbations on the UTLS water vapor and cirrus clouds with weakening fire intensity are robust whether or not aerosol perturbations vary with fire intensity unless their variation is extremely high.
This study investigates an observed case of a pyroCb using a modeling framework. In particular, this study focuses on effects of fire-produced aerosols on pyroCb development and its impacts on the UTLS water vapor and cirrus clouds. Results show that the pyroCb efficiently transports water vapor to the tropopause and above. This leads to a much greater amount of water vapor around and above the tropopause (i.e., the UTLS) over the pyroCb compared to that outside the pyroCb. The pyroCb also generates a deck of cirrus clouds around the tropopause. The role of fire-produced aerosols or the fire-induced aerosol perturbation in the water-vapor transport to the UTLS and the production of cirrus clouds becomes significant as fire intensity weakens.
During the initial stage, there is a similar LWC between the polluted-scenario and clean-scenario runs for each fire intensity. The reduction in LWC with weakening fire intensity among the polluted-scenario runs is similar to that among the clean-scenario runs. Much greater Nd is in the polluted-scenario run than in the clean-scenario run for each fire intensity. Nd decreases are smaller among the polluted-scenario runs than among the clean-scenario runs with weakening fire intensity. This situation during the initial stage induces Rv to decrease much more among the polluted-scenario runs with weakening fire intensity. This reduces autoconversion more among the polluted-scenario runs and increases differences in autoconversion between the polluted-scenario and clean-scenario runs as fire intensity weakens. The increasing differences in autoconversion between the runs cause greater differences in freezing-related latent heat as fire intensity weakens. Through feedback between freezing, deposition, updrafts and condensation, differences in freezing-related latent heat induce those in updrafts between the runs. Those greater differences in freezing-related latent heat lead to greater differences in updrafts, producing the greater differences in the UTLS water vapor and cirrus clouds between the runs with weaker fire intensity. This means that the role of fire-produced aerosols in the water-vapor transport to the UTLS and the production of cirrus clouds becomes more significant as fire intensity weakens. This more significant role of fire-produced aerosols with weaker fire intensity is robust to the magnitude of a given fire-induced aerosol perturbation, and the variation of the fire-induced aerosol perturbation with fire intensity unless the variation is very high.
The level of understanding of the role played by fire-produced aerosols in the development of pyroCbs and their impacts on the UTLS water vapor and cirrus clouds has been low. This study shows that fire-produced aerosols can invigorate updrafts and convection and thus enhance the transport of water vapor to the UTLS and the formation of cirrus clouds. We find that the mechanism that controls the invigoration of convection by aerosols in the pyroCb is consistent with the traditional invigoration mechanism proposed and described by Koren et al. (2005, 2008) and Rosenfeld et al. (2008). However, this study shows that for pyroCbs produced by strong fires, the aerosol-induced invigoration and its effects on the UTLS water vapor and cirrus clouds are insignificant. Note that traditional understanding generally focuses on the effects of fire-produced heat and water vapor and their associated surface fluxes on the pyroCb and does not consider the effects of fire-produced aerosols on the pyroCb. This understanding adequately explains the mechanics for pyroCbs in association with strong fires. This study suggests that when pyroCbs form over weak-intensity fires, those effects of fire-produced aerosols require consideration.
Note that when fire-induced aerosol perturbations are strongly reduced for cases of weaker-intensity fires compared with strong-intensity fires, the significance of the role of the fire-produced aerosol perturbation no longer increases and starts to decrease with weakening fire. This suggests that there may be a critical level of aerosol perturbation below which the increase in this significance with weakening fire intensity ceases.
The data used are currently private and stored in our private computer system. Opening the data to the public requires approval from funding sources. Since funding projects associated with this work are still going on, these sources do not allow the data to be open to the public; 2–3 years after these project ends, the data can be open to the public. However, if there is any inquiry about the data, contact the corresponding author: Seoung Soo Lee (slee1247@umd.edu).
SSL generated the research ideas and goals, performed the simulations and wrote the manuscript. GK and ZL selected the case, analyzed observations and provided data to set up the simulations while reviewing and providing comments on the manuscript. CHJ, YSC, JU and WJC revised the manuscript based on the reviewers' comments and performed associated analyses of simulation and observation data.
The authors declare that they have no conflict of interest.
The authors would like to express their gratitude for the valuable comments made by the two anonymous referees.
This research has been supported by the National Aeronautics and Space Administration (grant nos. 80NSSC20K0131 and NNX16AN61G), the National Science Foundation (grant no. AGS 1837811), the National Strategic Project-Fine particle of the National Research Foundation of Korea, funded by the Ministry of Science and ICT, the Ministry of Environment, the Ministry of Health and Welfare (grant no. NRF-2017M3D8A1092022), and the Ministry of Education (grant no. NRF-2018R1D1A1A09083227), and the National Institute of Environmental Research funded by the Ministry of Environment (grant no. NIER-2019-01-02-085). This research has also been supported by the National Research Foundation of Korea (NRF) grant funded by the South Korean government (MSIT) (grant no. NRF2020R1A2C1003215) and the “Construction of Ocean Research Stations and their Application Studies” project, funded by the Ministry of Oceans and Fisheries, South Korea.
This paper was edited by Graham Feingold and reviewed by two anonymous referees.
Albrecht, B. A.: Aerosols, cloud microphysics, and fractional cloudiness, Science, 245, 1227–1230, 1989.
Andreae, M. O., Rosenfeld, D., Artaxo, P., Costa, A. A., Frank, G. P., Longo, K. M., and Silva-Dias, M. A. F.: Smoking rain clouds over the Amazon, Science, 303, 1337–1342, 2004.
Emanuel, K.: Atmospheric convection, Oxford University Press, 580 pp., 1994.
Fan, J., Leung, L. R., DeMott, P. J., Comstock, J. M., Singh, B., Rosenfeld, D., Tomlinson, J. M., White, A., Prather, K. A., Minnis, P., Ayers, J. K., and Min, Q.: Aerosol impacts on California winter clouds and precipitation during CalWater 2011: local pollution versus long-range transported dust, Atmos. Chem. Phys., 14, 81–101, https://doi.org/10.5194/acp-14-81-2014, 2014.
Fan, J., Leung, L. R., Rosenfeld, D., and DeMott, P. J.: Effects of cloud condensation nuclei and ice nucleating particles on precipitation processes and supercooled liquid in mixed-phase orographic clouds, Atmos. Chem. Phys., 17, 1017–1035, https://doi.org/10.5194/acp-17-1017-2017, 2017.
Fouquart, Y. and Bonnel, B.: Computation of solar heating of the Earth's atmosphere: a new parameterization, Beitr. Phys. Atmos., 53, 35–62, 1980.
Fromm, M., Lindsey, D. T., Servranckx, R., Yue, G., Trickl, T., Sica, R., Doucet, P., and Godin-Beekmann, S.: The untold story of pyrocumulonimbus, B. Am. Meteorol. Soc., 91, 1193, https://doi.org/10.1175/2010BAMS3004.1, 2010.
Grabowski, W. W., Wu, X., and Moncrieff, M. W.: Cloud resolving modeling of tropical cloud systems during phase III of GATE. Part I: Two-dimensional experiments, J. Atmos. Sci., 53, 3684–3709, 1996.
Houze, R. A.: Cloud Dynamics, Academic Press, 573 pp., 1993.
Kablick, G., Fromm, M., Miller, S., Partain, P., Peterson. D., Lee, S. S., Zhang, Y., Lambert, A., and Li, Z.: The Great Slave Lake pyroCb of 5 August 2014: observations, simulations, comparisons with regular convection, and impact on UTLS water vapor, J. Geophy. Res., 123, 12332–12352, https://doi.org/10.1029/2018JD028965, 2018.
Khain, A.: Notes on state-of-the-art investigations of aerosol effects on precipitation: a critical review, Environ. Res. Lett., 4, 015004, https://doi.org/10.1088/1748-9326/4/1/015004, 2009.
Khain, A., BenMoshe, N., and Pokrovsky, A.: Factors determining the impact of aerosols on surface precipitation from clouds: Attempt of classification, J. Atmos. Sci., 65, 1721–1748, 2008.
Khairoutdinov, M. and Kogan, Y.: A new cloud physics parameterization in a large-eddy simulation model of marine stratocumulus, Mon. Weather Rev., 128, 229–243, 2000.
Knobelspiesse, K., Cairns, B., Ottaviani, M., Ferrare, R., Hair, J., Hostetler, C., Obland, M., Rogers, R., Redemann, J., Shinozuka, Y., Clarke, A., Freitag, S., Howell, S., Kapustin, V., and McNaughton, C.: Combined retrievals of boreal forest fire aerosol properties with a polarimeter and lidar, Atmos. Chem. Phys., 11, 7045–7067, https://doi.org/10.5194/acp-11-7045-2011, 2011.
Koop, T., Luo, B. P, Tsias, A., and Peter, T.: Water activity as the determinant for homogeneous ice nucleation in aqueous solutions, Nature, 406, 611–614. 2000.
Koren, I., Kaufman, Y. J., Rosenfeld, D., Remer, L. A., and Rudich, Y.: Aerosol invigoration and restricting of Atlantic convective clouds, Geophys. Res. Lett., 32, L14828, https://doi.org/10.1029/2005GL023187, 2005.
Koren I., Martins, J. V., Remer, L. A., and Afargan, H.: Smoke invigoration versus inhibition of clouds over the Amazon, Science, 321, 946–949, 2008.
Koren, I., Altaratz, O., Remer, L. A., Feingold, G., Martins, J. V., and Heiblum, R. H.: Aerosol-induced intensification of rain from the tropics to the mid-latitudes, Nat. Geosci., 5, 118–122, 2012.
Lebo, Z. J. and Morrison, H.: Effects of horizontal and vertical grid spacing on mixing in simulated squall lines and implications for convective strength and structure, Mon. Weather Rev., 143, 4355–4375, 2014.
Lee, H. and Baik, J.-J.: A physically based autoconversion parameterization, J. Atmos. Sci., 74, 1599–1615, 2017.
Lee, S. S., Donner, L. J., Phillips, V. T. J., and Ming, Y.: The dependence of aerosol effects on clouds and precipitation on cloud-system organization, shear and stability, J. Geophys. Res., 113, D16202, https://doi.org/10.1029/2007JD009224, 2008.
Lee, S. S., Feingold, G., Koren, I., Yu, H., Yamaguchi, T., and McComiskey, A.: Effect of gradients in biomass burning aerosol on circulations and clouds, J. Geophys. Res., 119, 9948–9964, 2014.
Lee, S. S., Kim, B. -G., Yum, S. S., Seo, K.-H., Jung, C.-H., Um, J., Li, Z., Hong, J., Chang, K.-H., and Jeong, J.-Y.: Effect of aerosol on evaporation, freezing and precipitation in a multiple cloud system, Clim. Dynam., 48, 1069–1087, 2016.
Lee, S. S., Li, Z., Mok, J., Ahn, M.-H., Kim, B.-G., Choi, Y.-S., Jung, C.-H., and Yoo, H. L.: Interactions between aerosol absorption, thermodynamics, dynamics, and microphysics and their impacts on clouds and precipitation in a multiple-cloud system, Clim. Dynam., 49, 3905–3921, 2017.
Lee, S. S., Kim, B.-G., Nam, H.-G., Yum, S. S., Choi, Y. S., and Jung, C.-H.: Factors that control heavy snowfalls in the eastern coast of Korea, Terr. Atmos. Ocean. Sci., 29, 301–304, 2018.
Liu, Y. and Daum, P. H.: Parameterization of the autoconversion process. Part I: Analytical formulation of the Kessler-type parameterizations, J. Atmos. Sci., 61, 1539–1548, 2004.
Lohmann, U. and Diehl, K.: Sensitivity studies of the importance of dust ice nuclei for the indirect aerosol effect on stratiform mixed-phase clouds, J. Atmos. Sci., 63, 968–982, 2006.
Luderer, G., Trentmann, J., Winterrath, T., Textor, C., Herzog, M., Graf, H. F., and Andreae, M. O.: Modeling of biomass smoke injection into the lower stratosphere by a large forest fire (Part II): sensitivity studies, Atmos. Chem. Phys., 6, 5261–5277, https://doi.org/10.5194/acp-6-5261-2006, 2006.
Luderer, G., Trentmann, J., and Andreae, M.: A new look at the role of fire-released moisture on the dynamics of atmospheric pyro-convection, Int. J. Wildland Fire, 18, 554–562, 2009.
Mlawer, E. J., Taubman, S. J., Brown, P. D., Iacono, M. J., and Clough, S. A.: RRTM, a validated correlated-k model for the longwave, J. Geophys. Res., 102, 1663–1668, 1997.
Möhler, O., Field, P. R., Connolly, P., Benz, S., Saathoff, H., Schnaiter, M., Wagner, R., Cotton, R., Krämer, M., Mangold, A., and Heymsfield, A. J.: Efficiency of the deposition mode ice nucleation on mineral dust particles, Atmos. Chem. Phys., 6, 3007–3021, https://doi.org/10.5194/acp-6-3007-2006, 2006.
Morrison, H. and Grabowski, W. W.: Cloud-system resolving model simulations of aerosol indirect effects on tropical deep convection and its thermodynamic environment, Atmos. Chem. Phys., 11, 10503–10523, https://doi.org/10.5194/acp-11-10503-2011, 2011.
Peterson, D., Fromm, M., Solbrig, J., Hyer, E., Surratt, M., and Campbell, J.: Detection and inventory of intense pyroconvection in western North America using GOES-15 daytime infrared data, J. Appl. Meteorol. Clim., 56, 471–493, 2017.
Phillips, V. T. J., Donner, L. J., and Garner, S.: Nucleation processes in deep convection simulated by a cloud-system-resolving model with double-moment bulk microphysics, J. Atrmos. Sci., 64, 738–761, 2007.
Pruppacher, H. R. and Klett, J. D.: Microphysics of clouds and precipitation, 714 pp., Reidel D., 1978.
Pumphrey, H. C., Santee, M. L., Livesey, N. J., Schwartz, M. J., and Read, W. G.: Microwave Limb Sounder observations of biomass-burning products from the Australian bush fires of February 2009, Atmos. Chem. Phys., 11, 6285–6296, https://doi.org/10.5194/acp-11-6285-2011, 2011.
Reid, J. S., Hobbs, P. V., Rangno, A. L., and Hegg, D. A.: Relationships between cloud droplet effective radius, liquid water content, and droplet concentration for warm clouds in Brazil embedded in biomass smoke, J. Geophys. Res., 104, 6145–6153, 1999.
Reid, J. S., Koppmann, R., Eck, T. F., and Eleuterio, D. P.: A review of biomass burning emissions part II: intensive physical properties of biomass burning particles, Atmos. Chem. Phys., 5, 799–825, https://doi.org/10.5194/acp-5-799-2005, 2005.
Rogers, R. R. and Yau, M. K.: A short course in cloud physics, Pergamon Press, 293 pp., 1991.
Rosenfeld, D., Lohmann, U., Raga, G. B., O'Dowd, C. D., Kulmala, M., Fuzzi, S., Reissell, A., and Andreae, M. O.: Flood or drought: How do aerosols affect precipitation?, Science, 321, 1309–1313, 2008.
Seinfeld, J. H. and Pandis, S. N.: Atmospheric Chemistry and Physics: From Air Pollution to Climate Change, John Wiley & Sons, 1326 pp., 1998.
Solomon, S., Rosenlof, K. H., Portmann, R. W., Daniel, J. S., Davis, S. M., Sanford, T. J., and Plattner, G. K.: Contributions of stratospheric water vapor to decadal changes in the rate of global warming, Science, 327, 1219–1223, 2010.
Storer, R. L., van den Heever, S. C., and Stephens, G. L.: Modeling aerosol impacts on convection under differing storm environments, J. Atmos. Sci., 67, 3904–3915, 2010.
Tao, W.-K., Chen, J.-P., Li, Z., Wang, C., and Zhang, C.: Impact of aerosols on convective clouds and precipitation, Rev. Geophys., 50, RG2001, https://doi.org/10.1029/2011RG000369, 2012.
Trentmann, J., Luderer, G., Winterrath, T., Fromm, M. D., Servranckx, R., Textor, C., Herzog, M., Graf, H.-F., and Andreae, M. O.: Modeling of biomass smoke injection into the lower stratosphere by a large forest fire (Part I): reference simulation, Atmos. Chem. Phys., 6, 5247–5260, https://doi.org/10.5194/acp-6-5247-2006, 2006.
Twomey, S.: The influence of pollution on the shortwave albedo of clouds, J. Atmos. Sci., 34, 1149–1152, 1977.
Wang, H., Skamarock, W. C., and Feingold, G.: Evaluation of scalar advection schemes in the Advanced Research WRF model using large-eddy simulations of aerosol-cloud interactions, Mon. Weather Rev., 137, 2547–2558, 2009.
Wang, P.: Is the Transport by deep convective storms the major source of stratospheric water vapor?, 99th Annual Meeting, American Meteorological Society, available at: https://ams.confex.com/ams/2019Annual/webprogram/Paper354897.html (last access: 18 March 2020), 2019.


