the Creative Commons Attribution 4.0 License.
the Creative Commons Attribution 4.0 License.
 | 19 Mar 2020
Improved 1 km resolution PM2.5 estimates across China using enhanced space–time extremely randomized trees
Maureen Cribb
Wei Huang
Wenhao Xue
Lin Sun
Jianping Guo
Yiran Peng
Alexei Lyapustin
Lei Liu
Yimeng Song
Fine particulate matter with aerodynamic diameters ≤2.5 µm (PM2.5) has adverse effects on human health and the atmospheric environment. The estimation of surface PM2.5 concentrations has made intensive use of satellite-derived aerosol products. However, it has been a great challenge to obtain high-quality and high-resolution PM2.5 data from both ground and satellite observations, which is essential to monitor air pollution over small-scale areas such as metropolitan regions. Here, the space–time extremely randomized trees (STET) model was enhanced by integrating updated spatiotemporal information and additional auxiliary data to improve the spatial resolution and overall accuracy of PM2.5 estimates across China. To this end, the newly released Moderate Resolution Imaging Spectroradiometer Multi-Angle Implementation of Atmospheric Correction AOD product, along with meteorological, topographical and land-use data and pollution emissions, was input to the STET model, and daily 1 km PM2.5 maps for 2018 covering mainland China were produced. The STET model performed well, with a high out-of-sample (out-of-station) cross-validation coefficient of determination (R2) of 0.89 (0.88), a low root-mean-square error of 10.33 (10.93) µg m−3, a small mean absolute error of 6.69 (7.15) µg m−3 and a small mean relative error of 21.28 % (23.69 %). In particular, the model captured well the PM2.5 concentrations at both regional and individual site scales. The North China Plain, the Sichuan Basin and Xinjiang Province always featured high PM2.5 pollution levels, especially in winter. The STET model outperformed most models presented in previous related studies, with a strong predictive power (e.g., monthly R2=0.80), which can be used to estimate historical PM2.5 records. More importantly, this study provides a new approach for obtaining high-resolution and high-quality PM2.5 dataset across mainland China (i.e., ChinaHighPM2.5), important for air pollution studies focused on urban areas.
- Article
(7691 KB) - Full-text XML
- BibTeX
- EndNote


Atmospheric particulate matter is a general term describing all kinds of solid and liquid particles in the atmosphere. Fine particles are those particles in ambient air with aerodynamic diameters of no more than 2.5 µm (PM2.5). Compared to coarser particles, PM2.5 is rich in toxic and harmful substances and can directly enter the respiratory tract and alveoli of humans. Moreover, they have a long residence time and long transmission distance in the atmosphere (Aggarwal and Jain, 2015). Numerous studies have illustrated that high PM2.5 concentrations adversely affect human health (Peng et al., 2009; Bartell et al., 2013; Chowdhury and Dey, 2016; Crippa et al., 2019; Song et al., 2019), severely impair the atmospheric environment (Z. Li et al., 2017), and significantly influence cloud and precipitation systems through aerosol radiative and microphysical effects (Koren et al., 2014; Seinfeld et al., 2016). Silva et al. (2013) showed that about 2.1 million people have died each year, resulting from increasing PM2.5 concentrations around the world.
Nowadays, air pollution is becoming more severe due to continuously increasing anthropogenic aerosols in developing countries, especially in China (He et al., 2011; Huang et al., 2014; Liu et al., 2017; Zhai et al., 2019). Fine particulate matter has become the primary pollutant in urban environments, garnering much scrutiny from the public (Han et al., 2014; Sun et al., 2016; Wu et al., 2018). Therefore, the China Meteorological Administration established a ground PM2.5 observation network to monitor the urban air quality in 2004 (Guo et al., 2009), followed by a denser network established by the Chinese Ministry of Environmental Protection in 2013. However, station-based monitoring is largely limited by the instruments and climatic conditions and cannot completely characterize air pollution over large areas. Satellite remote sensing technology has led to a variety of operational aerosol optical depth (AOD) products (Levy et al., 2013; Lyapustin et al., 2018), leading to estimates of PM2.5 on large scales due to the positive relationship between AOD and PM2.5 concentration (Guo et al., 2017).
Over the years, numerous approaches have been proposed to improve the PM2.5–AOD relationship. Physical models typically construct physical relationships between surface particulate matter concentrations and satellite AOD products through altitude and humidity corrections (Zhang and Li, 2015). Statistical regression models, e.g., the multiple linear regression model, the linear mixed-effect model, the two-stage model and the geographically weighted regression (GWR) model, have been widely used for applications due to their simplicity and versatility (Gupta and Christopher, 2009; Ma et al., 2014; Xiao et al., 2017; Yao et al., 2019). Artificial intelligence models mainly involve machine learning and deep learning models, e.g., the random forest (RF; Brokamp et al., 2018; Chen et al., 2018; Wei et al., 2019a), the extreme gradient boosting model (XGBoost; Chen et al., 2019), and the back-propagation and generalized regression neural networks (BRNN and GRNN; T. Li et al., 2017a).
PM2.5 is jointly affected by numerous factors, e.g., meteorological conditions, human activities and topography, showing great spatial and temporal heterogeneities. This makes it difficult for traditional physical and statistical regression approaches to accurately explain and construct PM2.5–AOD relationships, leading to poor PM2.5 estimates. Despite their stronger data mining ability, most artificial intelligence approaches have been simplistically adopted in PM2.5 predictions, neglecting the spatiotemporal characteristics of PM2.5 (Brokamp et al., 2018; Chen et al., 2018, 2019; T. Li et al., 2017a; Xue et al., 2019). Furthermore, deep learning is highly dependent on the performance of a computer and is less computationally efficient. In addition, most widely used aerosol products are generated at low spatial resolutions (3–50 km), a serious limitation for applications over small-scale regions such as urban areas.
To account for the spatiotemporal heterogeneity of PM2.5, the space–time extremely randomized trees (STET) model developed in our previous study for estimating PM1 (Wei et al., 2019b) is adopted here with further refinements for improving the estimation of PM2.5 using the high-spatial-resolution (1 km) Moderate Resolution Imaging Spectroradiometer (MODIS) Multi-Angle Implementation of Atmospheric Correction (MAIAC) AOD product. Note that PM1 and PM2.5 emission sources, formation and transport mechanisms, and health impacts differ. Their spatial patterns and distributions also differ, and their particle ratio varies greatly, ranging from less than 0.5 to greater than 0.9 at both spatial and temporal scales, especially in highly polluted regions, as in China (Wei et al., 2019b). The STET model has been improved by using corrected AODs, adding pollutant emissions, updating the feature selection and improving the determination of spatiotemporal information. Based on this, spatially continuous high-resolution and high-quality PM2.5 dataset across mainland China (i.e., ChinaHighPM2.5) in 2018 are generated from the MODIS MAIAC AOD product at a 1 km resolution using meteorological, land-use, topographic, population and emission parameters. Section 2 describes the data sources and integration. Section 3 introduces the enhanced STET model in detail, and Sect. 4 presents the validation and comparison of our PM2.5 estimates across China. Section 5 compares our model with those models developed in previous related studies, and Sect. 6 gives a summary and conclusions.
2.1 PM2.5 ground measurements
Hourly in situ PM2.5 observations at 1583 monitoring stations (Fig. 1) across mainland China from 1 January 2017 to 31 December 2018 were collected then averaged to obtain daily mean PM2.5 measurements. PM2.5 observations are measured using the tapered element oscillating microbalance approach or β-attenuation monitors that have undergone further calibration and strict quality control procedures (Guo et al., 2009).

Figure 1Spatial distributions of PM2.5 and AERONET monitoring stations in China. The Heihe–Tengchong line (orange line) shows the boundary between eastern and western China.
2.2 MAIAC AOD product
The MAIAC algorithm was developed to generate MODIS aerosol products from the darkest to the brightest surfaces at a 1 km spatial resolution over land (Lyapustin et al., 2011). On 30 May 2018, official 1 km resolution MAIAC aerosol products were released and made freely available to all users. This dataset is produced using the revised MAIAC algorithm with continuous improvements in scale transition using spectral regression coefficients, cloud detection, determination of aerosol models, over-water processing and general optimization in the global aerosol retrieval process (Lyapustin et al., 2018). MAIAC daily aerosol products from the Terra and Aqua satellites were collected from 2017 to 2018 across China, and 550 nm AOD retrievals with high quality assurance (QACloudMask= Clear and QAAdjacencyMask= Clear) were used.
Here, the MAIAC AOD retrievals were first evaluated against surface observations at 18 AERONET monitoring stations in China (Fig. 1) using the spatiotemporal matching approach (Wei et al., 2019c, d). MAIAC AOD retrievals are highly accurate, with small estimation errors across mainland China. More than 84 % of the matchups satisfy the MODIS expected error (Levy et al., 2013) at the national scale (Fig. 2a). Besides vegetated surfaces, e.g., cropland and grassland, the MAIAC algorithm shows considerable accuracy over heterogeneous urban surfaces (Fig. 2b). MAIAC AOD products are more accurate and less biased than the widely used Dark Target (DT) and Deep Blue products at coarse spatial resolutions (Liu et al., 2019; Wei et al., 2019e; Tao et al., 2019; Zhang et al., 2019). More importantly, the DT algorithm generates a large number of missing values over bright surfaces, and aerosol loadings are significantly overestimated over heterogeneous urban surfaces (Levy et al., 2013; Wei and Sun, 2017; Wei et al., 2018a, b, 2019e). Therefore, higher-data-quality and higher-spatial-resolution MAIAC products, which can generate more accurate and detailed PM2.5 estimates, are selected.
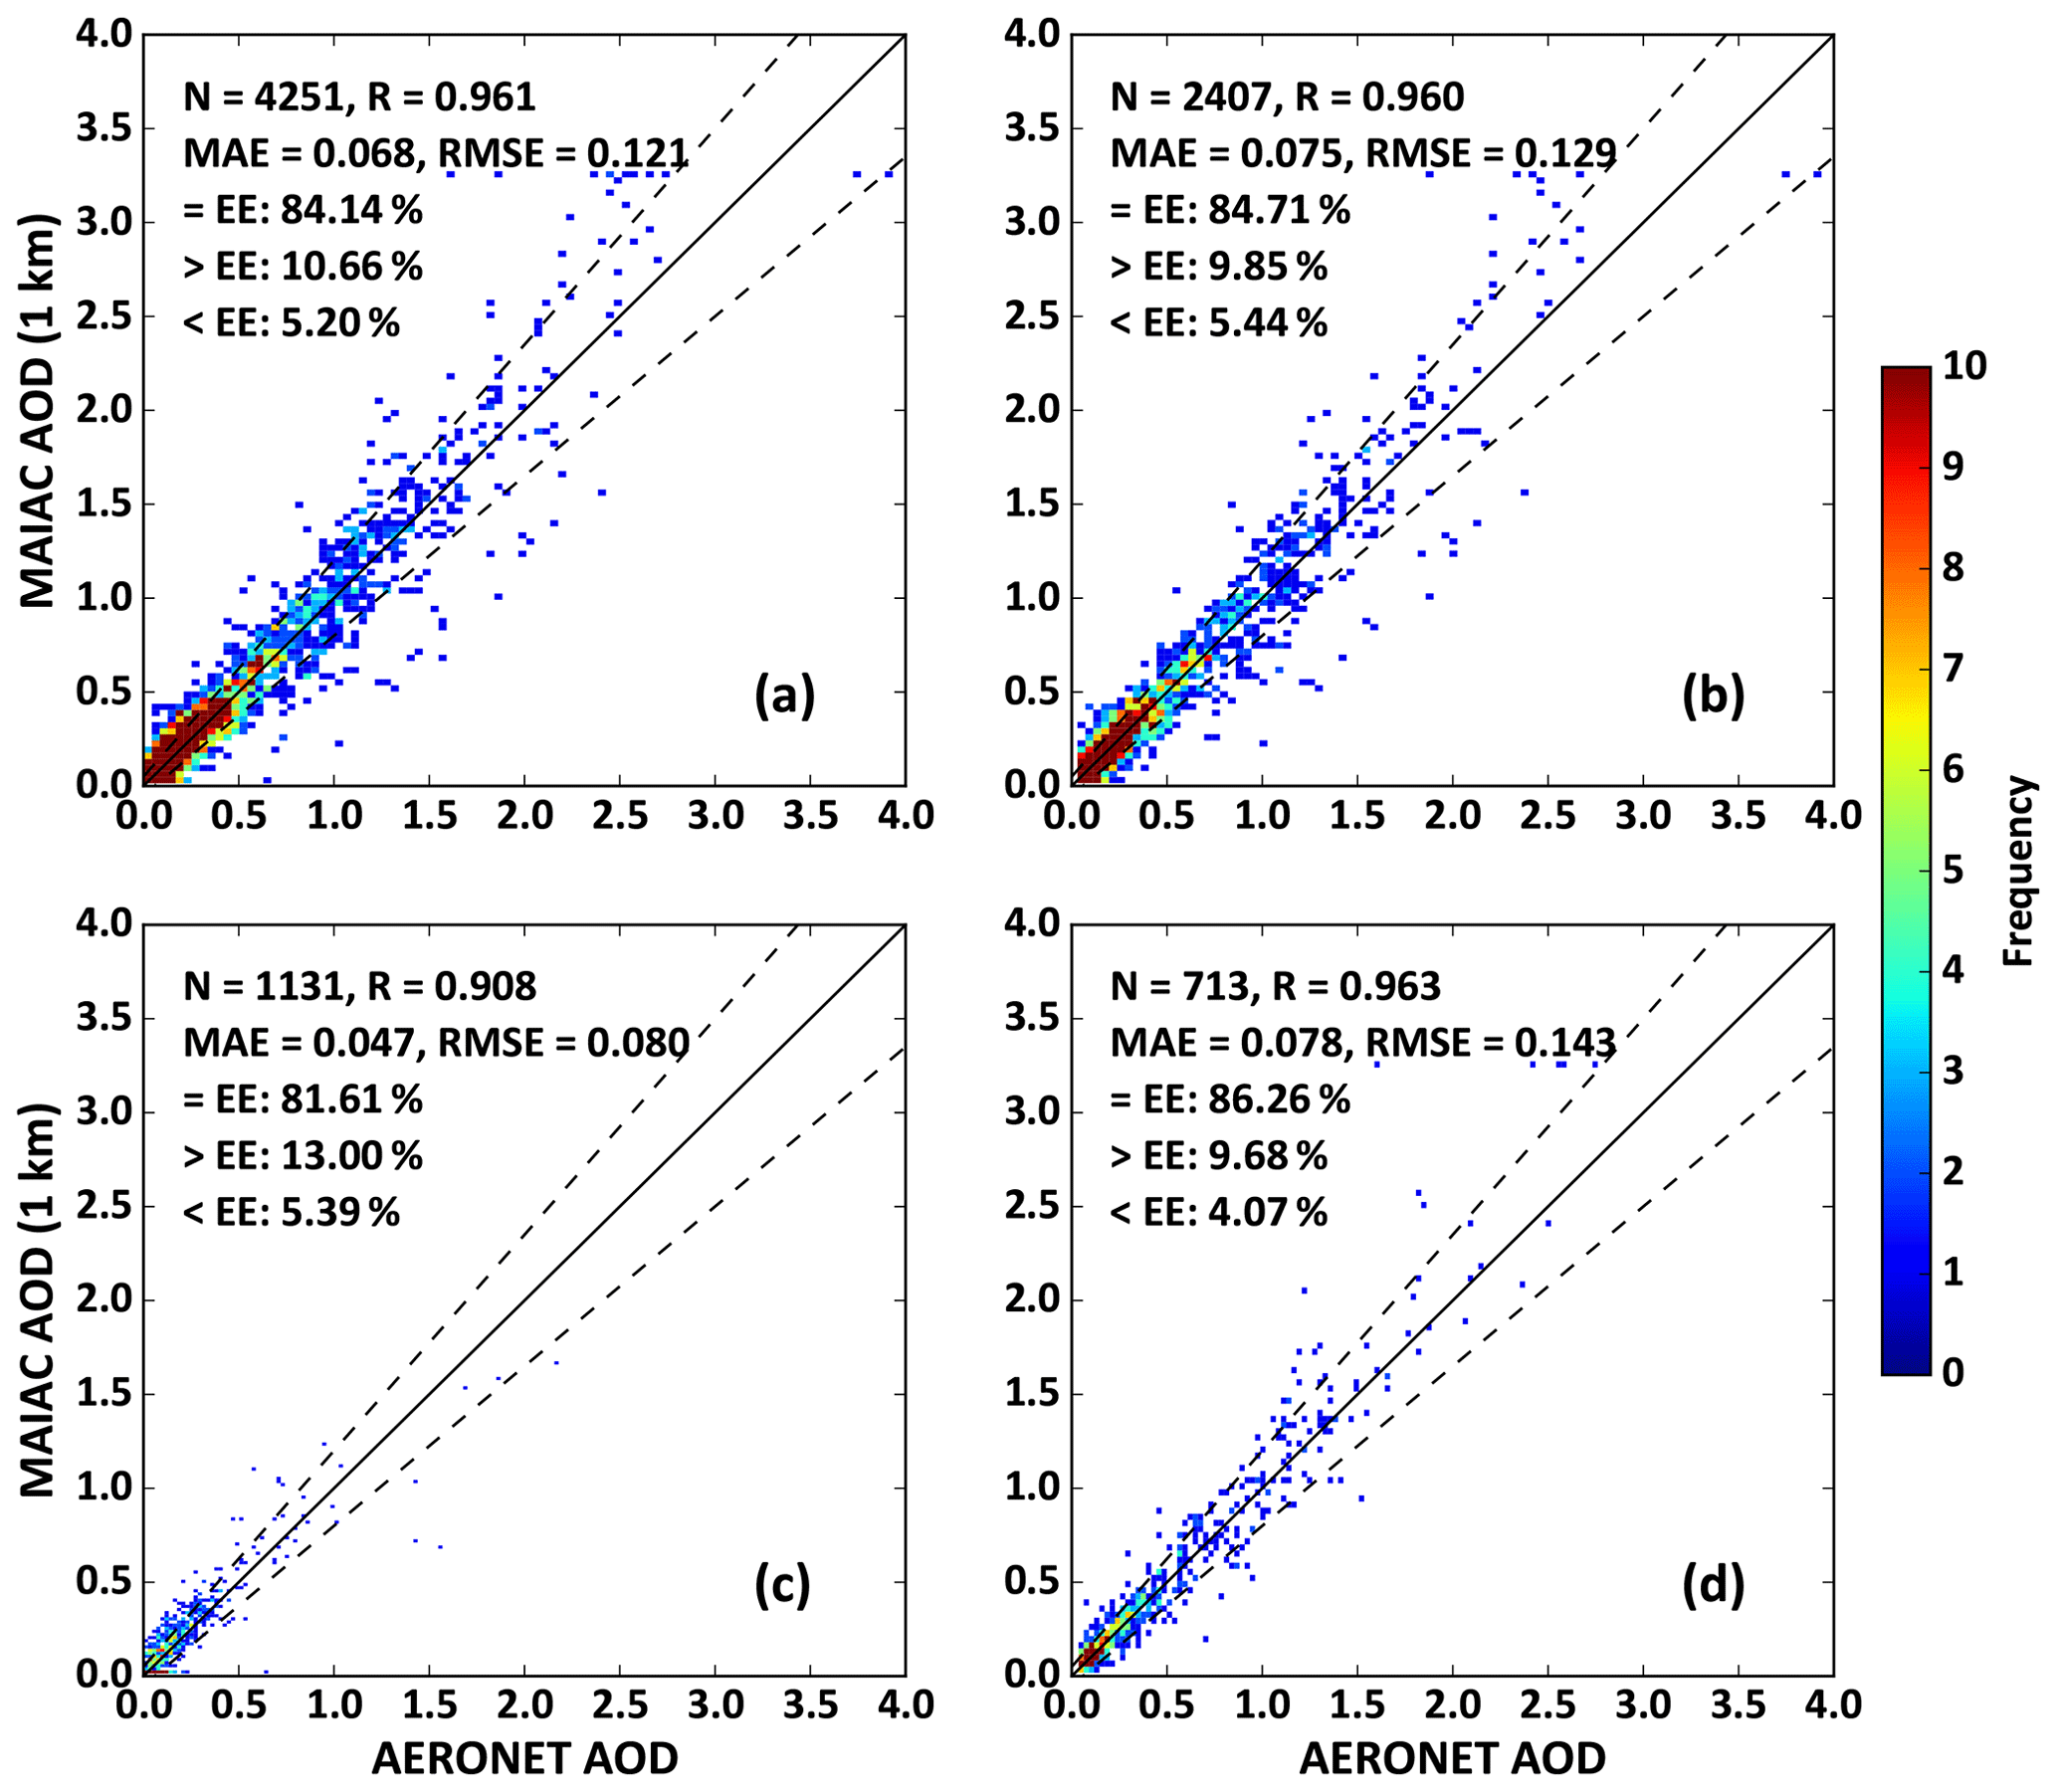
Figure 2Scatter plots of MAIAC AOD retrievals versus AERONET AODs at 550 nm in (a) China and (b) urban, (c) cropland and (d) grassland areas. The dotted lines represent the upper and lower boundaries of the expected error (EE). Statistical metrics are given in each panel, including the number of samples (N), the correlation coefficient (R), the mean absolute error (MAE) and the root-mean-square error (RMSE).
2.3 Auxiliary data
Auxiliary data include meteorological, land-cover, surface topographic and population data. The meteorological variables are collected from ERA-Interim atmospheric reanalysis products, including the boundary layer height (BLH), evaporation (ET), temperature (TEM), precipitation (PRE), relative humidity (RH), surface pressure (SP), wind speed (WS) and wind direction (WD). Observations of meteorological variables made between 10:00 and 14:00 LT (local time) are averaged to be consistent with satellite overpass times. Land-cover data include the MODIS land use cover and normalized difference vegetation index (NDVI) products. Topographic data, i.e., the surface elevation, slope, aspect and relief (Wei et al., 2019d), are calculated from the Shuttle Radar Topography Mission (SRTM) Digital Elevation Model (DEM) product, and the population data are from Visible Infrared Imaging Radiometer Suite nighttime lights (NTL) data. Different from our previous study (Wei et al., 2019b), pollutant emissions for different precursors (including SO2, NOx, CO and volatile organic compounds) and fine-sized dust are also employed to help explicitly explain the PM2.5 composition, collected from a multi-resolution emission inventory for China (MEIC; Zhang et al., 2007). Table 1 provides detailed information about the data sources.

Here, a tree-based ensemble learning approach, called the extremely randomized trees (ERT; Geurts et al., 2006), is selected to deal with complex supervised regression issues and to construct robust PM2.5–AOD relationships. This model splits nodes by randomly selecting cut-points and uses all training samples to grow trees instead of the bootstrap approach. The model efficiently solves variance problems and mines more valuable information compared to other widely used tree-based approaches, e.g., the decision tree and RF.
Unlike the STET model used in our previous study for retrieving PM1 (Wei et al., 2019b), the current algorithm for retrieving PM2.5 is partly based on the STET model and is enhanced by a series of refinements to further optimize and strengthen the model capacity to improve the estimation accuracy, including (1) using aerosol precursor gases (SO2, CO, NOx and VOC and fine-sized dust) from pollutant emission inventories as additional input, (2) correcting satellite retrievals of AOD with reference to ground-based measurements, (3) modifying the feature-selection approach using the Gini (GI) index and (4) improving the determination of spatiotemporal information.
3.1 Data correction and integration
Although the MAIAC algorithm performs generally well in China, with a mean absolute error (MAE) of 0.06 and a root-mean-square error (RMSE) of 0.121 (Fig. 2), a systematic error in the AOD retrievals (τs) can be corrected by linear regression between in situ AOD measurements collected at all AERONET sites in China matched with the MAIAC retrievals, given as follows:
Due to the difference in cloud distributions at their respective imaging times, the spatial coverages of Terra and Aqua MAIAC AOD products differ. Terra and Aqua MAIAC AOD retrievals are thus averaged for each pixel on each day to form a new dataset and enlarge the spatial coverage. By integrating the two datasets, the spatial coverage increased by more than 15 % over most areas in China, leading to PM2.5 maps with wider spatial coverages. The number of valid data samples also significantly increased by approximately 25 %–32 %, improving the model training ability. Due to different spatial resolutions, all auxiliary variables were uniformly aggregated to a 1 km spatial resolution using the bilinear interpolation approach. After removing invalid or unrealistic values, there are 167 716 matched PM2.5–AOD samples and independent variables collected for 2018 in China.
3.2 Potential effects of variables on PM2.5
The potential relationships between all selected independent variables and PM2.5 measurements are first investigated (Fig. 3). AOD is highly positively related to PM2.5 measurements (R=0.54), and all pollutant emissions, nighttime lights and land use cover show positive effects on PM2.5. In contrast, all topographical variables and NDVI are negatively related to PM2.5. Moreover, except for ET (R=0.24) and SP (R=0.16), the other meteorological variables show negative effects on PM2.5, especially for BLH () and TEM (). In general, all of the selected variables are significantly correlated to PM2.5 measurements at the confidence level of 0.01 or 0.05 (two sides), so they are used as inputs to the STET model for preliminary training.

Figure 3Potential effects and importance scores (blue bars; unit: %) of independent variables to PM2.5 estimates for the STET model.
3.3 Updated feature selection
Due to the large number of independent variables considered, over-fitting will occur during the model training process. The model thus needs further adjustment, done by selecting the most important variables rather than all variables to overcome this issue and improve the model efficiency. In this study, the GI index is selected to calculate the importance score of each independent variable on PM2.5 estimates because of its higher accuracy and stability as a variable-importance measure, especially for continuous variables with low signal-to-noise ratios (Jiang et al., 2009; Calle and Urrea, 2011), expressed as
where n represents the number of the categories () and ωn represents the sample weight of each category. The importance of one feature (Xj) on node m is that the GI changes before and after node m branching as follows:
where GIl and GIr represent the GI of two new nodes after branching. The importance score for one feature (ISj) in the then extra trees with k trees () is calculated as
where ΔGIij represents the importance of Xi in the ith tree when the node of feature Xi in decision tree j belongs to set M. Finally, an additional normalization approach is performed to all obtained importance scores for each feature.
The results suggest that AOD is the most influential variable, contributing ∼ 32.5 % to daily PM2.5 estimates (Fig. 3). Most meteorological variables contribute more to PM2.5 estimates, especially BLH, ET and TEM, with average importance scores of 9.6 %, 7.7 % and 7.3 %, respectively. The PM2.5–AOD relationship might largely depend on the compositions (e.g., aerosol water; Reddington et al., 2019; Jin et al., 2020). High RH conditions and precipitation should have large influences on the production and removal of PM2.5 (Sun et al., 2014; Zheng et al., 2015). However, RH and PRE become less important, with overall low importance scores in the STET model, which may be attributed to the fact that aerosol retrieval algorithms only work under cloud-free conditions when RH is relatively low. More importantly, the calculated importance score only represents the importance of features in splitting during the extra-tree construction, not the contribution of features to PM2.5 in physical mechanisms. Two main land-use variables, i.e., NDVI and DEM, are also important to PM2.5 estimates, while the pollutant emissions show different effects on PM2.5, with varying importance scores, especially for NH3, CO, SO2 and fine-sized dust. The eight least important variables with low importance scores of <2 % are excluded from the STET model, and the remaining 14 more important variables are selected as inputs to build the PM2.5–AOD relationship.
3.4 Improved spatiotemporal information
Spatiotemporal heterogeneities, i.e., strong spatial autocorrelations and clear temporal variations, are the key characteristics of PM2.5, presenting great challenges and usually neglected in most regression and artificial intelligence models. Therefore, in this study, the STET model is further enhanced to solve this problem by more accurately determining the spatial and temporal information. For this purpose, the Haversine approach is selected to calculate the great-circle distance between two points on a sphere specified by their latitudes and longitudes (Eqs. 5–7). This approach can avoid the problem of insufficient effective numbers due to the short distance between two points by using sines, used to represent the space term (Ps). In addition, instead of using the day of the year (DOY), the time radian difference for each point on different days in a year is calculated (Eq. 8) to minimize the impact of the seasonal cycle and is selected to represent the time term (PT). These two improved space–time terms can account for the spatiotemporal autocorrelations of PM2.5 between different points for each day and between consecutive time series at the same place.
where α1 and α2 denote the latitudes of two points, β1 and β2 denote the longitudes of two points in space, r denotes the radius (in km) of the earth, d represents the DOY, and T represents the total number of days in the year in question.

For the enhanced STET model, all of the selected independent variables are first input into the ERT model, and the random splits (S, ai) are established according to the whole of training data samples; second, totally different K attributes are selected randomly from all attributes according to spatial and temporal differences; third, K random splits are generated (), and a split (s∗) is selected by calculating the score measure function, i.e., Score(s∗, S); fourth, split node (S) is completely randomly generated to establish an extra tree; last, the extra tree ensemble is built using the similarity method. Detailed information on ERT algorithm can be found in Geurts et al. (2006). Figure 4 illustrates the schematic of the enhanced STET model.
3.5 Model validation approach
Different from our previous study, three independent validation methods are performed to verify the ability of the model to estimate PM2.5 concentrations. The first independent validation method, i.e., the out-of-sample cross-validation (CV) approach, is performed on all data samples using the 10-fold CV procedure (Rodriguez et al., 2010). The data samples are randomly divided into 10 subsets; nine are used as training data, and one is used as validation data. This approach is repeated 10 times, and error rates are averaged to obtain the final result. This is a common approach to evaluate the overall accuracy of a machine learning model, widely adopted in most satellite-derived PM studies (T. Li et al., 2017a, b; Ma et al., 2014, 2019; Xiao et al., 2017; He and Huang, 2018; Chen et al., 2019; Wei et al., 2019a, b; Xue et al., 2019; Yao et al., 2019).
The second independent validation method, i.e., out-of-station CV approach, is similar to the first one but performed using data from the monitoring stations to evaluate the spatial performance of the model. Data samples collected from different spatial points make up the training and testing data, and the relationship between spatial predictors and PM2.5 built from the training dataset is then estimated for each testing. The third independent validation approach tests the predictive power of the model. It is performed by applying the model built for a specific year to predict the PM2.5 concentrations for other years, then validating the results against the corresponding ground measurements. This approach ensures that the data samples for model training and validation are completely independent on both spatial and temporal scales. Several traditional statistical metrics are selected to describe the model performance, including the correlation coefficient (R), R2, RMSE, MAE and the mean relative error (MRE).
4.1 Validation at the spatial scale
4.1.1 National-scale validation
Figure 5 shows the out-of-sample and out-of-station 10-CV results of daily PM2.5 estimates for the traditional ERT model and our enhanced STET model at the national scale in 2018. The original ERT model works well in estimating PM2.5 concentrations, with an average out-of-sample CV R2 of 0.84 and overall small estimation uncertainties. However, when considering spatiotemporal information, the model performance significantly improves, with a sample-based CV R2 of 0.89, a stronger regression line, and a decreasing RMSE of 10.33 µg m−3, MAE of 6.69 µg m−3 and MRE of 21.28 %. Regarding the spatial performance, compared to the original ERT model, the enhanced STET model shows a stronger spatial predictive power, with a higher out-of-station CV R2 of 0.88, a lower RMSE of 10.93 µg m−3, MAE of 7.15 µg m−3 and MRE of 23.69 %. In addition, compared to the sample-based validation, the out-of-station accuracy changes little, suggesting that the enhanced STET model can estimate well the daily PM2.5 concentrations. Moreover, these results illustrate that spatiotemporal information is crucial in improving PM2.5–AOD relationships and should be carefully considered when introducing regression models using remote sensing techniques.
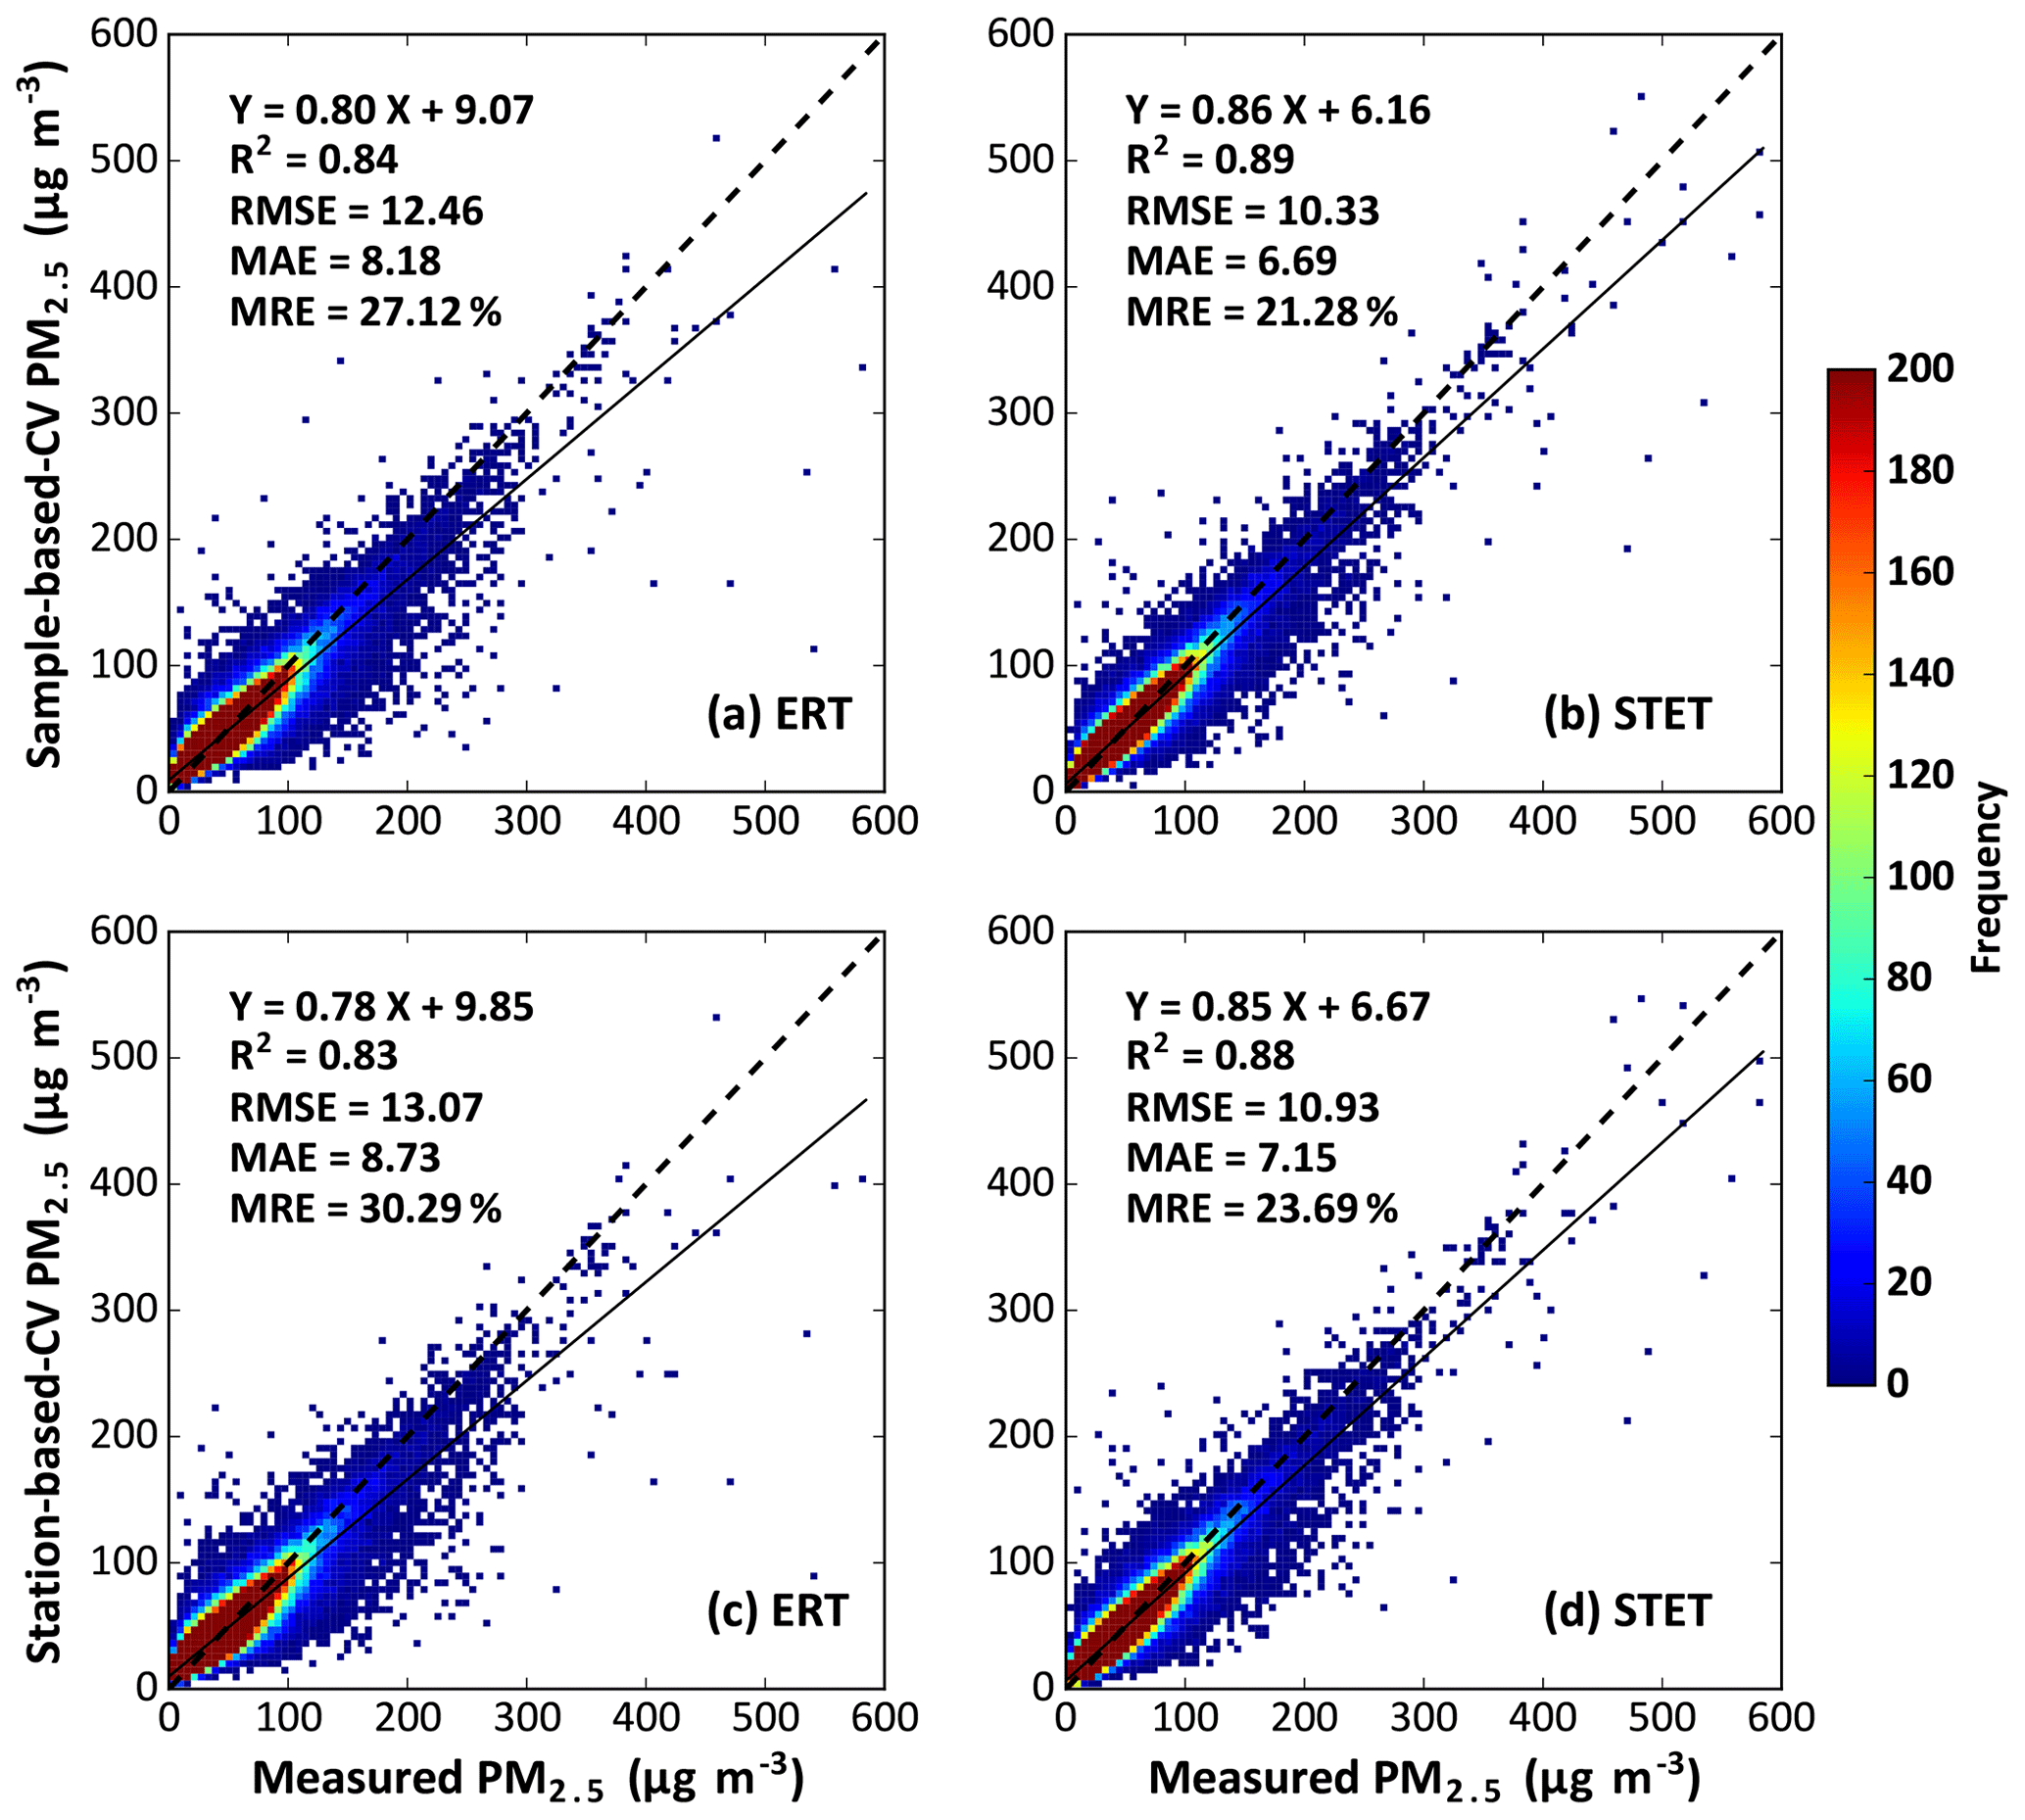
Figure 5Density scatter plots of (a, b) out-of-sample and (c, d) out-of-station 10-CV results for the (a, c) ERT and (b, d) STET models at the daily level in 2018 for mainland China. Statistical metrics are given in each panel, along with the linear regression relation, including the correlation of determination (R2), the root-mean-square error (RMSE), the mean absolute error (MAE) and the mean relative error (MRE).
4.1.2 Regional-scale validation
Figure 6 shows the sample-based 10-CV results of the enhanced STET model in PM2.5 daily estimates over eastern and western China (according to the widely used Heihe–Tengchong line) and four typical regions (Fig. 1). The enhanced STET model performs differently over eastern and western China, mainly due to significant differences in land cover and climate conditions. There are 1289 uniformly distributed PM2.5 stations in eastern China, and 127 241 daily samples were collected. The model performs well in eastern China, with a high sample-based CV R2 equal to 0.90 and low estimation uncertainties, i.e., RMSE =9.72 µg m−3, MAE =6.41 µg m−3 and MRE =19.16 %. In contrast, there are 294 unevenly and sparsely distributed PM2.5 stations in western China, with about 3 times fewer daily PM2.5 estimates collected. The model performance is overall poorer (e.g., CV R2=0.85, RMSE =12.04 µg m−3, MAE =7.56 µg m−3) than over eastern China. This is mainly attributed to brighter surfaces (e.g., desert and bare land) with little vegetation and harsh meteorological conditions over western China.
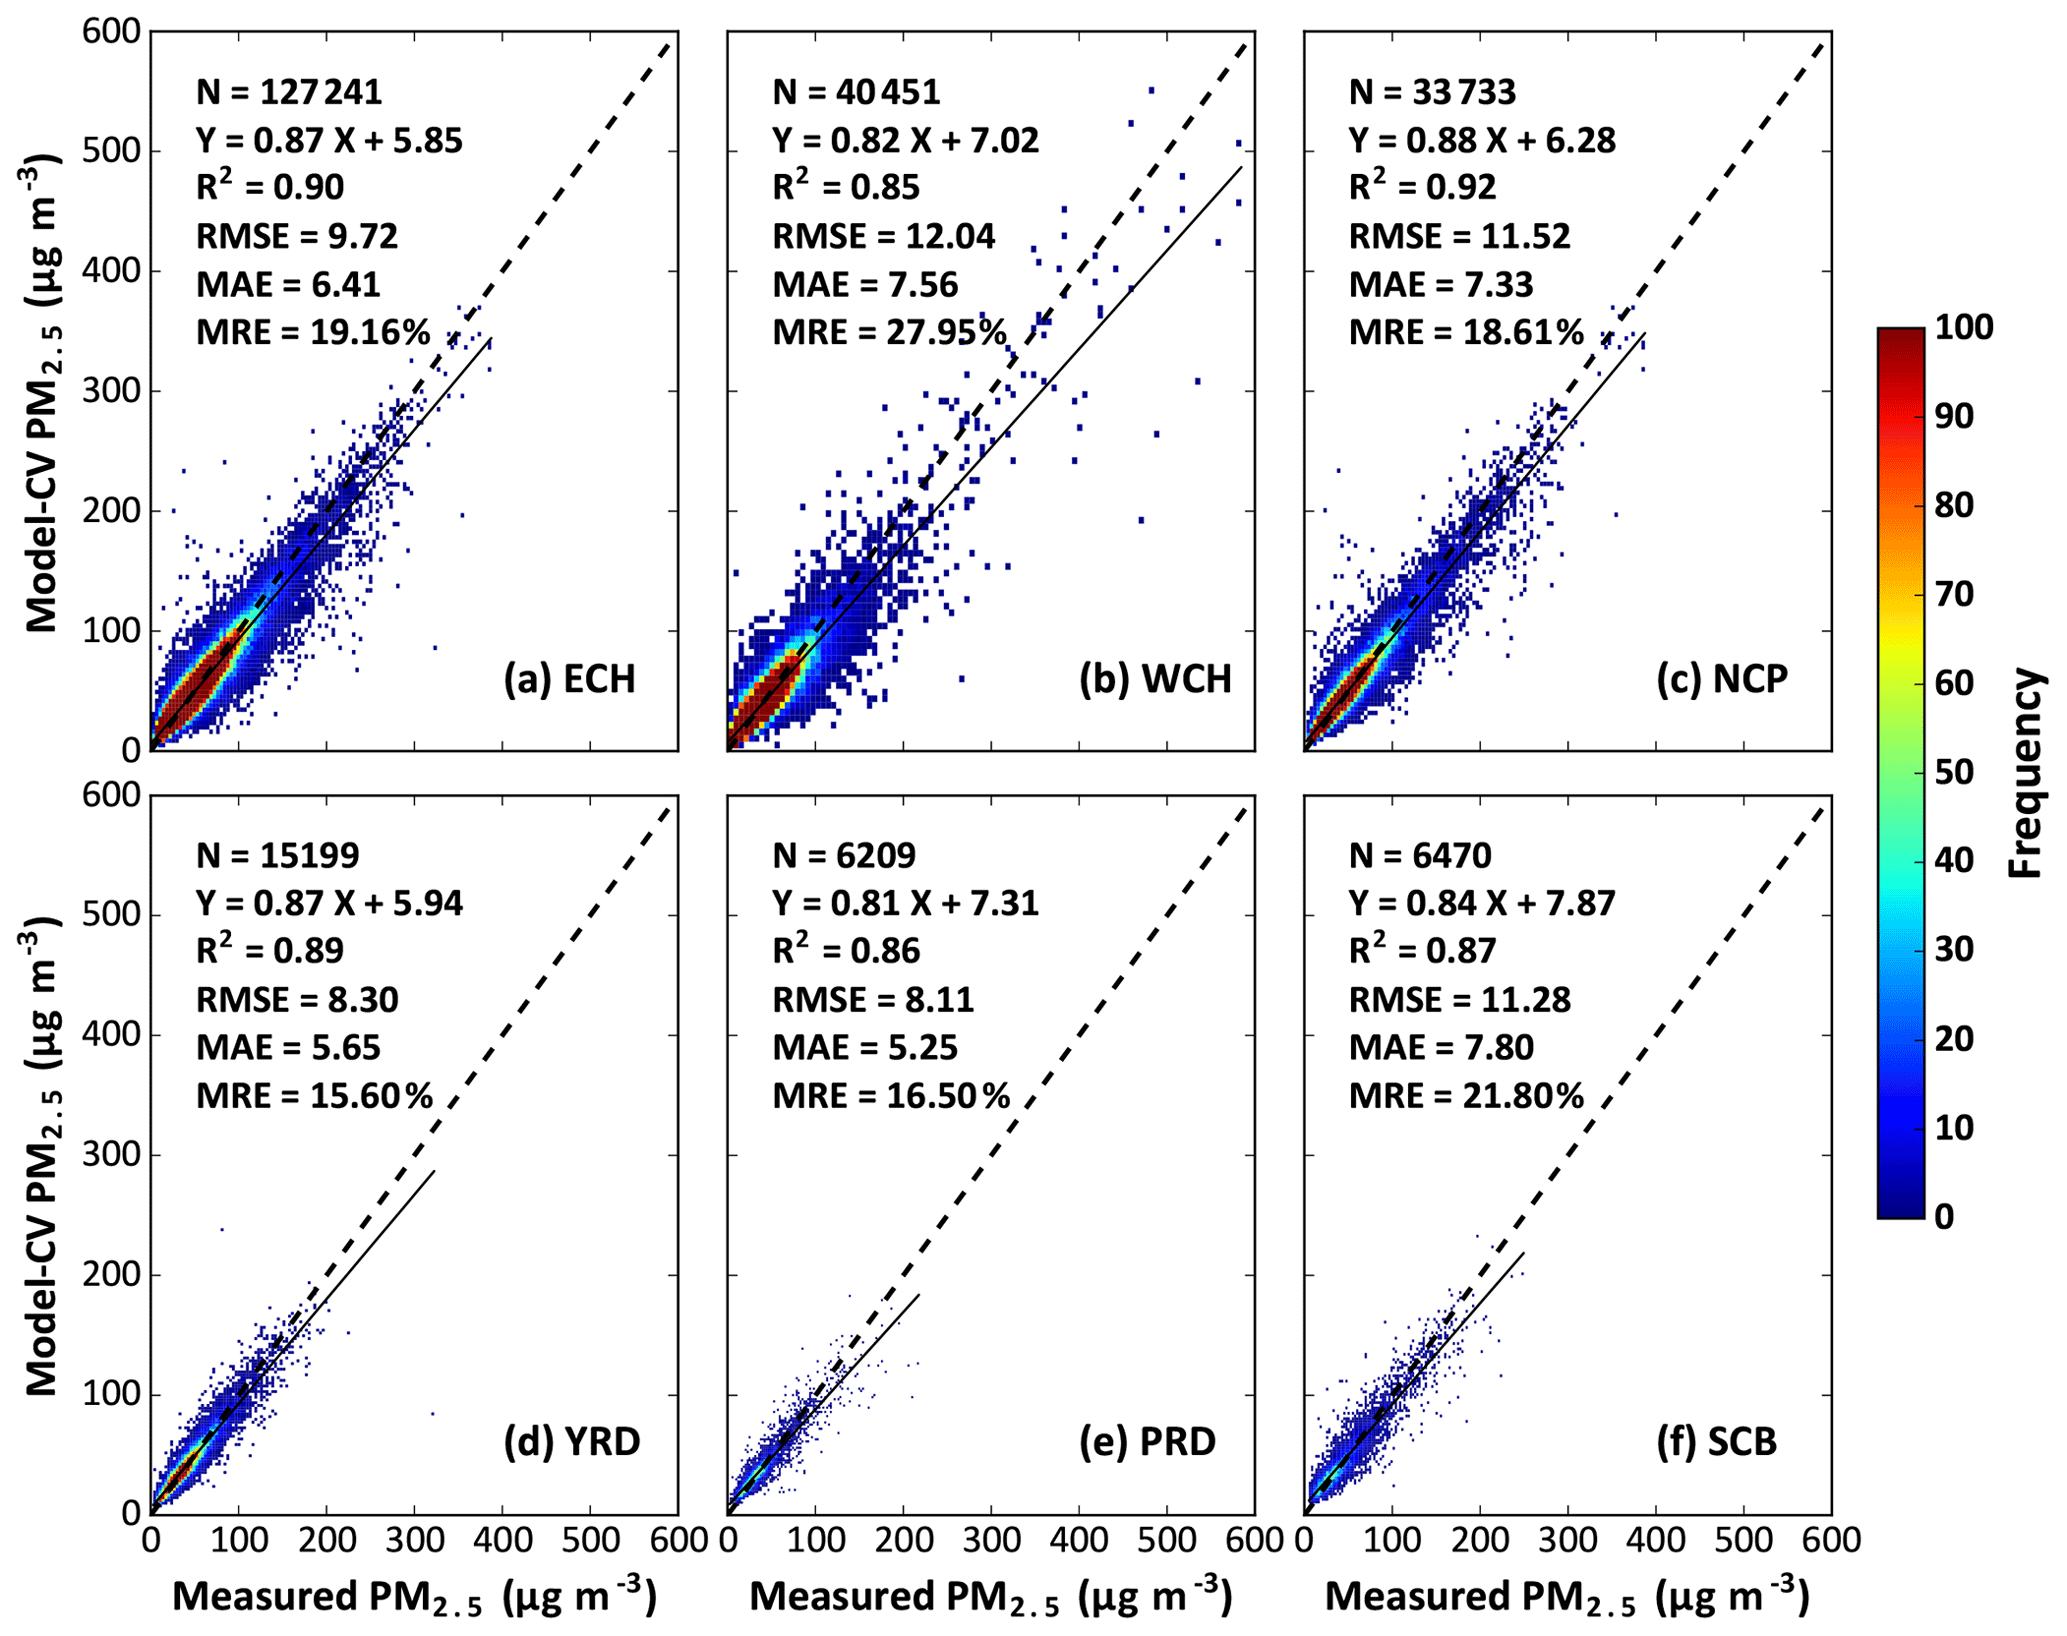
Figure 6Density scatter plots of out-of-sample 10-CV results for (a) eastern China (ECH), (b) western China (WCH), (c) the North China Plain (NCP), (d) the Yangtze River Delta (YRD), (e) the Pearl River Delta (PRD) and (f) the Sichuan Basin (SCB) in 2018. Statistical metrics are given in each panel, along with the linear regression relation, including the number of samples (N), the correlation of determination (R2), the root-mean-square error (RMSE), the mean absolute error (MAE) and the mean relative error (MRE).
There were 33 733, 15 199, 6209 and 6470 daily samples collected from 233, 184, 95 and 107 uniformly distributed PM2.5 monitoring stations in the North China Plain (NCP), the Yangtze River Delta (YRD), the Pearl River Delta (PRD) and the Sichuan Basin (SCB), respectively. Estimated PM2.5 concentrations in the typical urban agglomerations of the NCP, YRD and PRD are highly consistent with surface measurements (CV R2=0.86–0.92), with overall low estimation uncertainties (i.e., RMSE =8–12 µg m−3, MAE =5–8 µg m−3 and MRE =15 %–19 %). The new model also performs well over the Sichuan Basin, with an average CV R2 value equal to 0.87 and comparable estimation uncertainties to those from the NCP. Overall, despite some differences in model performance, the enhanced STET model shows an overall good ability in estimating PM2.5 concentrations at the regional scale.
4.1.3 Site-scale validation
National- and regional-scale aggregated evaluations mainly illustrate the overall performance of the model in estimating PM2.5 concentrations. However, due to the inhomogeneity of PM2.5 monitoring stations, an additional validation for each monitoring station in China is performed (Fig. 7). For statistical significance, only these monitoring stations with more than 10 data samples are plotted. Daily PM2.5 estimates relate well to surface measurements at most individual stations across China. The average sample-based CV R2 is 0.84, and CV R2 values are greater than 0.8 at more than 73 % of the monitoring stations, especially in eastern China. However, observed are relatively poorer performances (CV R2<0.6) at some scattered sites located in southwest and southeast China. In general, the new model shows overall low estimation uncertainties at most sites, with average RMSE and MAE values of 9.2 and 6.5 µg m−3, especially in southern China. Moreover, ∼94 % of the monitoring stations in China have mean RMSE and MAE values of less than 15 and 10 µg m−3, respectively. Note that these stations have larger RMSE values (>10 µg m−3) in central China, mainly due to the high pollution levels. The average MRE value in China is 20.8 %, and most stations (>86 % of them) have MRE values of less than 30 %, especially at sites located in eastern and southern China.
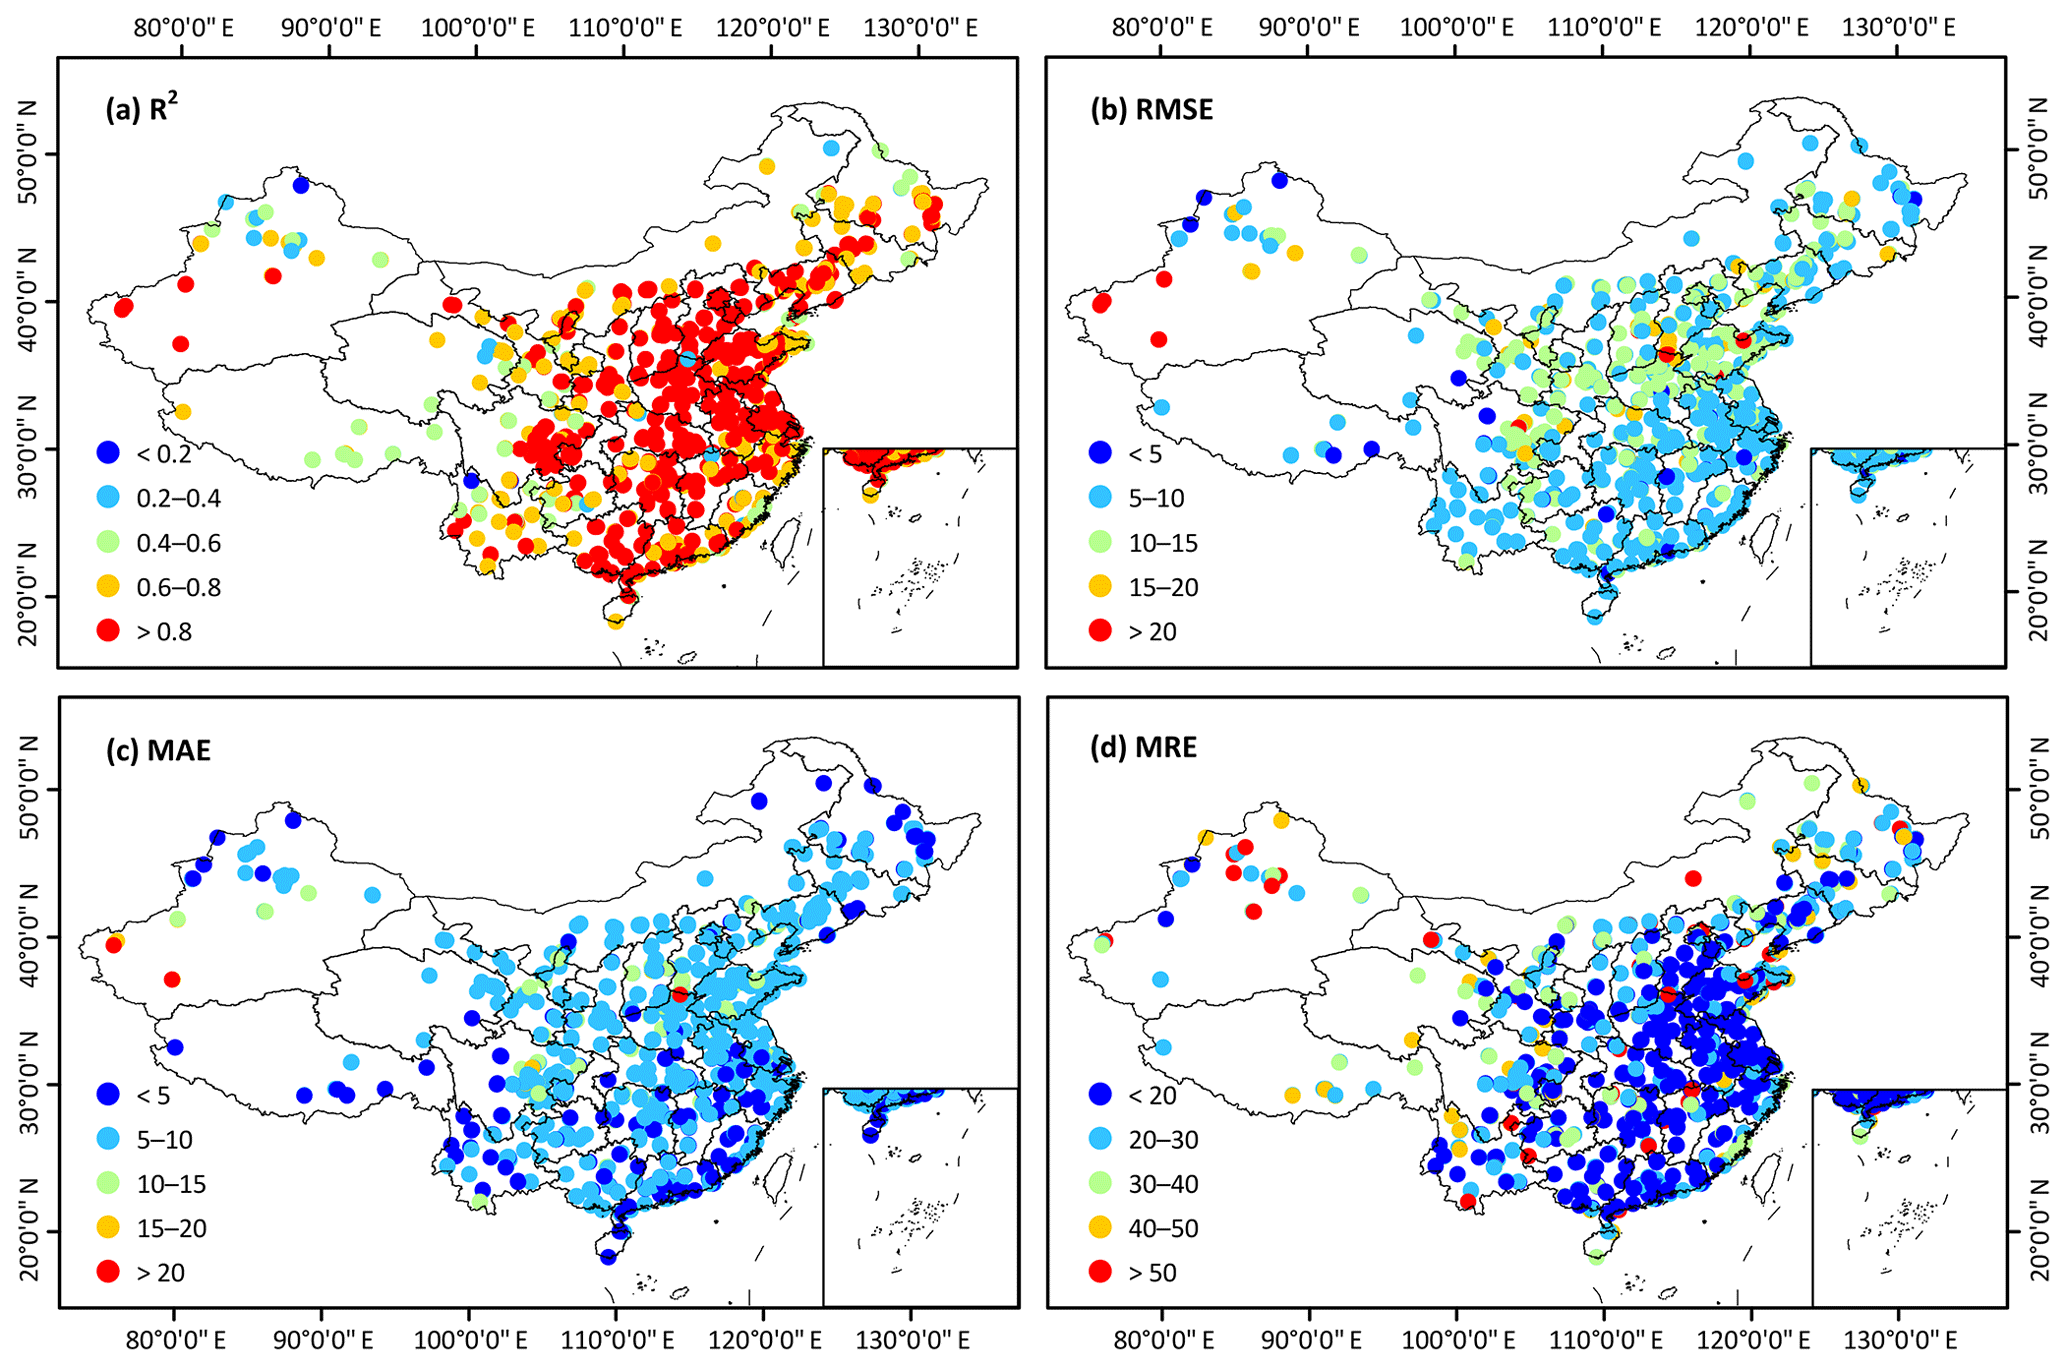
Figure 7Spatial distributions of the site-scale performance of the STET model for (a) the sample-based cross-validation coefficient of determination (R2), (b) the root-mean-square error (RMSE), (c) the mean absolute error (MAE) and (d) the mean relative error (MRE) in 2018 across China.
4.2 Performance at the temporal scale
4.2.1 Daily-scale validation
Figure 8 shows the model performance from all available monitoring stations in China as a function of the DOY. The number of data samples in a single day ranges from 54 to 1155, with an average of 466 in 2018. In general, the new model performs well (average CV R2=0.77) on most days in the year, and more than 77 % of these days have CV R2 values greater than 0.7. Two main uncertainty metrics, i.e., RMSE and MAE, show similar temporal variations during the year, first decreasing until around day 250, then gradually increasing. Approximately 91 % and 92 % of the days have low RMSE and MAE values of less than 15 and 10 µg m−3, respectively, over the year. MRE is relatively stable, ranging from 13 % to 49 % with an average value of 23.2 %, and more than 87 % of the days have MRE values of less than 30 % in China. In general, high R2 with overall large RMSE but small MRE values are observed at the beginning and end of the year (in winter). This is because PM2.5 concentrations vary more and are always high due to the greater amount of pollutant emissions caused by heating or frequent dust storms. In contrast, lower R2 with overall small RMSE and large MRE values are observed in the middle of the year (in summer) because air pollution levels are lower. Nevertheless, these results illustrate that the enhanced STET model captures well the PM2.5 concentrations on most days of the year.
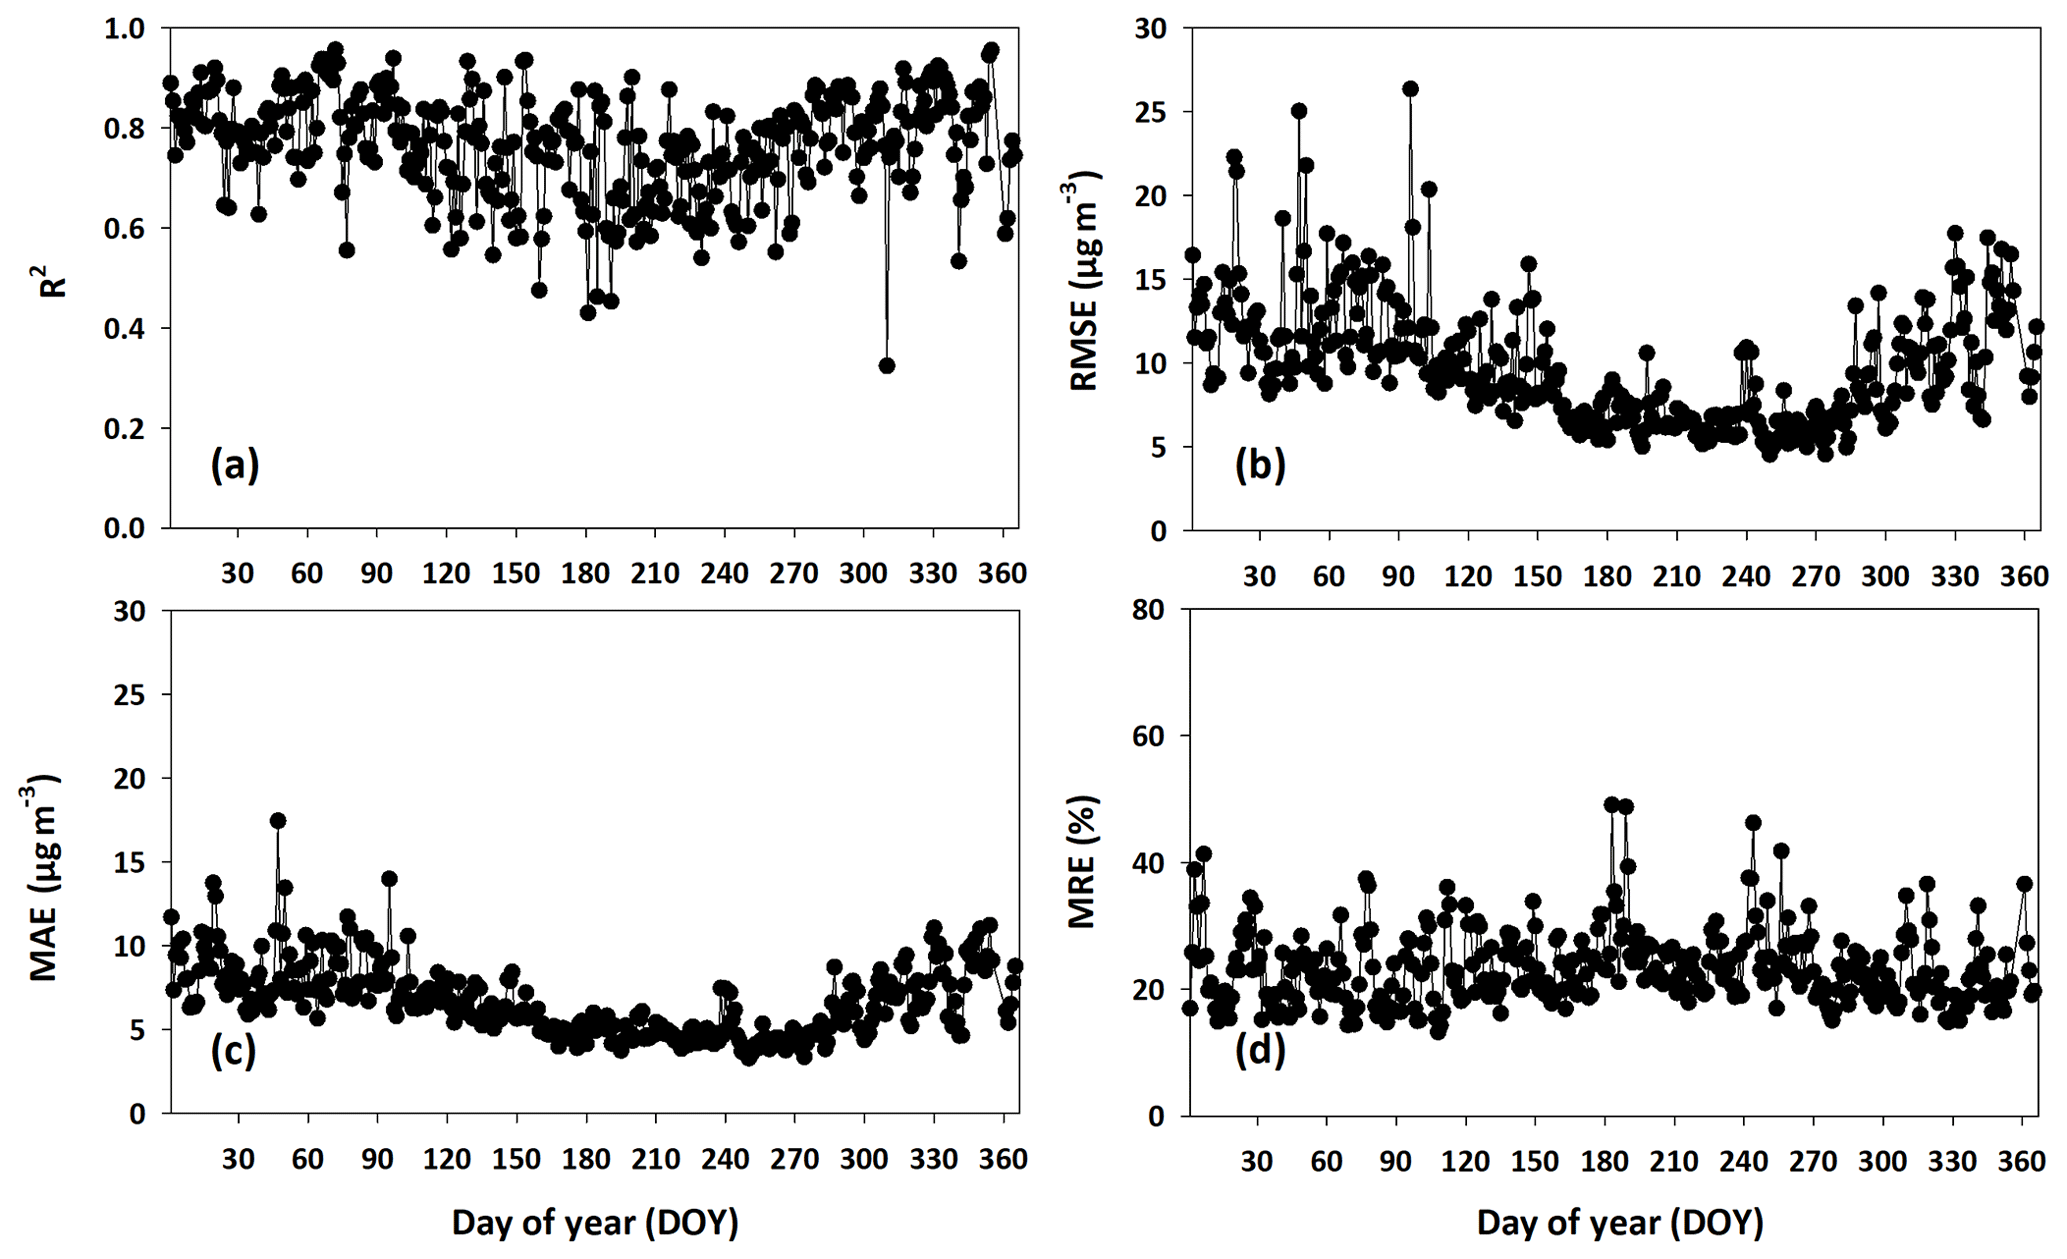
Figure 8Time series of the daily performance of the STET model in terms of (a) sample-based cross-validation coefficient of determination (R2), (b) the root-mean-square error (RMSE), (c) the mean absolute error (MAE) and (d) the mean relative error (MRE) in 2018 across China.
4.2.2 Seasonal-scale validation
Figure 9 shows sample-based CV results for PM2.5 daily estimates according to the season in 2018 in China. Results suggest that there are clear differences in the number of valid data samples because of the long-term snow/ice cover in winter and more frequent clouds in summer, resulting in an overall smaller number of samples than in the other two seasons. The enhanced STET model performs best in autumn, with the highest CV R2 value of 0.90 and the strongest regression line (i.e., slope =0.88 and intercept =4.85 µg m−3). Mean RMSE, MAE and MRE values in autumn are 8.97 µg m−3, 5.84 µg m−3 and 21.02 %, respectively. In contrast, the new model performs the worst in summer, with the lowest CV R2 of 0.79 and a less steep slope of 7.37, indicating clear underestimations. However, summer experiences the least amount of air pollution, with most daily PM2.5 values <50 µg m−3, leading to the smallest RMSE and MAE values but the largest MRE values. Air quality is about 2 or 3 times worse in spring and winter, with wider PM2.5 ranges and larger standard deviations. The model performance in these seasons is similar, with almost equal CV R2 and slope values and close estimation uncertainties. The differences in model performance among the seasons are mainly attributed to seasonal variations in natural conditions and human activities. Meteorological conditions in summer favor the diffusion of pollutants but complicate the PM2.5–AOD relationship (Su et al., 2018, 2020), whereas direct emissions of pollutants are greater in winter, resulting in severe air pollution.
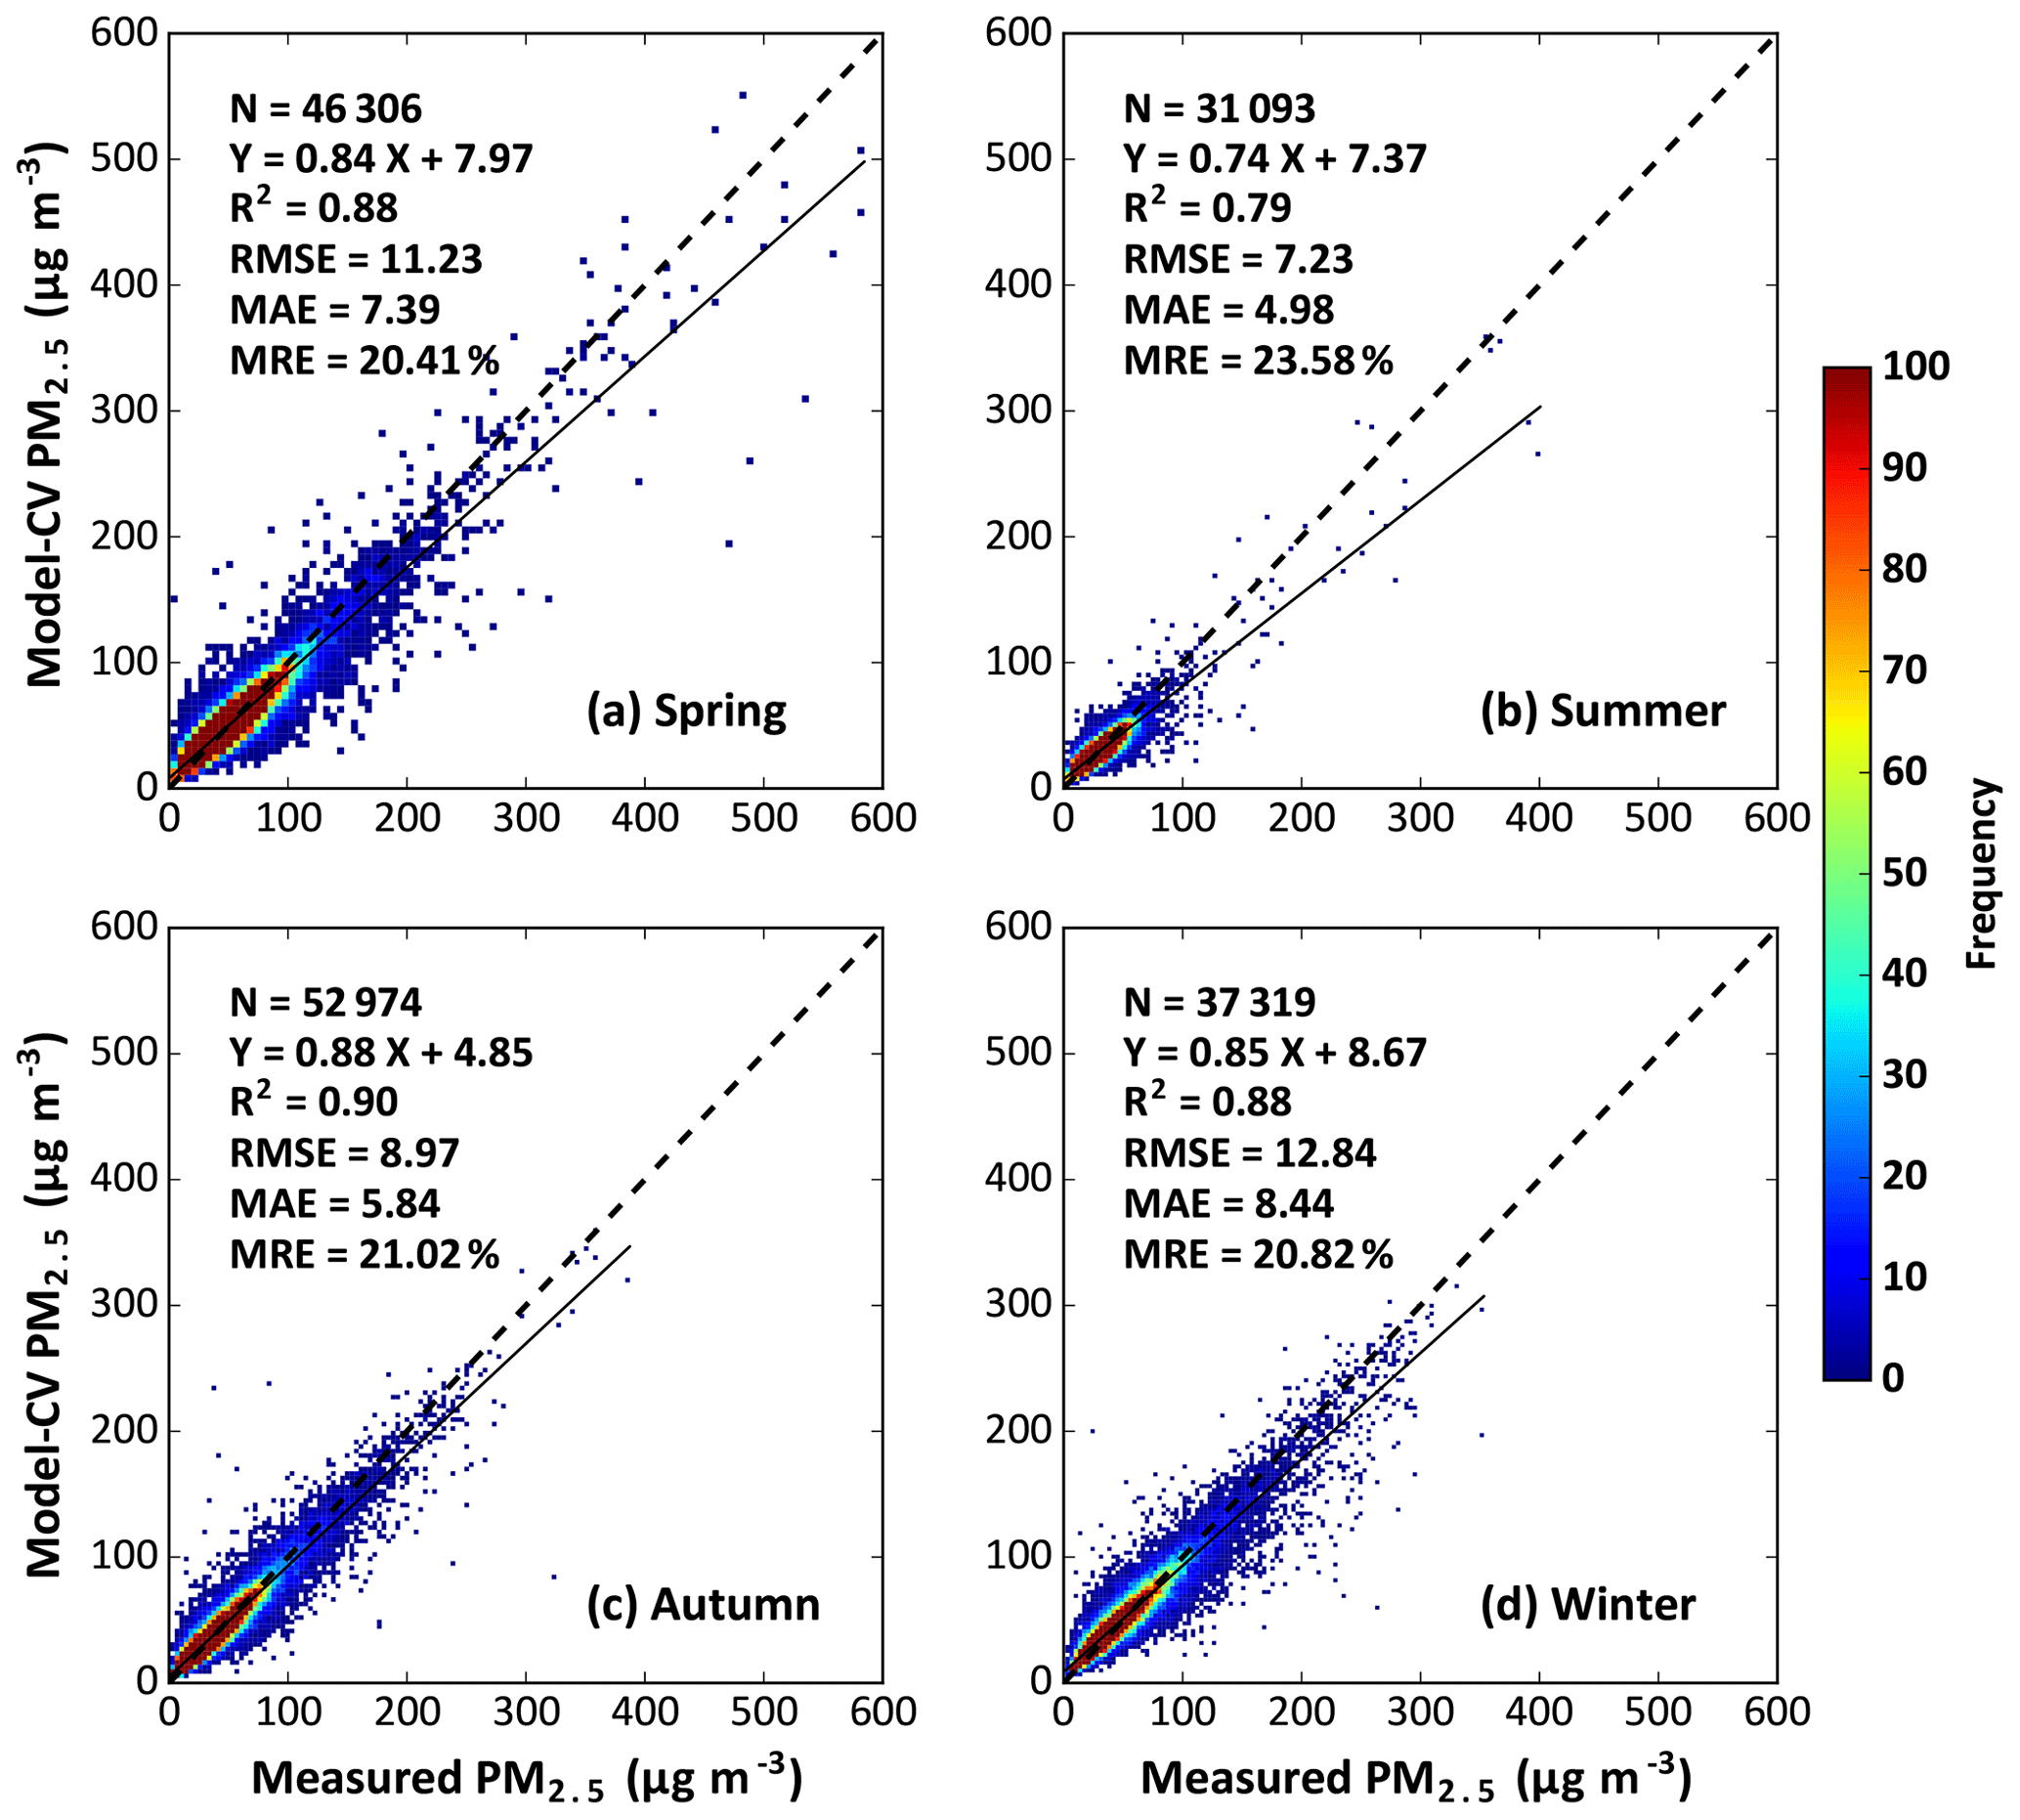
Figure 9Density scatter plots of sample-based 10-CV results for the STET model for the four seasons in 2018 across China. Statistical metrics are given in each panel, along with the linear regression relation, including the number of samples (N), the correlation of determination (R2), the root-mean-square error (RMSE), the mean absolute error (MAE) and the mean relative error (MRE).
4.2.3 Synthetic-scale validation
Synthesized PM2.5 retrievals are validated against PM2.5 surface observations by calculating the effective values from the same number of valid days at monthly, seasonal and annual timescales (Fig. 10). Monthly PM2.5 estimates and ground measurements (N=12 410) are highly correlated (R2=0.93), with a steep slope of 0.91. Mean RMSE, MAE and MRE values are 5.63 µg m−3, 4.08 µg m−3 and 11.59 %, respectively. Seasonal mean PM2.5 estimates (N=5231) have a good accuracy (i.e., R2=0.93, RMSE =5.00 µg m−3, MAE =3.69 µg m−3 and MRE =10.31 %). Annual mean PM2.5 estimates (N=1462) agree well with ground measurements (R=0.91), with small uncertainties (i.e., RMSE =4.11 µg m−3, MAE =3.12 µg m−3 and MRE =8.58 %). This illustrates that the synthetic dataset can more accurately reflect the spatiotemporal PM2.5 loadings and variations across China.
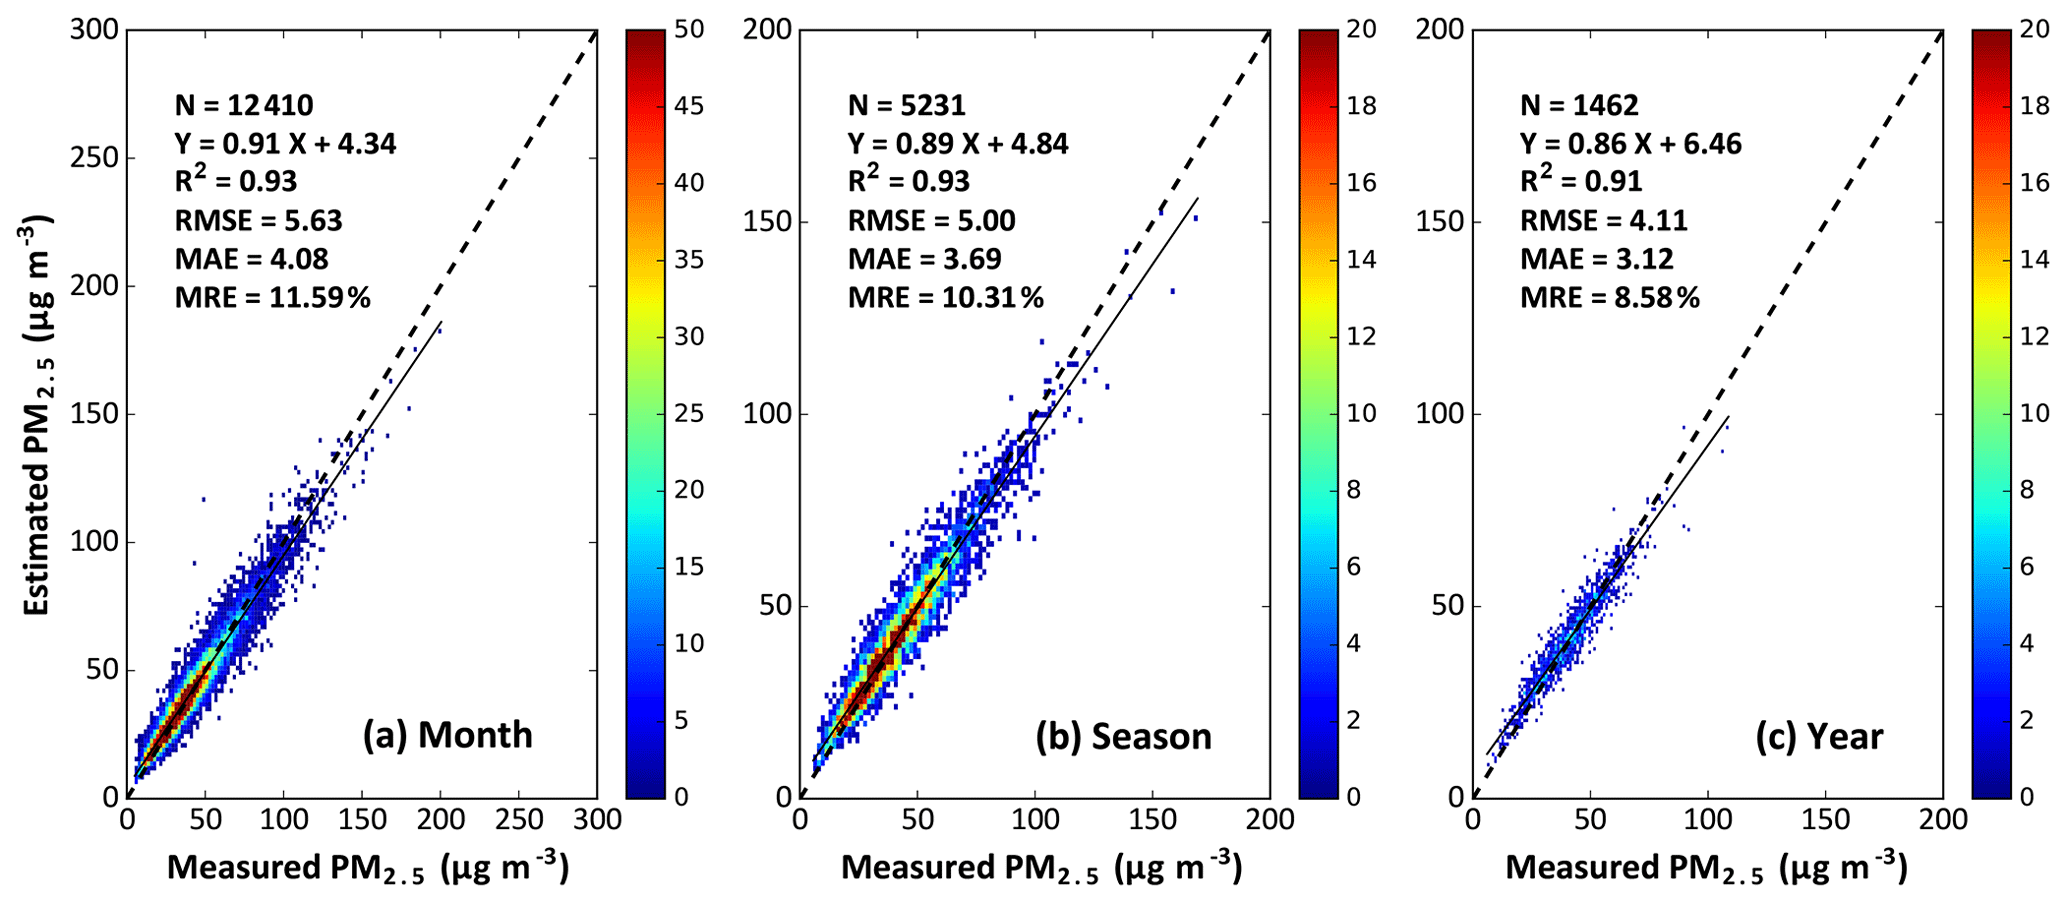
Figure 10Validation of (a) monthly, (b) seasonal and (c) annual PM2.5 estimates in 2018 in China. Statistical metrics are given in each panel, along with the linear regression relation, including the number of samples (N), the correlation of determination (R2), the root-mean-square error (RMSE), the mean absolute error (MAE) and the mean relative error (MRE).
4.3 Predicted PM2.5 maps across China
Monthly PM2.5 maps are thus synthesized and averaged from at least 20 % of available daily PM2.5 estimates for each grid in a month, and annual PM2.5 maps are generated from monthly PM2.5 maps if there are more than eight available values for each grid across China (Hsu et al., 2012; Wei et al., 2019f). The spatial coverage of monthly PM2.5 maps varies from 73 % to 92 %, with an average of 83 % across mainland China. The maximum coverage occurs in April, and the minimum coverage occurs in January. The monthly mean PM2.5 values vary conversely from 24.4 to 42.9 µg m−3, where the highest (lowest) PM2.5 concentration is observed in December (August).
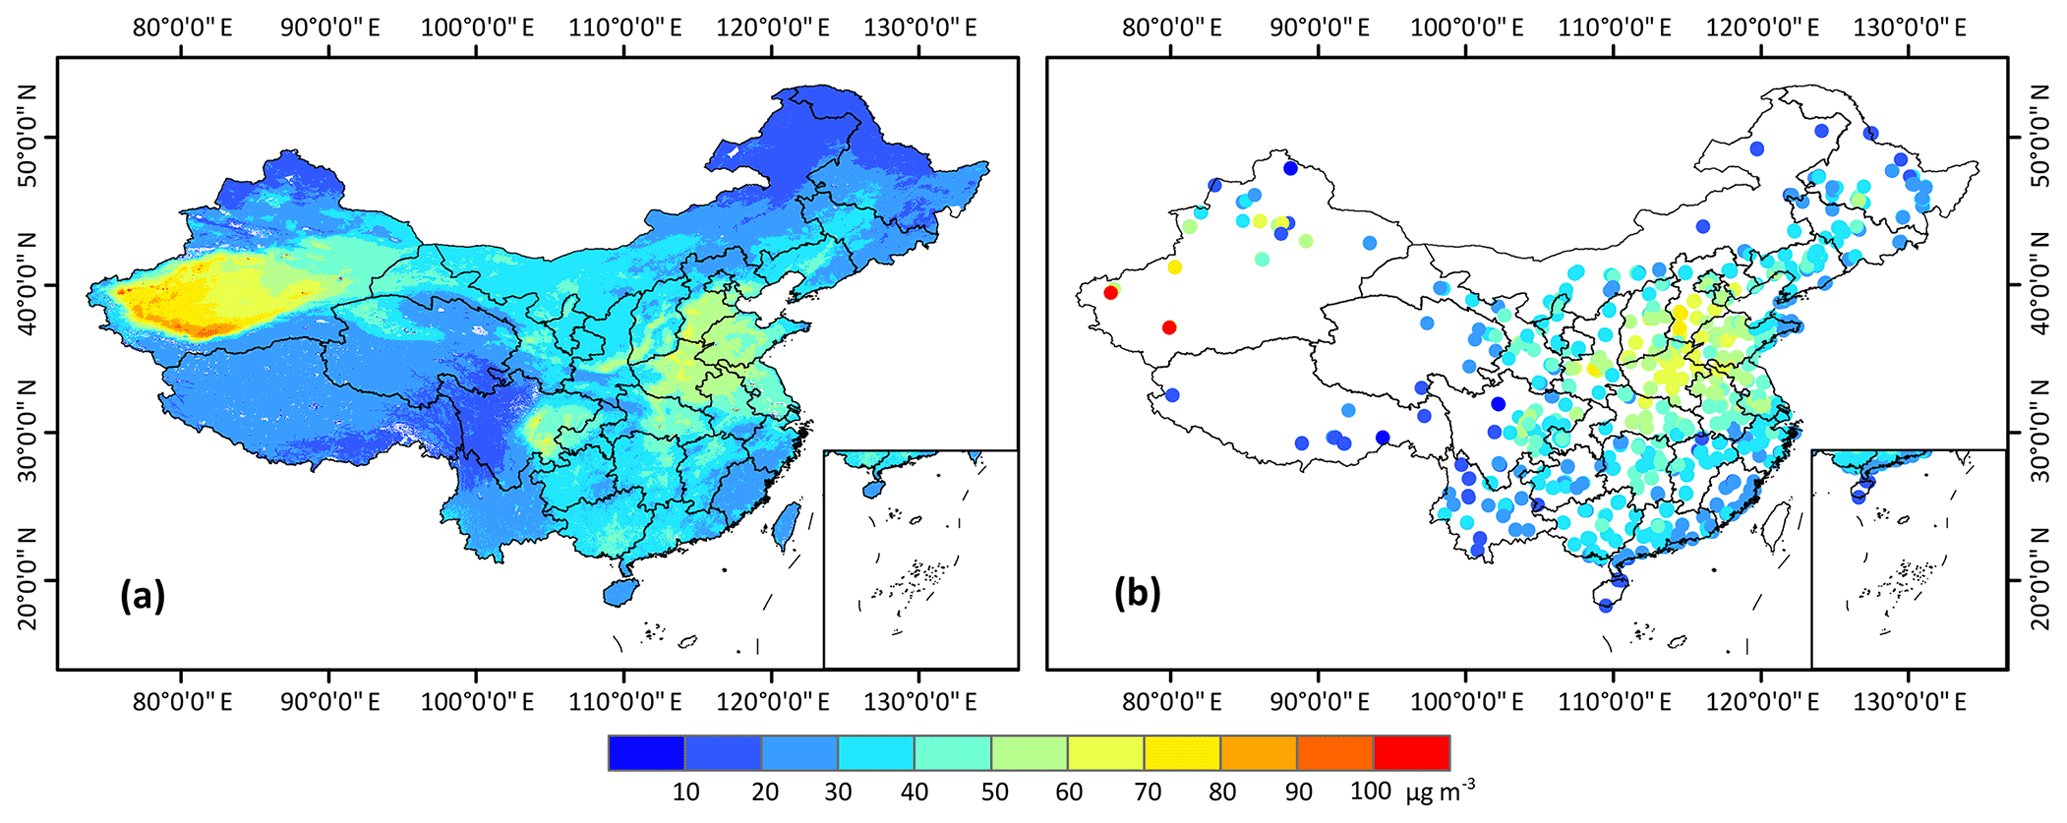
Figure 11Spatial distributions of annual mean (a) PM2.5 estimates and (b) surface observations in 2018 across China.
The satellite-derived 1 km resolution PM2.5 map in 2018 covers almost the full area (spatial coverage =99 %) across mainland China (Fig. 11a) and is highly consistent in spatial pattern with the corresponding in situ measurements (Fig. 11b). The average PM2.5 concentration is 32.7±13.6 µg m−3 in 2018 across mainland China. In general, the most severe PM2.5 pollution occurs in the Taklamakan Desert, where most areas are exposed to high PM2.5 concentrations of >80 µg m−3. There are also high pollution levels over the NCP, the SCB and the YRD, with annual mean PM2.5 values of 46.7±10.5, 39.8±9.9 and 38.4±8.3 µg m−3, respectively, arising from intensive human activities, and special topographic and meteorological conditions. In contrast, the annual mean PM2.5 loading is overall low over the rest of China, e.g., the PRD (33.4±3.9 µg m−3). However, there may be poor representativeness for areas in western China with few ground monitoring stations. More than 34 % of mainland China experienced high PM2.5 levels in 2018, exceeding the international and national recommended air quality level (PM2.5>35 µg m−3).
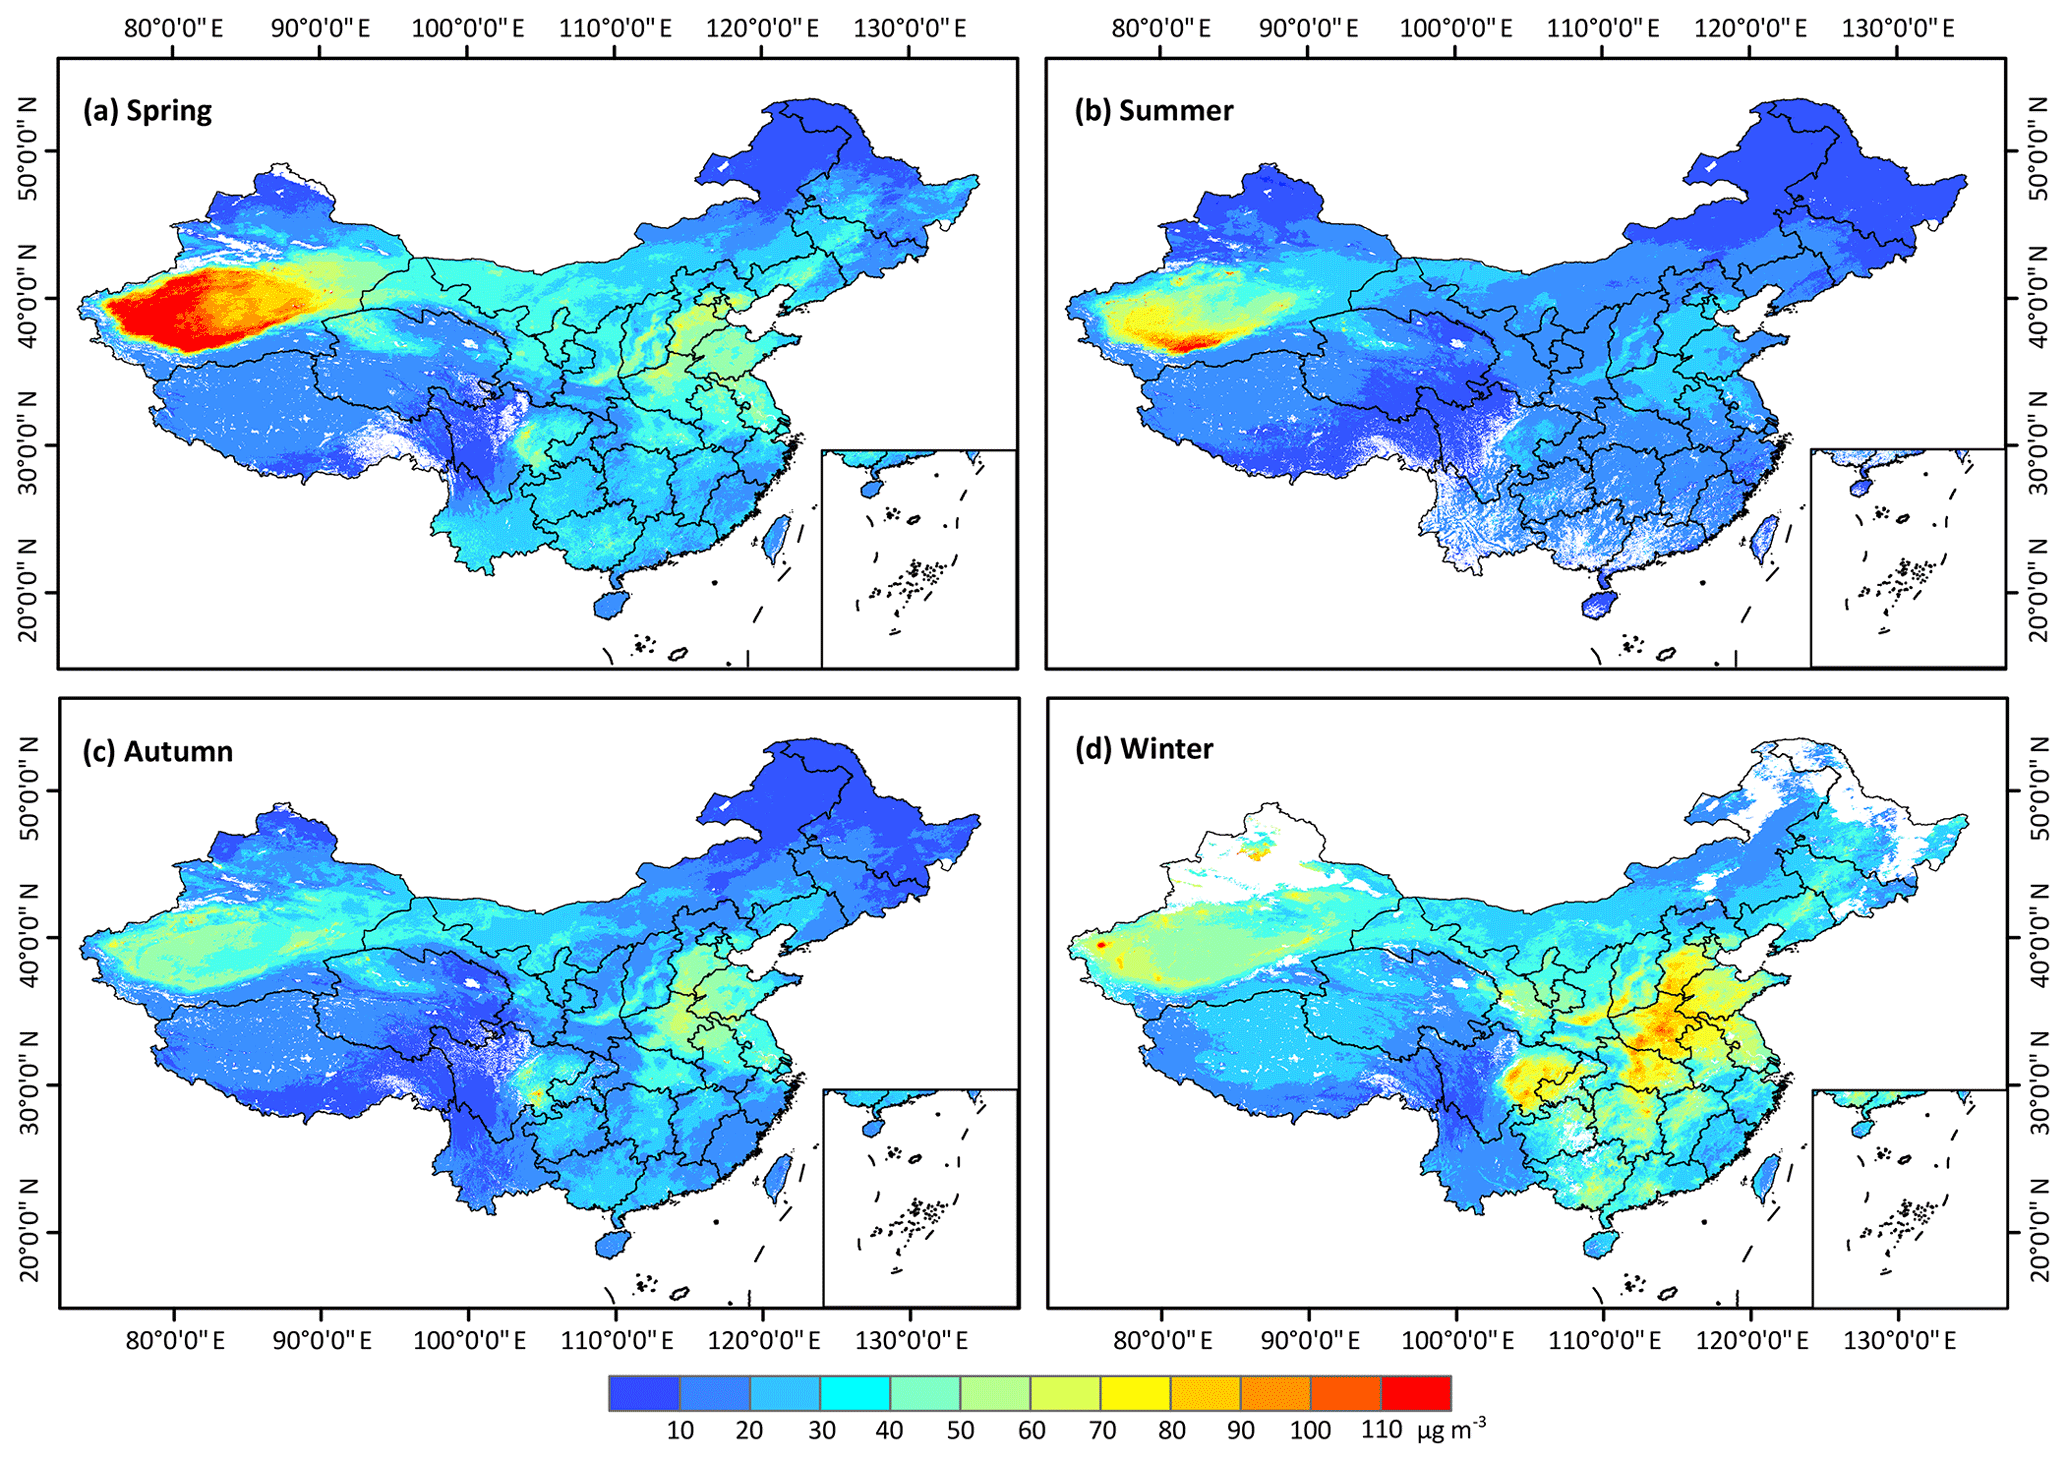
Figure 12Spatial distributions of seasonal mean 1 km resolution PM2.5 concentrations in 2018 across China.
Figure 12 shows seasonal mean PM2.5 maps, averaged from available monthly values for each grid, in 2018 across China. The average PM2.5 concentration (spatial coverage) is 37.2±20.7 µg m−3 (∼96 %), 25.5±12.1 µg m−3 (∼92 %), 29.5±11.5 µg m−3 (∼97 %) and 41.3±15.4 µg m−3 (∼88 %) for spring, summer, autumn and winter, respectively. There are noticeable spatial differences in PM2.5 distributions on the seasonal scale. In winter and spring, more than 49 % and 42 % of mainland China were exposed to high PM2.5 levels > 30 µg m−3, resulting in poor quality. In contrast, PM2.5 pollution is lower in summer and autumn, with more than 90 % and 74 % of mainland China, respectively, experiencing PM2.5 levels below the acceptable air quality level. Note that in spring, PM2.5 concentrations are particularly high in Xinjiang Province due to frequent sand and dust episodes in 2018.
5.1 Model accuracy
There is an increasing number of studies on estimating PM2.5 using satellite AOD products from local to national scales across China. However, limited by the operational satellite aerosol products, PM2.5 can only be estimated at coarse spatial resolutions of approximately 6–10 km (Fang et al., 2016; T. Li et al., 2017b; Yu et al., 2017; Chen et al., 2018; Ma et al., 2019; Yao et al., 2019). Recently, with the release of MODIS 3 km DT aerosol products, PM2.5 estimates can be improved to a 3 km spatial resolution across China (You et al., 2016; T. Li et al., 2017a; He and Huang, 2018; Chen et al., 2019; Xue et al., 2019). This study improves the spatial resolution of PM2.5 estimates across mainland China to 1 km based on the newly released high-quality MAIAC products.
Table 2Comparison between model performances of the enhanced STET model and other models from previous related studies focused on China.
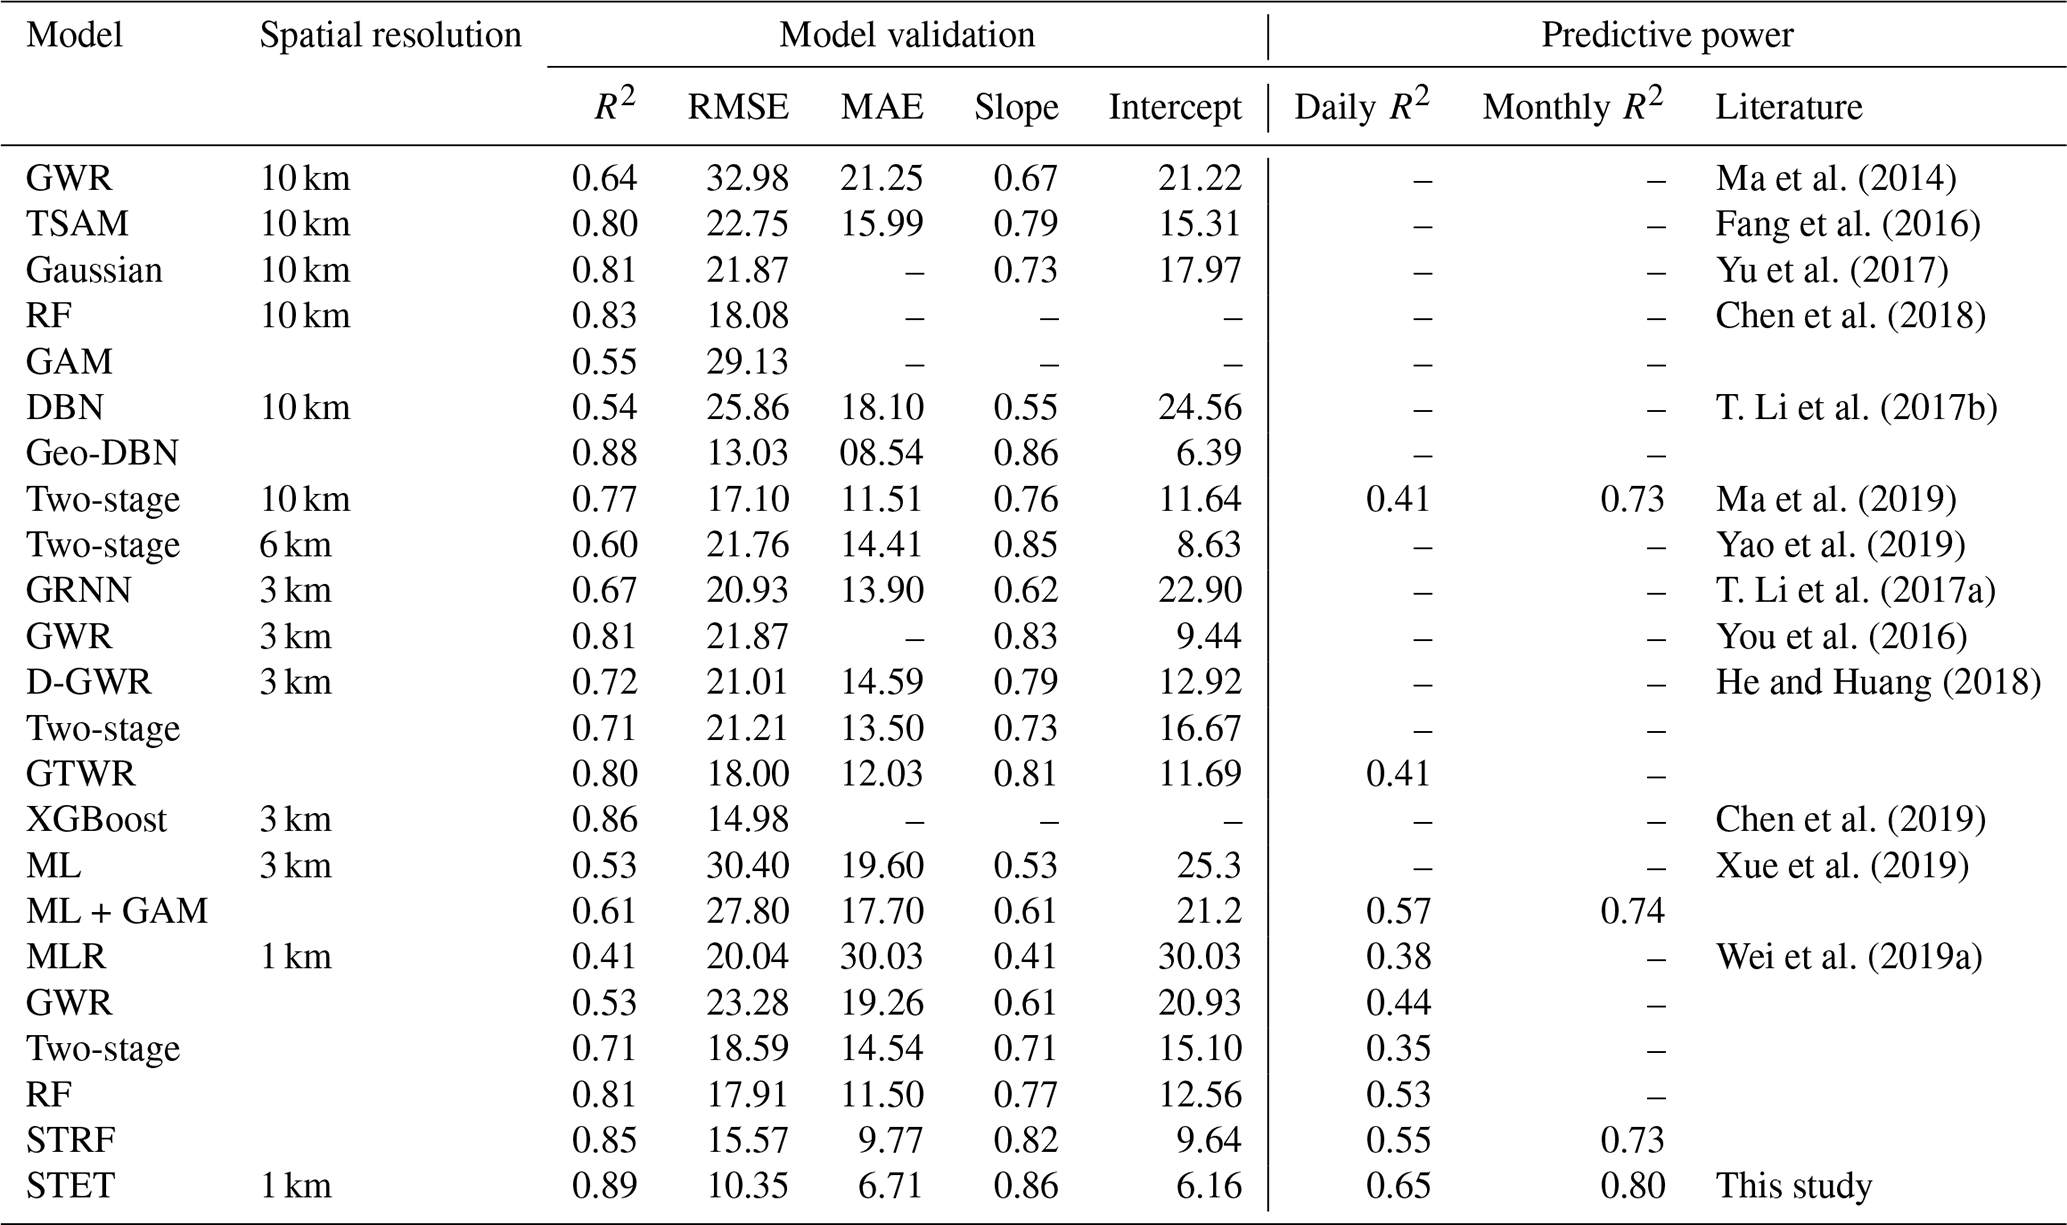
Regarding model performance, our newly developed STET model is more accurate, with higher CV R2 values and smaller RMSE and MAE values than those from statistical regression models (Table 2), e.g., the timely structure adaptive model (TSAM; Fang et al., 2016), the Generalized Additive Model (GAM; Chen et al., 2018) model, the GWR model (Ma et al., 2014; You et al., 2016), and the geographically and temporally weighted regression model (GTWR; He and Huang, 2018). The enhanced STET model can also outperform most machine learning (ML) and deep learning approaches including the Gaussian model (Yu et al., 2017), the random forest model (Chen et al., 2018; Wei et al., 2019a), the XGBoost model (Chen et al., 2019), the GRNN and deep brief network (DBN) models (T. Li et al., 2017a, b), and some optical combined models, e.g., the Daily-GWR model (D-GWR; He and Huang, 2018), the two-stage model (He and Huang, 2018; Ma et al., 2019; Yao et al., 2019) and the ML + GAM model (Xue et al., 2019).
We find that all traditional statistical regression models and machine and deep approaches reported in previous studies underestimated PM2.5 concentrations under highly polluted conditions, with poor regressions (i.e., slope <0.9 and intercept >6 µg m−3) between measurements and retrievals of PM2.5 in China, a common problem. Potential causes are as follows: (1) there are large estimation errors in AOD retrievals under severe pollution conditions in China (Wei et al., 2019c). This is further rooted to the fundamental limitations of satellite-based AOD retrievals, i.e., the nonlinear to reflectance and the high sensitivity of the single-scattering albedo (Li et al., 2009); (2) high AOD does not correspond to high PM2.5 concentrations because their ratio is highly variable over space and time, affected by both natural and human factors; and (3) the number of samples for high-pollution cases is small, hindering the ability to train the model. Therefore, our model also tends to underestimate PM2.5 concentrations on highly polluted days (PM2.5>150 µg m−3); however, it can more accurately capture the high pollution events, with a larger slope of 0.86 and a smaller intercept of 6.16 µg m−3 with reference to other models reported from previous studies (Table 2).
Furthermore, compared with daily PM1 estimates using the STET model in our previous study (CV R2=0.76 and slope =0.70; Wei et al., 2019b), the overall accuracy of daily PM2.5 estimates using the enhanced STET model has improved significantly, with a much higher CV R2 of 0.89 and a steeper slope of 0.86, based on data from 2018 in China. Continuous improvements of the model can further improve the determination of the relationship between fine particulate matter and AOD so as to improve the model performance. More data samples may also help improve the training ability of the model.
5.2 Predictive power
To test the predictive power of the enhanced STET model, the model built for the year 2018 was used to predict daily PM2.5 concentrations in 2017, validated against the ground measurements from 2017. Results suggest that our new model can correctly capture more than 65 % of the historical daily PM2.5 concentrations (N=177 616). Monthly (N=12 408), seasonal (N=5227) and annual (N=1461) mean PM2.5 predictions across China are highly correlated with surface observations, with R2 values of 0.80, 0.81 and 0.82, respectively, having overall small estimation uncertainties (i.e., RMSE <12 µg m−3, MAE <9 µg m−3 and MRE <26 µg m−3). There are only a handful of studies examining the predictive powers of models estimating PM2.5 concentrations in China. Comparisons show that the enhanced STET model is superior to those reported in previous studies, i.e., the two-stage model (Ma et al., 2019), the GTWR model (He and Huang, 2018), the ML + GAM model (Xue et al., 2019) and the space–time RF model (Wei et al., 2019a). The enhanced STET model has a strong predictive power and can be used to estimate historical PM2.5 concentrations in China.
With the increase in air pollution over recent years, abundant studies on estimating PM2.5 have been performed using satellite remote sensing. However, most of the PM2.5 estimates are reported at spatial resolutions of 3–10 km, which is inadequate for monitoring air quality in urban areas. Traditional models also limit the accuracy of PM2.5 estimates. Here, we present spatially continuous high-resolution (1 km) and high-quality PM2.5 dataset across mainland China (i.e., ChinaHighPM2.5). For this, an enhanced STET model was developed to minimize spatiotemporal heterogeneities and improve the overall estimate accuracy of ground-level PM2.5 concentrations.
Our results suggest that the enhanced STET model estimates well the daily PM2.5 concentrations at the national scale, with a relatively high sample-based cross-validation coefficient of 0.89, low RMSE of 10.35 µg m−3, MAE of 6.71 µg m−3 and MRE of 21.37 %. Comparisons illustrate that spatiotemporal information is important and should be carefully considered during model development. The enhanced STET model estimates PM2.5 concentrations well at most monitoring stations and individual days in the year. The North China Plain and the Sichuan Basin regions, under the influence of intense human activities and poor dispersion conditions, have high PM2.5 loadings. The enhanced STET model can outperform most models presented in previous related studies in terms of spatial resolution, model accuracy and predictive power. This study suggests that the ChinaHighPM2.5 dataset will be useful in future atmospheric pollution studies focused on medium- or small-scale areas. The enhanced STET model may be applied in the future to produce historical PM2.5 datasets for China because the MODIS data record extends back 20 years.
The ChinaHighPM2.5 dataset is available by contacting the first author (weijing_rs@163.com; weijing.rs@gmail.com). The in situ PM2.5 measurements are available from the China National Environmental Monitoring Center (http://www.cnemc.cn, CNEMC, 2019). The MODIS series products are available at https://search.earthdata.nasa.gov/ (NASA, 2019a), and the ERA-Interim reanalysis products are available at https://www.ecmwf.int/en/forecasts/datasets/reanalysis-datasets/era-interim (ECMWF, 2019). The AERONET measurements are available at https://aeronet.gsfc.nasa.gov/ (NASA, 2019b).
ZL designed the research, and JW carried out the research and wrote the initial draft of this paper. MC, LS, JG, YP and JL helped edit and review the manuscript. WH, WX, AL, LL, HW and YS helped collect and process data. All authors made substantial contributions to this work.
The authors declare that they have no conflict of interest.
We would like to thank Qiang Zhang at Tsinghua University for providing MEIC pollution emission data in China.
This research has been supported by the National Key R&D Program of China (grant no. 2017YFC1501702), the National Natural Science Foundation of China (grant no. 91544217), the U.S. National Science Foundation (grant no. AGS1534670) and the BNU Interdisciplinary Research Foundation for the First-Year Doctoral Candidates (grant no. BNUXKJC1808).
This paper was edited by Hang Su and reviewed by three anonymous referees.
Aggarwal, P. and Jain, S.: Impact of air pollutants from surface transport sources on human health: a modeling and epidemiological approach, Environ. Int., 83, 146–157, 2015.
Bartell, S. M., Longhurst, J., Tjoa, T., Sioutas, C., and Delfino, R. J.: Particulate air pollution, ambulatory heart rate variability, and cardiac arrhythmia in retirement community residents with coronary artery disease, Environ. Health Persp., 121, 1135–1141, 2013.
Brokamp, C., Jandarov, R., Hossain, M., and Ryan, P.: Predicting daily urban fine particulate matter concentrations using a random forest model, Environ. Sci. Tech., 52, 4173–4179, 2018.
Calle, M. and Urrea, V.: Letter to the editor: satiability of random forest importance measures, Brief. Bioinform., 12, 86–89, 2011.
Chen, G., Li, S., Knibbs, L., Hamm, N., Cao, W., Li, T., Guo, J., Ren, H., Abramson, M., and Guo, Y.: A machine learning method to estimate PM2.5 concentrations across China with remote sensing, meteorological and land use information, Sci. Total Environ., 636, 52–60, 2018.
Chen, Z., Zhang, T., Zhang, R., Zhu, Z., Yang, J., Chen, P., Ou, C., and Guo, Y.: Extreme gradient boosting model to estimate PM2.5 concentrations with missing-filled satellite data in China, Atmos. Environ., 202, 180–189, 2019.
Chowdhury, S. and Dey, S.: Cause-specific premature death from ambient PM2.5 exposure in India: estimate adjusted for baseline mortality, Environ. Int., 91, 283–290, 2016.
CNEMC: available at: http://www.cnemc.cn, last access: 1 December 2019.
Crippa, M., Janssens-Maenhout, G., Guizzardi, D., Van Dingenen, R., and Dentener, F.: Contribution and uncertainty of sectorial and regional emissions to regional and global PM2.5 health impacts, Atmos. Chem. Phys., 19, 5165–5186, https://doi.org/10.5194/acp-19-5165-2019, 2019.
ECMWF: ERA-Interim, available at: https://www.ecmwf.int/en/forecasts/datasets/reanalysis-datasets/era-interim, last access: 1 December 2019.
Fang, X., Zou, B., Liu, X., Sternberg, T., and Zhai, L.: Satellite-based ground PM2.5 estimation using timely structure adaptive modeling, Remote Sens. Environ., 186, 152–163, 2016.
Geurts, P., Ernst, D., and Wehenkel, L.: Extremely randomized trees, Mach. Learn., 63, 3–42, 2006.
Guo, J., Zhang, X., Che, H., Gong, S., An, X., Cao, C., Guang, J., Zhang, H., Wang, Y., Zhang, X., Xue, M., and Li, X.: Correlation between PM concentrations and aerosol optical depth in eastern China, Atmos. Environ., 43, 5876–5886, 2009.
Guo, J., Xia, F., Zhang, Y., Liu, H., Li, J., Lou, M, He, J., Yan, Y., Wang, F., Min, M., and Zhai, P.: Impact of diurnal variability and meteorological factors on the PM2.5-AOD relationship: implications for PM2.5 remote sensing, Environ. Pollut., 221, 94–104, 2017.
Gupta, P. and Christopher, S.: Particulate matter air quality assessment using integrated surface, satellite, and meteorological products: multiple regression approach, J. Geophys. Res.-Atmos., 114, D14205, https://doi.org/10.1029/2008JD011496, 2009.
Han, L., Zhou, W., Li, W., and Li, L.: Impact of urbanization level on urban air quality: a case of fine particles (PM2.5) in Chinese cities, Environ. Pollut., 194, 163–170, 2014.
He, K., Hong Huo, A., and Zhang, Q.: Urban air pollution in China: current status, characteristics, and progress, Annu. Rev. Energ. Env., 27, 397–431, 2011.
He, Q. and Huang, B.: Satellite-based mapping of daily high-resolution ground PM2.5 in China via space-time regression modelling, Remote Sens. Environ., 206, 72–83, 2018.
Hsu, N. C., Gautam, R., Sayer, A. M., Bettenhausen, C., Li, C., Jeong, M. J., Tsay, S.-C., and Holben, B. N.: Global and regional trends of aerosol optical depth over land and ocean using SeaWiFS measurements from 1997 to 2010, Atmos. Chem. Phys., 12, 8037–8053, https://doi.org/10.5194/acp-12-8037-2012, 2012.
Huang, R., Zhang, Y., Bozzetti, C., Ho, K., Cao, J., Han, Y., Daellenbach, K., Slowik, J., Platt, S., Canonaco, F., Zotter, P., Wolf, R., Pieber, S., Bruns, E., Cripa, M., Ciarelli, G., Piazzalunga, A., Schwikowski, M., Abbaszade, G., Schnelle-Kreis, J., Zimmermann, R., An, Z., Szidat., S., Baltensperger, U., Haddad, I., and Prévôt, A.: High secondary aerosol contribution to particulate pollution during haze events in China, Nature, 514, 218–222, 2014.
Jiang, R., Tang, W., Wu, X., and Fu, W.: A random forest approach to the detection of epistatic interactions in case-control studies, BMC Bioinformatics, 10, 135–135, 2009.
Jin, X., Wang, Y., Li, Z., Zhang, F., Xu, W., Sun, Y., Fan, X., Chen, G., Wu, H., Ren, J., Wang, Q., and Cribb, M.: Significant contribution of organics to aerosol liquid water content in winter in Beijing, China, Atmos. Chem. Phys., 20, 901–914, https://doi.org/10.5194/acp-20-901-2020, 2020.
Koren, I., Dagan, G., and Altaratz, O.: From aerosol-limited to invigoration of warm convective clouds, Science, 344, 1143–1146, 2014.
Levy, R. C., Mattoo, S., Munchak, L. A., Remer, L. A., Sayer, A. M., Patadia, F., and Hsu, N. C.: The Collection 6 MODIS aerosol products over land and ocean, Atmos. Meas. Tech., 6, 2989–3034, https://doi.org/10.5194/amt-6-2989-2013, 2013.
Li, T., Shen, H., Zeng, C., Yuan, Q., and Zhang, L.: Point-surface fusion of station measurements and satellite observations for mapping PM2.5 distribution in China: methods and assessment, Atmos. Environ., 152, 477–489, 2017a.
Li, T., Shen, H., Yuan, Q., Zhang, X., and Zhang, L.: Estimating ground-level PM2.5 by fusing satellite and station observations: a geo-intelligent deep learning approach, Geophys. Res. Lett., 44, 11985–11993, 2017b.
Li, Z., Zhao, X., Kahn, R., Mishchenko, M., Remer, L., Lee, K.-H., Wang, M., Laszlo, I., Nakajima, T., and Maring, H.: Uncertainties in satellite remote sensing of aerosols and impact on monitoring its long-term trend: a review and perspective, Ann. Geophys., 27, 2755–2770, https://doi.org/10.5194/angeo-27-2755-2009, 2009.
Li, Z., Guo, J., Ding, A., Liao, H., Liu, J., Sun, Y., Wang, T., Xue, H., Zhang, H., and Zhu, B.: Aerosol and boundary-layer interactions and impact on air quality, Natl. Sci. Rev., 4, 810–833, 2017.
Liu, M., Huang, Y., Ma, Z., Jin, Z., Liu, X., Wang, H., Liu, Y., Wang, J., Jantunen, M., Bi, J., and Kinney, P. L.: Spatial and temporal trends in the mortality burden of air pollution in China: 2004–2012, Environ. Intl., 98, 75–81, 2017.
Liu, N., Zou, B., Feng, H., Wang, W., Tang, Y., and Liang, Y.: Evaluation and comparison of multiangle implementation of the atmospheric correction algorithm, Dark Target, and Deep Blue aerosol products over China, Atmos. Chem. Phys., 19, 8243–8268, https://doi.org/10.5194/acp-19-8243-2019, 2019.
Lyapustin, A., Wang, Y., Laszlo, I., Kahn, R., Korkin, S., Remer, L., Levy, R., and Reid, J.: Multiangle implementation of atmospheric correction (MAIAC): 2. Aerosol algorithm, J. Geophys. Res.-Atmos., 116, D03211, https://doi.org/10.1029/2010JD014986, 2011.
Lyapustin, A., Wang, Y., Korkin, S., and Huang, D.: MODIS Collection 6 MAIAC algorithm, Atmos. Meas. Tech., 11, 5741–5765, https://doi.org/10.5194/amt-11-5741-2018, 2018.
Ma, Z., Hu, X., Huang, L., Bi, J., and Liu, Y.: Estimating ground-level PM2.5 in China using satellite remote sensing, Environ. Sci. Tech., 48, 7436–7444, 2014.
Ma, Z., Liu, R., Liu, Y., and Bi, J.: Effects of air pollution control policies on PM2.5 pollution improvement in China from 2005 to 2017: a satellite-based perspective, Atmos. Chem. Phys., 19, 6861–6877, https://doi.org/10.5194/acp-19-6861-2019, 2019.
NASA: EARTHDATA, available at: https://search.earthdata.nasa.gov/, last access: 1 December 2019a.
NASA: AERONET, available at: https://aeronet.gsfc.nasa.gov/, last access: 1 December 2019b.
Peng, R. D., Bell, M. L., Geyh, A. S., McDermott, A., Zeger, S. L., Samet, J. M., and Dominici, F.: Emergency admissions for cardiovascular and respiratory diseases and the chemical composition of fine particle air pollution, Environ. Health Persp., 117, 957–963, 2009.
Reddington, C. L., Morgan, W. T., Darbyshire, E., Brito, J., Coe, H., Artaxo, P., Scott, C. E., Marsham, J., and Spracklen, D. V.: Biomass burning aerosol over the Amazon: analysis of aircraft, surface and satellite observations using a global aerosol model, Atmos. Chem. Phys., 19, 9125–9152, https://doi.org/10.5194/acp-19-9125-2019, 2019.
Rodriguez, J. D., Perez, A., and Lozano, J. A.: Sensitivity analysis of k-fold cross validation in prediction error estimation, IEEE T. Pattern Anal., 32, 569–575, 2010.
Seinfeld, J. H., Bretherton, C., Carslaw, K. S., Coe, H., Demott, P. J., Dunlea, E. J., Feingold, G., Ghan, S., Chan, S., Guenther, A., Kahn, R., Kredenweis, S., Molina, M., Nenes, A., Penner, J., Prather, K., Ramanathan, V., Ramaswamy, V., Rashch, P., and Ravishankara, A.: Improving our fundamental understanding of the role of aerosol-cloud interactions in the climate system, P. Natl. Acad. Sci. USA, 113, 5781–5790, 2016.
Silva, R., West, J., Zhang, Y., Anenberg, S., Lamarque, J., Shindell, D., Collins, W., Dalsøren, S., Faluvegi, G., Folberth, G., Horowitz, L., Nagashima, T., Naik, V., Rumbold, S., Skeie, R., Sudo, K., Takemura, T., Bergmann, D., Cameron-Smith, P., Cionni, I., Doherty, R., Eyring, V., Josse, B., MacKenzie, I., Plummer, D., Righi, M., Stevenson, D., Strode, S., Szopa, S., and Zeng, G.: Global premature mortality due to anthropogenic outdoor air pollution and the contribution of past climate change, Environ. Res. Lett., 8, 034005, https://doi.org/10.1088/1748-9326/8/3/034005, 2013.
Song, Y., Huang, B., He, Q., Chen, B., Wei, J., and Mahmood, R.: Dynamic assessment of PM2.5 exposure and health risk using remote sensing and geo-spatial big data, Environ. Pollut., 253, 288–296, 2019.
Su, T., Li, Z., and Kahn, R.: Relationships between the planetary boundary layer height and surface pollutants derived from lidar observations over China: regional pattern and influencing factors, Atmos. Chem. Phys., 18, 15921–15935, https://doi.org/10.5194/acp-18-15921-2018, 2018.
Su, T., Li, Z., and Kahn, R.: A new method to retrieve the diurnal variability of planetary boundary layer height from lidar under different thermodynamic stability conditions, Remote Sens. Environ., 237, 111519, https://doi.org/10.1016/j.rse.2019.111519, 2020.
Sun, L., Wei, J., Duan, D., Guo, Y., Yang, D., Jia, C., and Mi, X.: Impact of land-use and land-cover change on urban air quality in representative cities of China, J. Atmos. Sol.-Terr. Phy., 142, 43–54, 2016.
Sun, Y., Jiang, Q., Wang, Z., Fu, P., Li, J., Yang, T., and Yin, Y.: Investigation of the sources and evolution processes of severe haze pollution in Beijing in January 2013, J. Geophys. Res.-Atmos., 119, 4380–4398, 2014.
Tao, M., Wang, J., Li, R., Wang, L., Wang, L., Wang, Z., Tao, J., Che, H., and Chen, L.: Performance of MODIS high-resolution MAIAC aerosol algorithm in China: characterization and limitation, Atmos. Environ., 213, 159–169, 2019.
Wei, J. and Sun, L.: Comparison and evaluation of different MODIS aerosol optical depth products over Beijing-Tianjin-Hebei region in China, IEEE J. Sel. Top. Appl. 10, 835–844, https://doi.org/10.1109/JSTARS.2016.2595624, 2017.
Wei, J., Sun, L., Huang, B., Bilal, M., Zhang, Z., and Wang, L.: Verification, improvement and application of aerosol optical depths in China. Part 1: Inter-comparison of NPP-VIIRS and Aqua-MODIS, Atmos. Environ., 175, 221–233, 2018a.
Wei, J., Sun, L., Peng, Y., Wang, L., Zhang, Z., Bilal, M., Ma, Y.: An improved high-spatial-resolution aerosol retrieval algorithm for MODIS images over land. J. Geophys. Res.-Atmos. 123, 12291–12307, https://doi.org/10.1029/2017JD027795, 2018b.
Wei, J., Huang, W., Li, Z., Xue, W., Peng, Y., Sun, L., and Cribb, M.: Estimating 1 km-resolution PM2.5 concentrations across China using the space-time random forest approach, Remote Sens. Environ., 231, 111221, https://doi.org/10.1016/j.rse.2019.111221, 2019a.
Wei, J., Li, Z., Guo, J., Sun, L., Huang, W., Xue, W., Fan, T., and Cribb, M.: Satellite-derived 1 km-resolution PM1 concentrations from 2014 to 2018 across China, Environ. Sci. Tech., 53, 13265–13274, https://doi.org/10.1021/acs.est.9b03258, 2019b.
Wei, J., Li, Z., Peng, Y., and Sun, L.: MODIS Collection 6.1 aerosol optical depth products over land and ocean: validation and comparison, Atmos. Environ., 201, 428–440, 2019c.
Wei, J., Li, Z., Sun, L., Peng, Y., and Wang, L.: Improved merge schemes for MODIS Collection 6.1 Dark Target and Deep Blue combined aerosol products, Atmos. Environ., 202, 315–327, 2019d.
Wei, J., Li, Z., Peng, Y., Sun, L., and Yan, X.: A regionally robust high-spatial-resolution aerosol retrieval algorithm for MODIS images over Eastern China, IEEE T. Geosci. Remote, 57, 4748–4757, 2019e.
Wei, J., Peng, Y., Mahmood, R., Sun, L., and Guo, J.: Intercomparison in spatial distributions and temporal trends derived from multi-source satellite aerosol products, Atmos. Chem. Phys., 19, 7183–7207, https://doi.org/10.5194/acp-19-7183-2019, 2019f.
Wu, J., Zheng, H., Zhe, F., Xie, W., and Song, J.: Study on the relationship between urbanization and fine particulate matter (PM2.5) concentration and its implication in China, J. Clean. Prod., 182, 872–882, 2018.
Xiao, Q., Wang, Y., Chang, H. H., Meng, X., Geng, G., Lyapustin, A., and Liu, Y.: Full-coverage high-resolution daily PM2.5 estimation using MAIAC AOD in the Yangtze River Delta of China, Remote Sens. Environ., 199, 437–446, 2017.
Xue, T., Zheng, Y., Tong, D., Zheng, B., Li, X., Zhu, T., and Zhang, Q.: Spatiotemporal continuous estimates of PM2.5 concentrations in China, 2000–2016: a machine learning method with inputs from satellites, chemical transport model, and ground observations, Environ. Int., 123, 345–357, 2019.
Yao, F., Wu, J., Li, W., and Peng, J.: A spatially structured adaptive two-stage model for retrieving ground-level PM2.5 concentrations from VIIRS AOD in China, ISPRS J. Photogramm., 151, 263–276, 2019.
You, W., Zang, Z., Zhang, L., Li, Y., Pan, X., and Wang, W.: National-scale estimates of ground-level PM2.5 concentration in China using geographically weighted regression based on 3 km resolution MODIS AOD, Remote Sens., 8, 184, https://doi.org/10.3390/rs8030184, 2016.
Yu, W., Liu, Y., Ma, Z., and Bi, J.: Improving satellite-based PM2.5 estimates in China using Gaussian processes modeling in a Bayesian hierarchical setting, Sci. Rep., 7, 7048, https://doi.org/10.1038/s41598-017-07478-0, 2017.
Zhai, S., Jacob, D. J., Wang, X., Shen, L., Li, K., Zhang, Y., Gui, K., Zhao, T., and Liao, H.: Fine particulate matter (PM2.5) trends in China, 2013–2018: separating contributions from anthropogenic emissions and meteorology, Atmos. Chem. Phys., 19, 11031–11041, https://doi.org/10.5194/acp-19-11031-2019, 2019.
Zhang, Q., Streets, D., He, K., and Klimont, Z.: Major components of China's anthropogenic primary particulate emissions, Environ. Res. Lett., 2, 045027, https://doi.org/10.1088/1748-9326/2/4/045027, 2007.
Zhang, Y. and Li, Z.: Remote sensing of atmospheric fine particulate matter (PM2.5) mass concentration near the ground from satellite observations, Remote Sens. Environ., 160, 252–262, 2015.
Zhang, Z., Wu, W., Fan, M., Wei, J., Tan, Y., and Wang, Q.: Evaluation of MAIAC aerosol retrievals over China, Atmos. Environ., 202, 8–16, 2019.
Zheng, G. J., Duan, F. K., Su, H., Ma, Y. L., Cheng, Y., Zheng, B., Zhang, Q., Huang, T., Kimoto, T., Chang, D., Pöschl, U., Cheng, Y. F., and He, K. B.: Exploring the severe winter haze in Beijing: the impact of synoptic weather, regional transport and heterogeneous reactions, Atmos. Chem. Phys., 15, 2969–2983, https://doi.org/10.5194/acp-15-2969-2015, 2015.