the Creative Commons Attribution 4.0 License.
the Creative Commons Attribution 4.0 License.
 | 06 Mar 2020
Investigating the regional contributions to air pollution in Beijing: a dispersion modelling study using CO as a tracer
Zoë L. Fleming
Paul S. Monks
Matthew J. Ashfold
Oliver Wild
Michael Hollaway
Qiang Zhang
Freya A. Squires
Joshua D. Vande Hey
The rapid urbanization and industrialization of northern China in recent decades has resulted in poor air quality in major cities like Beijing. Transport of air pollution plays a key role in determining the relative influence of local emissions and regional contributions to observed air pollution. In this paper, dispersion modelling (Numerical Atmospheric Modelling Environment, NAME model) is used with emission inventories and in situ ground measurement data to track the pathways of air masses arriving in Beijing. The percentage of time the air masses spent over specific regions during their travel to Beijing is used to assess the effects of regional meteorology on carbon monoxide (CO), a good tracer of anthropogenic emissions. The NAME model is used with the MEIC (Multi-resolution Emission Inventory for China) emission inventories to determine the amount of pollution that is transported to Beijing from the immediate surrounding areas and regions further away. This approach captures the magnitude and variability of CO over Beijing and reveals that CO is strongly driven by transport processes. This study provides a more detailed understanding of relative contributions to air pollution in Beijing under different regional airflow conditions. Approximately 45 % over a 4-year average (2013–2016) of the total CO pollution that affects Beijing is transported from other regions, and about half of this contribution comes from beyond the Hebei and Tianjin regions that immediately surround Beijing. The industrial sector is the dominant emission source from the surrounding regions and contributes over 20 % of the total CO in Beijing. Finally, using PM2.5 to determine high-pollution days, three pollution classification types of pollution were identified and used to analyse the APHH winter campaign and the 4-year period. The results can inform targeted control measures to be implemented by Beijing and the surrounding provinces to tackle air quality problems that affect Beijing and China.
- Article
(3734 KB) - Full-text XML
- BibTeX
- EndNote


Beijing has suffered from poor air quality during recent decades owing to rapid urbanization and industrialization. Air pollution can have adverse effects on human health and ecosystems; studies have shown that air pollution is a major contributor to the disease burden in China, with over a million attributable premature deaths per year (GBD MAPS Working Group, 2016). While air pollution is still at very high levels for human health and the environment (Shi et al., 2019), policy measures implemented over recent years have helped to reduce emissions (Jin et al., 2016; Zheng et al., 2018).
Zheng et al. (2018) conducted an extensive analysis of reductions in anthropogenic emissions of key species in China. Between 2010 and 2017, it is estimated that China reduced its anthropogenic emissions by 62 % for sulfur dioxide (SO2), 17 % for nitrogen oxides (NOx), 27 % for carbon monoxide (CO), 38 % for PM10 (particulate matter smaller than 10 µm in diameter) and 35 % for PM2.5 (particulate matter smaller than 2.5 µm in diameter).
A major contributor to air pollution in Beijing is the transportation of pollutants from other regions owing not just to the major regional sources but also to the meteorology and the topography of Beijing (Wang et al., 2018). Beijing is surrounded by mountains to the north and west of the city, with densely populated industrial areas to the south. The arrival of air masses from the south has been observed to correspond to the formation of pollution episodes (haze events), and air from the north-west leads to the cleansing of the city of pollution (Sun et al., 2016). Zhang et al. (2015) observed the same meteorological pattern with winds from the north-west pushing the pollution away from Beijing, and southerly winds being associated with more polluted days.
Guo et al. (2014) showed that severe pollution episodes in Beijing are largely driven by meteorological conditions. They determined that stagnation usually develops with a weak southerly wind from polluted industrial source regions and that PM2.5 concentrations are anti-correlated with the height of the boundary layer (the lower-most layer of the atmosphere governed by turbulent mixing) in Beijing (Miao et al., 2017). Moreover, the southerly winds transporting aerosols into the city in conjunction with low boundary layer (BL) height can produce heavy aerosol pollution events in Beijing. Tie et al. (2015) reported that during a haze event in October 2013, the PM2.5 concentration in Beijing was 270 µg m−3 in southerly winds. The next day the wind direction changed, with winds arriving from the north and the concentration decreased to 50 µg m−3. Last but not least, dust storms in Beijing are a resulting of the transportation of natural dust from north-western China, due to dominant north-western winds in the spring (Sugimoto et al., 2003).
Sun et al. (2013) determined that particulate matter levels are higher in the winter owing to increased use of coal. In a survey in 2012, it was reported that almost 85 % of heating energy and 41 % of cooking energy in rural China came from the use of solid fuels (Tao et al., 2018). The use of solid fuels in the residential sector can affect indoor and outdoor air quality and can have harmful effects on both human health and climate change (Desai et al., 2004). Wu et al. (2017) determined during a pollution episode in July 2013 that the contribution of aerosol species in Beijing is dominated by transport from outside Beijing, with contributions exceeding 50 % on average.
To implement effective emission controls it is important to understand the role of transport processes that can influence pollutant levels. In this study, we use dispersion modelling to determine the pathways of air masses and further analysis to determine the transportation of carbon monoxide (CO) to Beijing. The objective of this study is to investigate the impact of regional meteorology and transport on the air pollution in Beijing, and to understand the influence of regional air pollution on Beijing under differing meteorological conditions.
2.1 NAME modelling
In this study, we used the UK Met Office's Numerical Atmospheric Modelling Environment (NAME) (Jones et al., 2007) to track the pathways of air masses arriving in Beijing. A large number of hypothetical inert particles (hereafter referred to as “air masses”) are released and their pathways are tracked backwards in time using meteorological fields from the UK Met Office's Unified Model (Brown et al., 2012). These fields from 1 January 2013 to 15 July 2014 have a horizontal grid resolution of 0.35∘ longitude by 0.23∘ latitude and from 15 July 2014 to the end of our study period (31 December 2016) have a resolution of 0.23∘ longitude by 0.16∘ latitude. Throughout, the meteorological fields have 59 vertical levels up to an approximate height of 30 km. The NAME model was chosen as an appropriate model for this study because it uses high-resolution meteorological data of approximately 17 km × 17 km, it can predict dispersion over distances ranging from a few kilometres to the whole globe, and it has been used successfully in similar studies looking at the impact of air mass pathways on air quality (e.g., Fleming et al., 2012; S. Liu et al., 2015; Lowry et al., 2016).
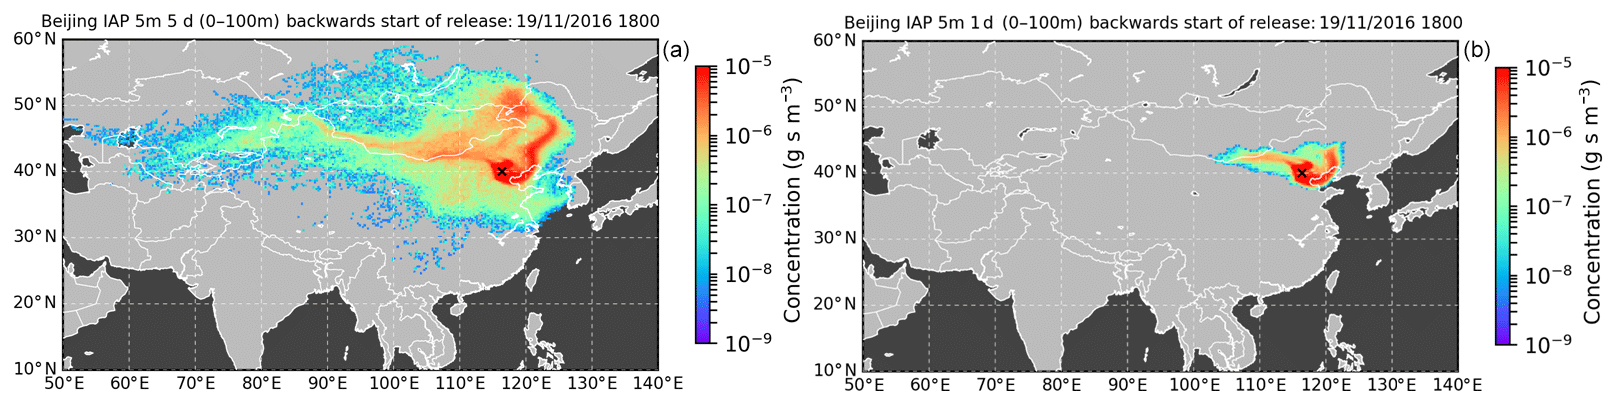
Figure 1Five-day backwards NAME footprint arriving at IAP meteorological tower (a) and 1 d backwards NAME footprint arriving at IAP meteorological tower (b).
To avoid inconsistency in the resolution of the outputs due to the two different resolutions of the meteorological fields, all the NAME footprints are outputted with the same resolution. The output is a 3-hourly footprint with a resolution of , of all the air masses passing through what we define as the surface layer (0–100 ) during their travel to the specified location. For this study, we modelled 5 and 1 d backward footprints from 2013 to 2016. Figure 1 shows an example footprint for the 19 November 2016 at 18:00 UTC (Coordinated Universal Time). The units are based on a release of a known quantity of air masses (hypothetical particles) in grams (g) during an integrated time-period (s) and the results are displayed per grid box, which has a volume component.
To investigate the pathways of air masses arriving in Beijing, we first characterize the air mass pathways based on four quadrants: north-west (N-W), north-east (N-E), south-west (S-W) and south-east (S-E) (see Fig. 2). The four regions intersect at the Institute of Atmospheric Physics (IAP) meteorological tower. The choice of the IAP tower as the centre point was made primarily because the modelled meteorological data could be validated against meteorological data measured from the tower. Figure 3 shows that there is a high degree of similarity between the modelled wind speed and direction (from the meteorological fields) used in NAME and the measured wind speed and direction from the IAP tower. The pathways of the air masses arriving at the IAP tower are important because the chemical and physical composition of an air mass can be influenced by the relative air pollution emissions of the different regions it passes over (Donnelly et al., 2016).
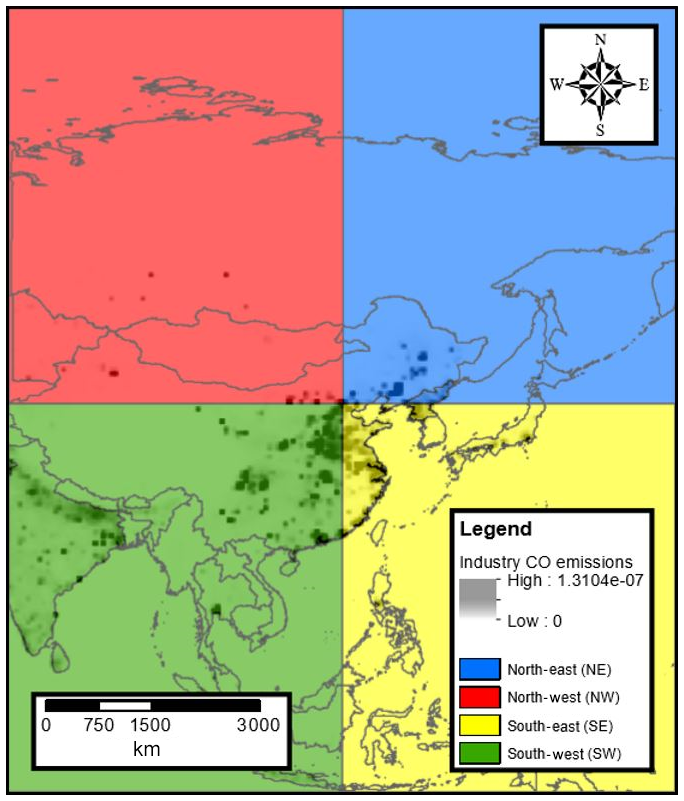
Figure 2The four quadrants created to investigate the air masses arriving in Beijing. Industry CO emissions (kg m2 s−1) from MEIC 2013.

Figure 3(a) Wind rose of the measured met data at 100 m at the IAP tower, (b) wind rose of the modelled met data at the IAP tower. Both wind roses are for November 2016.
2.2 CO transport
We combine the derived NAME footprints and the fluxes from the CO emission inventories to calculate a modelled mixing ratio of the emitted species at the measurement site (Oram et al., 2017). To do this, first we derive the sensitivities of the measured air masses to emissions occurring within a grid cell (units: ) and then by multiplying the sensitivities with the emissions from the emission inventories we are able to calculate the modelled CO concentration (dimensionally, ). To convert the concentration to a volume mixing ratio we divide the modelled concentrations by the molar mass, divide again by the air density and multiply by 1×10⁹. We consider only emissions occurring within the timescale of the NAME footprint. CO is commonly used as a tracer of anthropogenic emissions, as its lifetime of 1–2 months and its weak chemical reactivity make it an appropriate tracer for evaluating regional-scale atmospheric transport (Naeher et al., 2001; Saide et al., 2011).
In this study, the 2013 monthly Multi-resolution Emission Inventory for China (MEIC; Li et al., 2017) emission inventories were used along with the NAME footprint outputs to calculate the pollution transport to Beijing from surrounding regions. MEIC is a bottom-up emission inventory, which covers 31 provinces in mainland China and includes approximately 700 anthropogenic sources. The MEIC emission inventories for CO have a resolution of and are available for four sectors: (a) the industrial sector, (b) the residential sector, (c) the transportation sector and (d) the energy sector. Details of the inventory development and its source classifications can be found in F. Liu et al. (2015). The resolution of the emission inventories was reduced to to match the resolution of the NAME outputs.
The area of interest was split into “regional” to calculate contributions from outside Beijing and “local” to calculate contributions that are emitted from sources within Beijing (Fig. 4).
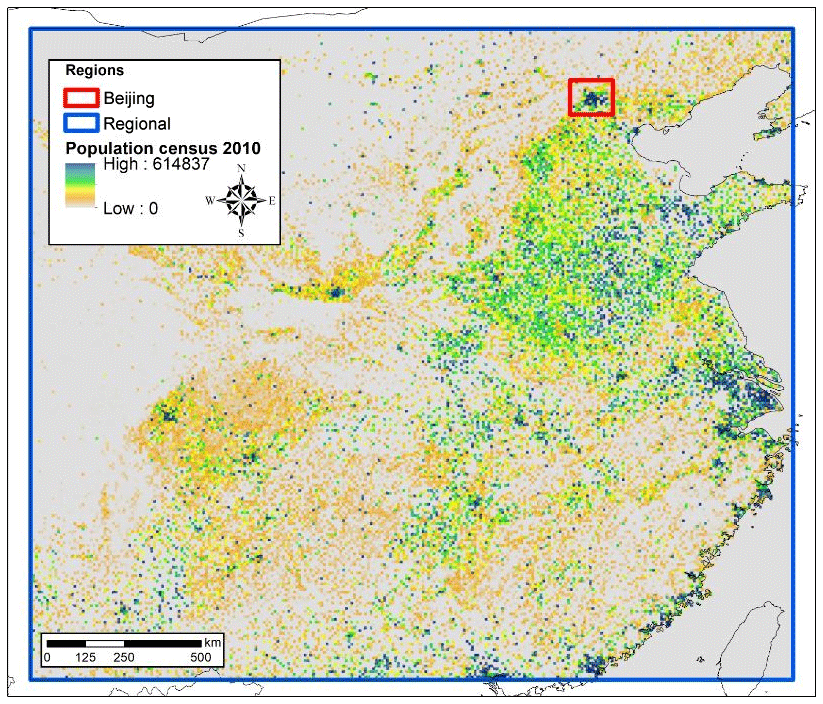
Figure 4The blue box represents the regional contributions from outside Beijing and the red box is the Beijing region. The map also shows the 2010 population census (people per pixel – WorldPop data, 2015).
2.3 In situ measurements
In this study, two different measurement datasets were used. The first is CO and PM2.5 measurements for 2013–2016 from 12 air quality monitoring stations around Beijing that are part of the national air quality monitoring network run by the China National Environmental Monitoring Centre (CNEMC). The second dataset contains CO measurements collected during the winter campaign of the APHH Beijing project that took place from 5 November to 10 December 2016, at the IAP Meteorological tower (39.975∘ N, 116.377∘ E) (Shi et al., 2019). CO measurements at the IAP site were made using six clustered electrochemical sensors (Alphasense Ltd.) encased in a 2×3 formation. In this study, we use the data collected at the IAP meteorological tower (Shi et al., 2019) to validate the modelled CO data and the CNEMC datasets to compare with our modelled CO from 2013–2016 and determine the pollution events in Beijing using the PM2.5 measurements. The CO and PM2.5 data from the national air quality network of CNEMC are available on an hourly basis while those from the APHH campaign have a much higher time resolution of 1 s. The analysis in this study is intended to aid interpretation of the vast suite of measurements made during the APHH-Beijing campaign, and for setting these campaigns in an annual and inter-annual context.
3.1 Analysis of transport to Beijing
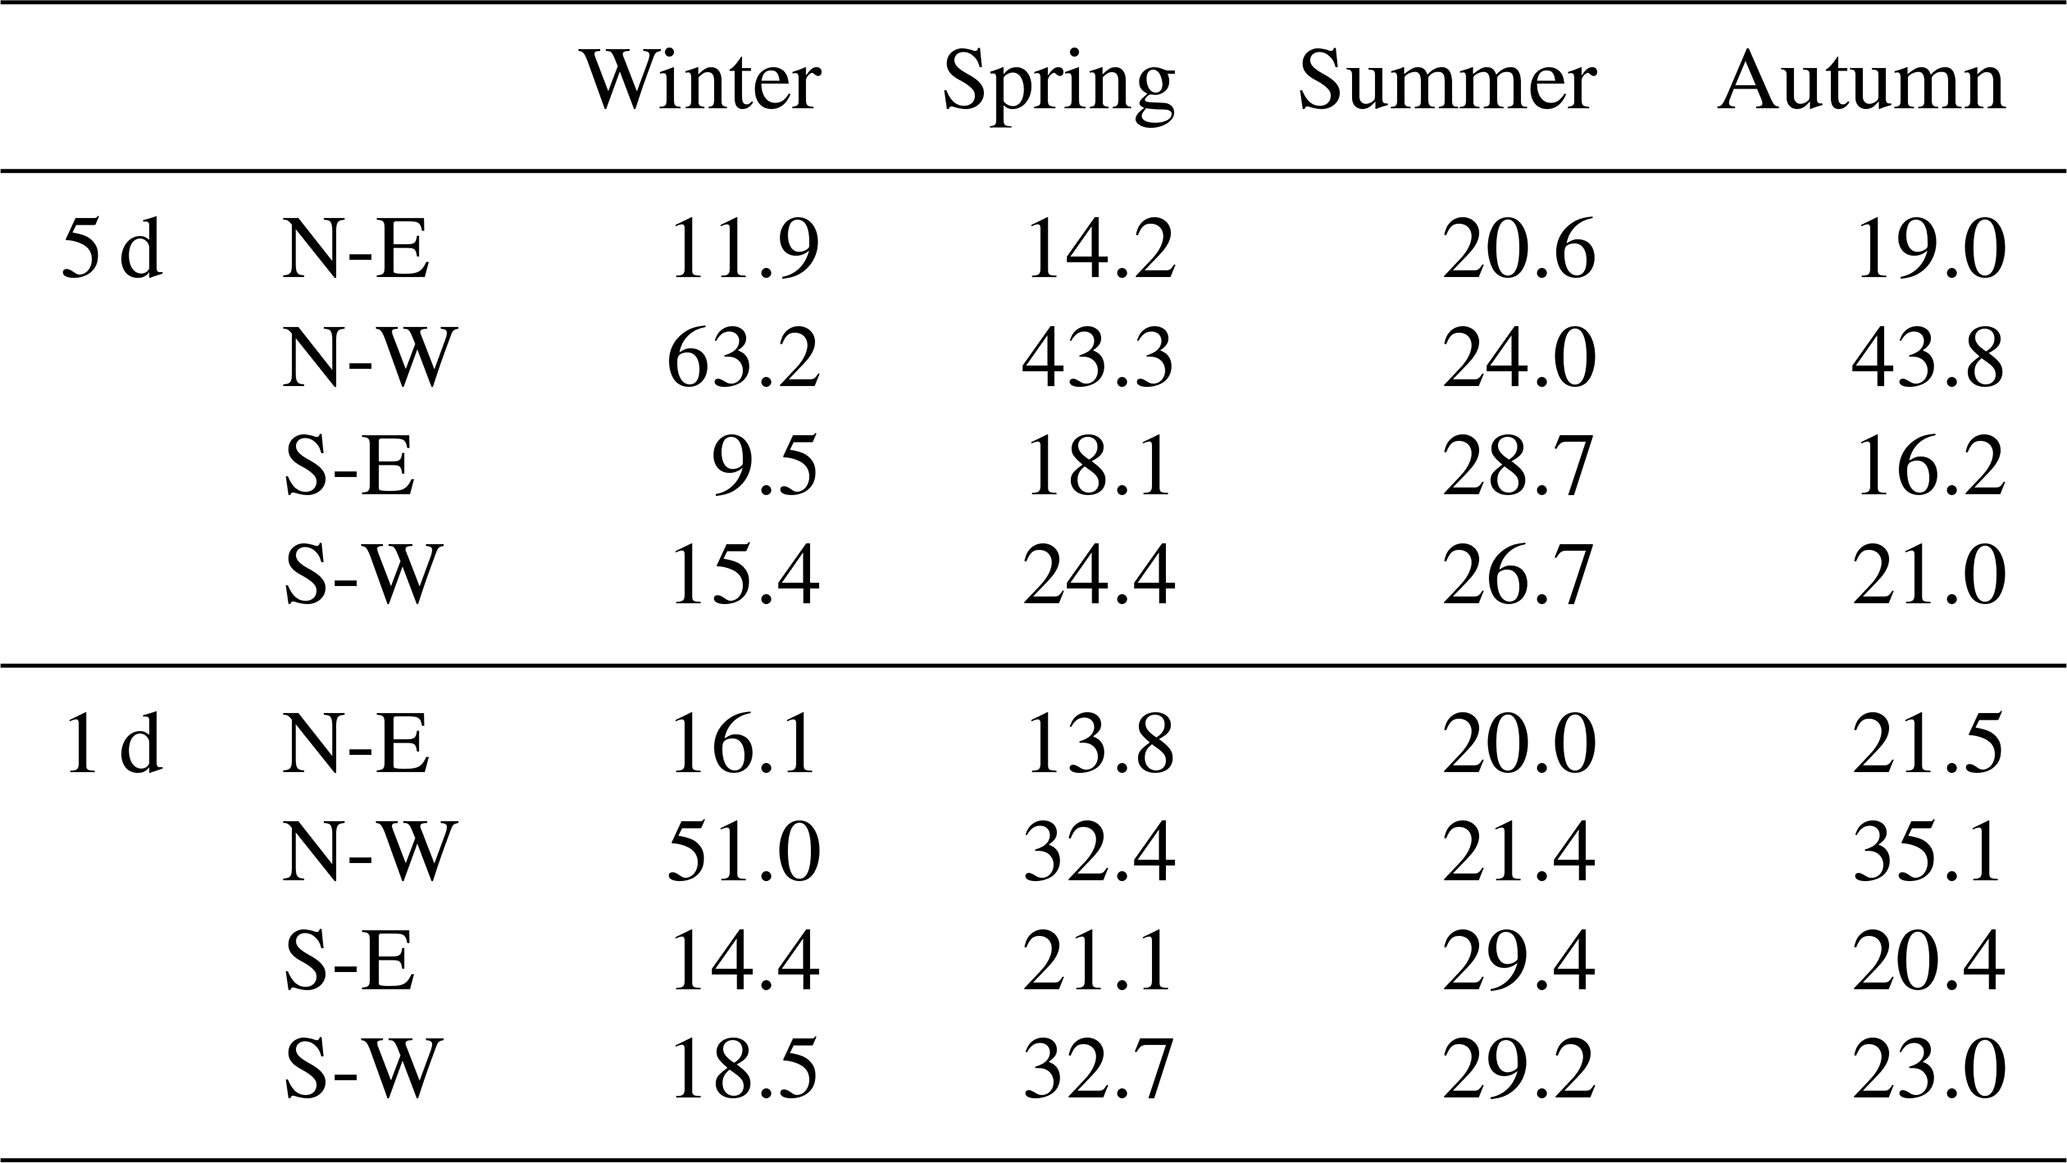
The 3-hourly NAME footprints were used to calculate the residence time of the air masses passing over specific regions. The air masses were characterized by season: winter (December, January, February), spring (March, April, May), summer (June, July, August) and autumn (September, October, November), to explore how the pathways change during the year over the four quadrants. The results reveal that the air masses spend more time over the northern quadrants (NW and NE) in all seasons except summer (see Fig. 5). In the summer months there is no dominant pattern, with air masses arriving equally from all four quadrants (see Table 1).
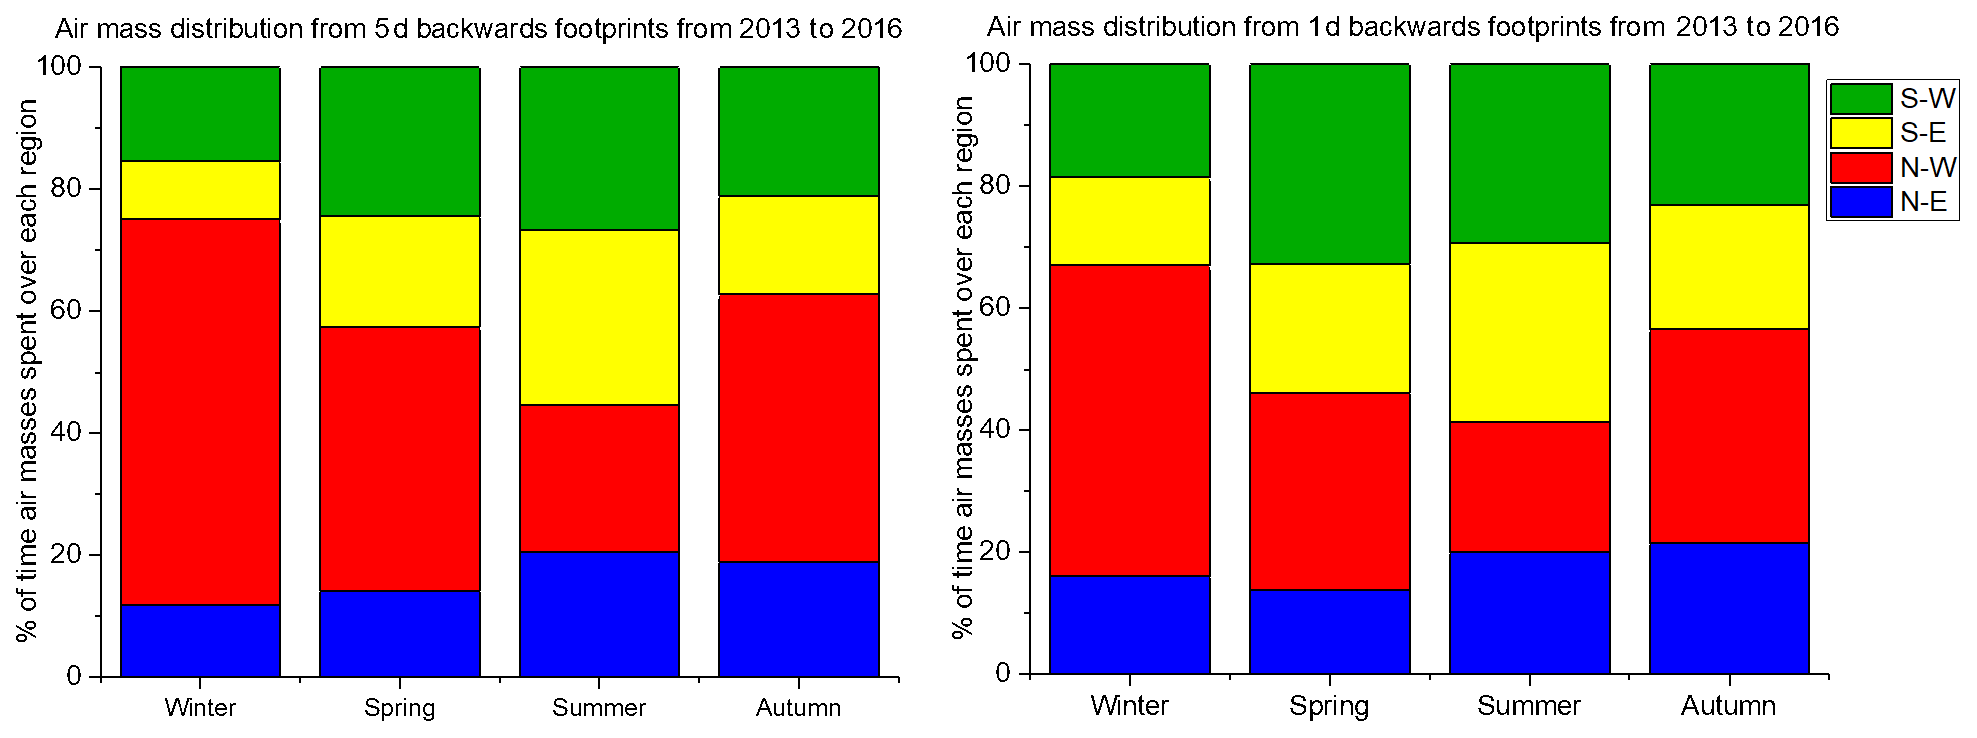
Figure 5Frequency of the air masses arriving in Beijing from the north-west, north-east, south-west and south-east.
To better understand how and where the air masses travel immediately before they arrive in Beijing, 1 d backward NAME footprints were analysed. These footprints reveal the path of the air masses on the last day before they arrive in Beijing. From the comparison of the 1 and 5 d backwards air mass distributions, (Fig. 5) it is observed that the northerly (NW and NE quadrants) distribution is somewhat lower in the 1 d backward footprints than in the 5 d backward footprints. This indicates that the air masses spend more time over the southern quadrants just before they arrive in Beijing.
Table 1Air mass frequency (%) over each region for the 5 and 1 d backwards NAME footprints.
It is therefore important to consider both short- and long-range air mass pathways. For example, when re-circulation of the air masses occurs, the measured wind speed and wind direction from only one station can be misleading. In Fig. 6, two footprints with similar local meteorological conditions are shown; however, the pathways of their arrival at the city are very different, indicating that it is important to have an understanding of synoptic-scale meteorology to effectively determine contributions from other areas. Surface meteorological stations in the city alone are not sufficient for working out contributions from regional air mass transport.
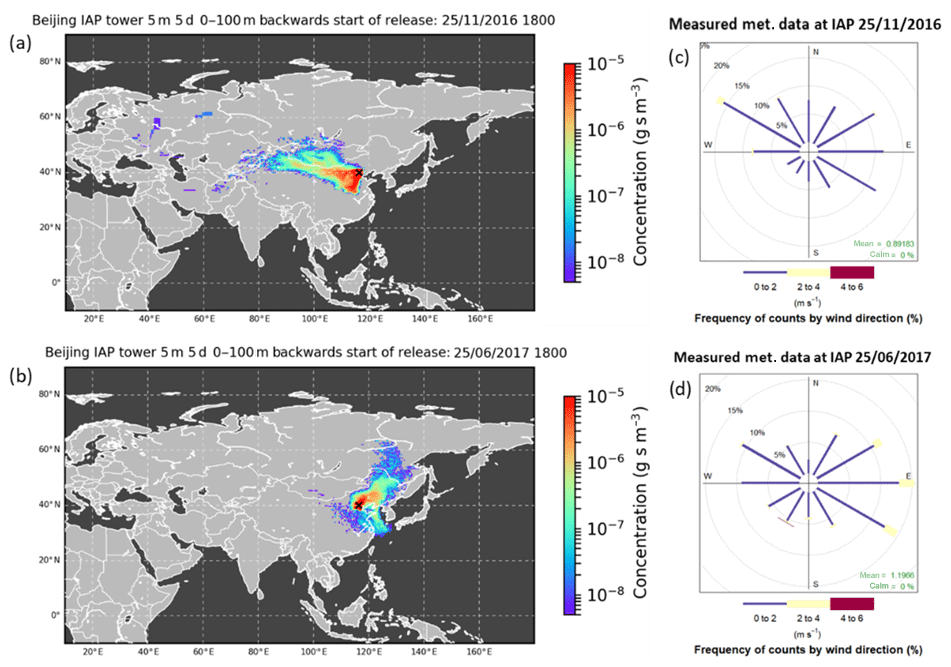
Figure 6Example footprints of air masses arriving in Beijing from the south (a) and north (b) and wind data measured at the ground level during these days (c, d).
3.2 Contributions to CO in Beijing
Using the technique described in Sect. 2.2, we calculate the expected CO concentrations arriving at the IAP tower in Beijing at 3 h intervals and compare these with CO measurements from the tower during the APHH campaign (Shi et al, 2019). There is generally good agreement between the measured and modelled CO at the IAP from the 5 d backward trajectories, with a coefficient of determination of R2=0.571; see Fig. 7. Moreover, the coefficient of determination for the 4-year measured CO and the modelled CO in Beijing was calculated: R2=0.479. The approach appears to account well for the meteorologically driven air mass transport contributions to Beijing pollution and it demonstrates that the variability is governed by the meteorology. Discrepancies between the predictions and observations may be caused by uncertainties in the emission inventory, missing biogenic emissions, secondary CO production and day-to-day variability in emissions along with small-scale local sources which are not included in the emission inventory. Furthermore, there are uncertainties in the meteorological field simulations owing to the fact that emissions transported to Beijing from outside the 5 d domain are not included.
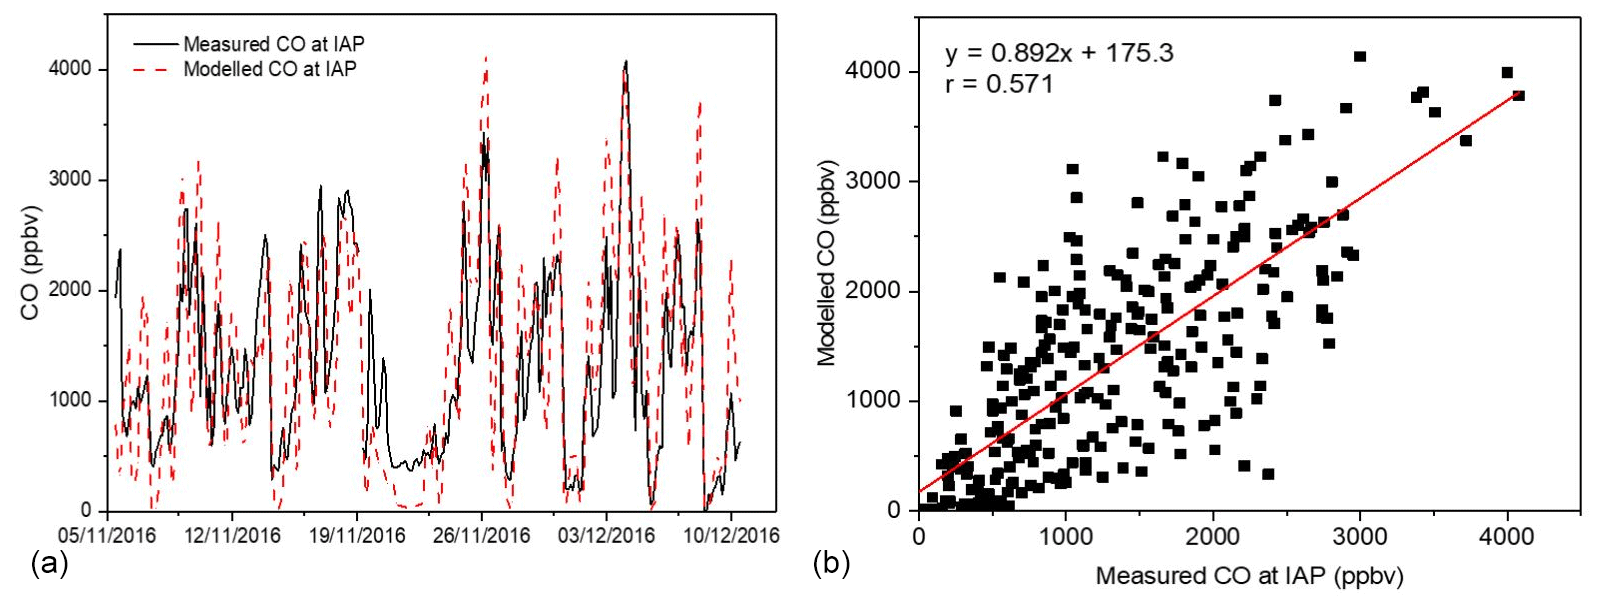
Figure 7Time series of modelled CO vs. measured CO at IAP during the APHH measurement campaign period (a), and correlation of measured and modelled CO (b).
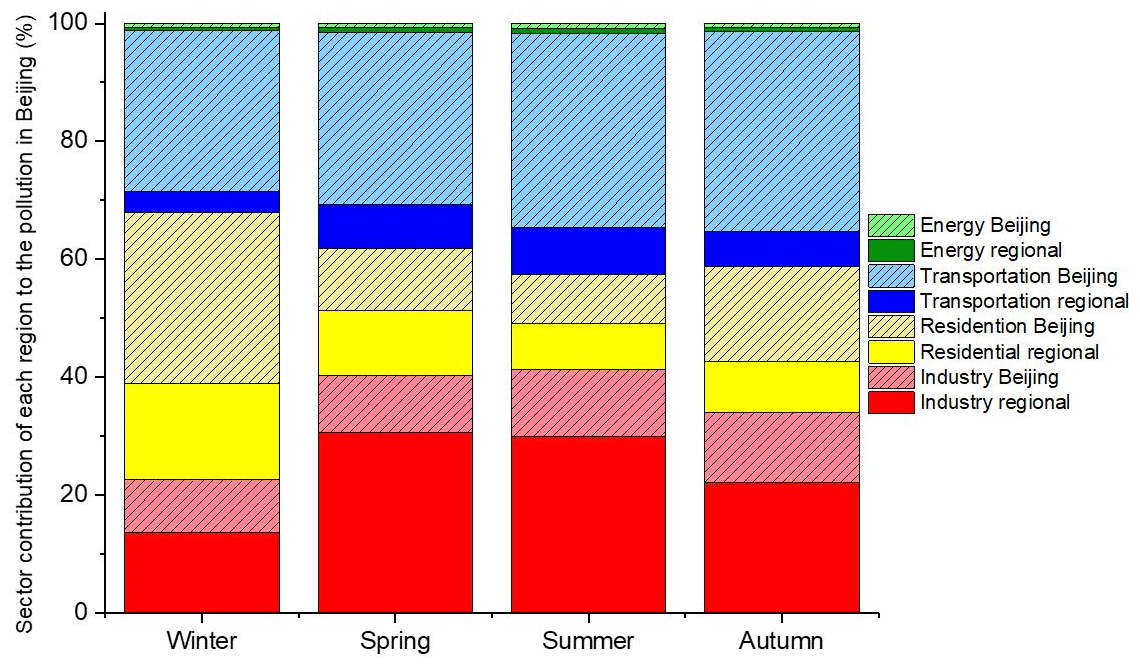
Using the CO transportation technique we pair the NAME footprints and the fluxes from the emission inventories on a grid-cell-by-grid-cell basis to calculate the CO. Over the 4-year period from 2013 to 2016 the source sectors contributing most to the total CO pollution modelled in Beijing are the transportation, industrial and residential sectors, with approximately 37 %, 34 % and 27 %, respectively. The energy sector is the lowest, with a contribution to the total CO in Beijing of less than 2 % in each season. Sector contributions have different seasonal cycles; the residential sector is highest during the winter months, with an average over 4 years of 637 ppbv (45.3 % of total winter modelled CO), and the industrial sector is highest during the summer, with a 4-year average of 355 ppbv (41.3 % of total summer modelled CO). The emissions from the transportation sector are similar throughout each season; however, their relative contribution compared to other sectors changes in each season (see sums in Table 2).
By removing local emissions from the MEIC emission inventory, we can isolate the contribution of transport of CO from emissions in other regions. From the 5 d backward footprints, we calculate that over a 4-year period, an average of 45 % of the CO in Beijing was transported from outside Beijing. This high contribution is underscored by the study of Wang et al. (2010), which determined that the contribution of CO from regional sources when local CO emissions in Beijing are controlled by strict control measures was approximately 77 % in Beijing during the 2008 Olympics. During polluted summer days, Chen et al. (2009) reported that approximately 50 % of the CO in Beijing is transported from the Tianjin, Shandong and Hebei regions alone, and Cheng et al. (2018) found that regional transport of pollutants contributed almost 60 % of the PM2.5 concentrations in the winter (January 2013), resulting in an extreme regional pollution episode. Furthermore, we determined that the contribution from emissions outside Beijing can reach as high as 80 % of the total CO on some days (as shown in case 2 in Sect. 3.3).
Table 2Sector CO pollution contribution to Beijing from each region.
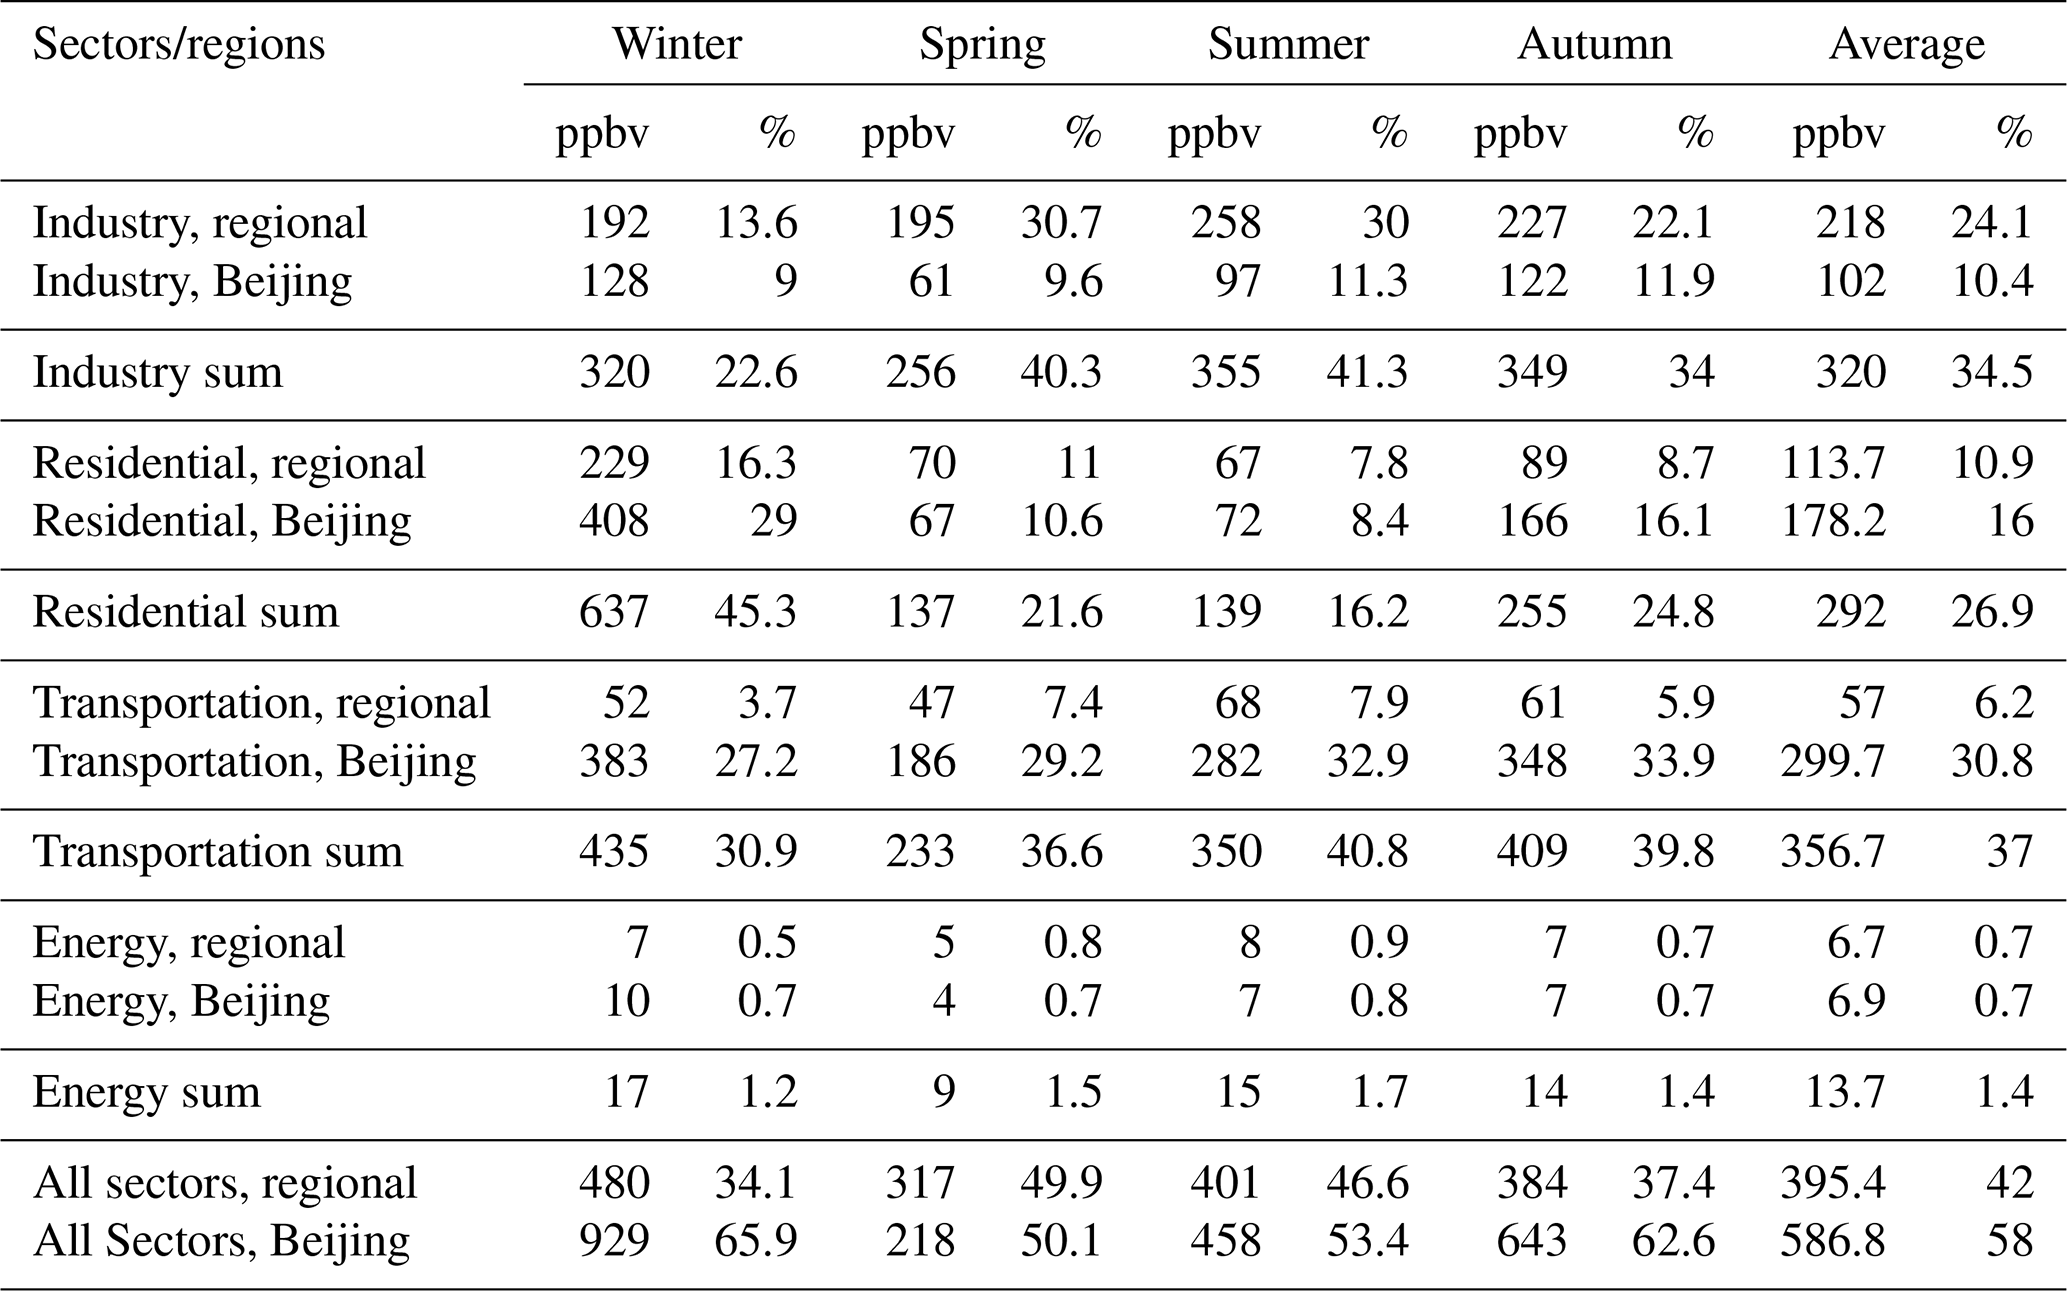
Further analysis was conducted to determine the contributions from each emission sector within Beijing and outside of Beijing using the modelled CO derived from the analysis of 5 d backwards footprints and the emission inventories. The highest contribution from the residential sector for regions outside Beijing is during the cold months of winter (see Table 2 and Fig. 8 for seasonal averages for all regions), reaching a maximum 3-hourly contribution of modelled CO concentration of approximately 1200 ppbv. This can be explained by the greater solid fuel burning during these months (Sun et al., 2013). For other seasons (spring, summer and autumn), the industrial sector was the dominant regional contributor to the CO pollution in Beijing, peaking at 1300 ppbv and contributing approximately 20 % of the total CO in Beijing. Furthermore, the changes in concentrations and contributions of each sector each season can be also associated with the changes in the air mass pathways and the increase in emissions from other sectors.
The sectoral contributions within Beijing are very different. The dominant sector throughout the year is the transportation sector, which contributes approximately 30 % of the total CO in Beijing and a maximum 3-hourly concentration of approximately 1600 ppbv. The same increase in the residential sector during the winter months was observed within Beijing as was observed outside of Beijing.
The 1 d backward footprints reveal that on average approximately 80 % of the modelled total CO calculated within the 5 d footprints is caused by emissions from within the final 24 h of air mass transport. Moreover, it was determined that the regional CO air pollution transported from outside Beijing modelled from the 1 d footprints is approximately half of the pollution transported to Beijing is transported from the immediate surrounding regions (such as Hebei, Tianjin etc.) and the other half from regions further away.
From the comparison of where the air masses spend more time before arriving to Beijing with the percentage of the CO air pollution transported from the “Regional China” region (Fig. 9), a clear seasonal pattern is observed. The seasonal pattern in the air masses is similar to the seasonal pattern in the CO contribution from Regional China; when the air masses spend more time over the south quadrants (S-E and S-W) before arriving in Beijing, the regional contribution to the CO pollution in Beijing is higher. This clear seasonality suggests that the regional CO contribution is highly influenced by emissions from the southern regions.
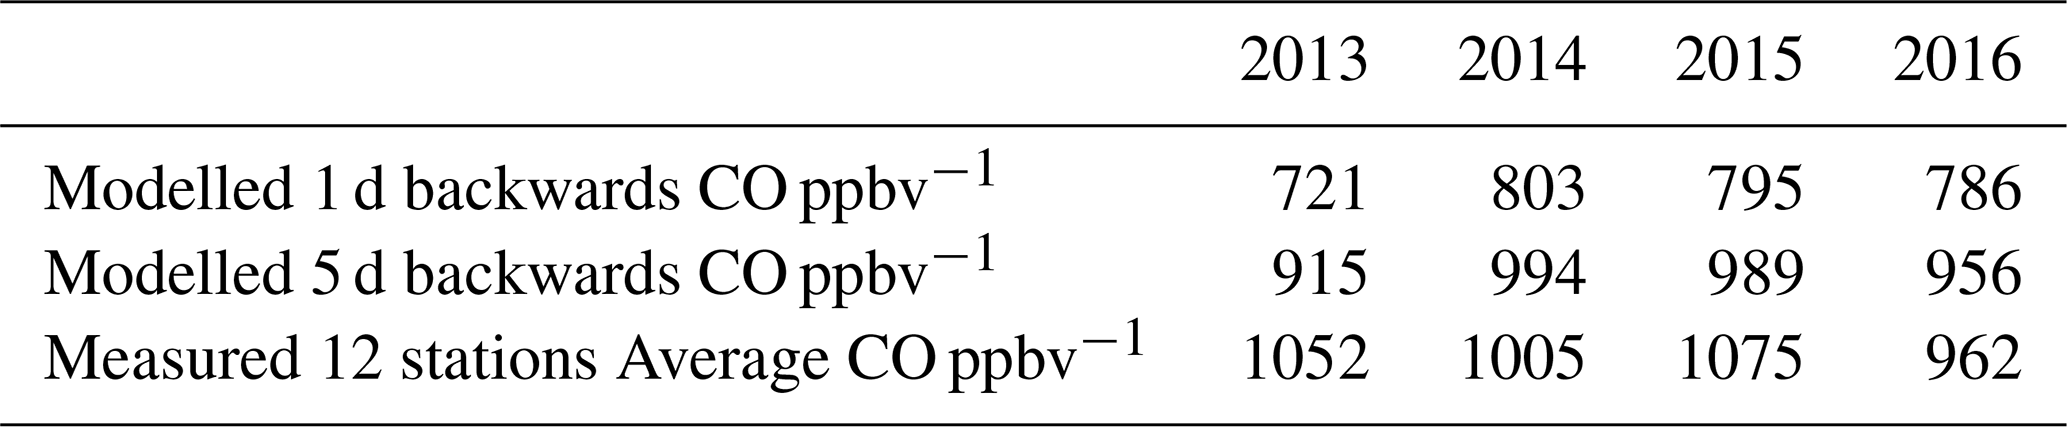
The yearly averages of the modelled CO for 1 and 5 d backward footprints and of the measured CO averaged over the 12 air quality stations in Beijing exhibit no major year-to-year variations (Table 3). While our model analysis is limited by the MEIC emission inventory existing only for 2013, the consistent year-to-year CO levels indicate the average yearly pathways do not change a lot from year to year. This indicates that we can confidently use the 2013 MEIC CO emission inventories to understand the importance of meteorological variations in pollution transportation to Beijing.
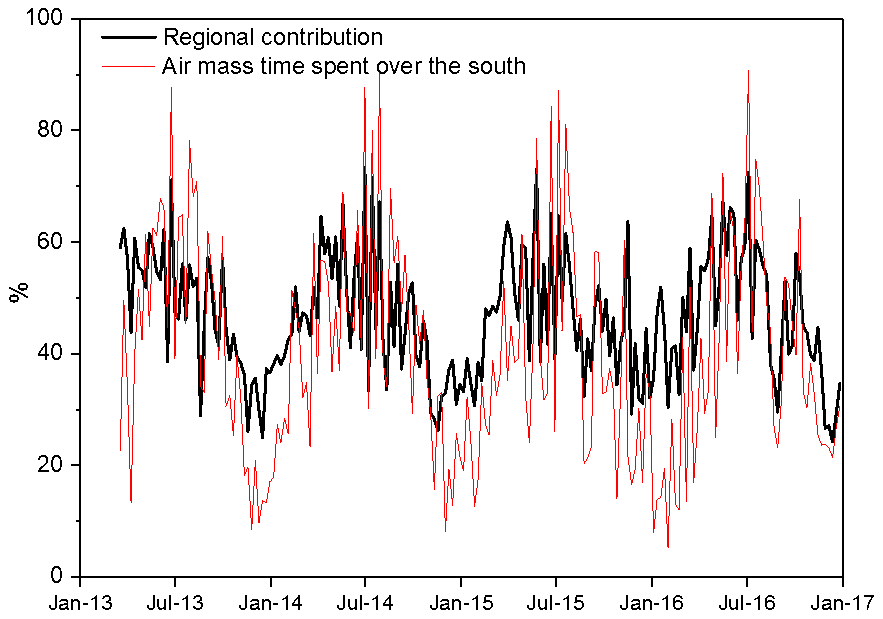
Figure 9Four-year cycle of contributions from outside Beijing (black line) and the proportion of time (of 5 d) spent over southern quadrants (red line).
Table 3Yearly averages of the 1 and 5 d modelled CO and the measured average Beijing CO in parts per billion by volume (ppbv).
3.3 Classification of pollution events
To investigate the relative importance of local and regional emissions during high-pollution events from previous years, the data from CNEMC for CO and PM2.5 concentrations from 12 monitoring stations in Beijing were used along with the modelled CO. From the measurement dataset, it was calculated that the 4-year average CO concentration is 1024 ppbv and the maximum concentration is greater than 8000 ppbv. The 4-year average PM2.5 concentration is 75 µg m−3 with a maximum of 606 µg m−3. The WHO limit for PM2.5 is a 25 µg m−3 24 h mean and the Chinese level 2 limit is a 75 µg m−3 24 h mean (WHO, 2006; Lin et al., 2018). We also consider PM2.5 data here because it is typically the air pollutant of greatest interest from a health perspective (Lelieveld et al., 2015) and is emitted from similar sources as CO such as incomplete combustion from sources like transportation, industry and residential areas (Staff and Staff, 2002). This is reflected in the correlation between measured CO and PM2.5 from all 12 sites used in this study being r=0.82. PM2.5 and CO also have similar trends during pollution events and despite PM2.5 having a shorter lifetime than CO, for the short timescales considered here they have similar responses (Shi et al., 2019).
Using the measured CO and PM2.5, three classification types have been identified as illustrative of different situations, such as when pollution is dominated by local or regional sources or when these contributions are similar. For these classification types, we defined high-pollution events using the PM2.5 Chinese limit level 2 (; see Fig. 10d for the average PM2.5 concentration during each classification) and conducted CO analysis for those periods only. Furthermore, these classification types were also used to analyse pollution events during the winter APHH campaign (see Sect. 3.4).
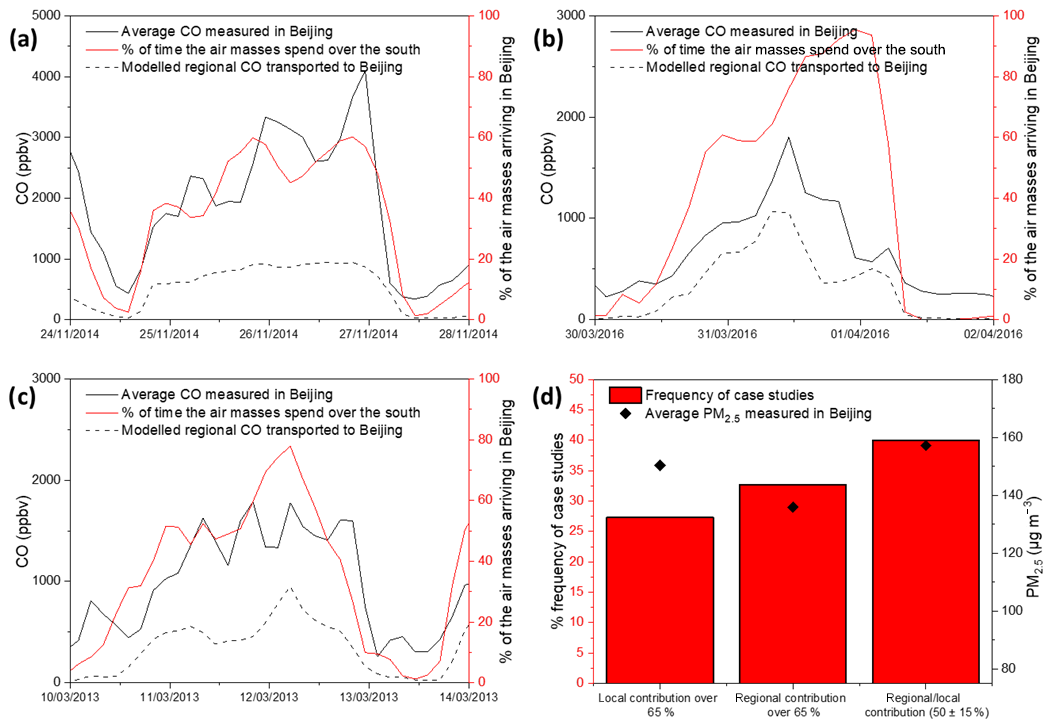
Figure 10(a–c) Time series of the measured CO, modelled CO transported to Beijing from other regions and the percentages of air masses arriving in Beijing from the south for three case studies, and (d) is the frequency distribution and average PM2.5 for each classifications when the PM2.5 concentration is over 75 µg m−3 during 2013–2016.
Classification type 1: pollution dominated by local emissions
Local emissions dominated (defined as >65 % contribution to) modelled CO pollution in Beijing approximately 28 % of the time when the PM2.5 concentration was over 75 µg m−3. Between 24 and 28 November 2014, the pollution levels in Beijing were extremely high, with PM2.5 and CO concentrations reaching 250 µg m−3 and 2500 ppbv, respectively. We find that during this event less than 30 % of CO was transported from outside Beijing (Fig. 10a). During these days, the contributions from the local sources were very high, with the transportation and the residential sectors accounting for over 2000 ppbv of the CO in Beijing. The air masses during these days were arriving in Beijing from all directions, which indicates that the transport was possibly very weak.
Classification type 2: pollution dominated by regional contributions
While the PM2.5 concentration was over 75 µg m−3, approximately 32 % of the time the contribution from emissions outside Beijing dominated (defined as >65 % contribution to the modelled CO pollution in Beijing). The concentration of PM2.5 peaked at over 200 µg m−3 on 31 March 2016, accompanied by CO concentrations of around 1500 ppbv (Fig. 10b). The air masses arriving in Beijing on this day were dominated by air masses that spent most of their time over the southern quadrants before arriving in Beijing. The modelled regional CO transportation and the dominating southern air mass distribution during this high-pollution day suggest that regional transportation from the south was the main driver of the pollution episode in Beijing.
Classification type 3: similar contribution from regional and local pollution
When the concentration of PM2.5 was over 75 µg m−3, the contributions from local and regional sources of the modelled CO was similar (50±15 %) for 40 % of the time during our 4-year study period. An example of these conditions can be seen on 10–12 March 2013 when PM2.5 and CO concentrations reached 100 µg m−3 and 1500 ppbv, respectively. We find that approximately 50 % of the modelled CO was emitted within Beijing and the rest was transported from regions outside Beijing. During the 12 March when the pollution levels were at maximum, the air masses spent more time over the southern quadrants, but the pollution levels decreased rapidly when air masses arrived from the northern quadrants (Fig. 10c).
3.4 APHH winter campaign
During the 35 d of the APHH campaign, 38 % of the modelled CO arrived from outside Beijing. From the sectors outside of Beijing, the industrial sector is the highest, with an average of 180 ppbv; from the sectors within Beijing, the transportation sector is the highest, with 424 ppbv during the campaign. Furthermore, the 1 d modelled CO makes up 86 % of the 5 d modelled CO, which indicates that the majority of the CO transported to Beijing is found in the immediately surrounding areas. The air masses spend approximately 60 % of the time over the north-west quadrant before arriving in Beijing.
Using the three classifications discussed previously when the PM2.5 concentration was over 75 µg m−3 during the APHH campaign, it was determined that the pollution was dominated by local contributions approximately 52 % of the time, was dominated by regional contributions 15 % of the time and had similar local and regional contributions 33 % of the time. The highest PM2.5 concentration was recorded when there was a mixture of both local and regional contributions with a 3-hourly average of 400 µg m−3.
Furthermore, the average contribution from each classification during the same dates in the three previous years (5 November to 10 December, 2013–2015) was calculated. During the previous three years on average, the pollution was dominated by local contributions on average approximately 51 % of the time, the pollution was dominated by regional contributions 8 % of the time, and the pollution in Beijing was a mixture of similar contributions from both the local and regional sources 41 % of the time.
Moreover, during the campaign five haze events were reported (discussed in the APHH project paper, Shi et al., 2019). The haze events are defined as visibility <10 km at relative humidity (RH)<80 % and when PM2.5 is higher than 75 µg m−3 (Li et al., 2019). The classifications above were applied to those pollution events. We found that during the five haze events, the pollution was dominated by local sources and a mixture of both local and regional contributions (see Fig. 11). Although the haze events are dominated by local sources, the maximum concentrations are a mixture of both local and regional sources. Two periods between the haze events were polluted but were not classified as haze events due to the visibility and RH. During the first period on 13 November the contributions are a mixture of both local and regional sources and during the second period on 28–30 November the pollution was mainly dominated by the local sources.
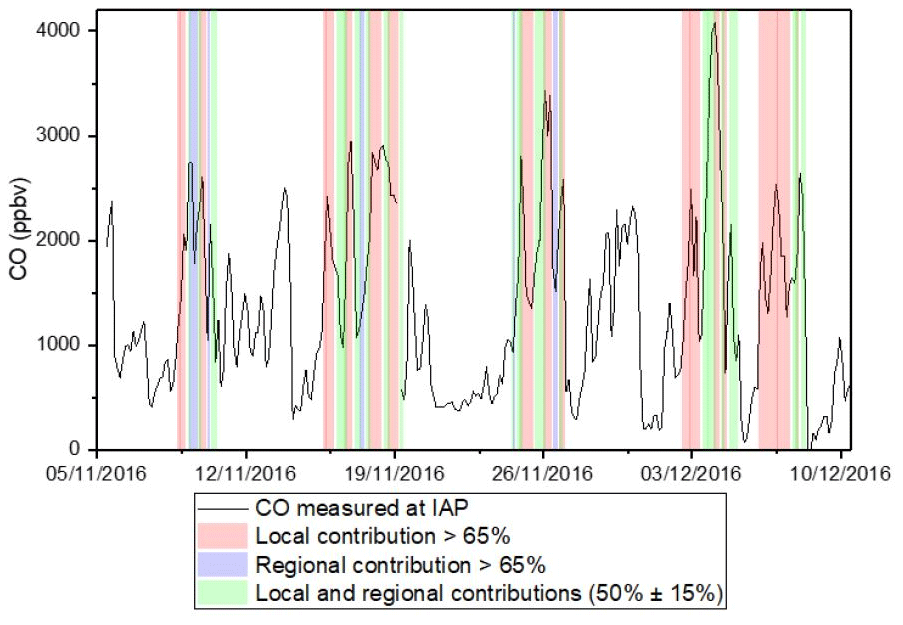
Figure 11Time series of the measured CO at the IAP in the winter APHH campaign, during the five haze events where PM2.5 concentration was over 75 µg m−3. The colours represent the three classifications observed during the five haze episodes identified in Shi et al. (2019).
In this study, we demonstrated that the dispersion modelling approach used provides a valuable way of assessing regional transport impacts and is able to explain variations in CO over Beijing. The variability in CO is clearly driven by meteorological processes (e.g., good correlation in Fig. 6) and reflects varying contributions from local and regional sources.
Averaged over the 4-year period from 2013 to 2016, the highest contributors to the total CO pollution in Beijing are the transportation, industrial and residential sectors with approximately 36 %, 33 % and 29 % respectively. From the results in this paper, it is clear that transportation of pollutants owing to the meteorology in China can strongly influence the pollution in Beijing. The contribution of CO pollution from outside Beijing can account on average over the 4 years for up to approximately 45 % of the total CO pollution in Beijing, with 23 % being transported to Beijing from the immediate surrounding areas and 22 % from areas further away.
The main contributor to the CO pollution from outside Beijing was the industrial sector, with approximately 20 % contribution on average to the total CO in Beijing, resulting from the many heavily industrial areas south of Beijing. The residential sector contribution from outside Beijing is very high, contributing 45 % of the CO in Beijing during the cold months of the winter, because of the coal combustion and solid fuel burning used for cooking and heating.
Although meteorology and regional transportation of CO are significant contributors to the CO pollution levels in Beijing, the pollution that is emitted within Beijing is still at very high levels, with an average of 55 % of CO pollution in Beijing. Within Beijing, the main contributor is the transportation sector, with contributions of 25 % of the total CO in Beijing.
The classifications revealed that over the 4-year period, when the PM2.5 concentration in Beijing was over 75 µg m−3, 32 % of the time CO in Beijing was strongly dominated by the emissions from outside Beijing and 27 % of the time the pollution was dominated by local emissions. However, the highest mean concentration for PM2.5 was observed during the classification where there is similar contribution from sources within Beijing and outside Beijing. Furthermore, using the same classifications for the APHH winter campaign 2016, it was observed that the pollution was dominated by local contributions 52 % of the time, by regional contributions 15 % of the time, and by similar local and regional contributions 33 % of the time. During the APHH campaign, a slight increase is observed in the regional contributions compared to the previous 3 years.
When the air masses arriving in Beijing spend more time over the southern quadrants, the contribution from the emission outside Beijing to the pollution levels in Beijing also increases. This indicates that other pollutants such as PM2.5 and volatile organic compounds (VOCs) could be transported similarly depending upon their lifetime in the atmosphere. For short-lived pollutants especially, the results suggested that they can be effectively transported to Beijing from the immediate surrounding regions.
The results lend further weight to the need for a combination of local and regional air quality control measures:
-
On average, 55 % of the CO pollution in Beijing is emitted within the city and 45 % is transported in from surrounding regions, emphasizing the need for joined up local and regional air quality management strategies.
-
Case studies (small sample size) suggest that for approximately one-third of air pollution episodes, greater than 65 % of the CO contribution is from regional sources, highlighting the key role transported pollution plays in poor air quality events.
-
Control measures may be more effective when they take into account the seasonality both of the regional meteorology and of the relative emissions sector contributions (see Table 2). For example, while Beijing traffic CO emission reductions should be applied throughout the year, additional controls in the summer might prioritize regional industrial CO reductions, whereas additional winter controls might prioritize Beijing residential CO reductions.
The uncertainties in the datasets (emission inventories, measured data and modelled data), especially in the emission inventories, need to be understood better. Furthermore, more research needs to be done to understand the regional contribution to Beijing of pollutants such as PM2.5, VOCs and ozone. Understanding the effect of the meteorology on the regional transport of pollutants to Beijing is very important for new emission control measures.
Atmospheric measurement data used in this study are available from the CEDA data archive at https://catalogue.ceda.ac.uk/uuid/648246d2bdc7460b8159a8f9daee7844 (last access: 2 February 2020) (Fleming et al., 2017). Dispersion model footprints are available from CEDA at https://catalogue.ceda.ac.uk/uuid/88f3a3de77354692aeada98c5dad599b (last access: 2 February 2020) (Panagi and Fleming, 2017). The modelled data in this study (modelled CO and air mass distribution) are available from the corresponding authors upon request.
MP performed the modelling and numerical data analysis and led the manuscript development. ZLF contributed to the development of the modelling and visualization technique. PSM contributed to research question framing and vision and the manuscript. MJA provided CO transport code and ideas on analysis and contributed to the manuscript. OW provided ideas on analysis and contributed to the manuscript, MH converted MEIC inventories for use. QZ contributed MEIC inventory data. FAS collected the CO APHH campaign data. JDVH oversaw the research and contributed extensively to the manuscript development and data interpretation.
The authors declare that they have no conflict of interest.
This article is part of the special issue “In-depth study of air pollution sources and processes within Beijing and its surrounding region (APHH-Beijing) (ACP/AMT inter-journal SI)”. It is not associated with a conference.
We would like to thank the UK Met Office for supplying the Unified Model Meteorological data and the use of the NAME model and the CEDA for providing space on the JASMIN supercomputer to run the model. We thank the University of Leicester's high-performance computing services for supplying the necessary computing power for plotting and storing the model output and Duncan Law-Green at Leicester University for developing the code to plot and interpret the NAME model output. We acknowledge James Lee at York University and the national air quality monitoring network run by the China National Environmental Monitoring Centre for providing the data. We would also like to thank the colleagues at IAP for the access to the tower meteorological data. Finally, we would like to thank the National Centre for Atmospheric Science (NCAS) and NERC for funding.
This research has been supported by the National Centre for Atmospheric Science (NCAS), the University of Leicester, and the UK Natural Environment Research Council (grant no. NE/N005406/1 for Joshua D. Vande Hey and grant nos. NE/N006925/1 and NE/N006976/1 for Oliver Wild and Michael Hollaway).
This paper was edited by James Allan and reviewed by two anonymous referees.
Brown, A., Milton, S., Cullen, M., Golding, B., Mitchell, J., and Shelly, A.: Unified Modeling and Prediction of Weather and Climate: A 25-Year Journey, B. Am. Meteorol. Soc., 93, 1865–1877, https://doi.org/10.1175/bams-d-12-00018.1, 2012.
Chen, D., Wang, Y., McElroy, M. B., He, K., Yantosca, R. M., and Le Sager, P.: Regional CO pollution and export in China simulated by the high-resolution nested-grid GEOS-Chem model, Atmos. Chem. Phys., 9, 3825–3839, https://doi.org/10.5194/acp-9-3825-2009, 2009.
Cheng, N., Li, Y., Cheng, B., Wang, X., Meng, F., Wang, Q., and Qiu, Q.: Comparisons of two serious air pollution episodes in winter and summer in Beijing, J. Environ. Sci., 69, 141–154, https://doi.org/10.1016/j.jes.2017.10.002, 2018.
Desai, M., Mehta, S., and Smith, K.: Indoor smoke from solid fuels: Assessing the environmental burden of disease at national and local levels, WHO Environmental Burden of Disease Series, No. 4, World Health Organization, Geneva, 2004.
Donnelly, A., Naughton, O., Misstear, B., and Broderick, B.: Maximizing the spatial representativeness of NO2 monitoring data using a combination of local wind-based sectoral division and seasonal and diurnal correction factors, J. Environ. Sci. Heal. A, 51, 1003–1011, https://doi.org/10.1080/10934529.2016.1198174, 2016.
Fleming, Z., Monks, P., and Manning, A.: Review: Untangling the influence of air-mass history in interpreting observed atmospheric composition, Atmos. Res., 104–105, 1–39, https://doi.org/10.1016/j.atmosres.2011.09.009, 2012.
Fleming, Z. L., Lee, J. D., Liu, D., Acton, J., Huang, Z., Wang, X., Hewitt, N., Crilley, L., Kramer, L., Slater, E., Whalley, L., Ye, C., and Ingham, T.: APHH: Atmospheric measurements and model results for the Atmospheric Pollution & Human Health in a Chinese Megacity, Centre for Environmental Data Analysis, available at: https://catalogue.ceda.ac.uk/uuid/648246d2bdc7460b8159a8f9daee7844 (last access: 2 February 2020), 2017.
GBD MAPS Working Group: Burden of Disease Attributable to Coal-Burning and Other Major Sources of Air Pollution in China. Special Report 20, Boston, MA, Health Effects Institute, 2016.
Guo, S., Hu, M., Zamora, M., Peng, J., Shang, D., Zheng, J., Du, Z., Wu, Z., Shao, M., Zeng, L., Molina, M., and Zhang, R.: Elucidating severe urban haze formation in China, P. Natl. Acad. Sci. USA, 111, 17373–17378, https://doi.org/10.1073/pnas.1419604111, 2014.
Jin, Y., Andersson, H., and Zhang, S.: Air Pollution Control Policies in China: A Retrospective and Prospects, Int. J. Environ. Res. Public Health, 13, 1219, https://doi.org/10.3390/ijerph13121219, 2016.
Jones, A., Thomson, D., Hort, M., and Devenish, B.: The UK Met Office's next-generation atmospheric dispersion model, NAME III, Air Pollut. Model. Appl. XVII, 17, 580–589, 2007.
Lelieveld, J., Evans, J., Fnais, M., Giannadaki, D., and Pozzer, A.: The contribution of outdoor air pollution sources to premature mortality on a global scale, Nature, 525, 367–371, https://doi.org/10.1038/nature15371, 2015.
Li, M., Zhang, Q., Kurokawa, J.-I., Woo, J.-H., He, K., Lu, Z., Ohara, T., Song, Y., Streets, D. G., Carmichael, G. R., Cheng, Y., Hong, C., Huo, H., Jiang, X., Kang, S., Liu, F., Su, H., and Zheng, B.: MIX: a mosaic Asian anthropogenic emission inventory under the international collaboration framework of the MICS-Asia and HTAP, Atmos. Chem. Phys., 17, 935–963, https://doi.org/10.5194/acp-17-935-2017, 2017.
Li, Y., Xue, Y., Guang, J., de Leeuw, G., Self, R., She, L., Fan, C., Xie, Y., and Chen, G.: Spatial and temporal distribution characteristics of haze days and associated factors in China from 1973 to 2017, Atmos. Environ., 214, 116862, https://doi.org/10.1016/j.atmosenv.2019.116822, 2019.
Lin, Y., Zou, J., Yang, W., and Li, C.-Q.: A Review of Recent Advances in Research on PM2.5 in China, Int. J. Environ. Res. Public Health, 15, 438, https://doi.org/10.3390/ijerph15030438, 2018.
Liu, F., Zhang, Q., Tong, D., Zheng, B., Li, M., Huo, H., and He, K. B.: High-resolution inventory of technologies, activities, and emissions of coal-fired power plants in China from 1990 to 2010, Atmos. Chem. Phys., 15, 13299–13317, https://doi.org/10.5194/acp-15-13299-2015, 2015a.
Liu, S., Aiken, A., Gorkowski, K., Dubey, M., Cappa, C., Williams, L., Herndon, S., Massoli, P., Fortner, E., Chhabra, P., Brooks, W., Onasch, T., Jayne, J., Worsnop, D., China, S., Sharma, N., Mazzoleni, C., Xu, L., Ng, N., Liu, D., Allan, J., Lee, J., Fleming, Z., Mohr, C., Zotter, P., Szidat, S., and Prévôt, A.: Enhanced light absorption by mixed source black and brown carbon particles in UK winter, Nat. Commun., 6, 8435, https://doi.org/10.1038/ncomms9435, 2015b.
Lowry, D., Lanoisellé, M., Fisher, R., Martin, M., Fowler, C., France, J., Hernández-Paniagua, I., Novelli, P., Sriskantharajah, S., O'Brien, P., Rata, N., Holmes, C., Fleming, Z., Clemitshaw, K., Zazzeri, G., Pommier, M., McLinden, C., and Nisbet, E.: Marked long-term decline in ambient CO mixing ratio in SE England, 1997–2014: evidence of policy success in improving air quality, Sci. Rep., 6, 25661, https://doi.org/10.1038/srep25661, 2016.
Miao, Y., Guo, J., Liu, S., Liu, H., Li, Z., Zhang, W., and Zhai, P.: Classification of summertime synoptic patterns in Beijing and their associations with boundary layer structure affecting aerosol pollution, Atmos. Chem. Phys., 17, 3097–3110, https://doi.org/10.5194/acp-17-3097-2017, 2017.
Naeher, L., Smith, K., Leaderer, B., Neufeld, L., and Mage, D.: Carbon Monoxide As a Tracer for Assessing Exposures to Particulate Matter in Wood and Gas Cookstove Households of Highland Guatemala, Environ. Sci. Technol., 35, 575–581, https://doi.org/10.1021/es991225g, 2001.
Oram, D. E., Ashfold, M. J., Laube, J. C., Gooch, L. J., Humphrey, S., Sturges, W. T., Leedham-Elvidge, E., Forster, G. L., Harris, N. R. P., Mead, M. I., Samah, A. A., Phang, S. M., Ou-Yang, C.-F., Lin, N.-H., Wang, J.-L., Baker, A. K., Brenninkmeijer, C. A. M., and Sherry, D.: A growing threat to the ozone layer from short-lived anthropogenic chlorocarbons, Atmos. Chem. Phys., 17, 11929–11941, https://doi.org/10.5194/acp-17-11929-2017, 2017.
Panagi, M. and Fleming, Z. L.: APHH: Atmospheric dispersion model footprint plots made at the IAP-Beijing site during the summer and winter campaigns, Centre for Environmental Data Analysis, available at: https://catalogue.ceda.ac.uk/uuid/88f3a3de77354692aeada98c5dad599b (last access: 2 February 2020), 2017.
Saide, P., Carmichael, G., Spak, S., Gallardo, L., Osses, A., Mena-Carrasco, M., and Pagowski, M.: Forecasting urban PM10 and PM2.5 pollution episodes in very stable nocturnal conditions and complex terrain using WRF–Chem CO tracer model, Atmos. Environ., 45, 2769–2780, https://doi.org/10.1016/j.atmosenv.2011.02.001, 2011.
Shi, Z., Vu, T., Kotthaus, S., Harrison, R. M., Grimmond, S., Yue, S., Zhu, T., Lee, J., Han, Y., Demuzere, M., Dunmore, R. E., Ren, L., Liu, D., Wang, Y., Wild, O., Allan, J., Acton, W. J., Barlow, J., Barratt, B., Beddows, D., Bloss, W. J., Calzolai, G., Carruthers, D., Carslaw, D. C., Chan, Q., Chatzidiakou, L., Chen, Y., Crilley, L., Coe, H., Dai, T., Doherty, R., Duan, F., Fu, P., Ge, B., Ge, M., Guan, D., Hamilton, J. F., He, K., Heal, M., Heard, D., Hewitt, C. N., Hollaway, M., Hu, M., Ji, D., Jiang, X., Jones, R., Kalberer, M., Kelly, F. J., Kramer, L., Langford, B., Lin, C., Lewis, A. C., Li, J., Li, W., Liu, H., Liu, J., Loh, M., Lu, K., Lucarelli, F., Mann, G., McFiggans, G., Miller, M. R., Mills, G., Monk, P., Nemitz, E., O'Connor, F., Ouyang, B., Palmer, P. I., Percival, C., Popoola, O., Reeves, C., Rickard, A. R., Shao, L., Shi, G., Spracklen, D., Stevenson, D., Sun, Y., Sun, Z., Tao, S., Tong, S., Wang, Q., Wang, W., Wang, X., Wang, X., Wang, Z., Wei, L., Whalley, L., Wu, X., Wu, Z., Xie, P., Yang, F., Zhang, Q., Zhang, Y., Zhang, Y., and Zheng, M.: Introduction to the special issue “In-depth study of air pollution sources and processes within Beijing and its surrounding region (APHH-Beijing)”, Atmos. Chem. Phys., 19, 7519–7546, https://doi.org/10.5194/acp-19-7519-2019, 2019.
Staff, N. and Staff, T.: Ongoing Challenge of Managing Carbon Monoxide Pollution in Fairbanks, Alaska, National Academies Press, Washington, 2002.
Sugimoto, N., Uno, I., Nishikawa, M., Shimizu, A., Matsui, I., Dong, X., Chen, Y., and Quan, H.: Record heavy Asian dust in Beijing in 2002: Observations and model analysis of recent events, Geophys. Res. Lett., 30, 1640, https://doi.org/10.1029/2002GL016349, 2003.
Sun, Y., Du, W., Fu, P., Wang, Q., Li, J., Ge, X., Zhang, Q., Zhu, C., Ren, L., Xu, W., Zhao, J., Han, T., Worsnop, D. R., and Wang, Z.: Primary and secondary aerosols in Beijing in winter: sources, variations and processes, Atmos. Chem. Phys., 16, 8309–8329, https://doi.org/10.5194/acp-16-8309-2016, 2016.
Sun, Y. L., Wang, Z. F., Fu, P. Q., Yang, T., Jiang, Q., Dong, H. B., Li, J., and Jia, J. J.: Aerosol composition, sources and processes during wintertime in Beijing, China, Atmos. Chem. Phys., 13, 4577–4592, https://doi.org/10.5194/acp-13-4577-2013, 2013.
Tao, S., Ru, M., Du, W., Zhu, X., Zhong, Q., Li, B., Shen, G., Pan, X., Meng, W., Chen, Y., Shen, H., Lin, N., Su, S., Zhuo, S., Huang, T., Xu, Y., Yun, X., Liu, J., Wang, X., Liu, W., Cheng, H., and Zhu, D.: Quantifying the rural residential energy transition in China from 1992 to 2012 through a representative national survey, Nature Energy, 3, 567–573, https://doi.org/10.1038/s41560-018-0158-4, 2018.
Tie, X., Zhang, Q., He, H., Cao, J., Han, S., Gao, Y., Li, X., and Jia, X.: A budget analysis of the formation of haze in Beijing, Atmos. Environ., 100, 25–36, https://doi.org/10.1016/j.atmosenv.2014.10.038, 2015.
Wang, T., Nie, W., Gao, J., Xue, L. K., Gao, X. M., Wang, X. F., Qiu, J., Poon, C. N., Meinardi, S., Blake, D., Wang, S. L., Ding, A. J., Chai, F. H., Zhang, Q. Z., and Wang, W. X.: Air quality during the 2008 Beijing Olympics: secondary pollutants and regional impact, Atmos. Chem. Phys., 10, 7603–7615, https://doi.org/10.5194/acp-10-7603-2010, 2010.
Wang, X., Dickinson, R., Su, L., Zhou, C., and Wang, K.: PM2.5 Pollution in China and How It Has Been Exacerbated by Terrain and Meteorological Conditions, B. Am. Meteorol. Soc., 99, 105–119, https://doi.org/10.1175/bams-d-16-0301.1, 2018.
WHO: WHO Air Quality Guidelines for Particulate Matter, Ozone, Nitrogen Dioxide and Sulfur Dioxide, World Health Organization, Geneva, Switzerland, 2006.
WorldPop (School of Geography and Environmental Science, University of Southampton): China 100 m Population. Alpha version 2010, 2015 and 2020 estimates of numbers of people per pixel (ppp) and people per hectare (pph), with national totals adjusted to match UN population division estimates, available at: https://www.worldpop.org/geodata/summary?id=131 (last access: 20 August 2019), and remaining unadjusted, https://doi.org/10.5258/SOTON/WP00055, 2015.
Wu, J., Li, G., Cao, J., Bei, N., Wang, Y., Feng, T., Huang, R., Liu, S., Zhang, Q., and Tie, X.: Contributions of trans-boundary transport to summertime air quality in Beijing, China, Atmos. Chem. Phys., 17, 2035–2051, https://doi.org/10.5194/acp-17-2035-2017, 2017.
Zhang, L., Wang, T., Lv, M., and Zhang, Q.: On the severe haze in Beijing during January 2013: Unraveling the effects of meteorological anomalies with WRF-Chem, Atmos. Environ., 104, 11–21, https://doi.org/10.1016/j.atmosenv.2015.01.001, 2015.
Zheng, B., Tong, D., Li, M., Liu, F., Hong, C., Geng, G., Li, H., Li, X., Peng, L., Qi, J., Yan, L., Zhang, Y., Zhao, H., Zheng, Y., He, K., and Zhang, Q.: Trends in China's anthropogenic emissions since 2010 as the consequence of clean air actions, Atmos. Chem. Phys., 18, 14095–14111, https://doi.org/10.5194/acp-18-14095-2018, 2018.