the Creative Commons Attribution 3.0 License.
the Creative Commons Attribution 3.0 License.
Comparison of tropospheric NO2 columns from MAX-DOAS retrievals and regional air quality model simulations
Anne-Marlene Blechschmidt
Joaquim Arteta
Adriana Coman
Lyana Curier
Henk Eskes
Gilles Foret
Clio Gielen
Francois Hendrick
Virginie Marécal
Frédérik Meleux
Jonathan Parmentier
Enno Peters
Gaia Pinardi
Ankie J. M. Piters
Matthieu Plu
Andreas Richter
Arjo Segers
Mikhail Sofiev
Álvaro M. Valdebenito
Michel Van Roozendael
Julius Vira
Tim Vlemmix
John P. Burrows
Multi-axis differential optical absorption spectroscopy (MAX-DOAS) tropospheric NO2 column retrievals from four European measurement stations are compared to simulations from five regional air quality models which contribute to the European regional ensemble forecasts and reanalyses of the operational Copernicus Atmosphere Monitoring Service (CAMS). Compared to other observational data usually applied for regional model evaluation, MAX-DOAS data are closer to the regional model data in terms of horizontal and vertical resolution, and multiple measurements are available during daylight, so that, for example, diurnal cycles of trace gases can be investigated.
In general, there is good agreement between simulated and retrieved NO2 column values for individual MAX-DOAS measurements with correlations between 35 % and 70 % for individual models and 45 % to 75 % for the ensemble median for tropospheric NO2 vertical column densities (VCDs), indicating that emissions, transport and tropospheric chemistry of NOx are on average well simulated. However, large differences are found for individual pollution plumes observed by MAX-DOAS. Most of the models overestimate seasonal cycles for the majority of MAX-DOAS sites investigated. At the urban stations, weekly cycles are reproduced well, but the decrease towards the weekend is underestimated and diurnal cycles are overall not well represented. In particular, simulated morning rush hour peaks are not confirmed by MAX-DOAS retrievals, and models fail to reproduce observed changes in diurnal cycles for weekdays versus weekends. The results of this study show that future model development needs to concentrate on improving representation of diurnal cycles and associated temporal scalings.
- Article
(11020 KB) - Full-text XML
- BibTeX
- EndNote


Given the influence of NOx on air quality and climate through effects on radiation, it is of high environmental and scientific interest to accurately observe and simulate spatial distribution and time evolution of NO2 concentrations in the troposphere. Simulating NO2 is a challenge for numerical models as it is chemically very active and hence depends on many factors including, for example, cloud cover which affects photolysis of this trace gas. Moreover, representation of NOx emissions adds a large uncertainty to the model output.
Multi-axis differential optical absorption spectroscopy (MAX-DOAS) (e.g., Hönninger et al., 2004; Wittrock et al., 2004) measurements have been used to investigate air pollution in many studies, including the FORMAT campaign in northern Italy (Heckel et al., 2005; Wagner et al., 2011), the Cabauw Intercomparison campaign for Nitrogen Dioxide measuring Instruments (CINDI) in the Netherlands (Piters et al., 2012), campaigns in Canada (Halla et al., 2011; Mendolia et al., 2013), China (e.g., Irie et al., 2011; Hendrick et al., 2014; Ma et al., 2013; Wang et al., 2014) and during ship-borne measurements (Leser et al., 2003; Takashima et al., 2012; Peters et al., 2012).
MAX-DOAS observations of atmospheric composition are performed by taking measurements of the scattered sunlight at different elevation and sometimes also azimuthal angles. Depending on the viewing angle and solar position, the light path through the atmosphere is different, with the observation in the zenith direction usually providing the shortest light path through the lower troposphere. Therefore, using observations in low-elevation angles as measurement intensity and zenith measurements as reference intensity, the total amount of molecules of a certain species along the light path difference (zenith subtracted from non-zenith measurement), so-called differential slant column densities, can be determined using Beer–Lambert law. These can be inverted to tropospheric columns and lower altitude tropospheric profiles by radiative transfer modeling and optimal estimation techniques.
A large number of studies applied MAX-DOAS data for satellite validation (e.g., Celarier et al., 2008; Valks et al., 2011; Irie et al., 2008, 2012; Ma et al., 2013; Lin et al., 2014; Kanaya et al., 2014; Pinardi et al., 2014) but up to now, comparisons to regional air quality model simulations of tropospheric NO2 have, to our knowledge, only been carried out by Vlemmix et al. (2015) and Shaiganfar et al. (2015). Several studies compared regional air quality model simulations to satellite data (e.g., Huijnen et al., 2010), although satellite data are usually only available at much coarser time steps compared to regional model data. In this respect, the advantage of MAX-DOAS retrievals compared to satellite retrievals is the finer resolution in time. Moreover, several studies compared in situ NO2 data to regional model results (e.g., Vautard et al., 2009; Colette et al., 2011; Mues et al., 2014), although in situ data usually refer to a specific location (point measurements), whereas regional model results are available for a specific horizontal grid resolution and area depending on the model setup. As MAX-DOAS data represent a larger volume of air, they are much better suited for investigating performance of regional models than in situ data. According to Richter et al. (2013), the horizontal averaging volume of MAX-DOAS data depends on aerosol loading, wavelength and viewing direction, and ranges from a few kilometers in the polluted boundary layer up to 80 km from the top of a mountain under clean air conditions. Another advantage of MAX-DOAS measurements is their ability to observe several pollution-related species at the same time (e.g., NO2, HCHO, CHOCHO, SO2, aerosols and potentially also O3) and to provide NO2 data which are virtually free of interferences from other species or nitrogen compounds such as NOy (NOx and other oxidized nitrogen species). In contrast to NO2, NOx cannot be retrieved from MAX-DOAS measurements directly, so these measurements are of more interest for air quality than for atmospheric chemistry studies. Vertical profiles of trace gases can be retrieved from MAX-DOAS measurements, which is another advantage for model comparison studies.
In the present study, MAX-DOAS measurements are compared to regional air quality model simulations to evaluate the quality of the simulations and to identify possible weaknesses of the models. Parts of this approach are already applied within scientific reports of the operational Copernicus Atmosphere Monitoring Service (CAMS; http://atmosphere.copernicus.eu/, last access: 7 February 2020) (see, e.g., Douros et al., 2019) but mainly to model results provided on eight output levels only, which introduces uncertainty to comparison results. CAMS is the operational follow-up of the former GEMS (Global and regional Earth-system Monitoring using Satellite and in-situ data) (Hollingsworth et al., 2008) and three succeeding MACC (Monitoring Atmospheric Composition and Climate) projects. The global component of CAMS extends weather services of the ECMWF (European Centre for Medium-Range Weather Forecasts) with simulations of atmospheric trace gases and aerosols, while operational air quality forecasts and analyses for Europe are provided at much finer resolution through the regional component. Hourly NO2 vertical column densities (VCDs) from six different regional model runs based on five models which are used within CAMS will be compared to MAX-DOAS measurements from one rural and three urban European stations: Bremen (operated by IUP-Bremen), De Bilt (operated by KNMI), Uccle and OHP (Observatoire de Haute-Provence) (the latter two operated by Royal Belgian Institute for Space Aeronomy – BIRA-IASB). The locations of the stations are plotted on top of mean NO2 tropospheric columns from the Ozone Monitoring Instrument (OMI) (Levelt et al., 2006) satellite observations for February 2011 as well as on a map of anthropogenic NOx emissions used by the models in Fig. 1 as an indicator of pollution levels in these and surrounding regions. The spatial distribution of NOx emissions agrees well with pollution hotspots and cleaner areas identified by OMI.
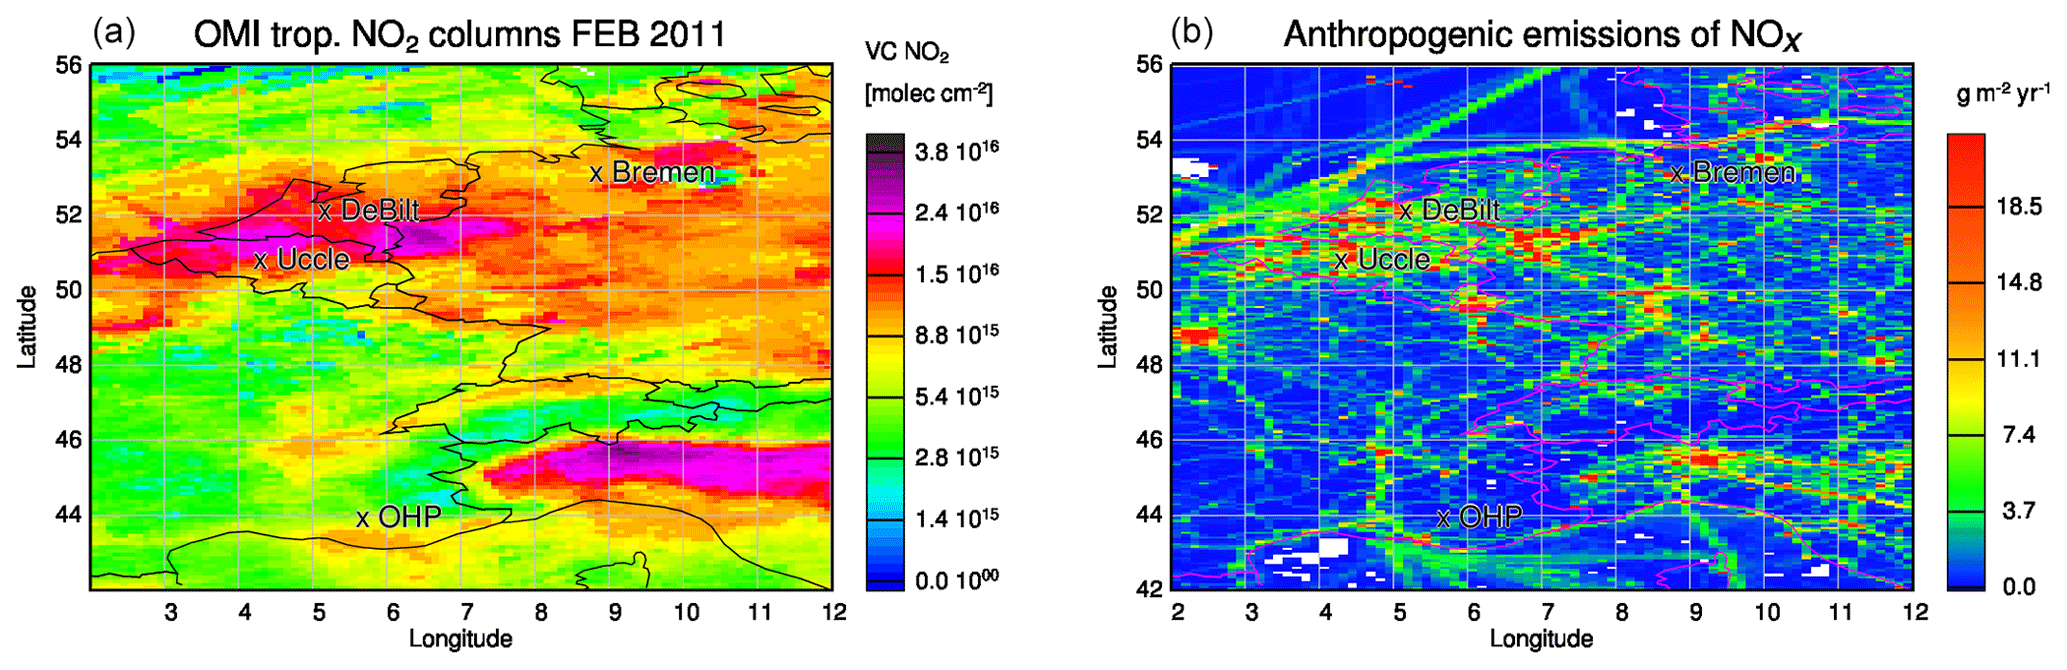
Figure 1Maps of (a) average tropospheric NO2 VCDs (molec cm−2) observed by OMI for February 2011 and (b) TNO/MACC-II anthropogenic NOx emissions (g m−2 yr−1) over Europe. The locations of MAX-DOAS measurement sites investigated in this study are marked by black crosses on the maps. The satellite data have been gridded to 0.1∘ lat × 0.1∘ long; the resolution of the emission database is 0.125∘ lat × 0.0625∘ long.
This paper starts with an overview of regional model and MAX-DOAS data (Sect. 2), followed by a description of the comparison method (Sect. 3). Results are described and discussed in Sect. 4. Finally, a summary and conclusions are given.
2.1 Regional air quality model simulations
CHIMERE (Menut et al., 2013), LOTOS-EUROS (LOng Term Ozone Simulation – EURopean Operational Smog) (Schaap et al., 2008), EMEP MSC-W (European Monitoring and Evaluation Programme Meteorological Synthesizing Centre – West) (Simpson et al., 2012), MOCAGE (Model Of atmospheric Chemistry At larGE scale) (Josse et al., 2004; Guth et al., 2016) and SILAM (System for Integrated modeLling of Atmospheric coMposition) (Sofiev et al., 2006, 2015) contributed to the European regional ensemble forecasts (Marécal et al., 2015) and reanalyses of the former MACC projects and are currently used within CAMS. These models have been used in many studies for investigating atmospheric composition on a regional scale (e.g., Drobinski et al., 2007; Huijnen et al., 2010; Lacressonnière et al., 2014; Petetin et al., 2015; Solazzo et al., 2012; Watson et al., 2016; Zyryanov et al., 2012).
All of these models use ECMWF-IFS and MACC reanalysis (Innes et al., 2013) data as meteorological and chemical input data and boundary conditions, respectively. Anthropogenic emissions are taken from the MACC emissions database (Kuenen et al., 2011), and the Global Fire Assimilation System (GFAS) (Kaiser et al., 2012) is used to account for fire emissions. The input to these models is thus consistent and differences in model results are mainly due to different representation of chemical processes, advection, convection, turbulent mixing, wet and dry deposition (Marécal et al., 2015).
The model runs investigated in the present study were performed by different European institutions and are based on different horizontal and vertical grid spacings and chemistry schemes (see Table 1 for further details). Apart from SILAM, the models were run without chemical data assimilation. The SILAM simulations included assimilation of surface observations of NO2 as described in Vira and Sofiev (2015).
(Schmidt et al., 2001)Simpson et al., 2012Bergström et al., 2012Simpson et al., 2012Bergström et al., 2012Schaap et al., 2008Whitten et al., 1980(Stockwell et al., 1997)(Lefèvre et al., 1994)(Sofiev, 2000)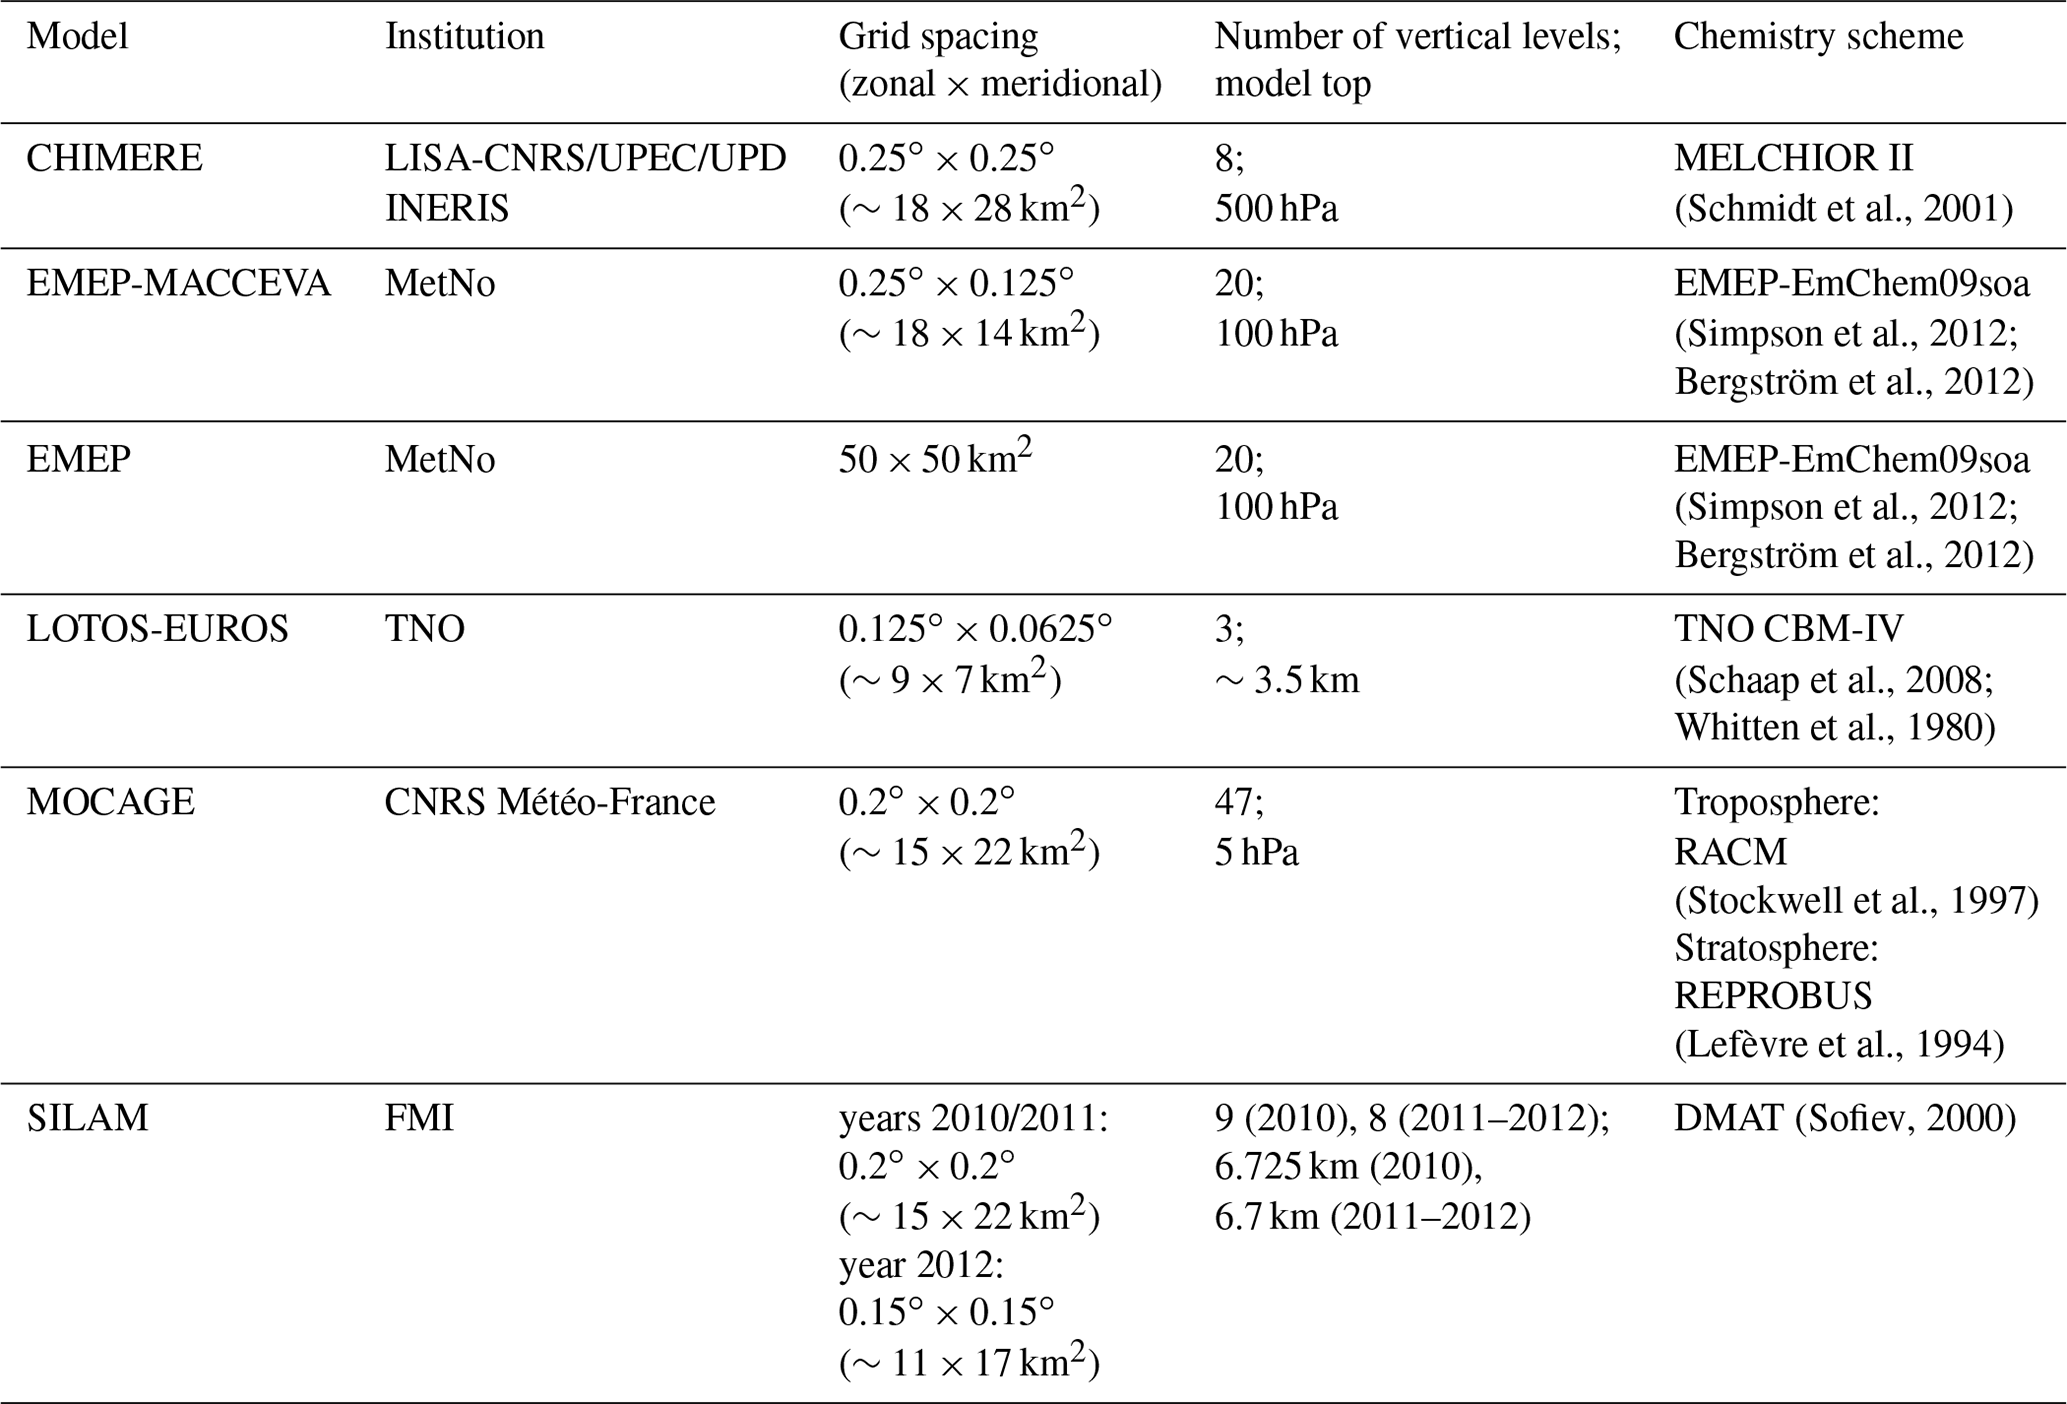
Two different sets of EMEP model runs are investigated in this study. The first one uses the same setup as the other regional models described above and is termed EMEP-MACCEVA in the following. EVA (validated assessments for air quality in Europe) was a subproject of MACC dedicated to the development and implementation of operational yearly production of European air quality assessment reports (https://policy.atmosphere.copernicus.eu/Reports.php, last access: 10 February 2020). The second set of simulations (called EMEP in the following) uses the same setup as in the EMEP status reports (see http://www.emep.int, last access: 7 February 2020) for each year based on the EMEP subdomain, ECMWF-IFS as meteorological driver, EMEP emissions, Fire INventory from NCAR version 1.0 (FINNv1; Wiedinmyer et al., 2011), initial conditions described by Schulz et al. (2013) for the years 2010–2011 and Fagerli et al. (2014) for 2012 and climatological boundary conditions described by Simpson et al. (2012).
According to Mues et al. (2014), chemistry transport models in general account for seasonal, daily and diurnal emission changes by applying average time profiles given for different energy sectors and regions to totals of annual emissions across the model domain. Temporal emission patterns used by the regional air quality models listed above are country and SNAP (Selected Nomenclature for Sources of Air Pollution) sector dependent and are based on Denier van der Gon et al. (2011). A list of the SNAP sectors is given by Bieser et al. (2011). Moreover, different vertical emission profiles are applied for each regional model. These are described in more detail by Bieser et al. (2011) for EMEP and CHIMERE, Simpson et al. (2003) for SILAM and Thunis et al. (2010) for LOTOS-EUROS. For MOCAGE, emissions are injected into the five lowest model levels using a hyperbolic decay.
More details on specific model setups and scores with respect to surface observations can be found in Marécal et al. (2015) and in the model specification/validation dossiers which are available online at https://atmosphere.copernicus.eu/regional-services (last access: 7 February 2020).
2.2 MAX-DOAS retrievals
This study makes use of MAX-DOAS measurements from four European stations: Bremen (Germany), De Bilt (the Netherlands), Uccle (Belgium) and OHP (France). Characteristics of the data available from the stations, such as exact location and time period of retrievals investigated here, are briefly summarized in Table 2 and will be described below.
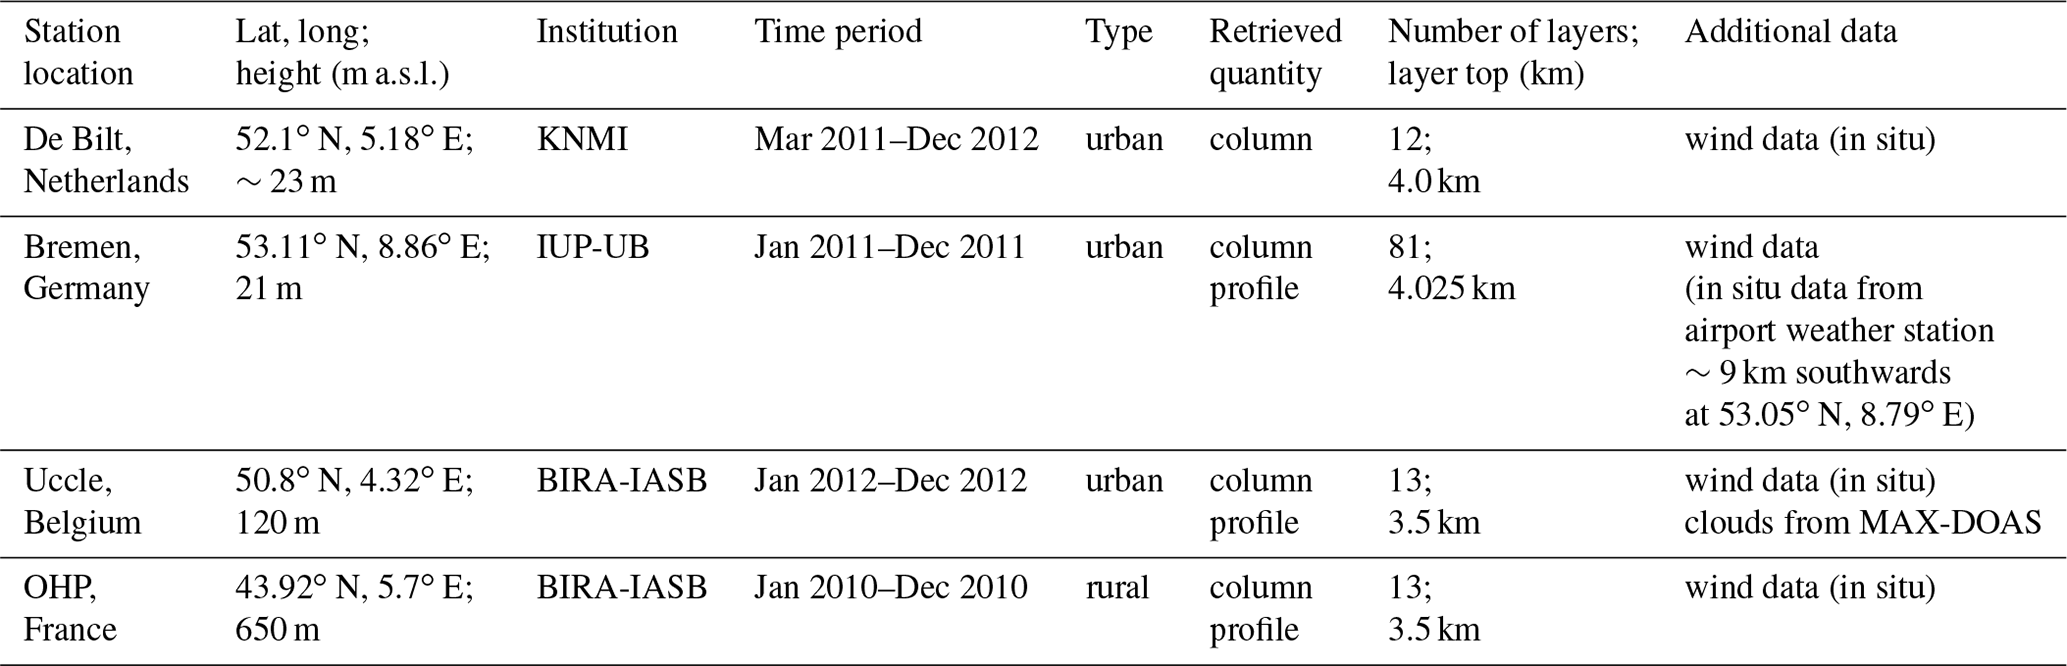
For Bremen, Uccle and OHP, NO2 slant column densities (SCDs) are obtained by a DOAS analysis for a specific wavelength window using a series of low-elevation angles as measurement intensity and zenith measurements as reference intensity. Cross sections of different trace gases are accounted for in the retrieval. Resulting SCDs of NO2 and O4 are then used as input for a radiative transfer model which is a two-step approach. First, an aerosol extinction profile is retrieved by comparing the measured O4 SCDs to O4 SCDs simulated by the radiative transfer models SCIATRAN (Rozanov et al., 2005) for Bremen and bePRO (Clémer et al., 2010) for Uccle and OHP. In the second step, the derived aerosol extinction, measured NO2 SCDs and an a priori NO2 profile are used to retrieve the NO2 profile of interest. This is an inverse problem solved by the means of the optimal estimation method (Rodgers, 2000).
De Bilt (52.10∘ N, 5.18∘ E; see Fig. 1) is the hometown of KNMI and located just outside the city of Utrecht. The De Bilt experimental research site is surrounded by local and regional roads, with a lot of traffic which can affect regional air quality significantly. According to Vlemmix et al. (2015), it can also be affected by pollution sources which are located more far away in the Rotterdam region to the southwest, Amsterdam to the northwest and the German Ruhr region to the southeast of De Bilt. The MAX-DOAS instrument operated at De Bilt is a commercial system obtained from Hoffmann Messtechnik GmbH. It has an Ocean Optics spectrograph, diffraction grating and a charge-coupled device (CCD) detector. It operates at a wavelength range of 400–600 nm. The pointing direction of the instrument is 80∘ (east to northeast); the wavelength window of the DOAS fit for NO2 is 425–490 nm. Wavelength calibration and slit-function width are determined using a high-resolution solar spectrum. Cross sections of O3, NO2, O4, H2O and a pseudo cross section accounting for the Ring effect are applied. The choice of fitting parameters complies with the standards agreed by the MAX-DOAS community, following from homogenization efforts within, e.g., CINDI, GEOMON, NORS and QA4ECV as much as possible. Air mass factor (AMF) calculations are performed by the DAK radiative transfer model (Doubling Adding KNMI; De Haan et al., 1987; Stammes, 2001). A priori profiles of NO2 are based on a block profile with NO2 present in the boundary layer; boundary layer heights were taken from a climatology based on ECMWF data. For De Bilt, averaging kernels refer to the altitude-dependent (or box-)differential AMFs divided by the total differential AMF. The differential AMF is derived at a specific altitude by simulating the radiance with and without an added partial column of NO2 at this altitude with the DAK model. NO2 tropospheric columns are retrieved from the 30∘ elevation angles; NO2 profiles were not available at the time of the study.
The IUP-Bremen MAX-DOAS instrument consists of an outdoor telescope unit collecting light in different directions, and an indoor grating spectrometer (Shamrock 163 equipped with an Andor LOT257U CCD with 2048×512 pixels) covering a wavelength interval from 430 to 516 nm at a resolution of approximately 0.7 nm. Both components are connected via an optical fiber bundle which simplifies handling and overcomes polarization effects. The telescope unit is installed at an altitude of approximately 20 m above ground level (m a.g.l.) at the roof of the Institute of Environmental Physics building (53.11∘ N, 8.86∘ E) at the University of Bremen which is located to the northeast of the city center. The azimuthal pointing direction is northwest, which means that some of the measured pollution peaks are due to the exhaust of an industrial area, predominantly a steel plant, as well as a nearby highway. However, over longer time periods, the retrievals are dominated by pollution from the city center. NO2 SCDs are derived by DOAS analysis using a fitting window of 450–497 nm. Cross sections of O3, NO2, O4, H2O and a pseudo cross section accounting for the ring effect are accounted for in the fit. Profiles of NO2 are derived from SCDs applying the BRemian Advanced MAX-DOAS retrieval algorithm (BREAM) which incorporates SCIATRAN radiative transfer simulations. An NO2 a priori profile which is constant with altitude is assumed and iterated in the retrieval. Detailed information about the profile retrieval is given by Wittrock (2006) and Peters et al. (2012).
BIRA-IASB has been operating a MAX-DOAS instrument at OHP (43.92∘ N, 5.7∘ E) since 2005. OHP is a background remote site in the south of France located on a plateau at 650 m above sea level (m a.s.l.), temporarily affected by transport of pollution from regional sources (e.g., from the petrochemical plants of Étang de Berre close to Marseille in the southwest) and the Po Valley (Italy) to the northeast of the station. The MAX-DOAS instrument, which points towards the SSW direction, consists of a grating spectrometer Jobin-Yvon TRIAX 180 (1800 grooves mm−1) covering the 330–390 nm wavelength range coupled to a thermoelectrically cooled (−40 ∘C) Hamamatsu CCD detector (1024 pixels). NO2 SCDs are obtained by applying the DOAS technique to a 364–384 nm wavelength interval, taking into account spectral signatures of O3, O4, the ring effect and NO2. In Uccle (50.8∘ N, 4.32∘ E), which is located southwest of the Brussels city center, a mini-MAX-DOAS from Hoffmann Messtechnik GmbH covering the 290–435 nm wavelength range has been operated by BIRA-IASB since 2011. The instrument points north to northeast towards the city center. NO2 SCDs are retrieved in a 407–432 nm wavelength interval including the same spectral signatures as for OHP. It should be noted that a sequential zenith reference spectrum has been implemented in order to minimize the impact of changes in shift and resolution due to temperature instabilities. The DOAS fit for NO2 has also been improved by introducing pseudo-absorber cross sections derived from principal component analysis of residuals on days affected by large thermal instabilities. This approach allows for a better correction of fast-changing slit-function variations, resulting in more stable residuals and therefore more realistic random uncertainty estimates. For NO2 vertical profile retrievals at both stations, the bePRO radiative transfer code (Clémer et al., 2010) is used. NO2 profiles are retrieved at 420 nm for Uccle and 372 nm for OHP. For NO2 vertical profile retrievals, exponentially decreasing a priori profiles have been constructed, based on an estimation of NO2 vertical column densities derived from the so-called geometrical approximation (Hönninger et al., 2004; Brinksma et al., 2008) and using scaling heights of 0.5 and 1 km for OHP and Uccle, respectively. A priori and measurement-uncertainty covariance matrices are constructed as by Clémer et al. (2010) with adopted correlation lengths of 0.05 and covariance scaling values of 0.5 and 0.35 for Uccle and OHP, respectively. A more detailed description of the model and trace gas profile retrievals can be found in Hendrick et al. (2014). Although there has not been formal side-by-side operation of both instruments for verification purpose, a good overall agreement has been obtained between the mini-DOAS and other BIRA research-grade spectrometers similar to the one operated at OHP, e.g., like during the CINDI campaign (Roscoe et al., 2010).
Previous studies (e.g., Hendrick et al., 2014; Wang et al., 2014; Franco et al., 2015) have shown that the typical error on MAX-DOAS retrieved VCDs is around 20 %, including uncertainties related to the optimal estimation method, trace gas cross sections and aerosol retrievals, and can be higher for sites with low trace gas concentrations like OHP or due to instrumental conditions. Moreover, the uncertainty of the retrieval is increased in cloudy conditions in particular as clouds are not included in the MAX-DOAS forward calculations.
For Uccle, information on cloud conditions was retrieved according to the method by Gielen et al. (2014), which is based on analysis of the MAX-DOAS retrievals but not applied for results shown in the present study. No cloud flags are available for Bremen, De Bilt and OHP. For Bremen, MAX-DOAS retrievals were filtered for broken cloud situations by comparing radiative forward calculations of O4 to retrieved O4 columns and removing scans with correlations < 0.6. For the other stations, the following data were not considered: (De Bilt) retrievals with fitting residuals > and NO2 or O4 fitting errors > 50 %, (Uccle/OHP) retrievals with NO2 fitting root mean square error (RMSE) > 50 % and degrees of freedom for signal < 1. Clouds may alter MAX-DOAS retrievals in several ways depending on the viewing direction at which they are present. This is described in detail by Vlemmix et al. (2015). In addition to the direct effect of clouds on the measurements, clouds also affect photolysis rates and hence NOx chemistry and NO-to-NO2 partitioning, which can impact on tropospheric NO2 columns and profiles retrieved under cloudy weather conditions. The influence of clouds on comparison results is complex and regarded as a separate topic for future studies.
2.3 Wind measurements
In order to investigate the ability of the models to reproduce transport of NO2 towards the stations, the MAX-DOAS data described above are complemented by meteorological in situ station data of wind speed and wind direction. Wind data for Bremen were provided by the German Weather Service/Deutscher Wetterdienst through their website at http://www.dwd.de (last access: 7 February 2020). The weather station in Bremen is located at the main airport, approximately 9 km southwards of the MAX-DOAS station. This may result in differences to the actual wind direction and wind speed at time and location of the MAX-DOAS retrievals. Wind data for OHP were taken from the weather station at the observatory and downloaded from the corresponding website at http://pc-meteo.obs-hp.fr/intervalle.php (last access: 10 February 2020). Wind speed and direction measurements at Uccle are performed using a commercial rugged wind sensor from Young (model 05103) and were provided by BIRA-IASB (Francois Hendrick, personal communication, 2016). For De Bilt, wind measurements (within 300 m from the MAX-DOAS instrument) carried out by KNMI were downloaded from https://www.knmi.nl/nederland-nu/klimatologie/uurgegevens (last access: 7 February 2020).
The sensitivity of MAX-DOAS retrievals is largest in the boundary layer, which needs to be taken into account when comparing MAX-DOAS retrievals to model simulated values. This is achieved here by applying column-averaging kernels (AVKs) to the model data prior to comparison. The AVKs are part of the MAX-DOAS profiling output and represent the sensitivity of the retrieved column to the amount of NO2 at different altitudes.
In this study, model VCDs are derived by two different methods in order to test the influence of AVKs on the data analysis. Non-AVK-weighted model VCDs are calculated by summing up NO2 partial columns (VCDi) over all N model levels in the vertical. AVK-weighted model VCDs are calculated by applying column AVKs of the retrievals to model NO2 partial columns before summing up NO2 partial columns in the vertical:
where Nobs is the number of measurement altitudes. NO2 partial columns were derived at measurement altitudes from the model output prior to the application of AVKs.
Only those model values closest to the measurement time are used for the comparisons. As the model output is given in hourly time steps, the maximum possible time difference between measurements and simulations is 30 min. VCDs are calculated separately for each model and constitute the basis for calculating ensemble mean values.
Following studies by, e.g., Marécal et al. (2015), Langner et al. (2012), Solazzo et al. (2012) and Vautard et al. (2009), the present paper focuses on results of the model ensemble, i.e., the median of individual model results of a given quantity. As an even number of six different model runs (based on five different models) constitutes the model ensemble in the present study, the median is calculated by ordering the six different model values (e.g., for seasonal cycles, these values refer to the average of individual model runs for each month) in terms of magnitude and taking the average of the two middle numbers. An exception is OHP, as MOCAGE data are not available for this station, so the median refers to the middle number here. In addition, results from separate models are briefly discussed and shown in the main part of the paper to understand characteristics of the model ensemble output. It is beyond the scope of this study to describe the performance of each individual model in detail. The reader is referred to the Appendix for additional comparison figures of individual model simulations and MAX-DOAS data.
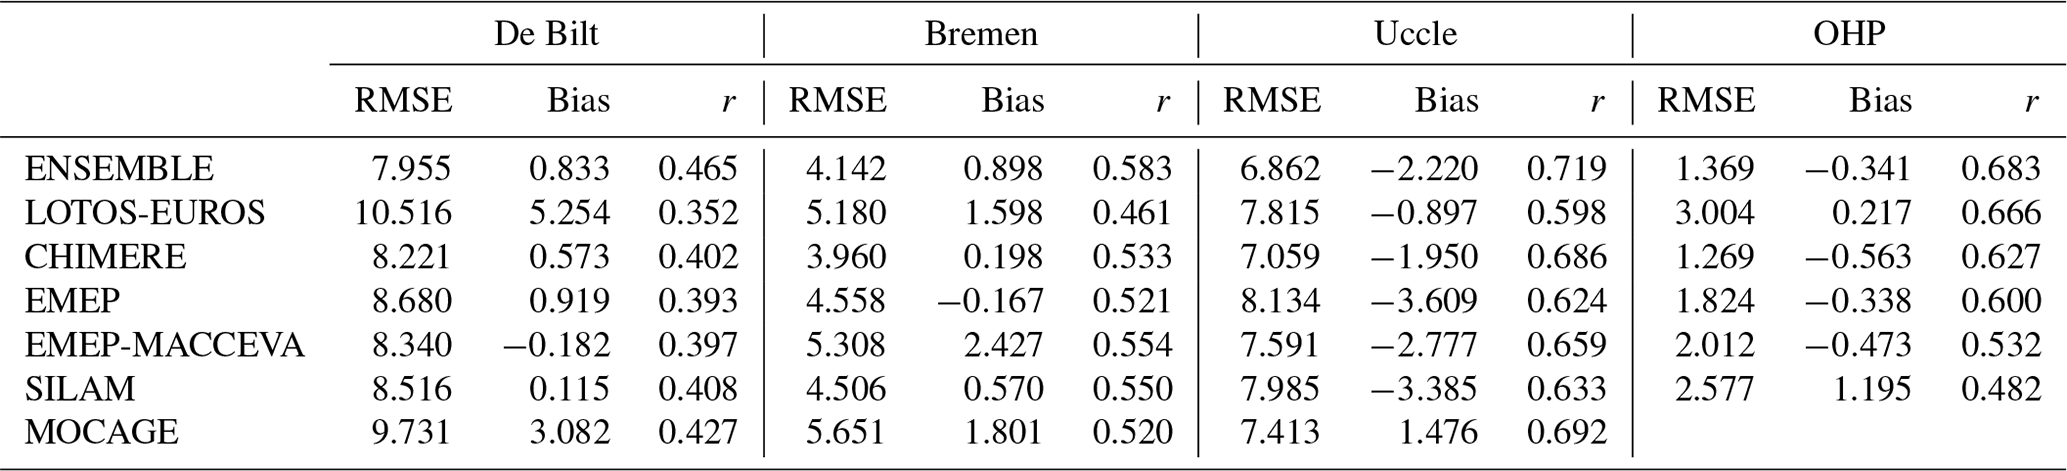
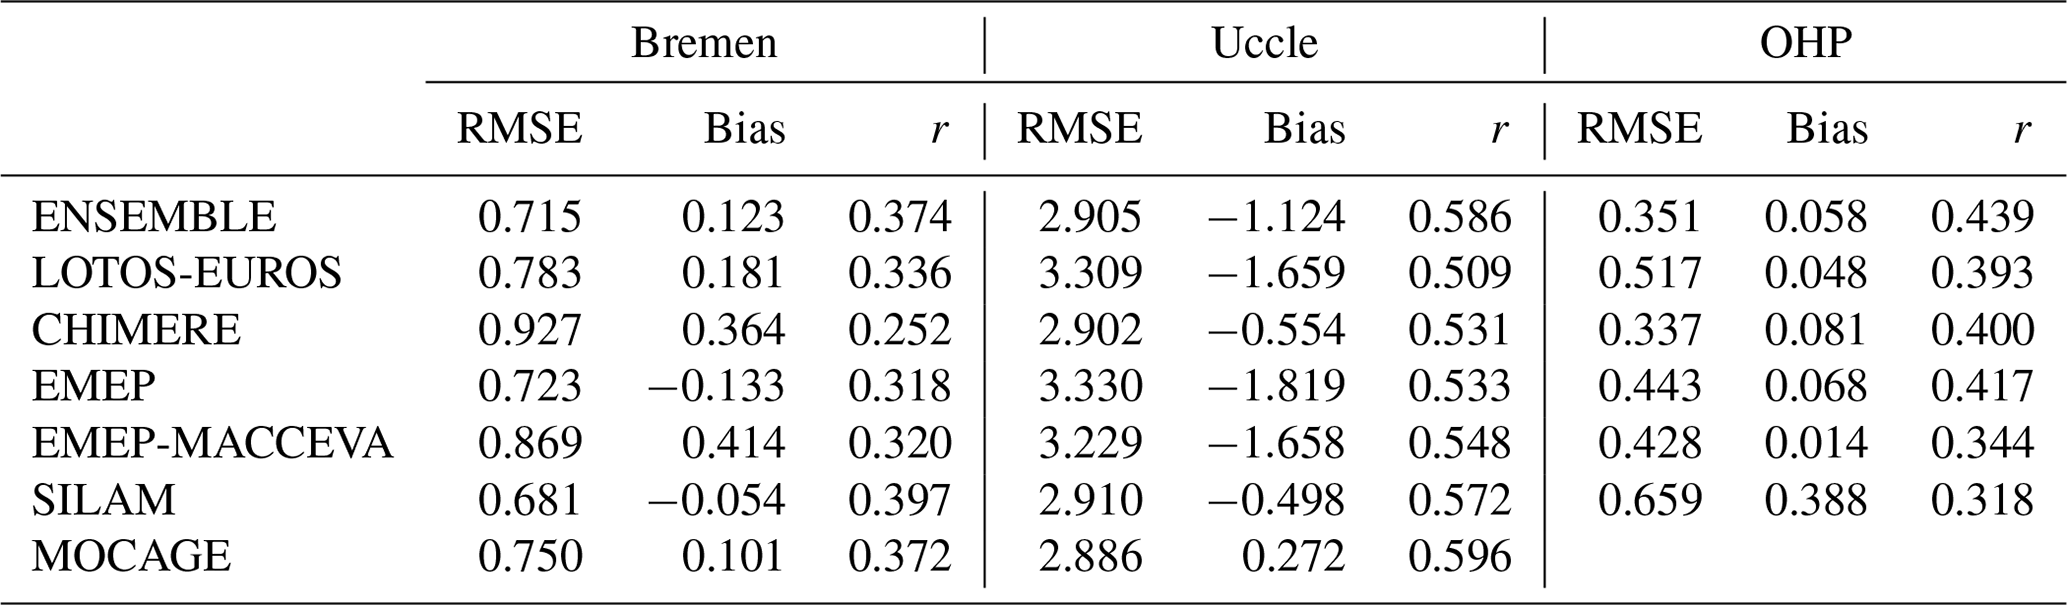
While the calculation of an ensemble median is a common approach to reduce individual model outliers, it is mainly used here for the sake of simplicity, allowing easier overall evaluation of how the models compare to MAX-DOAS retrievals. The model ensemble is based on five of the seven models (though with partly different setups) which constitute the CAMS regional model ensemble (http://www.regional.atmosphere.copernicus.eu/, last access: 7 February 2020) for which Marécal et al. (2015) have shown that, at least for ozone, the ensemble median performs on average best in terms of statistical indicators compared to the seven individual models and that the ensemble is also robust against reducing the ensemble size by one member. Statistical indicators for NO2 (see Tables 3 to 5) show that the ensemble median of the present study performs best in terms of overall correlation to individual MAX-DOAS measurements at each station. Compared to individual models for other statistical indicators and also comparisons for seasonal, diurnal and weekly cycles, reasonable results are achieved by the ensemble median.
Table 3Statistics on how AVK-weighted tropospheric NO2 VCDs (1015 molec cm−2) from regional models compare to MAX-DOAS retrievals at the four MAX-DOAS stations. Each column entry shows (from left to right) the root mean squared error (1015 molec cm−2), bias (1015 molec cm−2) and Pearson correlation coefficient. MOCAGE data are not available for the measurement time period at OHP.
As the typical error on MAX-DOAS retrieved VCDs is around 20 % but can be higher for sites with low trace gas concentrations like OHP or due to instrumental conditions (see Sect. 2.2), a conservative overall uncertainty of MAX-DOAS retrievals of 30 % is assumed for all stations within this paper and given along with the data plots, where appropriate. Data products with more detailed uncertainty information are currently in development, for example, in the framework of the FRM4DOAS project (http://frm4doas.aeronomie.be/, last access: 7 February 2020), and once available, these data and related uncertainty information can be used for other comparison studies.
The horizontal grid spacing (Table 1) differs for the six model runs evaluated in the present study, with a resolution of approximately 9 × 7 km2 for the finest resolution run (LOTOS-EUROS) and 50 × 50 km2 for the coarsest one (EMEP). The resolution of the remaining model runs is approximately 20 × 20 km2. As described in Sect. 2.2, the horizontal averaging volume of MAX-DOAS retrievals strongly depends on aerosol loading, viewing direction and wavelength (Richter et al., 2013). As a rough estimate, it ranges from 5 to 10 km for the stations used in the present study. Therefore, the horizontal averaging volume is (apart from the coarsest resolution run) expected to be either on the same spatial scale as the horizontal model resolution or by a factor of 1–4 smaller. From the latter (i.e., horizontal averaging volume of MAX-DOAS finer than model resolution), one would expect an underestimation of enhancements in tropospheric columns observed by MAX-DOAS in the event of horizontal changes in tropospheric NO2 columns below the model resolution and, similarly, an overestimation of local minima in tropospheric NO2 columns. However, in reality, the comparison between horizontal averaging volume of MAX-DOAS and horizontal resolution of the models is much more complicated, as MAX-DOAS instruments usually measure in one azimuthal pointing direction meaning that measurements, though integrated along the line of sight and over several elevation angles, do not necessarily fully represent the NO2 amount in the three-dimensional grid boxes of the model simulations. This could, for example, mean that a pollution plume with a horizontal extent on the order of the model resolution and hence showing up in the simulations is not observed by the MAX-DOAS instrument.
Figure 2 shows time series of AVK-weighted tropospheric NO2 VCDs from MAX-DOAS and model ensemble data. The magnitude of VCDs from the measurements for Bremen and OHP is reproduced by the model ensemble. For De Bilt, the spread of retrieved NO2 VCDs is larger than for simulated ones. At all of the four stations, measurements and simulations show large deviations for some of the time steps. Larger NO2 values inside individual pollution plumes are generally underestimated by the model ensemble, especially at Uccle and De Bilt. This is in agreement with Shaiganfar et al. (2015), who compared car MAX-DOAS measurements and OMI retrievals with a regional model (CHIMERE) and found that values inside emission plumes are systematically underestimated. However, especially in Bremen and OHP, the model ensemble also shows peaks at time steps when there was no or much less enhancement in retrieved NO2 VCDs. Out of the four MAX-DOAS sites investigated, the magnitude of NO2 VCDs is lowest at the rural station (OHP), which is sometimes affected by nearby pollution plumes that show up in the time series. Further investigation shows that most of these peaks are associated with northeasterly wind directions and hence pollution sources to the northeast of the station such as the Po Valley (Italy). At OHP, retrieved tropospheric NO2 columns are generally a bit higher than simulated ones, resulting in a negative bias of molec cm−2 for the ensemble (Table 3).

Figure 2Time series of AVK-weighted tropospheric NO2 VCDs (1015 molec cm−2) from (black circles) MAX-DOAS and (colored circles) model ensemble hourly data for (a–d) De Bilt, Bremen, Uccle and OHP.
The evolution of time series of tropospheric NO2 VCDs is largely determined by the evolution of surface partial columns (see Fig. 3) which already account for about 25 % of the magnitude of tropospheric NO2 VCDs. In the present study, surface partial columns refer to the partial column of the lowest measurement layer (Bremen 50 m, De Bilt 180 m, Uccle 180 m, OHP 150 m a.g.l.). As vertical profiles are not available from the MAX-DOAS output for De Bilt, comparisons of surface partial columns are not given for this station in the present paper. The same conclusions as for tropospheric NO2 VCDs described in the previous paragraph arise for surface partial columns when comparing the model ensemble to MAX-DOAS data. However, the negative bias found for OHP for tropospheric NO2 VCDs is not present when looking at the surface partial column time series for this station (see Tables 3 and 4). This result is consistent with average vertical profiles for OHP shown in Fig. 5, with the regional models slightly overestimating partial columns at the surface, while the majority of the models underestimate partial columns at altitudes between 1 and 1.5 km (Fig. 5).
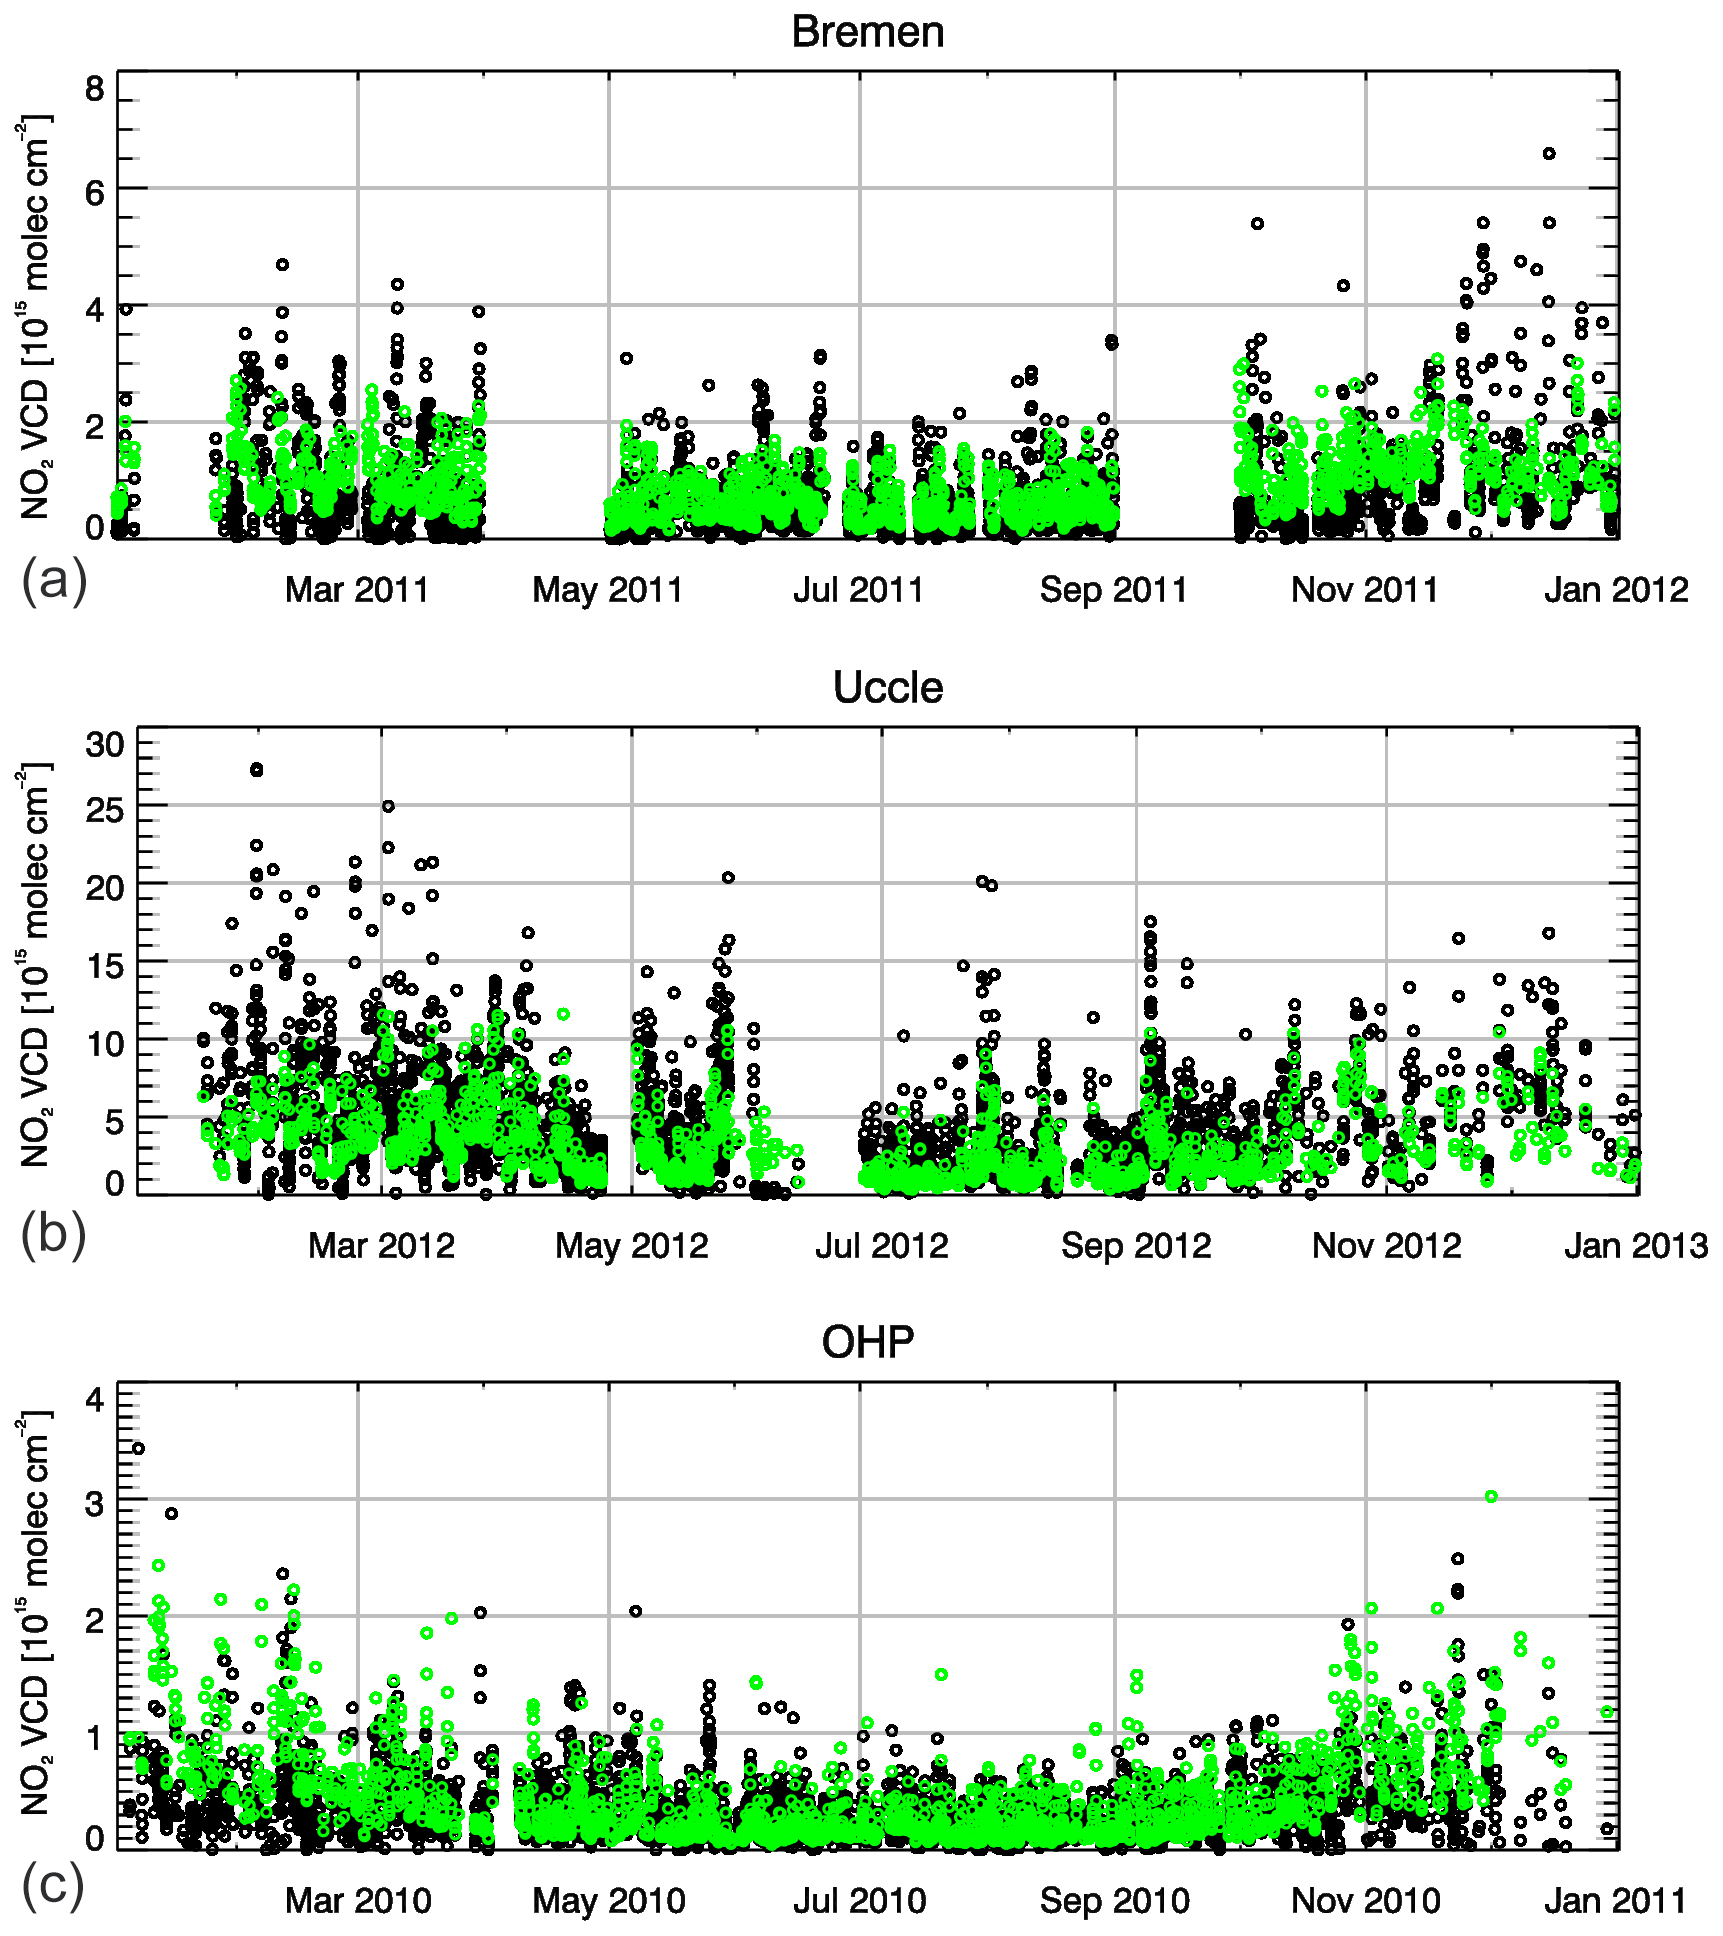
Figure 3As in Fig. 2 but for NO2 surface partial columns (1015 molec cm−2). Surface partial columns from MAX-DOAS are not available for De Bilt for the investigated time period.
Table 4As in Table 3 but for NO2 surface partial columns (1015 molec cm−2). Surface partial columns from MAX-DOAS are not available for De Bilt for the investigated time period.
Although there are larger differences between simulations and retrievals especially for individual pollution plumes, Fig. 4 shows that frequency distributions of AVK-weighted tropospheric NO2 VCDs are similar for ensemble simulations and observations. However, for OHP, the number of data values with tropospheric NO2 VCDs lower than 1×10¹⁵ molec cm−2 is significantly larger for model simulated values (about 1400 model values compared to about 200 observed data counts), in agreement with the negative bias in tropospheric columns described above.
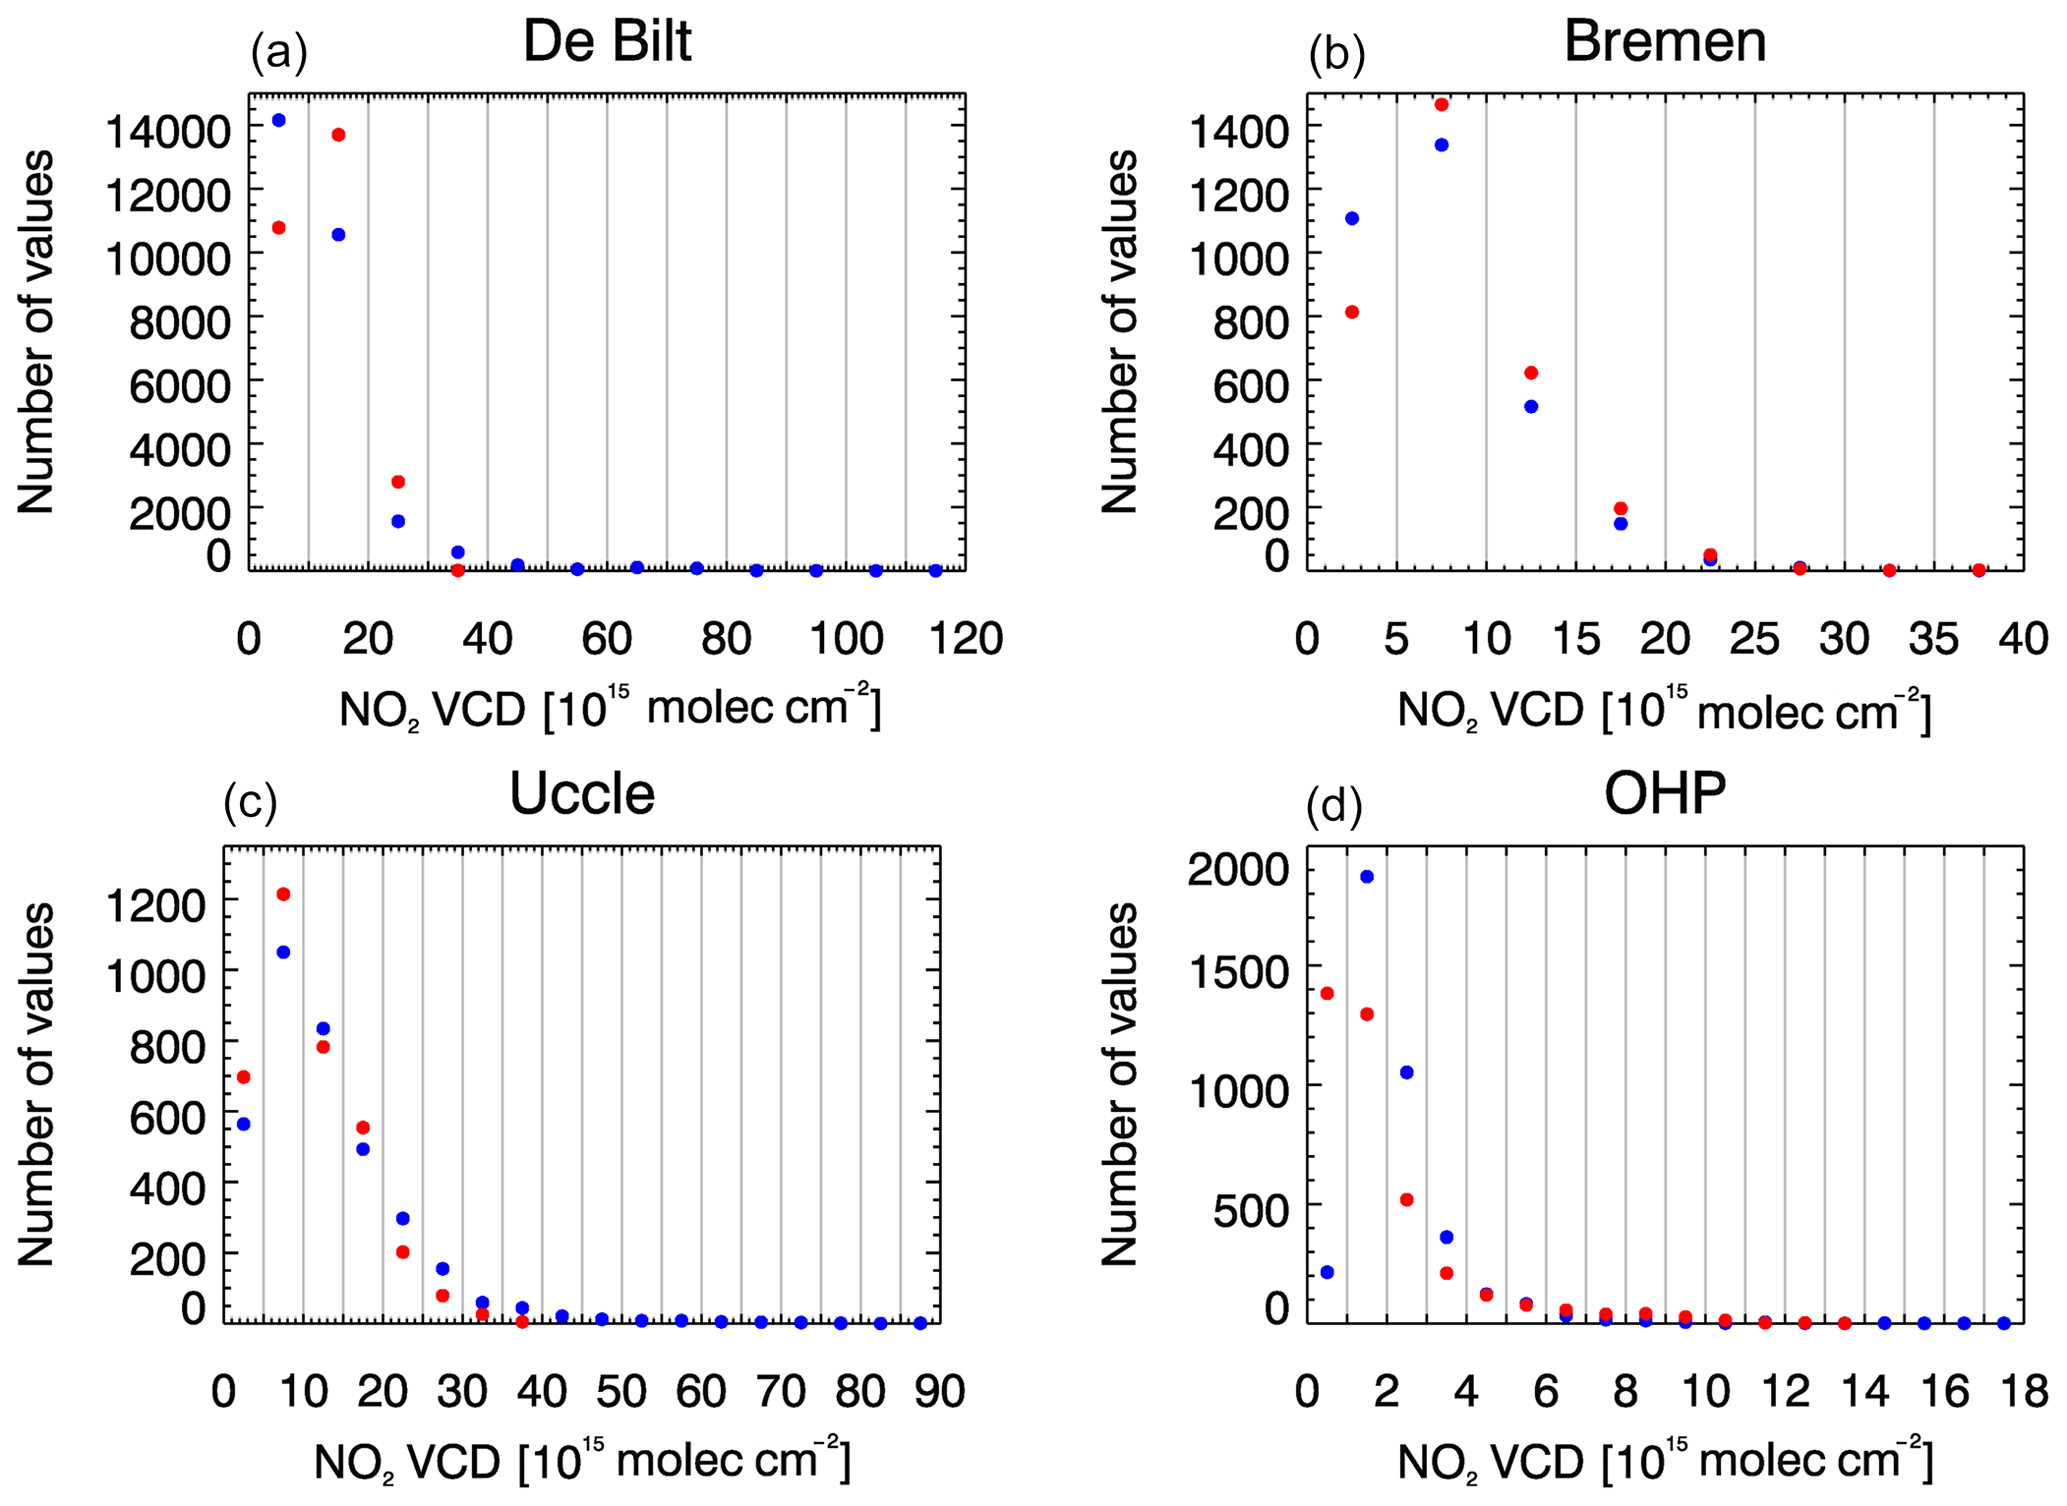
Figure 4Frequency distributions of AVK-weighted tropospheric NO2 VCDs (1015 molec cm−2) from (blue) MAX-DOAS and (red) model ensemble data for (a) De Bilt, (b) Bremen, (c) Uccle and (d) OHP. The distance between vertical gray lines on the x axis corresponds to the size of the bins used to calculate the number of values given on the y axis.
Figure 5 shows model simulated and MAX-DOAS retrieved vertical profiles of NO2 partial columns averaged over the whole time period of measurements together with a priori profiles and AVKs for completeness. Averages of vertical profiles over different seasons are given in Fig. A1, in order to investigate consistency between profiles throughout different times of the year. In general, differences between retrievals and simulations are largest for larger NO2 partial columns, which means for the lower altitude layers and during the colder winter and autumn seasons. Many of the values simulated by individual models do not fall into the uncertainty range of MAX-DOAS retrievals assumed here. For example, SILAM largely overestimates NO2 partial columns up to 1.5 km altitude at OHP, while MOCAGE (apart from the lowest observation layer) strongly overestimates values up to about 1 km altitude at Uccle. Although model ensemble profiles show some differences from the retrievals regarding the shape and magnitude of the profiles, they also show the largest partial columns close to the surface for all of the three stations investigated. This result also shows up throughout different seasons.
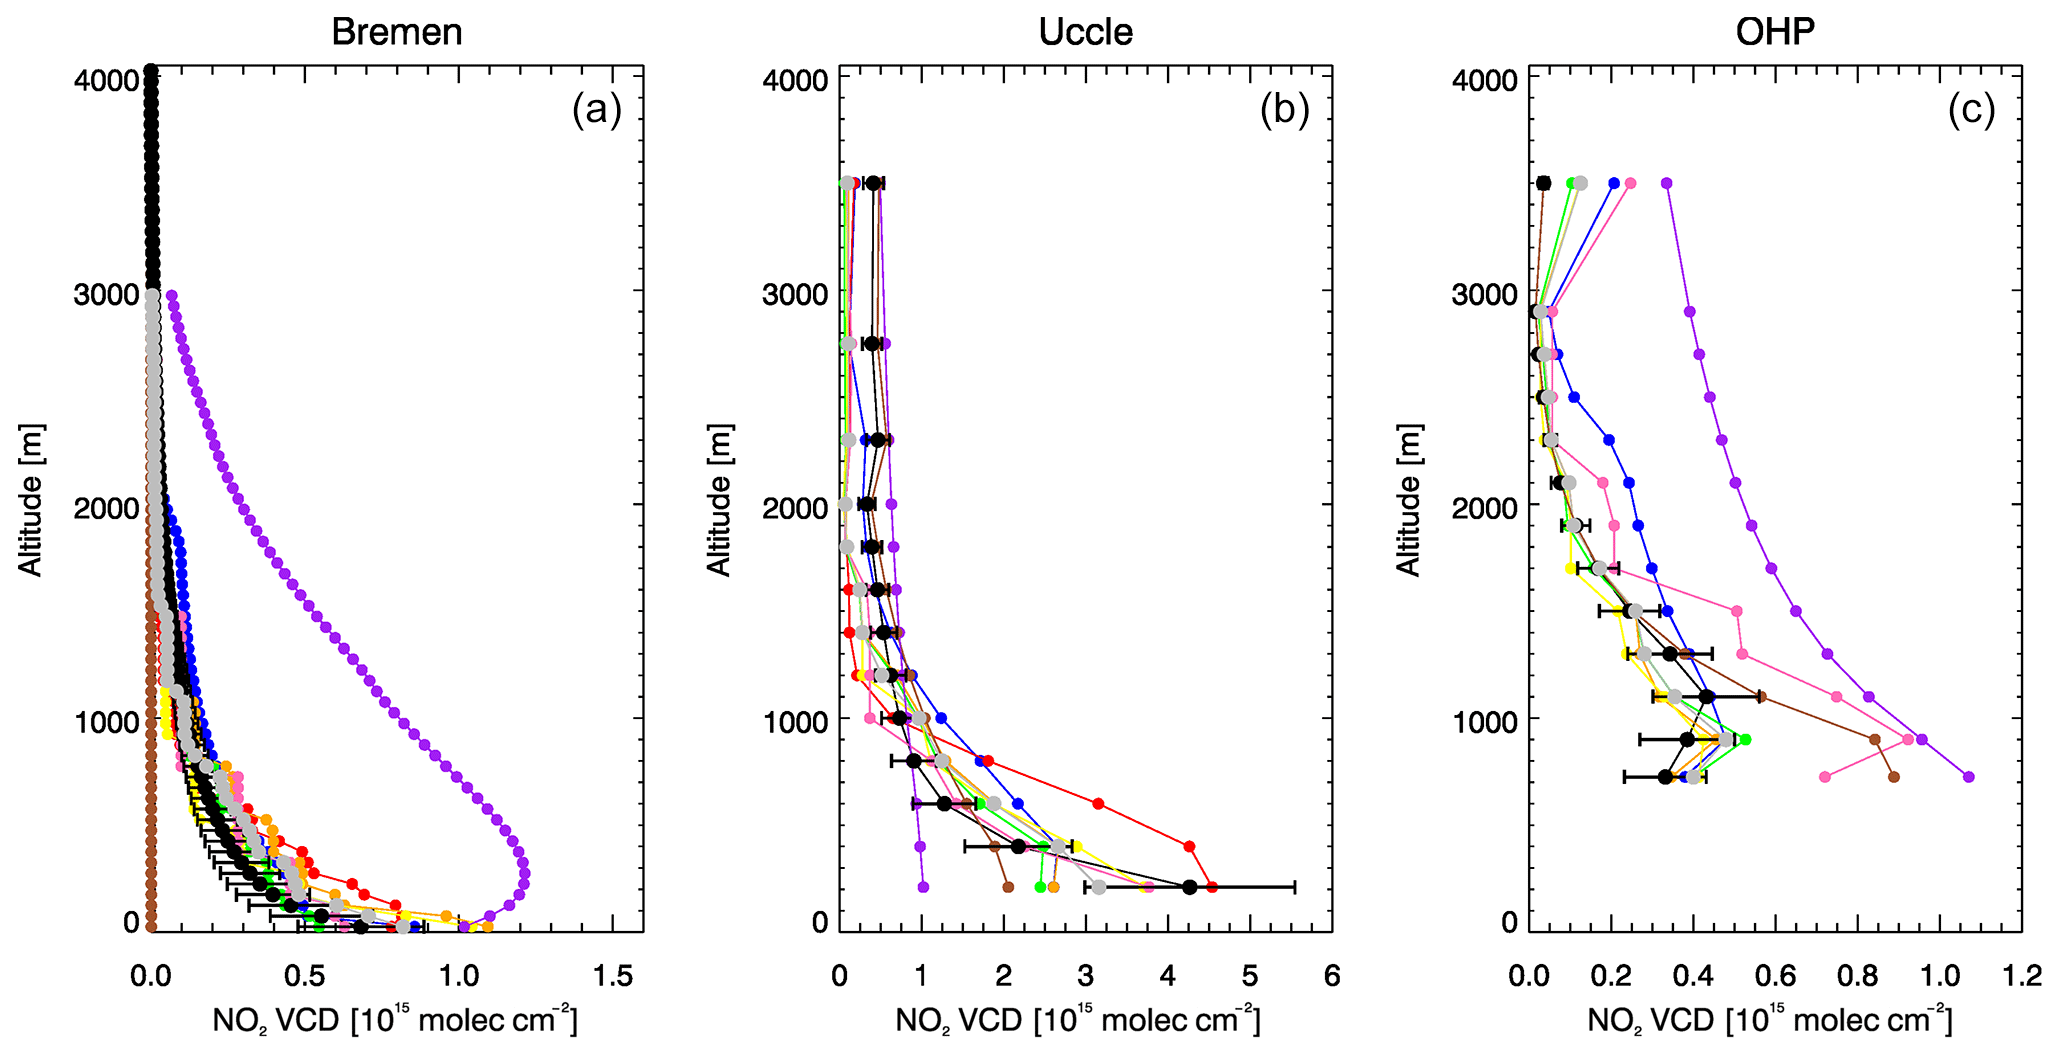
Figure 5Average vertical profiles of NO2 partial columns (1015 molec cm−2) from (black) MAX-DOAS, (brown) a priori profiles used for MAX-DOAS retrievals, (gray) model ensemble median, (blue) LOTOS-EUROS, (yellow) CHIMERE, (green) EMEP, (orange) EMEP-MACCEVA, (pink) SILAM and (red) MOCAGE as well as (purple) column AVKs (unitless) for (a) Bremen, (b) Uccle and (c) OHP. Black error bars refer to the uncertainty associated with the MAX-DOAS retrievals (assumed to be 30 % for all stations). MAX-DOAS vertical profiles are not available for De Bilt for the investigated time period.
As the sensitivity of MAX-DOAS retrievals is largest in the boundary layer, a feature which is independent of the retrieval method, we initially expected the application of column AVKs from the measurements to model simulations to be of crucial importance for evaluation results. However, further analysis showed that applying column AVKs to model NO2 partial columns before summing these up in the vertical does not have a big impact on derived tropospheric NO2 VCDs and therefore has a minor effect on the data analysis presented in this paper. Only AVK-weighted simulations of tropospheric NO2 VCDs are therefore shown here. Statistical values (root mean squared error, bias, Pearson correlation coefficient) which will be described below are quite similar for AVK-weighted model ensemble VCDs and those from non-AVK-weighted ones. One of the reasons for this is that (as shown in Figs. 5 and A1), AVKs are close to 1 around the boundary layer where MAX-DOAS instruments have the highest sensitivity (generally a bit larger than 1 close to the surface and smaller than 1 higher up, which has a balancing effect) and that the vertical shape of the column AVK curve is in principal agreement with the shape of simulated NO2 partial columns. At altitudes above 1 km, AVKs are smaller than 1, but simulated NO2 partial columns are also significantly smaller at these compared to lower altitudes, so that the contribution to the tropospheric column is limited. At higher altitudes, MAX-DOAS retrievals tend to follow the a priori profile, while retrievals in the boundary layer are not much influenced by the a priori profile in general. This is in contrast to the situation for satellite observations of tropospheric NO2, which usually have a minimum of the AVK in the boundary layer, i.e., where the largest fraction of NO2 is usually located in polluted situations. A priori profiles used within the MAX-DOAS retrievals (see Sect. 2.2) are in principal agreement with the ones simulated by the models. The vertical weighting caused by application of AVKs to partial columns therefore does not significantly impact derived tropospheric NO2 VCDs.
Scatter density plots of tropospheric NO2 VCDs from MAX-DOAS against model values corresponding to the time series displayed in Fig. 2 are shown in Fig. 6 (see Fig. A2 for individual model results). Statistical values (root mean squared error, bias, Pearson correlation) and least squares regression lines are given along with the plots to draw further conclusions on the ability of the model ensemble to reproduce MAX-DOAS retrievals and are listed in Table 3 (together with statistics on ensemble members). Statistical values for surface partial columns are given in Table 4. The ensemble median performs best in terms of overall correlation with values between 45 % and 75 % (compared to 35 % to 70 % for individual models) for tropospheric NO2 VCDs for all stations, the highest correlation is found for Uccle. Note, however, that for other statistical indicators, some of the individual models perform better. Correlations are generally lower than the ones based on tropospheric columns for surface partial columns which are on the order of 40 % for Bremen and OHP but much higher again for Uccle (∼ 60 %) for the ensemble. The model ensemble has a negative bias on the order of −0.3 and molec cm−2 at OHP and Uccle, respectively, and a positive bias on the order of 1×10¹⁵ molec cm−2 at De Bilt and Bremen for tropospheric columns. The largest RMSE and bias (10.5 and 5×10¹⁵ molec cm−2, respectively) are found for LOTOS-EUROS at De Bilt. Considering that tropospheric NO2 VCDs for OHP are generally lower than for the three urban sites, SILAM also shows a high RMSE and bias (2.6 and 1.2×10¹⁵ molec cm−2, respectively) at this station. Vertical profile comparisons described above show that the overestimation is largest at altitudes up to about 1.5 km. Our findings agree with Vira and Sofiev (2015), who found that SILAM tends to overestimate NO2 at rural sites based on in situ data and concluded that this is due to an overestimation of the lifetime of NO2, which is also consistent with findings by Huijnen et al. (2010). For surface partial columns, biases are negligibly small for OHP and Bremen for the ensemble and most of the individual models, while the ensemble is negatively biased by 1.1×10¹⁵ molec cm−2 at Uccle. The largest RMSE and bias in surface partial columns are found for EMEP at Uccle (3.3 and molec cm−2, respectively). The spread between models and observations is large for some individual data points. Regression lines show that the model ensemble tends to overestimate low and underestimate high tropospheric NO2 VCDs. The underestimation of larger tropospheric NO2 VCDs is most pronounced for De Bilt, followed by Uccle.
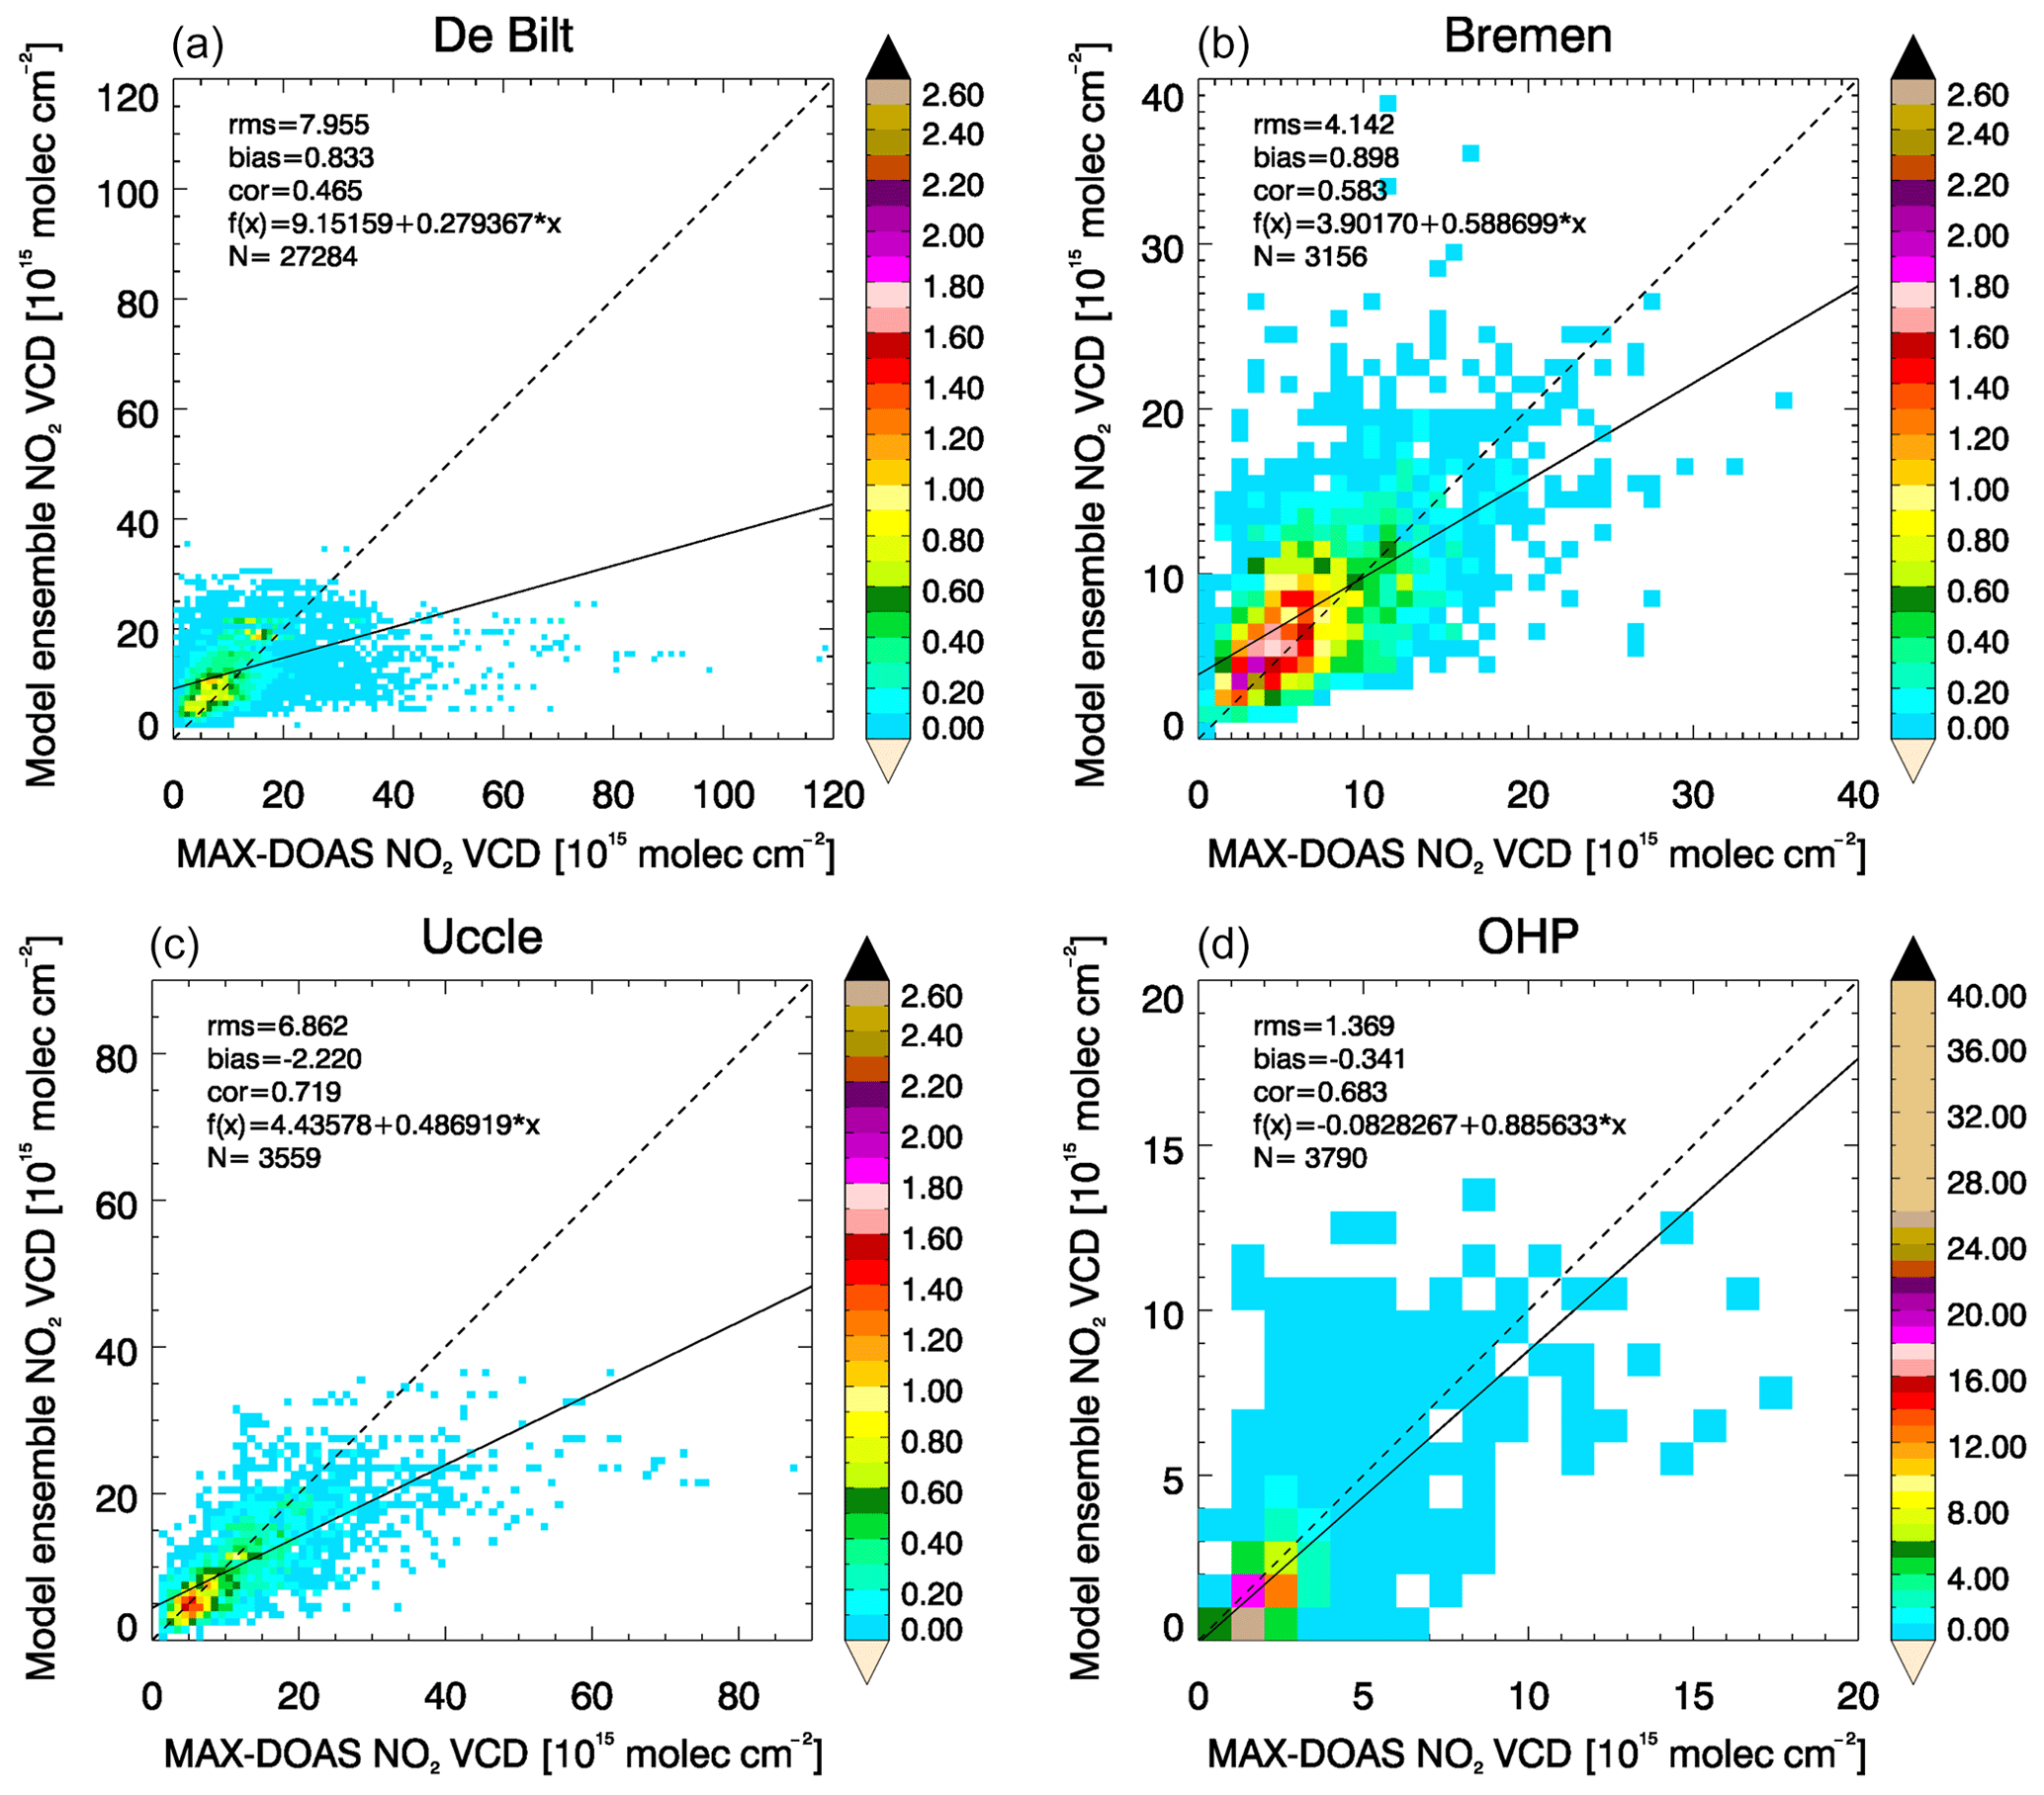
Figure 6Scatter density plots of AVK-weighted tropospheric NO2 VCDs (1015 molec cm−2) from MAX-DOAS against model ensemble data for (a) De Bilt, (b) Bremen, (c) Uccle and (d) OHP. The data are shown for different bins with a size of 1015 molec cm−2 and are colored according to the number of data points per bin (%). The dashed line is the reference line (f(x)=x). The solid line is the regression line (see top left of each plot for f(x) of this line). The root mean squared error (RMSE) (1015 molec cm−2), bias (1015 molec cm−2), Pearson correlation coefficient (cor, not squared) as well as the number of data points N are given in the top left of each plot.
Figure 7 shows comparisons between MAX-DOAS and the model ensemble of wind directional distributions of average tropospheric NO2 VCDs based on wind measurements from station data (note that further analysis has shown a good agreement between measured wind speeds and wind directions and those of the simulations). Changes of NO2 mean values from one wind direction bin to another are reproduced well by the model ensemble (and in general also by ensemble members; see Fig. A3), with an overall slightly better agreement with retrievals for tropospheric NO2 VCDs compared to surface partial columns (not shown). Both MAX-DOAS and model ensemble show the highest NO2 mean values for wind directions mainly where an influence from pollution sources is expected (i.e., the Ruhr area to the southeast of De Bilt, the Bremen city center to the southwest of the Bremen MAX-DOAS, Brussels city center to the northeast of Uccle, the Po Valley to the northeast of OHP; see Sect. 2.2).
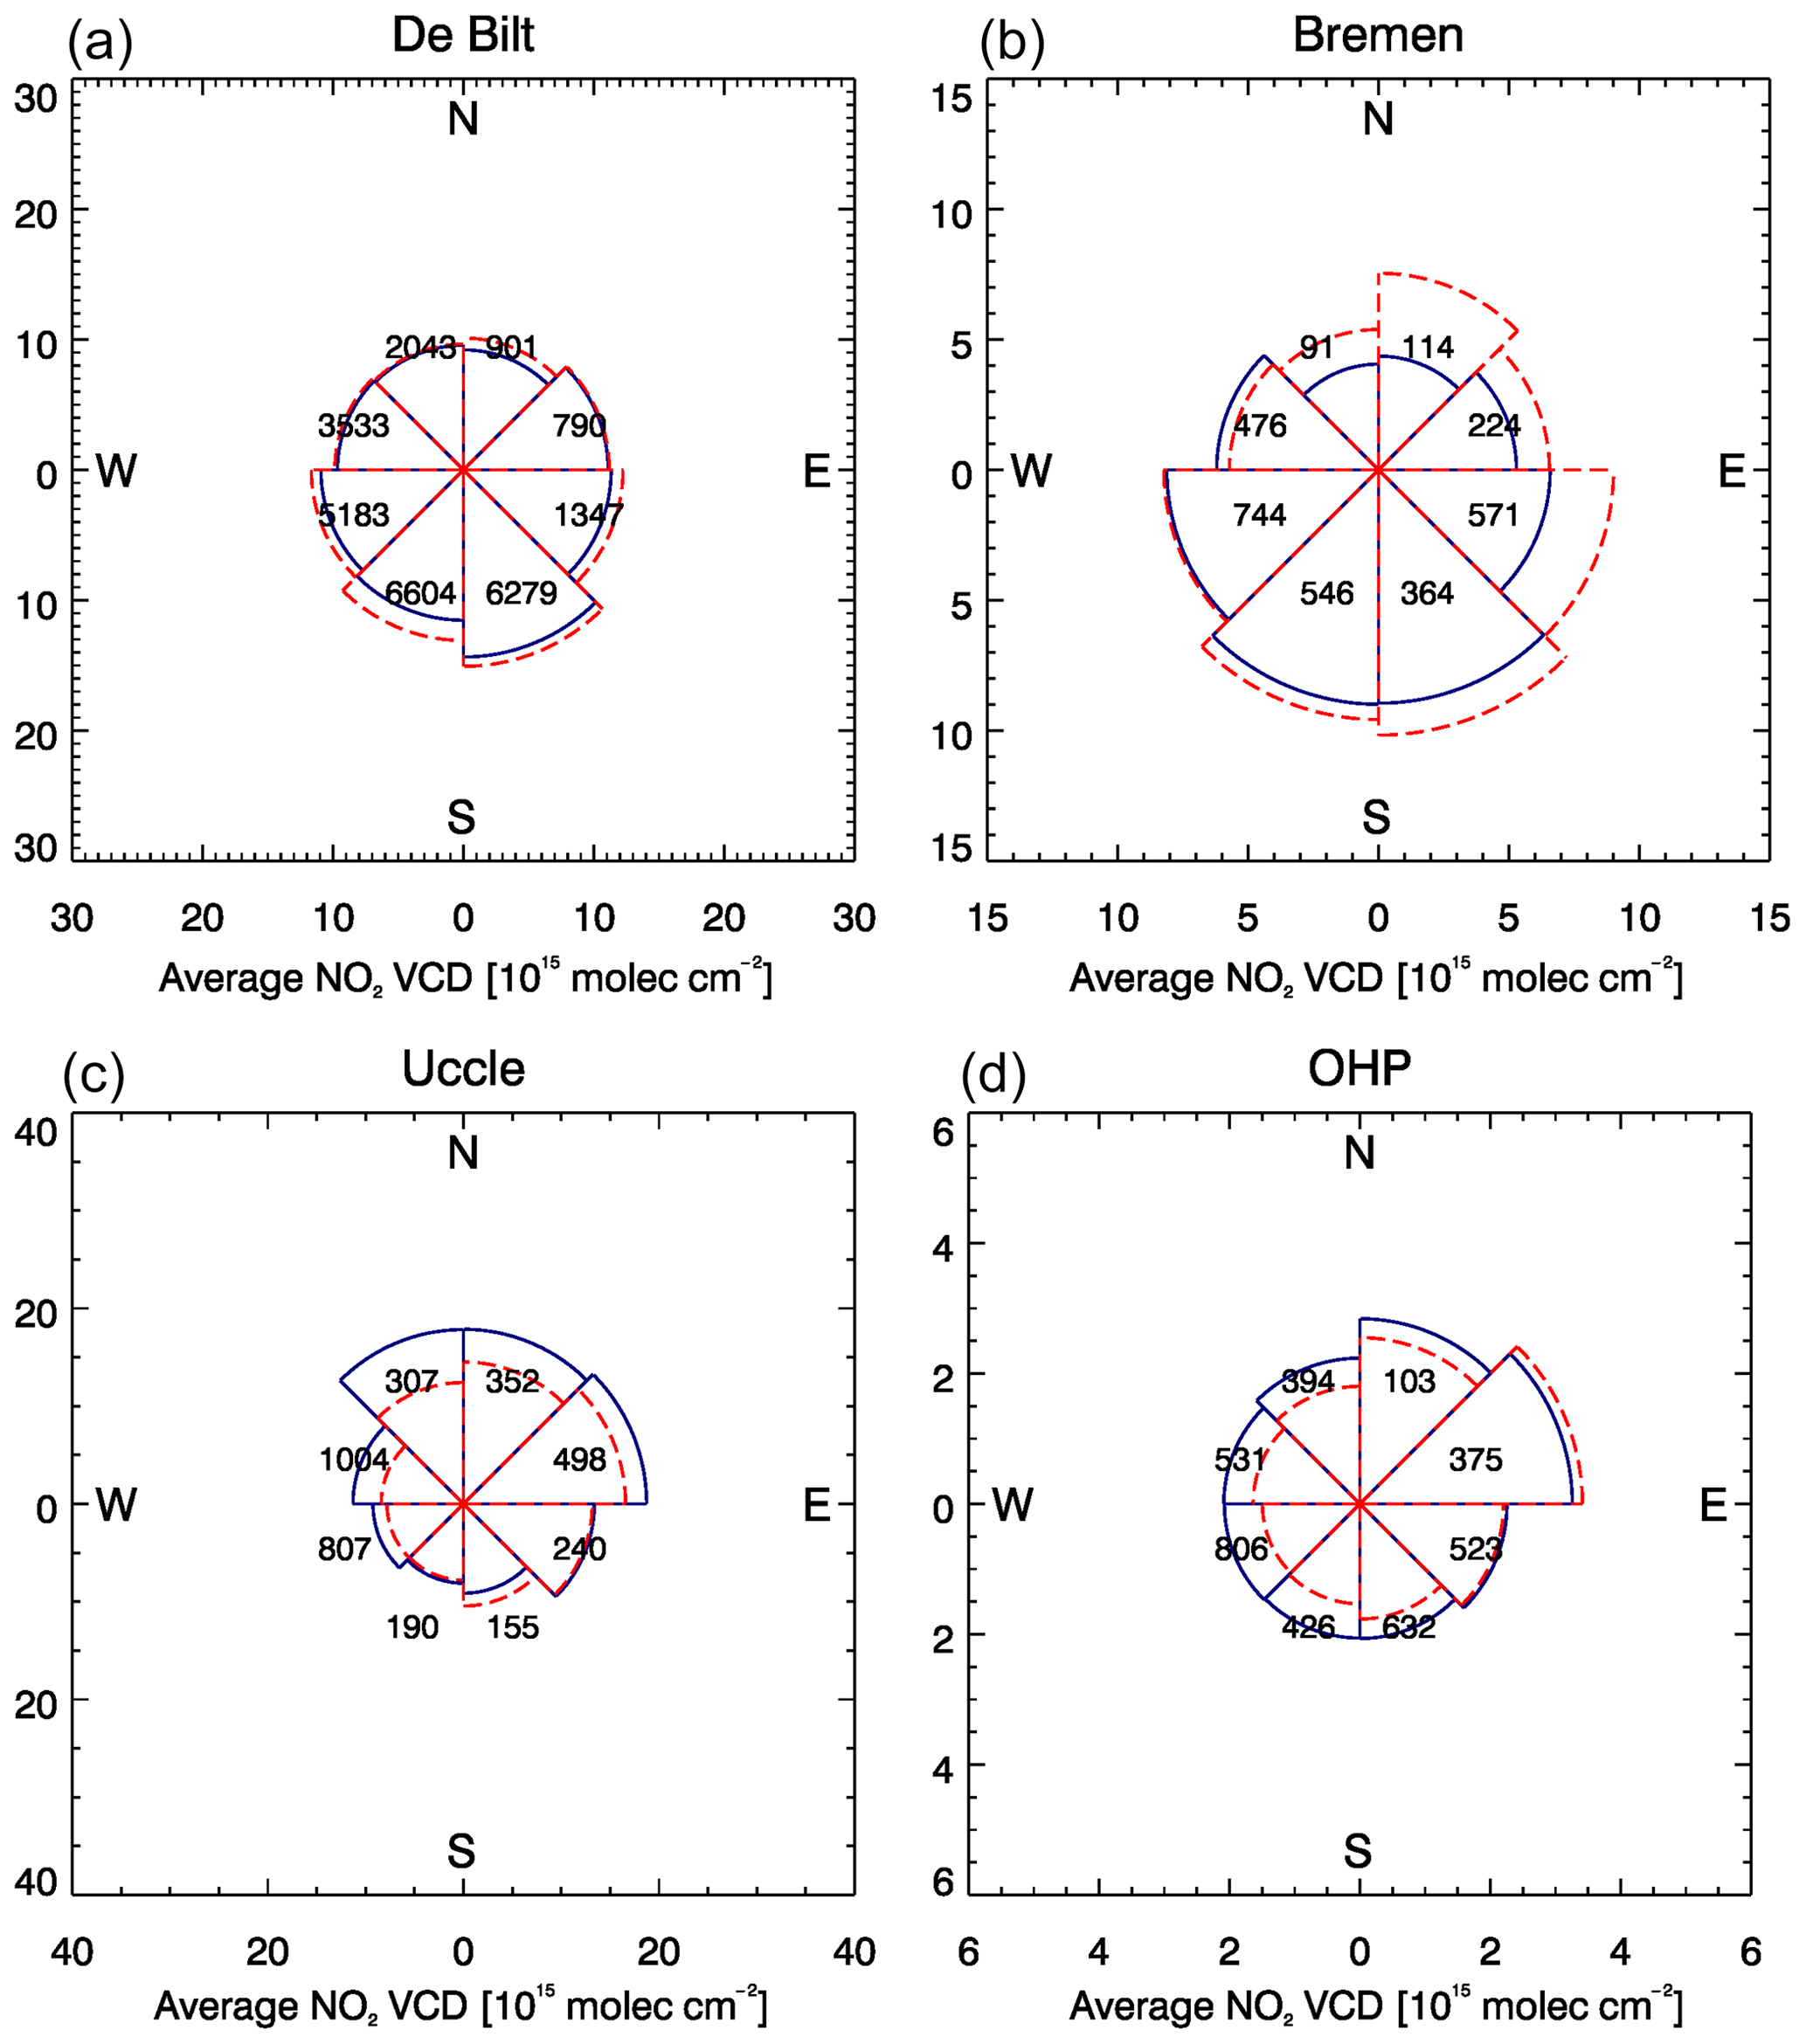
Figure 7Average AVK-weighted tropospheric NO2 VCDs (1015 molec cm−2) in 45∘ wide wind direction bins from (solid blue lines) MAX-DOAS and (dashed red lines) model ensemble data for (a) De Bilt, (b) Bremen, (c) Uccle and (d) OHP. Wind directions correspond to the direction towards the station and are taken from weather station measurements. The numbers close to the center of each plot refer to the number of data values used for calculating average values for each bin.
Comparisons for seasonal cycles (i.e., monthly averages) of tropospheric NO2 VCDs are given in Fig. 8 together with corresponding statistical values in Table 5. There is good agreement between MAX-DOAS and the model ensemble for Uccle regarding the magnitude of NO2 VCDs and seasonality, with simulated ensemble median values within the estimated uncertainty interval of the retrievals. The same is true for De Bilt, apart from the strong overestimation of MAX-DOAS retrieved values for January, March and April. However, a low number of observations is available during these compared to other months, so the results are statistically less significant. The model ensemble overestimates seasonal cycles for Bremen and OHP. More explicitly, there is an overestimation of wintertime values, while summertime values are better reproduced by the model ensemble. Huijnen et al. (2010) compared an ensemble of regional and global models to satellite data over Europe and found an overestimation of seasonal cycles by the simulations, which is in agreement with results for Bremen and OHP shown in the present paper. In Huijnen et al. (2010), however, model values were closer to satellite retrievals during winter, whereas for summer a strong underestimation was found, while comparisons to Dutch surface observations showed that this could be partly attributed to a high bias of satellite retrievals in summer at least over the Netherlands. Moreover, Huijnen et al. (2010) showed that the GEMS regional model ensemble median underestimates background values of tropospheric NO2 columns compared to OMI satellite retrievals in summer and spring. This is in agreement with results shown in Fig. 8, where the majority of regional models underestimate summer and springtime values at OHP. The spread between individual models is quite large for seasonal cycles at OHP, meaning that some of the models perform better than others. Seasonal cycles are generally more pronounced compared to the other model runs and retrievals for LOTOS-EUROS and MOCAGE. Especially LOTOS-EUROS largely overestimates the observed seasonal cycle at OHP. Low to moderate correlations in seasonal cycles are found for De Bilt, followed by moderate ones for Bremen. All models perform well in terms of correlation at Uccle and OHP (values around 0.8).
Table 5As in Table 3 but for (upper rows) seasonal cycles, (middle rows) diurnal cycles and (lower rows) weekly cycles of AVK-weighted tropospheric NO2 VCDs (1015 molec cm−2). In addition, values for diurnal cycles are given based on data during weekdays only and during weekends only for the ensemble.
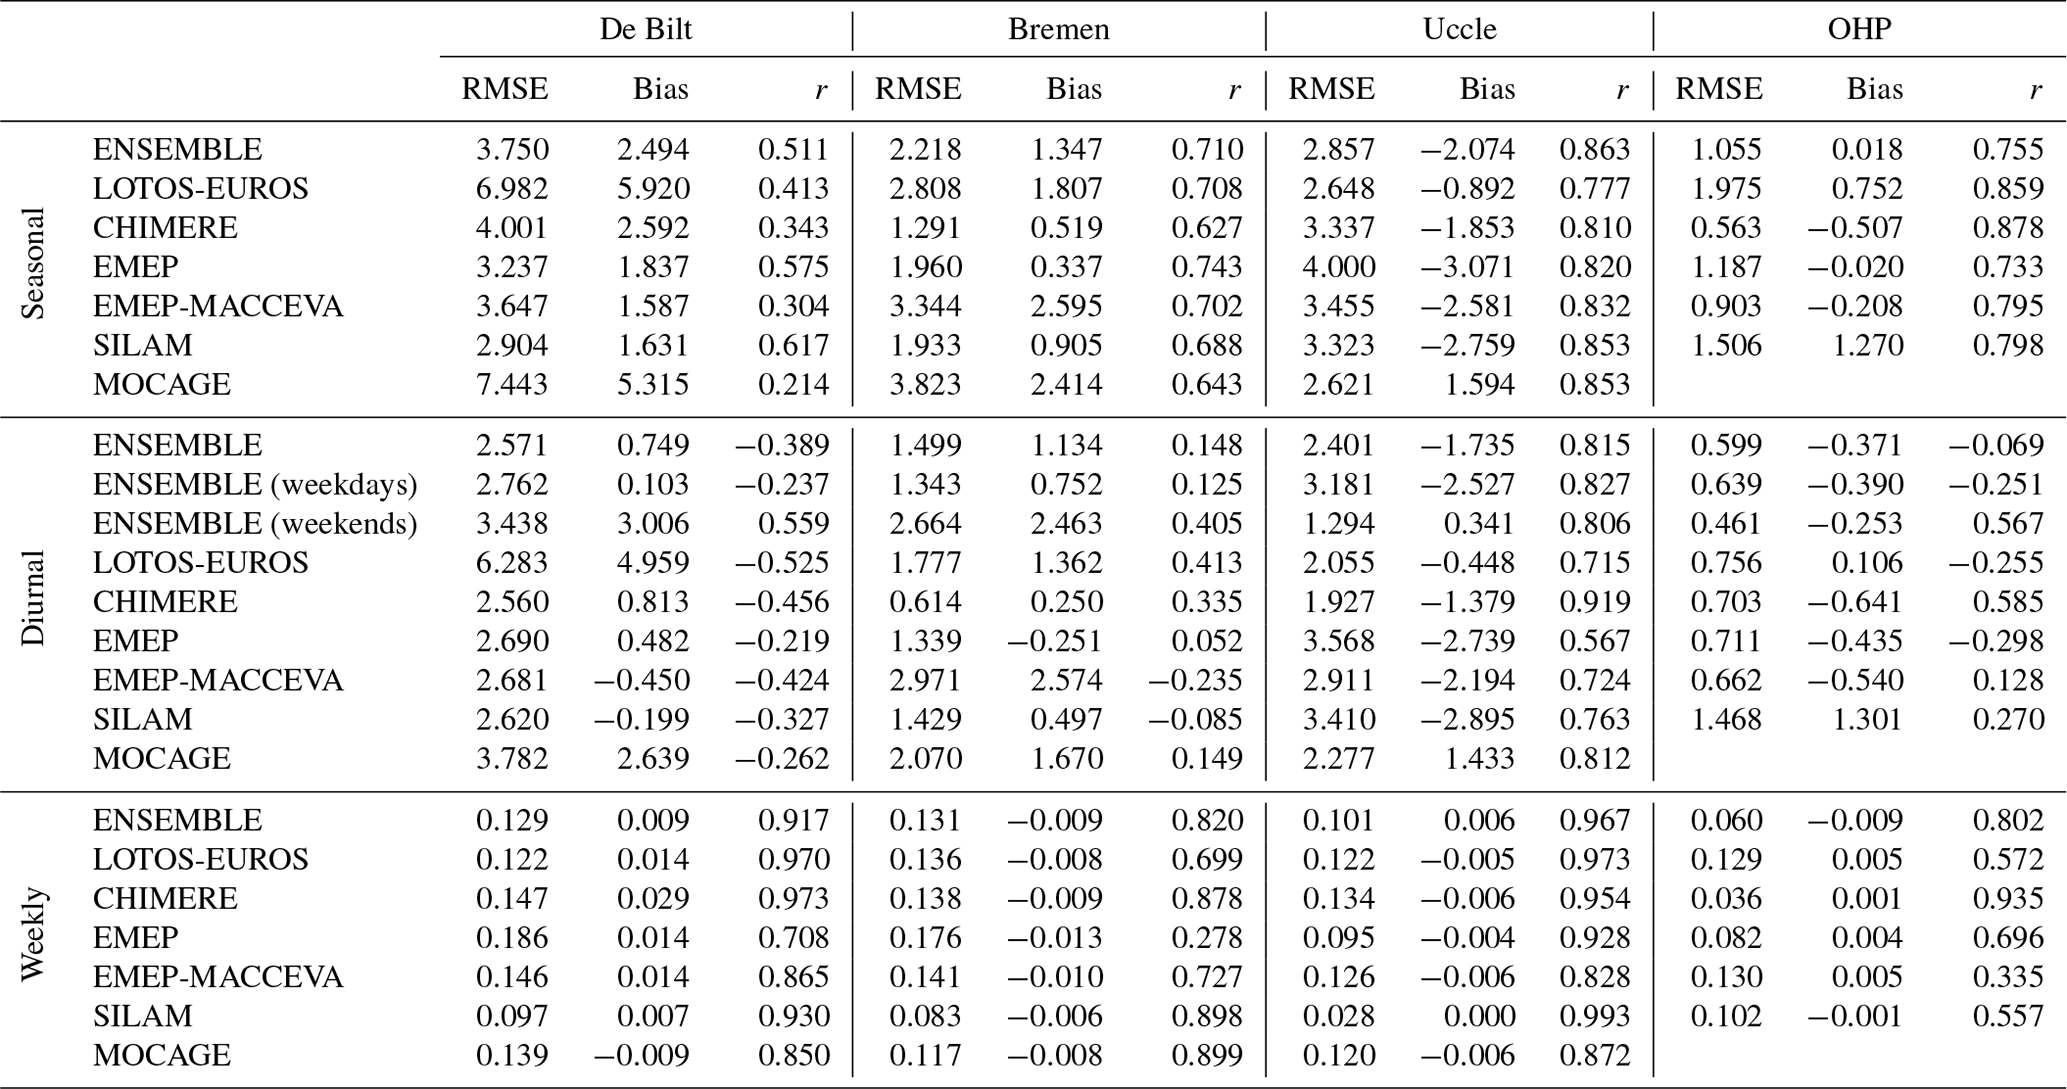
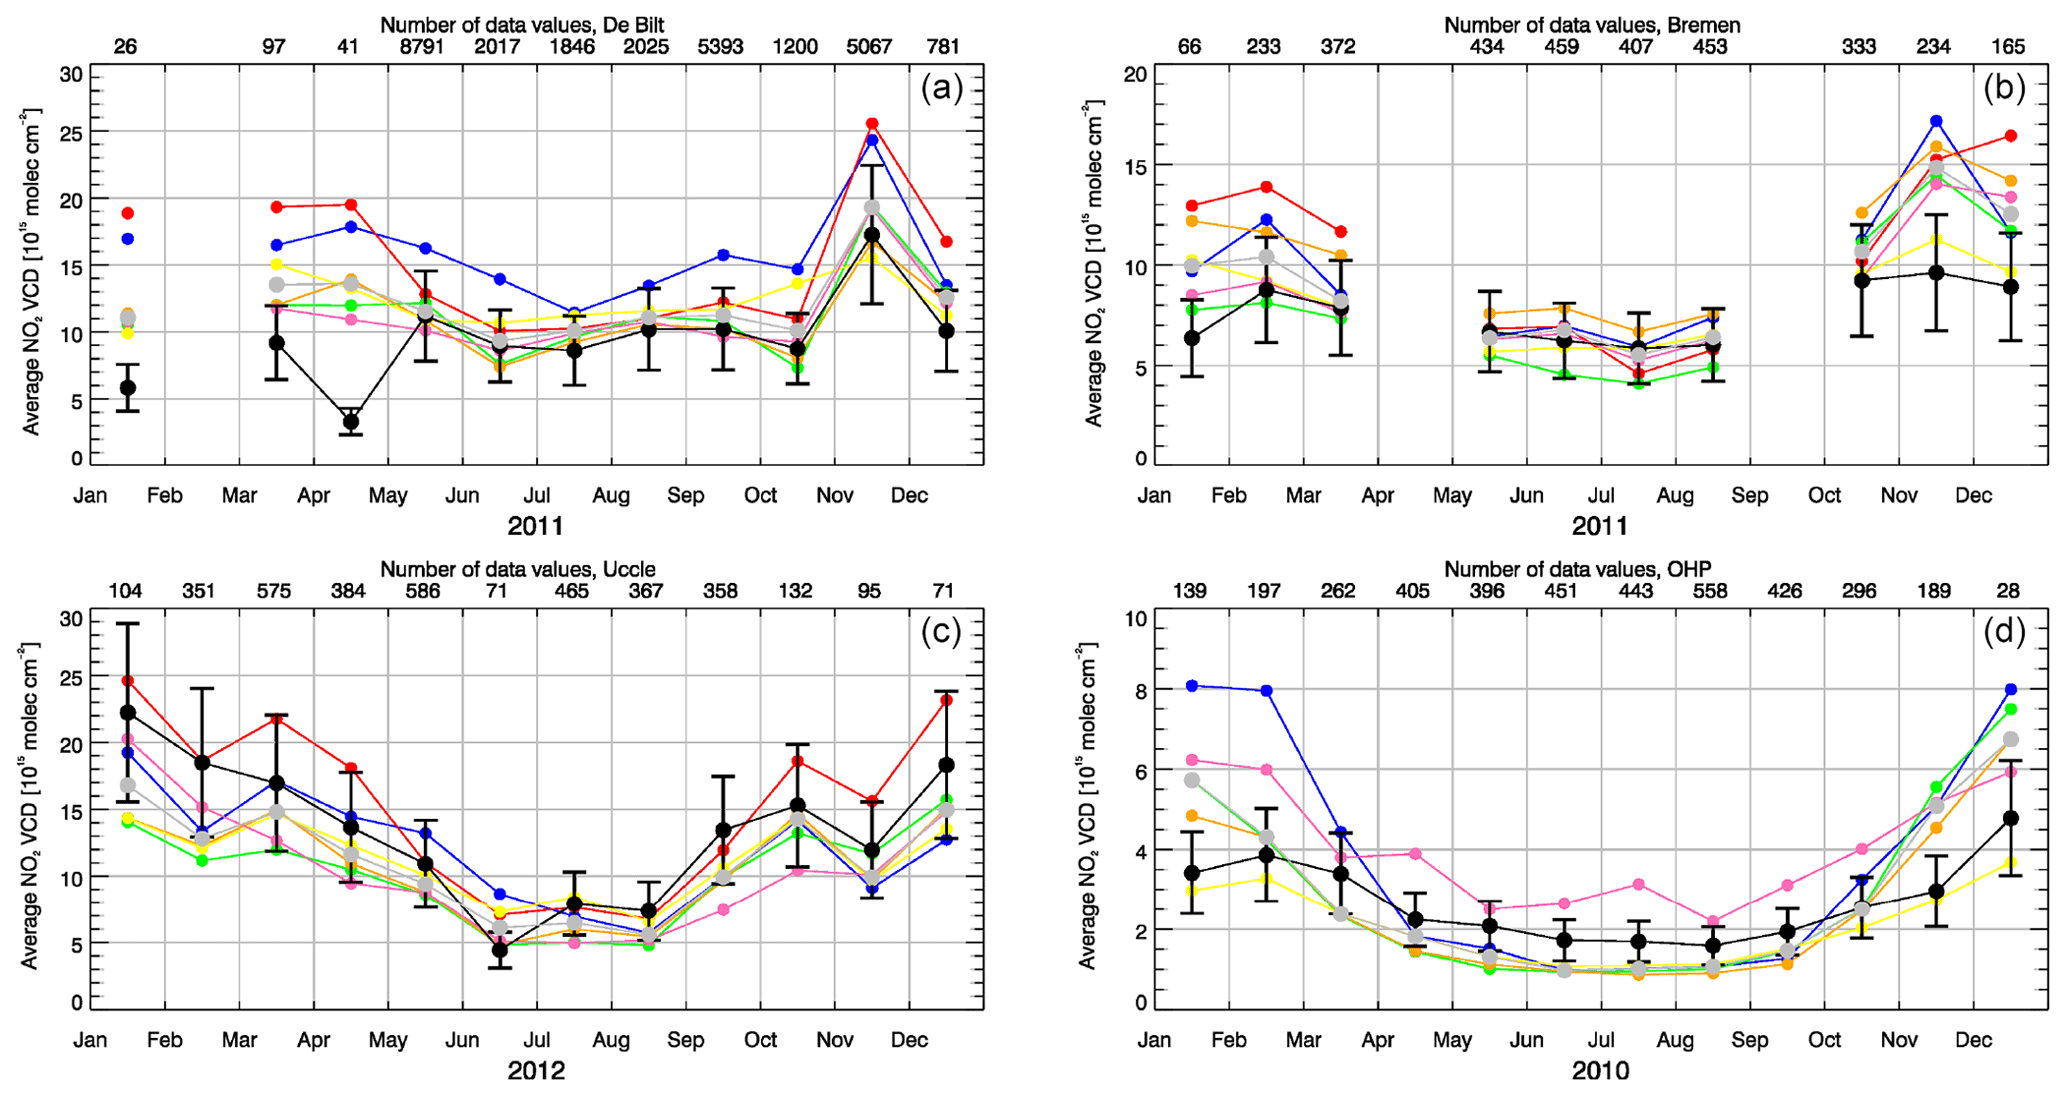
Figure 8Seasonal cycles (monthly averages) of AVK-weighted tropospheric NO2 VCDs (1015 molec cm−2) from (black) MAX-DOAS, (gray) model ensemble median, (blue) LOTOS-EUROS, (yellow) CHIMERE, (green) EMEP, (orange) EMEP-MACCEVA, (pink) SILAM and (red) MOCAGE for (a) De Bilt, (b) Bremen, (c) Uccle and (d) OHP. Black error bars refer to the uncertainty associated with the MAX-DOAS retrievals (assumed to be 30 % for all stations). The number of data values used for calculating average values is shown in the upper x axis of each plot as an indicator of statistical significance.
Figure 9 shows comparisons of diurnal cycles for the whole time series. Overall, the model ensemble fails to reproduce diurnal cycles, reflected by generally low correlations (Table 5) for all models in De Bilt, Bremen and OHP. All models show negative correlations in De Bilt, while some of the models only reach negative correlations in Bremen as well. MAX-DOAS retrieved values increase from the morning towards the afternoon, while simulated values in general decrease from the morning towards the afternoon. In Uccle, however, high or at least moderate correlations are achieved. CHIMERE performs best in terms of correlation in Uccle and OHP (0.92 and 0.6, respectively). For this model, diurnal scaling factors of traffic emissions have been developed by analyzing measurements of NO2 in European countries (Menut et al., 2013; Marécal et al., 2015). Although most of the model values fall within the estimated uncertainty interval of MAX-DOAS retrievals, the shape of diurnal cycles differs between observations and simulations. The ensemble shows a strong peak during the morning rush hour around 08:00 LT for Bremen, which is not confirmed by MAX-DOAS retrievals. In contrast to this, measurements show a maximum around 14:00 LT in the afternoon which coincides with a very weak local maximum simulated by the model ensemble. Looking at diurnal cycles for different seasons shown in Figs. A4 and A5 reveals that these are in general much better reproduced for spring and summer compared to autumn and winter for all stations. This is in agreement with results for seasonal cycles described in the previous paragraph. Weak morning rush hour peaks are also simulated for the rural station (OHP) (possibly related to pollution transport towards the station from surrounding areas), which is not in agreement with the measurements. The morning rush hour peaks for Bremen and OHP occur for all models with the exception of SILAM for OHP, which however strongly overestimates values (by a factor of 1.5–2 for diurnal cycle values averaged over the whole time series) for this station, resulting in a bias of molec cm−2 (see Table 5). The peak at 08:00 LT for Bremen is most pronounced for EMEP-MACCEVA, MOCAGE and LOTOS-EUROS. Individual model runs show the same shape of the diurnal cycle for Bremen, while the shape of diurnal cycles differs for OHP. Moreover, large differences regarding the magnitude of simulated values occur for both stations between the models. As described in Sect. 2.1, all models use the same emission inventory as a basis, except the EMEP run. There is a strong difference between the magnitude of the values simulated by EMEP and EMEP-MACCEVA specifically for the diurnal cycle at Bremen (while their shape agrees). EMEP and EMEP-MACCEVA runs were performed with different resolution and emission inventories which likely contributes to the differences found.
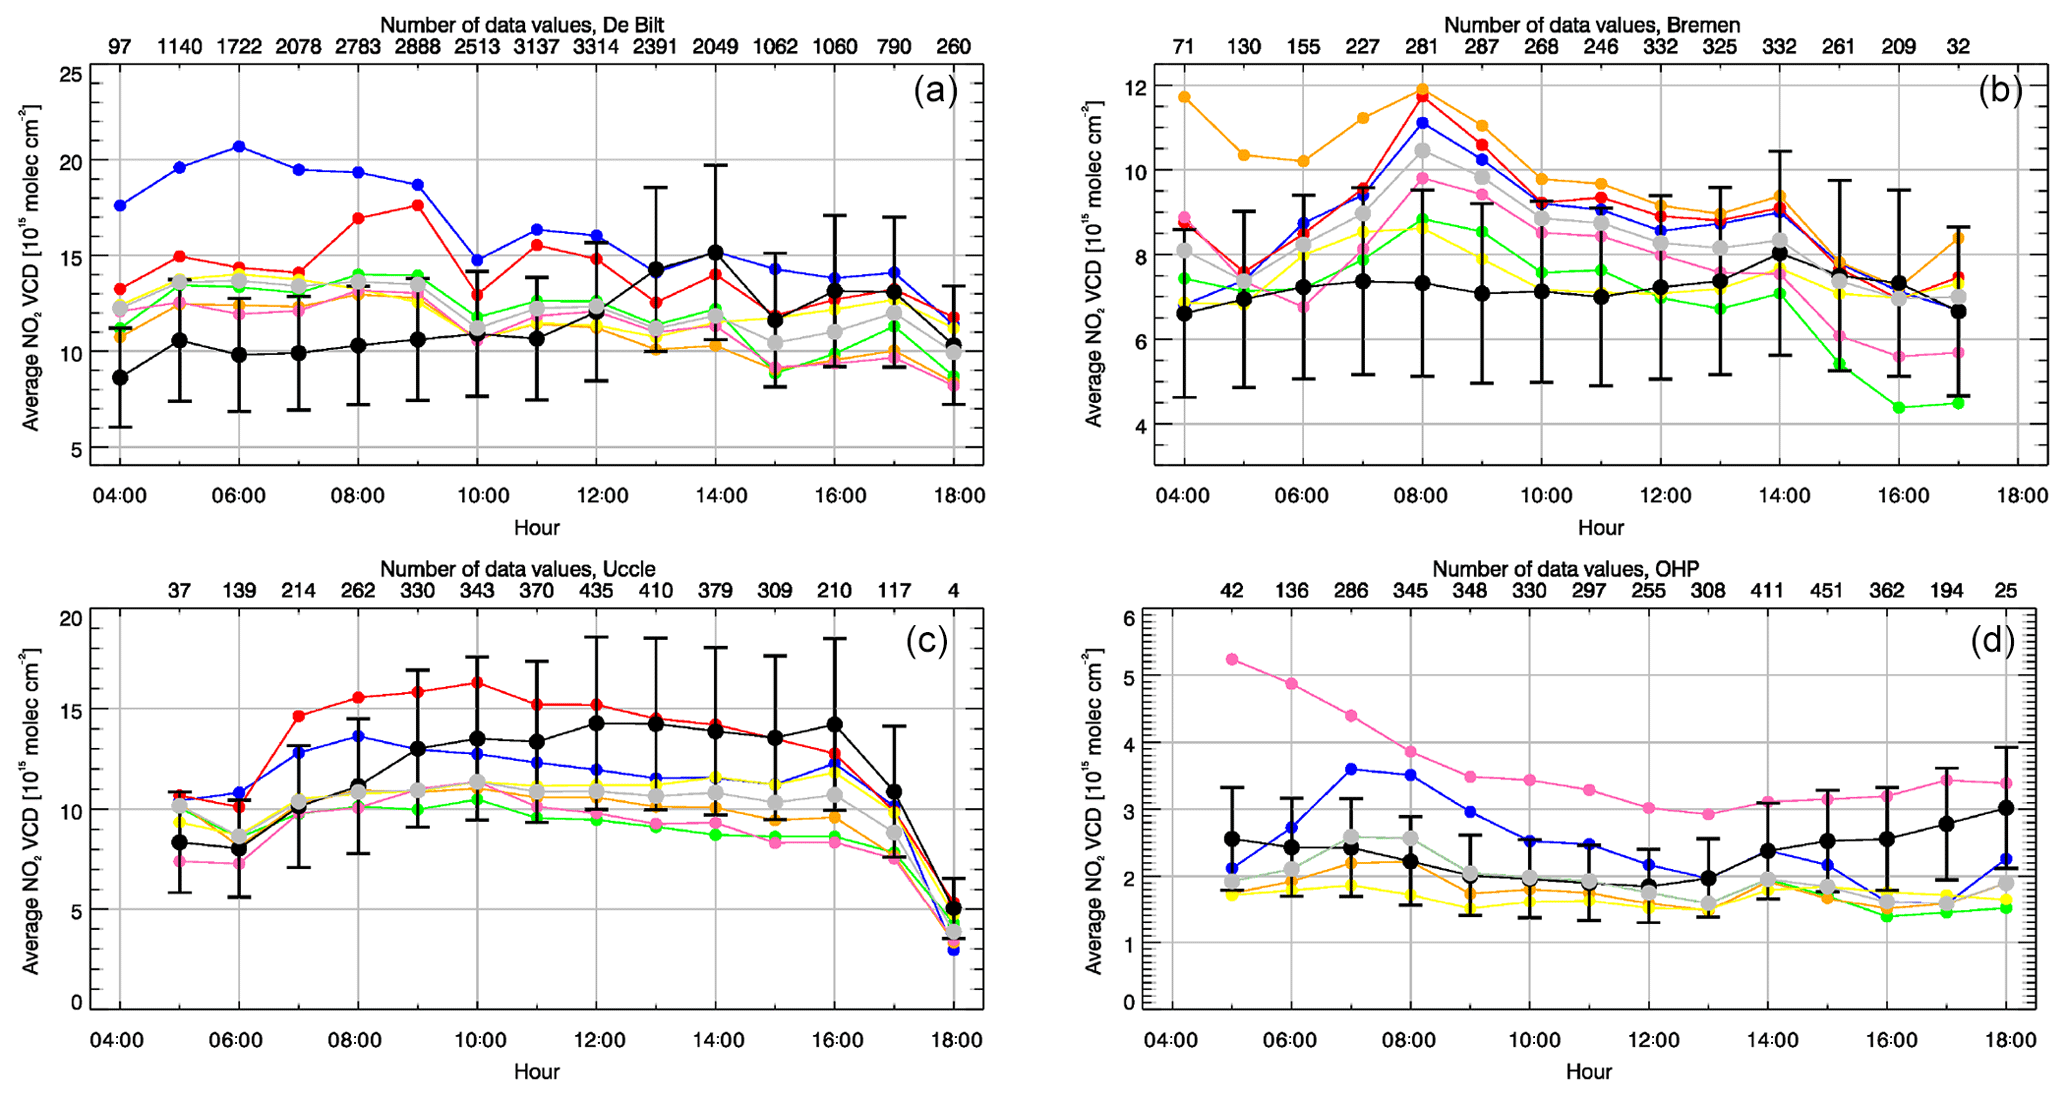
Figure 9As in Fig. 8 but for diurnal cycles (averages over hourly bins) of tropospheric NO2 VCDs (1015 molec cm−2).
The simulated morning rush hour peaks for Bremen coincide with maxima of diurnal scaling factors for the road transport and combustion pollutant sectors (see Fig. 1 of Denier van der Gon et al., 2011). Guevara et al. (2019) recently derived diurnal profiles from traffic counts for weekdays. The latter show, for several cities, less pronounced rush hours and much flatter time profiles during the day. This is in principal agreement with the MAX-DOAS observations of tropospheric NO2 VCDs. The comparison to the MAX-DOAS retrievals in Bremen shows that the diurnal scaling factors for road transport and potentially combustion currently used by the models should be adjusted to match the observed temporal profiles.
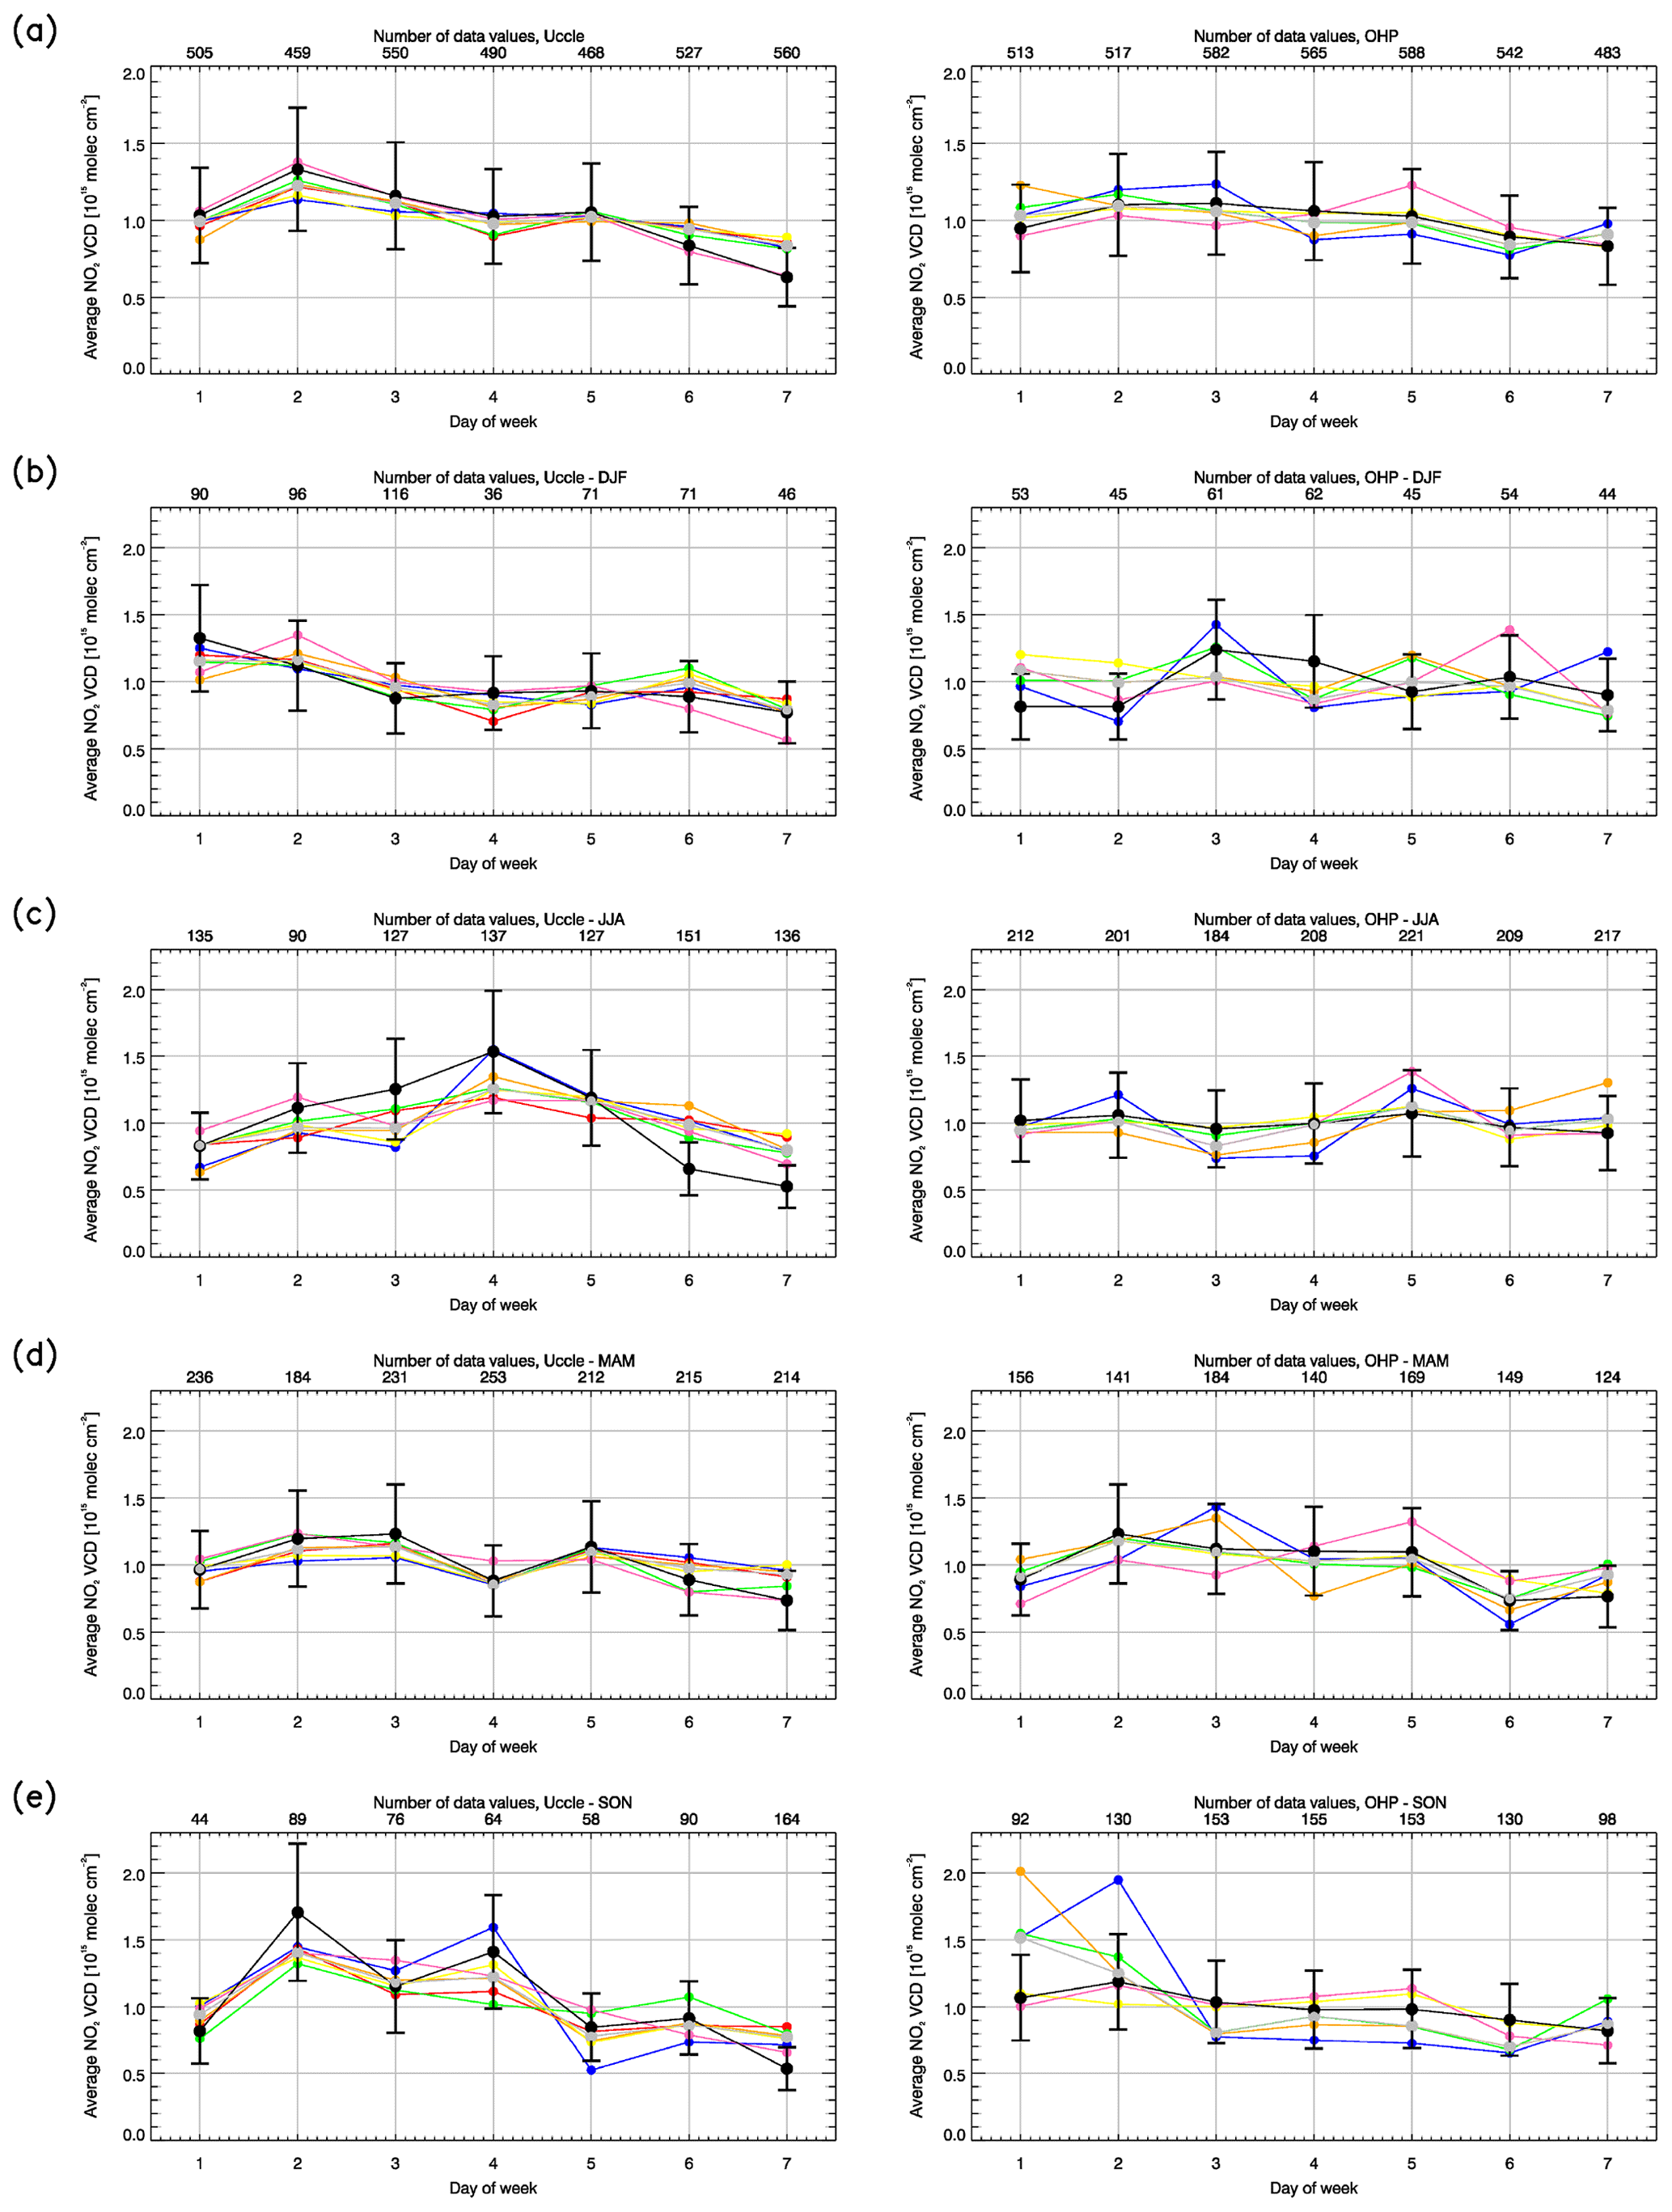
Figure 10 shows comparisons of diurnal cycles for weekends (Saturdays and Sundays) only. A figure of diurnal cycles for weekdays only shows very similar results to Fig. 9 (and is therefore not shown here), meaning that overall diurnal cycles are mainly driven by weekday emissions. At the three urban stations, MAX-DOAS retrieved diurnal cycles show a different shape for weekends compared to diurnal cycles for the whole week (and hence weekdays only). This is in contrast to model simulated diurnal cycles, which do not change much going from cycles for the whole week to cycles for weekends only, apart from a general decrease in values towards weekends for both retrieved and simulated tropospheric NO2 VCDs. As expected, MAX-DOAS retrieved diurnal cycles are rather flat for weekends only at the urban stations, as emissions from traffic and industry are reduced during weekends compared to weekdays (e.g., Elkus and Wilson, 1977; Beirle et al., 2003; Ialongo et al., 2016). As the shape of simulated diurnal cycles is similar for weekdays versus weekends, the difference between retrieved and simulated trends in tropospheric columns from morning to afternoon hours is reduced for weekends only resulting in significantly higher and positive correlations for diurnal cycles during weekends compared to weekdays for the ensemble at these stations (see Table 5). In Uccle, correlations are equally high (about 80 %) for weekdays and weekends, which is due to the fact that the change in the shape of retrieved diurnal cycles from weekdays to weekends is comparably small at this urban station. Correlations are also significantly higher for the background station (OHP) for weekends for the ensemble, mainly due to a better agreement in the development from the afternoon towards the evening during weekends. The results described above show that models fail to reproduce observed changes in diurnal cycles from weekdays to weekends at urban stations. This is because the diurnal scalings incorporated in the runs stay constant throughout the week (see Guevara et al., 2019). As observed diurnal cycles are rather flat at weekends, switching off diurnal scalings during weekends will likely lead to an improvement in model performance compared to MAX-DOAS.
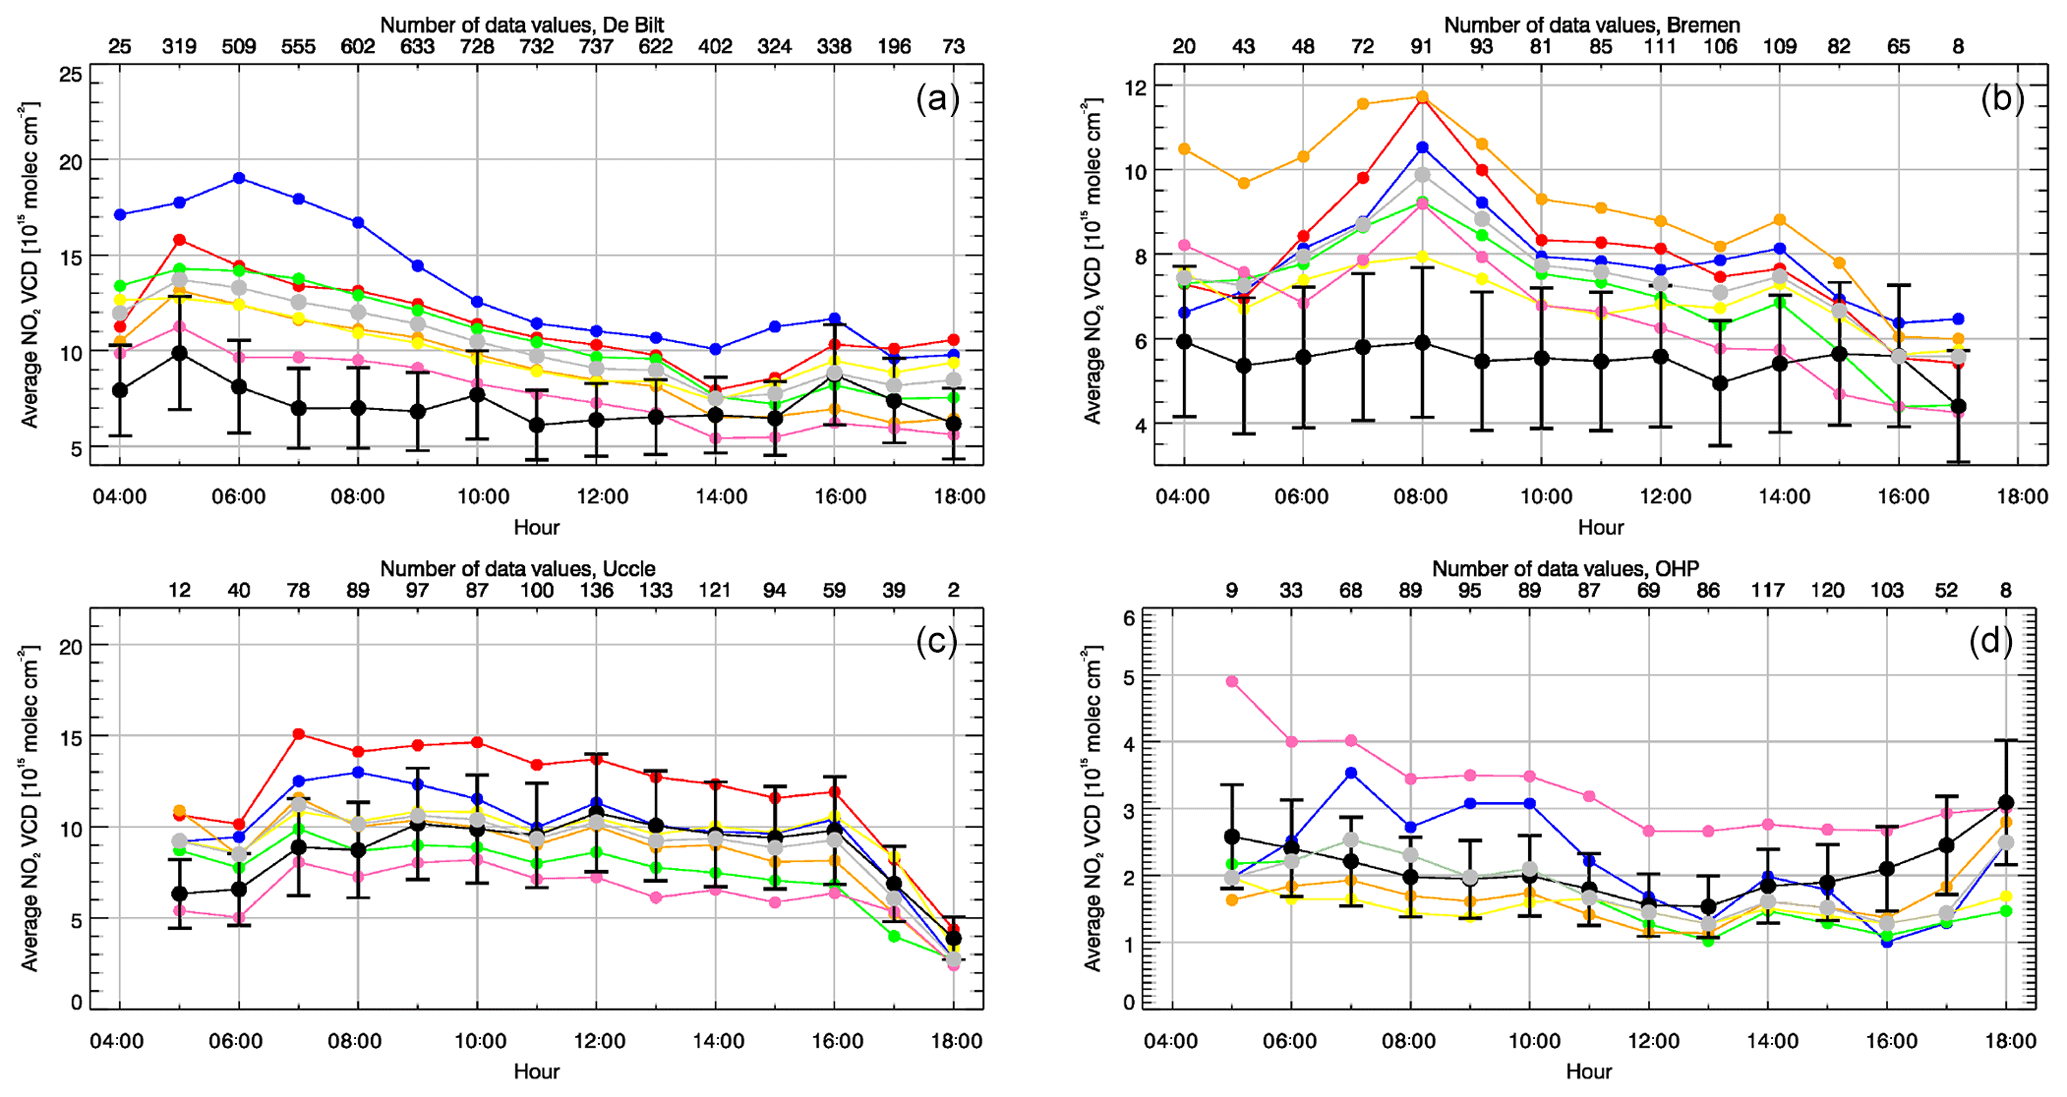
Figure 10As in Fig. 8 but for diurnal cycles (averages over hourly bins) of tropospheric NO2 VCDs (1015 molec cm−2) during weekends only.
Weekly cycle comparisons are presented in Fig. 11 (see Figs. A6 and A7 for different seasons). In contrast to diurnal cycles, weekly cycles and their seasonal variation measured by MAX-DOAS are much better simulated, reflected by high correlations (Table 5) for the ensemble at all stations. Both MAX-DOAS and the model ensemble show a decrease in tropospheric NO2 VCDs towards the weekend when there is less traffic especially for the urban De Bilt, Bremen and Uccle stations. However, this observed weekly cycle is stronger than the simulated one, a feature which is most pronounced for Bremen. This can be attributed to the fact that the diurnal scalings used in the model runs do not change from weekdays towards weekends (see previous paragraph), so that the simulations are positively biased by emission peaks at the weekend. The underestimation of weekly cycles is in agreement with Vlemmix et al. (2015), who compared LOTOS-EUROS simulations to MAX-DOAS retrievals for De Bilt. As expected, only a very weak weekly cycle is observed by MAX-DOAS and simulated by the models for the rural station (OHP). Note that maxima of weekly cycles for specific days may just be a coincidence due to data sampling times. Beirle et al. (2003) investigated weekly cycles of tropospheric NO2 based on Global Ozone Monitoring Experiment (GOME) satellite observations and found a decrease in values of up to about 50 % towards Sundays over polluted regions and cities in Europe. This is in principal agreement with results of the present study, although the choice of the cities is different.
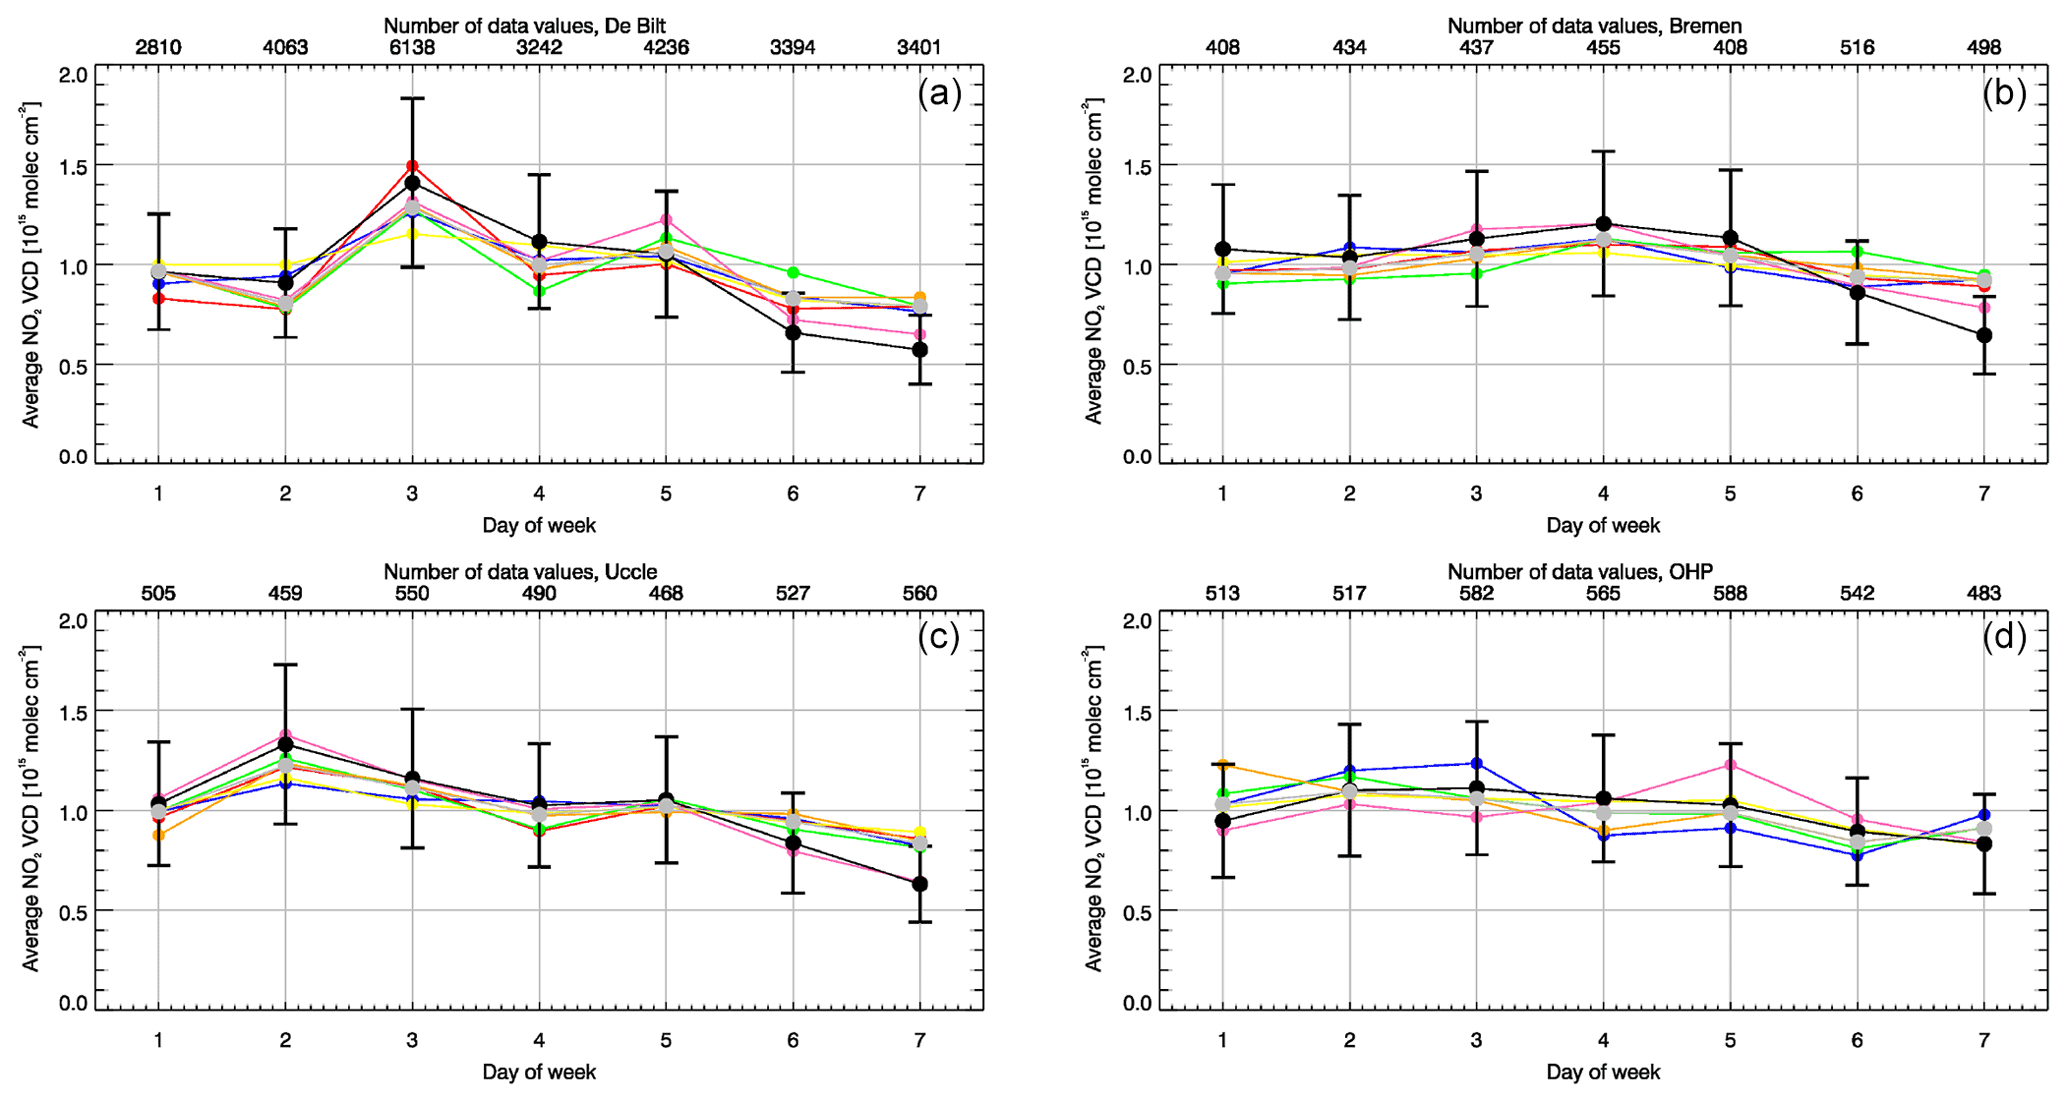
Figure 11As in Fig. 8 but for weekly cycles (averages over daily bins divided by the mean over the whole week; unitless values) of tropospheric NO2 VCDs.
Table 5 shows that the overall correlations (Table 3) reached at all stations are mainly driven by seasonal and weekly cycles, while significantly lower and in many cases negative correlations are found for diurnal cycles which decreases overall correlations. An exception for the latter is Uccle, where good correlations are also found for diurnal cycles.
A pollution plume and related increase in the time series of tropospheric NO2 VCDs observed by MAX-DOAS is expected to be reproduced better by model runs with finer horizontal resolution compared to coarser resolution runs. Moreover, increasing the amount of NO2 at relatively high NO2 concentrations results in a decrease of OH and hence increasing lifetime of NO2 (Valin et al., 2011). Colette et al. (2014) compared regional model simulations with differing horizontal resolution and found that an increase in resolution leads to a better agreement with NO2 in situ data. In the present study, statistical values show that the LOTOS-EUROS run with significantly finer horizontal resolution than the other runs (see Table 1) in general did not perform better than coarser horizontal resolution runs, but the LOTOS-EUROS run also has the lowest number of vertical levels. Similarly, the EMEP run with significantly coarser horizontal resolution did not perform worse than finer horizontal resolution runs but also has the largest number of vertical levels. Overall, no relation between the horizontal and vertical resolution of the models and their statistical performance is found.
In addition to the MAX-DOAS comparisons described above, we also carried out a comparison between the regional models and OMI (Levelt et al., 2006) satellite retrievals looking at maps of monthly means for a winter and summer month (February and August 2011, respectively) falling into the time period investigated by the present study. We found similar results to Huijnen et al. (2010), which are therefore not shown here, i.e., an underestimation of tropospheric NO2 columns over background regions during summer (in agreement with the general underestimation of means over summer months compared to MAX-DOAS shown by seasonal cycles for OHP for all models except SILAM) and a generally better agreement between satellite retrievals and models over pollution hotspots around Benelux countries, an underestimation however of values over large parts of Germany and over the Po Valley in many of the model runs. Some of the models also overestimated values to the south and southeast of OHP (roughly between Marseille and Genua along the southern coast of France) compared to OMI. However, due to the generally short lifetime of NO2, to properly relate uncertainties in the simulations over emission hotspots indicated by the OMI-based comparisons to the ones derived from MAX-DOAS-based comparisons would generally require investigating transport patterns of individual model runs with much finer time resolution around the MAX-DOAS sites, which is not provided by the satellite data (only one OMI orbit per day over the stations).
In this study, comparisons between NO2 columns simulated by five regional models and retrieved from MAX-DOAS measurements for four European MAX-DOAS stations have been presented. According to Marécal et al. (2015), the main uncertainties of the regional model air quality forecasts are generally emissions, meteorological and chemical initial and boundary conditions used to drive the simulations as well as representation of physical and chemical processes. This also explains parts of the differences between model results and observations found in the present study. Uncertainties in tropospheric MAX-DOAS retrievals further contribute to differences described here (a conservative uncertainty of 30 % was assumed for all stations).
In general, the model ensemble does well represent tropospheric NO2 amounts observed by MAX-DOAS. Moderate correlations around 60 % are found for tropospheric NO2 VCDs at each station for the ensemble. Time series comparisons and corresponding scatterplots show that MAX-DOAS retrieved pollution peaks are often underestimated by the model ensemble, while models also show peaks at times when the instruments did not observe similar enhancements. Comparisons of wind directional distributions of tropospheric NO2 VCDs and surface partial columns show good agreement between simulations and measurements. This indicates that transport of pollution towards the stations is, on average, well represented by the models.
Comparison of vertical profiles shows that the main differences between measurements and simulations are also not due to incorrect representation of the vertical NO2 distribution. Hence, it is not necessarily needed to apply AVKs to model simulations in MAX-DOAS-based comparison studies of tropospheric NO2 VCDs, a simple summation of simulated partial columns in the vertical can already be sufficient. This result was not expected, as the sensitivity of the MAX-DOAS profile retrievals is much larger close to the surface than at altitudes larger than approximately 1 km.
Moderate to high correlations (50 %–97 %) are achieved by the ensemble for seasonal and weekly cycles, while correlations <15 % are found for diurnal cycles at all stations except Uccle. This shows that simulation uncertainties in seasonal cycles (though overestimated by the model ensemble) and in reproducing the decrease in daily tropospheric NO2 VCDs towards the weekend (though underestimated by the models) do not explain the main part of the scatter between observations and simulations. The largest differences from the retrieved diurnal cycles generally occurred for LOTOS-EUROS and MOCAGE at Bremen and De Bilt, and for EMEP-MACCEVA at Bremen, LOTOS-EUROS and SILAM showed the largest differences to retrieved diurnal cycles for the background OHP station. As the diurnal scalings incorporated in the model runs stay constant throughout the week, models fail to reproduce observed changes in diurnal cycles from weekdays to weekends at urban stations, which is also consistent with the identified underestimation of weekly cycles. Switching off diurnal scalings during weekends is expected to already lead to an improvement in model performance. Moreover, the comparison to the MAX-DOAS retrievals at Bremen shows that the diurnal scaling factors for road transport and potentially combustion should be adjusted in order to match the observed temporal profiles. The results of this study clearly demonstrate that future model development needs to concentrate on improving representation of diurnal cycles and associated temporal scalings.
As described in Sect. 3, a pollution plume with a horizontal extent on the order of the model resolution and hence showing up in the simulations can be missed by the line of sight of the MAX-DOAS instrument. Multiple MAX-DOAS measurements should therefore be performed over a range of different azimuthal angles for each station and stricter quality filters could be applied on the MAX-DOAS data to reduce the impact of retrieval uncertainty in future MAX-DOAS comparison studies. Comparison results could also be complemented by further data sources where possible. It would be interesting to investigate the ability of the models to predict the scales of NO2 spatial variations derived from timescales of NO2 variations and wind speeds in the context of model resolution. Moreover, one could investigate the ability of the models to distribute NO2 in the vertical in terms of characteristic layer height of NO2, which is expected to be affected by vertical resolution of the models.
Similar comparisons to other regional models or other model setups (different chemistry schemes, resolutions, anthropogenic emission inventories, boundary layer physics, varying scalings of emissions in time and in the vertical) as well as for more MAX-DOAS sites should follow. As the stations investigated in the present study have, apart from the rural background OHP station, rather similar meteorological and pollution conditions, investigation of stations over a broader range of different conditions would be desirable. Further comparison studies could, for instance, include stations at pollution hotspots in the Mediterranean such as Athens with strong smog conditions especially during summer and clean mountain sites.
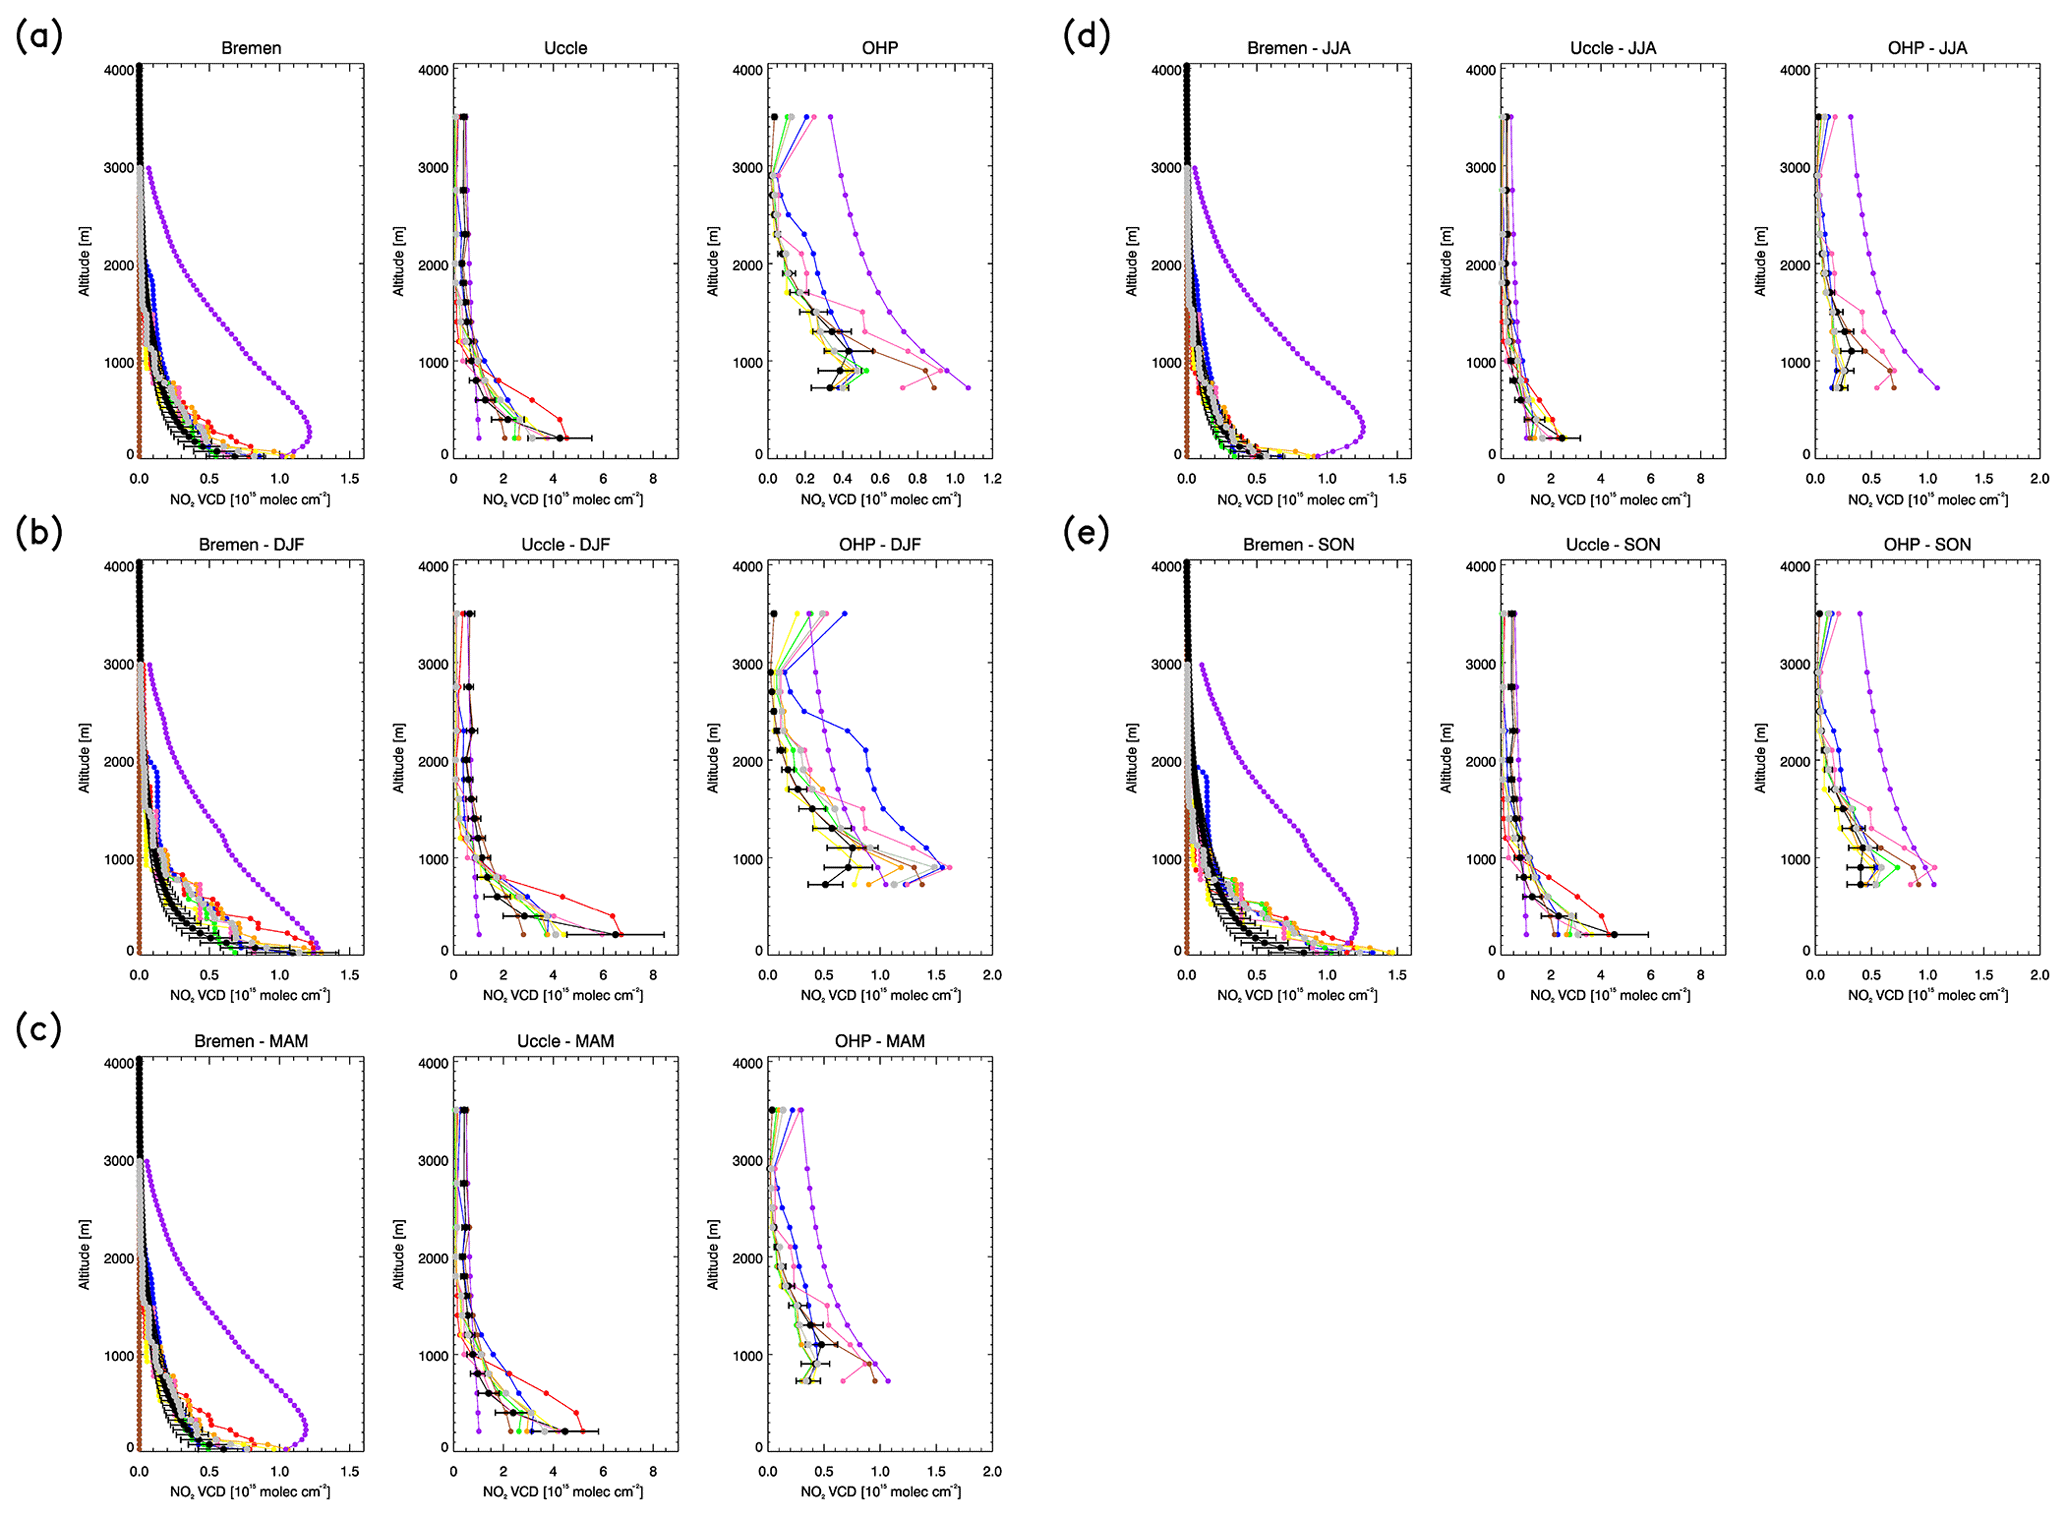
Figure A1Average vertical profiles of NO2 partial columns (1015 molec cm−2) from (black) MAX-DOAS, (brown) a priori profiles used for MAX-DOAS retrievals, (gray) model ensemble median, (blue) LOTOS-EUROS, (yellow) CHIMERE, (green) EMEP, (orange) EMEP-MACCEVA, (pink) SILAM and (red) MOCAGE as well as (purple) column AVKs (unitless). Black error bars refer to the uncertainty associated with the MAX-DOAS retrievals (assumed to be 30 % for all stations). Panel (a) shows profiles for data averaged over the whole time series, panel (b) shows profiles for DJF (December, January February), (c) MAM (March, April, May), (d) JJA (June, July, August) and (e) SON (September, October, November) months only. Panels (a) to (e) refer to (left) Bremen, (middle) Uccle and (right) OHP. MAX-DOAS vertical profiles are not available for De Bilt for the investigated time period.

Figure A2Scatter density plots of AVK-weighted tropospheric NO2 VCDs (1015 molec cm−2) from MAX-DOAS against model data for (from left to right) De Bilt, Bremen, Uccle and OHP. The data are shown for different bins with a size of 1015 molec cm−2 and are colored according to the number of data points per bin (%). The different panels show different model runs: (a) LOTOS-EUROS, (b) CHIMERE, (c) EMEP, (d) EMEP-MACCEVA, (e) SILAM and (f) MOCAGE. MOCAGE data are not available for the measurement time period at OHP. The dashed line is the reference line (f(x)=x). The solid line is the regression line (see top left of each plot for f(x) of this line). The root mean squared error (RMSE) (1015 molec cm−2), bias (1015 molec cm−2), Pearson correlation coefficient (cor, not squared) as well as the number of data points N are given in the top left of each plot.
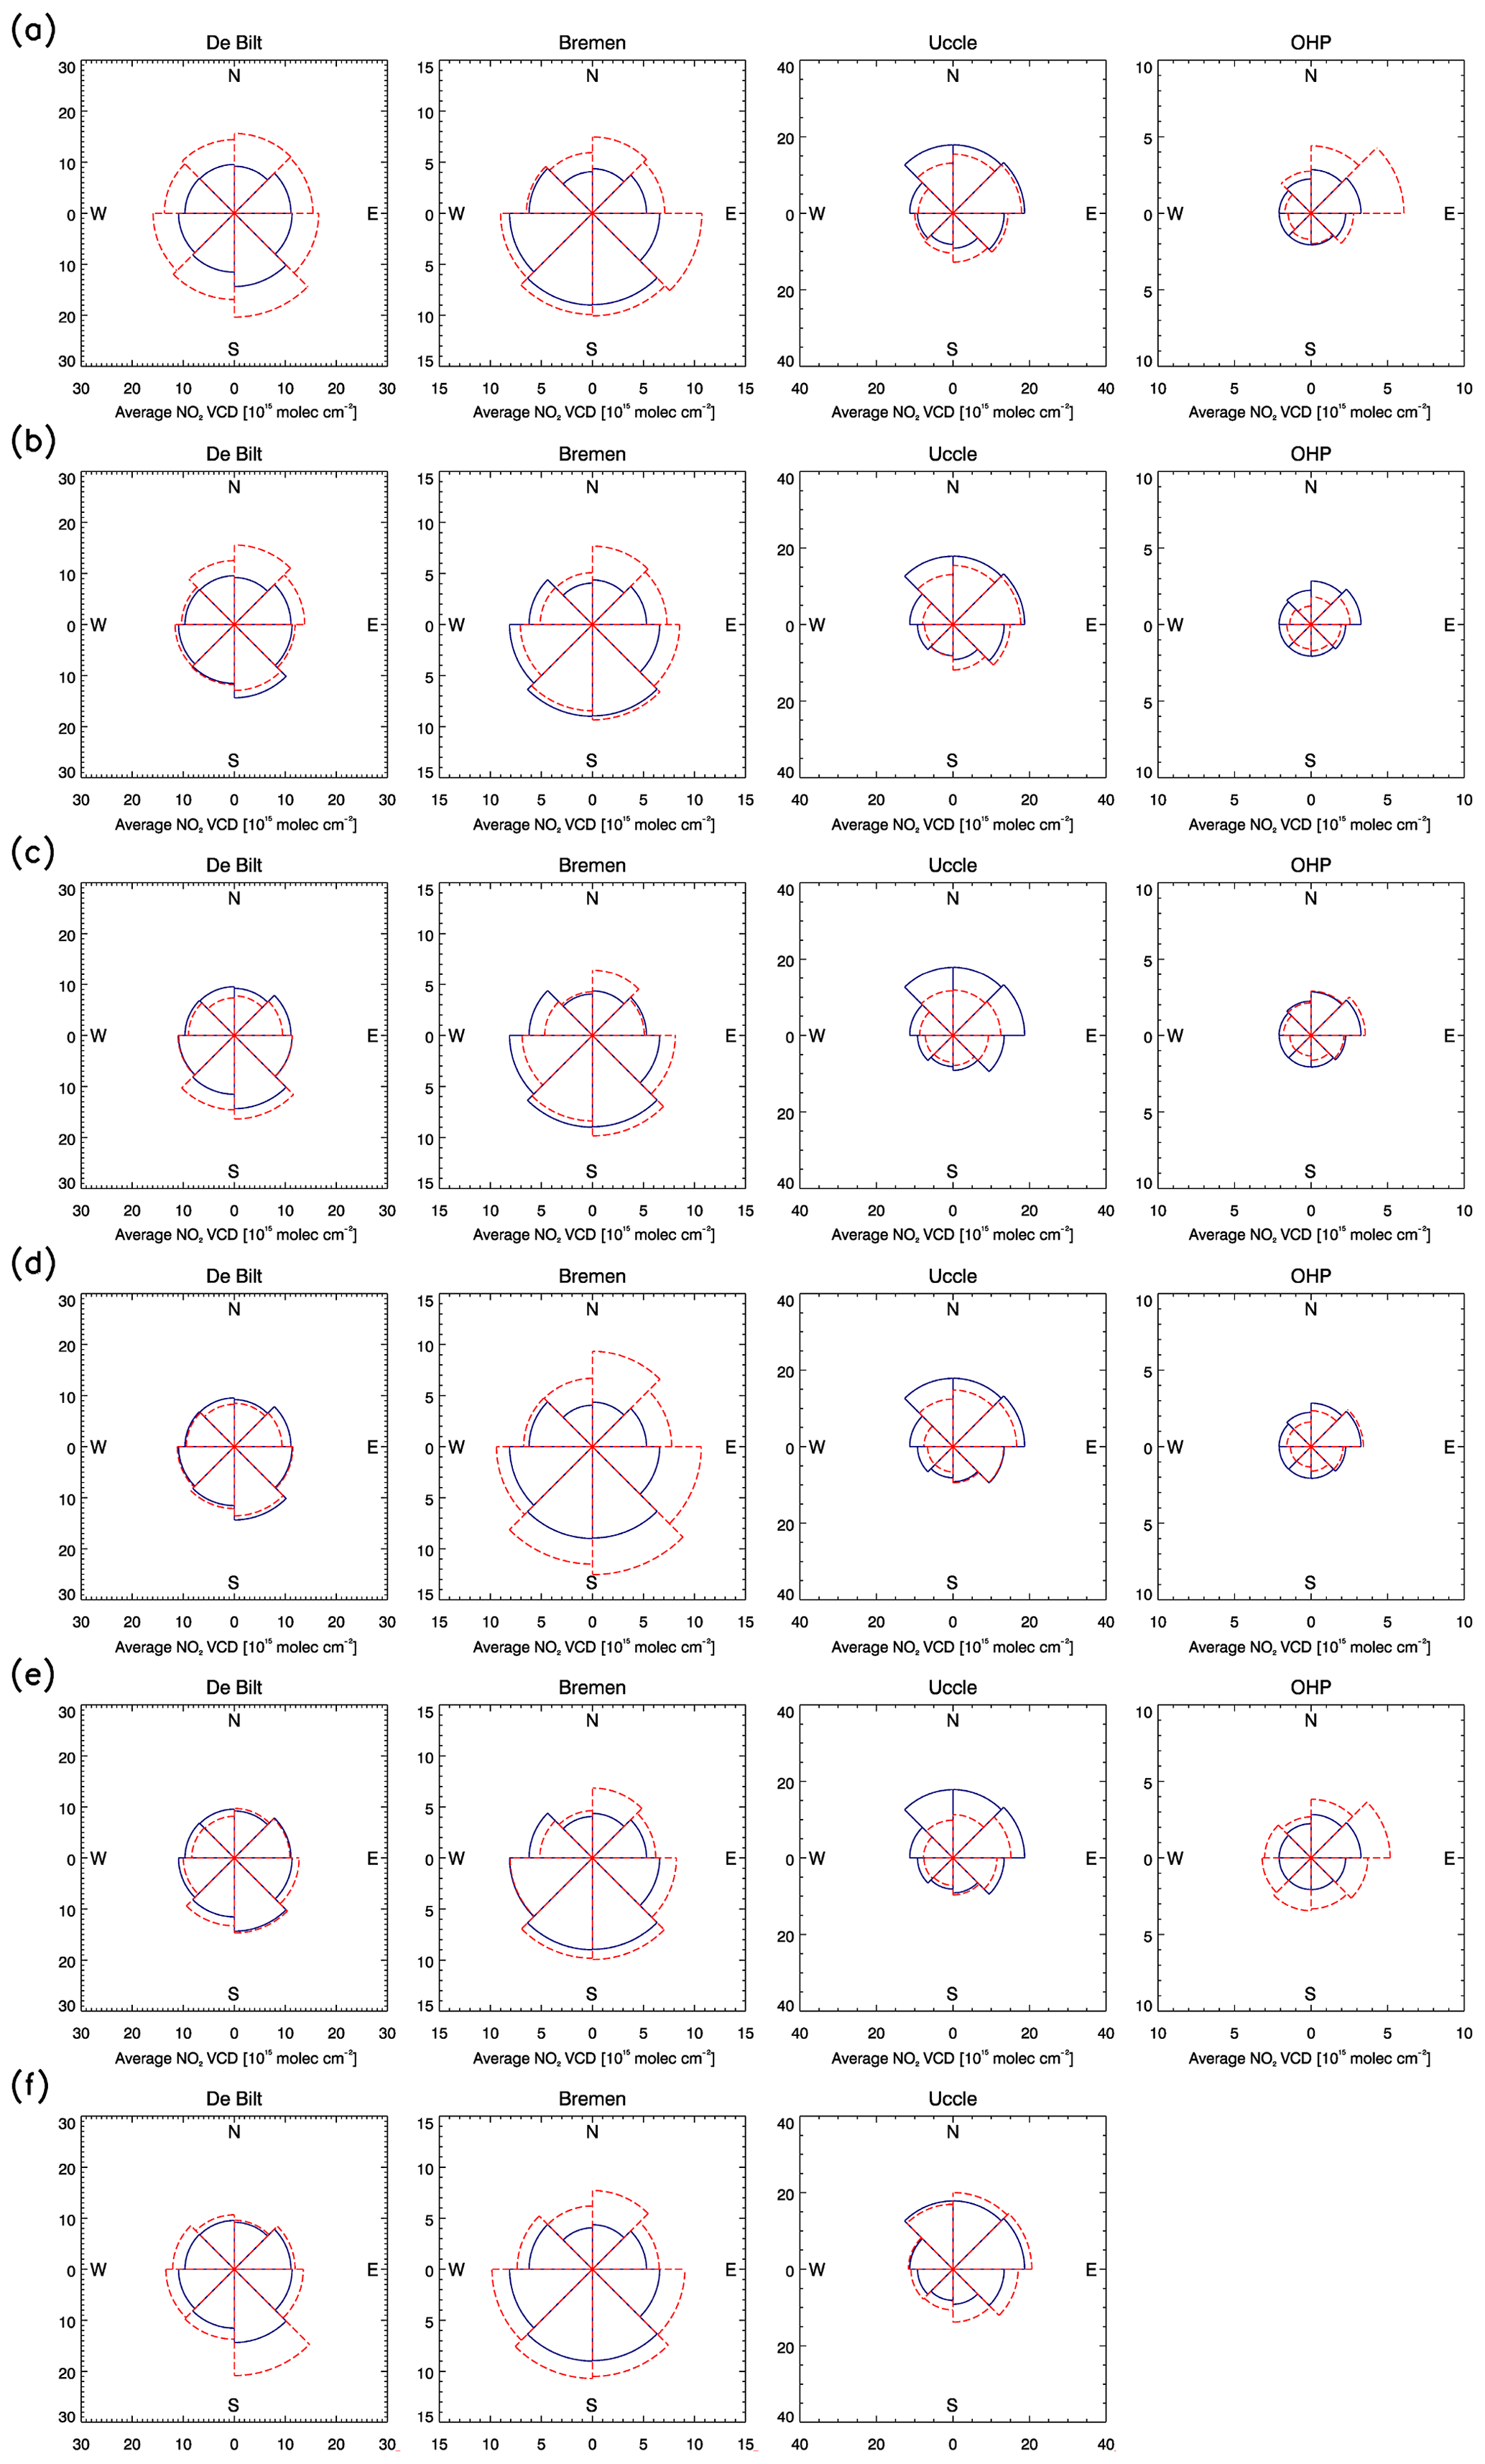
Figure A3As in Fig. A2 but for average AVK-weighted tropospheric NO2 VCDs (1015 molec cm−2) in 45∘ wide wind direction bins from (solid blue lines) MAX-DOAS and (dashed red lines) model data calculated. MOCAGE data are not available for the measurement time period at OHP.
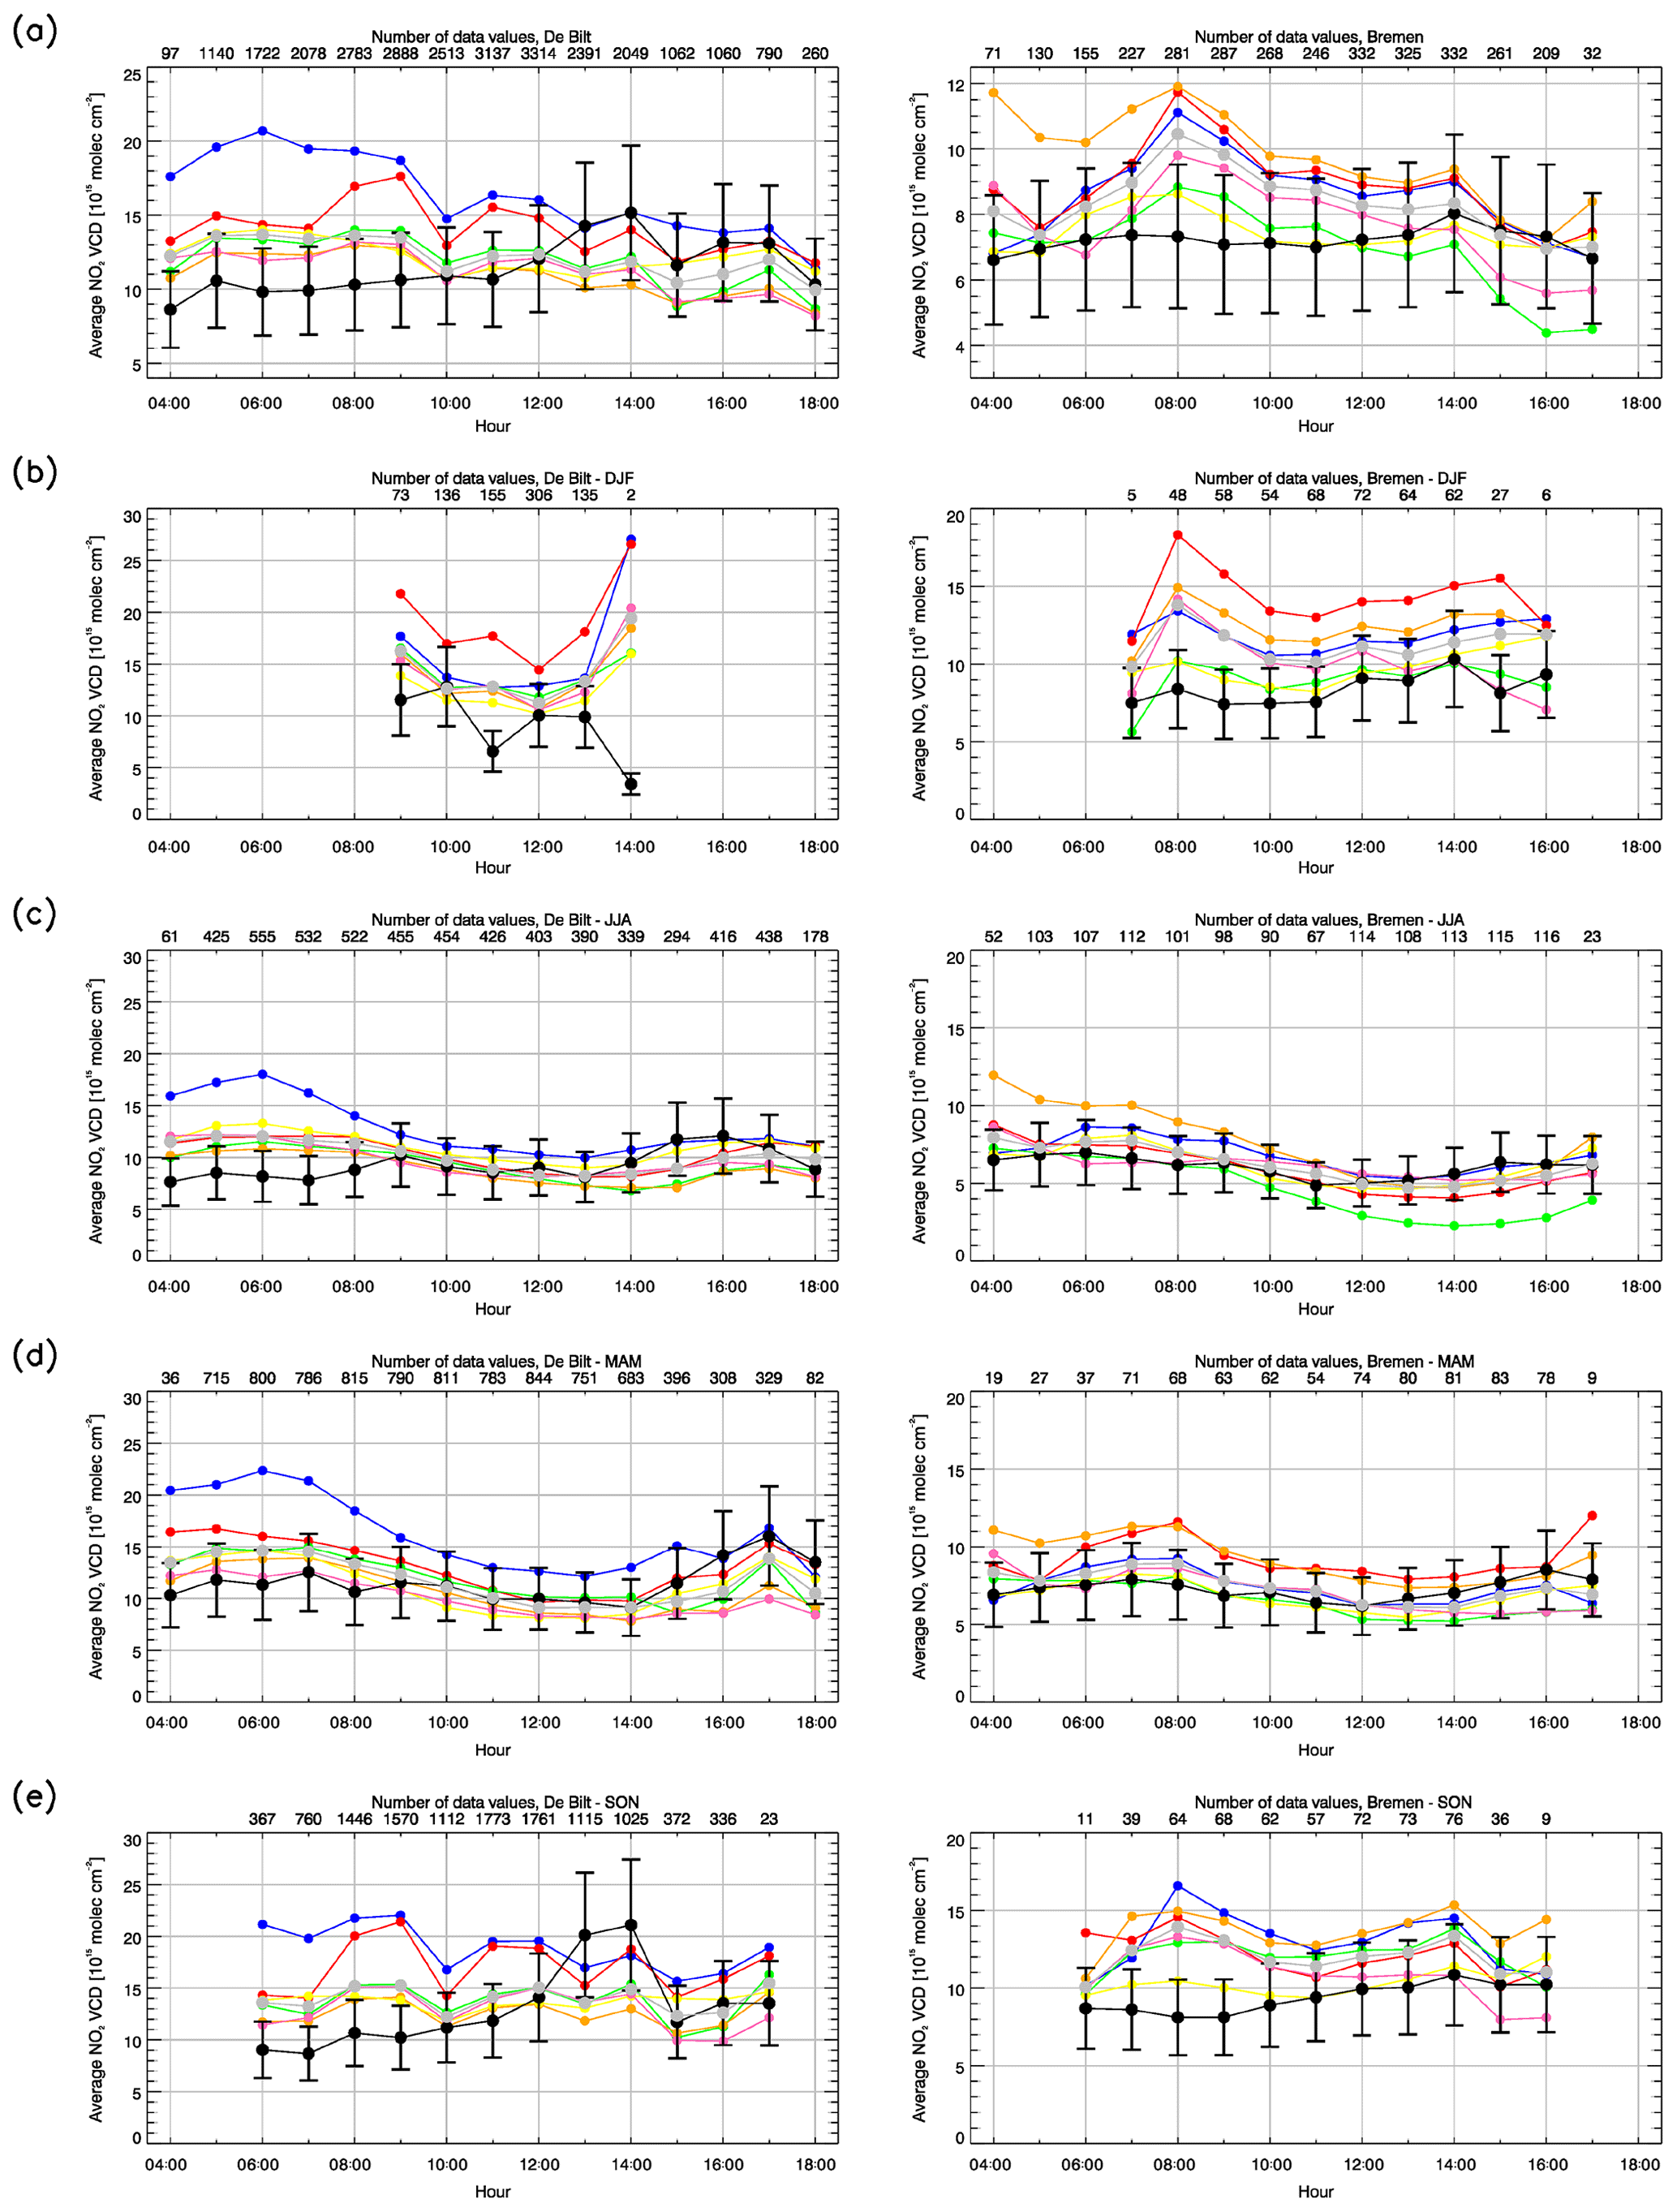
Figure A4Diurnal cycles (averages over hourly bins) of AVK-weighted tropospheric NO2 VCDs (1015 molec cm−2) from (black) MAX-DOAS, (gray) model ensemble median, (blue) LOTOS-EUROS, (yellow) CHIMERE, (green) EMEP, (orange) EMEP-MACCEVA, (pink) SILAM and (red) MOCAGE for (left) De Bilt and (right) Bremen. Model-based diurnal cycles were calculated from tropospheric NO2 VCDs. Black error bars refer to the uncertainty associated with the MAX-DOAS retrievals (assumed to be 30 % for all stations). Panel (a) shows cycles for the whole time series, (b) shows cycles for DJF, (c) MAM, (d) JJA and (e) SON months only. The number of data values used for calculating average values is shown in the top x axis of each plot.
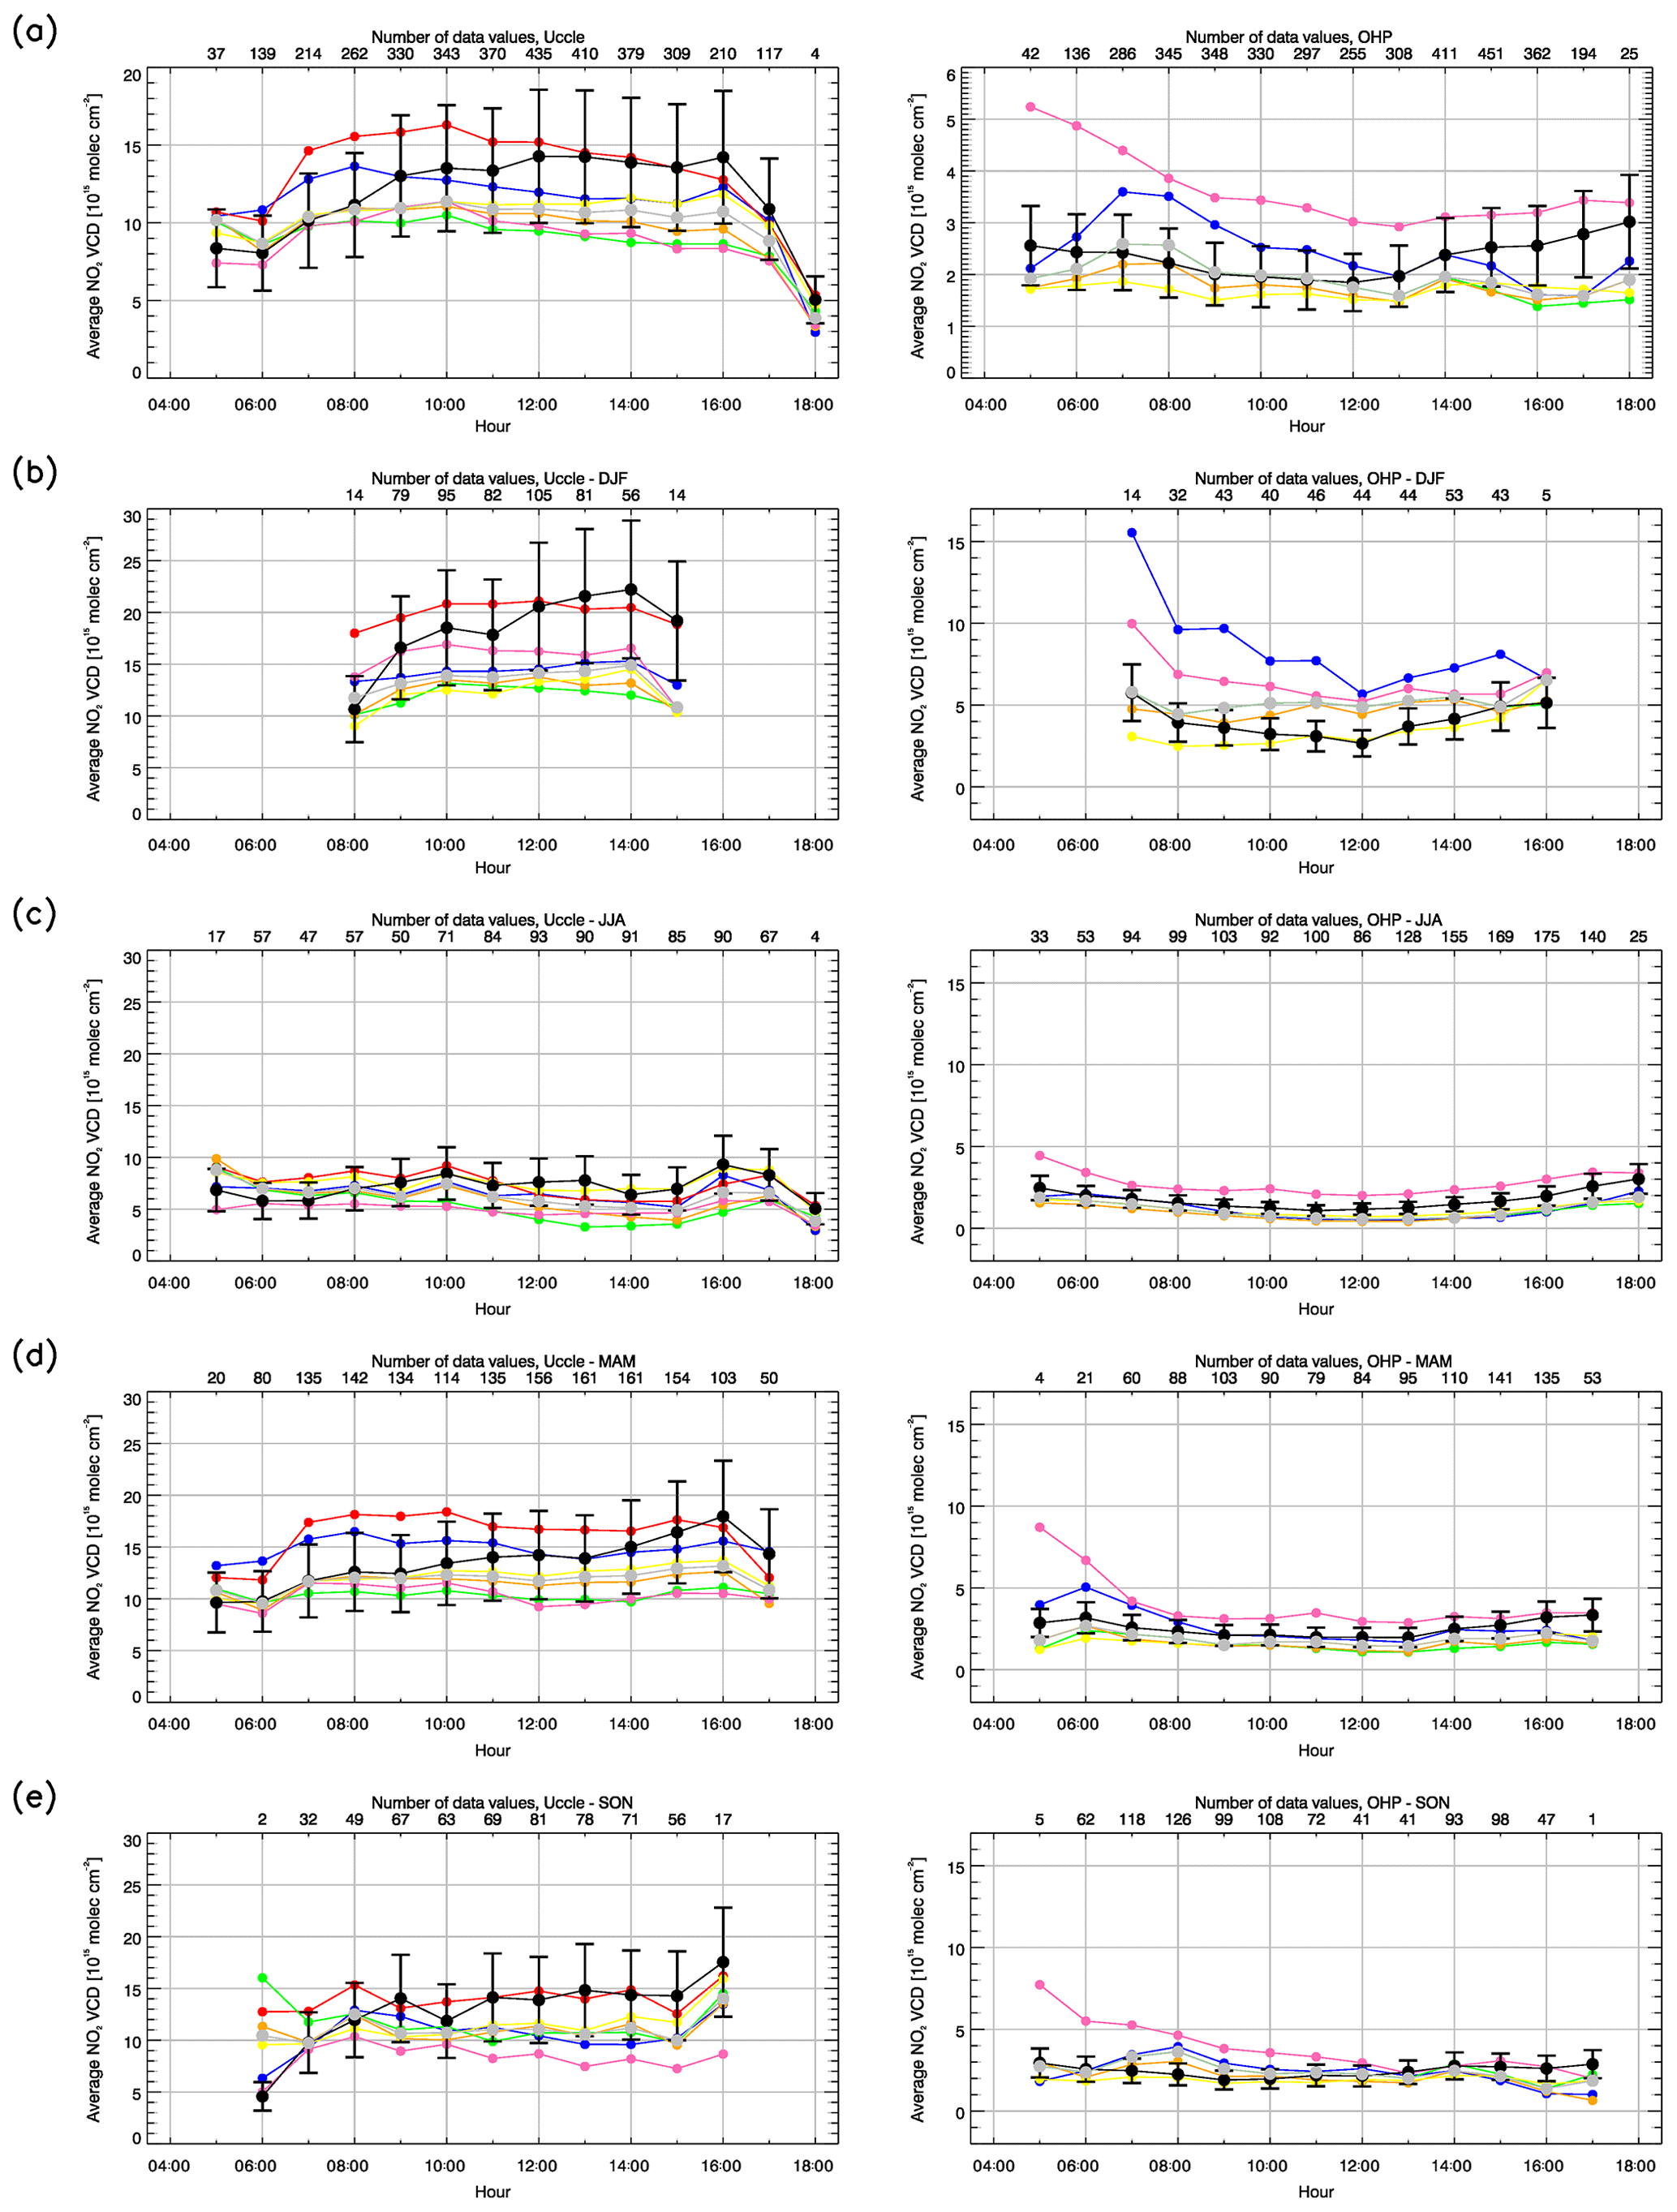
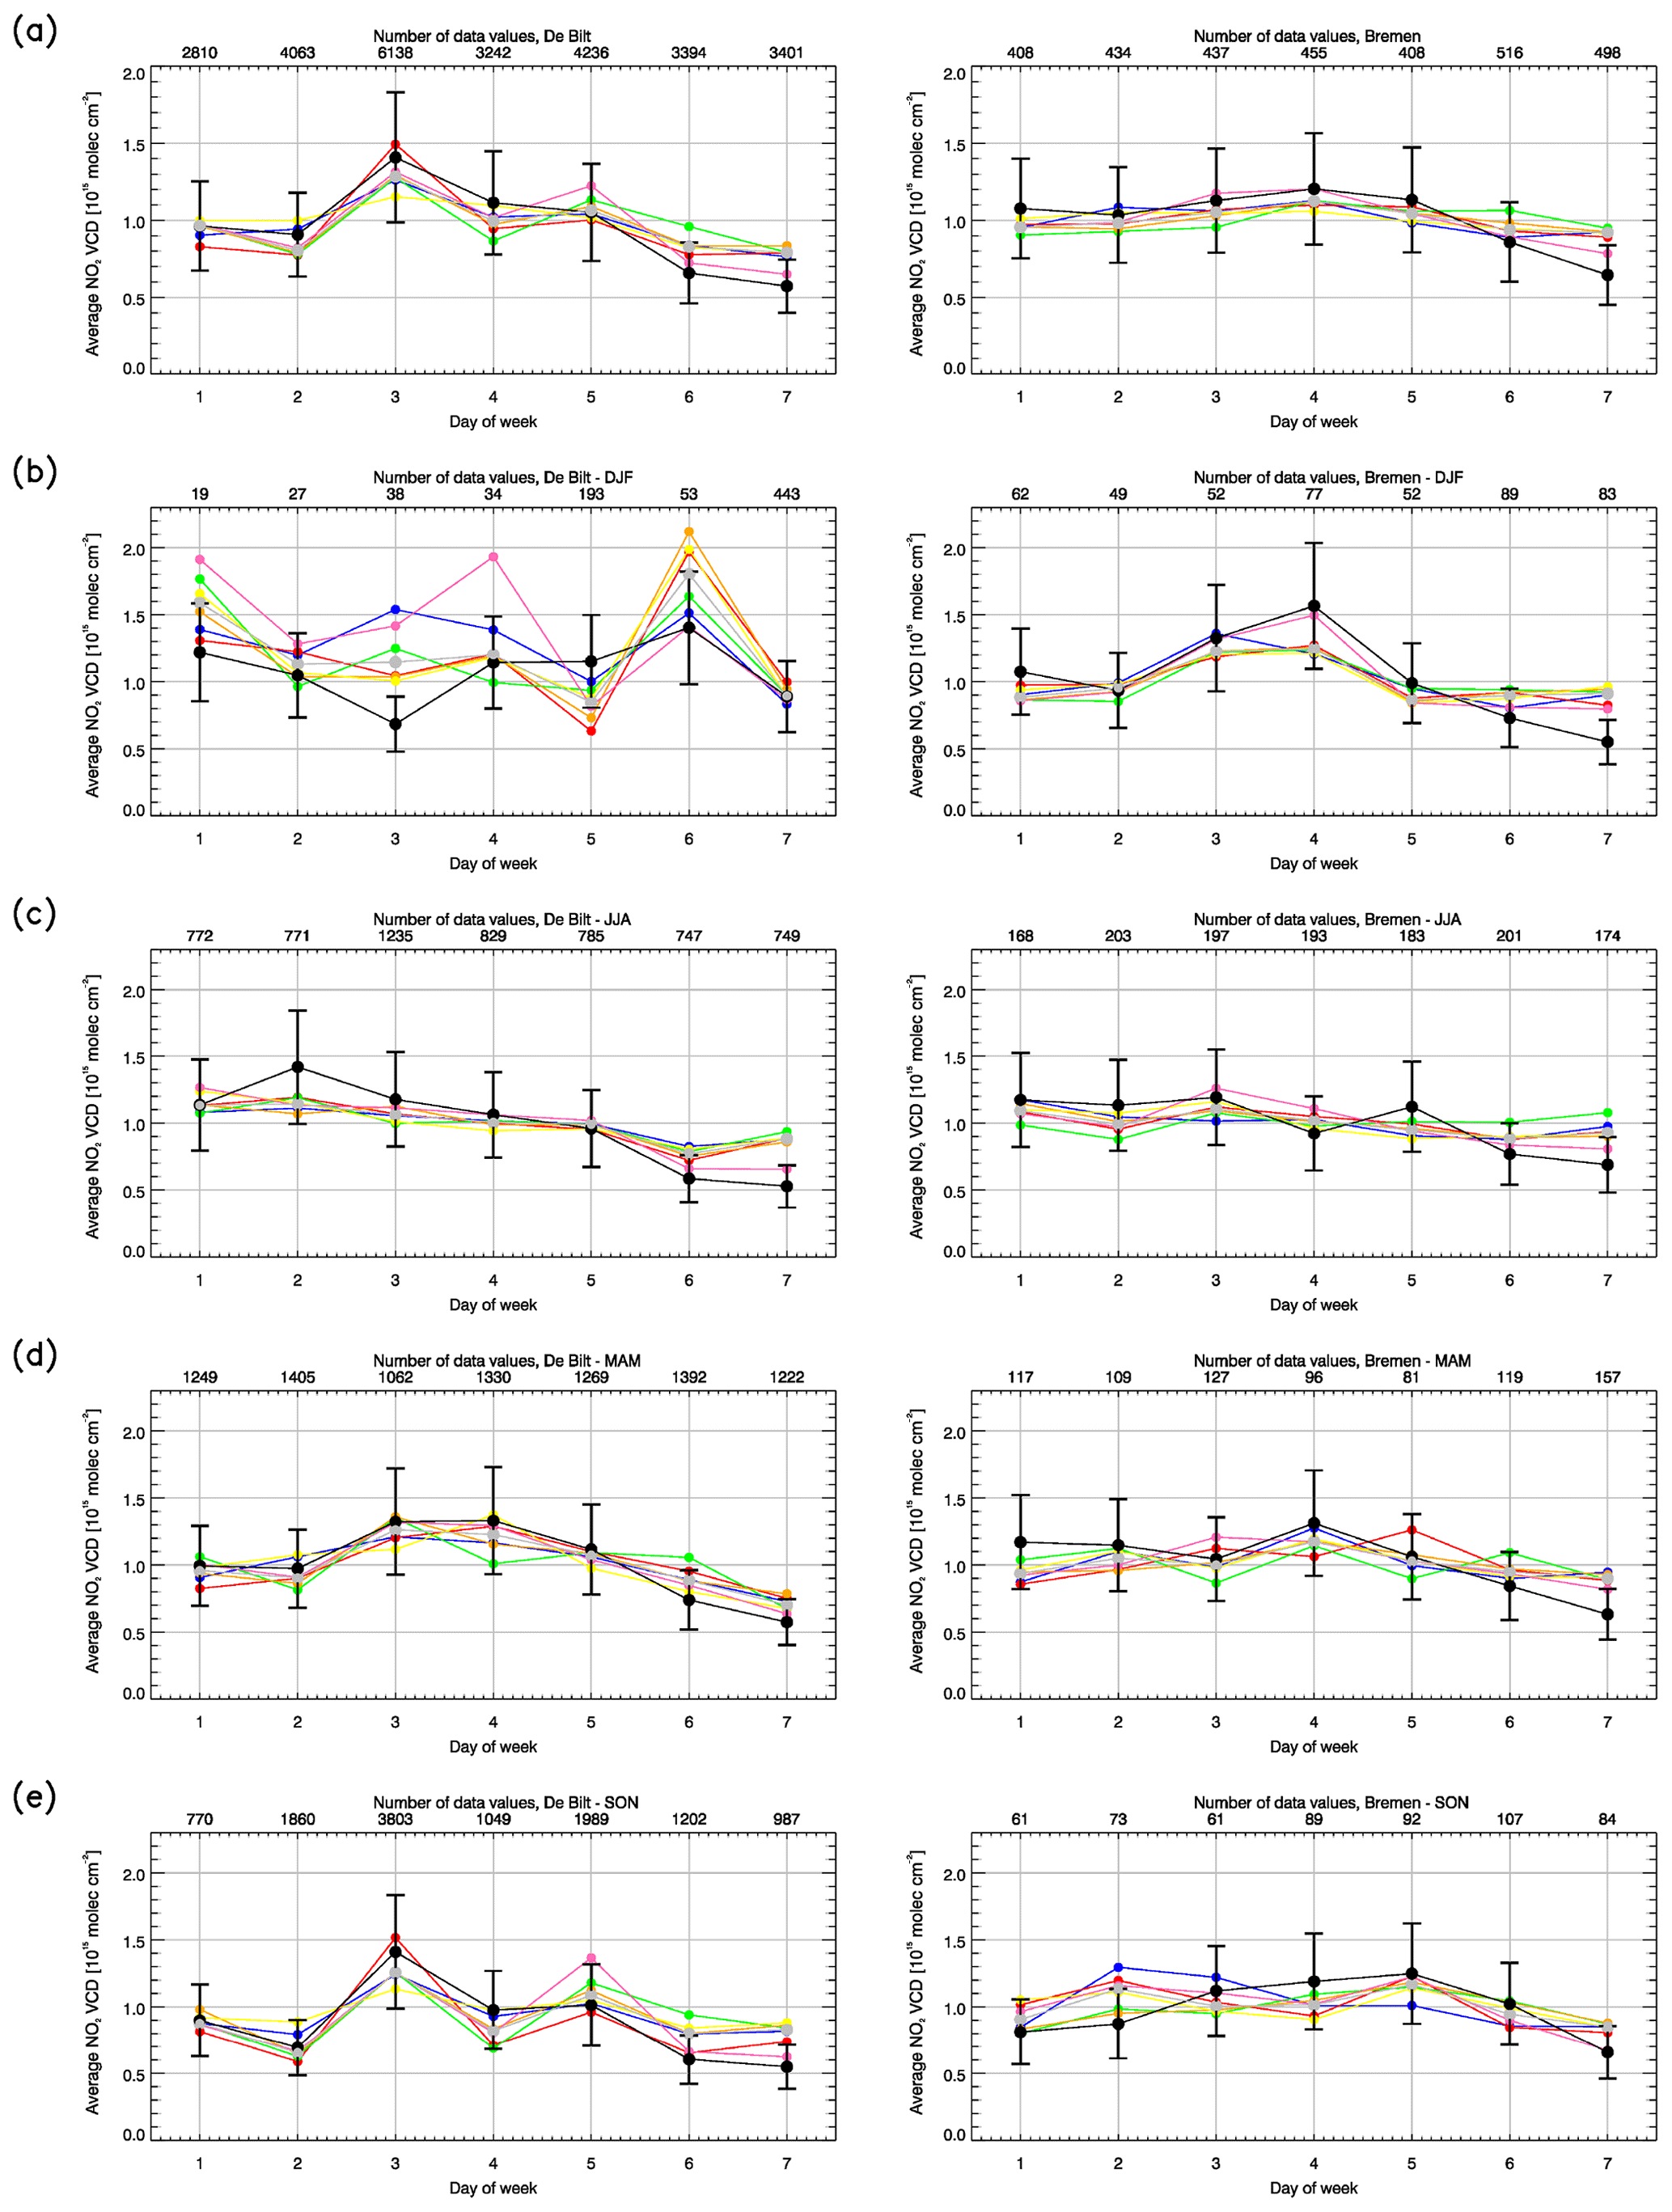
Figure A6As in Fig. A4 but for weekly cycles (averages over daily bins divided by the mean over the whole week; unitless values) of tropospheric NO2 VCDs.
Source code and test data sets for the open-source EMEP/MSC-W model are available at https://github.com/metno/emep-ctm (last access: 7 February 2020) or by contacting EMEP/MSC-W (emep.mscw@met.no). The SILAM code is available upon request from the authors (mikhail.sofiev@fmi.fi, julius.vira@fmi.fi). The MOCAGE results in the present paper are based on source code which is presently incorporated in the MOCAGE model. The MOCAGE source code is the property of Météo-France and CERFACS, and it is based on libraries that belong to some other holders. The MOCAGE model is not open source, and routines from MOCAGE cannot be freely distributed. CHIMERE is an open-source code protected under the GNU General Public license. It can be found at http://www.lmd.polytechnique.fr/chimere/ (last access: 7 February 2020). LOTOS-EUROS is downloadable free of charge after signing a license agreement. All information concerning the LOTOS-EUROS code is available at http://lotos-euros.nl (last access: 7 February 2020). For further information, the reader can contact Astrid Manders (astrid.manders@tno.nl).
AMB, AR and HE initialized and planned this study. AMB produced the comparison results, figures and tables, and wrote the main parts of the manuscript. JA, AC, LC, GF, VM, FM, JP, MP, AS, MS, AMV, JV and TV provided the model data and input to the text description about the models and on comparison results. CG, FH, EP, GP, AJMP, AR, MVR and TV provided the MAX-DOAS data and input to the text description about the measurements and on comparison results. AR provided the OMI retrievals for this study. All authors were involved in the discussion of the results.
The authors declare that they have no conflict of interest.
We thank the German Weather Service/Deutscher Wetterdienst for providing wind in situ data for Bremen through their website at http://www.dwd.de. We are also grateful to people behind the wind in situ data at Uccle (BIRA-IASB, Francois Hendrick, personal communication, 2016) and OHP (http://pc-meteo.obs-hp.fr/intervalle.php, last access: 7 February 2020) for providing these measurements.
This study was funded by the European Commission under the EU Seventh Research Framework Programme (grant agreement no. 283576, MACC II), the EU Horizon 2020 Research and Innovation Programme (grant agreement no. 633080, MACC-III) and the Copernicus Atmosphere Monitoring Service (CAMS), implemented by the European Centre for Medium-Range Weather Forecasts (ECMWF) on behalf of the European Commission. It was also funded in part by the University of Bremen.
The LOTOS-EUROS work was carried out within the ESA project, GLOB-EMISSION (grant no. AO/1-6721/11/I-NB). BIRA-IASB MAX-DOAS observations at Uccle and OHP were financially supported by the projects AGACC-II (BELSPO, Brussels) and NORS (EU FP7; contract 284421).
The article processing charges for this open-access publication were covered by the University of Bremen.
This paper was edited by Tim Butler and reviewed by three anonymous referees.
Beirle, S., Platt, U., Wenig, M., and Wagner, T.: Weekly cycle of NO2 by GOME measurements: a signature of anthropogenic sources, Atmos. Chem. Phys., 3, 2225–2232, https://doi.org/10.5194/acp-3-2225-2003, 2003. a, b
Bergström, R., Denier van der Gon, H. A. C., Prévôt, A. S. H., Yttri, K. E., and Simpson, D.: Modelling of organic aerosols over Europe (2002–2007) using a volatility basis set (VBS) framework: application of different assumptions regarding the formation of secondary organic aerosol, Atmos. Chem. Phys., 12, 8499–8527, https://doi.org/10.5194/acp-12-8499-2012, 2012. a, b
Bieser, J., Aulinger, A., Matthias, V., Quante, M., and Denier van Der Gon, H. A. C.: Vertical emission profiles for Europe based on plume rise calculations, Environ. Pollut., 159, 2935–2946, 2011. a, b
Brinksma, E. J., Pinardi, G. J., Braak, R., Volten, H., Richter, A., Dirksen, R. J., Vlemmix, T., Swart, D. P. J., Knap, W. H., Veefkind, J. P., Eskes, H. J., Allaart, M., Rothe, R., Piters, A. J. M., and Levelt, P. F.: The 2005 and 2006 DANDELIONS NO2 and Aerosol Intercomparison Campaigns, J. Geophys. Res., 113, D16S46, https://doi.org/10.1029/2007JD008808, 2008. a
Celarier, E. A., Brinksma, E. J., Gleason, J. F., Veefkind, J. P., Cede, A, Herman, J. R., Ionov, D., Goutail, F., Pommereau, J.-P., Lambert, J.-C., van Roozendael, M., Pinardi, G., Wittrock, F., Schönhardt, A., Richter, A., Ibrahim, O. W. , Wagner, T., Bojkov, B., Mount, G., Spinei, E., Chen, C. M. Pongetti, T. J. , Sander, S. P., Bucsela, E. J., Wenig, M. O. , Swart, D. P. J., Volten, H., Kroon, M., and Levelt, P. F.: Validation of Ozone Monitoring Instrument nitrogen dioxide columns, J. Geophys. Res., 113, D15S15, https://doi.org/10.1029/2007JD008908, 2008. a
Clémer, K., Van Roozendael, M., Fayt, C., Hendrick, F., Hermans, C., Pinardi, G., Spurr, R., Wang, P., and De Mazière, M.: Multiple wavelength retrieval of tropospheric aerosol optical properties from MAXDOAS measurements in Beijing, Atmos. Meas. Tech., 3, 863–878, https://doi.org/10.5194/amt-3-863-2010, 2010. a, b, c
Colette, A., Granier, C., Hodnebrog, Ø., Jakobs, H., Maurizi, A., Nyiri, A., Bessagnet, B., D'Angiola, A., D'Isidoro, M., Gauss, M., Meleux, F., Memmesheimer, M., Mieville, A., Rouïl, L., Russo, F., Solberg, S., Stordal, F., and Tampieri, F.: Air quality trends in Europe over the past decade: a first multi-model assessment, Atmos. Chem. Phys., 11, 11657–11678, https://doi.org/10.5194/acp-11-11657-2011, 2011. a
Colette, A., Bessagnet, B., Meleux, F., Terrenoire, E., and Rouïl, L.: Frontiers in air quality modelling, Geosci. Model Dev., 7, 203–210, https://doi.org/10.5194/gmd-7-203-2014, 2014. a
De Haan, J. F., Bosma, P. B., and Hovenier, J. W.: The adding method for multiple scattering calculations of polarized light, Astron. Astrophys., 183, 371–393, 1987. a
Denier van der Gon, H. A. C., Hendriks, C., Kuenen, J., Segers, A., and Visschedijk, A.: Description of current temporal emission patterns and sensitivity of predicted AQ for temporal emission patterns, TNO report, EU FP7 MACC deliverable report D_D-EMIS_1.3, Utrecht, the Netherlands, 2011. a, b
Douros, J., Eskes, H. J., Akriditis, D., Antonakaki, T., Bennouna, Y., Blechschmidt, A.-M., Bösch, T., Clark, H., Gielen, C., Hendrick, F., Kapsomenakis, J., Kartsios, K., Katragkou, E., Melas, D., Mortier, A., Peters, E., Petersen, K., Piters, A., Richter, A., van Roozendael, M., Schulz, M., Sudarchikova, N., Wagner, A., Zanis, P., and Zerefos, C.: Validation of CAMS regional services: concentrations above the surface, Status update for September–November 2018, Copernicus Atmosphere Monitoring Service (CAMS) report, CAMS84_2018SC1_D4.1.1-SON2018_v1.1, March 2019, available at: https://atmosphere.copernicus.eu/sites/default/files/2019-05/CAMS84_2018SC1_D4.1.1-SON2018_v1.1.pdf, last access: 27 November 2019. a
Drobinski, P., Saïd, F., Ancellet, G., Arteta, J., Augustin, P., Bastin, S., Brut, A., Caccia, J., Campistron, B., Cautenet, S., Colette, A., Coll, I., Corsmeier, U., Cros, B., Dabas, A., Delbarre, H., Dufour, A., Durand, P., Gu ́enard, V., Hasel, M., Kalthoff, N., Kottmeier, C., Lasry, F., Lemonsu, A., Lohou, F., Masson, V., Menut, L., Moppert, C., Peuch, V., Puygrenier, V., Reitebuch, O., and Vautard, R.: Regional transport and dilution during high-pollution episodes in southern France: Summary of findings from the Field Experiment to Constraint Models of Atmospheric Pollution and Emissions Transport (ESCOMPTE), J. Geophys. Res., 112, D13105, https://doi.org/10.1029/2006JD007494, 2007. a
Elkus, B. and Wilson, K. R.: Photochemical air pollution: weekend-weekday differences, Atmos. Environ., 11, 509–515, 1977. a
Fagerli, H., Solberg, S., Tsyro, S., Benedictow, A., Aas, W., Hjellbrekke, A.-G., and Posch, M.: Status of transboundary pollution in 2012, Transboundary particulate matter, photo-oxidants, acidifying and eutrophying components, EMEP Status Report 1/2014, The Norwegian Meteorological Institute, Oslo, Norway, 2014. a
Franco, B., Hendrick, F., Van Roozendael, M., Müller, J.-F., Stavrakou, T., Marais, E. A., Bovy, B., Bader, W., Fayt, C., Hermans, C., Lejeune, B., Pinardi, G., Servais, C., and Mahieu, E.: Retrievals of formaldehyde from ground-based FTIR and MAX-DOAS observations at the Jungfraujoch station and comparisons with GEOS-Chem and IMAGES model simulations, Atmos. Meas. Tech., 8, 1733–1756, https://doi.org/10.5194/amt-8-1733-2015, 2015. a
Gielen, C., Van Roozendael, M., Hendrick, F., Pinardi, G., Vlemmix, T., De Bock, V., De Backer, H., Fayt, C., Hermans, C., Gillotay, D., and Wang, P.: A simple and versatile cloud-screening method for MAX-DOAS retrievals, Atmos. Meas. Tech., 7, 3509–3527, https://doi.org/10.5194/amt-7-3509-2014, 2014. a
Guevara, M., Jorba, O., and García-Pando, C. P.: Report on emission temporal profiles for the global and regional scales, Copernicus Atmosphere Monitoring Service (CAMS) report, CAMS81_2017SC1_D81.6.2.1_201902_v1, February 2019, available at: https://atmosphere.copernicus.eu/sites/default/files/2019-11/27_CAMS81_2017SC1_D81.6.2.1-201902_v1_APPROVED_Ver1.pdf, last access: 27 November 2019. a, b
Guth, J., Josse, B., Marécal, V., Joly, M., and Hamer, P.: First implementation of secondary inorganic aerosols in the MOCAGE version R2.15.0 chemistry transport model, Geosci. Model Dev., 9, 137–160, https://doi.org/10.5194/gmd-9-137-2016, 2016. a
Halla, J. D., Wagner, T., Beirle, S., Brook, J. R., Hayden, K. L., O'Brien, J. M., Ng, A., Majonis, D., Wenig, M. O., and McLaren, R.: Determination of tropospheric vertical columns of NO2 and aerosol optical properties in a rural setting using MAX-DOAS, Atmos. Chem. Phys., 11, 12475–12498, https://doi.org/10.5194/acp-11-12475-2011, 2011. a
Heckel, A., Richter, A., Tarsu, T., Wittrock, F., Hak, C., Pundt, I., Junkermann, W., and Burrows, J. P.: MAX-DOAS measurements of formaldehyde in the Po-Valley, Atmos. Chem. Phys., 5, 909–918, https://doi.org/10.5194/acp-5-909-2005, 2005. a
Hendrick, F., Müller, J.-F., Clémer, K., Wang, P., De Mazière, M., Fayt, C., Gielen, C., Hermans, C., Ma, J. Z., Pinardi, G., Stavrakou, T., Vlemmix, T., and Van Roozendael, M.: Four years of ground-based MAX-DOAS observations of HONO and NO2 in the Beijing area, Atmos. Chem. Phys., 14, 765–781, https://doi.org/10.5194/acp-14-765-2014, 2014. a, b, c
Hollingsworth, A. R., Engelen, R. J., Textor, C., Benedetti, A., Boucher, O., Chevallier, F., Dethof, A., Elbern, H., Eskes, H., Flemming, J., Granier, C., Kaiser, J. W., Morcrette, J.-J., Rayner, P., Peuch, V.-H., Rouil, L., Schultz, M. G., Simmons, A. J., and Consortium, T. G.: Toward a monitoring and forecasting system for atmospheric composition: The GEMS project, B. Am. Meteorol. Soc., 89, 1147–1164, 2008. a
Hönninger, G., von Friedeburg, C., and Platt, U.: Multi axis differential optical absorption spectroscopy (MAX-DOAS), Atmos. Chem. Phys., 4, 231–254, https://doi.org/10.5194/acp-4-231-2004, 2004. a, b
Huijnen, V., Eskes, H. J., Poupkou, A., Elbern, H., Boersma, K. F., Foret, G., Sofiev, M., Valdebenito, A., Flemming, J., Stein, O., Gross, A., Robertson, L., D'Isidoro, M., Kioutsioukis, I., Friese, E., Amstrup, B., Bergstrom, R., Strunk, A., Vira, J., Zyryanov, D., Maurizi, A., Melas, D., Peuch, V.-H., and Zerefos, C.: Comparison of OMI NO2 tropospheric columns with an ensemble of global and European regional air quality models, Atmos. Chem. Phys., 10, 3273–3296, https://doi.org/10.5194/acp-10-3273-2010, 2010. a, b, c, d, e, f, g
Ialongo, I., Herman, J., Krotkov, N., Lamsal, L., Boersma, K. F., Hovila, J., and Tamminen, J.: Comparison of OMI NO2 observations and their seasonal and weekly cycles with ground-based measurements in Helsinki, Atmos. Meas. Tech., 9, 5203–5212, https://doi.org/10.5194/amt-9-5203-2016, 2016. a
Inness, A., Baier, F., Benedetti, A., Bouarar, I., Chabrillat, S., Clark, H., Clerbaux, C., Coheur, P., Engelen, R. J., Errera, Q., Flemming, J., George, M., Granier, C., Hadji-Lazaro, J., Huijnen, V., Hurtmans, D., Jones, L., Kaiser, J. W., Kapsomenakis, J., Lefever, K., Leitão, J., Razinger, M., Richter, A., Schultz, M. G., Simmons, A. J., Suttie, M., Stein, O., Thépaut, J.-N., Thouret, V., Vrekoussis, M., Zerefos, C., and the MACC team: The MACC reanalysis: an 8 yr data set of atmospheric composition, Atmos. Chem. Phys., 13, 4073–4109, https://doi.org/10.5194/acp-13-4073-2013, 2013. a
Irie, H., Kanaya, Y., Akimoto, H., Tanimoto, H., Wang, Z., Gleason, J. F., and Bucsela, E. J.: Validation of OMI tropospheric NO2 column data using MAX-DOAS measurements deep inside the North China Plain in June 2006: Mount Tai Experiment 2006, Atmos. Chem. Phys., 8, 6577–6586, https://doi.org/10.5194/acp-8-6577-2008, 2008. a
Irie, H., Takashima, H., Kanaya, Y., Boersma, K. F., Gast, L., Wittrock, F., Brunner, D., Zhou, Y., and Van Roozendael, M.: Eight-component retrievals from ground-based MAX-DOAS observations, Atmos. Meas. Tech., 4, 1027–1044, https://doi.org/10.5194/amt-4-1027-2011, 2011. a
Irie, H., Boersma, K. F., Kanaya, Y., Takashima, H., Pan, X., and Wang, Z. F.: Quantitative bias estimates for tropospheric NO2 columns retrieved from SCIAMACHY, OMI, and GOME-2 using a common standard for East Asia, Atmos. Meas. Tech., 5, 2403–2411, https://doi.org/10.5194/amt-5-2403-2012, 2012. a
Josse, B., Simon, P., and Peuch, V.-H.: Radon global simulations with the multiscale chemistry and transport model MOCAGE, Tellus B, 56, 339–356, https://doi.org/10.1111/j.1600-0889.2004.00112.x, 2004. a
Kaiser, J. W., Heil, A., Andreae, M. O., Benedetti, A., Chubarova, N., Jones, L., Morcrette, J.-J., Razinger, M., Schultz, M. G., Suttie, M., and van der Werf, G. R.: Biomass burning emissions estimated with a global fire assimilation system based on observed fire radiative power, Biogeosciences, 9, 527–554, https://doi.org/10.5194/bg-9-527-2012, 2012. a
Kanaya, Y., Irie, H., Takashima, H., Iwabuchi, H., Akimoto, H., Sudo, K., Gu, M., Chong, J., Kim, Y. J., Lee, H., Li, A., Si, F., Xu, J., Xie, P.-H., Liu, W.-Q., Dzhola, A., Postylyakov, O., Ivanov, V., Grechko, E., Terpugova, S., and Panchenko, M.: Long-term MAX-DOAS network observations of NO2 in Russia and Asia (MADRAS) during the period 2007–2012: instrumentation, elucidation of climatology, and comparisons with OMI satellite observations and global model simulations, Atmos. Chem. Phys., 14, 7909–7927, https://doi.org/10.5194/acp-14-7909-2014, 2014. a
Kuenen, J. J. P., Denier van der Gon, H. A. C., Visschedijk, A., Van der Brugh, H., and Van Gijlswijk, R.: MACC European emission inventory for the years 2003–2007, TNO report TNO-060-UT-2011-00588, TNO, Utrecht, 2011. a
Lacressonnière, G., Peuch, V.-H., Vautard, R., Arteta, J., Déqué, M., Josse, B., Marécal, V., and Saint-Martin, D.: European air quality in the 2030s and 2050s: Impacts of global and regional emission trends and of climate change, Atmos. Environ., 92, 348–358, 2014. a
Langner, J., Engardt, M., Baklanov, A., Christensen, J. H., Gauss, M., Geels, C., Hedegaard, G. B., Nuterman, R., Simpson, D., Soares, J., Sofiev, M., Wind, P., and Zakey, A.: A multi-model study of impacts of climate change on surface ozone in Europe, Atmos. Chem. Phys., 12, 10423–10440, https://doi.org/10.5194/acp-12-10423-2012, 2012. a
Lefèvre, F., Brasseur, G., Folkins, I., Smith, A., and Simon, P.: Chemistry of the 1991–1992 stratospheric winter: three-dimensional model simulations, J. Geophys. Res.-Atmos., 99, 8183–8195, 1994. a
Leser, H., Hönninger, G., and Platt, U.: MAX-DOAS measurements of BrO and NO2 in the marine boundary layer, Geophys. Res. Lett., 30, 1537, https://doi.org/10.1029/2002GL015811, 2003. a
Levelt, P. F., Van den Oord, G. H. J., Dobber, M. R., Malkki, A., Visser, H., de Vries, J., Stammes, P., Lundell, J. O. V., and Saari, H.: The Ozone Monitoring Instrument, Ieee Trans. Geosci. Remote Sens., 44, 1093–1101, 2006. a, b
Lin, J.-T., Martin, R. V., Boersma, K. F., Sneep, M., Stammes, P., Spurr, R., Wang, P., Van Roozendael, M., Clémer, K., and Irie, H.: Retrieving tropospheric nitrogen dioxide from the Ozone Monitoring Instrument: effects of aerosols, surface reflectance anisotropy, and vertical profile of nitrogen dioxide, Atmos. Chem. Phys., 14, 1441–1461, https://doi.org/10.5194/acp-14-1441-2014, 2014. a
Ma, J. Z., Beirle, S., Jin, J. L., Shaiganfar, R., Yan, P., and Wagner, T.: Tropospheric NO2 vertical column densities over Beijing: results of the first three years of ground-based MAX-DOAS measurements (2008–2011) and satellite validation, Atmos. Chem. Phys., 13, 1547–1567, https://doi.org/10.5194/acp-13-1547-2013, 2013. a, b
Marécal, V., Peuch, V.-H., Andersson, C., Andersson, S., Arteta, J., Beekmann, M., Benedictow, A., Bergström, R., Bessagnet, B., Cansado, A., Chéroux, F., Colette, A., Coman, A., Curier, R. L., Denier van der Gon, H. A. C., Drouin, A., Elbern, H., Emili, E., Engelen, R. J., Eskes, H. J., Foret, G., Friese, E., Gauss, M., Giannaros, C., Guth, J., Joly, M., Jaumouillé, E., Josse, B., Kadygrov, N., Kaiser, J. W., Krajsek, K., Kuenen, J., Kumar, U., Liora, N., Lopez, E., Malherbe, L., Martinez, I., Melas, D., Meleux, F., Menut, L., Moinat, P., Morales, T., Parmentier, J., Piacentini, A., Plu, M., Poupkou, A., Queguiner, S., Robertson, L., Rouïl, L., Schaap, M., Segers, A., Sofiev, M., Tarasson, L., Thomas, M., Timmermans, R., Valdebenito, Á., van Velthoven, P., van Versendaal, R., Vira, J., and Ung, A.: A regional air quality forecasting system over Europe: the MACC-II daily ensemble production, Geosci. Model Dev., 8, 2777–2813, https://doi.org/10.5194/gmd-8-2777-2015, 2015. a, b, c, d, e, f, g
Mendolia, D., D'Souza, R. J. C., Evans, G. J., and Brook, J.: Comparison of tropospheric NO2 vertical columns in an urban environment using satellite, multi-axis differential optical absorption spectroscopy, and in situ measurements, Atmos. Meas. Tech., 6, 2907–2924, https://doi.org/10.5194/amt-6-2907-2013, 2013. a
Menut, L., Bessagnet, B., Khvorostyanov, D., Beekmann, M., Blond, N., Colette, A., Coll, I., Curci, G., Foret, G., Hodzic, A., Mailler, S., Meleux, F., Monge, J.-L., Pison, I., Siour, G., Turquety, S., Valari, M., Vautard, R., and Vivanco, M. G.: CHIMERE 2013: a model for regional atmospheric composition modelling, Geosci. Model Dev., 6, 981–1028, https://doi.org/10.5194/gmd-6-981-2013, 2013. a, b
Mues, A., Kuenen, J., Hendriks, C., Manders, A., Segers, A., Scholz, Y., Hueglin, C., Builtjes, P., and Schaap, M.: Sensitivity of air pollution simulations with LOTOS-EUROS to the temporal distribution of anthropogenic emissions, Atmos. Chem. Phys., 14, 939–955, https://doi.org/10.5194/acp-14-939-2014, 2014. a, b
Peters, E., Wittrock, F., Großmann, K., Frieß, U., Richter, A., and Burrows, J. P.: Formaldehyde and nitrogen dioxide over the remote western Pacific Ocean: SCIAMACHY and GOME-2 validation using ship-based MAX-DOAS observations, Atmos. Chem. Phys., 12, 11179–11197, https://doi.org/10.5194/acp-12-11179-2012, 2012. a, b
Petetin, H., Beekmann, M., Colomb, A., Denier van der Gon, H. A. C., Dupont, J.-C., Honoré, C., Michoud, V., Morille, Y., Perrussel, O., Schwarzenboeck, A., Sciare, J., Wiedensohler, A., and Zhang, Q. J.: Evaluating BC and NOx emission inventories for the Paris region from MEGAPOLI aircraft measurements, Atmos. Chem. Phys., 15, 9799–9818, https://doi.org/10.5194/acp-15-9799-2015, 2015. a
Pinardi, G., Van Roozendael, M., Lambert, J.-C., Granville, J., Hendrick, F., Tack, F., Yu, H., Cede, A., Kanaya, Y., Irie, H., Goutail, F., Pommereau, J.-P., Pazmino, A., Wittrock, F., Richter, A., Wagner, T., Gu, M., Remmers, J., Friess, U., Vlemmix, T., Piters, A., Hao, N., Tiefengraber, M., Herman, J., Abuhassan, N., Bais, A., Kouremeti, N., Hovila, J., Holla, R., Chong, J., Postylyakov, O., and Ma, J.: GOME-2 total and tropospheric NO2 validation based on zenith-sky, direct-sun and Multi-Axis DOAS network observations, EUMETSAT conference, 22–26 September 2014, Geneva, Switzerland, 2014. a
Piters, A. J. M., Boersma, K. F., Kroon, M., Hains, J. C., Van Roozendael, M., Wittrock, F., Abuhassan, N., Adams, C., Akrami, M., Allaart, M. A. F., Apituley, A., Beirle, S., Bergwerff, J. B., Berkhout, A. J. C., Brunner, D., Cede, A., Chong, J., Clémer, K., Fayt, C., Frieß, U., Gast, L. F. L., Gil-Ojeda, M., Goutail, F., Graves, R., Griesfeller, A., Großmann, K., Hemerijckx, G., Hendrick, F., Henzing, B., Herman, J., Hermans, C., Hoexum, M., van der Hoff, G. R., Irie, H., Johnston, P. V., Kanaya, Y., Kim, Y. J., Klein Baltink, H., Kreher, K., de Leeuw, G., Leigh, R., Merlaud, A., Moerman, M. M., Monks, P. S., Mount, G. H., Navarro-Comas, M., Oetjen, H., Pazmino, A., Perez-Camacho, M., Peters, E., du Piesanie, A., Pinardi, G., Puentedura, O., Richter, A., Roscoe, H. K., Schönhardt, A., Schwarzenbach, B., Shaiganfar, R., Sluis, W., Spinei, E., Stolk, A. P., Strong, K., Swart, D. P. J., Takashima, H., Vlemmix, T., Vrekoussis, M., Wagner, T., Whyte, C., Wilson, K. M., Yela, M., Yilmaz, S., Zieger, P., and Zhou, Y.: The Cabauw Intercomparison campaign for Nitrogen Dioxide measuring Instruments (CINDI): design, execution, and early results, Atmos. Meas. Tech., 5, 457–485, https://doi.org/10.5194/amt-5-457-2012, 2012. a
Richter, A., Godin, S., Gomez, L., Hendrick, F., Hocke, K., Langerock, B., van Roozendael, M., and Wagner, T.: Spatial Representativeness of NORS observations, NORS project deliverable, available at: http://nors.aeronomie.be/projectdir/PDF/D4.4_NORS_SR.pdf (last access: 10 February 2020), 2013. a, b
Rodgers, C. D.: Inverse Methods for Atmospheric Sounding – Theory and Practice, Series on Atmospheric, Oceanic and Planetary Physics, World Scientific, Singapore, 2000. a
Roscoe, H. K., Van Roozendael, M., Fayt, C., du Piesanie, A., Abuhassan, N., Adams, C., Akrami, M., Cede, A., Chong, J., Clémer, K., Frieß, U., Gil Ojeda, M., Goutail, F., Graves, R., Griesfeller, A., Grossmann, K., Hemerijckx, G., Hendrick, F., Herman, J., Hermans, C., Irie, H., Johnston, P. V., Kanaya, Y., Kreher, K., Leigh, R., Merlaud, A., Mount, G. H., Navarro, M., Oetjen, H., Pazmino, A., Perez-Camacho, M., Peters, E., Pinardi, G., Puentedura, O., Richter, A., Schönhardt, A., Shaiganfar, R., Spinei, E., Strong, K., Takashima, H., Vlemmix, T., Vrekoussis, M., Wagner, T., Wittrock, F., Yela, M., Yilmaz, S., Boersma, F., Hains, J., Kroon, M., Piters, A., and Kim, Y. J.: Intercomparison of slant column measurements of NO2 and O4 by MAX-DOAS and zenith-sky UV and visible spectrometers, Atmos. Meas. Tech., 3, 1629–1646, https://doi.org/10.5194/amt-3-1629-2010, 2010. a
Rozanov, A., Rozanov, V., Buchwitz, M., Kokhanovsky, A., and Burrows, J. P.: SCIATRAN 2.0 – a new radiative transfer model for geophysical applications in the 175–2400 nm spectral region, Adv. Space Res., 36, 1015–1019, 2005. a
Schaap, M., Timmermans, R. M. A., Roemer, M., Boersen, G. A. C., Builtjes, P. J. H., Sauter, F. J., Velders, G. J. M., and Beck, J. P.: The LOTOS-EUROS Model: Description, validation and latest developments, Int. J. Environ. Pollut., 32, 270–290, 2008. a, b
Schmidt, H., Derognat, C., Vautard, R., and Beekmann, M.: A comparison of simulated and observed ozone mixing ratios for the summer of 1998 in western Europe, Atmos. Environ., 35, 6277–6297, 2001. a
Schulz, M., Benedictow, A., Schneider, P., Bartnicki, J., Valdebenito, Á., Gauss, M., and Griesfeller, J.: Modelling and evaluation of trends in the EMEP framework, Transboundary acidification, eutrophication and ground level ozone in Europe in 2011, EMEP Status Report 1/2013, Norwegian Meteorological Institute, Oslo, Norway, 2013. a
Shaiganfar, R., Beirle, S., Petetin, H., Zhang, Q., Beekmann, M., and Wagner, T.: New concepts for the comparison of tropospheric NO2 column densities derived from car-MAX-DOAS observations, OMI satellite observations and the regional model CHIMERE during two MEGAPOLI campaigns in Paris 2009/10, Atmos. Meas. Tech., 8, 2827–2852, https://doi.org/10.5194/amt-8-2827-2015, 2015. a, b
Simpson, D., Benedictow, A., Berge, H., Bergström, R., Emberson, L. D., Fagerli, H., Flechard, C. R., Hayman, G. D., Gauss, M., Jonson, J. E., Jenkin, M. E., Nyíri, A., Richter, C., Semeena, V. S., Tsyro, S., Tuovinen, J.-P., Valdebenito, Á., and Wind, P.: The EMEP MSC-W chemical transport model – technical description, Atmos. Chem. Phys., 12, 7825–7865, https://doi.org/10.5194/acp-12-7825-2012, 2012. a, b, c, d
Simpson, D., Fagerli, H., Jonson, J., Tsyro, S., Wind, P., and Tuovinen, J.-P.: The EMEP Unified Eulerian Model. Model Description, EMEP MSC-W Report 1/2003, The Norwegian Meteorological Institute, Oslo, Norway, 2003. a
Sofiev, M.: A model for the evaluation of long-term airborne pollution transport at regional and continental scales, Atmos. Environ., 34, 2481–2493, https://doi.org/10.1016/S1352-2310(99)00415-X, 2000. a
Sofiev, M., Siljamo, P., Valkama, I., Ilvonen, M., and Kukkonen, J.: A dispersion modelling system SILAM and its evaluation against ETEX data, Atmos. Environ., 40, 674–685, https://doi.org/10.1016/j.atmosenv.2005.09.069, 2006. a
Sofiev, M., Vira, J., Kouznetsov, R., Prank, M., Soares, J., and Genikhovich, E.: Construction of the SILAM Eulerian atmospheric dispersion model based on the advection algorithm of Michael Galperin, Geosci. Model Dev., 8, 3497–3522, https://doi.org/10.5194/gmd-8-3497-2015, 2015. a
Solazzo, E., Bianconi, R., Vautard, R., Appel, K. W., Moran, M. D., Hogrefe, C., Bessagnet, B., Brandt, J., Christensen, J. H., Chemel, C., Coll, I., Denier van der Gon, H., Ferreira, J., Forkel, R., Francis, X. V., Grell, G., Grossi, P., Hansen, A. B., Jeričević, A., Kraljević, L., Miranda, A. I., Nopmongcol, U., Pirovano, G., Prank, M., Riccio, A., Sartelet, K. N., Schaap, M., Silver, J. D., Sokhi, R. S., Vira, J., Werhahn, J., Wolke, R., Yarwood, G., Zhang, J., Rao, S. T., and Galmarini, S.: Model Evaluation and Ensemble Modeling of Surface-Level Ozone in Europe and North America in the Context of the AQMEII, Atmos. Environ., 53, 60–74, 2012. a, b
Stammes, P.: Spectral radiance modeling in the UV-visible range, in: IRS 2000: Current Problems in Atmospheric Radiation, edited by: Smith, W. and Timofeyev, Y. A. Deepak, Hampton, Va, 385–388, 2001. a
Stockwell, W., Kirchner, F., Kuhn, M., and Seefeld, S.: A new mechanism for regional atmospheric chemistry modeling, J. Geophys. Res., 102, 25847–25879, 1997. a
Takashima, H., Irie, H., Kanaya, Y., and Syamsudin, F.: NO2 observations over the western Pacific and Indian Ocean by MAX-DOAS on Kaiyo, a Japanese research vessel, Atmos. Meas. Tech., 5, 2351–2360, https://doi.org/10.5194/amt-5-2351-2012, 2012. a
Thunis, P., Cuvelier, C., Roberts, P., White, L., Stern, R., Kerschbaumer, A., Bessagnet, B., Bergström, R., and Schaap, M.: EURODELTA: Evaluation of a Sectoral Approach to Integrated Assessment Modelling- Second Report, in: EUR-Scientific and Technical Research Series-24474 EN-2010, Publications Office of the European Union, Luxembourg, ISSN 1018-5593, 2010. a
Valin, L. C., Russell, A. R., Hudman, R. C., and Cohen, R. C.: Effects of model resolution on the interpretation of satellite NO2 observations, Atmos. Chem. Phys., 11, 11647–11655, https://doi.org/10.5194/acp-11-11647-2011, 2011. a
Valks, P., Pinardi, G., Richter, A., Lambert, J.-C., Hao, N., Loyola, D., Van Roozendael, M., and Emmadi, S.: Operational total and tropospheric NO2 column retrieval for GOME-2, Atmos. Meas. Tech., 4, 1491–1514, https://doi.org/10.5194/amt-4-1491-2011, 2011. a
Vautard, R., Schaap, M., Bergström, R., Bessagnet, B., Brandt, J., Builtjes, P. J. H., Christensen, J. H., Cuvelier, K., Foltescu, V., Graff, A., Kerschbaumer, A., Krol, M., Roberts, P., Rouil, L., Stern, R., Tarrasón, L., Thunis, P., Vignati, E., and Wind, P.: Skill and uncertainty of a regional air quality model ensemble, Atmos. Environ., 43, 4822–4832, https://doi.org/10.1016/j.atmosenv.2008.09.083, 2009. a, b
Vira, J. and Sofiev, M.: Assimilation of surface NO2 and O3 observations into the SILAM chemistry transport model, Geosci. Model Dev., 8, 191–203, https://doi.org/10.5194/gmd-8-191-2015, 2015. a, b
Vlemmix, T., Eskes, H. J., Piters, A. J. M., Schaap, M., Sauter, F. J., Kelder, H., and Levelt, P. F.: MAX-DOAS tropospheric nitrogen dioxide column measurements compared with the Lotos-Euros air quality model, Atmos. Chem. Phys., 15, 1313–1330, https://doi.org/10.5194/acp-15-1313-2015, 2015. a, b, c, d
Wagner, T., Beirle, S., Brauers, T., Deutschmann, T., Frieß, U., Hak, C., Halla, J. D., Heue, K. P., Junkermann, W., Li, X., Platt, U., and Pundt-Gruber, I.: Inversion of tropospheric profiles of aerosol extinction and HCHO and NO2 mixing ratios from MAX-DOAS observations in Milano during the summer of 2003 and comparison with independent data sets, Atmos. Meas. Tech., 4, 2685–2715, https://doi.org/10.5194/amt-4-2685-2011, 2011. a
Wang, T., Hendrick, F., Wang, P., Tang, G., Clémer, K., Yu, H., Fayt, C., Hermans, C., Gielen, C., Müller, J.-F., Pinardi, G., Theys, N., Brenot, H., and Van Roozendael, M.: Evaluation of tropospheric SO2 retrieved from MAX-DOAS measurements in Xianghe, China, Atmos. Chem. Phys., 14, 11149–11164, https://doi.org/10.5194/acp-14-11149-2014, 2014. a, b
Watson, L. , Lacressonnière, G., Gauss, M., Engardt, M., Andersson, C., Josse, B., Marécal, V., Nyiri, A., Sobolowski, S., Siour, G., Szopa, S., and Vautard, R.: The impact of emissions and +2 ∘C climate change upon future ozone and nitrogen dioxide over Europe, Atmos. Environ., 142, 271–285, 2016. a
Whitten, G. Z., Hogo, H., and Killus, J. P.: The Carbon-Bond Mechanism : A Condensed Kinetic Mechanism for Photochemical Smog, Environ. Sci., 14, 690–700, https://doi.org/10.1021/es60166a008, 1980. a
Wiedinmyer, C., Akagi, S. K., Yokelson, R. J., Emmons, L. K., Al-Saadi, J. A., Orlando, J. J., and Soja, A. J.: The Fire INventory from NCAR (FINN): a high resolution global model to estimate the emissions from open burning, Geosci. Model Dev., 4, 625–641, https://doi.org/10.5194/gmd-4-625-2011, 2011. a
Wittrock, F.: The retrieval of oxygenated volatile organic compounds by remote sensing techniques, PhD, University of Bremen, Bremen, Germany, available at: http://www.doas-bremen.de/paper/diss_wittrock_06.pdf (last access: 10 February 2020), 2006. a
Wittrock, F., Oetjen, H., Richter, A., Fietkau, S., Medeke, T., Rozanov, A., and Burrows, J. P.: MAX-DOAS measurements of atmospheric trace gases in Ny-Ålesund – Radiative transfer studies and their application, Atmos. Chem. Phys., 4, 955–966, https://doi.org/10.5194/acp-4-955-2004, 2004. a
Zyryanov, D., Foret, G., Eremenko, M., Beekmann, M., Cammas, J.-P., D'Isidoro, M., Elbern, H., Flemming, J., Friese, E., Kioutsioutkis, I., Maurizi, A., Melas, D., Meleux, F., Menut, L., Moinat, P., Peuch, V.-H., Poupkou, A., Razinger, M., Schultz, M., Stein, O., Suttie, A. M., Valdebenito, A., Zerefos, C., Dufour, G., Bergametti, G., and Flaud, J.-M.: 3-D evaluation of tropospheric ozone simulations by an ensemble of regional Chemistry Transport Model, Atmos. Chem. Phys., 12, 3219–3240, https://doi.org/10.5194/acp-12-3219-2012, 2012. a