the Creative Commons Attribution 4.0 License.
the Creative Commons Attribution 4.0 License.
 | 04 Mar 2020
Kinetic and mechanistic study of the reaction between methane sulfonamide (CH3S(O)2NH2) and OH
Matias Berasategui
Damien Amedro
Achim Edtbauer
Jonathan Williams
Jos Lelieveld
Methane sulfonamide (MSAM), CH3S(O)2NH2, was recently detected for the first time in ambient air over the Red Sea and the Gulf of Aden where peak mixing ratios of ≈60 pptv were recorded. Prior to this study the rate constant for its reaction with the OH radical and the products thereby formed were unknown, precluding assessment of its role in the atmosphere. We have studied the OH-initiated photo-oxidation of MSAM in air (298 K, 700 Torr total pressure) in a photochemical reactor using in situ detection of MSAM and its products by Fourier transform infrared (FTIR) absorption spectroscopy. The relative rate technique, using three different reference compounds, was used to derive a rate coefficient of . The main end products of the photo-oxidation observed by FTIR were CO2, CO, SO2, and HNO3 with molar yields of (0.73±0.11), (0.28±0.04), (0.96±0.15), and (0.62±0.09), respectively. N2O and HC(O)OH were also observed in smaller yields of (0.09±0.02) and (0.03±0.01). Both the low rate coefficient and the products formed are consistent with hydrogen abstraction from the −CH3 group as the dominant initial step. Based on our results MSAM has an atmospheric lifetime with respect to loss by reaction with OH of about 80 d.
- Article
(2461 KB) - Full-text XML
-
Supplement
(594 KB) - BibTeX
- EndNote


Natural emissions of organosulfur compounds from phytoplankton comprise up to 60 % of the total sulfur flux into the marine boundary layer (Andreae, 1990; Bates et al., 1992; Spiro et al., 1992), and in remote oceanic areas they are the main source of climatically active sulfate aerosols, which can influence the radiation balance at the earth's surface (Charlson et al., 1987; Andreae and Crutzen, 1997). The main organosulfur trace gases in the marine boundary layer are dimethyl sulfide (CH3SCH3, DMS) and its oxidation products dimethyl sulfoxide (DMSO), dimethyl sulfone (DMSO2), methyl sulfonic acid (MSA), and methyl sulfinic acid (MSI) for which atmospheric lifetimes with respect to their degradation by the OH radical vary between hours (DMS) and several weeks (DMSO2).
Recently, the first detection of methane sulfonamide (CH3S(O)2NH2, MSAM) in ambient air was made during the Air Quality and Climate Change in the Arabian Basin (AQABA-2017) campaign. Mixing ratios of MSAM approached 60 pptv over the Arabian Sea; details of these measurements and a discussion of the likely sources of MSAM in these regions are given in a companion paper (Edtbauer et al., 2019). As MSAM had not been considered to be an atmospheric trace gas prior to the observations of Edtbauer et al. (2019), there have been no laboratory studies to investigate either its spectroscopy or the kinetics of its reactions with atmospheric radicals, such as OH, so that its atmospheric lifetime and the products formed during its degradation in air were unknown. Combining carbon, nitrogen, sulfur, and oxygen in a single, small molecule, MSAM is an intriguing species not only as an atmospheric trace gas but also from a spectroscopic and kinetic perspective. Unlike basic alkyl amines such as, for example, CH3NH2, MSAM contains an acidic −NH2 group (Remko, 2003).
This work presents the first kinetic and mechanistic study of the OH-induced oxidation of MSAM in air. A reaction mechanism is proposed that, through numerical simulation, describes the time-dependent formation of the end products we observed. From these results, we calculate the lifetime and the likely role of MSAM in the atmosphere.
2.1 Experimental set-up
The experimental set-up used to study the reaction of OH with MSAM has been described in detail previously (Crowley et al., 1999; Bunkan et al., 2018). Briefly, the reaction vessel was a 44.39 L cylindrical quartz-wall chamber equipped with a White-type multiple-reflection mirror system resulting in an 86.3 m optical path length for absorption spectroscopy in the infrared. The quartz reactor was at room temperature (296±2 K) and for most experiments at 700 Torr total pressure (1 Torr=1.333 hPa) using synthetic air bath gas. Six external, radially mounted, low-pressure Hg lamps emitting mainly at 253.65 nm provided a homogeneous light flux within the reactor for radical generation. A 1000 Torr capacitance manometer was used to measure the pressure inside the reactor.
MSAM and other gases used to generate OH (see below) were mixed in a glass vacuum line which was connected directly to the reaction chamber by a PTFE piping. Two capacitance manometers (10 and 100 Torr ranges) were used to accurately measure pressures in the vacuum line. Crystalline MSAM melts at 363 K and has a boiling point of approximately 453 K and an unknown vapour pressure (<0.02 Torr) at room temperature. Owing to its low vapour pressure, MSAM was eluted into the reaction chamber by flowing synthetic air (450 cm3 STP min−1, sccm) through a finger containing crystalline MSAM warmed to 333 K and subsequently through a cold trap at 298 K (to prevent condensation downstream). This way we could ensure that the saturation vapour pressure of MSAM at 298 K was achieved. In initial experiments without the trap we observed extra absorption features, which could be assigned to a dimer of MSAM (see below).
Gas-phase infrared spectra in the range of 4000–600 cm−1 were recorded with a resolution of 2 cm−1 from 16 co-added interferograms (128 scans for the background) using a Fourier transform infrared (FTIR) spectrometer (Bruker Vector 22) equipped with an external photoconductive mercury–cadmium–telluride (MCT) detector cooled to liquid nitrogen temperature. OPUS software was used to analyse and manipulate the IR spectra. Interferograms were phase-corrected (Mertz) and Boxcar apodized with a zero-filling factor of 4. Most of the products obtained (CO2, CO, HC(O)OH, HNO3, and SO2) were identified and quantified from the IR reference spectra of pure samples under similar experimental conditions (700 Torr and 298.2 K, Fig. S1 in the Supplement).
The low vapour pressure of MSAM precluded accurate dosing into the chamber and thus generation of a calibration spectrum. In order to calibrate the infrared absorption features of MSAM, we oxidized it in air and then conducted a sulfur and nitrogen balance of the products. As discussed below, the only sulfur-containing product detected from MSAM degradation was SO2 (which can easily be calibrated), and the only nitrogen-containing products were HNO3 and N2O, which can also be calibrated. Experiments in which MSAM was almost completely converted to known amounts of SO2, HNO3, and N2O thus provided an indirect calibration (via assumption of 100 % sulfur or nitrogen balance) of its concentration and thus IR cross sections.
2.2 Generation of OH
OH was generated by the 254 nm photolysis of O3 in the presence of H2.
Further reactions that cycle OH and HO2 (e.g. OH+H2, H+O3, HO2+O3) are listed in Table S1 in the Supplement.
In a typical experiment, the starting concentrations of O3 and H2 were and . As described previously (Bunkan et al., 2018), this scheme generates not only OH radicals but also via, for example, Reaction (R3) HO2. HO2 is not expected to react with MSAM but will influence the course of secondary reactions in this system (e.g. by reacting with organic peroxy radicals) and thus the end-product distribution, as described in detail in Sect. 3.5. Simulations of the radical concentrations when generating OH in this manner indicate that the HO2∕OH ratio is approximately 30, with individual concentrations of HO2 and 3×10⁹ OH.
As an OH source, the photolysis of O3 in the presence of H2 has the advantage over other photochemical sources (e.g. photolysis of H2O2, HONO, or CH3ONO) that neither H2 nor O3 has strong absorption features in the infrared, resulting in a less cluttered spectrum which simplifies retrieval of concentration–time profiles of reactants and products.
2.3 Chemicals
A commercially available sample of methane sulfonamide (Alfa Aesar, >98 %) was used. O3 was generated by flowing synthetic air (Westfalen) through a stainless-steel tube that housed a low-pressure Hg lamp (PenRay) emitting at 184.95 nm. Synthetic air (Westfalen, 99.999 %), H2 (Westfalen, 99.999 %), CO2 (Westfalen 99.995 %), CO (Westfalen, 99.997 %), SO2 (Air Liquide, 1 ppmv in air), and HC(O)OH (Sigma Aldrich) were obtained commercially. Anhydrous nitric acid was prepared by mixing KNO3 (Sigma Aldrich, 99 %) and H2SO4 (Roth, 98 %) and condensing HNO3 vapour into a liquid nitrogen trap.
2.4 Relative rate constant determination
The rate constant (k4) of the reaction between OH and CH3SO2NH2 (Reaction R4) was measured using the relative rate method using (in different experiments) formic acid (HC(O)OH), acetone (CH3C(O)CH3), and methanol (CH3OH) as reference compounds.
Relative rate constants were derived by monitoring the depletion of one or more IR features of MSAM relative to those of the reference compounds. The following expression links the depletion factors (e.g. ln ([MSAM]0∕[MSAM]t)) to the relative rate coefficient:
where [MSAM]0, [MSAM]t, [ref]0, and [ref]t are the concentrations of MSAM and reference compound at times 0 and t; k4 and kref are the rate constants for reactions of OH with the MSAM and reference, respectively. As only relative changes in the IR signal are used in the analysis, absolute concentrations are not required as long as the absorption features used display a linear relation with concentration. Plots of ln ([MSAM]0∕[MSAM]t) versus ln ([ref]0∕[ref]t) should therefore be linear, pass through the origin, and have a slope of k4∕kref. The experimental procedure consisted of filling the cell with a mixture of MSAM∕reference∕O3∕H2∕N2 and allowing it to mix (5–10 min) prior to subjecting the mixture to 253.65 nm radiation whilst monitoring IR features at 3–5 min intervals.
This analysis inherently assumes that the only loss process for MSAM and the reference molecules is reaction with OH. Experiments in which the starting gas mixture was allowed to stand for several hours with no discernible loss of MSAM, formic acid, methanol, or acetone confirmed that none of these gases are lost to the wall or react with O3 to a significant extent. From observation of MSAM and O3 mixtures, we were able to derive an upper limit for the reaction of MSAM with O3 of .
3.1 Vibrational characterization of CH3SO2NH2
The experimental, infrared absorption spectrum of MSAM (Fig. 1) shows characteristic bands corresponding to SO2 stretching vibrations at 1385 and 1172 cm−1, the NH2 wagging vibration at 857 cm−1, stretching vibrations at 3476 and 3380 cm−1, bending at 1551 cm−1, and the CH3 wagging band at 976 cm−1. Assignment of the infrared features (Table 1) was made by comparison with a theoretical spectrum calculated using density functional theory (DFT) at the B3LYP/6-311G(3d,2p) and B3LYP/aug-cc-pVTZ-pp levels of theory for the vibrational characterization of MSAM in the gas phase. These basis sets should be sufficient to describe the relative energies for the isomers. Harmonic vibrational frequencies and zero-point energies (ZPEs) were calculated at these levels of theory to check whether the stationary points obtained were either isomers or first-order transition states (all calculated conformers had only real frequencies). The high-accuracy energy method Gaussian 04 with Møller–Plesset expansion truncated at the second order (G4MP2) was also used for the calculation of the barrier energies. The determination of the Hessian matrix also enabled the calculation of the thermochemical quantities for the conformers at 298.15 K. All symmetry restrictions were turned off in the calculations. All calculations were run with the Gaussian 09 program package (Frisch, 2009). Assuming that the point group for the molecule is Cs, all 24 fundamental modes should be both IR and Raman active, 14 of them belonging to A′ representation and 10 to A′′. All the vibrational frequencies are real and positive. The assignments in Table 1 were made from an evaluation of the normal-mode displacement vectors; as many of the modes are strongly coupled, this information is rather subjective. The frequencies of the absorption bands of the theoretical spectrum displayed in Fig. 1 were adjusted by a scaling factor of 0.968±0.019 recommended for the B3LYP/aug-cc-pVTZ level of theory (column “ratio” in Table 1) (Halls et al., 2001).
Table 1Experimental and calculated vibrational wavenumbers for MSAM.
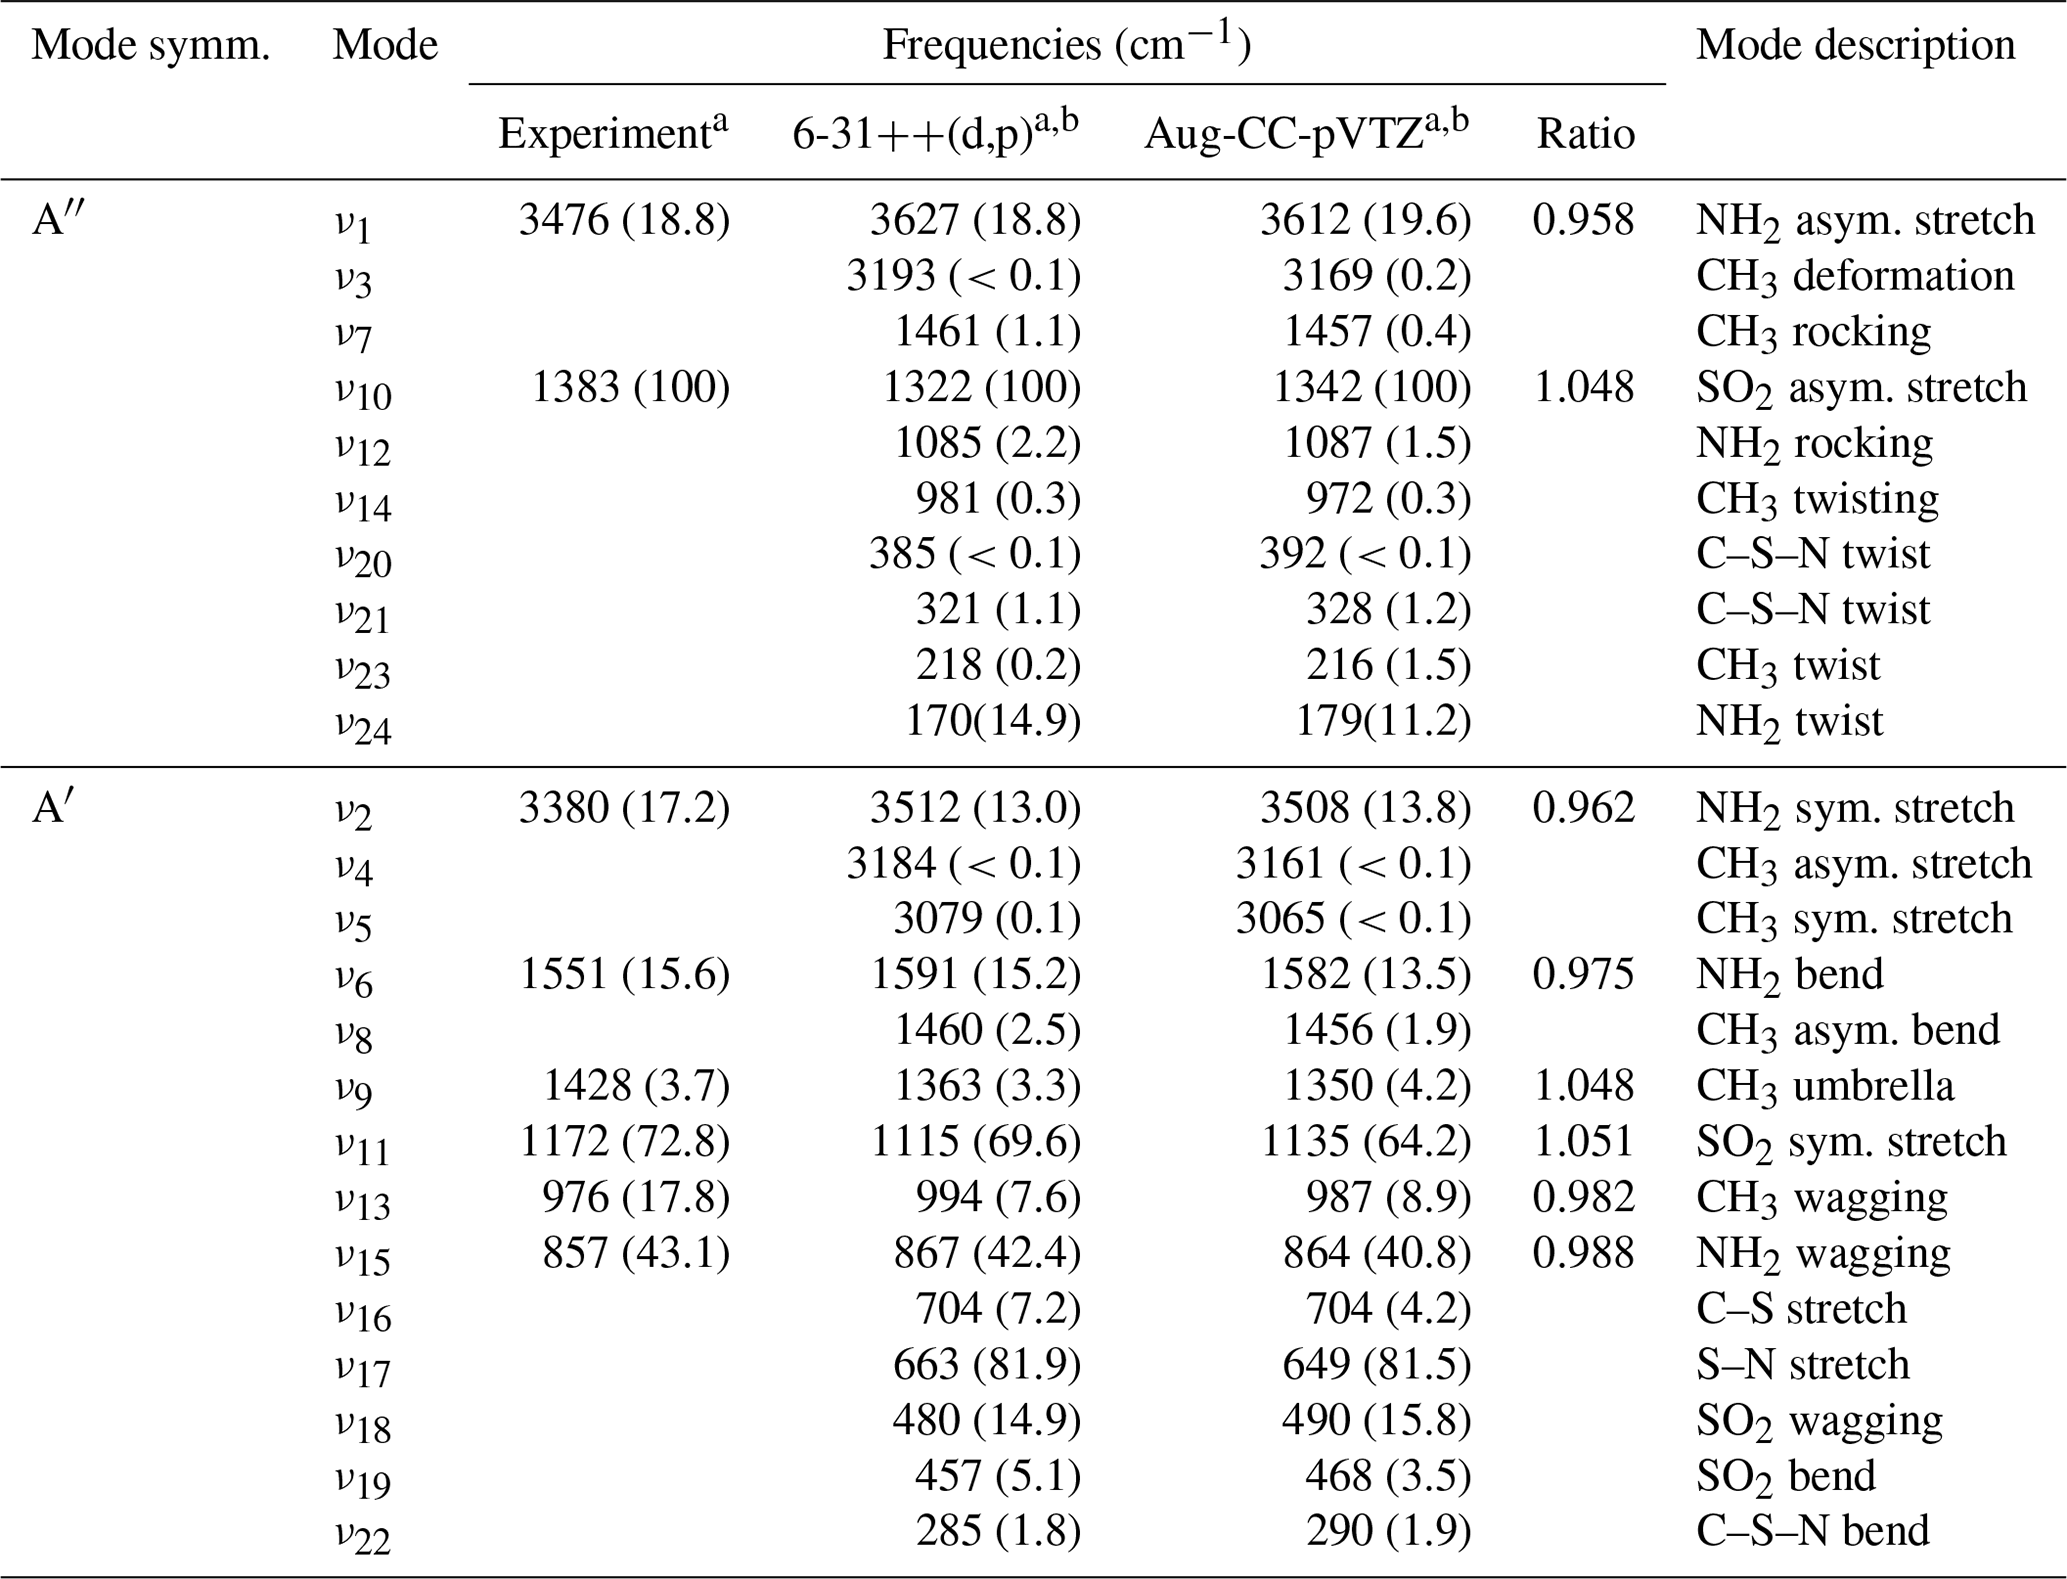
a Relative absorbance at band maximum in parentheses. b Calculated using the B3LYP method.
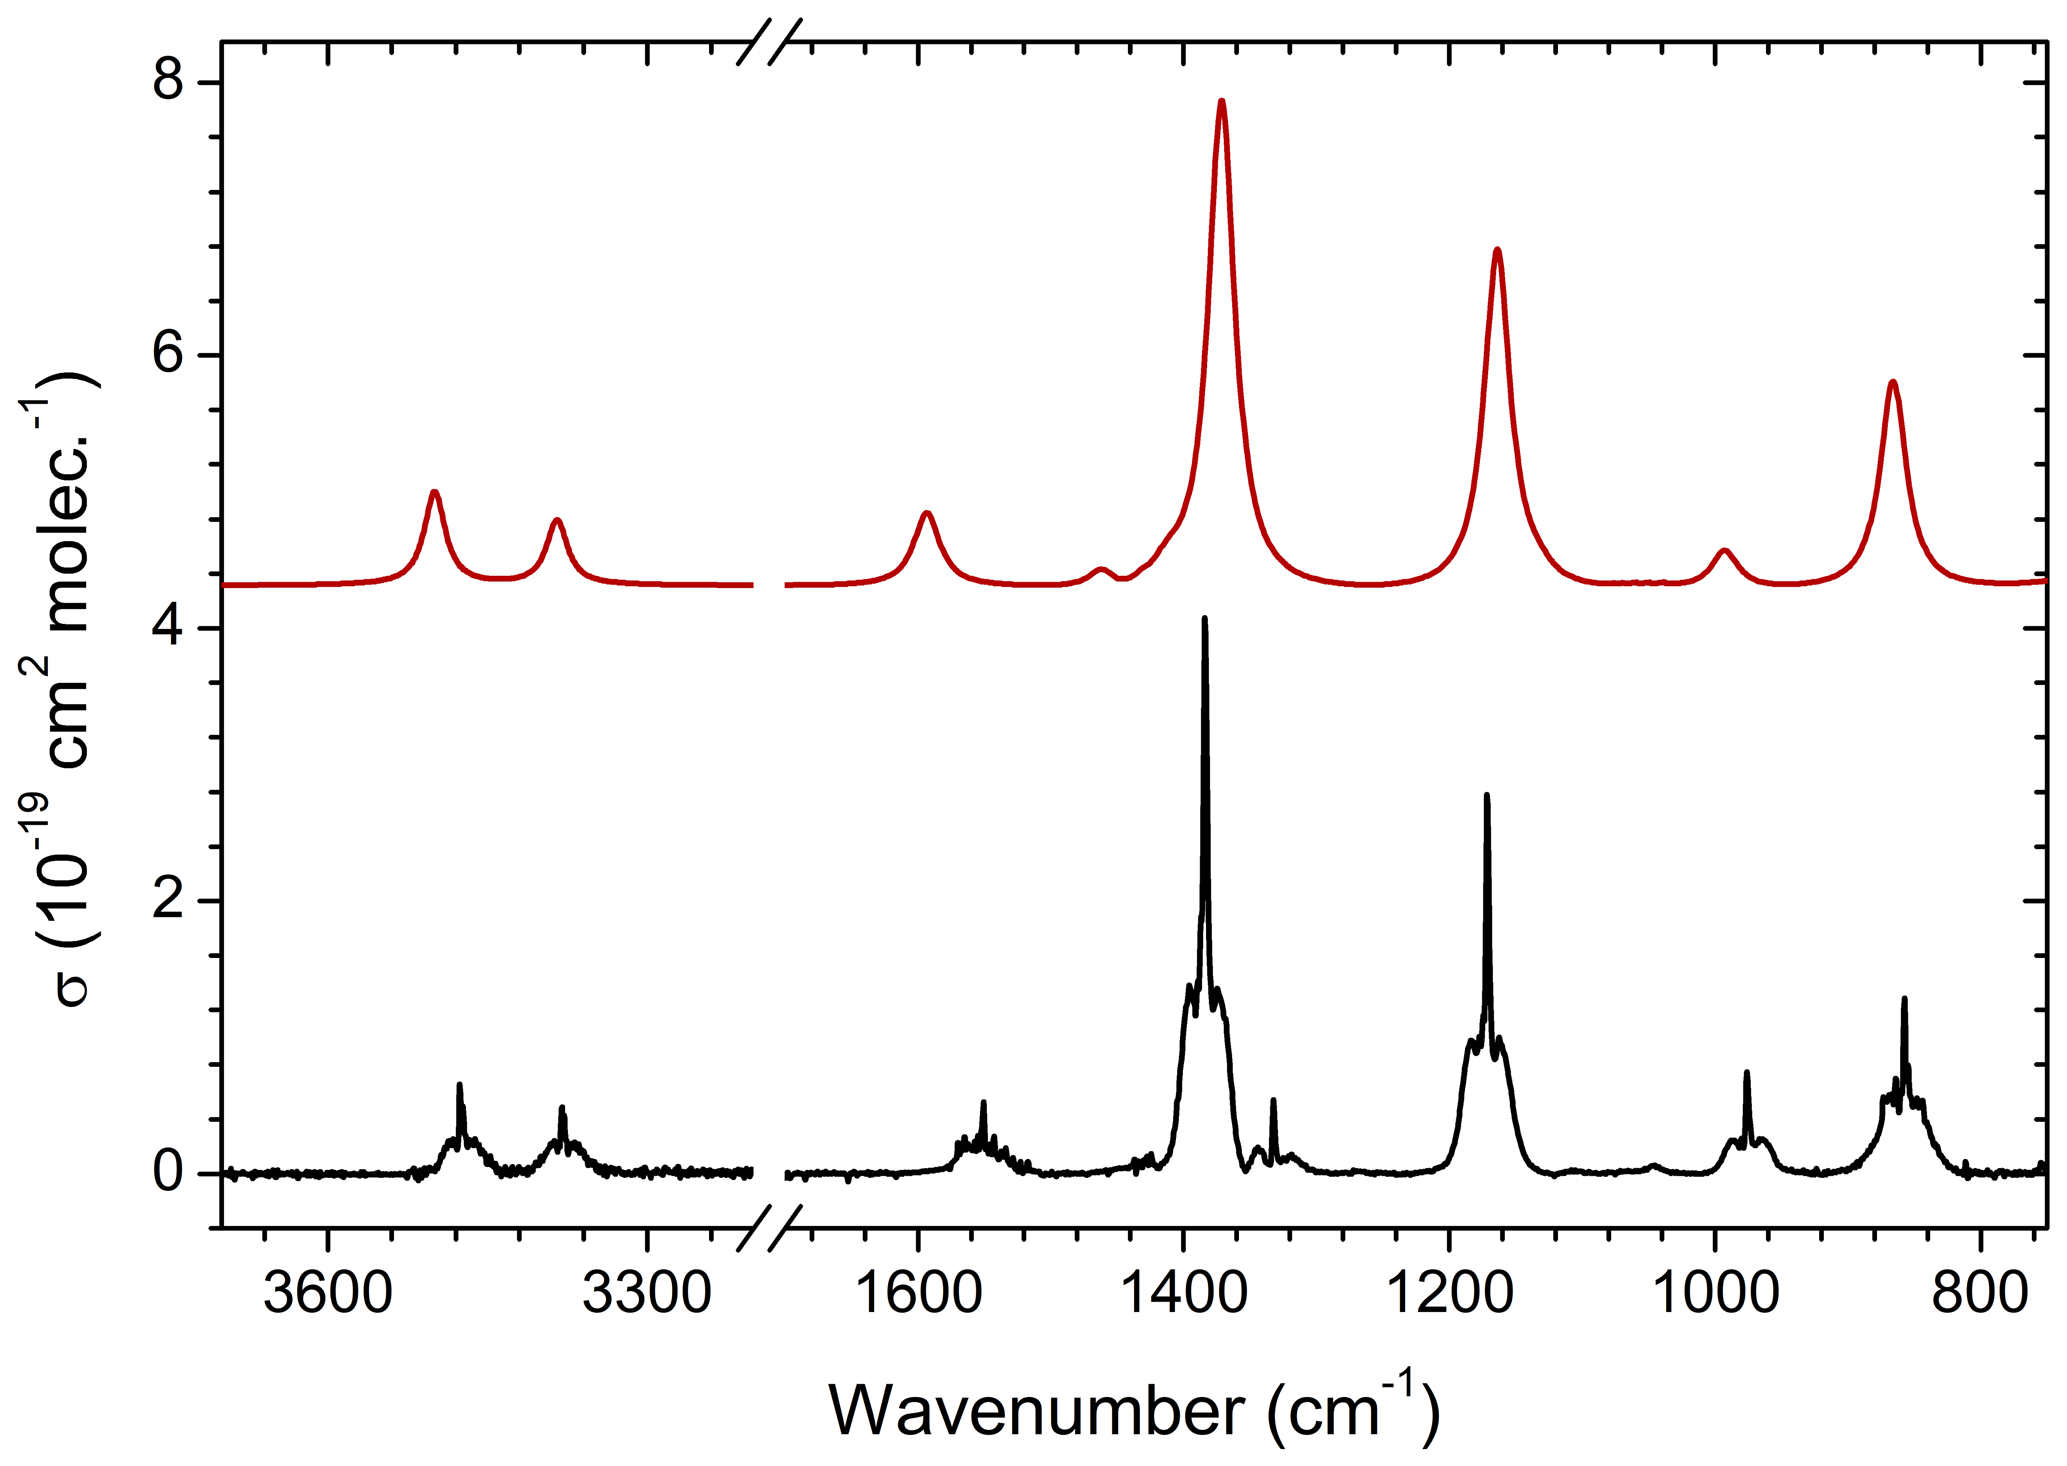
Figure 1Comparison of the experimental infrared absorption spectrum (black line) of MSAM () and the calculated spectrum at B3LYP/aug-cc-pVTZ-pp levels of theory (red line). The cross sections (σ) are in base e.
If the “cold trap” is removed, extra absorption bands originating from the MSAM dimer are observed. These slowly disappear with time as the condensation of the low-volatility dimer to the reactor surfaces takes place. Figure S1 shows the IR spectra of the dimer after the subtraction of the monomer. A complete characterization of the vibrational modes is presented in Table S1. According to our calculations, two hydrogen-bond interactions between the −HNH⋯OSO- are formed in the dimer which produce a bathochromic shift of the absorption bands. For each kinetic experiment we ensure that no dimer band is present in the initial spectrum.
3.2 Relative rate measurements: determination of k4
Once the concentrations of MSAM and the reference compound were stable (i.e. mixing in the chamber was complete) the photolysis lamps were switched on for a period of typically 1 h during which FTIR spectra (duration of ∼20 s) were obtained every few minutes. The concentrations of the reactants in each individual experiment can be found in Table 2. Figure 2 shows the loss of absorption features due to MSAM and the reference compound (in this case acetone) at different times during the experiment.
Table 2Rate coefficient ratios and experimental conditions for the relative rate experiments.
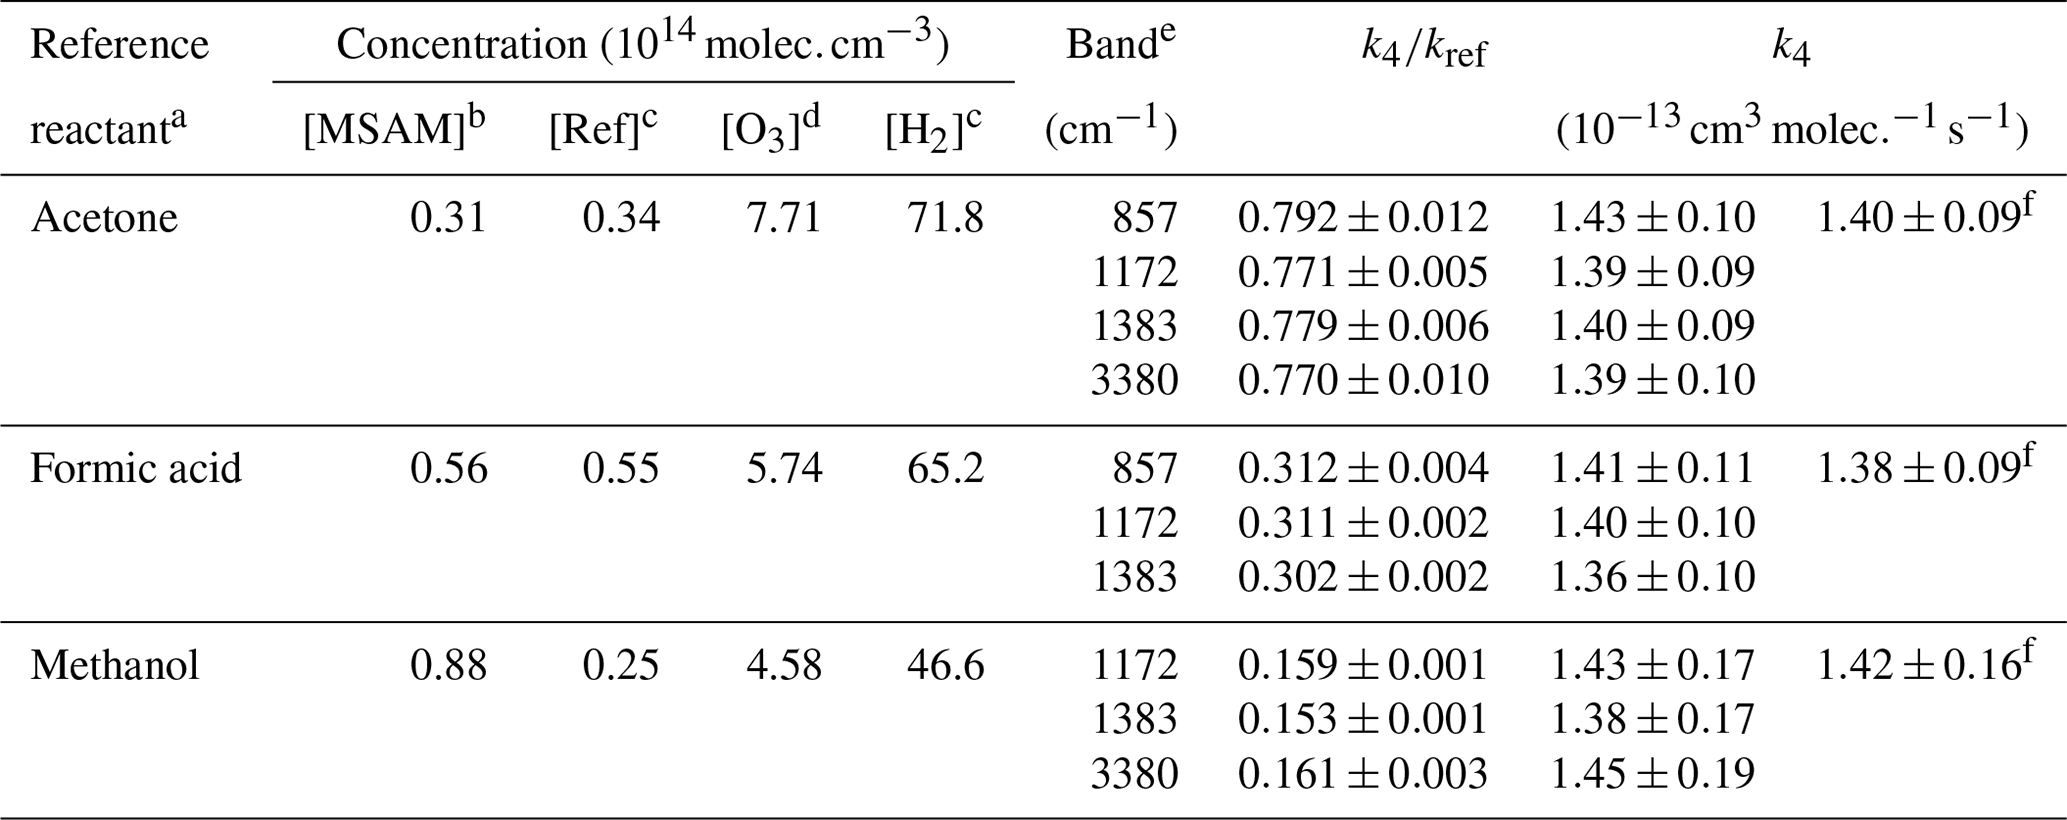
a Depletion of reference reactants monitored at 1221–1249, 1073–1133, and 2788–3070 cm−1 for acetone, formic acid, and methanol, respectively. b Concentration estimated from the absorption cross section reported in Fig. 1. c Concentration calculated from the measured pressures. d Concentration derived from the absorption cross section of O3. e IR absorption bands of MSAM used for the determination of the concentration change over time. f Relative rate constant obtained from the linear fitting of all the data and using , , and rate constants (IUPAC, 2019).
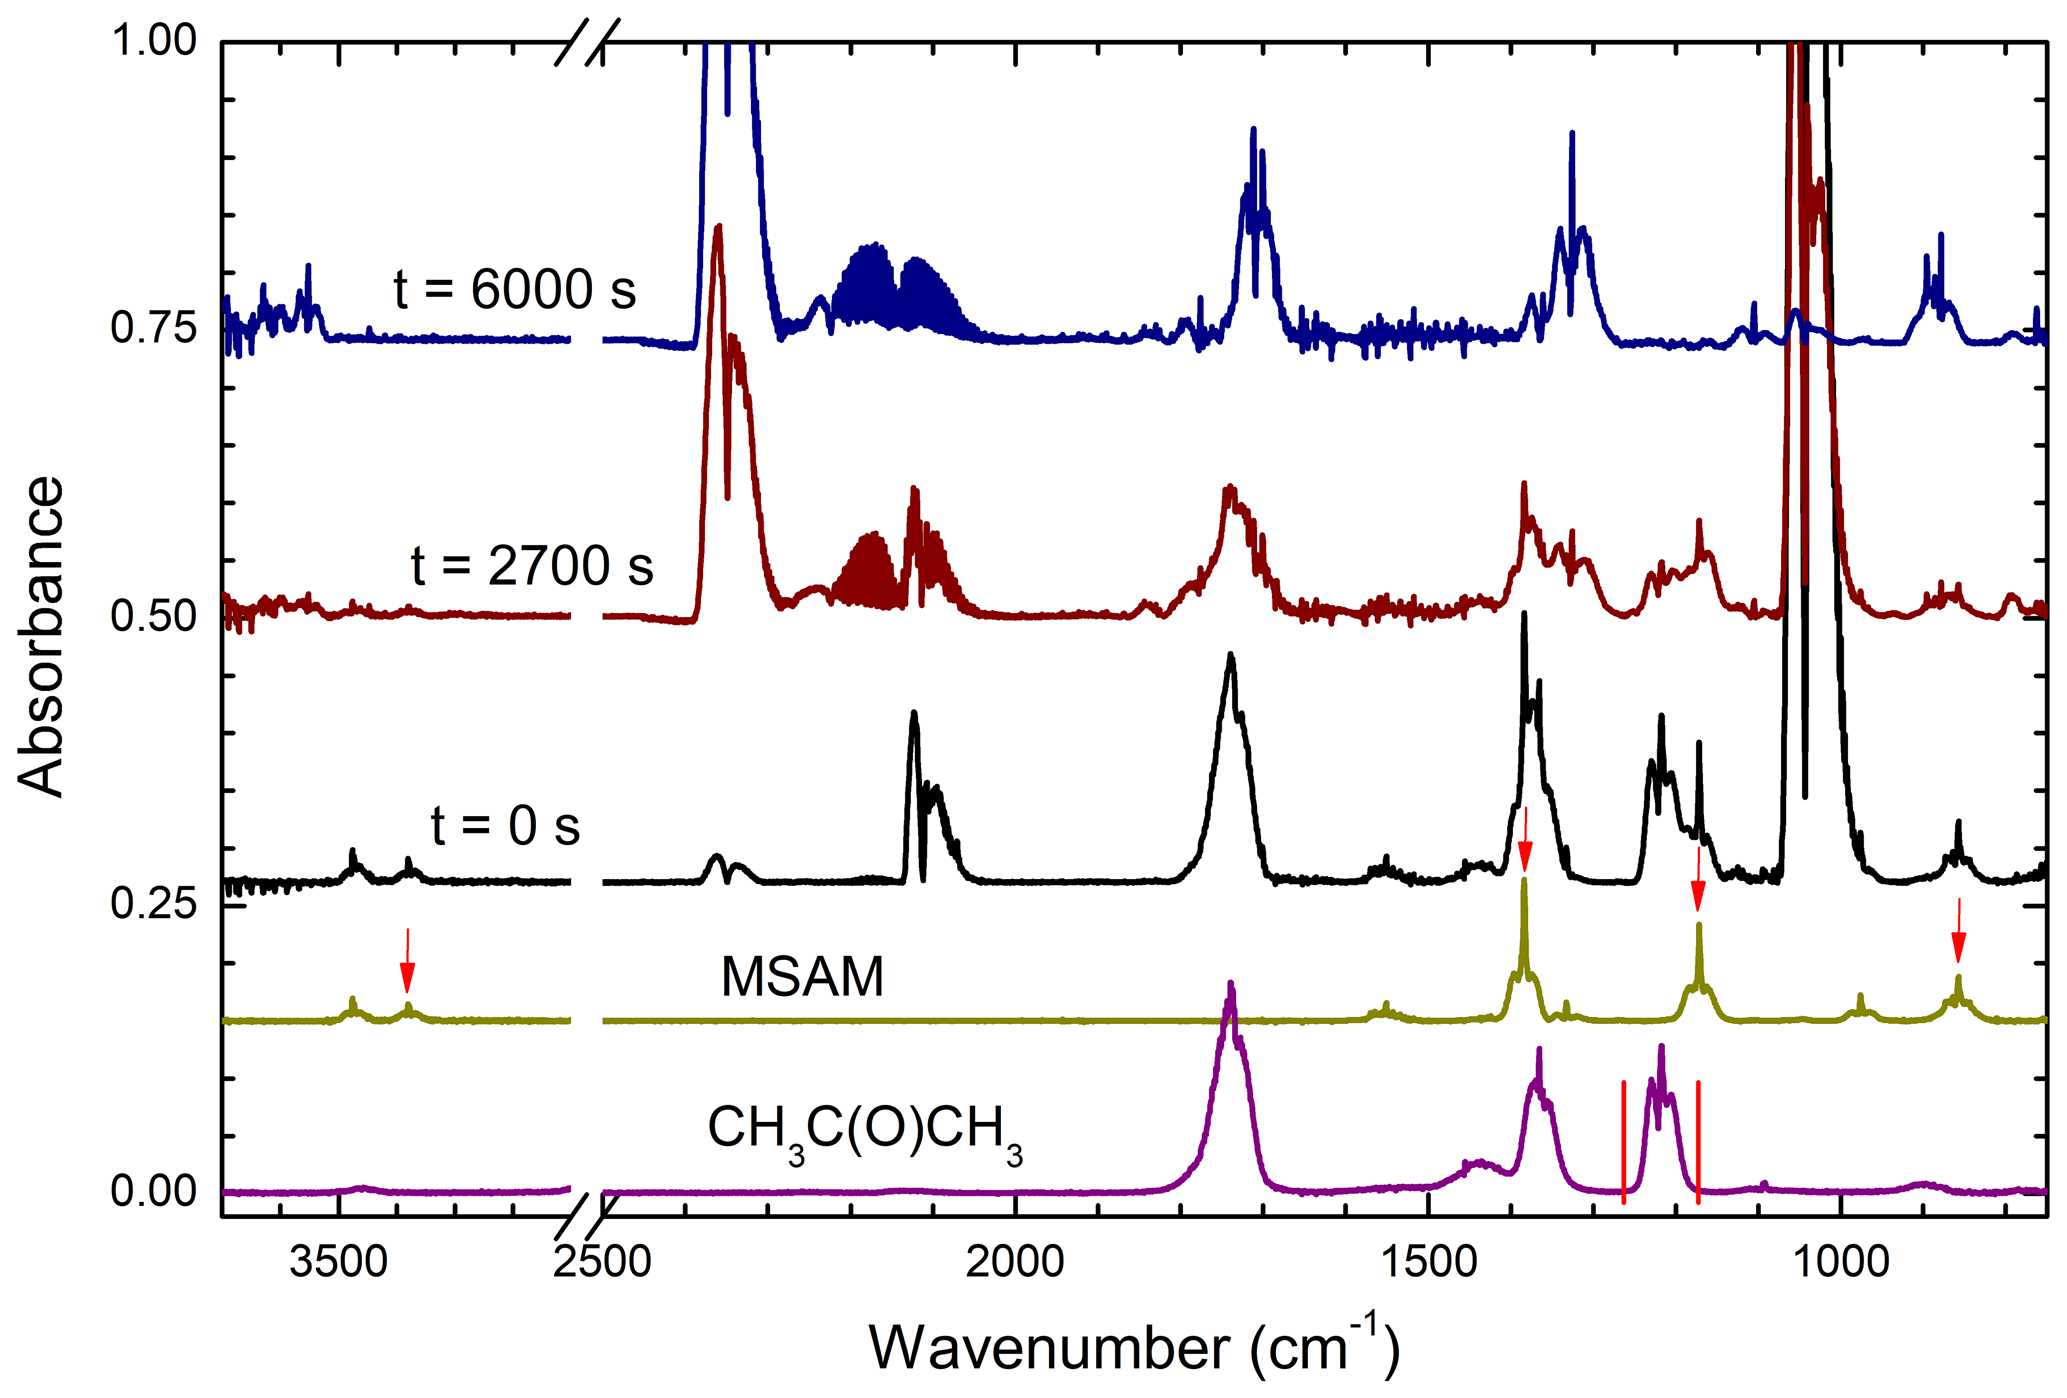
Figure 2Raw data from a relative rate experiment (using acetone as reference reactant) showing the gradual depletion of reactants and formation of products. The lower two spectra are reference spectra, indicating (red arrows and red min–max lines) which absorption features were used for the relative rate analysis. The strong absorption close to 2100 cm−1 at t=0 s is due to O3. CO2 and CO absorption bands are centred at ≈2350 and 2140 cm−1, respectively.
The depletion of MSAM was quantified by integrating the Q-branch of the 857, 1172, and 1383 cm−1 absorption bands and the complete absorption band at 3380 cm−1. The relative depletion of the MSAM absorption features agreed to within ∼ 5 %. Depletion of the reference gases was quantified by integrating their absorption bands at 1221–1249 cm−1 (acetone), 2788–3070 cm−1 (methanol), and 1073–1133 cm−1 (formic acid). An alternative analysis procedure, in which the relative depletion of MSAM was derived by scaling a reference spectrum of MSAM (e.g. that obtained prior to photolysis) to match those at various times after photolysis, was also used. The depletion factors thus obtained were indistinguishable from those using individual absorption features.
Figure 3 shows plots of the depletion factors for MSAM versus those of the three reference compounds following exposure to OH radicals in 700 Torr of synthetic air at 296 K. A linear least-squares analysis of the data gives rate constant ratios , , and where the quoted errors are 2 standard deviations. Table 2 summarizes the experimental conditions and the rate coefficient ratios obtained when using each MSAM absorption band. The difference between the rate coefficient ratios obtained for the three-absorption-band experiments is always less than 5 %. The rate constant ratios were placed on an absolute basis using evaluated rate coefficients (Atkinson et al., 2006; IUPAC, 2019) whereby , and . We derive values of k4 (relative to acetone) , k4 (relative to formic acid) , and k4 (relative to methanol) (where the uncertainties include uncertainty associated with the evaluated rate coefficients for k5, k6, and k7). The values of k4 obtained using the three different reference compounds are, within experimental uncertainties, identical, indicating the absence of significant systematic errors associated with the use of the reference reactants. We prefer the value of k4 from the experiment using acetone as reference. For acetone, the relative rate constant is close to unity and the rate coefficient for OH has been extensively studied and is associated with low uncertainty. The preferred value of the rate coefficient, k4, is where the uncertainty is 2σ.
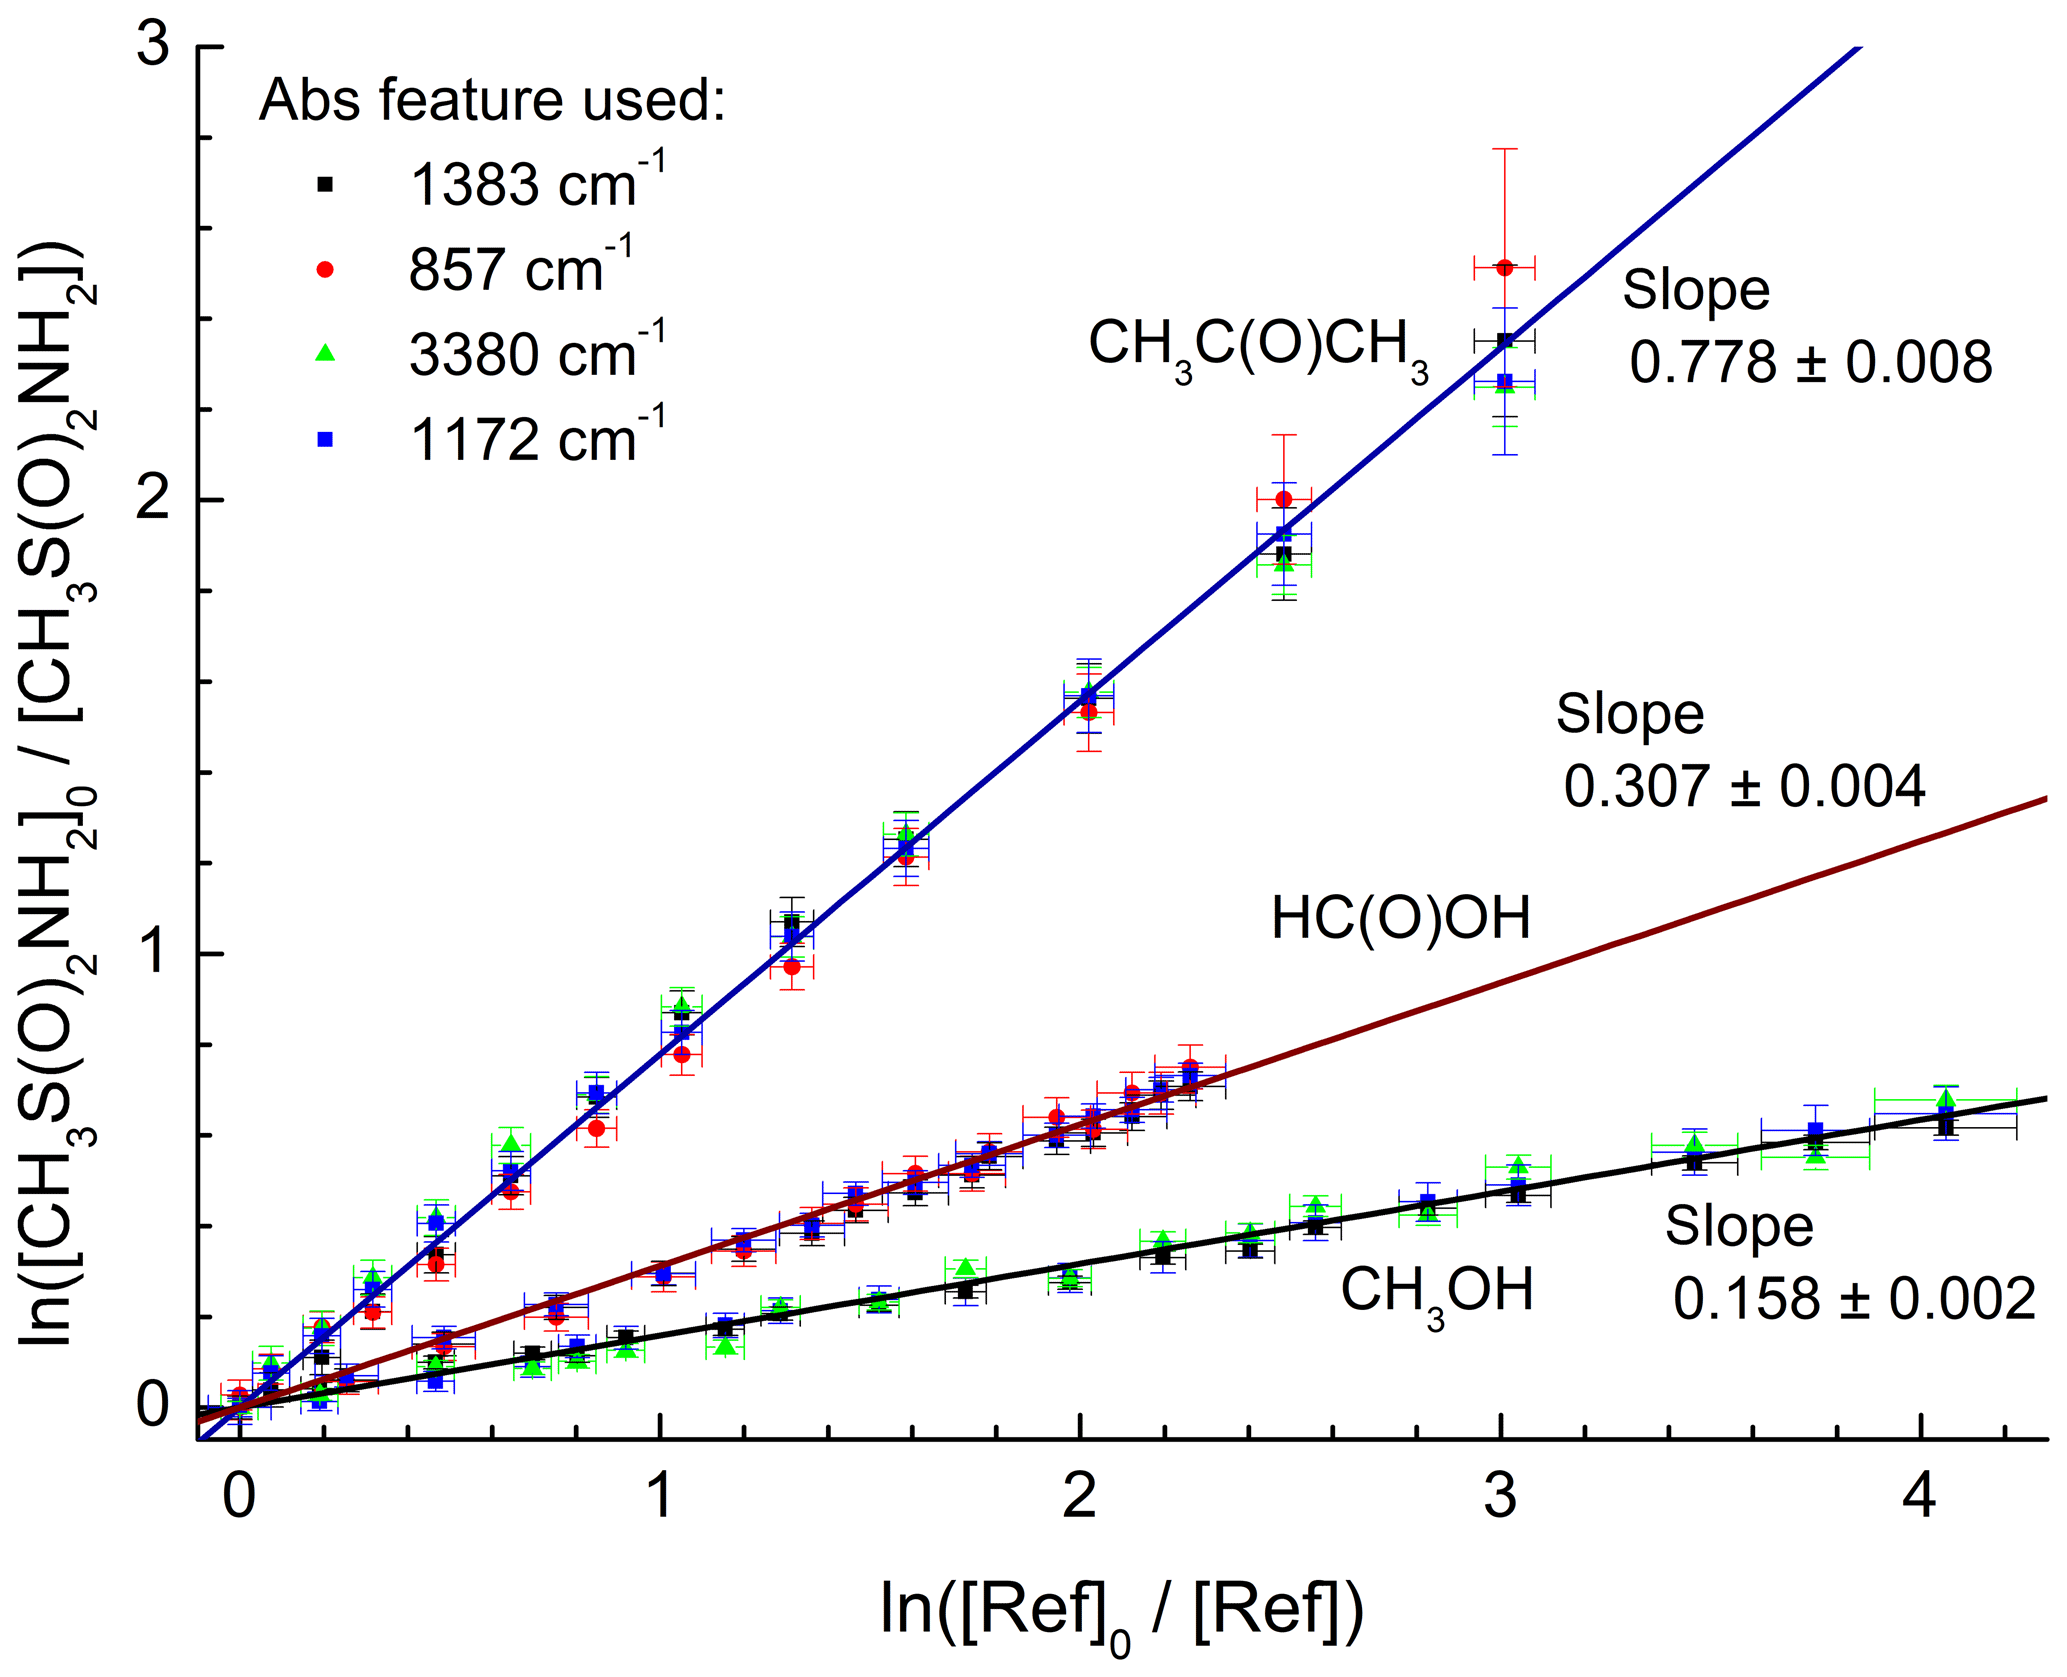
Figure 3Relative depletion factors for MSAM and the reference compounds CH3C(O)CH3, HC(O)OH, and CH3OH obtained at room temperature and a total pressure of 700 Torr of air. The different absorption bands of MSAM used in the analysis are indicated. The slopes are equal to the ratio of rate coefficients k4∕kref as defined in Eq. (1).
3.3 Product yields
In order to identify and quantify the end products of the title reaction in air, approximately of MSAM, of O3, and of H2 were loaded into the chamber at a total pressure of 700 Torr of synthetic air and 298 K. Subsequent to initiation of the reaction between OH and MSAM by switching the Hg lamps on, IR spectra (700–4000 cm−1) were taken at 300 s intervals.
Figure 4 shows the initial spectrum of the gas mixture with O3 bands at 903–1068 and 2064–2134 cm−1 (A), with the spectrum after 3000 s (B) showing depletion of MSAM and formation of products and the final products after the disappearance of the Q-branches (at 1172 and 1385 cm−1) of MSAM after 5700 s (C). The IR-absorption bands of water vapour have been subtracted from the spectra. Both CO2 (2387–2300 cm−1) and CO (2226–2050 cm−1) are observed from the photolysis of compounds adsorbed on the walls and surfaces of the cell, and they do not result solely from MSAM degradation.
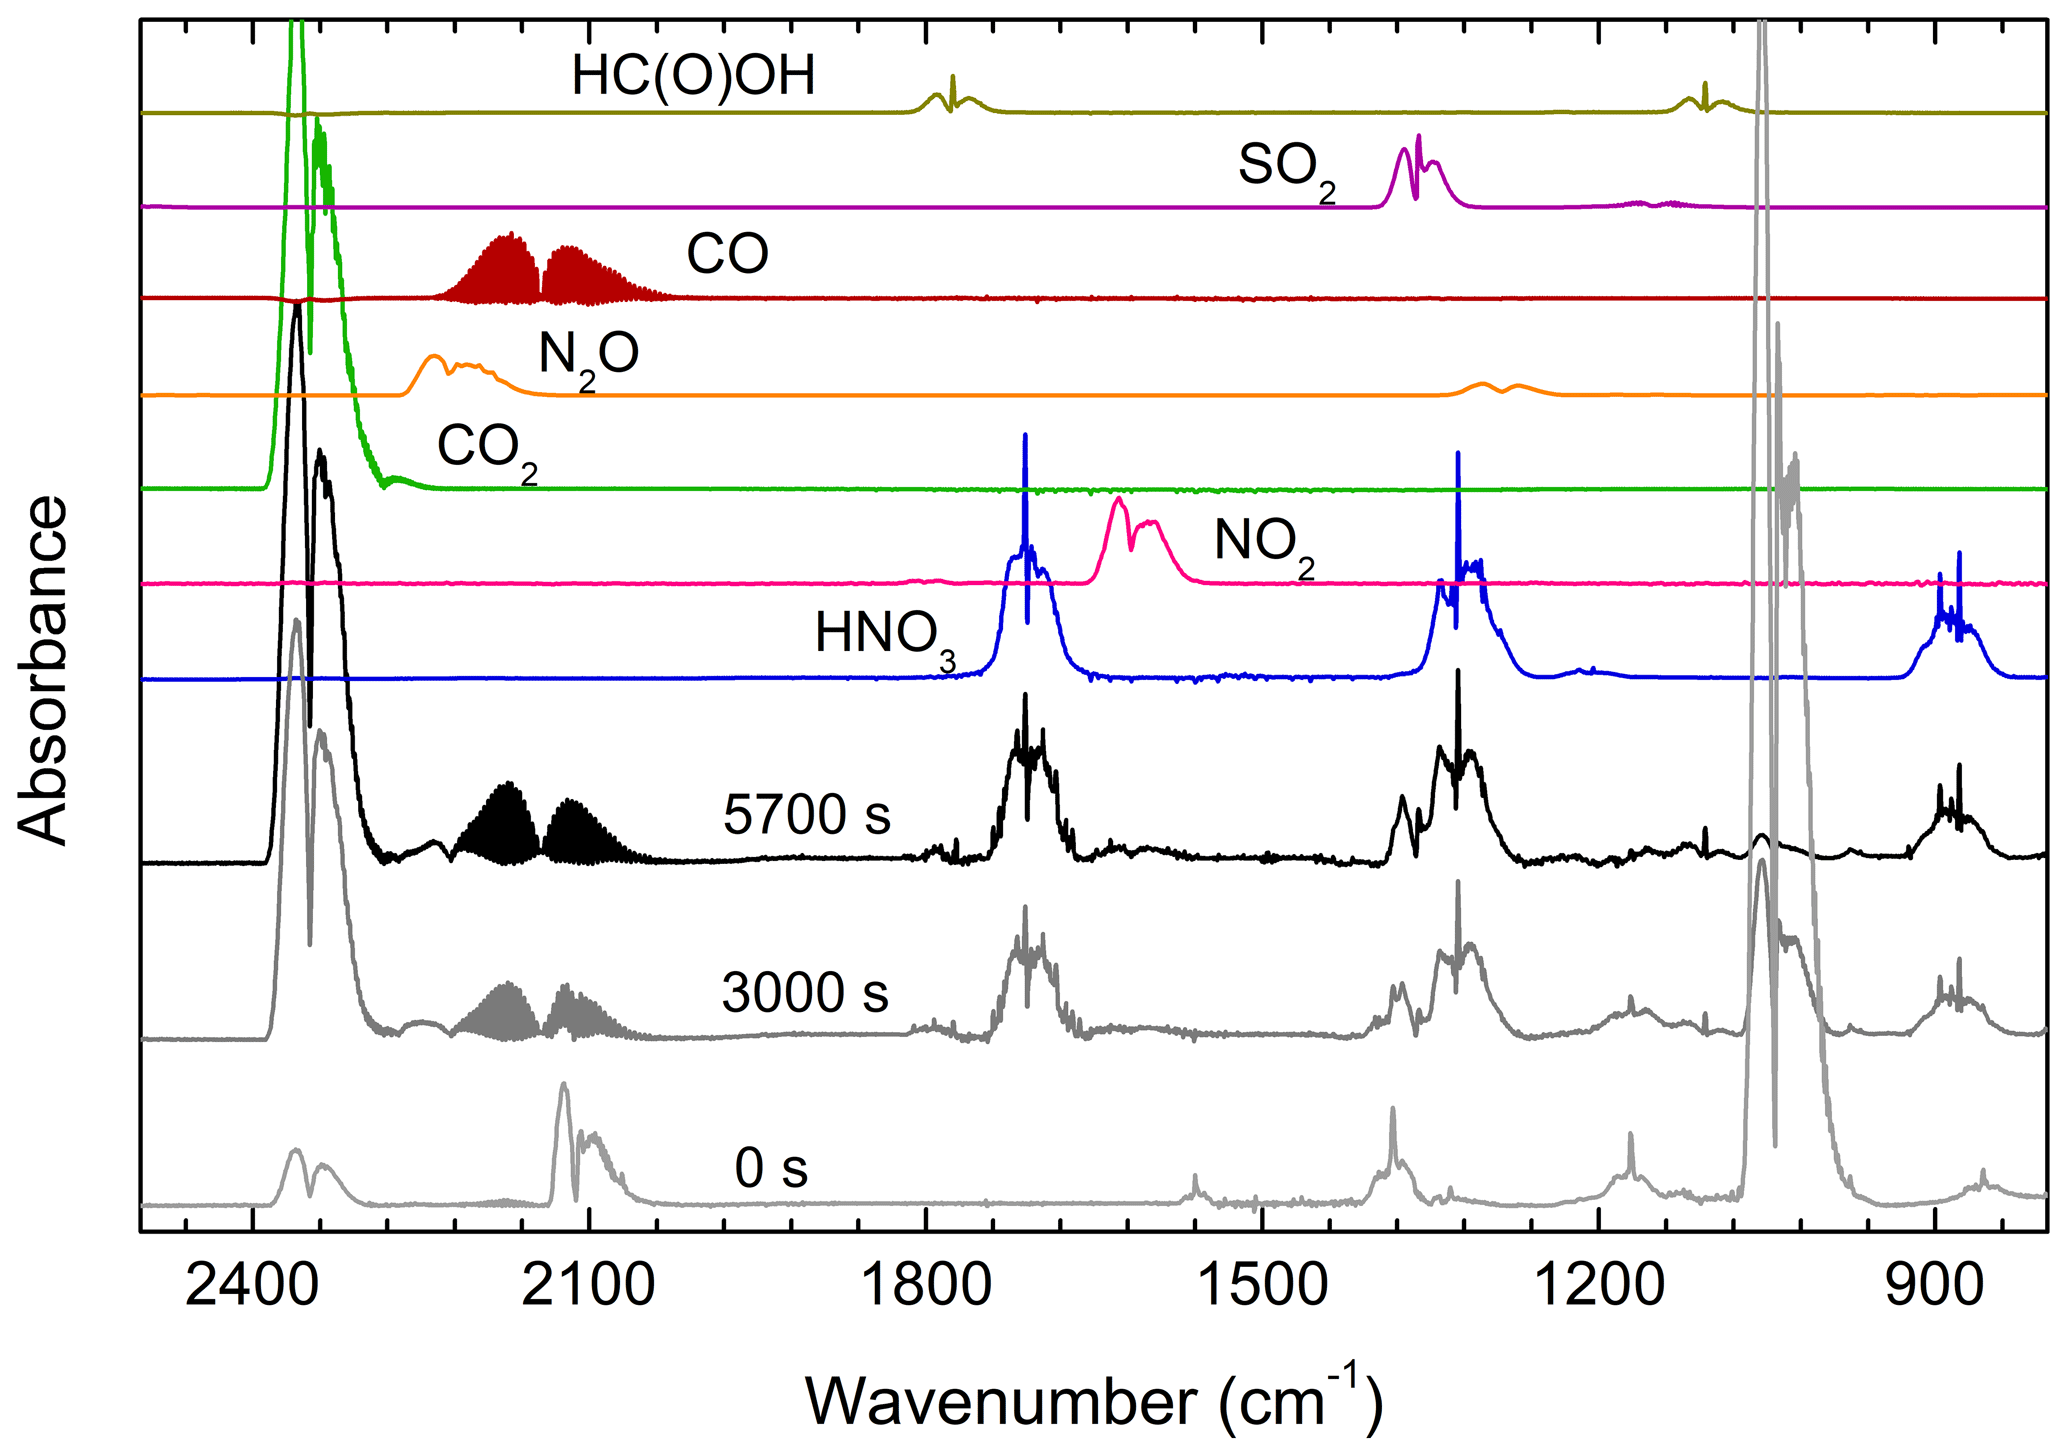
Figure 4Infrared spectrum acquired prior to (0 s) and after (3000 and 5700 s) photolysis of a mixture of MSAM, O3, H2, and air. During irradiation, OH concentrations were . H2O-absorption features have been subtracted from the spectra. Reference spectrum of HNO3, NO2, CO2, N2O, CO, SO2, and HC(O)OH recorded under the same experimental conditions (700 Torr and 298 K) are also shown.
Figure 4 also displays reference spectra (measured at the same temperature and pressure) of the compounds we identified as reaction products. Other than CO2 and CO, nitric acid (HNO3) and sulfur dioxide (SO2) are easily identified, with weak features from N2O, NO2, and formic acid (HC(O)OH) also apparent. The absorption of each product was converted to a concentration using calibration curves that were obtained at the same pressure and temperature (see Fig. S2).
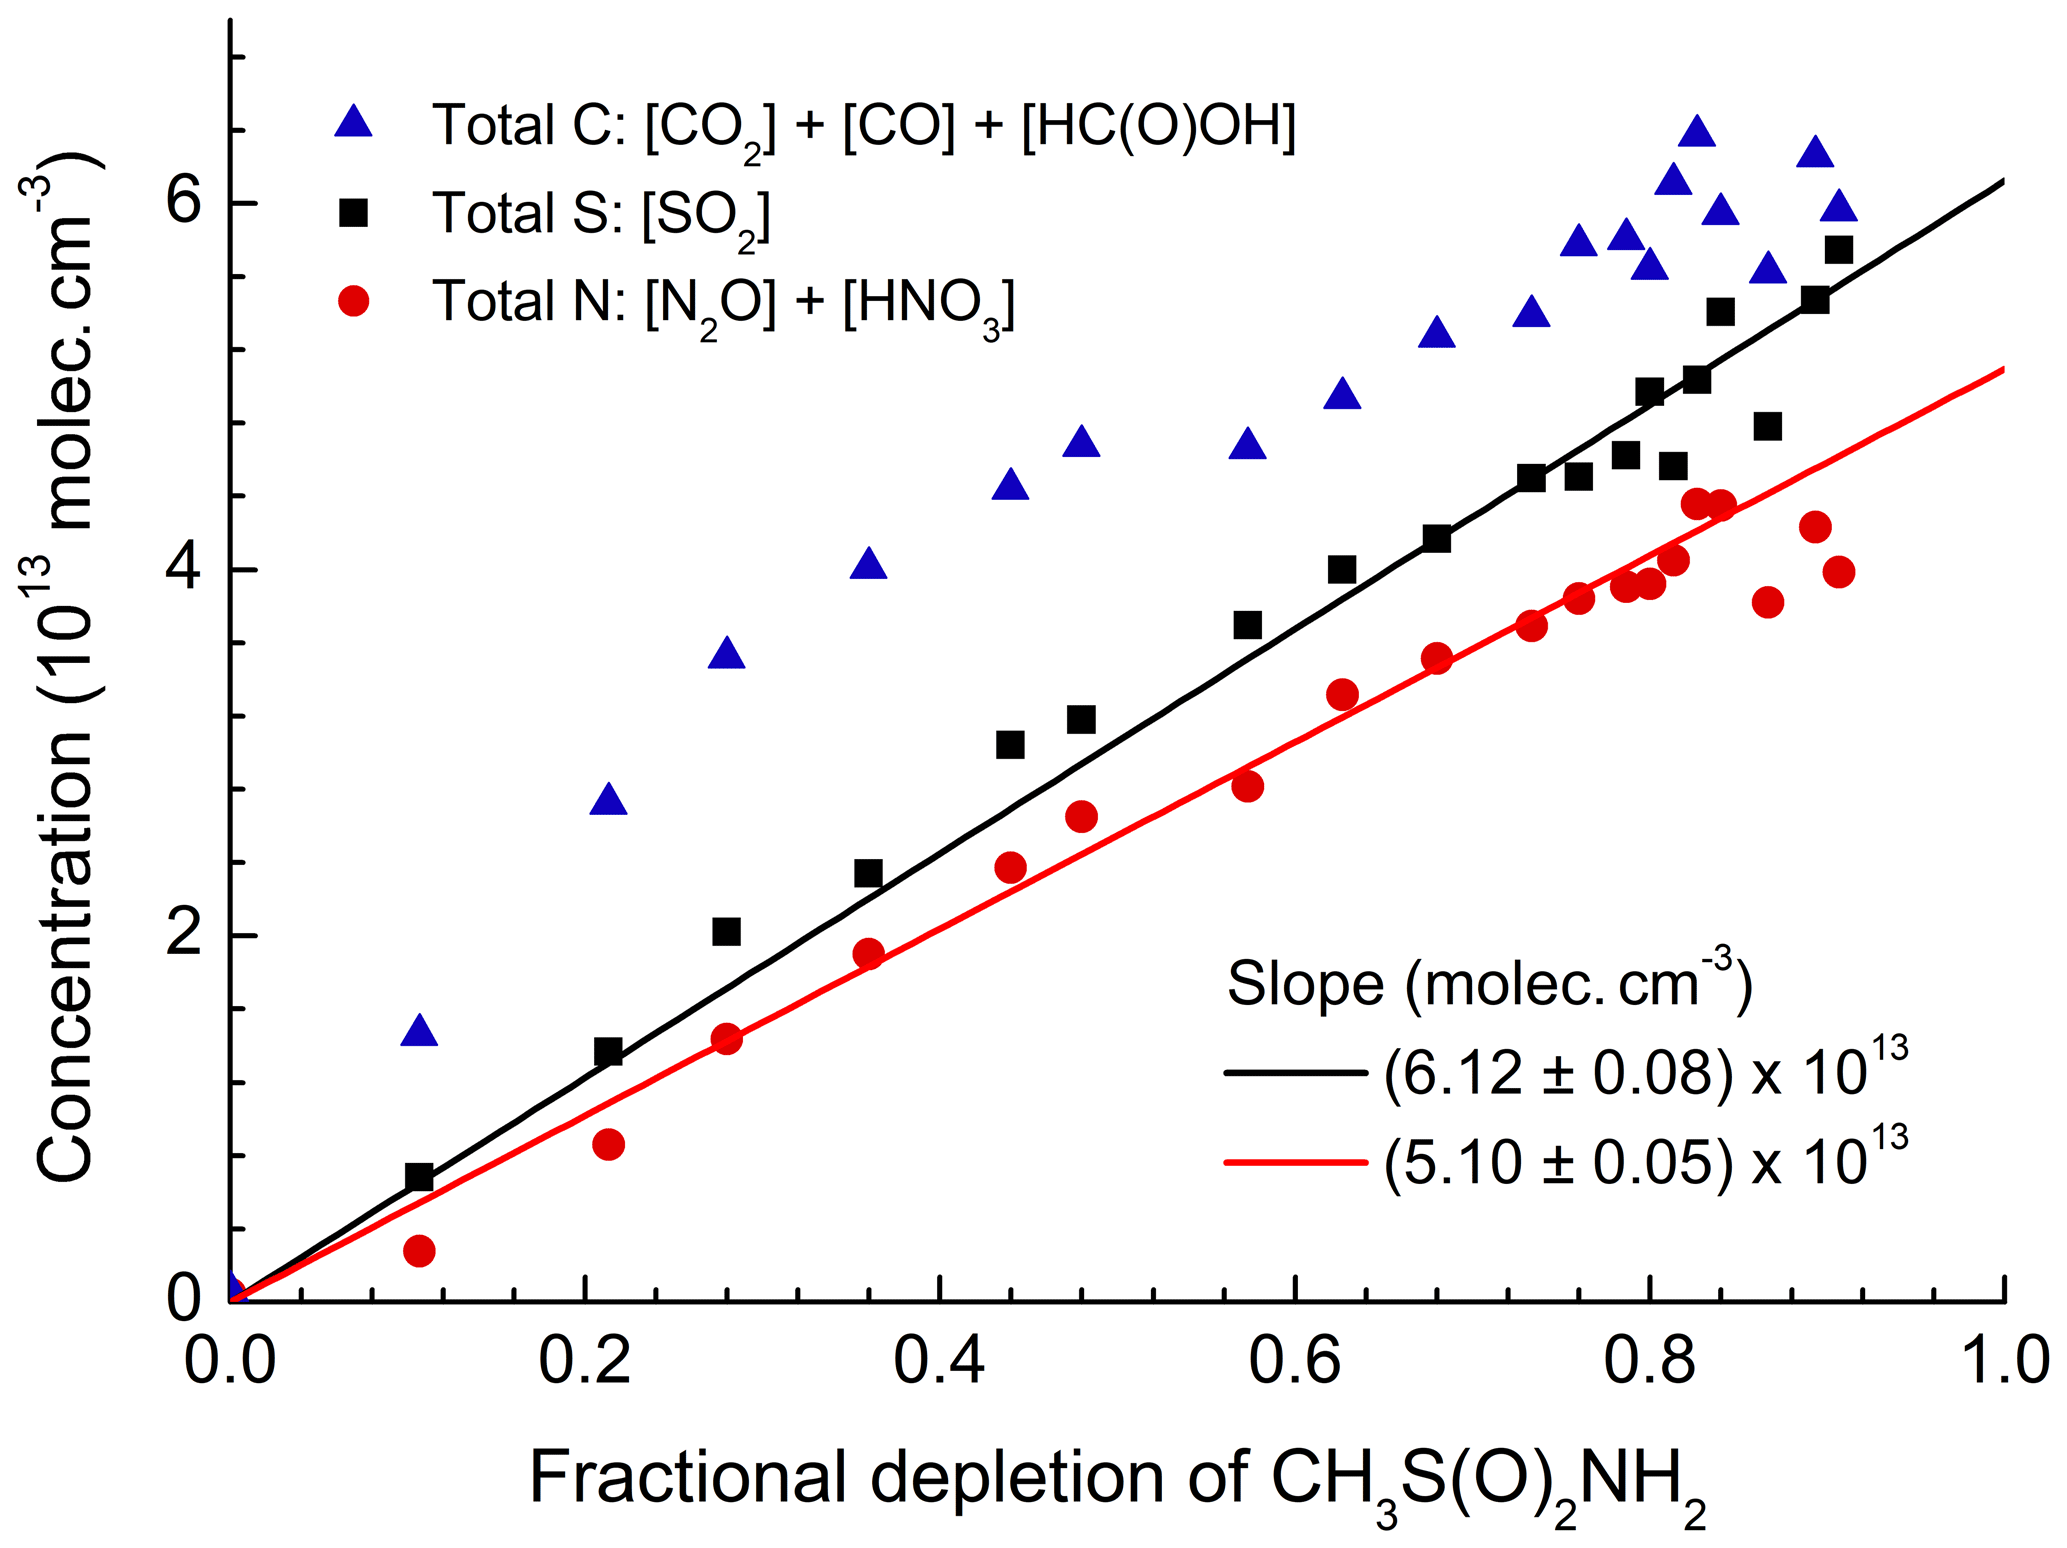
Figure 5Summed concentration of carbon-containing products (CO2, CO, and HC(O)OH), sulfur-containing products (SO2), and nitrogen-containing products (N2O and HNO3) plotted versus the relative depletion of MSAM. The slope gives the initial concentration of MSAM assuming stoichiometric conversion to the products listed.
Figure 5 plots the concentration of SO2 (the only sulfur-containing product observed), the sum of HNO3+2N2O (the total reactive nitrogen observed as product), and the sum of (total carbon-containing products observed) versus the fractional depletion of MSAM. The concentrations after 6000 s (when ∼90 % of the MSAM had reacted) were , , , , , and . MSAM contains one atom each of sulfur, nitrogen, and carbon. If SO2, reactive nitrogen, and carbon are conserved, we can derive initial concentrations of MSAM (from the slope) of (based on the sulfur balance), (based on the nitrogen balance), and (based on the carbon balance at the maximum fractional depletion of MSAM). As already mentioned, total carbon is very likely to be overestimated due to its formation and desorption at/from the walls of the chamber. As the main nitrogen product is HNO3, which has a large affinity for surfaces and which is likely to be lost to the walls, we also expect that use of reactive nitrogen will result in an underestimation of the initial MSAM concentration. For these reasons we believe that the best method to estimate the initial concentration of MSAM is via the formation of SO2. Figure S3 illustrates the strict proportionality between the relative change of the SO2 concentration and the MSAM absorption feature at 1384 cm−1 in four different experiments. From these four experiments we derive absorption cross sections for MSAM at this wavenumber of . This value was used to scale the spectrum of MSAM (Fig. 1) and was used to calculate initial concentrations in all other experiments. Figure 6a presents a plot of Δ[product] vs. −Δ[MSAM] from one experiment. Apart from CO, we observe a roughly linear relationship for all products. Time-dependent yields of each product are displayed in Fig. 6b. Whereas the yields of SO2, CO2, N2O, and HC(O)OH are within experimental scatter roughly constant, that of HNO3 (black line) reaches a constant value only after 800 s, indicating that it is not formed directly, but in a secondary reaction. In contrast, the CO yield is initially slightly larger than unity (indicative of extra sources from the chamber walls) and then decreases with time as it is removed (via reaction with OH) to form CO2. The molar yields (after 6000 s of photolysis when MSAM has depleted to ∼20 % of its original concentration) of the products obtained at 298 K and 700 Torr of synthetic air are , , , , and . The slight deviation of Φ(SO2) from unity stems from the fact that the quoted yield is at a fixed time, whereas the initial MSAM concentration was derived using all the SO2 data in this experiment as described above. As N2O contains two N atoms, the nitrogen balance is thus 0.80±0.13. It is likely that some HNO3 is lost to reactor surfaces, explaining the deviation from unity. Note that if we had used the nitrogen balance to derive the MSAM IR cross sections, the SO2 yield would have exceeded unity.
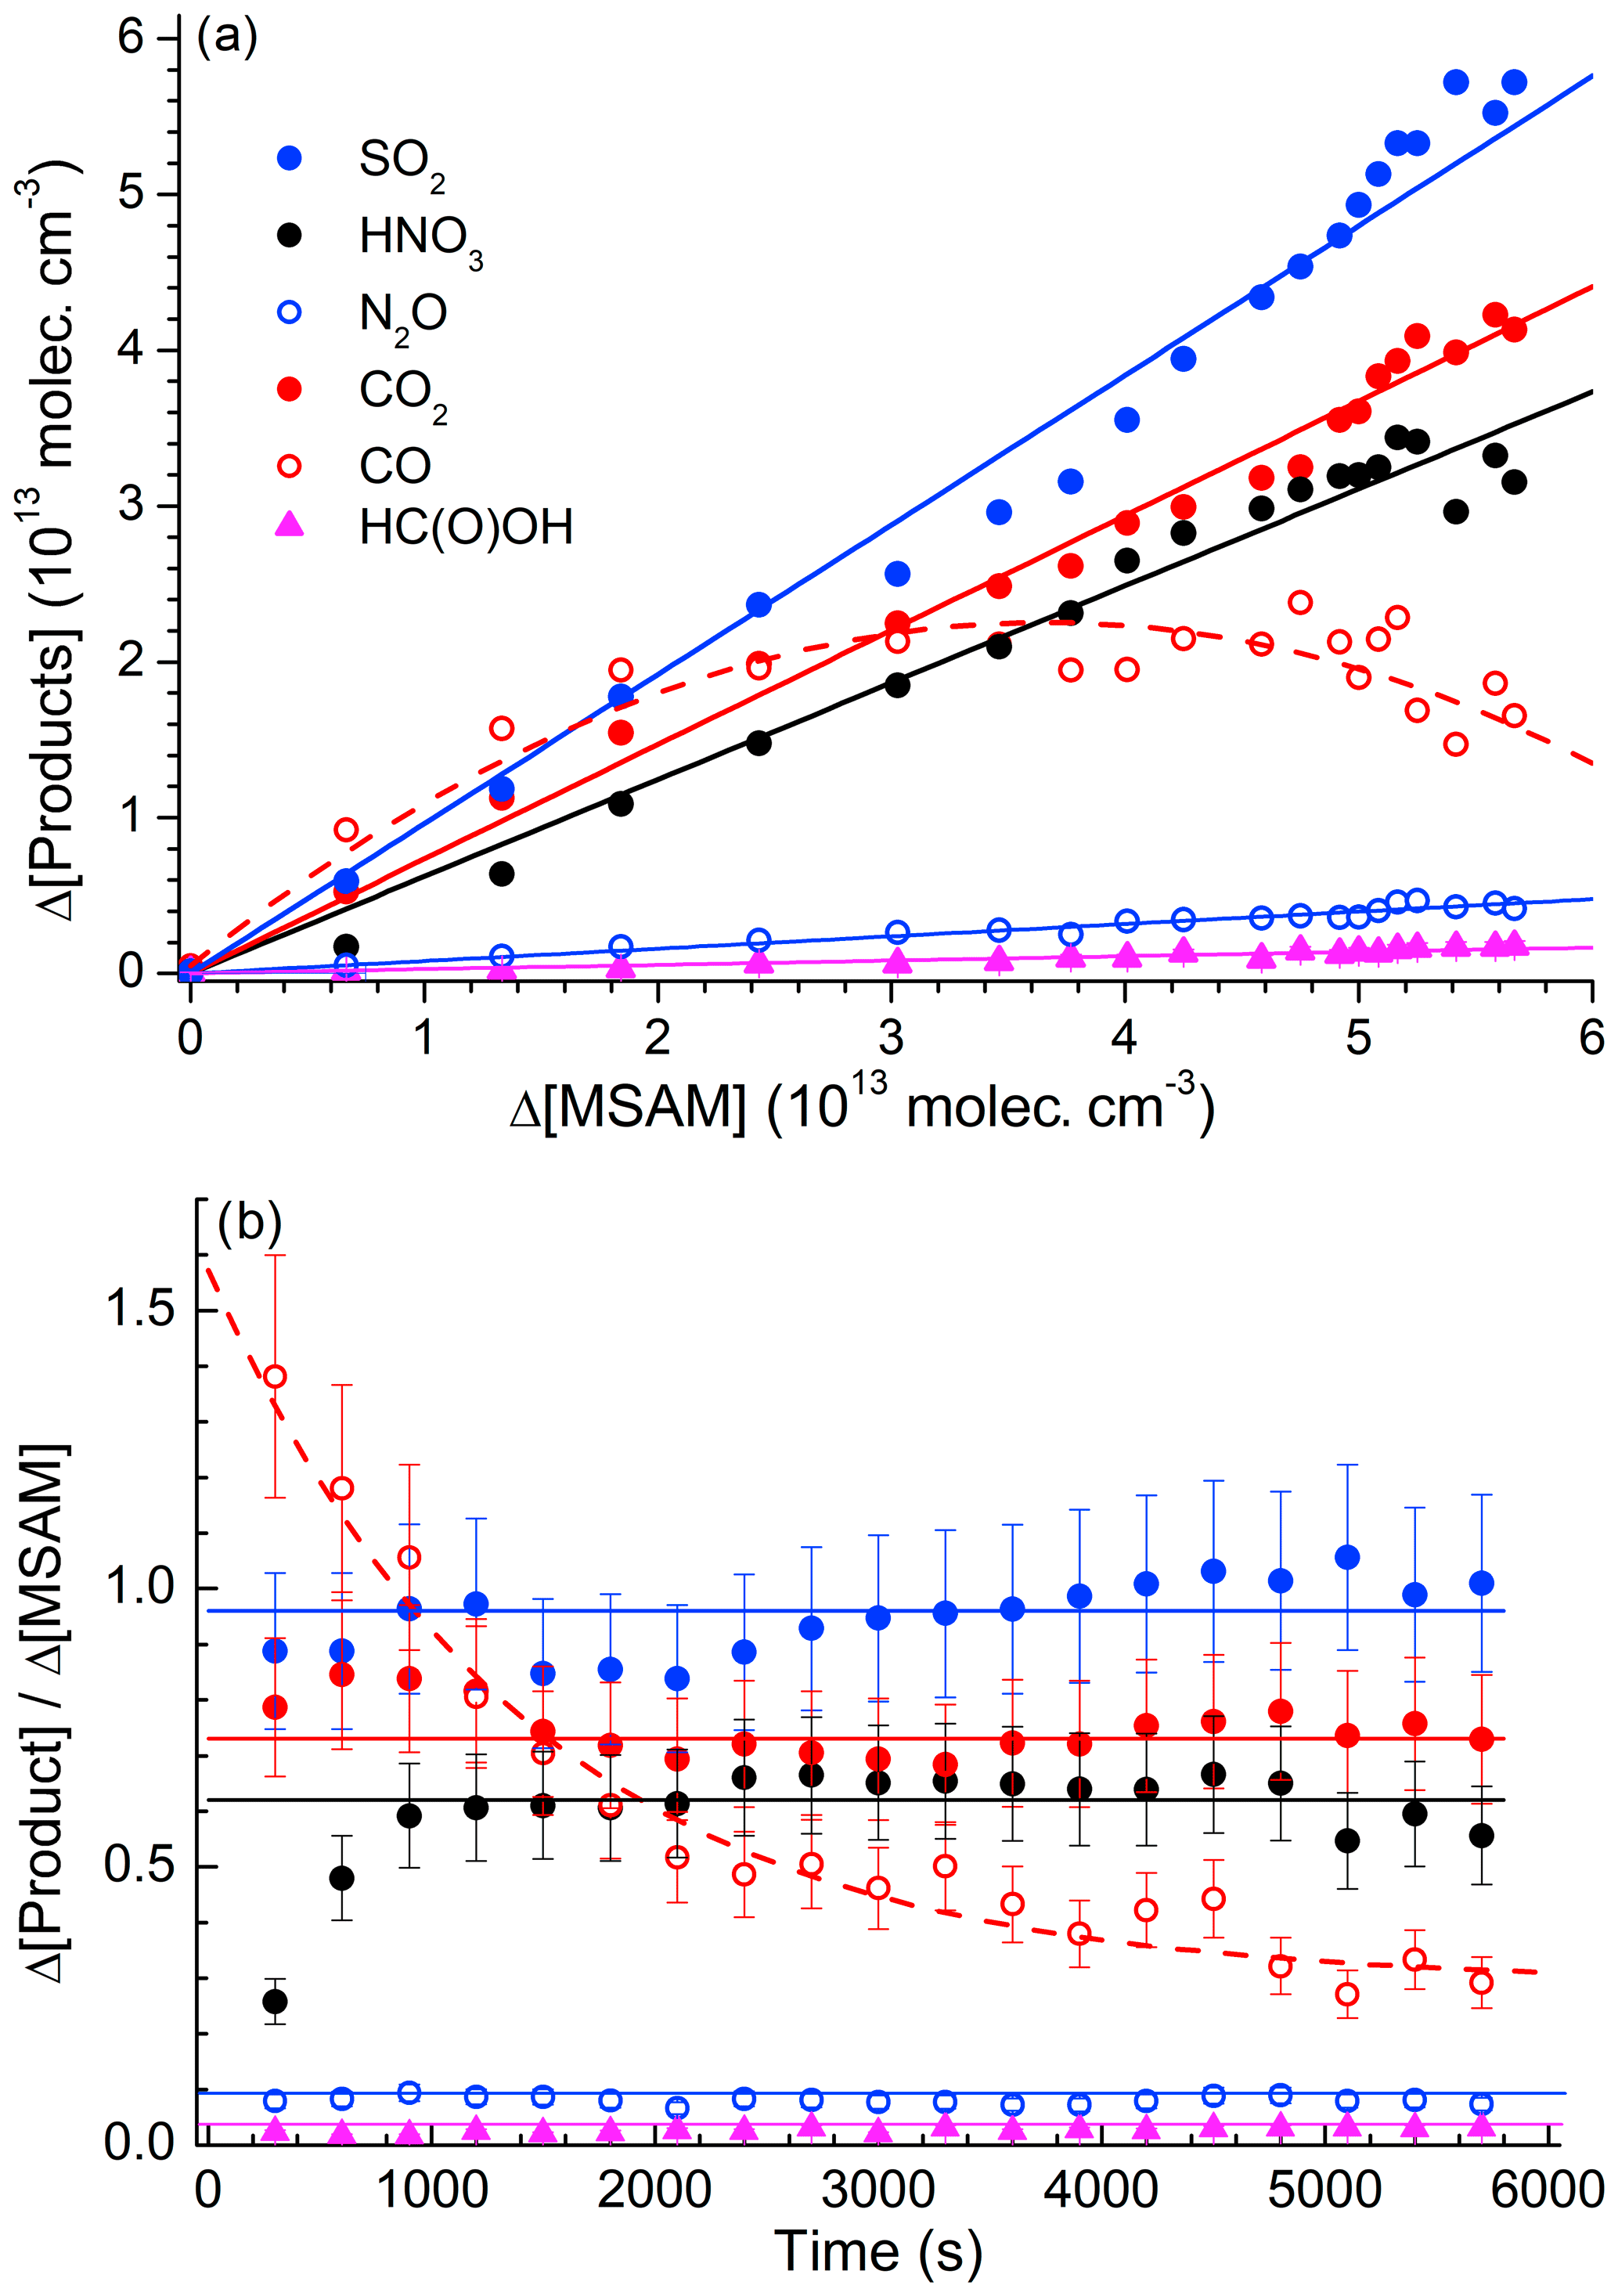
Figure 6(a) Formation of products versus depletion of MSAM. The slopes of the linear fits are the yields of SO2, HNO3, CO2, N2O, and HC(O)OH from this particular experiment. The polynomial fit to the CO data (red dash line) is added to guide the eye. (b) Time dependence of the product yields from the same experiment. The solid, horizontal lines represent the average yield. Error bars are total estimated uncertainty (2σ) including uncertainty in cross sections of products and MSAM.
3.4 Reaction mechanism
The time-dependent formation of HNO3, SO2, N2O, and CO provides important clues to the reaction mechanism. Addition to the S atom is not possible so that the initial step will be abstraction of hydrogen by the OH radical, either from the −CH3 group (Reaction R8a) or from the −NH2 group (Reaction R8b).
Based on results of previous studies of the reactions of OH with trace gases containing both CH3 and −NH2 entities (e.g. CH3NH2 or CH3C(O)NH2), we expect abstraction at the −CH3 group (Reaction R8a) to dominate (Onel et al., 2014; Borduas et al., 2015; Butkovskaya and Setser, 2016). H abstraction at the methyl group is also consistent with a rate coefficient for Reaction (R4) that is very similar to that for OH+acetone.
3.4.1 Abstraction from the −CH3 group
In Sect. 3.4.1 we focus on the fate of the peroxy radical, OOCH2SO2NH2, formed by reaction of initially formed CH2SO2NH2 with O2 (Reaction R9). The most important reactions of organic peroxy radicals are self-reactions (Reaction R10) or reactions with NO (Reaction R11), NO2 (Reaction R12), or HO2 (Reaction R13).
Peroxy nitrates such as the one formed in Reaction (R12) are thermally unstable with respect to dissociation back to reactants at room temperature, and, given the very low concentrations of NO2 in our system, Reaction (R12) will not play a significant role in this study.
The oxy-radical OCH2SO2NH2 formed in Reactions (R10) and (R11) will react with O2 to produce an aldehyde (Reaction R14). Alternatively, it could undergo C−S bond cleavage (Reaction R15) to form formaldehyde (CH2O) and the SO2NH2 radical.
The fate of HC(O)SO2NH2 will be reaction with OH to form C(O)SO2NH2 (Reaction R16), which may dissociate to form CO+SO2NH2 (Reaction R17). The rate coefficient for Reaction (R16) is expected to be as for many similar reactions of OH with aldehydes (e.g. CH3CHO).
C(O)SO2NH2 may either decompose to SO2NH2 and CO (Reaction R17) or react with O2 to form an α-carbonyl peroxy radical (Reaction R18).
The fate of O2C(O)SO2NH2 is likely to be dominated by reaction with HO2, which, by analogy to CH3C(O)O2 (another α-carbonyl peroxy radical), is expected to lead to the reformation of OH (Dillon and Crowley, 2008; Groß et al., 2014).
In both scenarios, SO2NH2 is the sulfur-containing product, whereas formation of the peroxy radical in Reaction (R18) will result in early CO2 formation and OH recycling.
Formaldehyde formed in Reaction (R15) will react with OH to form CO and subsequently CO2.
But it may also react with HO2 to form formic acid.
The above reactions explain, at least qualitatively, the observed formation of CO, CO2, and HC(O)OH. Note that the room temperature rate coefficient for reaction of OH with HCHO is large (; Atkinson et al., 2006) compared to that for reaction with CO (; Atkinson et al., 2006), which explains why CO was observed as an intermediate product at high concentrations whereas HCHO was not.
The likely fate of the SO2NH2 radical formed in Reaction (R15) is either reaction with O2 to generate SO2NH or dissociation by S–N bond scission to produce SO2 and the NH2 radical.
We did not observe features in the IR spectrum that could be assigned to SO2NH based on the spectrum reported by Deng et al. (2016), and we propose that Reaction (R27) is the source of SO2 as a major reaction product. By analogy with the thermal decomposition of the similar CH3SO2 radical, which dissociates to CH3 and SO2 on a millisecond timescale (Ray et al., 1996), we expect SO2NH2 to decompose stoichiometrically to SO2 and NH2 on the timescale of our experiments. The NH2 radical is known to react with O3, HO2, and NO2 (IUPAC, 2019).
NH2O rearranges within ∼1 ms to NHOH (Kohlmann and Poppe, 1999), which then reacts with OH or O2 to generate HNO.
The fate of HNO is the reaction with OH or O2 to generate NO (Reactions R33 and R34).
High concentrations of O3 () and HO2 () in our system ensure that NO is converted to NO2 in less than 1 s, explaining the non-observation of the IR absorption features of NO.
Finally, NO2 in this system will react with OH to form the main reactive nitrogen compound we observed, HNO3.
Thus far we have not considered the reaction of the peroxy radical OOCH2SO2NH2 with HO2 (Reaction R13), which is expected to result in the formation of a peroxide, HOOCH2SO2NH2. The most likely fate of HOOCH2SO2NH2 is reaction with OH for which (via comparison with CH3OOH) a rate coefficient close to may be expected with H abstraction from both the peroxide group (Reaction R38) and the adjacent carbon (Reaction R39).
Reaction (R38) regenerates the peroxy radical, whereas the HOOCHSO2NH2 radical may decompose (Reaction R40) to form formic acid HC(O)OH or decomposes via Reaction (R41) to form the same aldehyde that is generated in Reaction (R14), whilst regenerating OH.
The final products are thus the same as those resulting from the self-reaction of the peroxy radical. The path from MSAM to the observed end products including the reactive intermediates that were not observed is illustrated in Fig. 7.
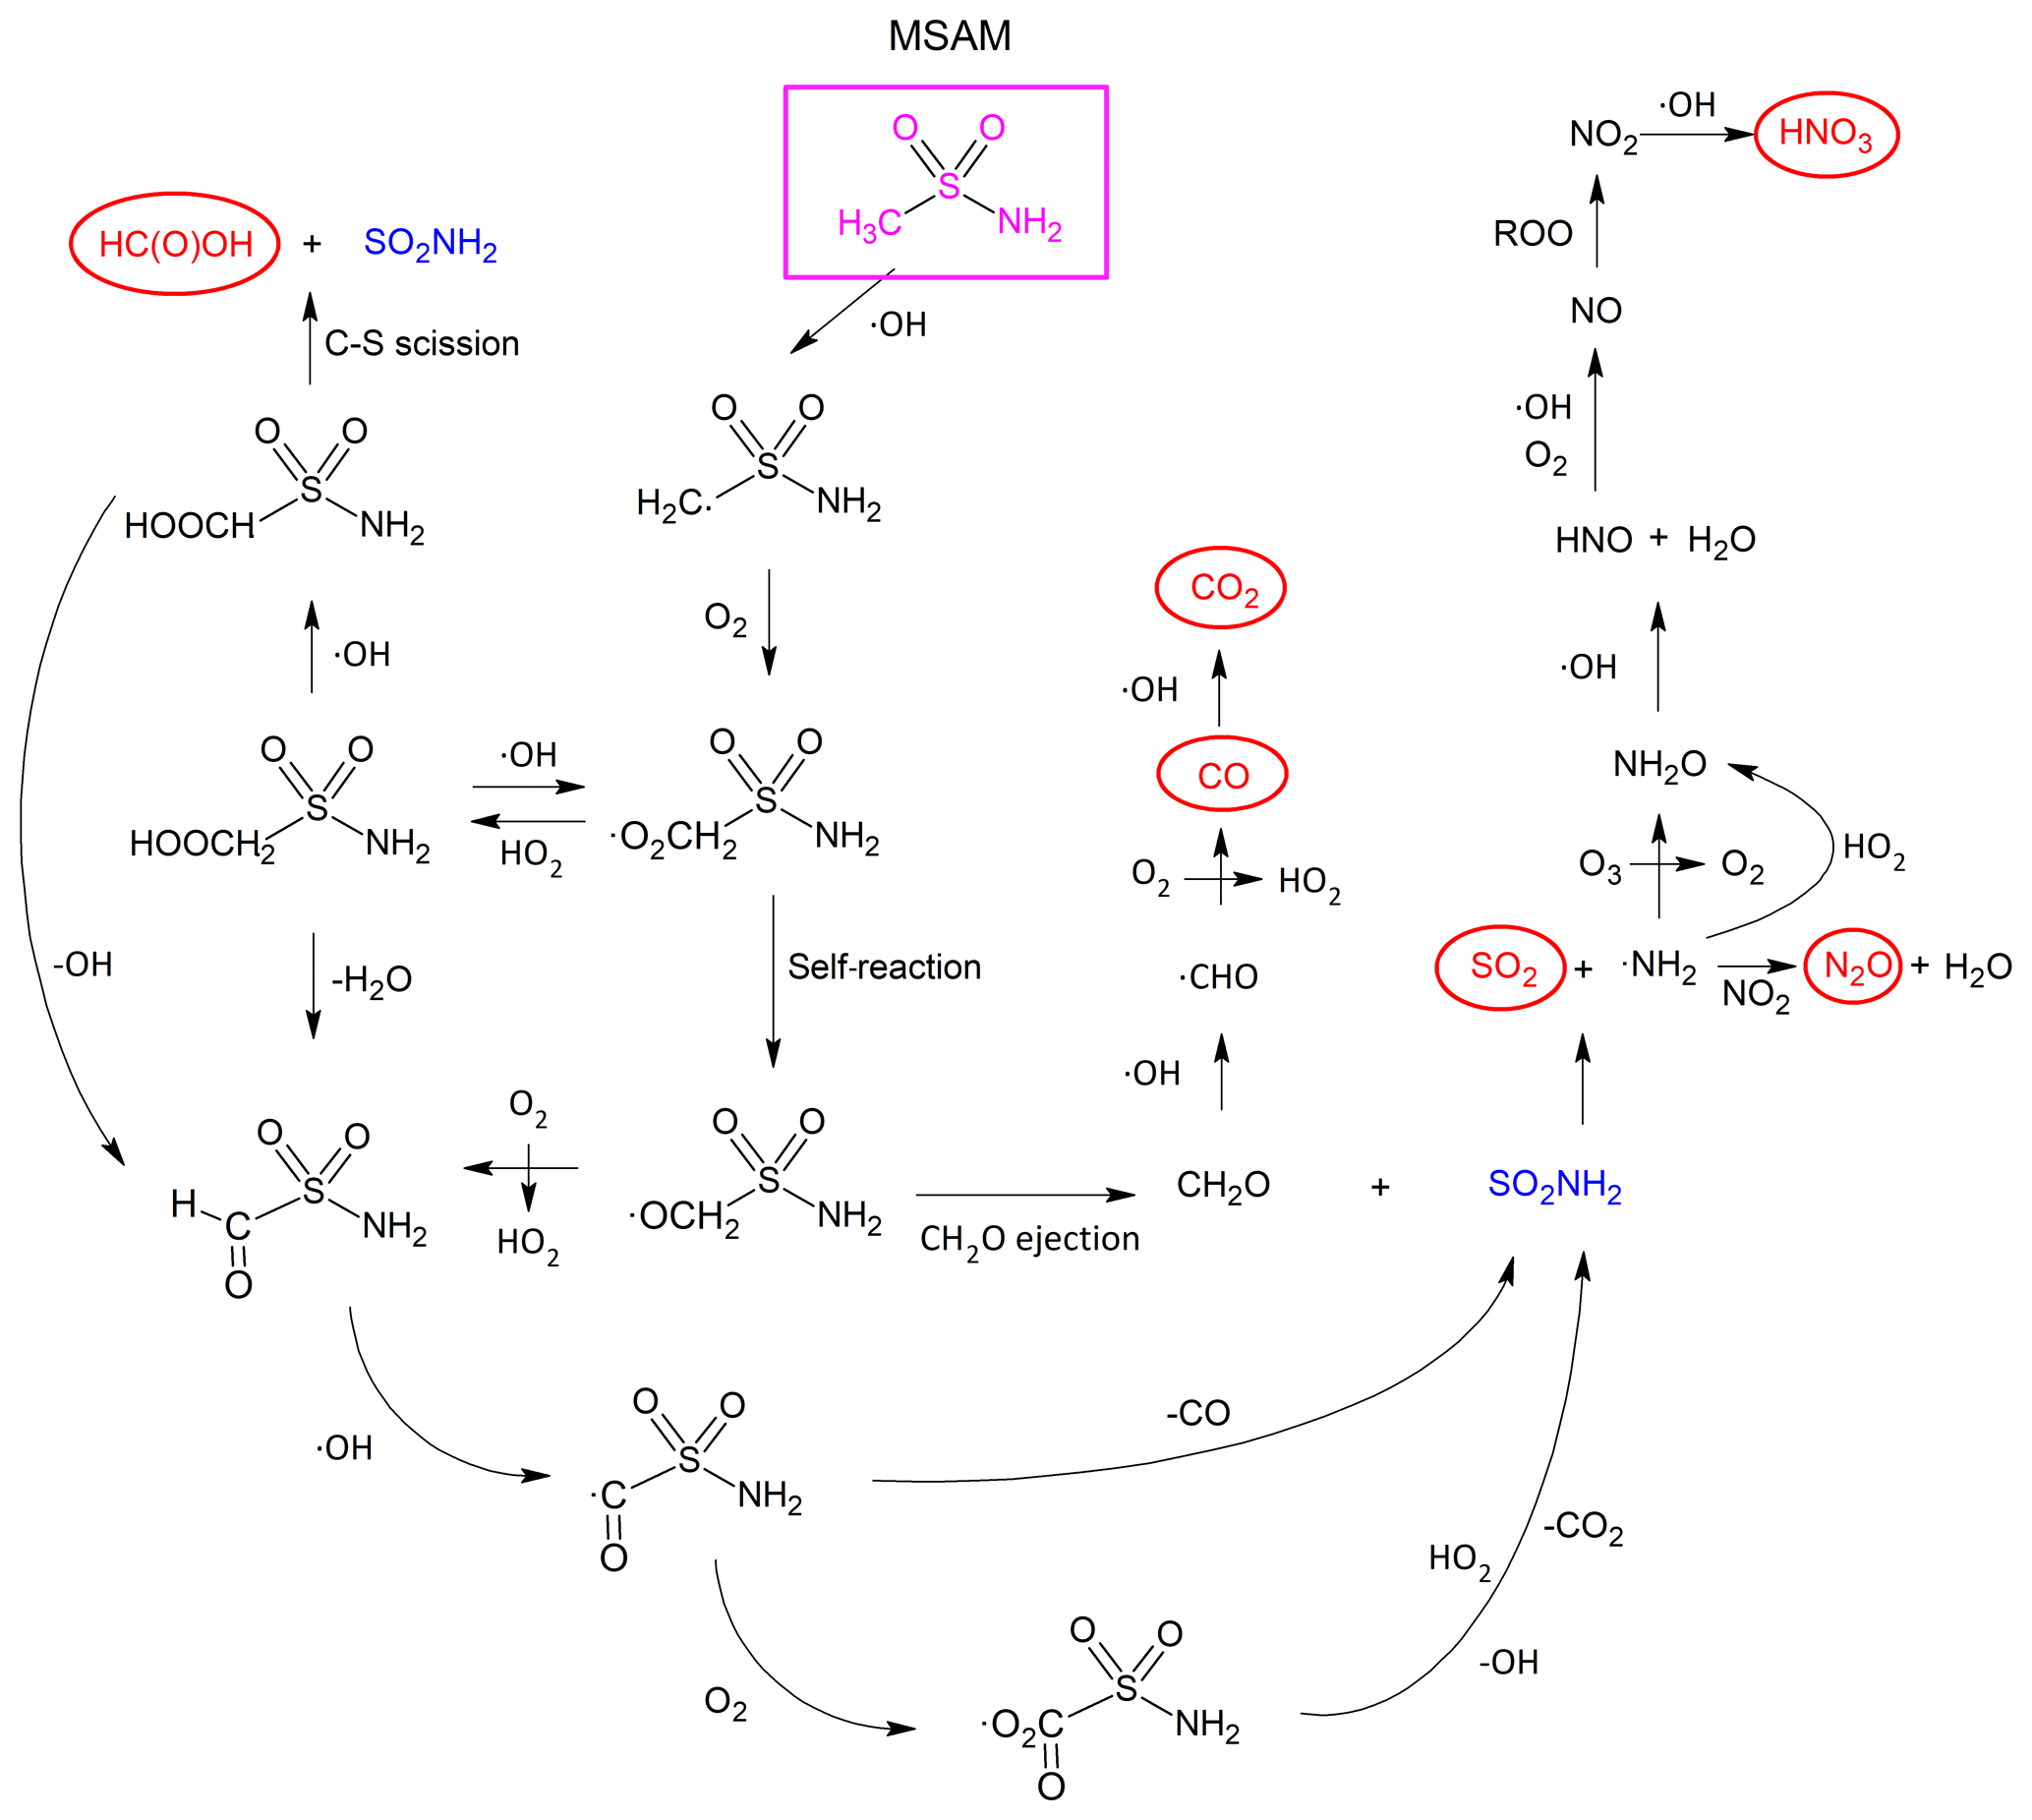
Figure 7Mechanism for the formation of carbon-containing (HC(O)OH, CO, CO2), nitrogen-containing (HNO3 and N2O), and sulfur-containing (SO2) end products (in red circles) observed in the OH-initiated photo-oxidation of MSAM.
3.4.2 Abstraction from the −NH2 group
In analogy to the reaction between CH3C(O)NH2 and OH (Barnes et al., 2010), H abstraction from the −NH2 group is expected to result in decomposition of the initially formed CH3SO2NH radical via C−S bond fission.
The methyl radical would react with O2 to form the methyl-peroxy radical and in subsequent reactions (via CH3O) would result in CH2O formation. As discussed above, CH2O will be efficiently oxidized to CO and CO2 in this system. However, the characteristic IR-absorption bands (Deng et al., 2016) of the SO2NH product were not observed in our experiments, and calculations at the G4MP2 level of theory indicate that Reaction (R42) is endothermic (by 137 kJ mol−1). We conclude that H abstraction from the −NH2 group is a minor channel.
3.5 Kinetic simulation
The proposed reaction mechanism (considering initial reaction by H abstraction from the −CH3 group only) was tested by kinetic simulation using the KINTECUS program package (Ianni, 2015). The reactions used in the chemical scheme and the associated rate coefficients are presented in Table S2. Where experimental rate coefficients were not available, we used rate parameters from similar reactions, and we rationalize these choices in the text associated with Table S2.
Figure 8 shows the variation in the concentrations of the reagent, intermediates, and products observed as a function of time in an experiment conducted at 298 K and 700 Torr of synthetic air. The error bars consider uncertainty associated with the absorption cross sections (5 %–12 %) and uncertainty in deriving the areas of the absorption band areas (less than 3 % in all cases). For MSAM, an uncertainty of ≈25 % is expected, based on the indirect method of calibration (see Sect. 3.2). The simulation results are depicted as solid lines.
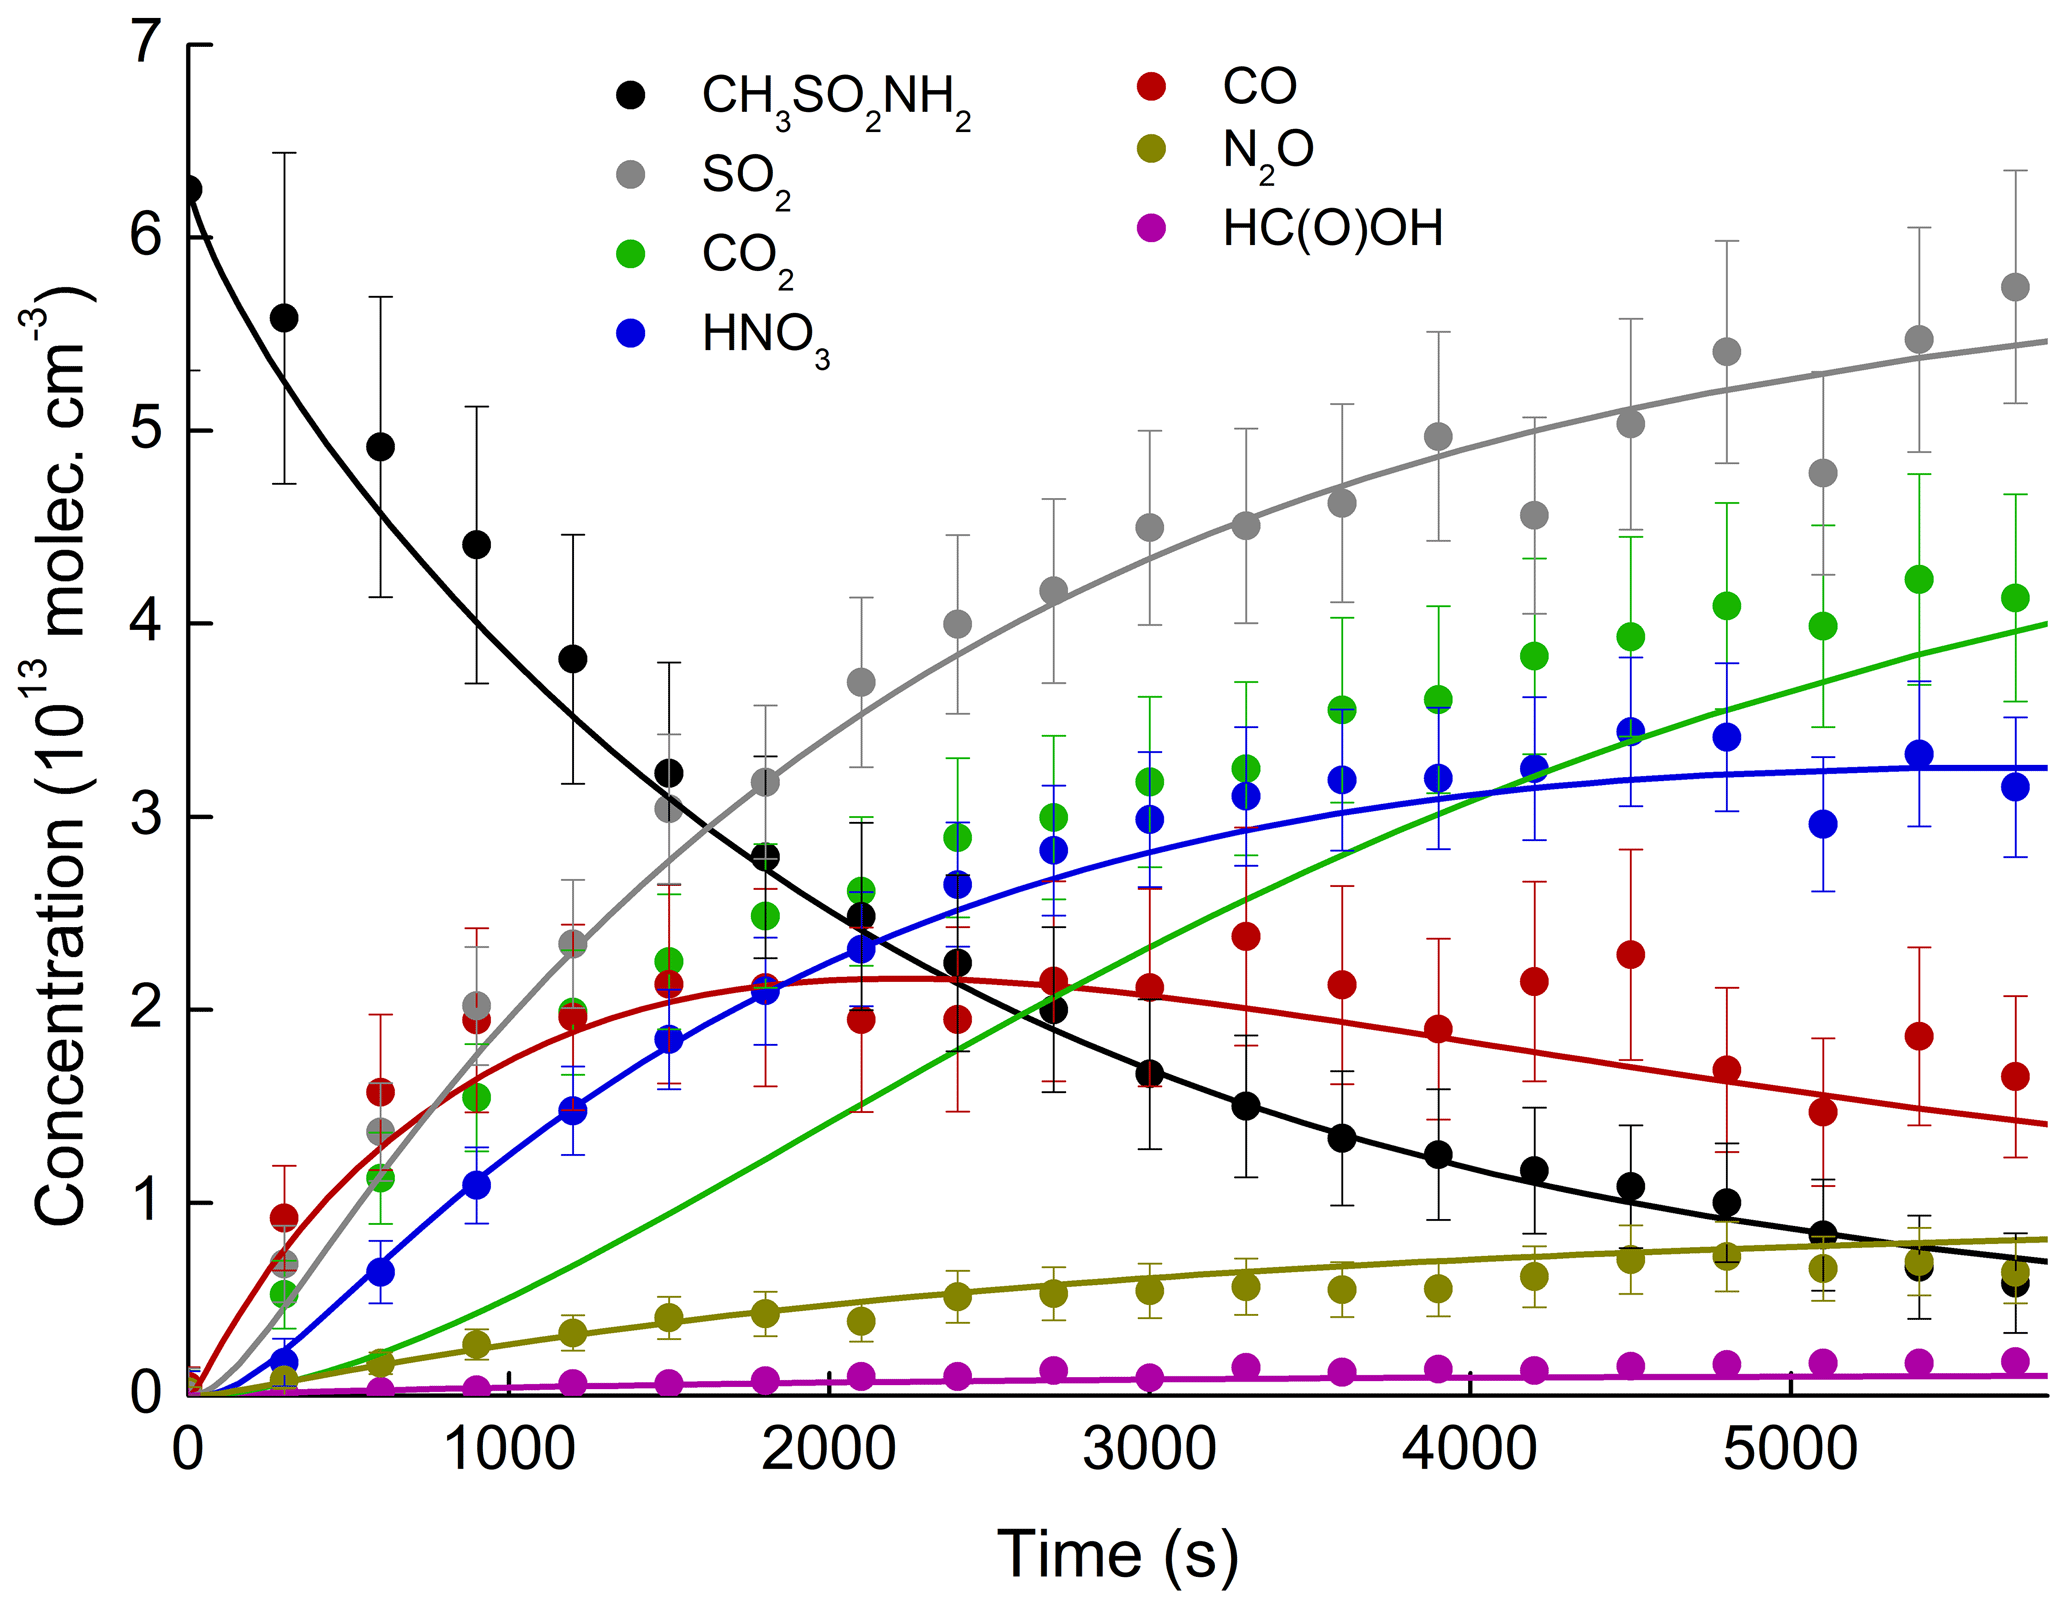
Figure 8Concentration–time profiles of MSAM and reaction products formed in an experiment at 298 K and 700 Torr air. The error bars represent uncertainty in infrared cross sections. The uncertainty associated with the MSAM concentration is estimated to be ≈25 %. Solid lines are simulated profiles.
The good agreement with the N2O (formed from NH2 in Reaction R28) and HNO3 experimental data suggests that the fate of NH2 (the only source of reactive nitrogen in this system) is accurately described in the model. Note that the wall loss rate of HNO3 () in the simulation was adjusted to match the HNO3 profile. The simulated amount of HNO3 lost to the wall at the end of the experiment was ≈14 % of that formed, which helps to explain the non-unity yield of gas-phase nitrogen compounds. The simulations indicate that the maximum concentrations of NO () and NO2 () are below the detection limit of the instrument and explain why they were not observed. The strongest absorption features of HCHO (1700–1800 cm−1) overlap with those of H2O and HNO3 so that the predicted concentrations of HCHO () are also below the detection limit.
The grey line in Fig. 8 represents the sum of , i.e. all model trace gases containing sulfur, which, in the absence of IR absorption features of SO3 or H2SO4, we equate to SO2. We now draw attention to the fact that SO2 (the yield of which is constant with time; see Fig. 6) is only well simulated if we neglect its removal by OH (Reaction R43).
Otherwise, using the preferred rate constant (IUPAC, 2019) at 700 Torr and 298 K of we find that the simulated SO2 concentration is significantly reduced and its yield is time dependent. At 1 bar of air, collisionally stabilized HOSO2 is converted within 1 µs to HO2 and SO3. In the atmosphere, SO3 reacts with H2O to form H2SO4 (Reaction R45). The conversion of SO3 to H2SO4 may be suppressed under our “dry” conditions.
SO2 should therefore not behave like a stable end product in our experiments but be converted to more oxidized forms. In order to confirm that SO2 is indeed stable in our experiments, we measured the relative rate of loss of SO2 and acetone under the same experimental conditions (Fig. S4). The apparent relative rate constant k43∕k5 was 0.46, which converts to an effective rate constant for SO2 loss of . This is more than a factor of 10 lower than the preferred value, indicating that the net rate of the OH-induced SO2 loss in our system is much lower than expected and not simply governed by the rate constant for the forward reaction to form HOSO2. The reformation of SO2 under our experimental conditions is the subject of ongoing experiments in this laboratory, which are beyond the scope of the present study. We note that the unexpected behaviour of SO2 does not significantly impact the conclusions drawn in this work.
The simulation also captures the CO profile well but fails to predict the early formation of CO2. The match between simulation and experiment could be improved to some extent for CO2 by amending the fate of the C(O)SO2NH2 radical as described above (Reactions R17 and R18) so that CO2 rather than CO is formed. The results (Fig. S5) indicate that the improved simulation of CO2 is accompanied by complete loss of agreement with CO (which is no longer formed in measurable amounts) and poorer agreement with, for example, SO2 and HNO3. However, given that CO2 is generated from the cell walls during irradiation and cannot be used quantitatively (Sect. 3.5), the true fate of the C(O)SO2NH2 radical remains obscure.
Table 3Lifetimes of atmospheric organosulfur trace gases with respect to reaction with OH.
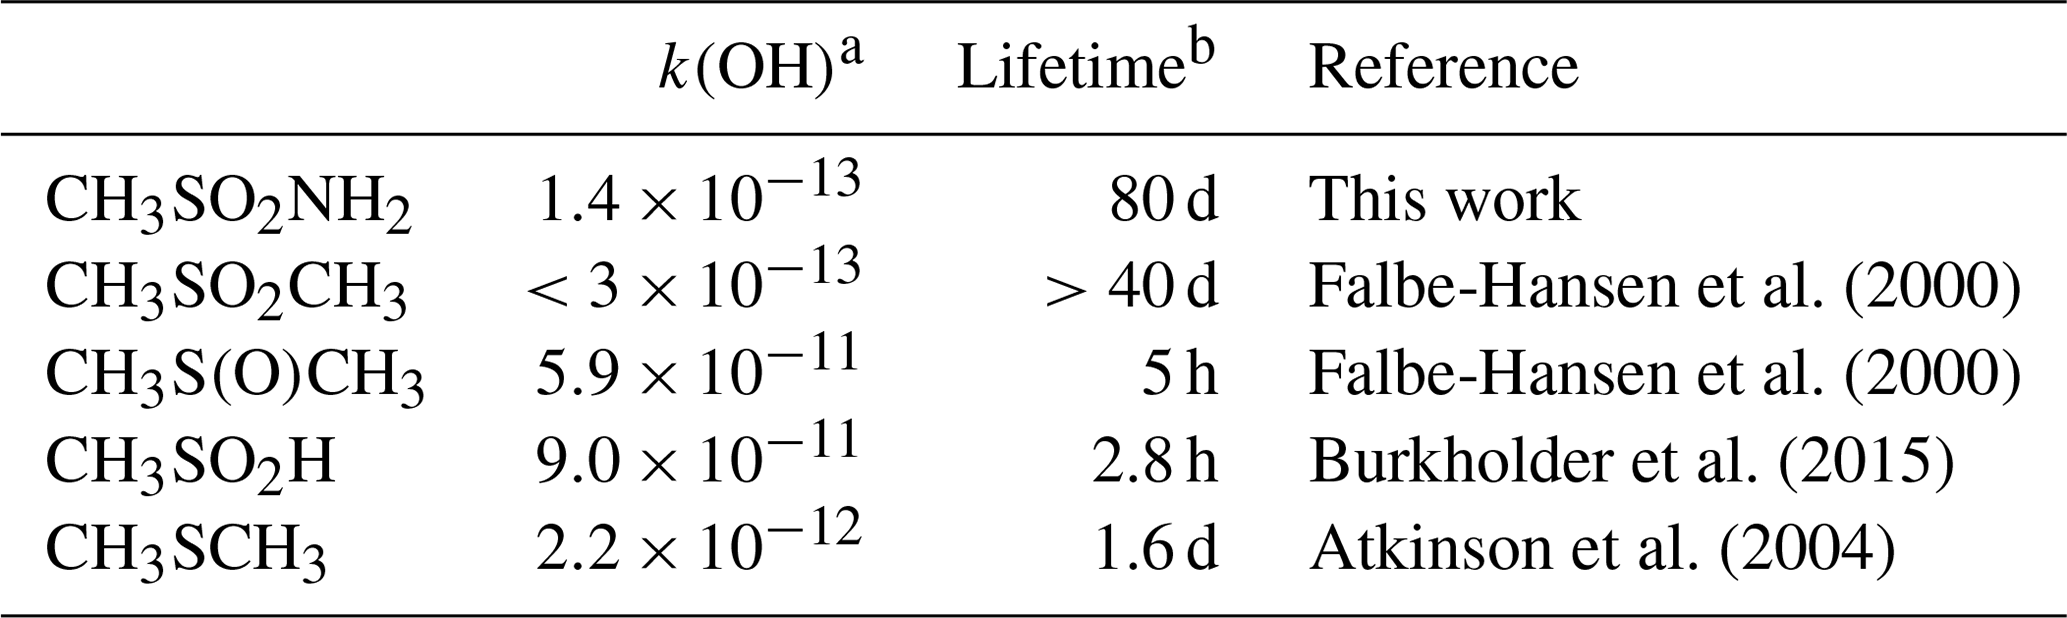
a Units of . b Assumes a diel average OH concentration of 1×10⁶ .
3.6 Atmospheric implications
The rate coefficients for a number of tropospheric, organosulfur trace gases are listed in Table 3. The rate coefficient for the title reaction is significantly lower than those for CH3SCH3 (CH3SCH3) and CH3S(O)CH3, (DMSO) for which reaction with OH is the major atmospheric loss process (lifetimes of hours), but it is comparable to CH3S(O)2CH3, which also has two S=O double bonds. However, as for most tropospheric trace gases, the lifetime of MSAM will be controlled by a number of processes including photolysis; reactions with the three major oxidants, OH, NO3, and O3; and dry deposition (kdd) and heterogeneous uptake to particles (khet), followed by wet deposition.
The lack of C=C double bonds in MSAM suggest that the reaction with O3 will be a negligible sink, which is confirmed by the low upper limit to the rate constant of described in Sect. 2.4. Whereas the reaction with NO3 represents an important loss mechanism for DMS, we do not expect this to be important for MSAM. CH3SCH3 reacts with NO3 (despite lack of a C=C double bond) as the high electron density around the sulfur atom enables a pre-reaction complex to form prior to H abstraction. This mechanism is not available for MSAM because the electron density around the sulfur atom is reduced by the two oxygen atoms attached to it, which also provide steric hindrance.
Owing to its low vapour pressure, we were unable to measure the UV-absorption spectrum of MSAM, but we note that it was not photolysed at a measurable rate by the 254 nm radiation in our study. We conclude that photolysis in the troposphere, where actinic flux only at wavelengths above ≥320 nm is available, is a negligible sink of MSAM.
Therefore, the lifetime of MSAM can be approximated by
Using our overall rate coefficient, , for the title reaction and taking a diel-averaged OH concentration of 1×10⁶ , we can use Eq. (2) to calculate a first-order loss rate constant of . Which is equivalent to a lifetime of ≈80 d.
MSAM is highly soluble and a dry deposition velocity of ≈ 1 cm s−1 to the ocean has been estimated (Edtbauer et al., 2019). Combined with a marine boundary height of , this results in a loss rate coefficient of or a lifetime with respect to uptake to the ocean of less than 1 d. Wet deposition is also likely to play a role, which may limit the MSAM lifetime to days under rainy conditions and to weeks in dry regions.
To a first approximation the heterogeneous loss rate of a trace gas to a particle is given by
where γ is the uptake coefficient which represents the net efficiency (on a per collision basis) of transfer of MSAM from the gas phase to the particle phase, is the mean molecular velocity of MSAM (), and A is the surface area density of particles (cm2 cm−3) for which a typical value in lightly to moderately polluted regions would be . A rather low uptake coefficient of would then be sufficient to compete with MSAM loss due to reaction with OH, but a value of would be necessary to compete with dry deposition.
The rate coefficient for reaction of methane sulfonamide (MSAM) with OH was determined using the relative rate method as . The major, stable, quantifiable sulfur- and nitrogen-containing end products of the reaction are SO2 and HNO3 with molar yields of (0.96±0.15) and (0.62±0.09), respectively. CO and CO2 are the dominant carbon-containing products. N2O and HC(O)OH were also observed at lower yields of (0.09±0.02) and (0.03±0.01), respectively. The end products (and the low rate coefficient) are consistent with an initial abstraction by OH from the CH3 group. Based on our results MSAM has an atmospheric lifetime with respect to loss by reaction with OH of about 80 d, indicating that other processes (e.g. deposition) will likely dominate.
The rate coefficients measured during this experimental study are listed in Table 2.
The supplement related to this article is available online at: https://doi.org/10.5194/acp-20-2695-2020-supplement.
The experiments and data analysis were carried out by MB and DA. The preparation of the paper was performed by MB and JNC, with contributions from DA, JL, JW, and AE.
The authors declare that they have no conflict of interest.
The article processing charges for this open-access publication were covered by the Max Planck Society.
This paper was edited by James B. Burkholder and reviewed by two anonymous referees.
Andreae, M. O.: Ocean-atmosphere interactions in the global biogeochemical sulfur cycle, Mar. Chem., 30, 1–29, https://doi.org/10.1016/0304-4203(90)90059-l, 1990.
Andreae, M. O. and Crutzen, P. J.: Atmospheric aerosols: Biogeochemical sources and role in atmospheric chemistry, Science, 276, 1052–1058, https://doi.org/10.1126/science.276.5315.1052, 1997.
Atkinson, R., Baulch, D. L., Cox, R. A., Crowley, J. N., Hampson, R. F., Hynes, R. G., Jenkin, M. E., Rossi, M. J., and Troe, J.: Evaluated kinetic and photochemical data for atmospheric chemistry: Volume I – gas phase reactions of Ox, HOx, NOx and SOx species, Atmos. Chem. Phys., 4, 1461–1738, https://doi.org/10.5194/acp-4-1461-2004, 2004.
Atkinson, R., Baulch, D. L., Cox, R. A., Crowley, J. N., Hampson, R. F., Hynes, R. G., Jenkin, M. E., Rossi, M. J., Troe, J., and IUPAC Subcommittee: Evaluated kinetic and photochemical data for atmospheric chemistry: Volume II – gas phase reactions of organic species, Atmos. Chem. Phys., 6, 3625–4055, https://doi.org/10.5194/acp-6-3625-2006, 2006.
Barnes, I., Solignac, G., Mellouki, A., and Becker, K. H.: Aspects of the Atmospheric Chemistry of Amides, Chem. Phys. Chem., 11, 3844–3857, https://doi.org/10.1002/cphc.201000374, 2010.
Bates, T. S., Lamb, B. K., Guenther, A., Dignon, J., and Stoiber, R. E.: Sulfur emissions to the atmosphere from natrural sources, J. Atmos. Chem., 14, 315–337, https://doi.org/10.1007/bf00115242, 1992.
Borduas, N., da Silva, G., Murphy, J. G., and Abbatt, J. P. D.: Experimental and Theoretical Understanding of the Gas Phase Oxidation of Atmospheric Amides with OH Radicals: Kinetics, Products, and Mechanisms, J. Phys. Chem. A, 119, 4298–4308, https://doi.org/10.1021/jp503759f, 2015.
Bunkan, A. J. C., Srinivasulu, G., Amedro, D., Vereecken, L., Wallington, T. J., and Crowley, J. N.: Products and Mechanism of the OH initiated photo oxidation of perfluoro ethyl vinyl ether, C2F5OCF=CF2, Phys. Chem. Chem. Phys., 20, 11306–11316, 2018.
Burkholder, J. B., Sander, S. P., Abbatt, J., Barker, J. R., Huie, R. E., Kolb, C. E., Kurylo, M. J., Orkin, V. L., Wilmouth, D. M., and Wine, P. H.: Chemical Kinetics and Photochemical Data for Use in Atmospheric Studies, Evaluation No. 18, JPL Publication 15–10, Jet Propulsion Laboratory, Pasadena, available at: http://jpldataeval.jpl.nasa.gov (last access: 27 February 2020), 2015.
Butkovskaya, N. I. and Setser, D. W.: Branching Ratios and Vibrational Distributions in Water-Forming Reactions of OH and OD Radicals with Methylamines, J. Phys. Chem. A, 120, 6698–6711, https://doi.org/10.1021/acs.jpca.6b06411, 2016.
Charlson, R. J., Lovelock, J. E., Andreae, M. O., and Warren, S. G.: Oceanic phytpoplankton, atmospheric sulfur, cloud albedo and climate, Nature, 326, 655–661, https://doi.org/10.1038/326655a0, 1987.
Crowley, J. N., Saueressig, G., Bergamaschi, P., Fischer, H., and Harris, G. W.: Carbon kinetic isotope effect in the reaction CH4+Cl: a relative rate study using FTIR spectroscopy, Chem. Phys. Lett., 303, 268–274, 1999.
Deng, G. H., Wu, Z., Li, D. Q., Linguerri, R., Francisco, J. S., and Zeng, X. Q.: Simplest N-Sulfonylamine HNSO2, J. Am. Chem. Soc., 138, 11509–11512, https://doi.org/10.1021/jacs.6b07966, 2016.
Dillon, T. J. and Crowley, J. N.: Direct detection of OH formation in the reactions of HO2 with CH3C(O)O2 and other substituted peroxy radicals, Atmos. Chem. Phys., 8, 4877–4889, https://doi.org/10.5194/acp-8-4877-2008, 2008.
Edtbauer, A., Stönner, C., Pfannerstill, E. Y., Berasategui, M., Walter, D., Crowley, J. N., Lelieveld, J., and Williams, J.: A new marine biogenic emission: methane sulfonamide (MSAM), DMS and DMSO2 measured in air over the Arabian Sea, Atmos. Chem. Phys. Discuss., https://doi.org/10.5194/acp-2019-1021, in review, 2020.
Falbe-Hansen, H., Sorensen, S., Jensen, N. R., Pedersen, T., and Hjorth, J.: Atmospheric gas-phase reactions of dimethylsulphoxide and dimethylsulphone with OH and NO3 radicals, Cl atoms and ozone, Atmos. Environ., 34, 1543–1551, 2000.
Frisch, M. J., Trucks, G. W., Schlegel, H. B., Scuseria, G. E., Robb, M. A., Cheeseman, J. R., Scalmani, G., Barone, V., Mennucci, B., Petersson, G. A., Nakatsuji, H., Caricato, M., Li, X., Hratchian, H. P., Izmaylov, A. F., Bloino, J., Zheng, G., Sonnenberg, J. L., Hada, M., Ehara, M., Toyota, K., Fukuda, R., Hasegawa, J., Ishida, M., Nakajima, T., Honda, Y., Kitao, O., Nakai, H., Vreven, T., Montgomery Jr., J. A., J. Peralta, E., Ogliaro, F., Bearpark, M., Heyd, J. J., Brothers, E., Kudin, K. N., Staroverov, V. N., Kobayashi, R., Normand, J., Raghavachari, K., Rendell, A., Burant, J. C., Iyengar, S. S., Tomasi, J., Cossi, M., Rega, N., Millam, J. M., Klene, M., Knox, J. E., Cross, J. B., Bakken, V., Adamo, C., Jaramillo, J., Gomperts, R., Stratmann, R. E., Yazyev, O., Austin, A. J., Cammi, R., Pomelli, C., Ochterski, J. W., Martin, R. L., Morokuma, K., Zakrzewski, V. G., Voth, G. A., Salvador, P., Dannenberg, J. J., Dapprich, S., Daniels, A. D., Farkas, Ö., Foresman, J. B., Ortiz, J. V., Cioslowski, J., and Fox, D. J.: Gaussian 09, Gaussian, Inc., Wallingford CT, 2009.
Groß, C. B. M., Dillon, T. J., Schuster, G., Lelieveld, J., and Crowley, J. N.: Direct kinetic study of OH and O3 formation in the reaction of CH3C(O)O2 with HO2, J. Phys. Chem. A, 118, 974–985, https://doi.org/10.1021/jp412380z, 2014.
Halls, M. D., Velkovski, J., and Schlegel, H. B.: Harmonic frequency scaling factors for Hartree-Fock, S-VWN, B-LYP, B3-LYP, B3-PW91 and MP2 with the Sadlej pVTZ electric property basis set, Theor. Chem. Acc., 105, 413–421, 2001.
Ianni, J. C.: Kintecus v. 5.5, available at: http://www.kintecus.com (last access: 27 February 2020), 2015.
IUPAC: Task Group on Atmospheric Chemical Kinetic Data Evaluation (Ammann, M., Cox, R. A., Crowley, J. N., Herrmann, H., Jenkin, M. E., McNeill, V. F., Mellouki, A., Rossi, M. J., Troe, J., and Wallington, T. J.), available at: http://iupac.pole-ether.fr/index.html, last access: October 2019.
Kohlmann, J.-P. and Poppe, D.: The tropospheric gas-phase degradation of NH3 and its impact on the formation of N2O and NOx, J. Atmos. Chem., 32, 397–415, 1999.
Onel, L., Blitz, M., Dryden, M., Thonger, L., and Seakins, P.: Branching Ratios in Reactions of OH Radicals with Methylamine, Dimethylamine, and Ethylamine, Environ. Sci. Technol., 48, 9935–9942, https://doi.org/10.1021/es502398r, 2014.
Ray, A., Vassalli, I., Laverdet, G., and LeBras, G.: Kinetics of the thermal decomposition of the CH3SO2 radical and its with NO2 at 1 Torr and 298 K, J. Phys. Chem., 100, 8895–8900, https://doi.org/10.1021/jp9600120, 1996.
Remko, M.: Theoretical study of molecular structure and gas-phase acidity of some biologically active sulfonamides, J. Phys. Chem. A, 107, 720–725, https://doi.org/10.1021/jp026980m, 2003.
Spiro, P. A., Jacob, D. J., and Logan, J. A.: Global inventory of sulfur emissions with 1-degree × 1-degree resolution, J. Geophys. Res.-Atmos., 97, 6023–6036, https://doi.org/10.1029/91jd03139, 1992.