the Creative Commons Attribution 4.0 License.
the Creative Commons Attribution 4.0 License.
 | 07 Feb 2020
The challenge of simulating the sensitivity of the Amazonian cloud microstructure to cloud condensation nuclei number concentrations
Pascal Polonik
Christoph Knote
Tobias Zinner
Florian Ewald
Tobias Kölling
Bernhard Mayer
Meinrat O. Andreae
Tina Jurkat-Witschas
Thomas Klimach
Christoph Mahnke
Sergej Molleker
Christopher Pöhlker
Mira L. Pöhlker
Ulrich Pöschl
Daniel Rosenfeld
Christiane Voigt
Ralf Weigel
Manfred Wendisch
The realistic representation of aerosol–cloud interactions is of primary importance for accurate climate model projections. The investigation of these interactions in strongly contrasting clean and polluted atmospheric conditions in the Amazon region has been one of the motivations for several field campaigns, including the airborne “Aerosol, Cloud, Precipitation, and Radiation Interactions and Dynamics of Convective Cloud Systems–Cloud Processes of the Main Precipitation Systems in Brazil: A Contribution to Cloud Resolving Modeling and to the GPM (Global Precipitation Measurement) (ACRIDICON-CHUVA)” campaign based in Manaus, Brazil, in September 2014. In this work we combine in situ and remotely sensed aerosol, cloud, and atmospheric radiation data collected during ACRIDICON-CHUVA with regional, online-coupled chemistry-transport simulations to evaluate the model's ability to represent the indirect effects of biomass burning aerosol on cloud microphysical and optical properties (droplet number concentration and effective radius).
We found agreement between the modeled and observed median cloud droplet number concentration (CDNC) for low values of CDNC, i.e., low levels of pollution. In general, a linear relationship between modeled and observed CDNC with a slope of 0.3 was found, which implies a systematic underestimation of modeled CDNC when compared to measurements. Variability in cloud condensation nuclei (CCN) number concentrations was also underestimated, and cloud droplet effective radii (reff) were overestimated by the model. Modeled effective radius profiles began to saturate around 500 CCN cm−3 at cloud base, indicating an upper limit for the model sensitivity well below CCN concentrations reached during the burning season in the Amazon Basin. Additional CCN emitted from local fires did not cause a notable change in modeled cloud droplet effective radii. Finally, we also evaluate a parameterization of CDNC at cloud base using more readily available cloud microphysical properties, showing that we are able to derive CDNC at cloud base from cloud-side remote-sensing observations.
- Article
(4505 KB) - Full-text XML
- BibTeX
- EndNote


Aerosol particles influence the formation of cloud droplets and thereby the microphysical and macrophysical properties of clouds. Cloud droplet sizes and number concentrations determine the effect of clouds on atmospheric radiation and, therefore, also on weather and climate. Increased aerosol concentrations increase the cloud albedo (Twomey, 1991) and possibly the lifetime (Albrecht, 1989) of clouds by decreasing droplet size if the total liquid water mass is assumed constant. Cloud alterations by aerosol (i.e., indirect effects) can therefore lead to enhanced reflection of solar radiation under high aerosol loading and therefore cause a net cooling of the sub-cloud layer. However, the magnitude of these effects is not well constrained, which causes major uncertainties in current climate projections (IPCC, 2014).
Representing aerosol–cloud interactions in numerical models that form the basis of these projections is challenging because two of the most dynamic and complex atmospheric systems (aerosol and clouds) must be adequately represented individually before considering an accurate representation of their interactions (Ghan et al., 2016). Correctly modeling cloud condensation nuclei (CCN) number concentration requires accurate representation of aerosol chemistry and size, which depend on parameterizations of emissions, relevant chemical reactions, microphysical interactions like coagulation, and removal processes like dry deposition (Zaveri et al., 2008). In sufficiently complex parameterizations the calculated CCN will then influence the formation of droplets under saturated conditions, and, conversely, the droplets may remove the aerosol from the atmosphere.
Cloud microphysical parameterizations with varying levels of complexity have been incorporated into numerical models of the atmosphere (e.g., Khain and Sednev, 1996; Seifert and Beheng, 2006; Morrison et al., 2005; Grützun et al., 2008; Thompson and Eidhammer, 2014), which provides opportunities to better understand the underlying physical processes. It is difficult, however, to disentangle benefits in forecast-relevant quantities (e.g., 500 hPa pressure field deviation, storm track accuracy, or accumulated precipitation) from an actual improvement in the modeled cloud macro- and microphysical characteristics and its impact on the atmospheric radiation budget. Testing such parameterizations on a mechanistic level requires direct comparisons of model output to a variety of data sources (Seinfeld et al., 2016) as well as situations in which a noticeable aerosol signal can be expected. Events like volcanic eruptions (Malavelle et al., 2017; McCoy and Hartmann, 2015), desert dust outbreaks (Levin et al., 2005; Sassen et al., 2003), or wildfires (Rosenfeld, 1999; Brioude et al., 2009) provide strong signals that facilitate such process-level analysis of aerosol–cloud interactions.
We focus on the Amazon, which has been a historically popular location for aerosol–cloud investigations, largely because both very high and very low aerosol concentrations can exist in the region and because convective clouds are somewhat predictable. There have been multiple efforts to quantify Amazonian aerosol–cloud interactions from remote sensing (Kaufman and Nakajima, 1993; Kaufman and Fraser, 1997; Lin et al., 2006; Wall et al., 2014), in situ measurements (Andreae et al., 2004, 2018; Martin et al., 2017), combinations of measurement types (Rosenfeld et al., 2012; Gonçalves et al., 2015), and models (Feingold et al., 2005; Zhang et al., 2008; Martins et al., 2009). However, few studies have attempted to combine analysis of regional numerical models with measurements (Ten Hoeve et al., 2011; Fan et al., 2018). The specific comparison of modeled and measured microphysical quantities has previously not been done. Aerosol–cloud parameterizations and computational power have recently improved to allow for such a study, but the direct comparison of modeled and measured cloud parameters remains challenging.
We use simulations and novel measurements from a recent field campaign in the Amazon to explore aerosol–cloud-radiation effects of biomass burning from a microphysical perspective. We first evaluate whether numerical simulations on convection-permitting scales can accurately represent observed cloud microphysical properties. For this purpose we focus on cloud droplet number concentration (CDNC) and cloud droplet effective radius (reff) vertical profiles, since reff profiles represent the microphysical development of a cloud and can be derived from in situ and remote-sensing observations.
Reid et al. (1999) similarly investigated the effects of biomass burning in Brazil. In their simulations, they found no further changes in reff from additional biomass burning aerosol when regional background accumulation-mode aerosol concentration reached 3000–4000 cm−3. reff was then merely a function of the liquid water content. They also showed that reff values for clouds affected by biomass burning smoke are considerably smaller than those of clouds in more pristine environments like a marine boundary layer.
Though reff profiles describe the vertical evolution of cloud microphysical properties, it is actually the number of activated cloud condensation nuclei at cloud base, Na, that provides the link between cloud development and aerosol availability (Khain et al., 2005). Parameterizations have been developed to determine Na based on observations of reff, since Na is a somewhat elusive quantity to observe using remote sensing (Rosenfeld et al., 2012). Therefore we then also evaluate the applicability of the parameterization from Freud et al. (2011) using the in situ, remote-sensing, and model-derived reff profiles along with modeled and measured Na.
Though many measurements and modeling studies have focused on the Amazon, they have not attempted to directly compare regional model output and measured cloud microphysical parameters. This comparison is a step towards bridging the gap between the observations used to improve physical understanding and the numerical models used to predict future climate.
2.1 Field campaign
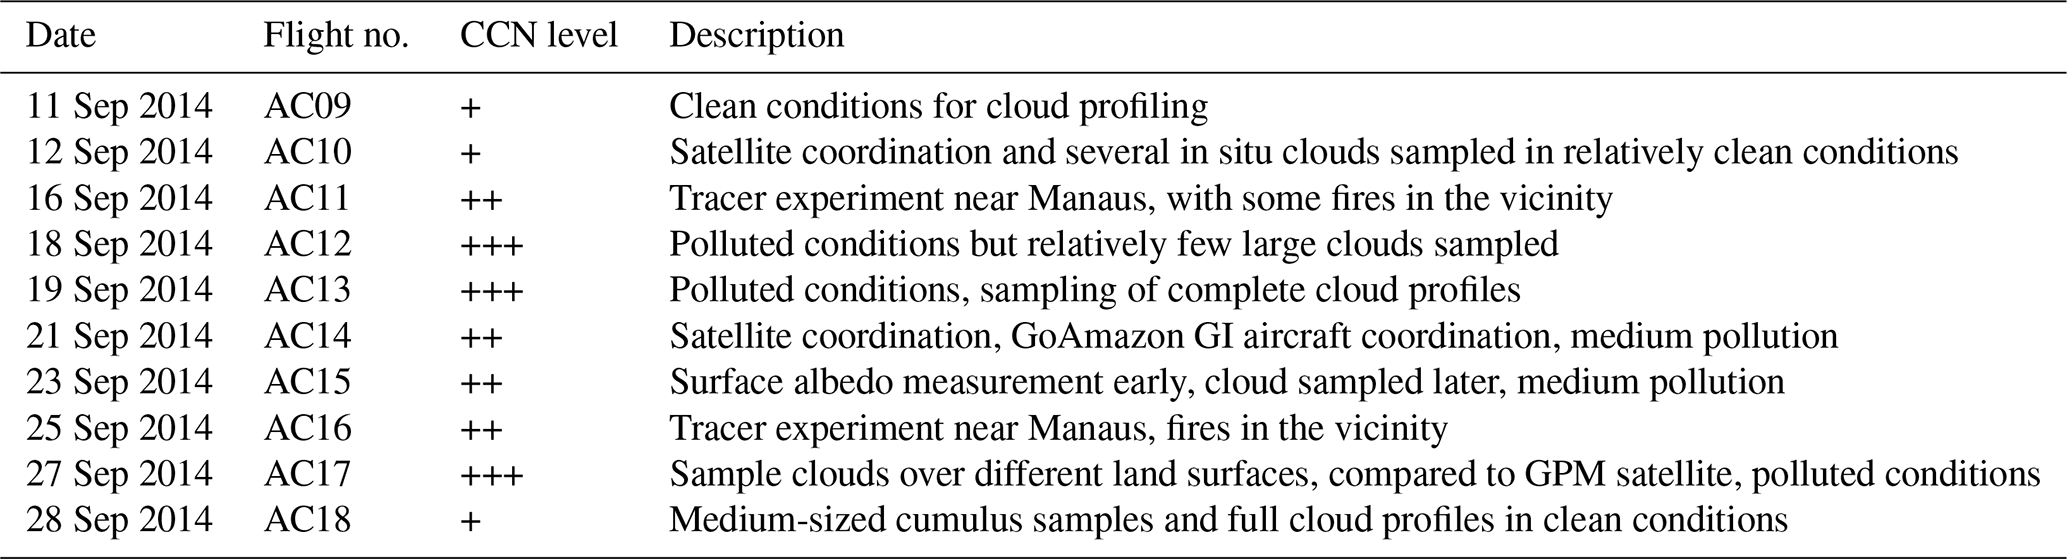
The “Aerosol, Cloud, Precipitation, and Radiation Interactions and Dynamics of Convective Cloud Systems–Cloud Processes of the Main Precipitation Systems in Brazil: A Contribution to Cloud Resolving Modeling and to the GPM (Global Precipitation Measurement) (ACRIDICON-CHUVA)” field campaign (Wendisch et al., 2016) was conducted over the Amazon in September 2014 during the dry season, when biomass burning from regional agricultural practices creates strong perturbations of cloud condensation nuclei (CCN) number concentration (Pöhlker et al., 2018). Researchers collected data on aerosol size and composition, CCN concentration, cloud phase and droplet size, trace gas concentrations, and other atmospheric quantities. Both remote-sensing and in situ data were collected aboard the High Altitude and Long Range Research Aircraft (HALO), operated by the German Aerospace Center (DLR). HALO flew underneath and within clouds to reconstruct vertical profiles. Typically, HALO research flights began with a ferry from Manaus to a region of interest, followed by sampling in that region, and ending with the trip back to Manaus (Fig. 1; Table 1). The regions of interest were areas with forecasted presence of convective clouds above specific surface conditions, such as intact forest or polluted agricultural burning areas. Many of the HALO flights were conducted in regions where medium or high aerosol number concentrations from biomass burning were suspected to influence cloud microphysical and radiative properties.
Table 1Dates of flights conducted during the ACRIDICON-CHUVA campaign, with basic information about each flight compiled from Wendisch et al. (2016) and the campaign blog (https://acridicon-chuva.weebly.com/, last access: 10 July 2018). CCN levels during each research flight are binned into low (“+”), medium (“++”), and high (“+++”).
2.2 Model
We attempted to reproduce the measurements conducted during the HALO flights using numerical simulations with the Weather Research and Forecasting model with Chemistry (WRF-Chem; Grell et al., 2005) at convection-permitting scales. The model simulated atmospheric motion with online calculations of trace gases and aerosol chemical and physical properties in a nested-domain setup; 1 ∘ resolution, 6-hourly updated meteorological boundary conditions were taken from analyses of the National Centers for Environmental Prediction Global Forecast System (NCEP GFS), and chemical boundary conditions were provided by forecasts of the global chemistry model MOZART (Model for Ozone And Related chemical Tracers; https://www.acom.ucar.edu/wrf-chem/mozart.shtml, last access: 6 February 2018).
The simulations feature a size-resolved description of the full life cycle of ambient aerosol, including biomass burning emissions, secondary particle formation through trace gas oxidation, and dry and wet deposition. Specifically, we used the MOZART gas-phase chemistry (Emmons et al., 2010; Knote et al., 2014) and the Model for Simulating Aerosol Interactions and Chemistry (MOSAIC) aerosol module (Zaveri et al., 2008), with a volatility basis set parameterization for organic aerosol evolution (Knote et al., 2015). Anthropogenic emission data were taken from the Emissions Database for Global Atmospheric Research from the Task Force on Hemispheric Transport of Air Pollution (EDGAR-HTAP; Janssens-Maenhout et al., 2012). Biogenic emissions are calculated online using the Model of Emissions of Gases and Aerosols from Nature (MEGAN; Guenther et al., 2006). The Fire INventory from NCAR (FINN) module was used for the fire emission data (Wiedinmyer et al., 2011).
Radiative properties of the aerosol population are considered based on size distribution and component-resolved optical properties (Barnard et al., 2010). The modeled aerosol description is linked to the double-moment microphysics scheme of Morrison and Gettelman (2008), and no convection parameterization was applied in the nested domain. The Morrison and Gettelman (2008) scheme has five hydrometeor classes (cloud droplets, rain, cloud ice, snow, and graupel), with each size distribution parameterized by a gamma function. The cloud droplet effective radius is calculated through integration over the droplet size distribution:
with r being the cloud droplet radius and N(r) the droplet number concentration at radius r.
Effects of aerosol particles on atmospheric radiation (direct effect) are considered as presented in Fast et al. (2006). The number of CCN available for cloud formation as well as their physiochemical properties (size distribution and hygroscopicity) are provided to the cloud microphysics scheme based on the online-calculated aerosol properties. Activation of aerosol particles as cloud droplets is calculated based on the aerosol size distribution and chemical composition using κ-Köhler theory (Abdul-Razzak and Ghan, 2000, 2002), with relevant aspects of the implementation in the version of WRF-Chem used here presented in Gustafson Jr. et al. (2007) and Chapman et al. (2009). The life cycle of activated aerosol particles is modeled explicitly; i.e., they are removed from the interstitial aerosol population, and their evolution is modeled in accordance with that of the cloud droplets in which they are incorporated, including processes like washout from precipitation or re-evaporation. Secondary, in-cloud activation of aerosol particles to cloud droplets is only considered to the extent that entrainment and in-cloud supersaturation is represented on the grid scale. Other sources of secondary activation such as ultrafine particles (Fan et al., 2018) are not considered. Cloud chemistry and limited heterogeneous processes are included as presented in Knote et al. (2015). Chemistry and aerosol processes are included in an operator-splitting fashion, in which individual processes update model fields sequentially. For each WRF-Chem time step, advection is calculated first, followed by droplet activation and then chemistry and aerosol processes.
The above-described WRF-Chem simulations were conducted over the Amazon region for the ACRIDICON-CHUVA mission period between 8 and 30 September 2014. A continuous simulation with 15 km horizontal resolution, covering an area of approximately 3000 km×2700 km (200×180 grid points), and 36 vertical levels up to 50 hPa, was conducted for the full campaign period (see Fig. 1 for domain overview). To keep the large-scale meteorology in line with reality, WRF-Chem was restarted every 24 h (at 0 h UTC) from GFS analyses. Concentrations of trace gases and aerosol quantities were carried over, however, to allow for multi-day pollution build-up and aging. Each 24 h period was simulated with a 6 h meteorological spin-up with nudging and a chemical restart file from the previous day. Meteorology was then allowed to evolve freely within the WRF-Chem domain (i.e., no nudging was applied) to enable the model to develop the implemented aerosol–cloud interactions. Three additional days before the study period were simulated to spin-up trace gas chemistry and aerosol.
Convection-permitting, 3 km horizontal-resolution domains (180×180 grid points, approximately 540 km×540 km) were then “nested” into this simulation during days with HALO flights. Two-way interactions were allowed between the parent and the nested domains. The locations of these “nests” varied and were chosen so that they covered the area of interest sampled by HALO in each flight (Fig. 1; see also Sect. 3.1). On each flight day, the nested domain was started (by interpolating the current state of the outer domain) at 09:00 UTC and run until 21:00 UTC, hence covering the full time frame of each HALO research flight. All model results presented in this study are from the nested, convection-permitting domains.
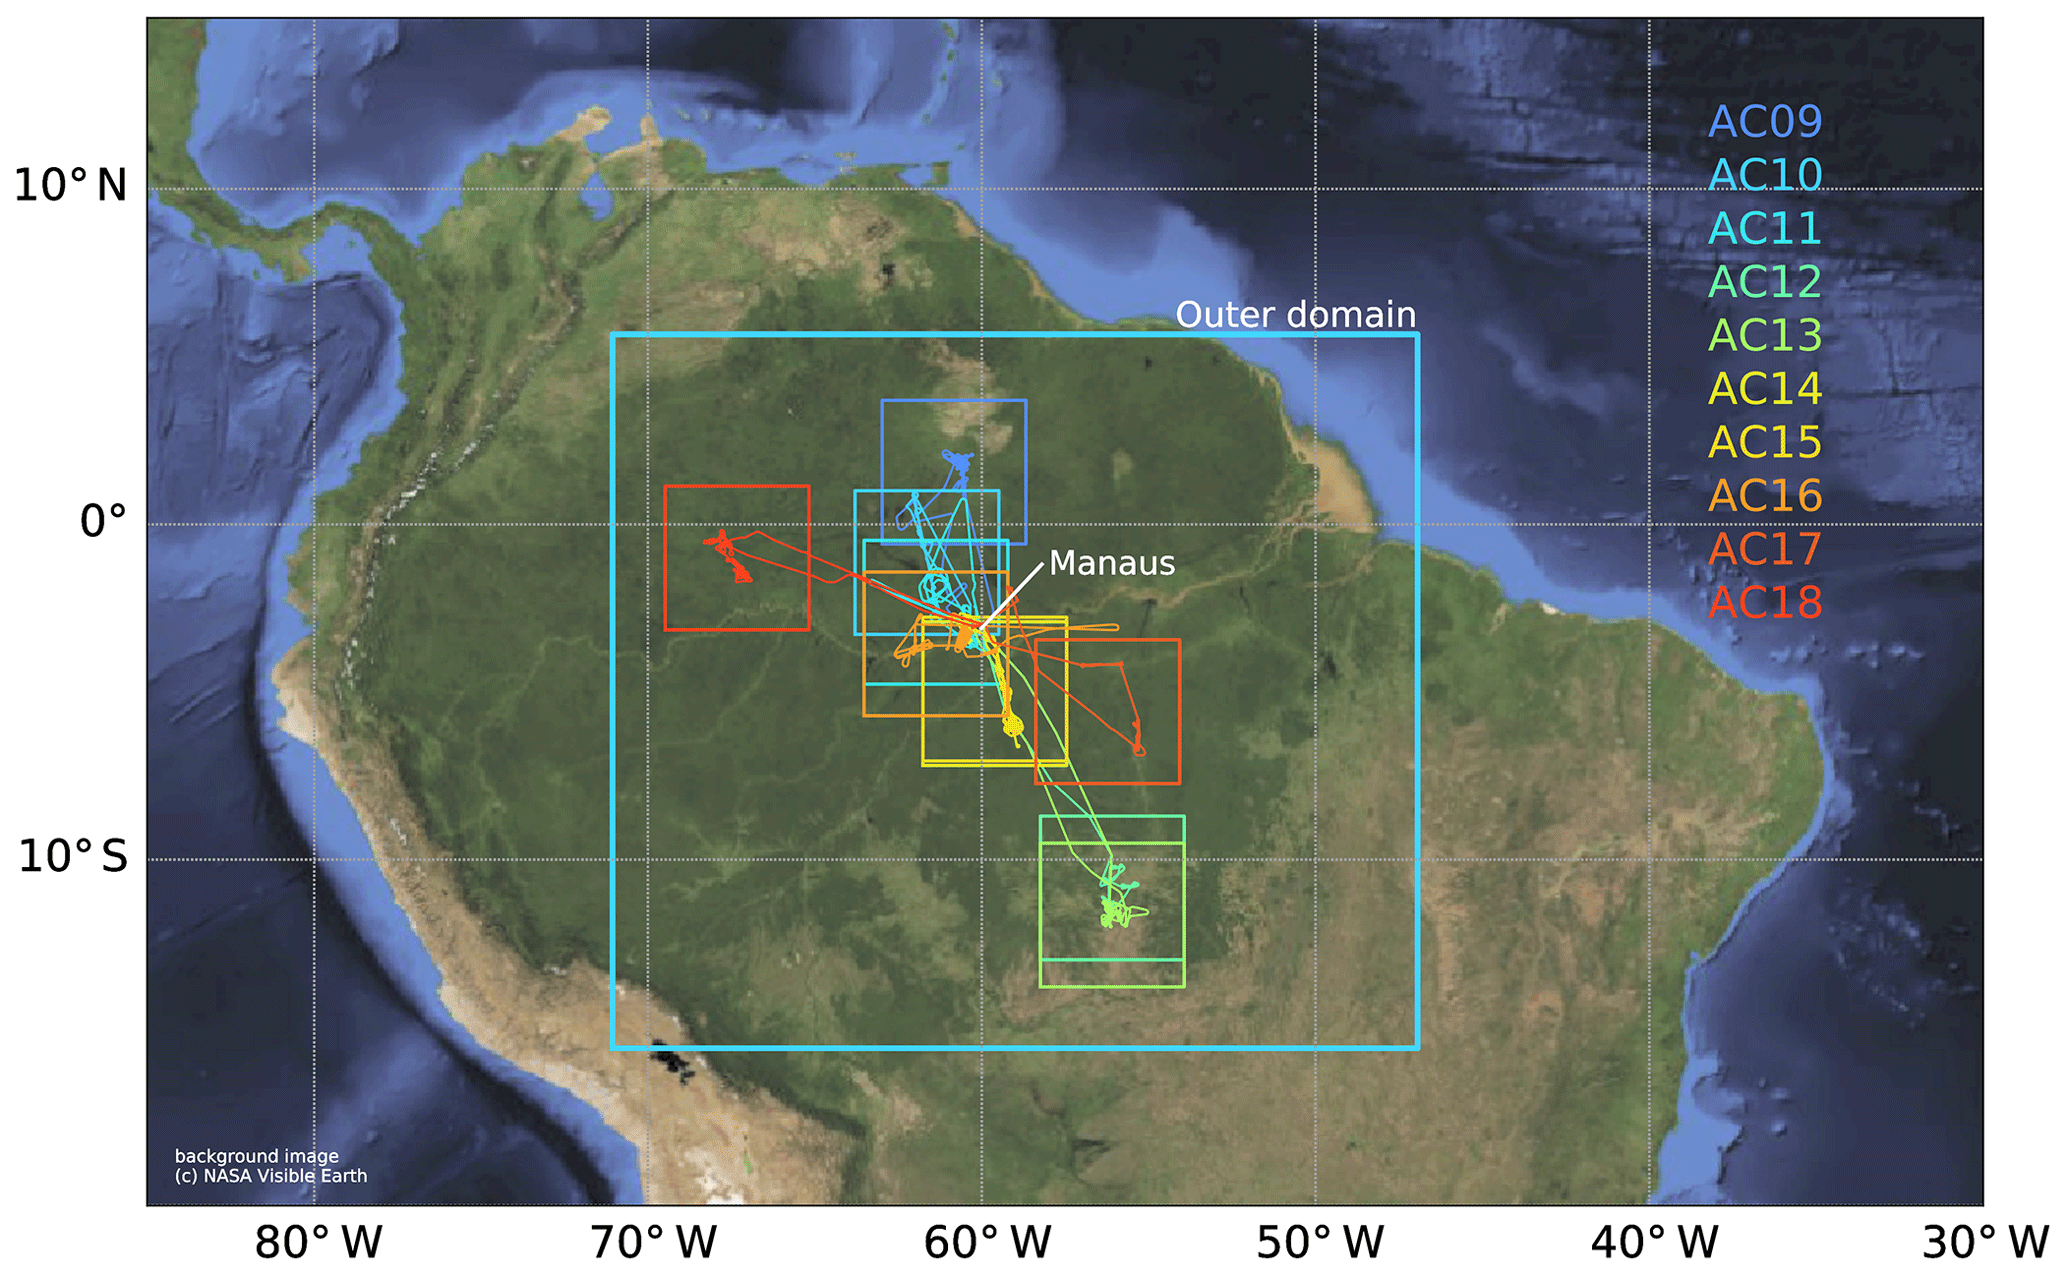
Figure 1A map showing the campaign area, with all ACRIDICON-CHUVA research flights considered in this study as color-coded lines, the continuously run outer simulation domain (blue box), and the individual nested domains used for analysis of each research flight, identified by the flight labels (Table 1). The outer domain resolution is 15 km, and the inner domain resolution is 3 km.
2.3 Measurements
2.3.1 Cloud in situ measurements
The cloud combination probe (CCP) combines the cloud imaging probe (CIP) and the cloud droplet probe (CDP) to measure the cloud particle size distribution by detecting their forward-scattered laser light (Lance et al., 2010). During the ACRIDICON-CHUVA campaign, the CCP measured at 1 Hz frequency from underneath the right wing of the HALO aircraft (Wendisch et al., 2016). A correction for the high flight velocities was applied to improve data quality (Weigel et al., 2016). The CCP measures particles with diameters between 2 and 960 µm, but here we only used the 14 bins for particle diameters from 3 to 50 µm (from the CDP) to calculate the cloud particle effective radius. Except for the details of the selection of appropriate data points, the data used here are the same as described in Braga et al. (2017a). To filter the data, we calculated liquid water content from binned effective diameter measurements and only included those with at least 1 g kg−1 liquid water content. This threshold is consistent with the one used to define “cloudy” points in model output.
Like the CCP–CDP, the cloud and aerosol spectrometer with depolarization (CAS-DPOL) measures cloud particle size distributions at 1 Hz frequency (Baumgardner et al., 2011; Voigt et al., 2017). The CAS-DPOL measures the intensity of forward-scattered light between 4 and 12∘ in 30 size bins from particles with a diameter of 0.5–50 µm. The polarized backward-scattered light is used to analyze the sphericity and thermodynamic phase of the measured particles (Baumgardner et al., 2014; Järvinen et al., 2016), but this capability was not used for our analysis. Our calculation of the cloud particle effective radius (Schumann et al., 2017) was again limited to particles between 3 and 50 µm, which corresponds to 10 Mie-ambiguity-corrected size bins, to account for consistency with the CDP. Further details on CAS-DPOL data evaluation are given in Kleine et al. (2018).
Profiles of reff were derived using data from both the CAS-DPOL and the CDP. Braga et al. (2017a) demonstrated that the CDP and CAS-DPOL instruments are comparable within their expected measurement uncertainties. Flamant et al. (2018) and Taylor et al. (2019) also found good agreement between CAS-DPOL and CDP measurements in shallow clouds. Here, we combine measurements from both instruments into one in situ dataset to construct effective radii profiles. Therefore, the concentration of activated cloud condensation nuclei Na is derived using all in situ reff measurements with their respective adiabatic liquid water content (see further description in Sect. 2.3.4). Treating in situ measurements from the two instruments as independent is justifiable in part because they are located on opposite wings of the aircraft.
2.3.2 CCN in situ measurements
The number concentration of CCN was measured with a continuous-flow streamwise thermal-gradient CCN counter (CCNC, model CCN-200, DMT, Longmont, CO, USA; Roberts and Nenes, 2005; Rose et al., 2008). Activated CCN that grow to a diameter of at least 1 µm at a set water vapor supersaturation between 0.1 % and 5 % are counted by the instrument at 1 Hz. Two sample inlets were used during the ACRIDICON-CHUVA campaign, but here we only use data from the HALO aerosol submicron inlet (HASI), which collected data at a constant supersaturation of 0.55 %. The uncertainty of the CCN measurements is dominated by the counting statistics and ranges between 10 % for high CCN and 20 % for low CCN (Krüger et al., 2014). The supersaturation uncertainty is also about 10 % (Braga et al., 2017a).
2.3.3 Cloud remote-sensing measurements
The spectral imager of the Munich Aerosol and Cloud Scanner (specMACS) was installed on the HALO aircraft during ACRIDICON-CHUVA. specMACS is a hyperspectral line camera that measures at visible and near-infrared wavelengths (Ewald et al., 2016). Marshak et al. (2006) and Martins et al. (2011) suggested using the solar radiation reflected by illuminated cloud sides to derive the vertical profile of effective radius and cloud phase, but the ACRIDICON-CHUVA campaign was the first time that passive cloud-side remote sensing was applied systematically for a large number of cases. Zinner et al. (2008) and Ewald et al. (2019) developed a cloud-side retrieval and demonstrated the application using ACRIDICON-CHUVA data. Jäkel et al. (2017) derived phase information from cloud-side reflectivity measurements during ACRIDICON-CHUVA. specMACS was mounted on HALO at a sideward viewing port to observe clouds passed by the aircraft. Cloud vertical profiles were then retrieved using the method by Ewald et al. (2019) along the flight route akin to a push-broom satellite instrument. Results for three cases are compared to in situ and WRF-Chem model data.
specMACS cases shown in this paper are first-example cases and mainly presented to showcase the capability of airborne remote sensing to provide effective radius profiles and CDNC. They are not as representative for whole flights or flight regions as the used in situ or modeled data but show specific examples of local situations along a few minutes of flight time. In this respect they complement the large-scale picture provided by modeled data averaged over 540 km×540 km or the in situ data collected over several hours of flight time. specMACS cloud scenes were selected based on favorable data collection conditions. This includes minimal turning of the aircraft, favorable sunlight conditions, and high cloud coverage.
2.3.4 Derivation of Na from in situ, remote-sensing, and model cloud data
The central quantity for determining the influence of aerosol on cloud development and lifetime is the number of activated cloud condensation nuclei at cloud base, Na (e.g., Khain et al., 2005; Freud et al., 2011). During ACRIDICON-CHUVA, HALO directly sampled Na during their cloud profile flights, providing a valuable comparison to remotely sensed and modeled data. As the collection of in situ data is expensive and spatial coverage is limited, Rosenfeld et al. (2012) suggested inferring Na at cloud base using other more readily available observations like satellite retrievals. Freud et al. (2011) proposed a parametrization that derives Na from the vertical profile of droplet radii. To do this, cloud-base temperature and pressure are first used to calculate an adiabatic liquid water content (LWCa) under the assumption that all water vapor above the saturation vapor pressure is condensed during the moist adiabatic ascent of a parcel. Then, LWCa can be combined with an empirical relation between reff and the volumetric radius, rv (i.e., , as in Freud et al., 2011), and the density of water ρw to derive a fixed Na:
The ratio of LWCa and is found as the slope of a linear regression through all available point pairs of LWCa and in the droplet size profile, forced through the origin. An additional mixing factor of 0.7 accounts for the imperfection of the adiabatic assumption (Freud et al., 2011; Braga et al., 2017a). Freud et al. (2011) empirically derived this factor using in situ effective radius and LWC data from multiple previous field campaigns, including one in the Amazon. Although there was geographic diversity in the data used for the derivation, only one estimation was made which may introduce an unknown error in our studies. This could be especially relevant for remotely sensed data that measure cloud sides rather than a cloud cross section. Nonetheless, we apply the same derivation and same mixing factor to all three available reff datasets: remotely sensed, in situ, and model output. Applying this method to multiple data sources provides insights into the validity of this concept. The resulting Na can also be used for direct comparison of the different input reff profiles.
3.1 Deriving comparable quantities for model–measurement evaluation
Comparing the three different sources of information on cloud microphysical properties (model, remote-sensing, and in situ observations) is not straightforward. Colocating in situ and remote-sensing observations required observing a cloud using the side-facing specMACS and then flying into this cloud to obtain respective in situ measurements. During ACRIDICON-CHUVA, cloud clusters had been identified for each research flight, which were then passed several times to allow for remote-sensing observations before probing these clusters in situ. This precludes direct comparison of individual clouds without diligent data selection but allows for a statistical comparison of in situ data collected near the cluster and the corresponding remote-sensing observations. Simulations will not reproduce an individual (observed) cloud, but they will create a comparable, realistic regional environment with comparable clouds. Hence, the nested domains were chosen such that they center on the cloud cluster chosen as a target for an ACRIDICON-CHUVA research flight. Assuming a homogeneous environment within the model domain, a statistical comparison of all modeled clouds in the model domain with observations taken of the cloud cluster within the domain is reasonable. Therefore, we used all clouds within the respective nested model domain to derive model statistics. Observation statistics are based on all data collected within the spatial domain of the model nest. As mentioned above, statistics pertaining to in-cloud variables are restricted to data points with a liquid water content of more than 1 g kg−1 in both model and observations.
3.2 Cloud droplet number concentrations
Figure 2 shows median in situ measurements of CDNC during flights and the median CDNC values from the entire nested model domain corresponding to the flight. Modeled and measured CDNC match for lower values of 200 cm−3 (AC09) but diverge for higher values. There is a linear relationship between WRF-Chem results and observations, albeit below the 1-to-1 line, leading to a factor of 2 of underestimation of CDNC for the most polluted case investigated (AC12, with about 750 cm−3 observed).
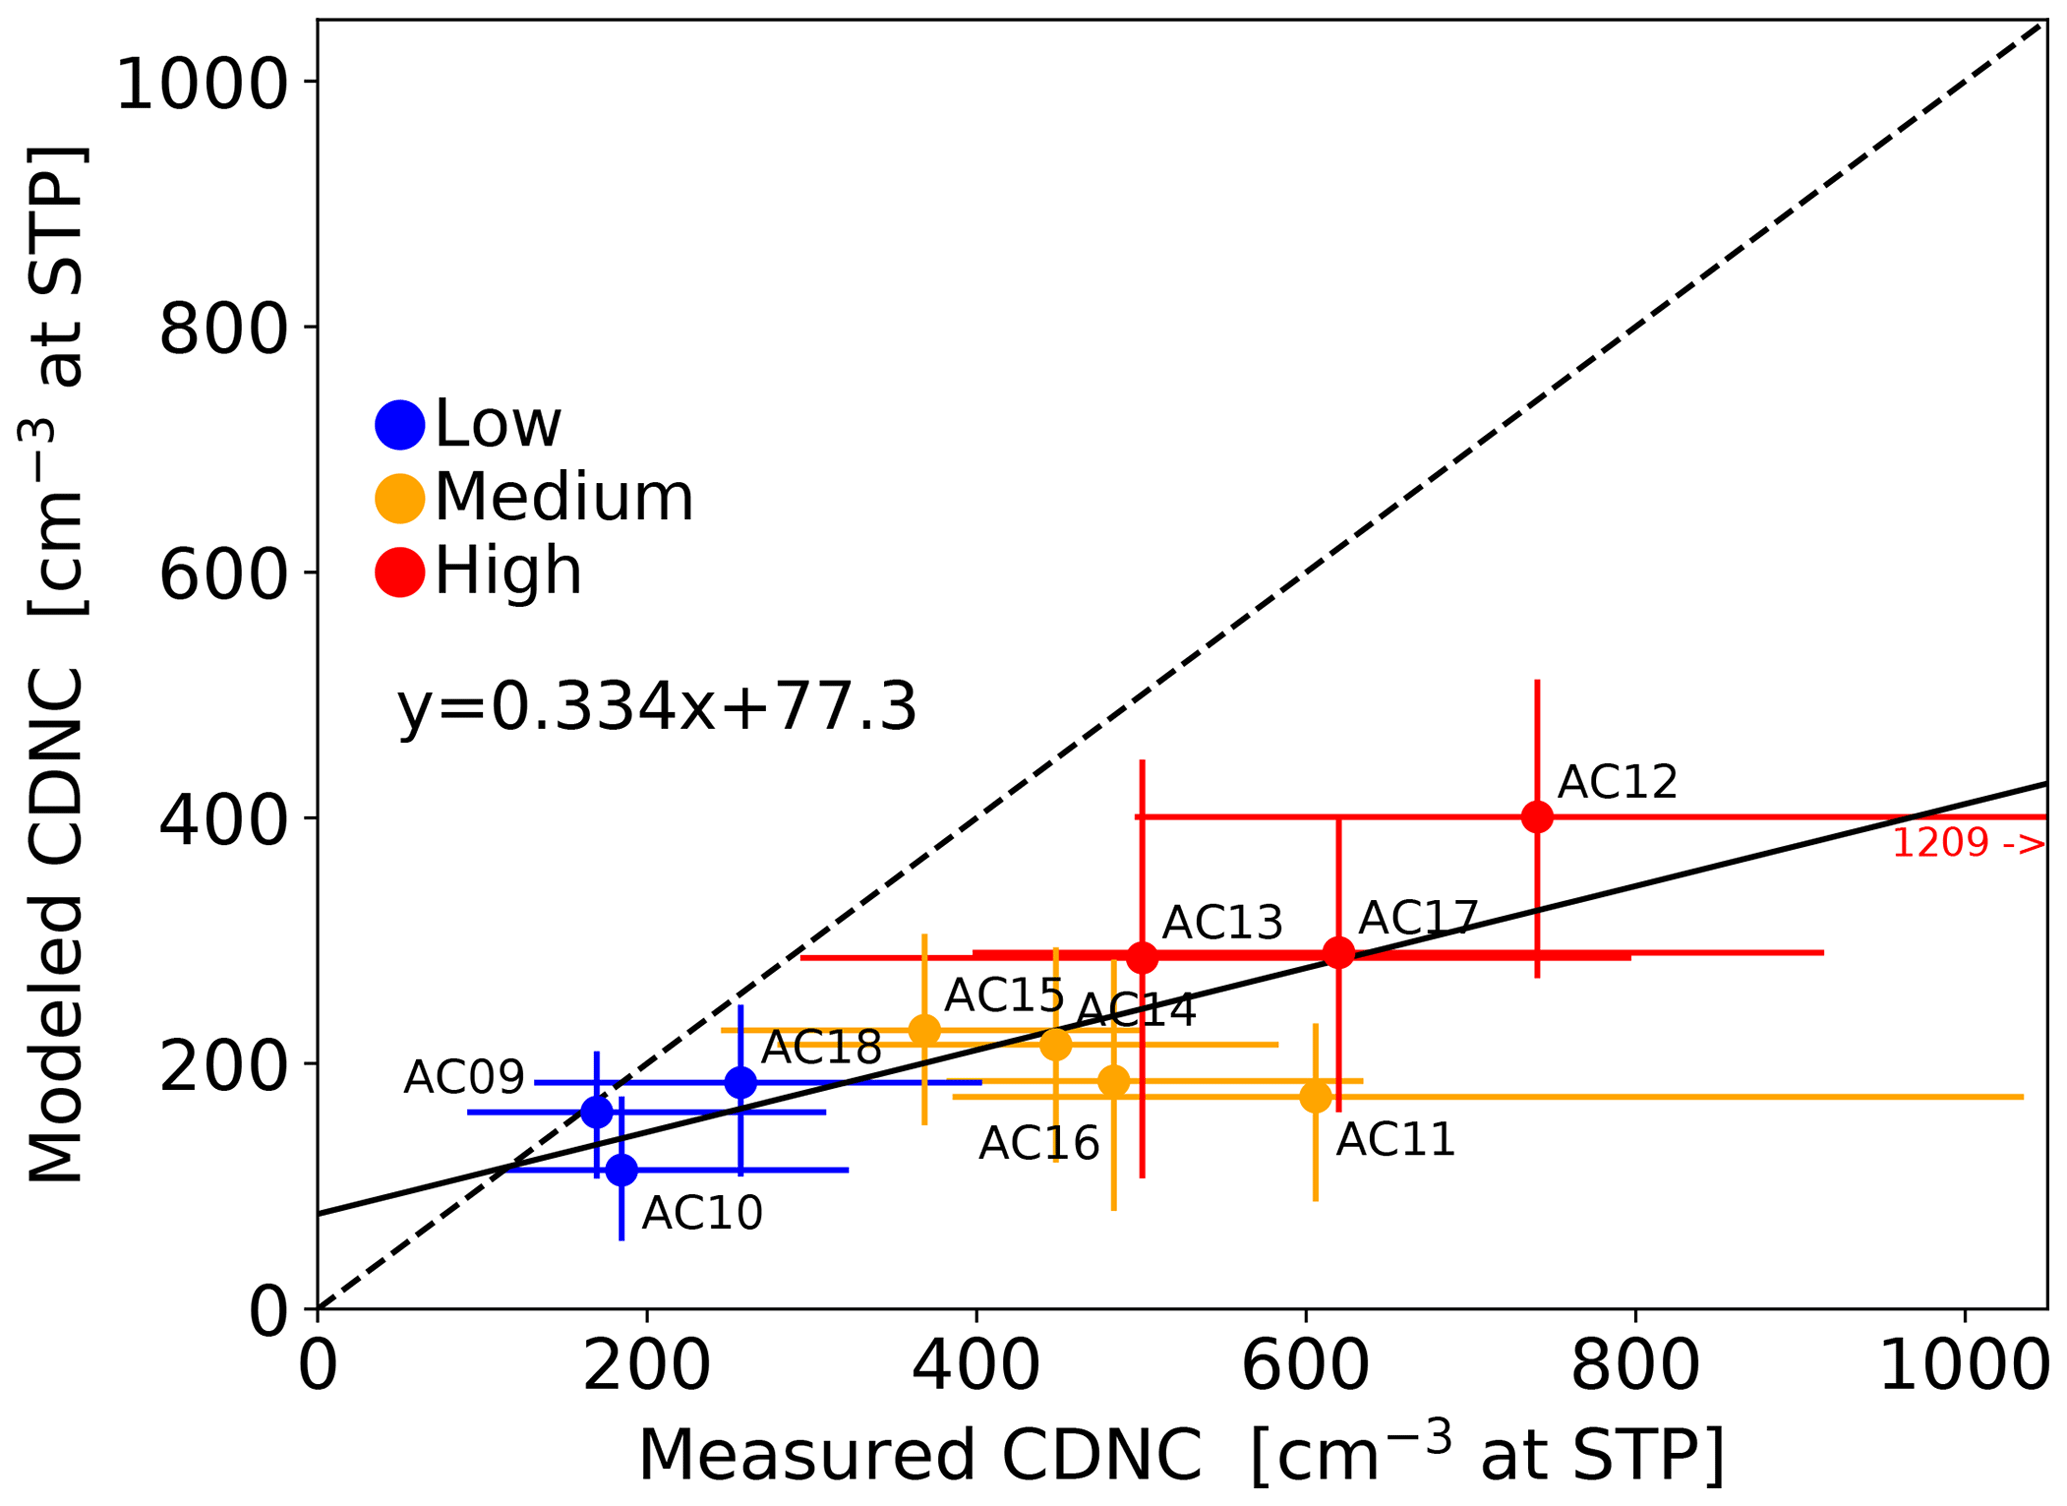
Figure 2Median cloud droplet number concentration from the WRF domain and in situ measurements. The colors correspond to the CCN-level labels in Table 1. Error bars depict the interquartile range (25 %–75 % of all values). The equation describes the (solid black) regression line. The dashed black line is a 1-to-1 line for reference. STP refers to standard temperature (273.15 K) and pressure (1000 hPa).
3.3 Variability in modeled reff profiles
All WRF-Chem modeled reff data from the 10 nested domains were combined and binned by cloud-base CCN concentration (Fig. 3). Cloud-base CCN is defined as the modeled CCN concentration at 0.5 % supersaturation directly below the lowest cloudy pixel in a model column.
The binning of reff profiles shows that the modeled profiles correspond to theoretical expectations; clouds with more available CCN have a reff profile that is shifted towards smaller values relative to those with fewer available CCN. The response to CCN concentration saturates in the model at around 500–600 cm−3, indicating that biomass burning effects will be nonlinear and strongest in relatively clean conditions. We did not find such a saturation effect for CDNC (Fig. 2). Between 2 and 4 km a.s.l., where the most model clouds occur, the slope of the profile also scales with available CCN. The radius grows quickly with height to a maximum reff under low-CCN (clean) conditions, whereas under high-CCN (polluted) conditions the radius does not reach a maximum until much higher in the atmosphere. The profiles reach a maximum and then remain roughly constant at higher elevations. Under clean conditions, the maximum reff is larger and is reached at lower elevations. Profiles for the cleanest conditions also exhibit the largest maximum median reff of about 17 µm.
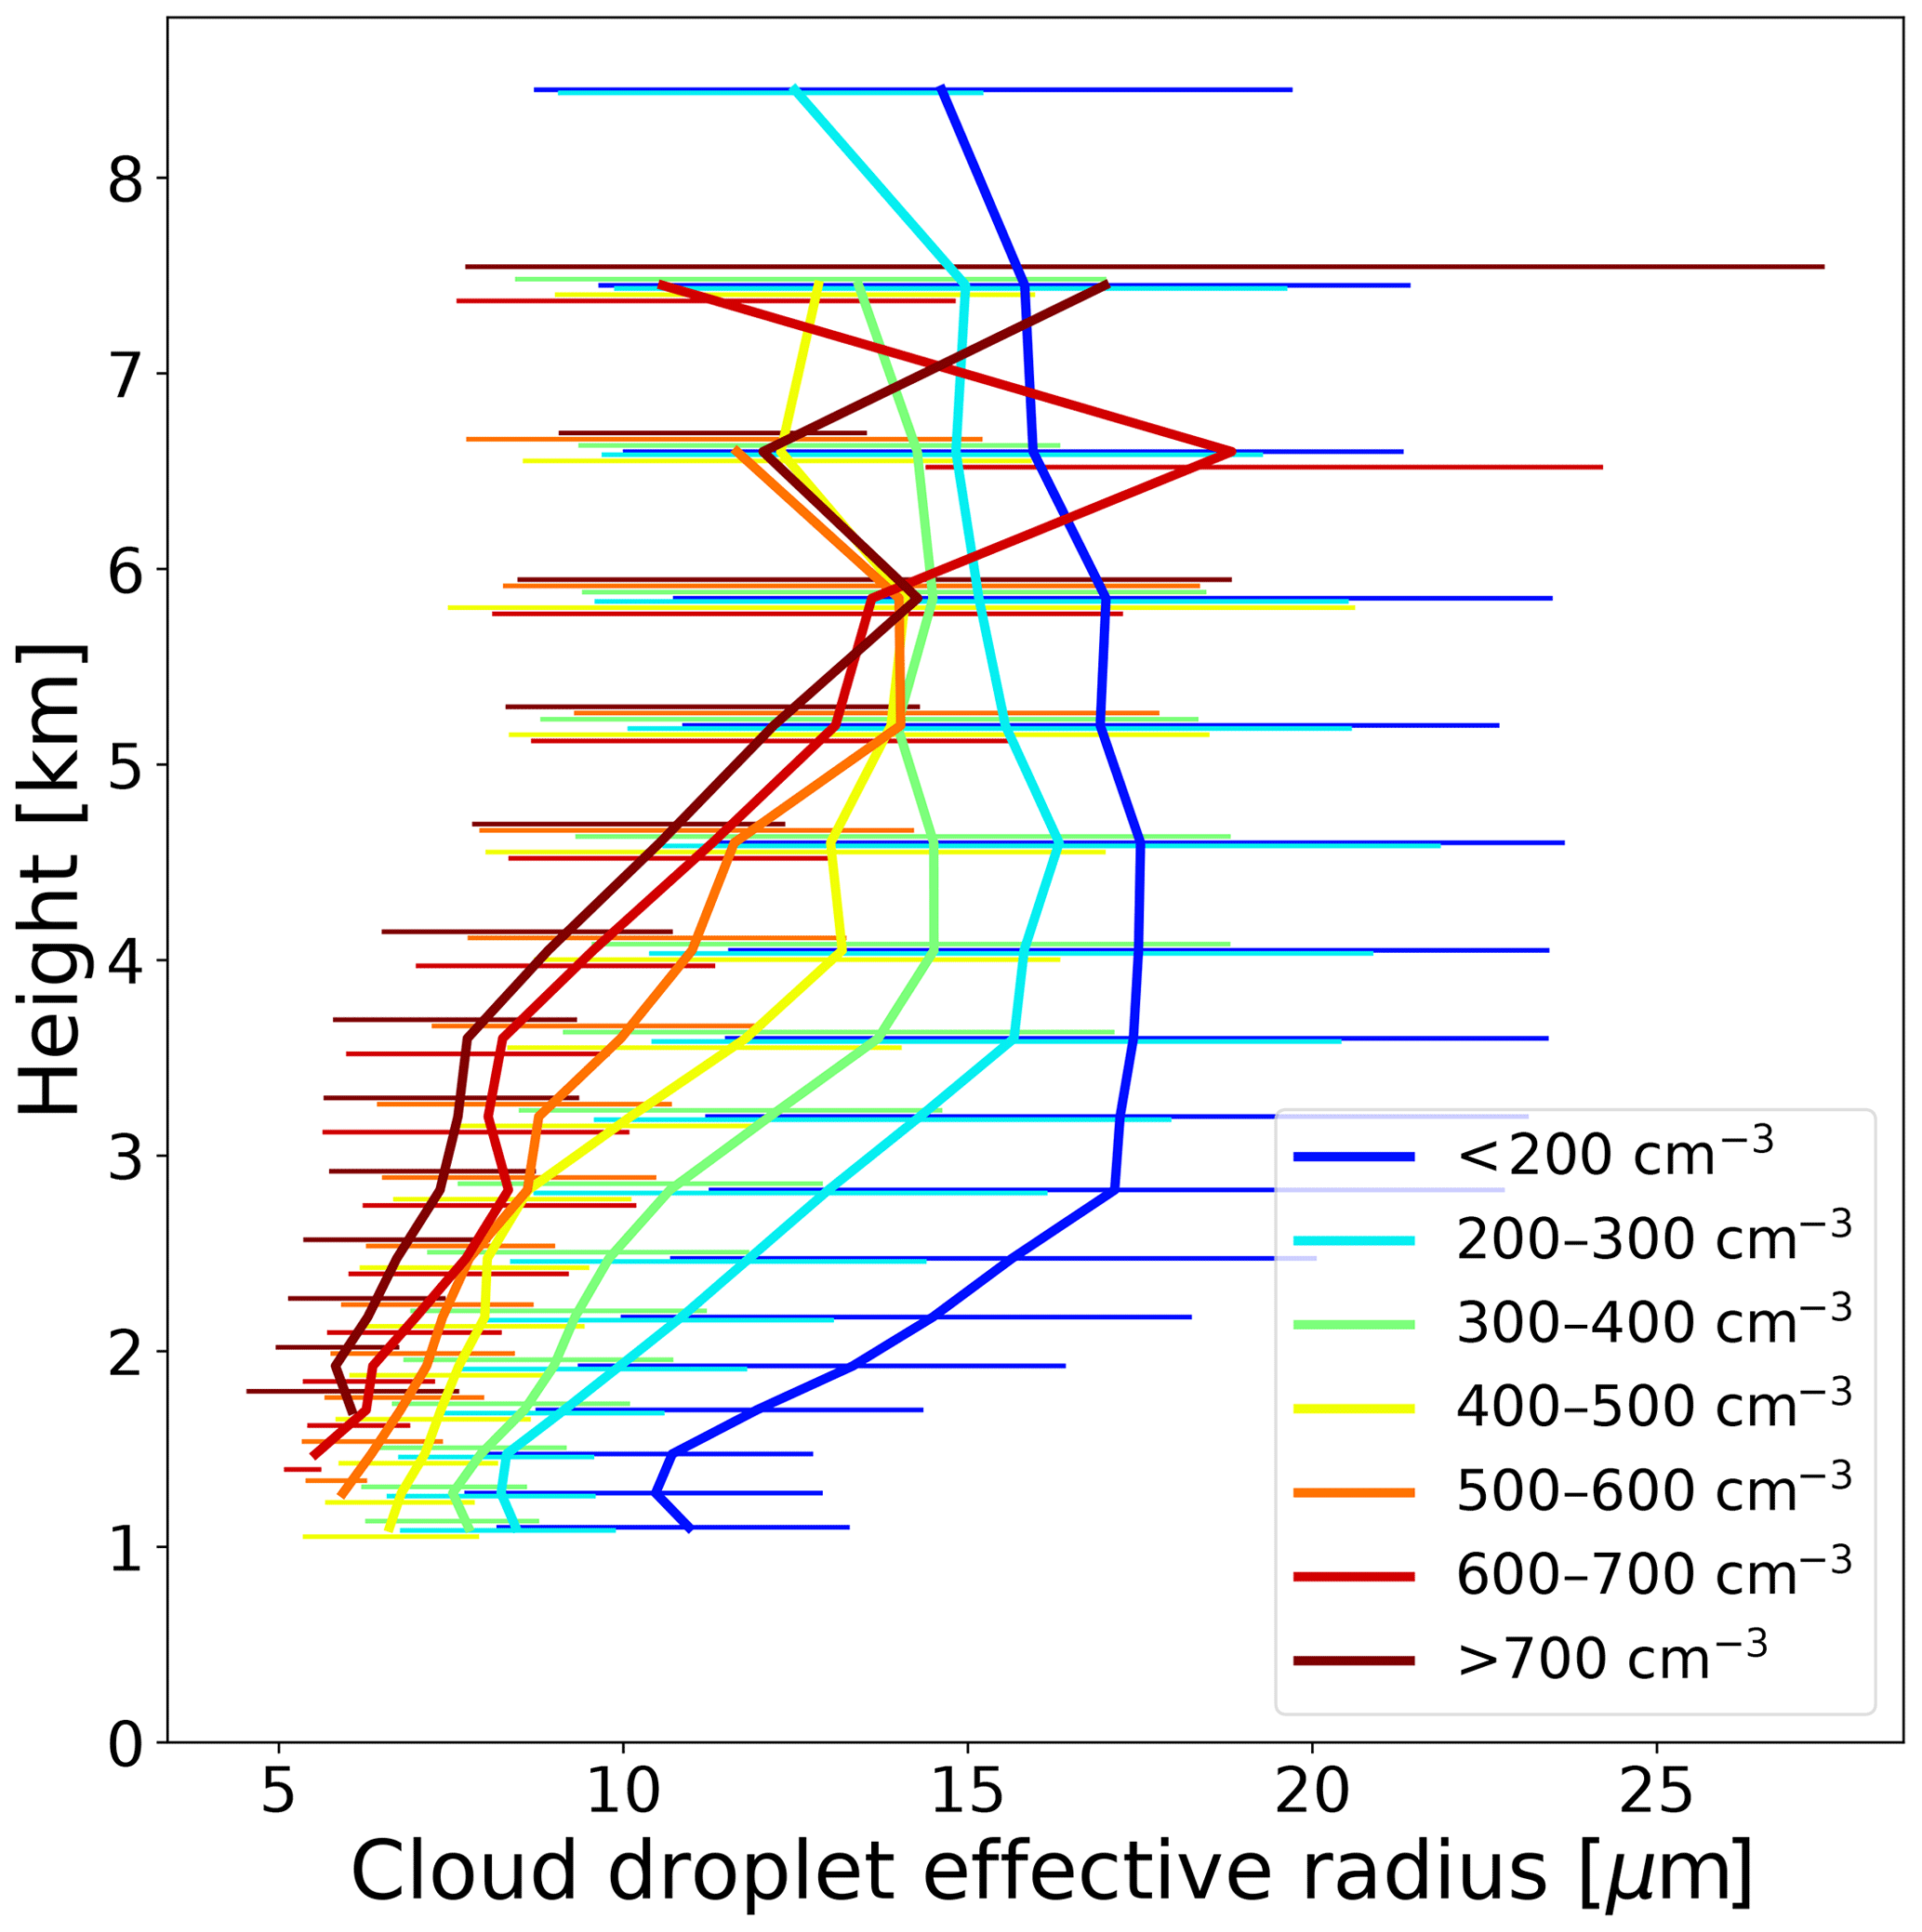
Figure 3WRF-Chem-simulated median cloud droplet effective radius vertical profiles from all nested-domain output during the study period, binned by below-cloud CCN concentration (cm−3 at STP). Error bars represent the 20th to 80th percentile for each level and are offset vertically for readability.
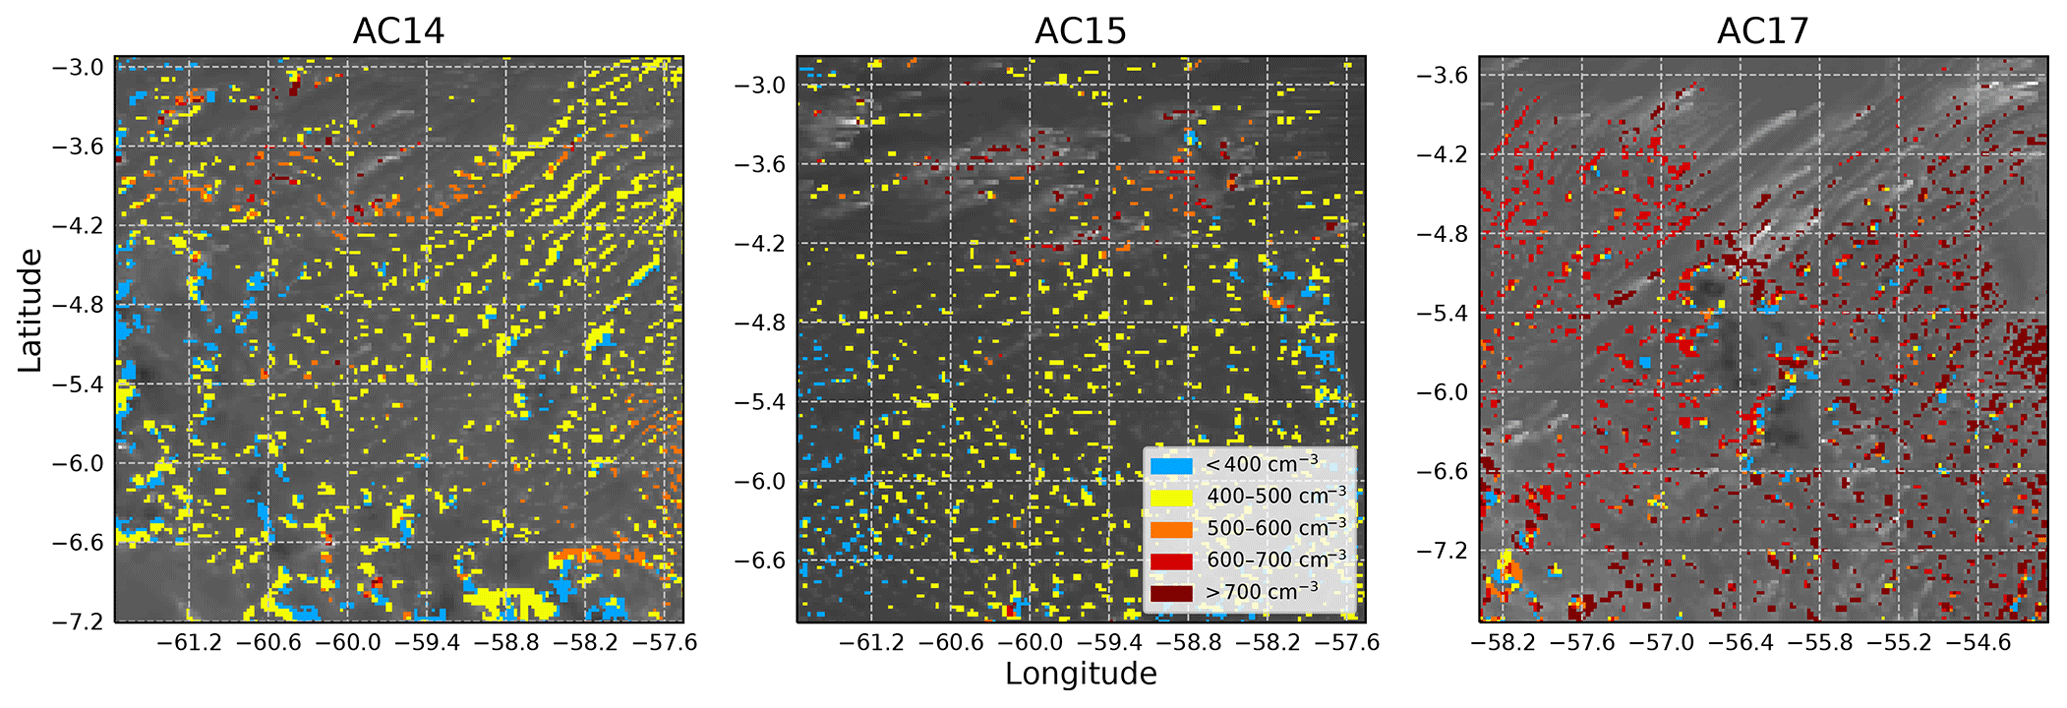
Figure 4Spatial variability in modeled concentration of CCN at cloud base on 3 d (at 18 Z) for the entire nested domain. Modeled aerosol optical depth (AOD) is shown as grey shading in the background, with brighter colors indicating higher AOD values. CCN concentrations are only shown where clouds were present.
3.4 Comparison of modeled and observed reff profiles
WRF-Chem modeled reff profiles were compared to remotely sensed and in situ measured profiles. In Fig. 4 we show snapshots of the spatial variability in modeled CCN concentrations at cloud base for 3 different days. This figure demonstrates the influence of the fires on the regional CCN concentrations and highlights the CCN variability at large and small scales. Three-dimensional CCN fields were simulated, but below-cloud concentrations (i.e., CCN concentration below the lowest cloudy point in a column) are most relevant for cloud droplet size. Figure 5a–c then show reff profiles derived from specMACS from 2 min cloud scenes on these 3 d, below-cloud-CCN binned WRF reff profiles from 3 h near the specMACS data collection time, and all in situ reff profile measurements within the nested model domain. Figure 5d–f show the known modeled and in situ CDNC. No CDNC is available for the specMACS observations, since those data are remotely sensed.
Note that this is an approximate comparison, as no exact colocation can be expected between in situ and remotely sensed clouds, and we cannot compare individual modeled clouds directly to observed ones. Visual inspection of the slope and magnitude of median reff profiles measured by specMACS suggests that they match reasonably well to those from WRF-Chem, though in situ reff values tend to be smaller than both the modeled ones or the ones retrieved by specMACS for all three cases investigated here.
The relatively small differences between reff profiles at larger CDNC are expected because the theoretical relationship between reff and CDNC is (Morrison and Gettelman, 2008). A linear relationship between LWC and CDNC therefore results in saturation of reff. However, the CDNC at which this saturation occurs is not equally well described.
3.5 Number of activated cloud condensation nuclei at cloud base
As a more quantitative comparison of the different profiles, the number of activated CCN at cloud base (Na) was derived for each profile based on the methodology proposed in Freud et al. (2011). Braga et al. (2017a) already showed a comparison against in situ measurements, which we use as a starting point here for an evaluation against remote-sensing and regional model results. For the 3 same days as in Fig. 5, Fig. 6a–c show the regressions between adiabatic liquid water content (LWCa) and mean volume radius (rv) that result (using Eq. 2) in the calculated Na,calc values shown in Fig. 6d–f. LWCa for the modeled profiles was calculated in model clouds at the same points as used for the reff values. For specMACS, a nested-domain-averaged LWCa profile was used, since the below-cloud CCN is unknown for those measurements. The same profile was used for the in situ LWCa to allow for direct comparisons. Only the increasing portion of the WRF-Chem profiles were used for the fits in Fig. 6a–c; points above the first decrease that occurs above 4 km are excluded. The known CDNC (Fig. 5) and calculated Na (Fig. 6) matched well, given that CDNC is viewed as equivalent to Na, although Na is an upper limit for CDNC, since CDNC can be influenced by processes like collision and coalescence. A direct comparison of the true and derived CDNC are shown in Fig. 7. This comparison demonstrates the effectiveness of the Freud et al. (2011) method for model data. The relationship is linear, but there is a systematic positive bias of derived CDNC. The factor of 0.7 as taken from the literature may be an underestimation for the modeled clouds. Sensitivity of the derivation to cloud-base height may explain why using modeled LWCa resulted in high derived CDNC for two of the in situ derivations. Another contributor could be the high low-level CCN concentrations that were not reached in the model and in part by the use of an average model LWCa rather than a “true” LWCa. Even though Na,WRF and Na,calc do not match exactly, general trends are captured. The Na values derived from the specMACS reff profiles (Na,spec) fall within the range of modeled CDNC values (Fig. 6d–f). Compared to the modeled CDNC, specMACS-derived Na,spec values are relatively high, low, and central for AC14, AC15, and AC17, respectively.
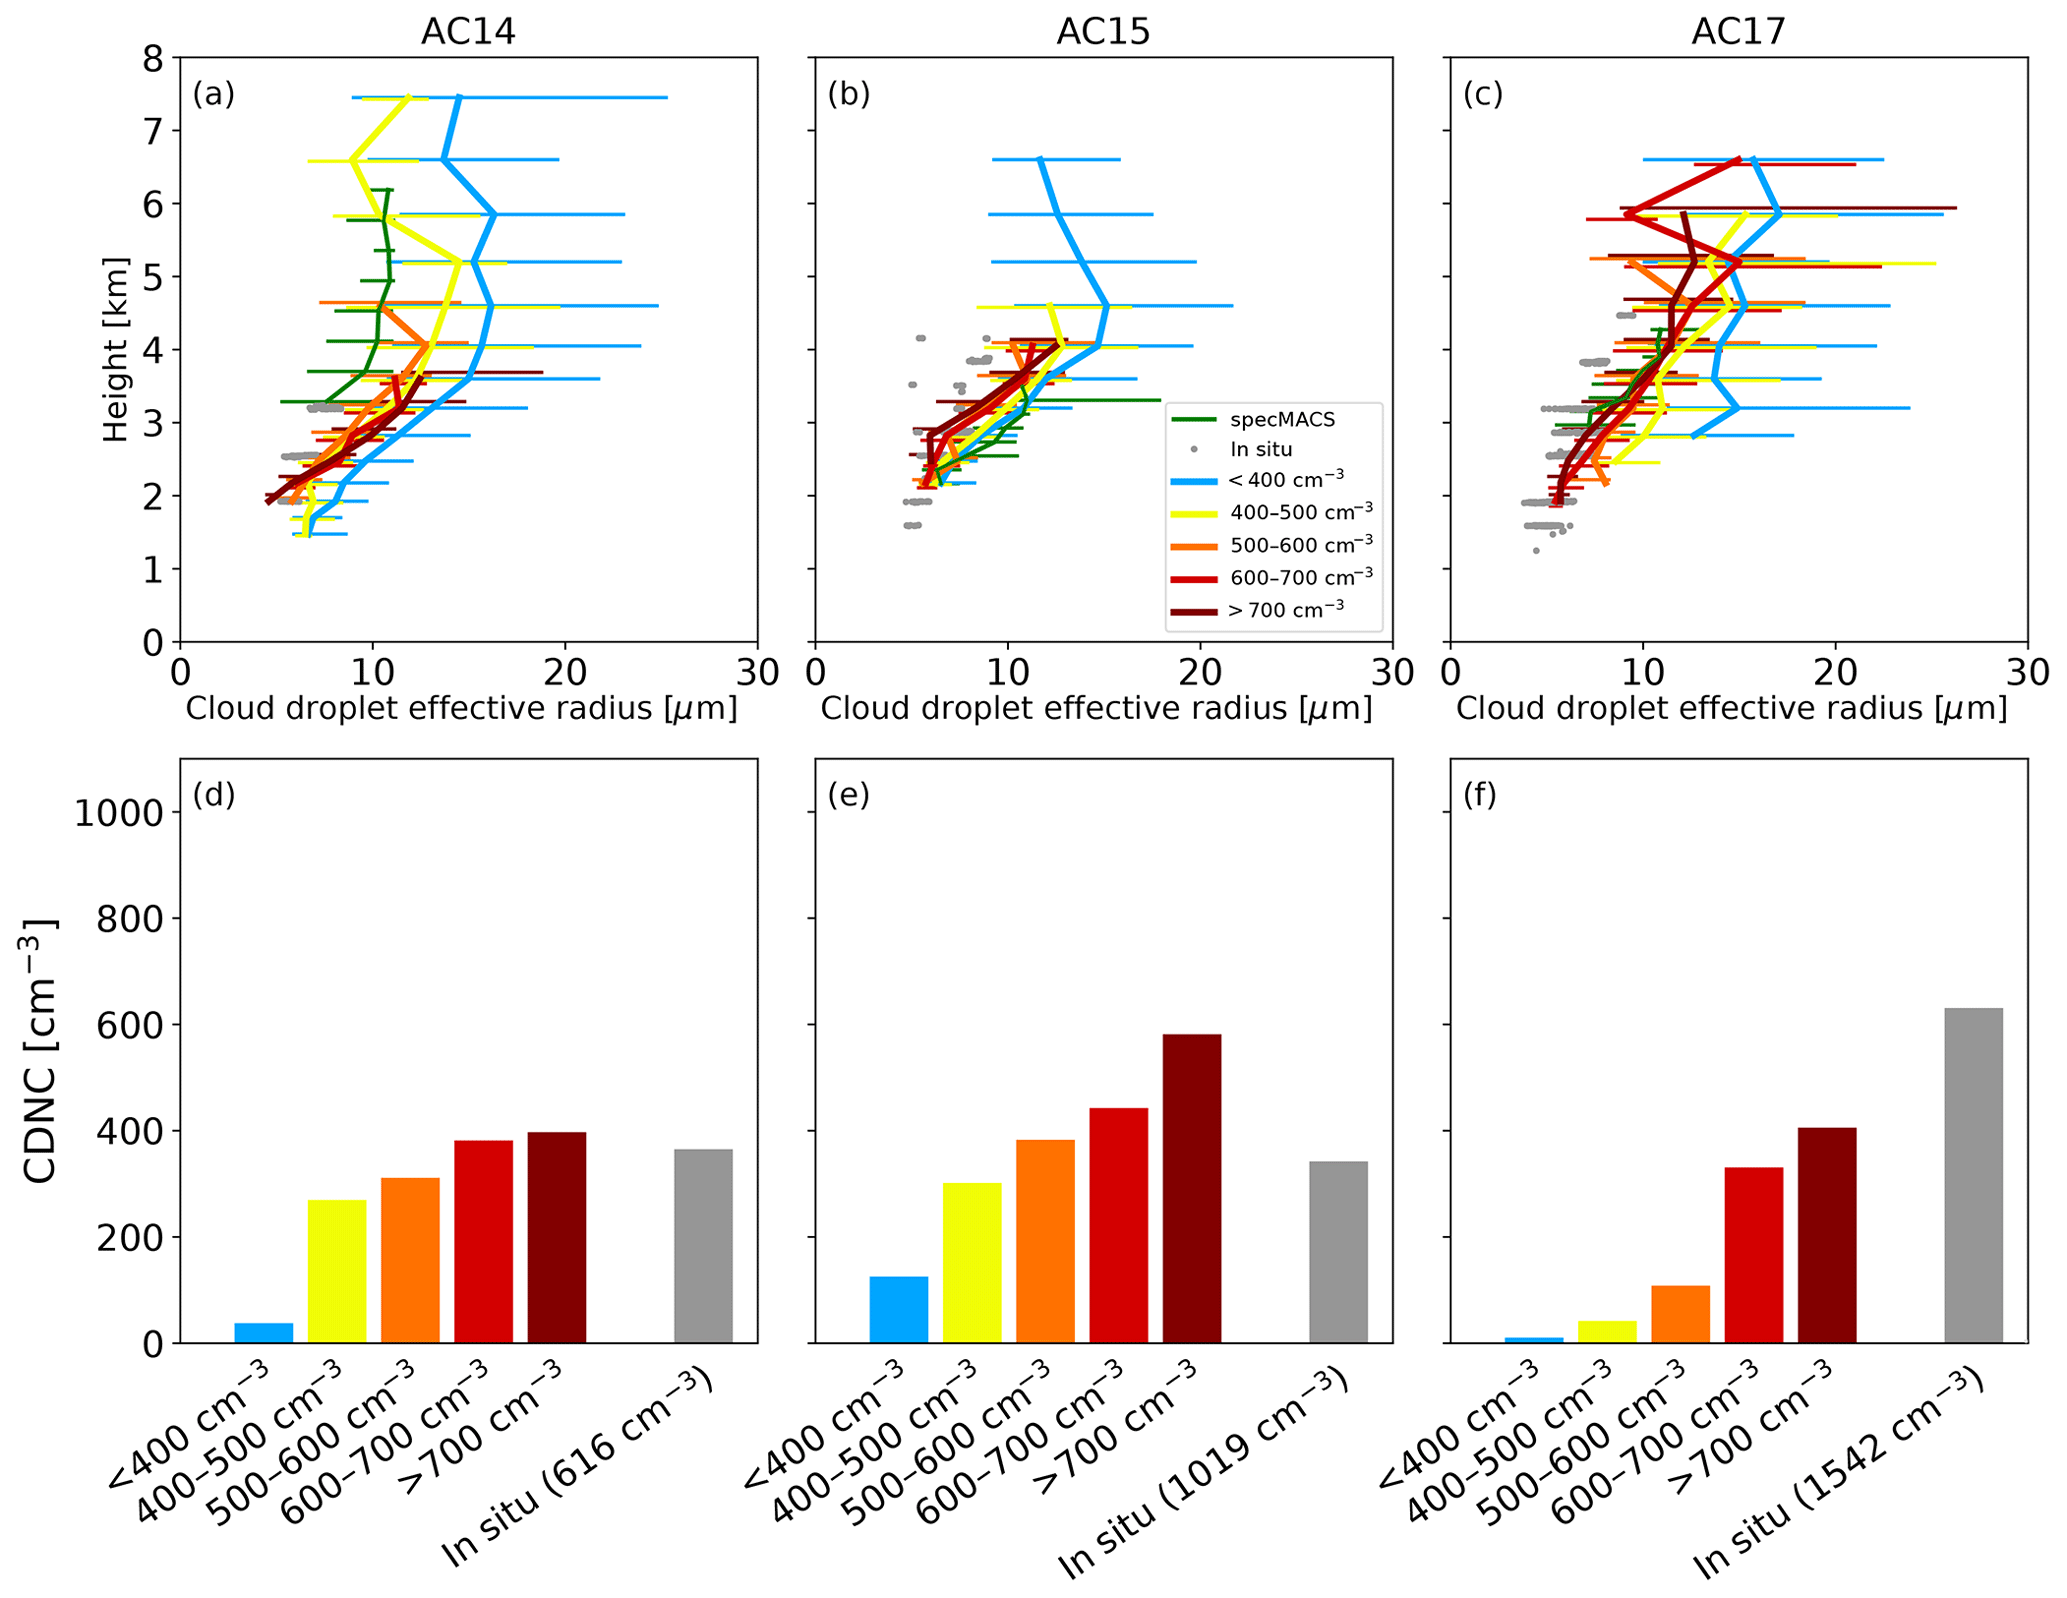
Figure 5reff profiles and associated cloud droplet number concentration (CDNC) on 3 d during the field campaign. (a–c) show a comparison of median WRF-Chem, specMACS, and in situ reff profiles. (d–f) show the “true” below-cloud CCN-binned CDNC from WRF-Chem simulations and CDNC from in situ cloud profiling. Average in situ CCN concentrations (below 2 km) are presented at the bar label for the in situ-derived Na. See Sect. 3.1 for details regarding the definition of “average”.
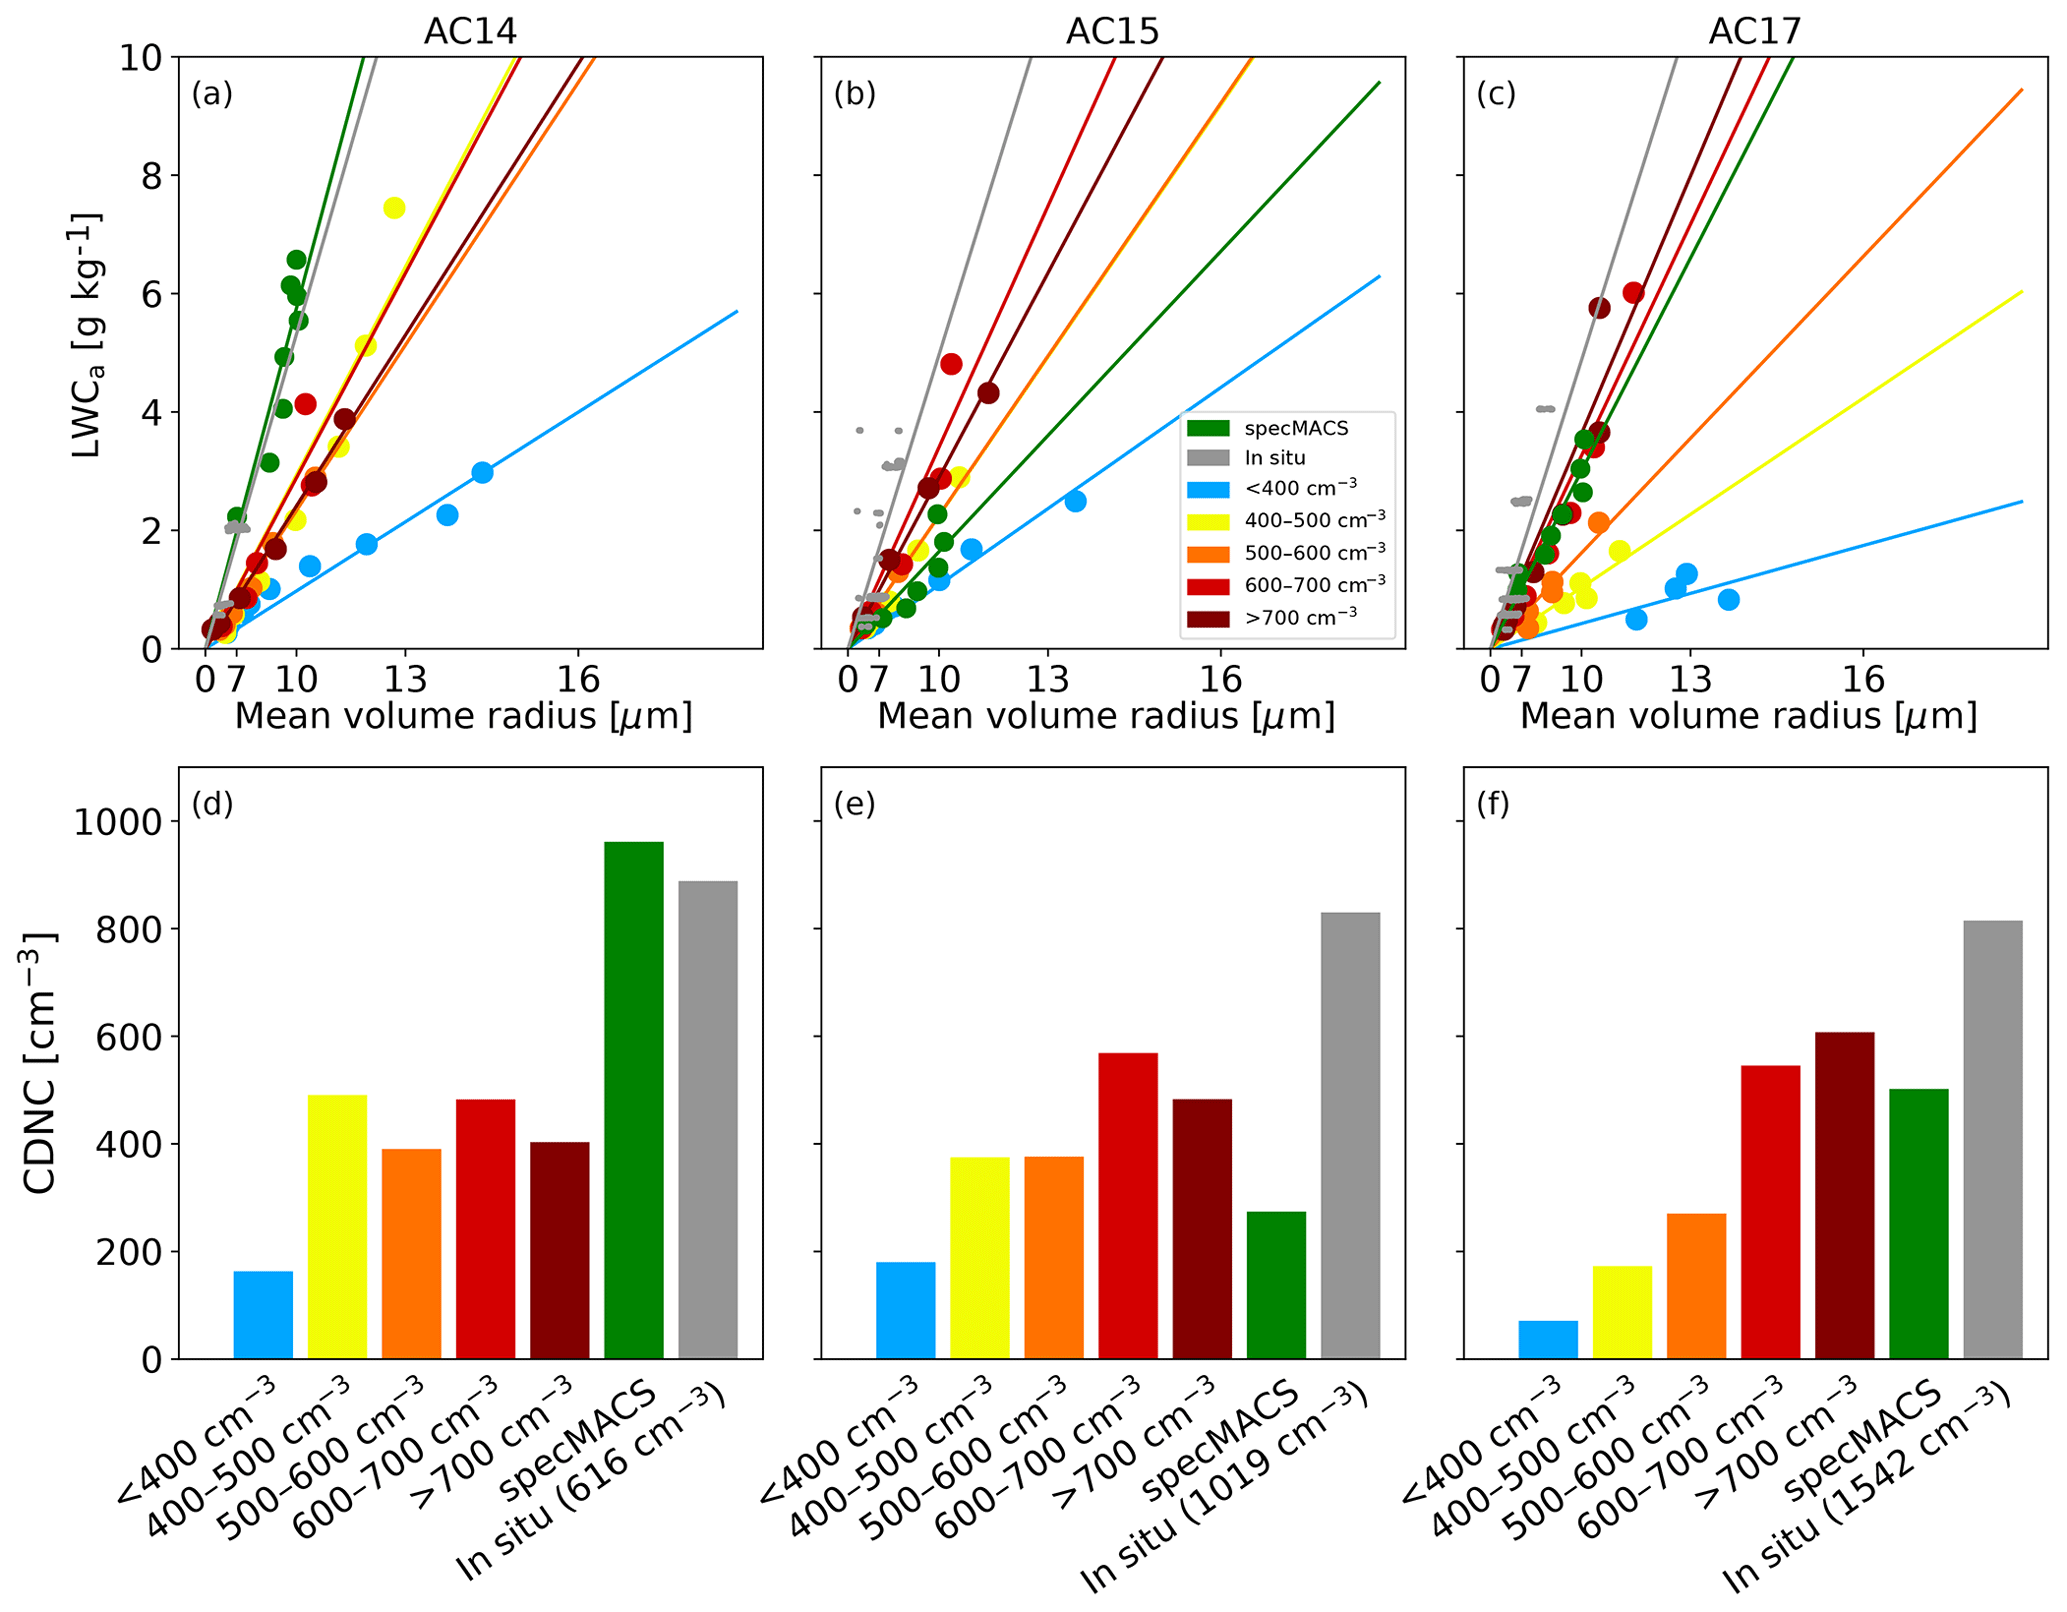
Figure 6Derived cloud droplet number concentration (CDNC) on 3 d during the field campaign. (a–c) show the regressions between mean volume radius and adiabatic liquid water content (LWCa) used to derive the CDNC as shown in (d–f). Average in situ CCN concentrations below 2 km are shown below the in situ-derived Na. (d–f) CDNC was derived from the slopes in (a–c), whereas Fig. 5d–f CDNC was more directly determined.
With the available data it is not possible to know the aerosol or below-cloud properties for the clouds sampled by specMACS. We suggest, however, that we can use the model results to deduce that the specMACS observed relatively polluted clouds during AC14 (Fig. 6a and d), relatively clean clouds during AC15 (Fig. 6b and e), and medium-polluted clouds during AC17 (Fig. 6c and f). The Na derived from the in situ profiles is higher than the others. While the calculated Na depends on the theoretical adiabatic liquid water content (LWCa), the measured LWC might in fact be lower. This finding should be explored further but is out of scope of this work.
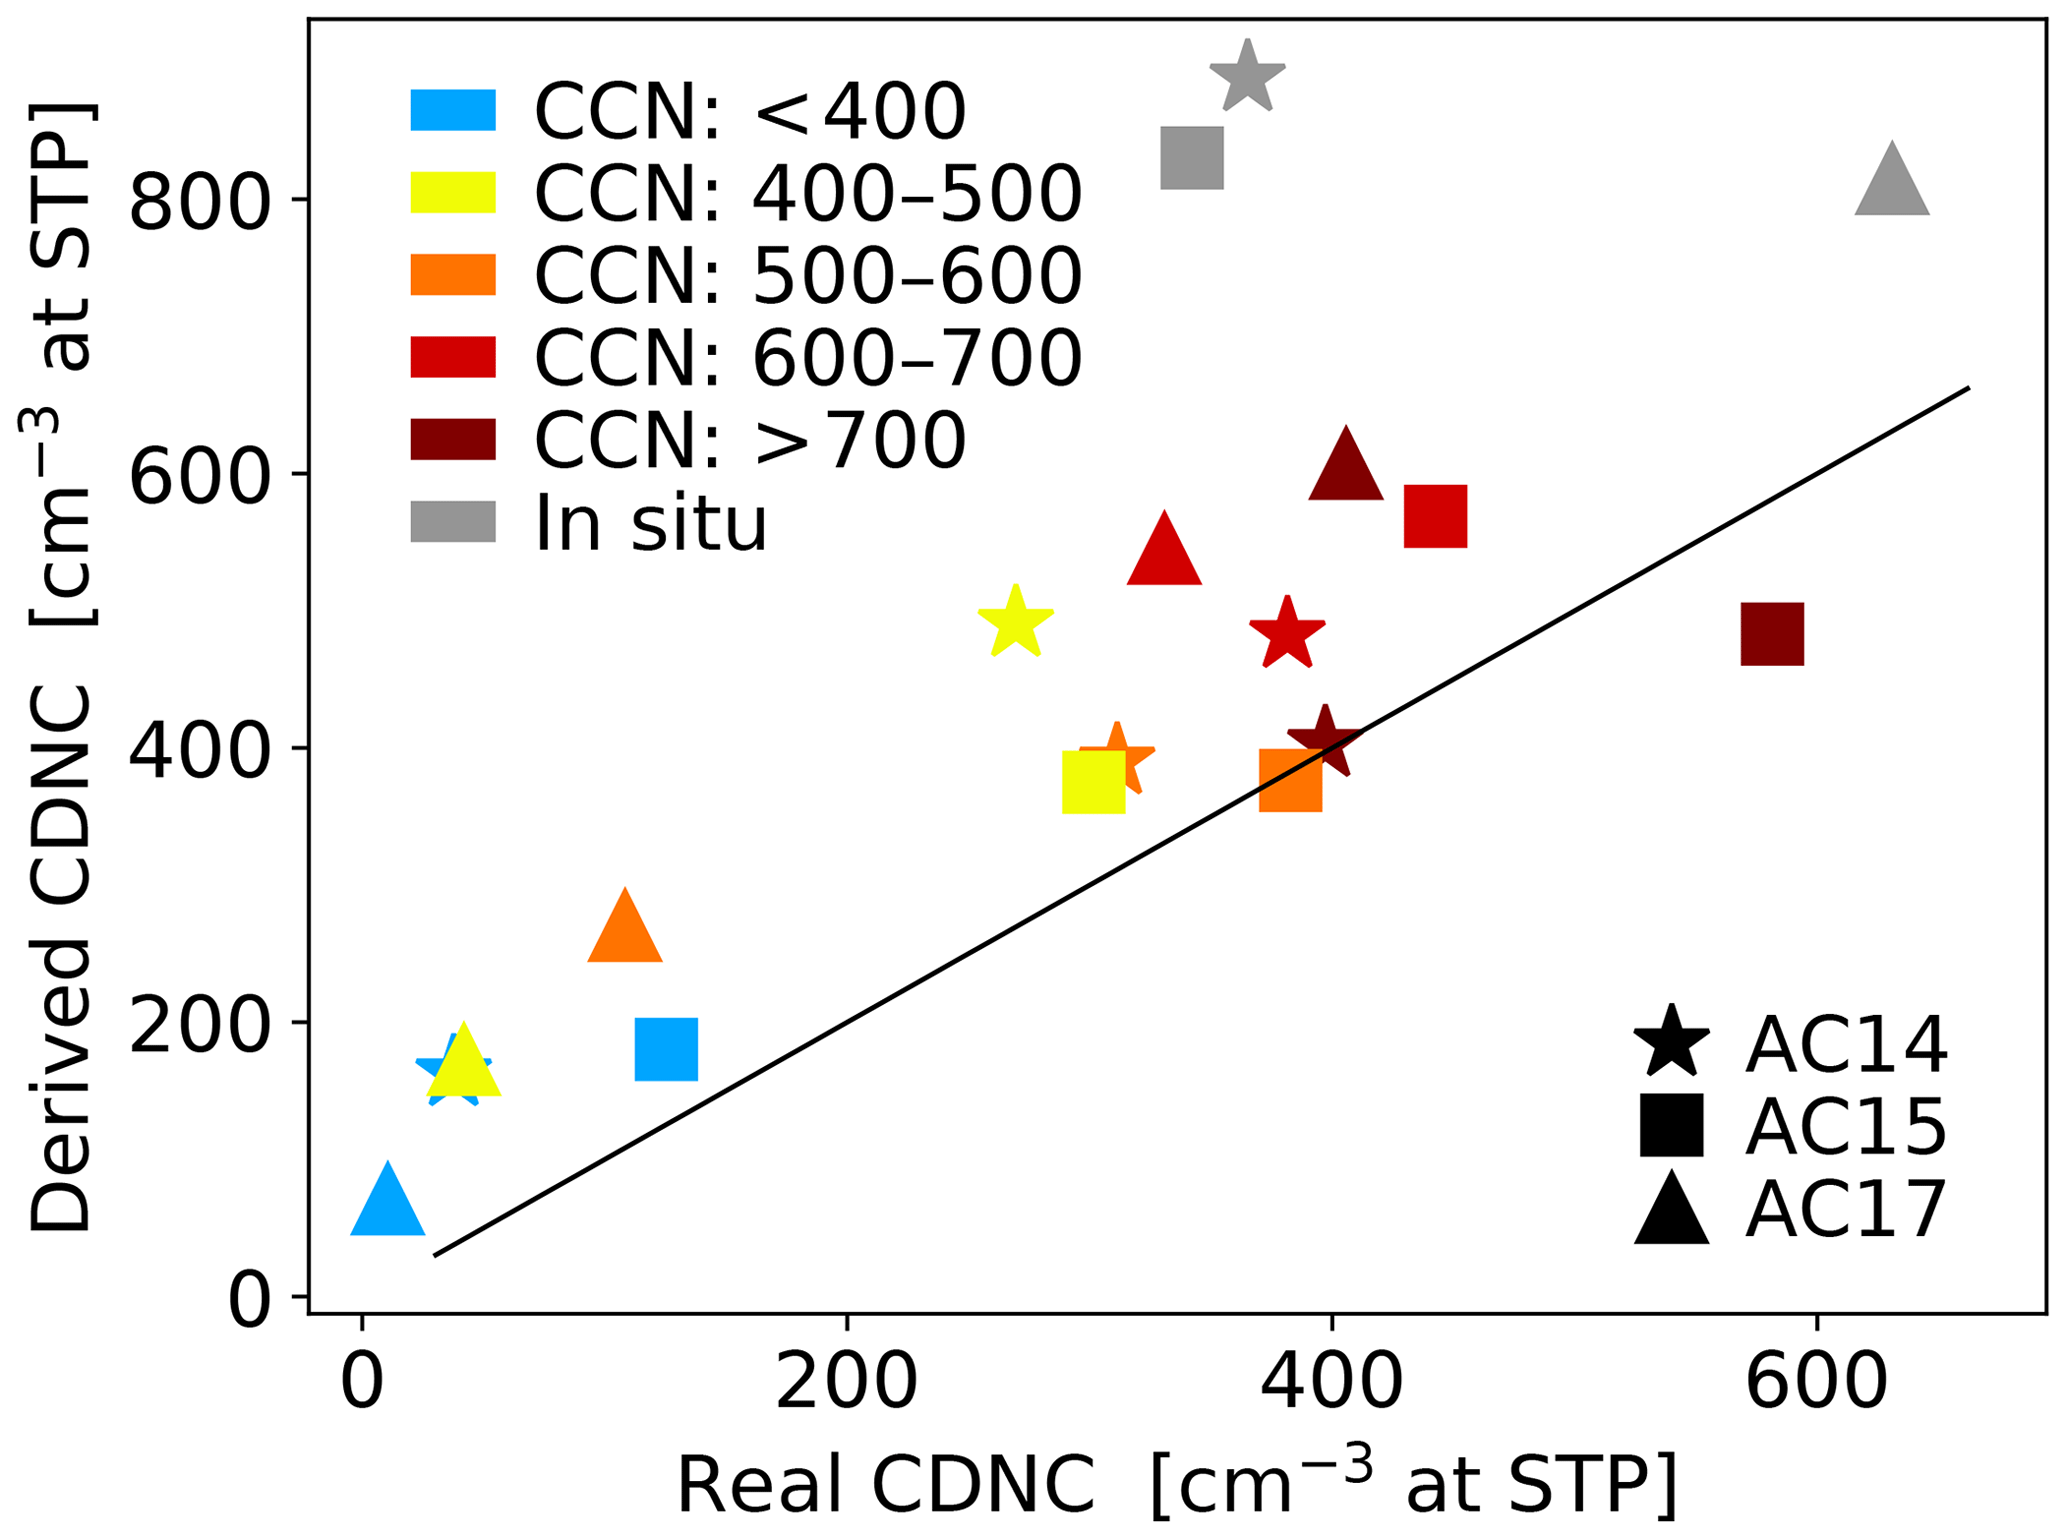
Figure 7Comparison of real (i.e., CDP and CAS measured) CDNC with CDNC as derived using the Freud et al. (2011) method. Real CDNC for model data is average modeled CDNC in the model domain. Symbols indicate date; colors indicate model bin or in situ data. The 1-to-1 line is for reference. These are the same data as in Figs. 5d–f and 6d–f.
3.6 Discussion
Modeled reff tended to be larger than in situ measurements of reff. Subsequently, directly modeled and model-derived CDNC was lower than in situ measurements and derivations. Partly, these differences can be accounted for by the low modeled CCN concentrations (Fig. 2). However, the 20th to 80th percentile range of modeled profiles with high below-cloud CCN do overlap with the in situ data. The modeled reff profiles began to saturate around 500 cm−3 at standard temperature and pressure (STP) below-cloud CCN, with only small differences at higher concentrations (Fig. 3), meaning that the modeled cloud albedo or Twomey effect saturates at approximately that concentration. A sensitivity study in which we artificially doubled the amount of biomass burning emissions showed the same saturation in modeled reff, further corroborating our findings. The concentration of around 500 cm−3 at STP below-cloud CCN is well below the CCN concentration characteristic of the dry season in the southern half of the Amazon Basin, which is typically in the range of 1000 to 7000 cm−3 (Andreae et al., 2004, 2018; Andreae, 2009). No such saturation was observed in the evaluation of modeled CDNC.
Increased model spatial resolution could potentially provide better agreement for these high-pollution situations, but a variety of hurdles (input data resolution of emission and static data like land use, vegetation cover and topography, model formulation of turbulence, and statistical methods for output analysis) need to be overcome before reliable simulations at higher resolution are feasible. The horizontal grid resolution of 3 km is at the fine end of what regional modeling systems were designed for, reaching for “terra incognita” (Wyngaard, 2004) in terms of resolution. Sensitivity simulations in which we simply increased the horizontal and/or vertical resolution by a factor of 2 did not lead to improved agreement with observations.
More complex parameterizations of cloud microphysics, such as spectral bin microphysics (e.g., Grützun et al., 2008; Khain and Sednev, 1996), have been developed and used before in case studies. Such more complex parameterizations might improve the representation of the cloud droplet size spectra and hence also modeled reff. Such parameterizations are, however, still computationally too expensive to be used on a regular basis or in the context of a climate study.
Estimating the radiative forcing due to biomass burning is of central importance in evaluating its impact on the climate system. Calculating the top-of-atmosphere radiative forcing leads to a campaign average daytime cooling of −0.9 W m−2 (not shown), which is comparable to previous estimates (e.g., Archer-Nicholls et al., 2016) and shows that our model behaves similarly to existing studies. However, given the demonstrated lack of skill of the modeling system in representing the very strong CCN perturbations due to biomass burning, we refrained from further exploring their climate impacts.
We deem our modeling study to be representative for other regional-scale chemistry-transport modeling studies of aerosol–cloud interactions of convective clouds in situations strongly affected by biomass burning (e.g., Martins et al., 2009; Wu et al., 2011; Archer-Nicholls et al., 2016). WRF-Chem is a widely used modeling system and similar to other regional modeling systems. Our setup contains state-of-the-art representations of clouds, aerosols, and aerosol–cloud interactions because we used a two-moment cloud microphysics scheme with a sectional aerosol module and the cloud activation scheme of Abdul-Razzak and Ghan (2000).
Comparisons between entire model domains and in situ measurements are inherently difficult, since the exact measured clouds will never be realistically simulated due to the randomness of modeled clouds and the difference in scales. There are a variety of challenges involved with this comparison. However, especially at high CCN, the model overestimates reff and, therefore, underestimates Na. The specMACS data experience similar comparison difficulties, since each set only spans a cloud scene (∼50 km) over a short time (∼2 min). However, the retrieved reff profiles still fall within the in situ measurements and the model output. Profile values derived from specMACS measurements also tend to be smaller than the data from in situ sampling, which is expected based on previous tests (Ewald et al., 2016).
We have demonstrated that the method by Freud et al. (2011) to derive cloud base CDNC from reff observations can successfully be applied in conjunction with simulated clouds to derive Na from remotely sensed hyperspectral data of the specMACS instrument. The method is limited by its high sensitivity at low Na due to the mathematical nature of the slope (i.e., steep slopes in Fig. 6a–c), and we are unable to verify its accuracy with the available data. It also uses an average mixing factor that may vary for the cloud scenes measured by specMACS. However, using Fig. 7 as a guide to the accuracy of the method, the uncertainties appear to be smaller than those from satellite retrievals, which are about 78 % at the pixel level (Grosvenor et al., 2018). We therefore propose that model results can be used to differentiate specMACS observations into clean and polluted conditions, which will need to be verified in future studies.
Aerosol–cloud interactions have been the focus of field campaigns and measurement development due to the large associated model uncertainty. Here we used novel observations taken aboard the HALO aircraft during the ACRIDICON-CHUVA field campaign to evaluate cloud representation in a numerical model to help reduce this uncertainty. We demonstrated that we can reproduce realistic cloud properties (i.e., cloud droplet effective radius profiles) with a regional online-coupled chemistry-transport model at convection-permitting scales for the Amazon region during the biomass burning season.
As expected from theory, the number of CCN at cloud base has a major influence on cloud droplet size and the shape of the vertical profile of cloud droplet effective radius. Increasing CCN leads to decreasing cloud droplet sizes, and we demonstrated that the model and the observations exhibit quantitatively similar behavior. We also observed a saturation effect at high aerosol concentrations in the model (number concentration of CCN larger than 500 cm−3 at STP), above which we find no further change in modeled effective droplet size or the shape of the droplet size profile. Observations from previous campaigns (Reid et al., 1999; Andreae et al., 2004) and from the ACRIDICON-CHUVA campaign (Braga et al., 2017b) have demonstrated substantial Twomey effects at much higher aerosol loadings. Additionally, the relation between modeled and observed CDNC is linear and has a slope of 0.3, indicating a considerable underestimation of cloud droplet number concentrations by the model. Although we only tested one microphysics scheme, we demonstrated that a modern, complex parameterization does not imply accurate representation of all cloud microphysical properties and suggest that calculations of the radiative forcing of these phenomena may be biased under polluted conditions like those found during the Amazon biomass burning season.
Evaluation of the parameterization of Freud et al. (2011) proved to be successful in deriving Na from cloud-side remote-sensing data collected by the specMACS instrument. We note a high sensitivity of the method at low Na and its dependence on an average mixing factor. We were able to gain these insights by applying a previously developed parameterization in a new context. Our study demonstrates that, despite some inherent challenges, existing techniques can be applied for model–measurement comparisons to improve our understanding of model biases.
Model data, the source code used in the evaluation, and all observational data are available from the authors upon request.
PP ran the simulations and conducted the analysis under the supervision of CK and TZ. PP, TZ, and CK wrote the paper, with input from BM, MA, DR, RW, and MW. MA, CP, MP, UP, DR, RW, and MW contributed through fruitful discussions. FE, TKo, TJ, TKl, CM, SM, CP, MP, CV, and RW provided measurements essential for this paper.
The authors declare that they have no conflict of interest.
This article is part of the special issue “The ACRIDICON-CHUVA campaign to study deep convective clouds and precipitation over Amazonia using the new German HALO research aircraft (ACP/AMT inter-journal SI)”. It is not associated with a conference.
We thank the Leibniz Supercomputing Centre (LRZ) of the Bavarian Academy of Sciences and Humanities (BAdW) for the support and provisioning of computing infrastructure essential to this publication. We acknowledge use of the WRF-Chem preprocessor tools anthro_emiss, exo_coldens, fire_emiss, megan_bio_emiss, mozbc, and wesely, provided by the Atmospheric Chemistry Observations and Modeling Lab (ACOM) of NCAR. We acknowledge use of MOZART-4 global model output available at http://www.acom.ucar.edu/wrf-chem/mozart.shtml (last access: 24 July 2018). We thank National Centers for Environmental Prediction for making Global Forecasting System data publicly available. We also thank DLR for access to the HALO database for all in situ data used in this study, and we gratefully acknowledge all contributions and support from the project teams of ACRIDICON-CHUVA and GoAmazon2014/5. This work was supported by the Max Planck Society, the DFG (Deutsche Forschungsgemeinschaft – German Research Foundation) Priority Program SPP 1294, the German Aerospace Center (DLR), the FAPESP (São Paulo Research Foundation) grants 2009/15235-8 and 2013/05014-0, and a wide range of other institutional partners.
Florian Ewald was funded by DFG MA 2548/6-1 and MA 2548/9-1. Tobias Kölling was funded by DFG ZI 1132/3-1.
This paper was edited by Stefan Buehler and reviewed by two anonymous referees.
Abdul-Razzak, H. and Ghan, S. J.: A parameterization of aerosol activation: 2. Multiple aerosol types, J. Geophys. Res.-Atmos., 105, 6837–6844, https://doi.org/10.1029/1999JD901161, 2000. a, b
Abdul-Razzak, H. and Ghan, S. J.: A parameterization of aerosol activation 3. Sectional representation, J. Geophys. Res.-Atmos., 107, D3, https://doi.org/10.1029/2001JD000483, 2002. a
Albrecht, B. A.: Aerosols, cloud microphysics, and fractional cloudiness, Science, 245, 1227–1230, 1989. a
Andreae, M. O.: Correlation between cloud condensation nuclei concentration and aerosol optical thickness in remote and polluted regions, Atmos. Chem. Phys., 9, 543–556, https://doi.org/10.5194/acp-9-543-2009, 2009. a
Andreae, M. O., Rosenfeld, D., Artaxo, P., Costa, A., Frank, G., Longo, K., and Silva-Dias, M.: Smoking rain clouds over the Amazon, Science, 303, 1337–1342, 2004. a, b, c
Andreae, M. O., Afchine, A., Albrecht, R., Holanda, B. A., Artaxo, P., Barbosa, H. M. J., Borrmann, S., Cecchini, M. A., Costa, A., Dollner, M., Fütterer, D., Järvinen, E., Jurkat, T., Klimach, T., Konemann, T., Knote, C., Krämer, M., Krisna, T., Machado, L. A. T., Mertes, S., Minikin, A., Pöhlker, C., Pöhlker, M. L., Pöschl, U., Rosenfeld, D., Sauer, D., Schlager, H., Schnaiter, M., Schneider, J., Schulz, C., Spanu, A., Sperling, V. B., Voigt, C., Walser, A., Wang, J., Weinzierl, B., Wendisch, M., and Ziereis, H.: Aerosol characteristics and particle production in the upper troposphere over the Amazon Basin, Atmos. Chem. Phys., 18, 921–961, https://doi.org/10.5194/acp-18-921-2018, 2018. a, b
Archer-Nicholls, S., Lowe, D., Schultz, D. M., and McFiggans, G.: Aerosol-radiation-cloud interactions in a regional coupled model: the effects of convective parameterisation and resolution, Atmos. Chem. Phys., 16, 5573–5594, https://doi.org/10.5194/acp-16-5573-2016, 2016. a, b
Barnard, J. C., Fast, J. D., Paredes-Miranda, G., Arnott, W. P., and Laskin, A.: Technical Note: Evaluation of the WRF-Chem “Aerosol Chemical to Aerosol Optical Properties” Module using data from the MILAGRO campaign, Atmos. Chem. Phys., 10, 7325–7340, https://doi.org/10.5194/acp-10-7325-2010, 2010. a
Baumgardner, D., Brenguier, J., Bucholtz, A., Coe, H., DeMott, P., Garrett, T., Gayet, J., Hermann, M., Heymsfield, A., Korolev, A., et al.: Airborne instruments to measure atmospheric aerosol particles, clouds and radiation: A cook's tour of mature and emerging technology, Atmos. Res., 102, 10–29, 2011. a
Baumgardner, D., Newton, R., Krämer, M., Meyer, J., Beyer, A., Wendisch, M., and Vochezer, P.: The Cloud Particle Spectrometer with Polarization Detection (CPSPD): A next generation open-path cloud probe for distinguishing liquid cloud droplets from ice crystals, Atmos. Res., 142, 2–14, 2014. a
Braga, R. C., Rosenfeld, D., Weigel, R., Jurkat, T., Andreae, M. O., Wendisch, M., Pöhlker, M. L., Klimach, T., Pöschl, U., Pöhlker, C., Voigt, C., Mahnke, C., Borrmann, S., Albrecht, R. I., Molleker, S., Vila, D. A., Machado, L. A. T., and Artaxo, P.: Comparing parameterized versus measured microphysical properties of tropical convective cloud bases during the ACRIDICON-CHUVA campaign, Atmos. Chem. Phys., 17, 7365–7386, https://doi.org/10.5194/acp-17-7365-2017, 2017a. a, b, c, d, e
Braga, R. C., Rosenfeld, D., Weigel, R., Jurkat, T., Andreae, M. O., Wendisch, M., Pöschl, U., Voigt, C., Mahnke, C., Borrmann, S., Albrecht, R. I., Molleker, S., Vila, D. A., Machado, L. A. T., and Grulich, L.: Further evidence for CCN aerosol concentrations determining the height of warm rain and ice initiation in convective clouds over the Amazon basin, Atmos. Chem. Phys., 17, 14433–14456, https://doi.org/10.5194/acp-17-14433-2017, 2017b. a
Brioude, J., Cooper, O. R., Feingold, G., Trainer, M., Freitas, S. R., Kowal, D., Ayers, J. K., Prins, E., Minnis, P., McKeen, S. A., Frost, G. J., and Hsie, E.-Y.: Effect of biomass burning on marine stratocumulus clouds off the California coast, Atmos. Chem. Phys., 9, 8841–8856, https://doi.org/10.5194/acp-9-8841-2009, 2009. a
Chapman, E. G., Gustafson Jr., W. I., Easter, R. C., Barnard, J. C., Ghan, S. J., Pekour, M. S., and Fast, J. D.: Coupling aerosol-cloud-radiative processes in the WRF-Chem model: Investigating the radiative impact of elevated point sources, Atmos. Chem. Phys., 9, 945–964, https://doi.org/10.5194/acp-9-945-2009, 2009. a
Emmons, L. K., Walters, S., Hess, P. G., Lamarque, J.-F., Pfister, G. G., Fillmore, D., Granier, C., Guenther, A., Kinnison, D., Laepple, T., Orlando, J., Tie, X., Tyndall, G., Wiedinmyer, C., Baughcum, S. L., and Kloster, S.: Description and evaluation of the Model for Ozone and Related chemical Tracers, version 4 (MOZART-4), Geosci. Model Dev., 3, 43–67, https://doi.org/10.5194/gmd-3-43-2010, 2010. a
Ewald, F., Kölling, T., Baumgartner, A., Zinner, T., and Mayer, B.: Design and characterization of specMACS, a multipurpose hyperspectral cloud and sky imager, Atmos. Meas. Tech., 9, 2015–2042, https://doi.org/10.5194/amt-9-2015-2016, 2016. a, b
Ewald, F., Zinner, T., Kölling, T., and Mayer, B.: Remote sensing of cloud droplet radius profiles using solar reflectance from cloud sides – Part 1: Retrieval development and characterization, Atmos. Meas. Tech., 12, 1183–1206, https://doi.org/10.5194/amt-12-1183-2019, 2019. a, b
Fan, J., Rosenfeld, D., Zhang, Y., Giangrande, S. E., Li, Z., Machado, L. A., Martin, S. T., Yang, Y., Wang, J., Artaxo, P., Barbosa, H. M. J., Braga, R. C., Comstock, J. M., Feng, Z., Gao, W.,. Gomes, H. B., Mei, F., Pöhlker, C., Pöhlker, M. L., Pöschl, U., and de Souza, R. A. F.: Substantial convection and precipitation enhancements by ultrafine aerosol particles, Science, 359, 411–418, https://doi.org/10.1126/science.aan8461, 2018. a, b
Fast, J. D., Gustafson Jr, W. I., Easter, R. C., Zaveri, R. A., Barnard, J. C., Chapman, E. G., Grell, G. A., and Peckham, S. E.: Evolution of ozone, particulates, and aerosol direct radiative forcing in the vicinity of Houston using a fully coupled meteorology-chemistry-aerosol model, J. Geophys. Res.-Atmos., 111, D21305, https://doi.org/10.1029/2005JD006721, 2006. a
Feingold, G., Jiang, H., and Harrington, J. Y.: On smoke suppression of clouds in Amazonia, Geophys. Res. Lett., 32, L02804, https://doi.org/:10.1029/2004GL021369, 2005. a
Flamant, C., Knippertz, P., Fink, A. H., Akpo, A., Brooks, B., Chiu, C. J., Coe, H., Danuor, S., Evans, M., Jegede, O., Kalthoff, N., Konaré, A., Liousse, C., Lohou, F., Mari, C., Schlager, H., Schwarzenboeck, A., Adler, B., Amekudzi, L., Aryee, J., Ayoola, M., Batenburg, A. M., Bessardon, G., Borrmann, S., Brito, J., Bower, K., Burnet, F., Catoire, V., Colomb, A., Denjean, C., Fosu-Amankwah, K., Hill, P. G., Lee, J., Lothon, M., Maranan, M., Marsham, J., Meynadier, R., Ngamini, J., Rosenberg, P., Sauer, D., Smith, V., Stratmann, G., Taylor, J. W., Voigt, C., and Yoboué, V.: The Dynamics–Aerosol–Chemistry–Cloud Interactions in West Africa Field Campaign: Overview and Research Highlights, B. Am. Meteorol. Soc., 99, 83–104, 2018. a
Freud, E., Rosenfeld, D., and Kulkarni, J. R.: Resolving both entrainment-mixing and number of activated CCN in deep convective clouds, Atmos. Chem. Phys., 11, 12887–12900, https://doi.org/10.5194/acp-11-12887-2011, 2011. a, b, c, d, e, f, g, h, i, j, k
Ghan, S., Wang, M., Zhang, S., Ferrachat, S., Gettelman, A., Griesfeller, J., Kipling, Z., Lohmann, U., Morrison, H., Neubauer, D., Partridge, D. G., Stier, P., Takemura, T., Wang, H., and Zhang, K.: Challenges in constraining anthropogenic aerosol effects on cloud radiative forcing using present-day spatiotemporal variability, P. Natl. Acad. Sci. USA, 113, 5804–5811, 2016. a
Gonçalves, W. A., Machado, L. A. T., and Kirstetter, P.-E.: Influence of biomass aerosol on precipitation over the Central Amazon: an observational study, Atmos. Chem. Phys., 15, 6789–6800, https://doi.org/10.5194/acp-15-6789-2015, 2015. a
Grell, G. A., Peckham, S. E., Schmitz, R., McKeen, S. A., Frost, G., Skamarock, W. C., and Eder, B.: Fully coupled “online” chemistry within the WRF model, Atmos. Environ., 39, 6957–6975, 2005. a
Grosvenor, D. P., Sourdeval, O., Zuidema, P., Ackerman, A., Alexandrov, M. D., Bennartz, R., Boers, R., Cairns, B., Chiu, J. C., Christensen, M., Deneke, H., Diamond, M., Feingold, G., Fridlind, A., Hünerbein, A., Knist, C., Kollias, P., Marshak, A., McCoy, D., Merk, D., Painemal, D., Rausch, J., Rosenfeld, D., Russchenberg, H., Seifert, P., Sinclair, K., Stier, P., van Diedenhoven, B., Wendisch, M., Werner, F., Wood, R., Zhang, Z., and Quaas, J.: Remote Sensing of Droplet Number Concentration in Warm Clouds: A Review of the Current State of Knowledge and Perspectives, Rev. Geophys., 56, 409–453, https://doi.org/10.1029/2017RG000593, 2018. a
Grützun, V., Knoth, O., and Simmel, M.: Simulation of the influence of aerosol particle characteristics on clouds and precipitation with LM-SPECS: Model description and first results, Atmos. Res., 90, 233–242, https://doi.org/10.1016/j.atmosres.2008.03.002, 17th International Conference on Nucleation and Atmospheric Aerosols, 2008. a, b
Guenther, A., Karl, T., Harley, P., Wiedinmyer, C., Palmer, P. I., and Geron, C.: Estimates of global terrestrial isoprene emissions using MEGAN (Model of Emissions of Gases and Aerosols from Nature), Atmos. Chem. Phys., 6, 3181–3210, https://doi.org/10.5194/acp-6-3181-2006, 2006. a
Gustafson Jr., W. I., Chapman, E. G., Ghan, S. J., Easter, R. C., and Fast, J. D.: Impact on modeled cloud characteristics due to simplified treatment of uniform cloud condensation nuclei during NEAQS 2004, Geophys. Res. Lett., 34, L19809, https://doi.org/10.1029/2007GL030021, 2007. a
IPCC: Climate Change 2014: Synthesis Report. Contribution of Working Groups I, II and III to the Fifth Assessment Report of the Intergovernmental Panel on Climate Change, IPCC, Geneva, Switzerland, 2014. a
Jäkel, E., Wendisch, M., Krisna, T. C., Ewald, F., Kölling, T., Jurkat, T., Voigt, C., Cecchini, M. A., Machado, L. A. T., Afchine, A., Costa, A., Krämer, M., Andreae, M. O., Pöschl, U., Rosenfeld, D., and Yuan, T.: Vertical distribution of the particle phase in tropical deep convective clouds as derived from cloud-side reflected solar radiation measurements, Atmos. Chem. Phys., 17, 9049–9066, https://doi.org/10.5194/acp-17-9049-2017, 2017. a
Janssens-Maenhout, G., Dentener, F., Van Aardenne, J., Monni, S., Pagliari, V., Orlandini, L., Klimont, Z., Kurokawa, J.-I., Akimoto, H., Ohara, T., Wankmüller, R., Battye, B., Grano, D., Zuber, A., and Keating, T.: EDGAR-HTAP: a harmonized gridded air pollution emission dataset based on national inventories, European Commission Joint Research Centre Institute for Environment and Sustainability, JRC 68434 UR 25229 EUR 25229, ISBN 978-92-79-23123-0, 2012. a
Järvinen, E., Schnaiter, M., Mioche, G., Jourdan, O., Shcherbakov, V. N., Costa, A., Afchine, A., Krämer, M., Heidelberg, F., Jurkat, T., Voigt, C., Schlager, H., Nichman, L., Gallagher, M., Hirst, E., Schmitt, C., Bansemer, A., Heymsfield, A., Lawson, P., Tricoli, U., Pfeilsticker, K., Vochezer, P., Möhler, O., and Leisner, T.: Quasi-spherical ice in convective clouds, J. Atmos. Sci., 73, 3885–3910, 2016. a
Kaufman, Y. J. and Fraser, R. S.: The effect of smoke particles on clouds and climate forcing, Science, 277, 1636–1639, 1997. a
Kaufman, Y. J. and Nakajima, T.: Effect of Amazon smoke on cloud microphysics and albedo-analysis from satellite imagery, J. Appl. Meteorol., 32, 729–744, 1993. a
Khain, A., Rosenfeld, D., and Pokrovsky, A.: Aerosol impact on the dynamics and microphysics of deep convective clouds, Q. J. Roy. Meteorol. Soc., A journal of the atmospheric sciences, applied meteorology and physical oceanography, 131, 2639–2663, 2005. a, b
Khain, A. P. and Sednev, I.: Simulation of precipitation formation in the Eastern Mediterranean coastal zone using a spectral microphysics cloud ensemble model, Atmos. Res., 43, 77–110, https://doi.org/10.1016/S0169-8095(96)00005-1, 1996. a, b
Kleine, J., Voigt, C., Sauer, D., Schlager, H., Scheibe, M., Jurkat-Witschas, T., Kaufmann, S., Kärcher, B., and Anderson, B. E.: In Situ Observations of Ice Particle Losses in a Young Persistent Contrail, Geophys. Res. Lett., 45, 13553–13561, https://doi.org/10.1029/2018GL079390, 2018. a
Knote, C., Hodzic, A., Jimenez, J. L., Volkamer, R., Orlando, J. J., Baidar, S., Brioude, J., Fast, J., Gentner, D. R., Goldstein, A. H., Hayes, P. L., Knighton, W. B., Oetjen, H., Setyan, A., Stark, H., Thalman, R., Tyndall, G., Washenfelder, R., Waxman, E., and Zhang, Q.: Simulation of semi-explicit mechanisms of SOA formation from glyoxal in aerosol in a 3-D model, Atmos. Chem. Phys., 14, 6213–6239, https://doi.org/10.5194/acp-14-6213-2014, 2014. a
Knote, C., Hodzic, A., and Jimenez, J. L.: The effect of dry and wet deposition of condensable vapors on secondary organic aerosols concentrations over the continental US, Atmos. Chem. Phys., 15, 1–18, https://doi.org/10.5194/acp-15-1-2015, 2015. a, b
Krüger, M. L., Mertes, S., Klimach, T., Cheng, Y. F., Su, H., Schneider, J., Andreae, M. O., Pöschl, U., and Rose, D.: Assessment of cloud supersaturation by size-resolved aerosol particle and cloud condensation nuclei (CCN) measurements, Atmos. Meas. Tech., 7, 2615–2629, https://doi.org/10.5194/amt-7-2615-2014, 2014. a
Lance, S., Brock, C. A., Rogers, D., and Gordon, J. A.: Water droplet calibration of the Cloud Droplet Probe (CDP) and in-flight performance in liquid, ice and mixed-phase clouds during ARCPAC, Atmos. Meas. Tech., 3, 1683–1706, https://doi.org/10.5194/amt-3-1683-2010, 2010. a
Levin, Z., Teller, A., Ganor, E., and Yin, Y.: On the interactions of mineral dust, sea-salt particles, and clouds: A measurement and modeling study from the Mediterranean Israeli Dust Experiment campaign, J. Geophys. Res.-Atmos., 110, D20202, https://doi.org/10.1029/2005JD005810, 2005. a
Lin, J. C., Matsui, T., Pielke Sr., R., and Kummerow, C.: Effects of biomass-burning-derived aerosols on precipitation and clouds in the Amazon Basin: A satellite-based empirical study, J. Geophys. Res.-Atmos., 111, D19204, https://doi.org/10.1029/2005JD006884, 2006. a
Malavelle, F. F., Haywood, J. M., Jones, A., Gettelman, A., Clarisse, L., Bauduin, S., Allan, R. P., Karset, I. H. H., Kristjánsson, J. E., Oreopoulos, L., Cho, N., Lee, D., Bellouin, N., Boucher, O., Grosvenor, D. P.., Carslaw, K. S., Dhomse, S., Mann, G. W., Schmidt, A., Coe, H., Hartley, M. E., Dalvi, M., Hill, A. A., Johnson, B. T., Johnson, C. E., Knight, J. R., O'Connor, F. M., Partridge, D. G., Stier, P., Myhre, G., Platnick, S., Stephens, G. L., Takahashi, H., and Thordarson, T.: Strong constraints on aerosol–cloud interactions from volcanic eruptions, Nature, 546, 485–491, 2017. a
Marshak, A., Platnick, S., Várnai, T., Wen, G., and Cahalan, R. F.: Impact of three-dimensional radiative effects on satellite retrievals of cloud droplet sizes, J. Geophys. Res.-Atmos., 111, D09207, https://doi.org/10.1029/2005JD006686, 2006. a
Martin, S. T., Artaxo, P., Machado, L., Manzi, A., Souza, R., Schumacher, C., Wang, J., Biscaro, T., Brito, J., Calheiros, A., Jardine, K., Medeiros, A., Portela, B., de Sá, S. S., Adachi, K., Aiken, A. C., Albrecht, R., Alexander, L., Andreae, M. O., Barbosa, H. M., Buseck, P., Chand, D., Comstock, J. M., Day, D. A., Dubey, M., Fan, J., Fast, J., Fisch, G., Fortner, E., Giangrande, S., Gilles, M., Goldstein, A. H., Guenther, A., Hubbe, J., Jensen, M., Jimenez, J. L., Keutsch, F. N., Kim, S., Kuang, C., Laskin, A., McKinney, K., Mei, F., Miller, M., Nascimento, R., Pauliquevis, T., Pekour, M., Peres, J., Petäjä, T., Pöhlker, C., Pöschl, U., Rizzo, L., Schmid, B., Shilling, J. E., Dias, M. A., Smith, J. N., Tomlinson, J. M., Tóta, J., and Wendisch, M.: The Green Ocean Amazon experiment (GoAmazon2014/5) observes pollution affecting gases, aerosols, clouds, and rainfall over the rain forest, B. Am. Meteorol. Soc., 98, 981–997, 2017. a
Martins, J. A., Silva Dias, M. A. F., and Gonçalves, F. L. T.: Impact of biomass burning aerosols on precipitation in the Amazon: A modeling case study, J. Geophys. Res.-Atmos., 114, D02207, https://doi.org/10.1029/2007JD009587, 2009. a, b
Martins, J. V., Marshak, A., Remer, L. A., Rosenfeld, D., Kaufman, Y. J., Fernandez-Borda, R., Koren, I., Correia, A. L., Zubko, V., and Artaxo, P.: Remote sensing the vertical profile of cloud droplet effective radius, thermodynamic phase, and temperature, Atmos. Chem. Phys., 11, 9485–9501, https://doi.org/10.5194/acp-11-9485-2011, 2011. a
McCoy, D. T. and Hartmann, D. L.: Observations of a substantial cloud-aerosol indirect effect during the 2014–2015 Baroarbunga-Veioivotn fissure eruption in Iceland, Geophys. Res. Lett., 42, 10–409, 2015. a
Morrison, H. and Gettelman, A.: A new two-moment bulk stratiform cloud microphysics scheme in the Community Atmosphere Model, version 3 (CAM3). Part I: Description and numerical tests, J. Climate, 21, 3642–3659, 2008. a, b, c
Morrison, H., Curry, J., and Khvorostyanov, V.: A new double-moment microphysics parameterization for application in cloud and climate models. Part I: Description, J. Atmos. Sci., 62, 1665–1677, 2005. a
Pöhlker, M. L., Ditas, F., Saturno, J., Klimach, T., Hrabě de Angelis, I., Araùjo, A. C., Brito, J., Carbone, S., Cheng, Y., Chi, X., Ditz, R., Gunthe, S. S., Holanda, B. A., Kandler, K., Kesselmeier, J., Könemann, T., Krüger, O. O., Lavrič, J. V., Martin, S. T., Mikhailov, E., Moran-Zuloaga, D., Rizzo, L. V., Rose, D., Su, H., Thalman, R., Walter, D., Wang, J., Wolff, S., Barbosa, H. M. J., Artaxo, P., Andreae, M. O., Pöschl, U., and Pöhlker, C.: Long-term observations of cloud condensation nuclei over the Amazon rain forest – Part 2: Variability and characteristics of biomass burning, long-range transport, and pristine rain forest aerosols, Atmos. Chem. Phys., 18, 10289–10331, https://doi.org/10.5194/acp-18-10289-2018, 2018. a
Reid, J. S., Hobbs, P. V., Rangno, A. L., and Hegg, D. A.: Relationships between cloud droplet effective radius, liquid water content, and droplet concentration for warm clouds in Brazil embedded in biomass smoke, J. Geophys. Res.-Atmos., 104, 6145–6153, 1999. a, b
Roberts, G. and Nenes, A.: A continuous-flow streamwise thermal-gradient CCN chamber for atmospheric measurements, Aerosol Sci. Technol., 39, 206–221, 2005. a
Rose, D., Gunthe, S. S., Mikhailov, E., Frank, G. P., Dusek, U., Andreae, M. O., and Pöschl, U.: Calibration and measurement uncertainties of a continuous-flow cloud condensation nuclei counter (DMT-CCNC): CCN activation of ammonium sulfate and sodium chloride aerosol particles in theory and experiment, Atmos. Chem. Phys., 8, 1153–1179, https://doi.org/10.5194/acp-8-1153-2008, 2008. a
Rosenfeld, D.: TRMM observed first direct evidence of smoke from forest fires inhibiting rainfall, Geophys. Res. Lett., 26, 3105–3108, 1999. a
Rosenfeld, D., Williams, E., Andreae, M. O., Freud, E., Pöschl, U., and Rennó, N. O.: The scientific basis for a satellite mission to retrieve CCN concentrations and their impacts on convective clouds, Atmos. Meas. Tech., 5, 2039–2055, https://doi.org/10.5194/amt-5-2039-2012, 2012. a, b, c
Sassen, K., DeMott, P. J., Prospero, J. M., and Poellot, M. R.: Saharan dust storms and indirect aerosol effects on clouds: CRYSTAL-FACE results, Geophys. Res. Lett., 30, 1633, https://doi.org/10.1029/2003GL017371, 2003. a
Schumann, U., Baumann, R., Baumgardner, D., Bedka, S. T., Duda, D. P., Freudenthaler, V., Gayet, J.-F., Heymsfield, A. J., Minnis, P., Quante, M., Raschke, E., Schlager, H., Vázquez-Navarro, M., Voigt, C., and Wang, Z.: Properties of individual contrails: a compilation of observations and some comparisons, Atmos. Chem. Phys., 17, 403–438, https://doi.org/10.5194/acp-17-403-2017, 2017. a
Seifert, A. and Beheng, K. D.: A two-moment cloud microphysics parameterization for mixed-phase clouds. Part 1: Model description, Meteorol. Atmos. Phys., 92, 45–66, https://doi.org/10.1007/s00703-005-0112-4, 2006. a
Seinfeld, J. H., Bretherton, C., Carslaw, K. S., Coe, H., DeMott, P. J., Dunlea, E. J., Feingold, G., Ghan, S., Guenther, A. B., Kahn, R., Kraucunas, I., Kreidenweis, S. M., Molina, M. J., Nenes, A., Penner, J. E., Prather, K. A., Ramanathan, V.., Ramaswamy, V., Rasch, P. J., Ravishankara, A. R., Rosenfeld, D., Stephens, G., and Wood, R.: Improving our fundamental understanding of the role of aerosol- cloud interactions in the climate system, P. Natl. Acad. Sci. USA, 113, 5781–5790, 2016. a
Taylor, J. W., Haslett, S. L., Bower, K., Flynn, M., Crawford, I., Dorsey, J., Choularton, T., Connolly, P. J., Hahn, V., Voigt, C., Sauer, D., Dupuy, R., Brito, J., Schwarzenboeck, A., Bourriane, T., Denjean, C., Rosenberg, P., Flamant, C., Lee, J. D., Vaughan, A. R., Hill, P. G., Brooks, B., Catoire, V., Knippertz, P., and Coe, H.: Aerosol influences on low-level clouds in the West African monsoon, Atmos. Chem. Phys., 19, 8503–8522, https://doi.org/10.5194/acp-19-8503-2019, 2019. a
Ten Hoeve, J. E., Remer, L. A., and Jacobson, M. Z.: Microphysical and radiative effects of aerosols on warm clouds during the Amazon biomass burning season as observed by MODIS: impacts of water vapor and land cover, Atmos. Chem. Phys., 11, 3021–3036, https://doi.org/10.5194/acp-11-3021-2011, 2011. a
Thompson, G. and Eidhammer, T.: A Study of Aerosol Impacts on Clouds and Precipitation Development in a Large Winter Cyclone, J. Atmos. Sci., 71, 3636–3658, https://doi.org/10.1175/JAS-D-13-0305.1, 2014. a
Twomey, S.: Aerosols, clouds and radiation, Atmos. Environ., Part A. General Topics, 25, 2435–2442, 1991. a
Voigt, C., Schumann, U., Minikin, A., Abdelmonem, A., Afchine, A., Borrmann, S., Boettcher, M., Buchholz, B., Bugliaro, L., Costa, A., Curtius, J., Dollner, M., Dörnbrack, A., Dreiling, V., Ebert, V., Ehrlich, A., Fix, A., Forster, L., Frank, F., Fütterer, D., Giez, A., Graf, K., Grooß, J.-U., Groß, S., Heimerl, K., Heinold, B., Hüneke, T., Järvinen, E., Jurkat, T., Kaufmann, S., Kenntner, M., Klingebiel, M., Klimach, T., Kohl, R., Krämer, M., Krisna, T. C., Luebke, A., Mayer, B., Mertes, S., Molleker, S., Petzold, A., Pfeilsticker, K., Port, M., Rapp, M., Reutter, P., Rolf, C., Rose, D., Sauer, D., Schäfler, A., Schlage, R., Schnaiter, M., Schneider, J., Spelten, N., Spichtinger, P., Stock, P., Walser, A., Weigel, R., Weinzierl, B., Wendisch, M., Werner, F., Wernli, H., Wirth, M., Zahn, A., Ziereis, H., and Zöger, M.: ML-CIRRUS: The airborne experiment on natural cirrus and contrail cirrus with the high-altitude long-range research aircraft HALO, B. Am. Meteorol. Soc., 98, 271–288, 2017. a
Wall, C., Zipser, E., and Liu, C.: An investigation of the aerosol indirect effect on convective intensity using satellite observations, J. Atmos. Sci., 71, 430–447, 2014. a
Weigel, R., Spichtinger, P., Mahnke, C., Klingebiel, M., Afchine, A., Petzold, A., Krämer, M., Costa, A., Molleker, S., Reutter, P., Szakáll, M., Port, M., Grulich, L., Jurkat, T., Minikin, A., and Borrmann, S.: Thermodynamic correction of particle concentrations measured by underwing probes on fast-flying aircraft, Atmos. Meas. Tech., 9, 5135–5162, https://doi.org/10.5194/amt-9-5135-2016, 2016. a
Wendisch, M., Pöschl, U., Andreae, M. O., Machado, L. A., Albrecht, R., Schlager, H., Rosenfeld, D., Martin, S. T., Abdelmonem, A., Afchine, A., Araùjo, A. C., Artaxo, P., Aufmhoff, H., Barbosa, H. M. J., Borrmann, S., Braga, R., Buchholz, B., Cecchini, M. A., Costa, A., Curtius, J., Dollner, M., Dorf, M., Dreiling, V., Ebert, V., Ehrlich, A., Ewald, F., Fisch, G., Fix, A., Frank, F., Fütterer, D., Heckl, C., Heidelberg, F., Hüneke, T., Jäkel, E., Järvinen, E., Jurkat, T., Kanter, S., Kästner, U., Kenntner, M., Kesselmeier, J., Klimach, T., Knecht, M., Kohl, R., Kölling, T., Krämer, M., Krüger, M., Krisna, T. C., Lavric, J. V., Longo, K., Mahnke, C., Manzi, A. O., Mayer, B., Mertes, S., Minikin, A., Molleker, S., Münch, S., Nillius, B., Pfeilsticker, K., Pöhlker, C., Roiger, A., Rose, D., Rosenow, D., Sauer, D., Schnaiter, M., Schneider, J., Schulz, C., de Souza, R. A. F., Spanu, A., Stock, P., Vila, D., Voigt, C., Walser, A., Walter, D., Weigel, R., Weinzierl, B., Werner, F., Yamasoe, M. A., Ziereis, H., Zinner, T., and Zöger, M.: ACRIDICON–CHUVA campaign: Studying tropical deep convective clouds and precipitation over Amazonia using the new German research aircraft HALO, B. Am. Meteorol. Soc., 97, 1885–1908, 2016. a, b, c
Wiedinmyer, C., Akagi, S. K., Yokelson, R. J., Emmons, L. K., Al-Saadi, J. A., Orlando, J. J., and Soja, A. J.: The Fire INventory from NCAR (FINN): a high resolution global model to estimate the emissions from open burning, Geosci. Model Dev., 4, 625–641, https://doi.org/10.5194/gmd-4-625-2011, 2011. a
Wu, L., Su, H., and Jiang, J. H.: Regional simulations of deep convection and biomass burning over South America: 2. Biomass burning aerosol effects on clouds and precipitation, J. Geophys. Res.-Atmos., 116, D17209, https://doi.org/10.1029/2011JD016106, 2011. a
Wyngaard, J. C.: Toward Numerical Modeling in the “Terra Incognita”, J. Atmos. Sci., 61, 1816–1826, https://doi.org/10.1175/1520-0469(2004)061<1816:TNMITT>2.0.CO;2, 2004. a
Zaveri, R. A., Easter, R. C., Fast, J. D., and Peters, L. K.: Model for simulating aerosol interactions and chemistry (MOSAIC), J. Geophys. Res.-Atmos., 113, D13204, https://doi.org/10.1029/2007JD008782, 2008. a, b
Zhang, Y., Fu, R., Yu, H., Dickinson, R. E., Juarez, R. N., Chin, M., and Wang, H.: A regional climate model study of how biomass burning aerosol impacts land-atmosphere interactions over the Amazon, J. Geophys. Res.-Atmos., 113, D14S15, https://doi.org/10.1029/2007JD009449, 2008. a
Zinner, T., Marshak, A., Lang, S., Martins, J. V., and Mayer, B.: Remote sensing of cloud sides of deep convection: towards a three-dimensional retrieval of cloud particle size profiles, Atmos. Chem. Phys., 8, 4741–4757, https://doi.org/10.5194/acp-8-4741-2008, 2008. a