the Creative Commons Attribution 4.0 License.
the Creative Commons Attribution 4.0 License.
 | 18 Dec 2020
UK surface NO2 levels dropped by 42 % during the COVID-19 lockdown: impact on surface O3
Will S. Drysdale
Doug P. Finch
Shona E. Wilde
Paul I. Palmer
We report changes in surface nitrogen dioxide (NO2) across the UK during the COVID-19 pandemic when large and rapid emission reductions accompanied a nationwide lockdown (23 March–31 May 2020, inclusively), and compare them with values from an equivalent period over the previous 5 years. Data are from the Automatic Urban and Rural Network (AURN), which forms the basis of checking nationwide compliance with ambient air quality directives. We calculate that NO2 reduced by 42 %±9.8 % on average across all 126 urban AURN sites, with a slightly larger (48 %±9.5 %) reduction at sites close to the roadside (urban traffic). We also find that ozone (O3) increased by 11 % on average across the urban background network during the lockdown period. Total oxidant levels () increased only slightly on average (3.2 %±0.2 %), suggesting the majority of this change can be attributed to photochemical repartitioning due to the reduction in NOx. Generally, we find larger, positive Ox changes in southern UK cities, which we attribute to increased UV radiation and temperature in 2020 compared to previous years. The net effect of the NO2 and O3 changes is a sharp decrease in exceedances of the NO2 air quality objective limit for the UK, with only one exceedance in London in 2020 up until the end of May. Concurrent increases in O3 exceedances in London emphasize the potential for O3 to become an air pollutant of concern as NOx emissions are reduced in the next 10–20 years.
- Article
(5267 KB) - Full-text XML
-
Supplement
(2833 KB) - BibTeX
- EndNote


The current SARS-CoV-2 (COVID-19) outbreak was first identified in Wuhan, China, in December 2019 and was recognized as a pandemic by the World Health Organization (WHO) on 11 March 2020 (WHO, 2020). As of early August 2020, there have been almost 18 million confirmed cases and over 700 000 deaths reported across the world (https://coronavirus.jhu.edu/map.html, last access: 15 December 2020). Efforts to prevent the virus spreading have included severe travel restrictions and the closure of workplaces, inevitably leading to a significant drop in emissions of primary air pollutants from several important sectors. This has provided a unique opportunity to examine how air pollutant concentrations respond to an abrupt and prolonged perturbation, followed by policy-relatable increases as restrictions are incrementally relaxed.
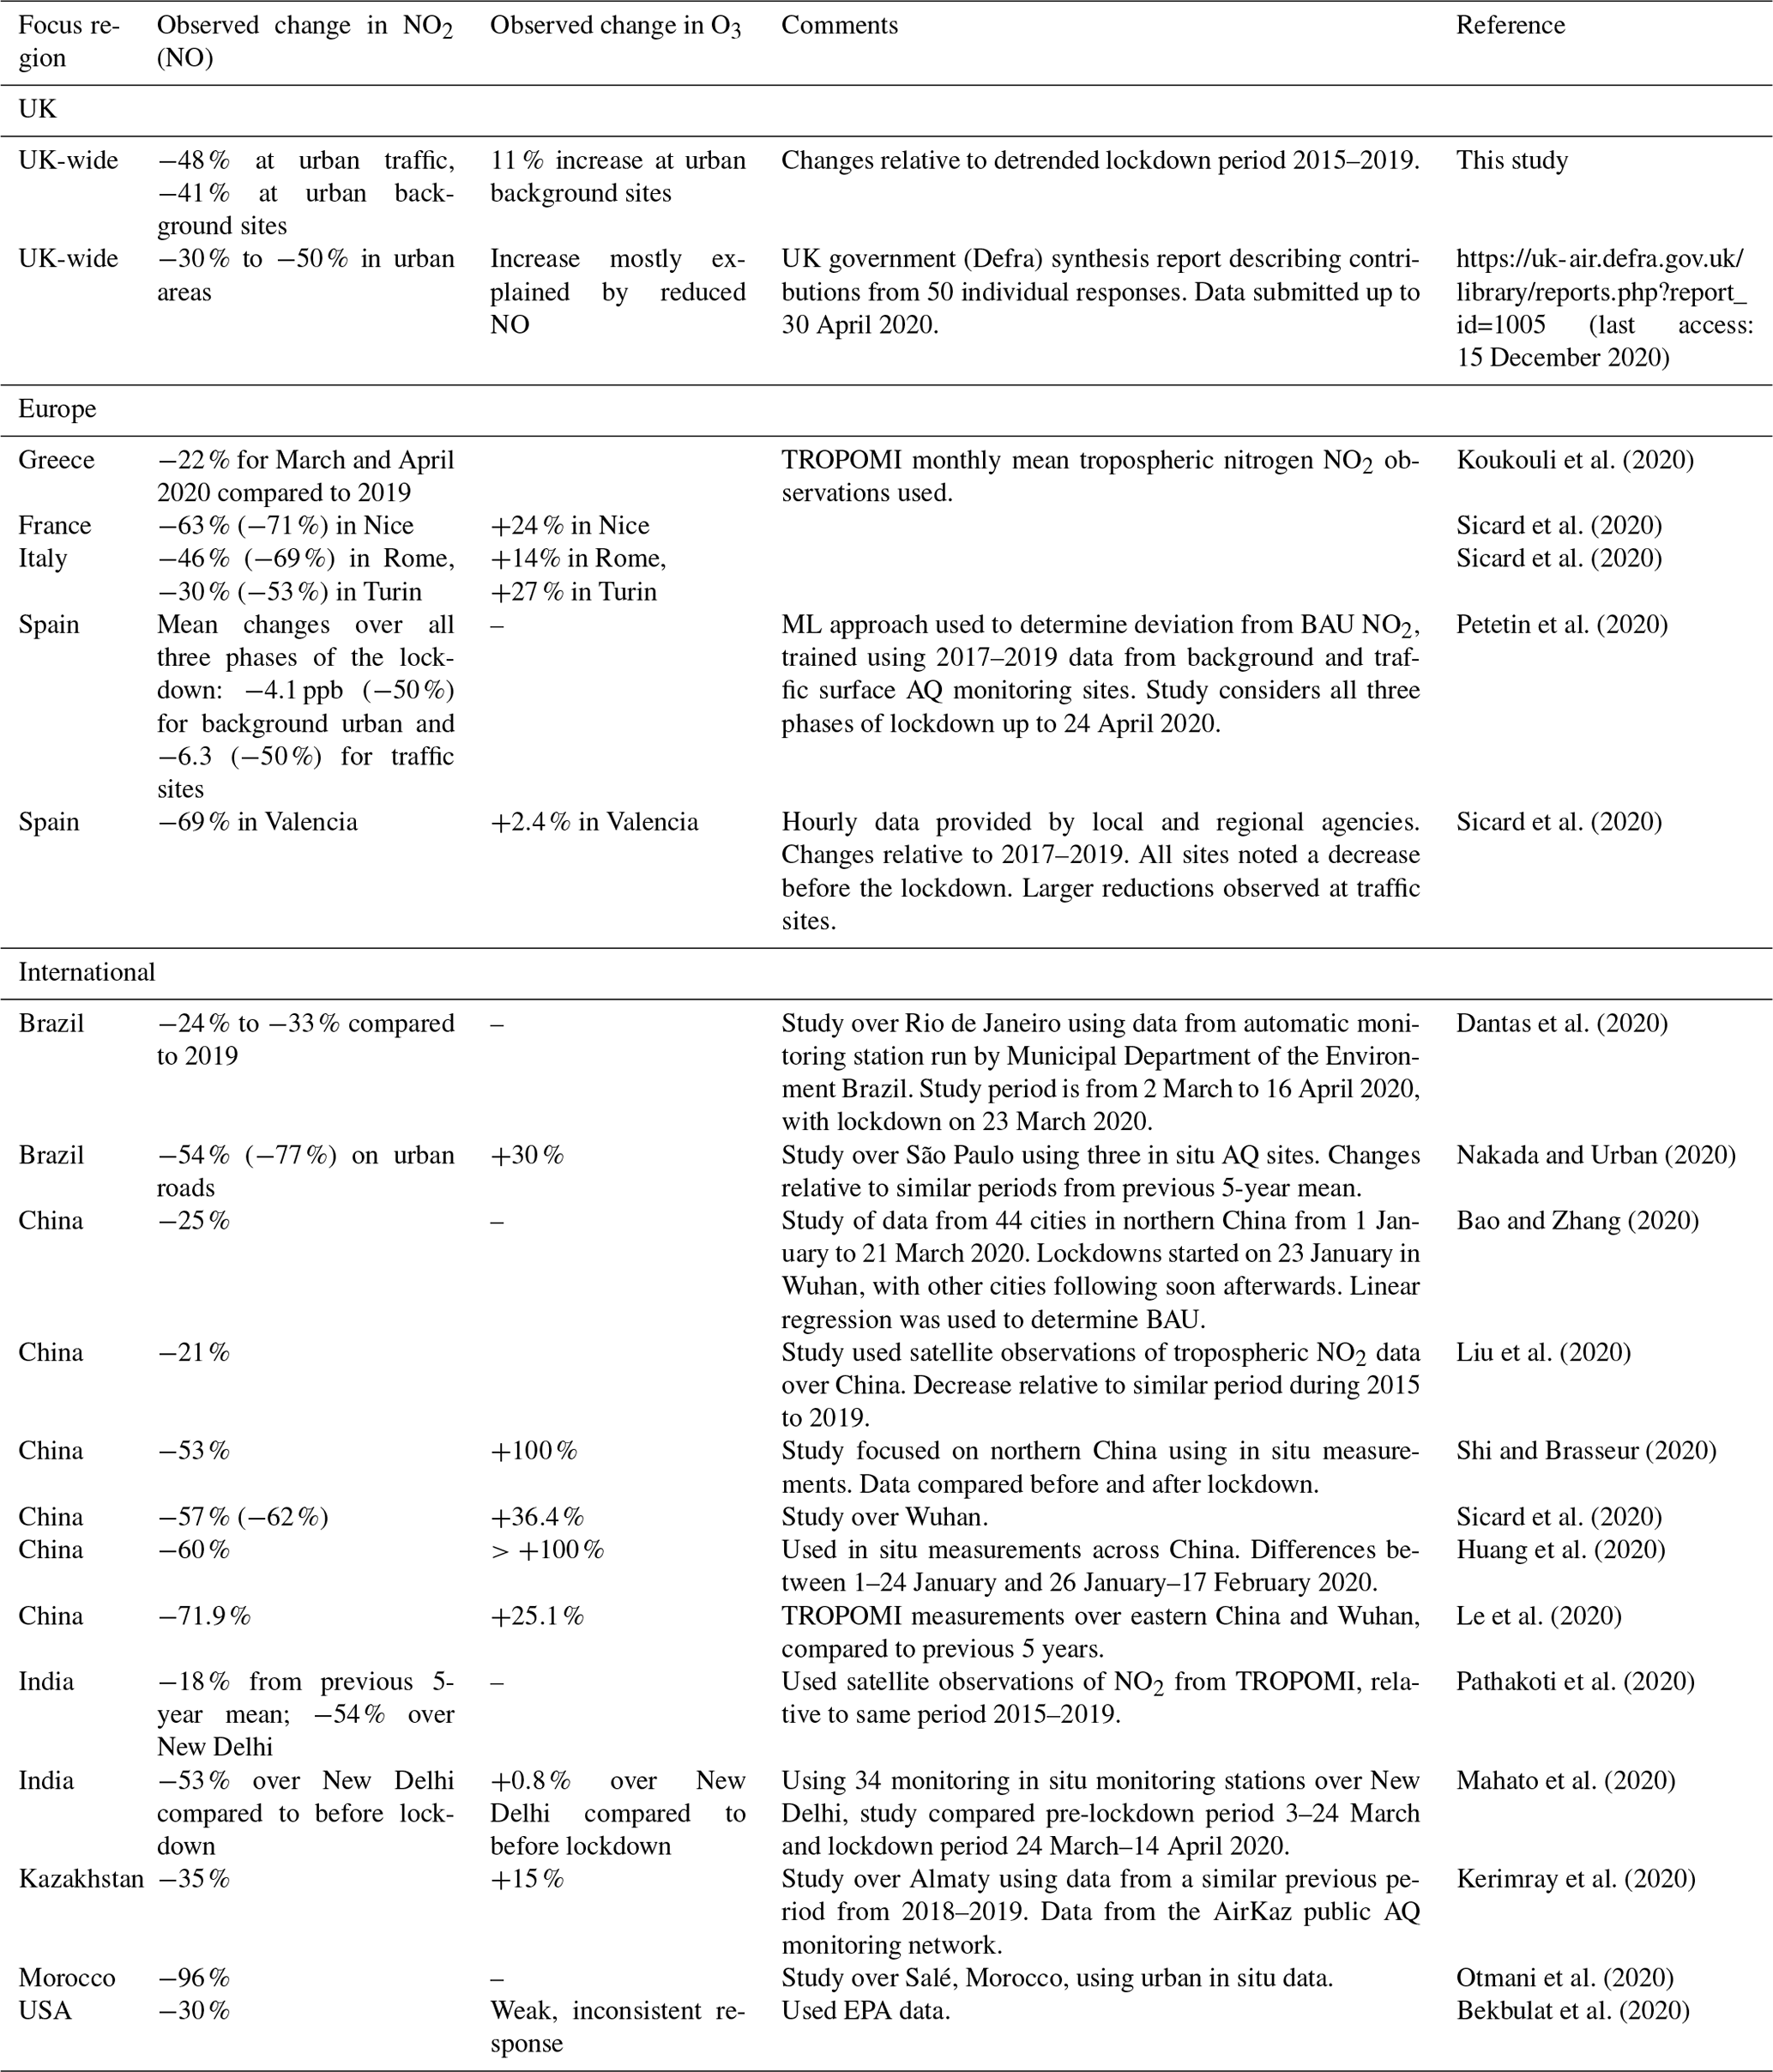
The effects of the change of emissions on nitrogen dioxide (NO2) and ozone (O3) have been observed using satellite and in situ measurements in several studies. Table 1 summarizes studies from a growing body of work that report changes in NO2 and other air pollutants in countries across the world that are associated with the global COVID-19 lockdown, including satellite observations (Liu et al., 2020) and in situ measurements. These studies have used various methods to isolate the impact of the COVID-19 lockdown on changes in air pollutants from confounding factors, for instance meteorology, using atmospheric chemistry transport models and weather normalization techniques based on machine learning (ML) algorithms. In Europe, reductions of NO2 are typically slightly larger than we have seen in the UK in our study, perhaps reflecting more stringent lockdown policy. In Spain, NO2 was reduced by 50 % at both urban traffic and urban background sites (Petetin et al., 2020); in Rome, Turin and Nice, NO2 was reduced by 46, 30 and 63 %, respectively (Sicard et al., 2020). In all of these studies similar-magnitude increases of O3 were observed, mainly attributed to the decreased nitric oxide (NO). Further afield, in India the TROPOspheric Monitoring Instrument (TROPOMI) satellite measurements showed that during the COVID-19 lockdown there was a 18 % decrease in NO2 over the whole country, with a 54 % decrease over New Delhi compared to the same period in 2015–2019 (Pathakoti et al., 2020). In situ measurements in New Delhi showed a 53 % decrease in NO2 and a 0.8 % increase in O3 for the lockdown period compared to the 2 weeks immediately preceding it. In Rio de Janeiro, Brazil, there was a 24–33 % decrease in NO2 during the lockdown compared to the week before (Dantas et al., 2020), and in São Paulo data from urban roadside sites showed a 54 % decrease in NO2 compared to the previous 5 years (Nakada and Urban, 2020). In China, satellite observations showed a mean NO2 decrease of 21 % across the whole country, relative to a similar period in 2015–2019 (Bao and Zhang, 2020). In situ measurements in cities in northern China before and after lockdown showed a 53 % decrease in NO2 (Shi and Brasseur, 2020), and in situ measurements in cities across the whole of China showed a 60 % decrease in NO2 comparing 1–24 January 2020 and 26 January–17 February 2020 (Huang et al., 2020). Both these two studies also reported a >100 % increase in O3. These studies were both during wintertime, so the O3 increase was largely attributed to the reduction in NO emissions, reducing titration of O3 to NO2; however the possible effect of reduced particles on UV radiation and hence O3 production was also considered to have led to some of the increased O3. Le et al. (2020) use satellite data to show a 71.9 % decrease in NO2 and 93 % decrease in Wuhan at the peak of the outbreak. They also report a 25.1 % increase in O3 in Wuhan, largely attributed to a reduction in titration with NO. In the USA one study using EPA data showed a mean decrease of 30 % of NO2 in urban areas of Seattle, Los Angeles and New York during the lockdown. The study did not show any consistent change in O3 levels (Bekbulat et al., 2020). Here, we report changes in NO2 across the UK and discuss them in context of observed changes in surface O3.
In 2018 the road transport sector accounted for 37 % of UK NOx (sum of NO and NO2), the largest emission from a single sector, followed by energy industries (21 %), non-road transport (mainly rail and aviation) (15 %), manufacturing industries and construction (10 %) and domestic combustion (9 %) (https://www.gov.uk/government/statistical-data-sets/env01-emissions-of-air-pollutants, last access: 15 December 2020). In major cities, the contribution from road transport is typically much higher. On average across six cities in the UK (London, Bristol, Cardiff, Newcastle, Glasgow and Belfast) for example 47 %±6 % comes from road transport, with 17 %±5 % from domestic combustion, 15 %±6 % from non-road transport sources (mainly rail), 14±10 % from energy industries and 6 %±2 % from industrial combustion. In recent years, there has been a pronounced reduction in NOx emission (Defra, 2018a), which largely reflects lower transport emissions, with NO2 showing an average decrease of 3.3 % per year since 2015. Since 2014, Euro 6 standards for light passenger diesel vehicles reduced the maximum permitted NOx emission from 0.18 to 0.08 g km−1, and the number of ultra-low emission vehicles (e.g. electric, hybrid cars) has increased its market share from 0.59 % in 2014 to 2.6 % in 2018. Despite these developments, air pollution is still currently the largest environmental health stressor on the UK population (Public Health England, 2019).
At present the main pollutants of concern are NO2 and particulate matter with diameter smaller than 2.5 µm (PM2.5) in urban centres, and O3 in urban, suburban and rural environments with exposure to excess levels of these species is known to have a negative effect on human health (An et al., 2018; Kurt et al., 2016; Mannucci et al., 2015). O3 is a secondary air pollutant formed photochemically by the oxidation of volatile organic compounds (VOCs) in the presence of NOx (Monks et al., 2015). It is generally lower in urban areas due to reactions with NOx, but in the past 2 decades over the UK (Finch and Palmer, 2020), and across the world (Fleming et al., 2018; Lefohn et al., 2018; Ma et al., 2016; Paoletti et al., 2014; Sicard et al., 2013; Sun et al., 2016), there have been large mean surface O3 increases in urban centres driven by reduced NOx emissions. In more rural environments, the opposite has been observed, with O3 decreasing with decreasing NOx emissions (Cooper et al, 2012; Cooper et al., 2014; Strode et al., 2015). Air pollution has led to an estimated 29 000 premature deaths per year in the UK, equivalent to 340 000 life years across the population in any 1 year, and costs the UK economy between GBP 10 billion and GBP 20 billion yr−1 (Royal College of Physicians, 2016). To meet the UK government's clean air strategy (UK Government, 2019) and its commitment to achieve its zero-carbon-emission target by 2050, sales of non-zero-emission cars, vans and motorcycles will end by 2035. One of the challenges associated with the progressive move to a low-NOx vehicle fleet in the UK is to understand the impacts on surface air pollution if other emissions are not reduced commensurately.
The widespread and rapid reduction in UK transport activity (and therefore the associated emissions) from the COVID-19 lockdown represents a natural experiment to study air pollution with a greatly reduced volume of NOx-emitting vehicles, which we use as a proxy for a future low-NOx vehicle fleet. Figure 1 summarizes the timeline of events associated with COVID-19 in the UK, including Google mobility data that describe the percentage changes in transport from a pre-lockdown baseline and daily mortality values reported by the UK Office of National Statistics. Google mobility data were used as a proxy for traffic counts as they are readily accessible; however for any quantitative analysis of the effect of reduction in traffic on pollution levels, real traffic counts or flow data would be required. The UK Foreign and Commonwealth Office issued a travel advisory on 28 January not to travel to mainland China. The first two UK cases of COVID-19 were confirmed on 31 January, with a third case confirmed on 6 February. As the number of cases continued to rise, the first UK death from COVID-19 was confirmed on 5 March. On that same day, the UK government moved from the “containment” to the “delay” phase of addressing COVID-19, which included, for example, social distancing. A UK-wide lockdown was announced nearly 3 weeks later on 23 March, with citizens instructed to stay at home with the exception of shopping for basic necessities, one form of exercise per day, medical needs and travel associated with key workers. An immediate effect of these restrictions in movement was a large and progressive drop in transport use, with an associated reduction in motor vehicles throughout the lockdown period. We use in situ measurements collected across the UK to examine how these reductions (and other changes) have affected NO2 in the UK, with a discussion on how this could have, in turn, affected O3. We also examine the changes in exceedances of limit values for NO2 and O3 and assess whether the COVID-19 lockdown can provide useful information on how air pollution will respond to future changes in emissions due to the move to a low-carbon economy. In the next section we discuss the data we use. In Sect. 3 we describe our results for NO2, which we put into context in Sect. 4 with the observed changes in surface O3, as well as comparing our results with other studies. We conclude the paper in Sect. 5.
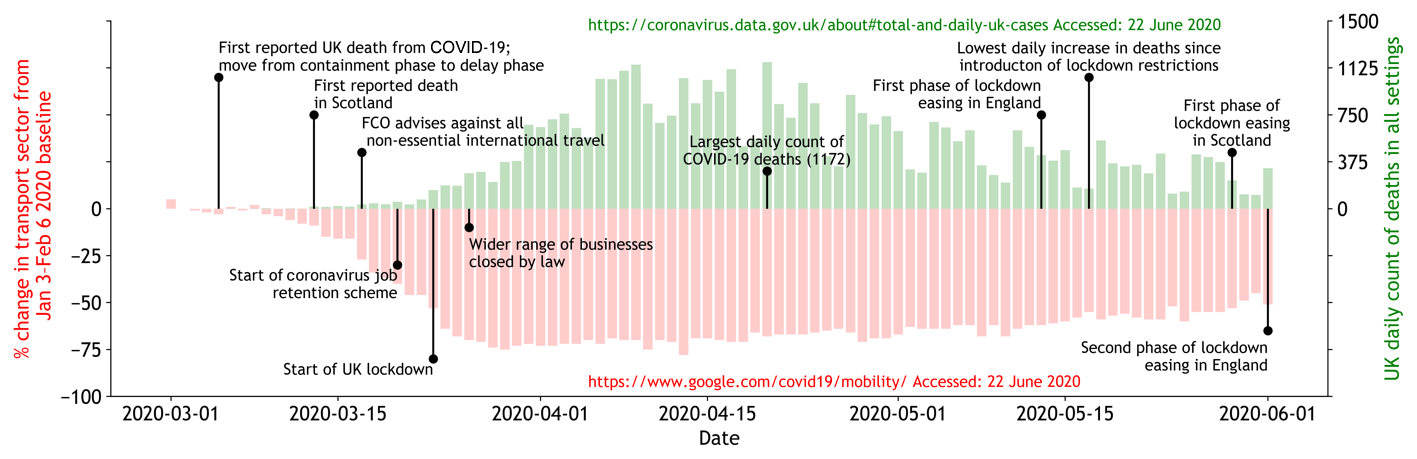
Figure 1Schematic of the timelines involved with daily mortality values attributed by the UK government to COVID-19, and changes in mobility from the transport sector (inferred from Google location data on smartphones) compared to a reference period (3 January–6 February 2020) before the lockdown period. Also included are key dates that describe the run-up and evolution of the UK lockdown. Data acknowledgements are shown inset on the plot.
2.1 In situ measurements of NO2 and O3
We use data collected as part of the Defra Automatic Urban and Rural (AURN) network, which currently consists of 150 active sites across the UK (Fig. S1 and Tables S1 and S2 in the Supplement) and is the main network used for compliance reporting against the Ambient Air Quality Directives. It includes automatic air quality monitoring stations measuring oxides of nitrogen (NOx), sulfur dioxide (SO2), ozone (O3), carbon monoxide (CO) and particles (PM10, PM2.5). Online measurements of VOCs are available at a small number of sites. These sites provide hourly information, which is communicated rapidly to the public, using a wide range of electronic media and web platforms. More detail can be found at https://uk-air.defra.gov.uk (last access: 15 December 2020). Three different site types are used in this analysis. Urban traffic sites are defined as being in continuously built-up urban areas, with pollution levels predominantly influenced by emissions from nearby traffic. Urban background sites are located such that pollution levels are not influenced significantly by any single source or street, but rather by the integrated contribution from all sources upwind of the stations. These can be considered more representative of residential areas. Rural background sites are sited more than 20 km away from agglomerations and more than 5 km away from other built-up areas, industrial installations or motorways or major roads, so that the air sampled is representative of air quality in a surrounding area of at least 1000 km2.
The AURN network uses standardized techniques and operating procedures to ensure data are comparable. Full details can be found at https://uk-air.defra.gov.uk/assets/documents/reports/empire/lsoman/ (last access: 15 December 2020), but a brief description will be given here. NO in the sample air stream reacts with O3 in an evacuated chamber to produce activated nitrogen dioxide (NO2*). This then returns to its ground (unactivated) state, emitting a photon (chemiluminescence). The intensity of the chemiluminescent radiation produced depends upon the amount of NO in the sampled air. This is measured using a photomultiplier tube or photodiode detector, so the detector output voltage is proportional to the NO concentration. The ambient air sample is divided into two streams. In one stream, the ambient NO2 is reduced to NO (with at least 95 % efficiency) using a molybdenum catalyst converter before reaction. The molybdenum converter should be at least 95 % efficient at converting NO2 to NO. External gas cylinders or an internal permeation oven and zero air scrubber are used to provide daily automatic check calibrations for NO. The NO2 conversion efficiency is checked every 6 months using either an NO2 calibration cylinder or gas phase titration of the NO with O3. In recent years it has become well established that NO2 measurements using molybdenum converters can overestimate NO2 due to interferences from other oxidized nitrogen species (e.g. HNO3, PAN, HONO) (Steinbacher et al., 2007). However, in urban environments the interferences are often minimal compared to the levels of NOx (Villena et al., 2012). In addition, as we are looking at a change in NO2, it is likely that any interference that is present will be there in very similar amounts in both the 2020 and 2015–2019 data. Ozone is measured by UV absorption at 254 nm, with concentrations calculated using the Beer–Lambert law (Parrish and Fehsenfeld, 2000). An O3-removing scrubber is used to provide a zero-reference intensity. An internal ozone generator and zero air scrubber are used to provide daily automatic check calibrations, and instruments are calibrated with a primary ozone standard every 12 months. Whilst the accuracy of the measurement will vary on a site-by-site basis, the maximum allowed uncertainty for the AURN network is 15 % for NO2 and O3 measurements. To study the effect of the lockdown on NO2 levels in the UK, we use measurements from 66 urban traffic and 62 urban background sites across the UK, all of which have measurements between 2015 and the end of May 2020.
2.2 Correlative meteorological data
Measured meteorological data (wind direction, wind speed and temperature) are not available at most AURN sites, so modelled data, based on the position of the site, from the UK Met Office Unified Model are used. UV-A irradiance data are taken from measurements made by the Public Health England solar network.
2.3 Statistical methods
To quantify the impact of the COVID-19 lockdown on atmospheric levels of NO2 and O3, we compare measurements during the lockdown with values corresponding to “business as usual” (BAU), i.e. what we would have expected in the absence of the pandemic. To determine our BAU scenario, we first linearly detrend and deseasonalize NO2 data at each AURN site. To deseasonalize the data, we determine the climatology based on the mean annual cycle of the previous 5 years (from 1 January 2015 to 31 December 2019), which is then repeated to match the length of the time series, subtracted from the mean to standardize the data and then subtracted from the original time series to produce a time series of the residuals. This 5-year period is sufficiently long to take into account year-to-year variations in meteorology but short enough to reduce the impact of any longer-term trends driven by earlier changes in emission standards. We then calculate the difference between a linear regression model of the previous data, projected forward to June 2020 to predict BAU values of NO2 and O3 (Fig. 2), and calculate the difference between this and the measured values. We acknowledge there are uncertainties associated with our approach, but this method offers simplicity and straightforward error propagation. Other more complex methods of determining BAU that, for example, explicitly take into account local changes in meteorology (Grange and Carslaw, 2019) will also be subject to uncertainties, for example the extent to which regional-scale meteorological fields can describe smaller-scale variations in atmospheric pollutants. We define the start of the UK lockdown period as 23 March 2020, when the lockdown was advised by the UK government. Figure 1 shows that a decrease in mobility in the transport sector is already evident from 9 March, which in the absence of any obvious change in law is perhaps influenced by the emerging crises in nearby European countries. Our analysis concludes on 31 May 2020, the day before the first phase of lockdown easing in England.
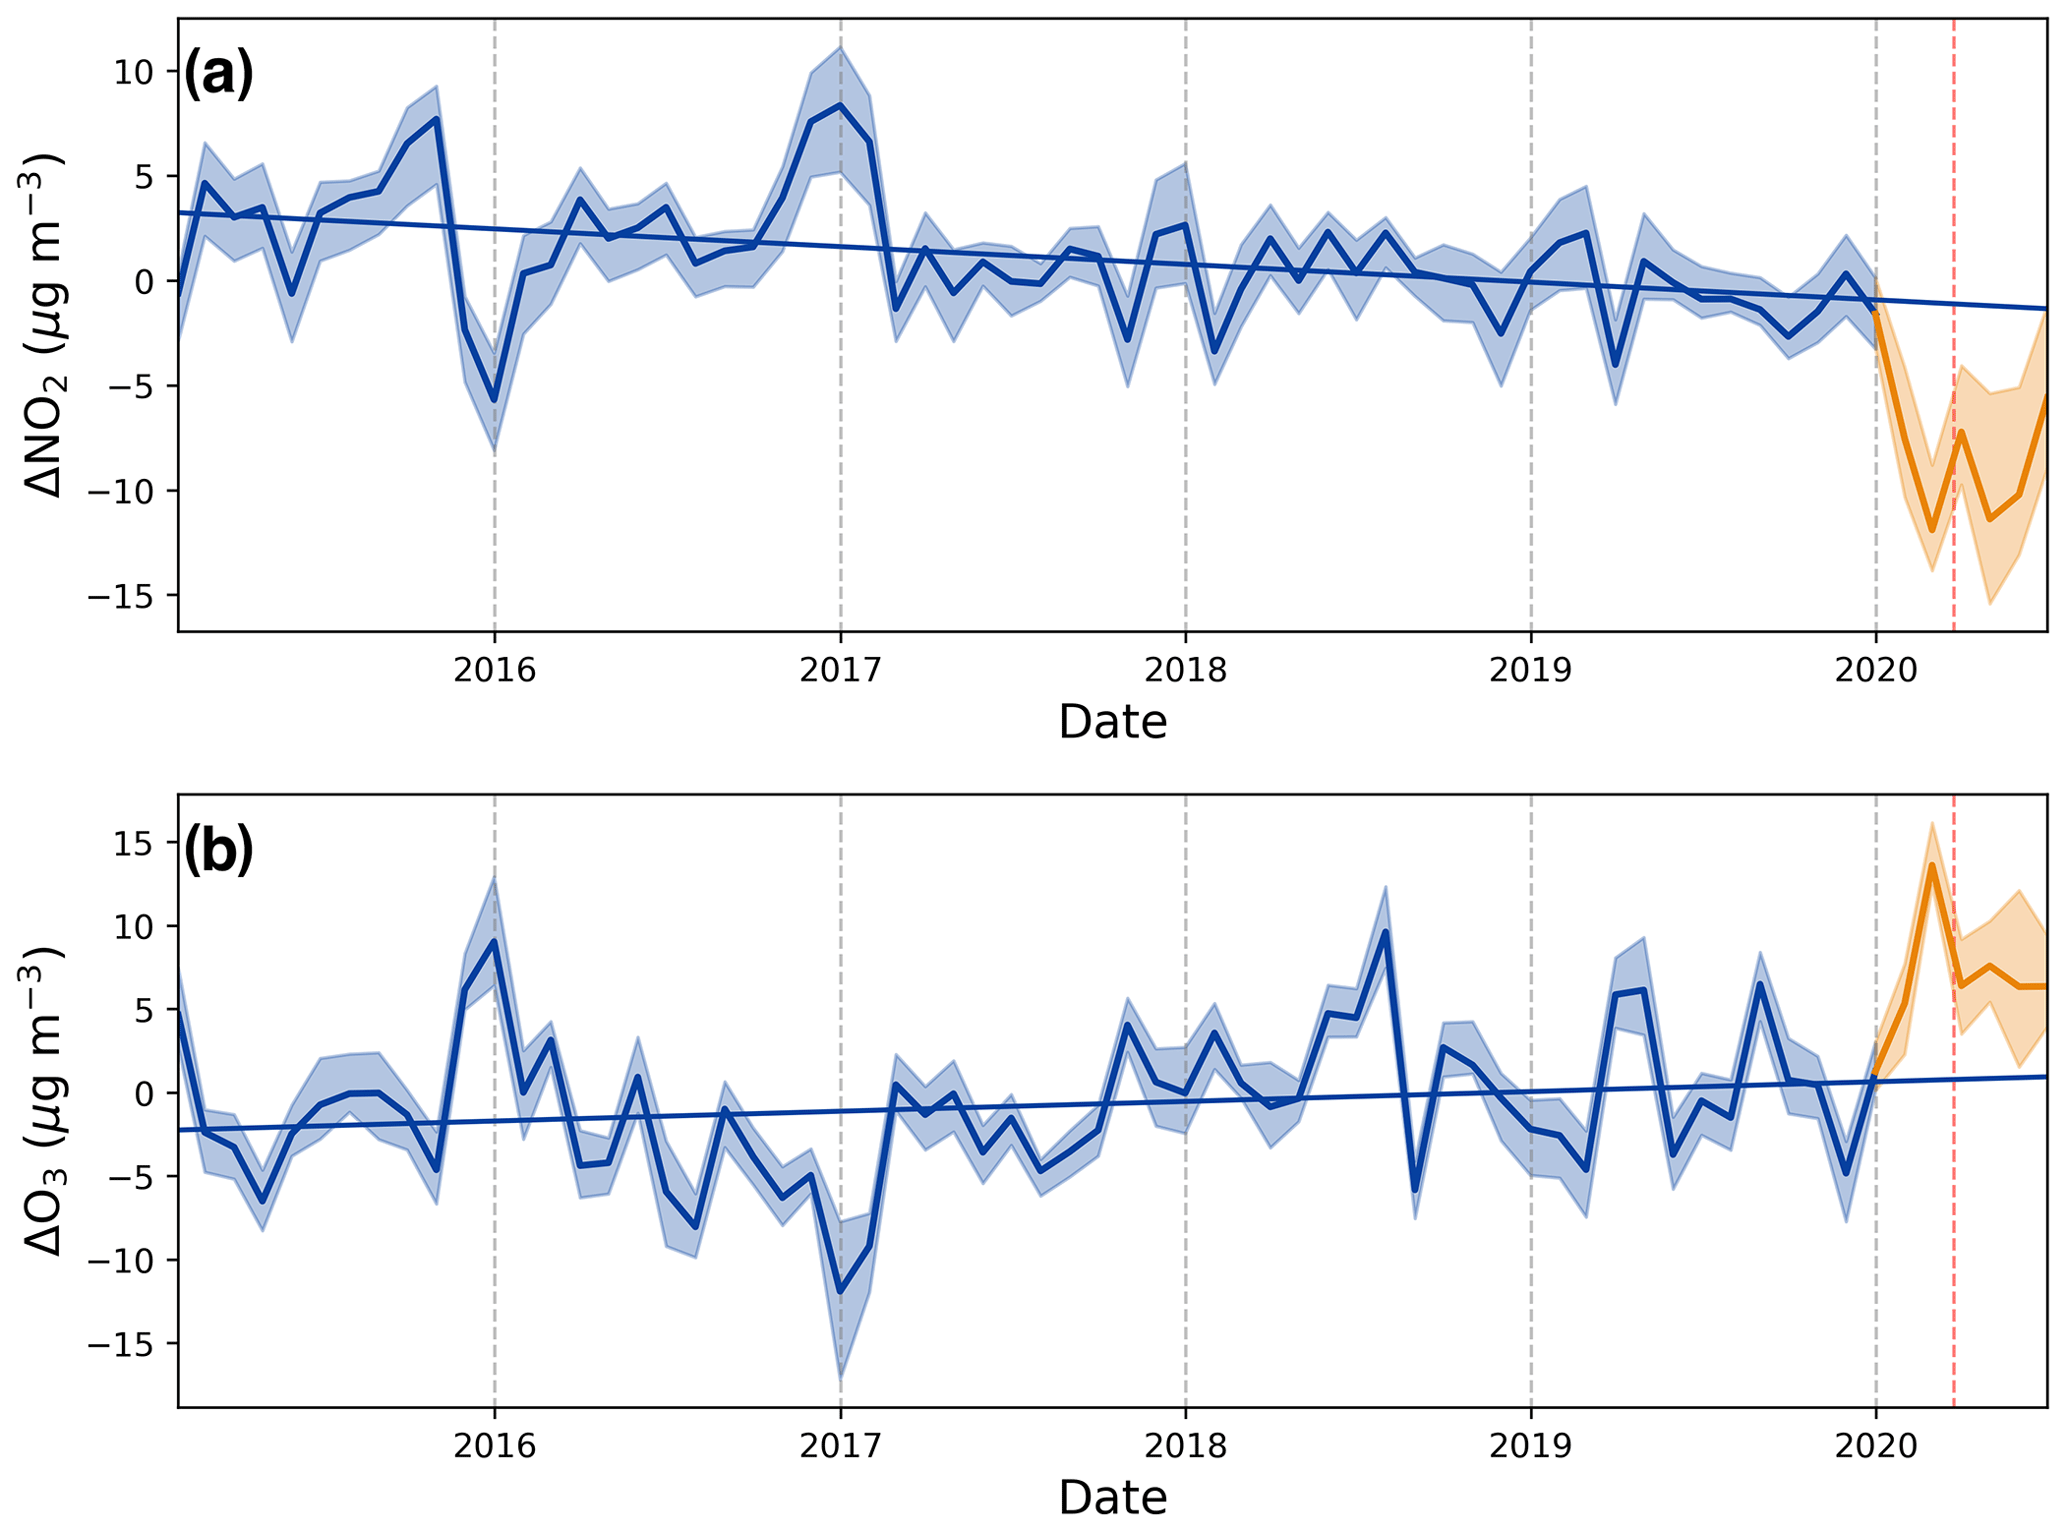
Figure 2Mean relative change of deseasonalized UK values of (a) NO2 and (b) O3 for all urban background and traffic sites from 2015 to 2020, with the mean 2015–2019 trend superimposed. Data from 2020 are shown in orange, with the red dashed line denoting the start of the lockdown on 23 March 2020. The 25–75 % range is shown by the shaded area.
We use independent sample Mann–Whitney U tests to test the significance of changes in mean concentration for each site between the lockdown period and the mean of the same period for the past 5 years, the lockdown period and measurements in 2020 prior to the lockdown, and measurements from prior to lockdown in 2020 with the same period for the previous 5 years. This test indicates how likely the observed changes in mean concentration between the different time periods are due to chance and noise in the data or whether they are statistically significant and can be attributed to a real signal, which in our work is the start of the lockdown. We use this test rather than a t test or z test due to the large sample size and non-normal distribution of the data.
Figure 2 shows the mean relative change of UK deseasonalized NO2 and O3 observations from all urban sites from 2015–May 2020 and the mean trend from 2015 to 2019. The mean NO2 linear trend across all AURN urban traffic (background) sites is −1.4 (−0.6) (−4.5 (−2.1) % yr−1). The urban traffic site at London Marylebone Road shows the largest decreasing trend over the past 5 years: (); in contrast, eight urban sites show a small increasing trend in NO2 between 0.1 and 0.6 (0.5 % yr−1–1.2 % yr−1). The mean standard error of the NO2 trend for all sites is 0.002 µg m−2. The mean O3 linear trend across all urban traffic (background) sites is 2.4 (1.3) (5.5 (3.1) % yr−1), and the mean standard error of the fit for all sites is 0.003 µg m−2.
3.1 Meteorological context
It is well understood that ambient concentrations of air pollutants are greatly affected by meteorology, with low wind speeds causing a build-up of pollutants, and over the UK easterly flow is often accompanied by pollution from mainland Europe. Figure 3 shows surface wind data from six cities across the UK (London, Bristol, Cardiff, Newcastle, Glasgow and Belfast), providing information from a wide geographical range across the country. Wind roses for the pre- (10 January–10 March) and post-lockdown (23 March–31 May) periods of 2020 and the mean of 2015–2019 show that all cities during the pre-lockdown period in 2020 were dominated by strong westerly winds across all of the UK, with successive low-pressure systems across the UK, including the storms named Ciara, Dennis and Jorge through the month of February and early March. The winter season (January–February) was the fifth wettest on record and the fifth warmest. February 2020 was the wettest-ever February recorded in the UK. The wind roses also show that 2020 saw much stronger winds than the mean of the previous 5 years. The six cities saw an average wind speed in 2020 of (6.5±1.2) m s−1, which was 33.5 % higher than the average of the previous 5 years. Since the beginning of the COVID-19 lockdown, meteorological conditions have been much more settled, with high pressure and easterly winds dominating UK weather since mid-March, especially in the southern and western UK. Average wind speed across the six cities was (4.1±0.4) m s−1, although this is still an increase of 7.5 % compared to the previous 5 years. Of the cities analysed, Cardiff saw the largest increase in wind speed for 2020 compared to the previous 5 years (16.8 %), with Bristol showing a 10 % increase. The other cities all saw slight (<5 %) decreases in wind speed in 2020. Typically, meteorological conditions of lower wind speed are associated with higher levels of air pollution due to increased atmospheric stability and transport of pollution from mainland Europe in the UK, and so care must be taken when comparing pre and post-lockdown levels of air pollution, as described in Sect. 2.3, and comparing to the average of the previous 5 years is a better measure of the changes.
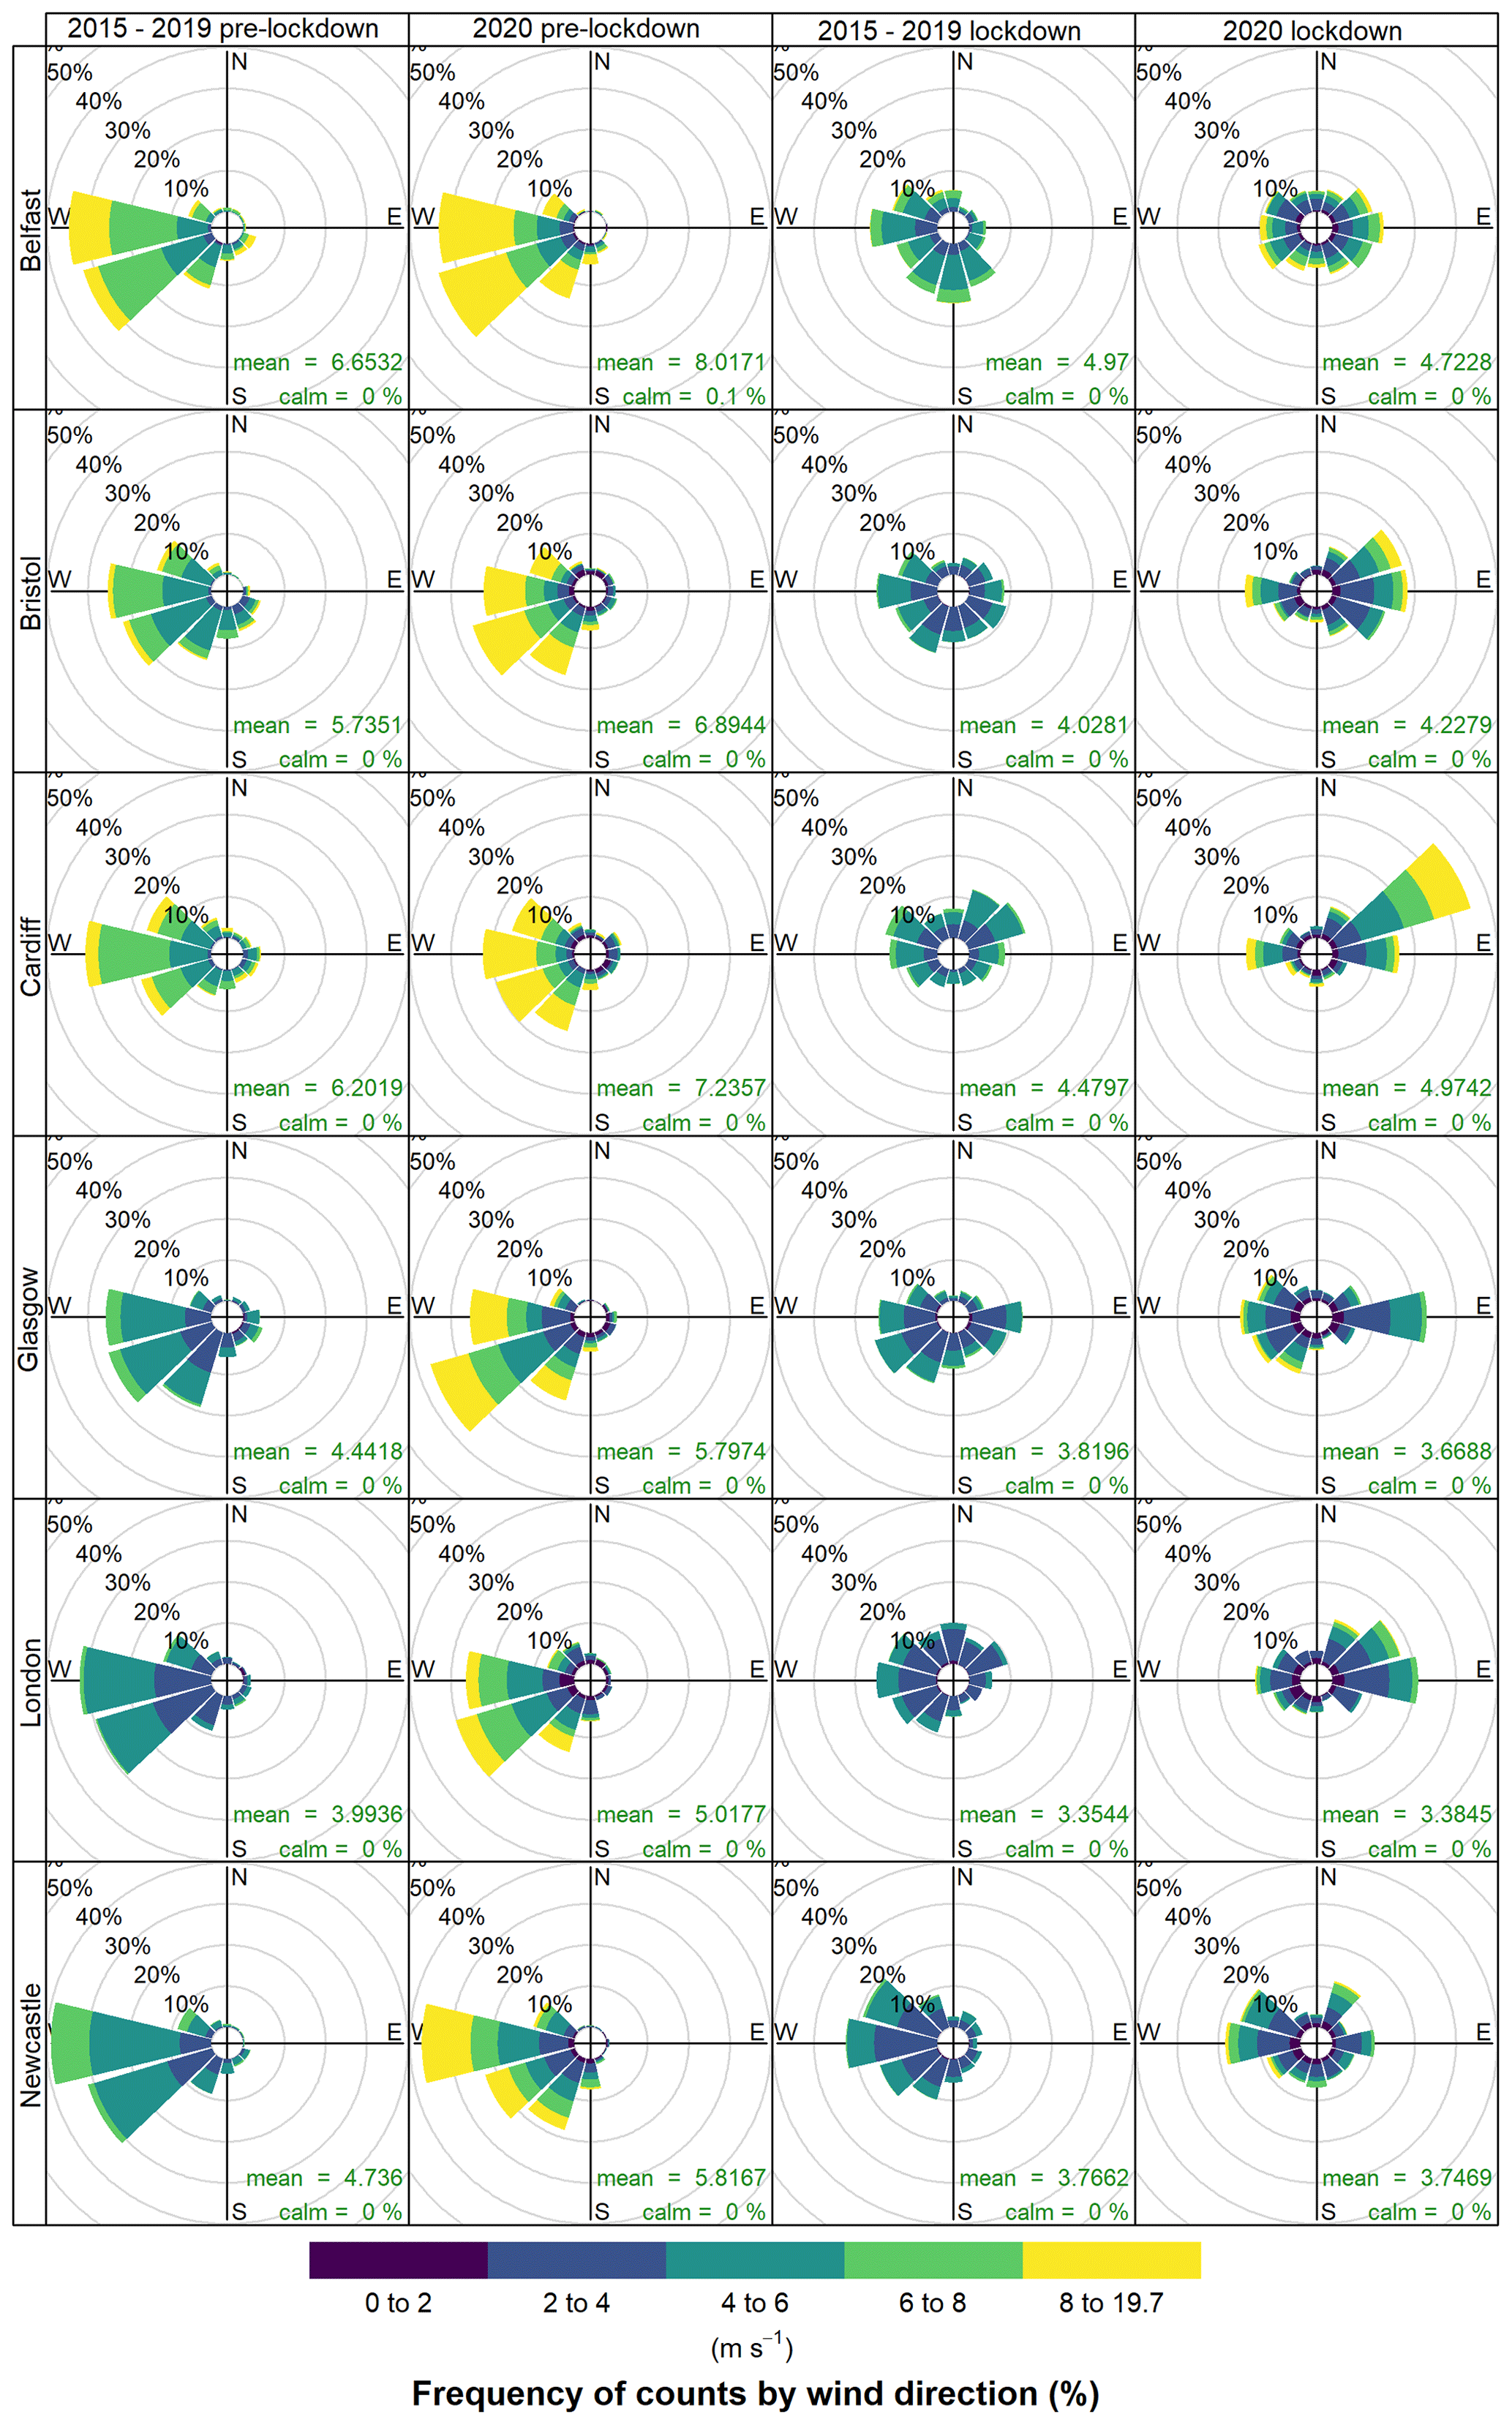
Figure 3Average wind roses for six cities for pre- and post-lockdown period and lockdown period 2015–2019 and 2020. Data used are modelled using the UK Met Office Unified Model.
3.2 Observed changes in daily mean and diurnal variations of NO2
Measurements in 2020 from 65 urban traffic (Fig. S2a in the Supplement) and 61 urban background (Fig. S2b in the Supplement) AURN measurement sites across the UK show clear reductions in NO2 concentrations across all sites following the lockdown. Some of these differences are due to the natural seasonal variation in NO2 and meteorology. To account for these expected variations, we calculate the daily difference of NO2 values from 2020 with mean NO2 values from detrended values from 2015 to 2019 for the appropriate day of year. This approach allows us to emphasize the difference of NO2 values in 2020 from previous years. During the lockdown period, we find that 83 % of days in 2020 at urban traffic sites have lower NO2 values, far outnumbering those with higher NO2 values (17 %). During the pre-lockdown period, we find 76 % of days at urban traffic sites in 2020 are below the 2015–2019 mean. We find a similar situation for urban background sites, with 73 % of days below the 2015–2019 mean, but the decrease during the lockdown period is not as dramatic.
Figure 4 shows the percentage difference for all urban traffic and urban background sites for the lockdown period in 2020 compared to the same period averaged across 2015–2019. To assess the error, we combined the standard error in the median of the daily median concentrations for the lockdown period in 2015–2019 and 2020, with error bars shown on the graph. After removing site-dependent trends, it is observed that urban traffic sites have a mean decrease of (13.4±2.1) µg m−3 in NO2 over the lockdown period compared with the same period over the previous 5 years. This mean decrease approximately equates to a (48±9.5) % drop in NO2 levels across the UK. The AURN site Glasgow Kerbside observed the largest mean percentage decrease of (71.2±7.7) % during the lockdown period, closely followed by Cambridge Roadside (68.8±9.9) % and London Marylebone Road with a decrease of (67.8±7.8) %. In total, 32 of the 65 urban traffic sites saw a decrease in NO2 of greater than 50 %. Armagh Roadside (Northern Ireland) is the only urban traffic site to show a mean increase in NO2 (1.3±1.1) µg m−3 (6.7±6.2) %. Urban background sites show a smaller mean reduction of (4.9±1.1) µg m−3, equating to a decrease of (40.6±10.1) % in NO2 levels across the UK. The largest decrease of (25.7±3.3) µg m−3 was observed at London Hillingdon, corresponding to (59.3±9.6) %. Small increases ( (<10 %)) were seen in York Bootham (Yorkshire and Humberside) and Eastbourne (South East). On average across all urban sites (traffic and background), a decrease in NO2 of (42±9.8) % is observed. We see that, whilst NO2 concentrations do tend to be higher at lower wind speed (Fig. S3b in the Supplement), there is very little correlation between the observed change in NO2 between 2020 and the previous 5 years and any change in wind speed (Fig. S3a in the Supplement).
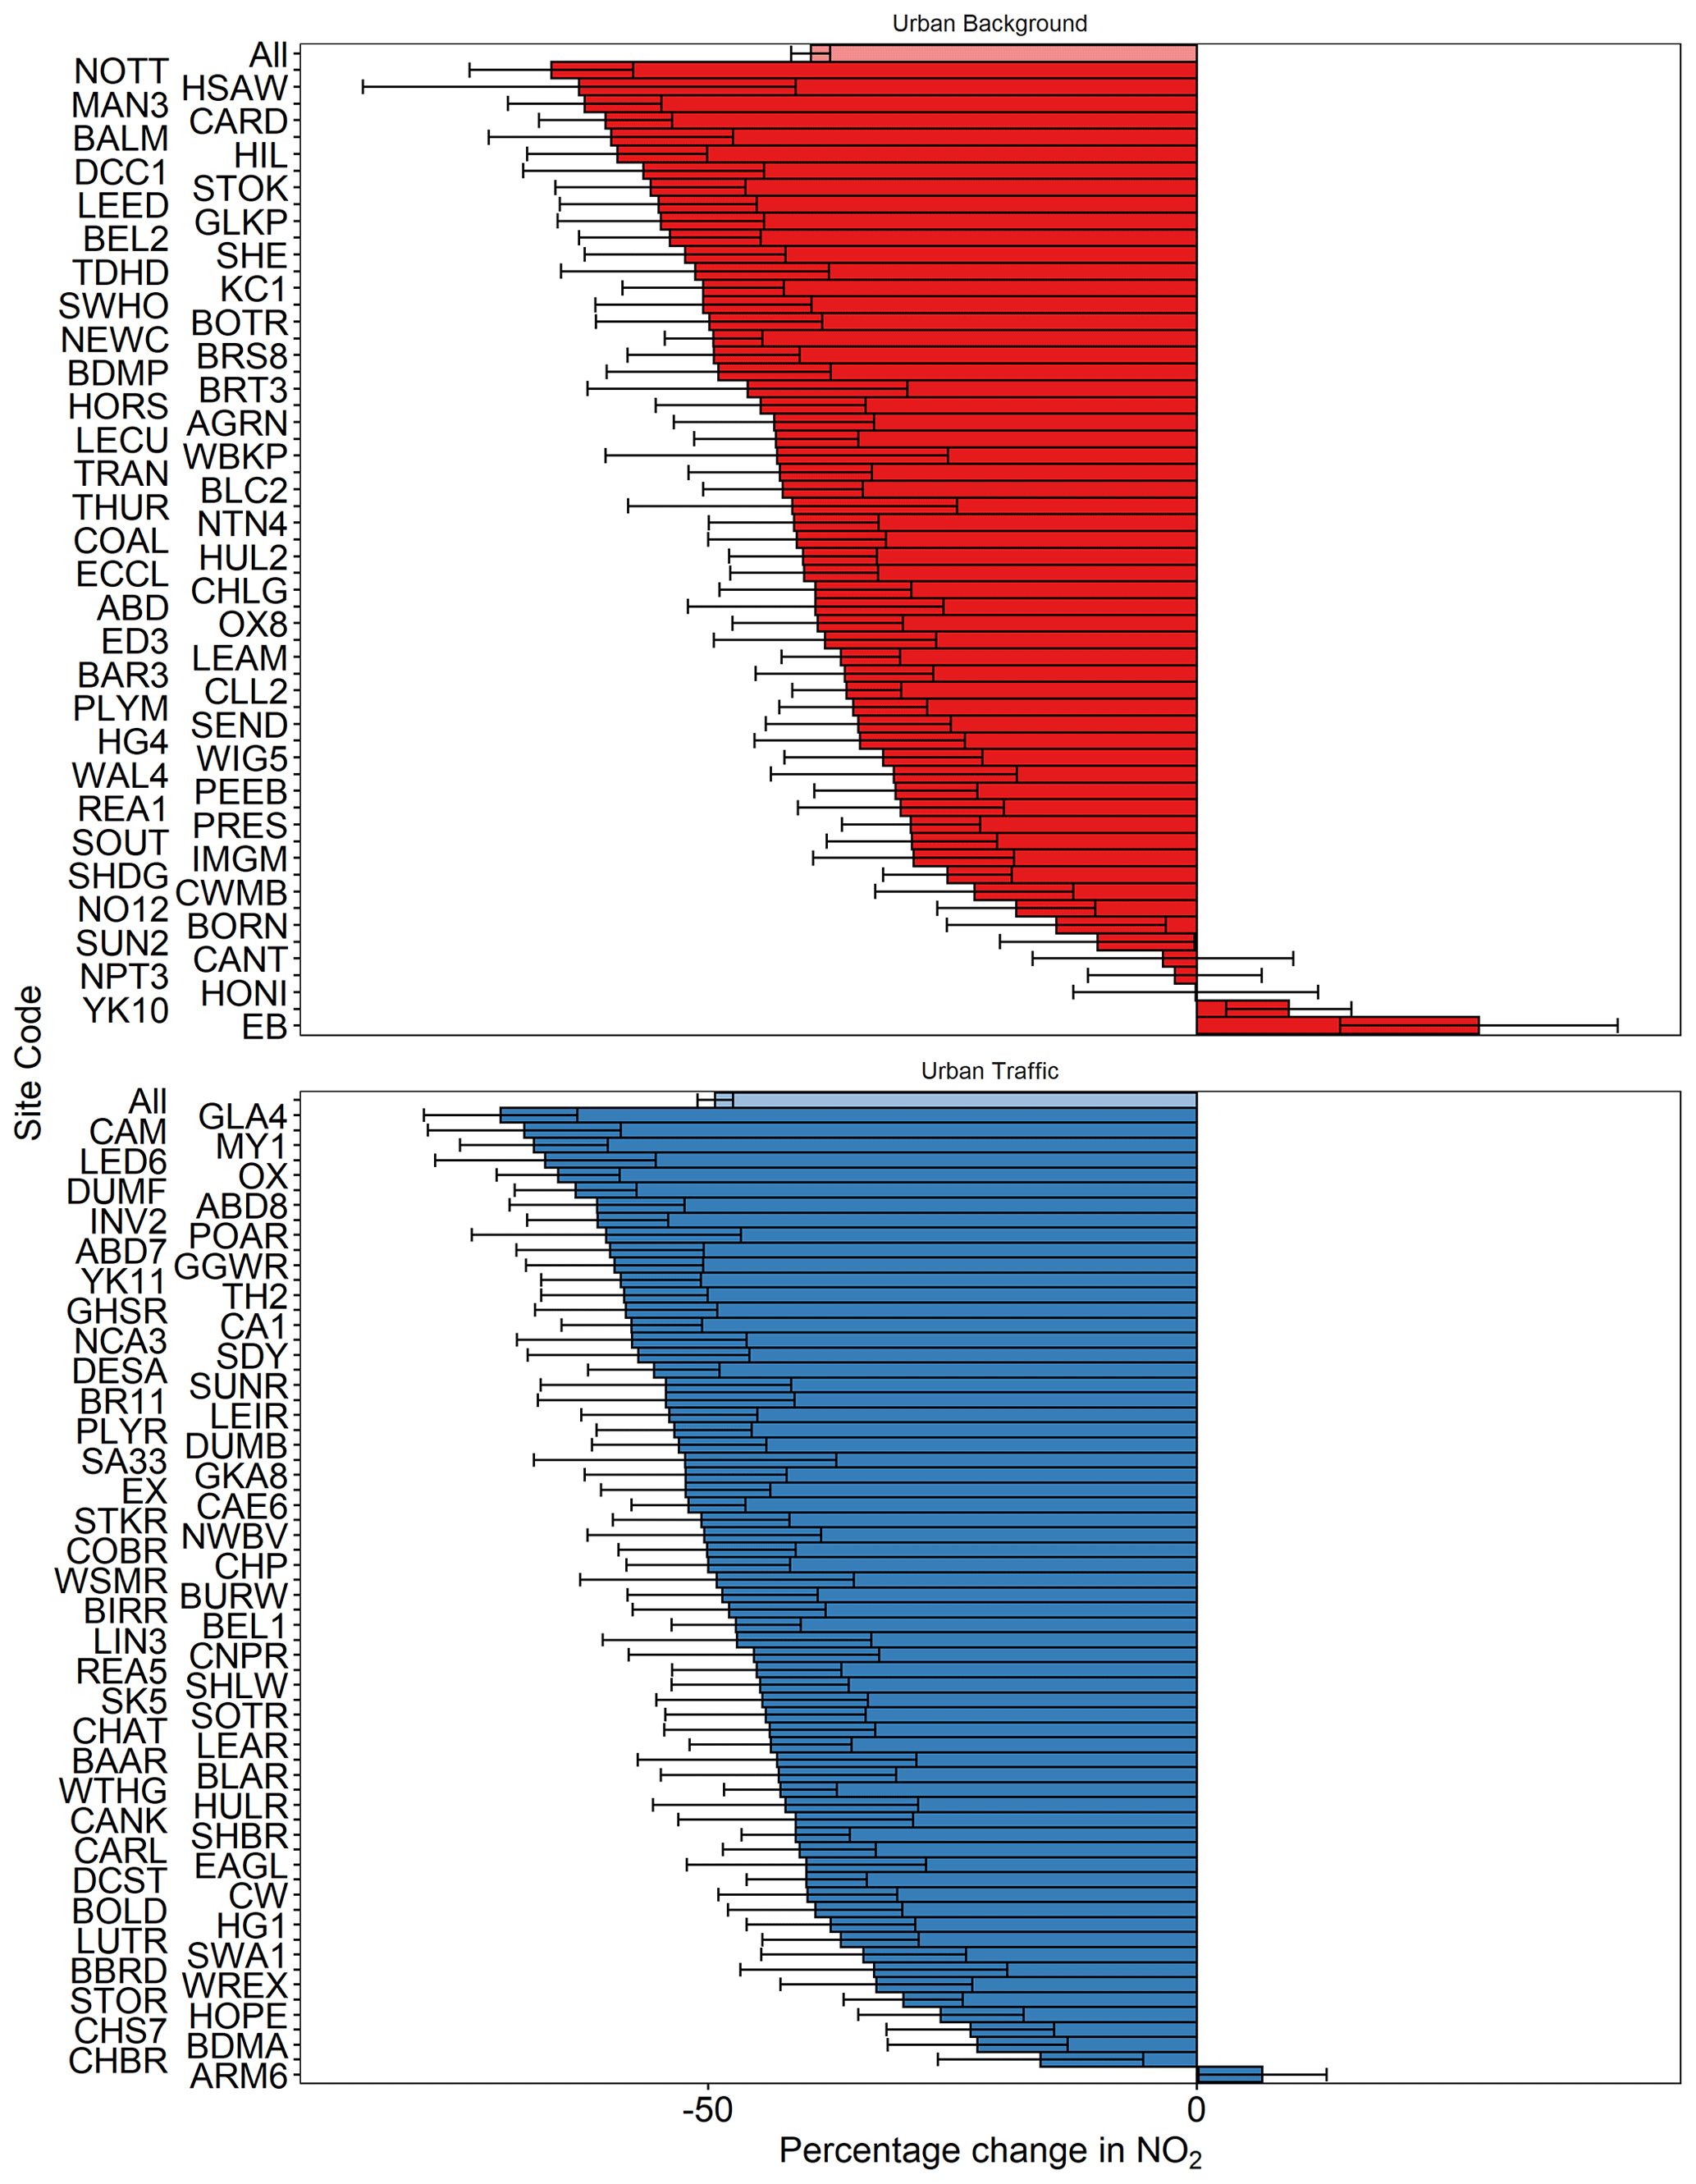
Figure 4Percentage change in NO2 at all urban background and urban traffic sites for the lockdown period (23 March–31 May) in 2020 compared to the same period averaged across the previous 5 years, after removing site-dependent trends. The lighter-coloured bar at the top shows the average of all sites. Site acronyms can be found in the Supplement.
We perform independent Mann–Whitney U tests on NO2 measurements during the lockdown period and the mean from the same period from the previous 5 years, on NO2 measurements during the lockdown period and measurements in 2020 immediately prior to the lockdown, and on NO2 measurements immediately prior to lockdown in 2020 with the same period for the previous 5 years. Using these tests, we find that 115 out of the 128 (89 %) urban sites show a statistically significant (p<0.01) difference in NO2 between the mean observations during lockdown and the mean of the same period during the past 5 years. We also find that 112 sites (from a possible 128 sites, 88 %) show a significant difference between NO2 measurements made in 2020 immediately prior to the lockdown and the mean of the same period from the previous 5 years, with urban background sites showing a µg m−3 change and urban traffic a 9.2±1.9 µg m−3 change. We attribute this difference to changes in meteorology during January and February 2020 (Fig. 3), in particular wind speed, which was on average 33 % higher than the average of the previous 5 years. Finally, we find that 94 sites (75 %) show a statistically significant difference between mean NO2 observations during lockdown and immediately prior to lockdown in 2020, implying there was a significant drop in NO2 across the UK as a direct result of the lockdown.
We also examine mean changes in the diurnal cycles of NO2 at urban traffic and urban background sites in London, Bristol, Cardiff, Newcastle, Glasgow and Belfast during the lockdown period compared to the same periods from the 2015–2019 mean. Based on the diurnal profile of NO2 levels, we find that (Fig. S4 in the Supplement) typical pre-lockdown diurnal cycles are driven by emission peaks in the morning and evening rush hours, with the evening peaks suppressed due to the higher mean boundary layer that grows during the day. In general, we find that the evening rush hour peaks at urban traffic sites across all cities during the lockdown period are suppressed compared to previous years, potentially due to changing working patterns. A notable exception is in Cardiff, where the morning rush hour peak is suppressed. In contrast, at urban background sites in Cardiff the diurnal cycle of NO2 is very similar in 2020 to the previous years, with rush hour peaks of similar magnitude in the morning and evening. A reason for these observed diurnal cycles could be domestic combustion, which typically makes up around 17 % of urban NOx emissions (compared to 47 % for road transport and 15 % for other transport, e.g. rail). We do not expect domestic combustion to have changed much during the lockdown; therefore its contribution to the total (and the diurnal cycle) will be greater.
3.3 Observed changes in daily mean O3 and Ox (O3+NO2)
Typically, close to sources of NOx, O3 is suppressed due to the reaction of high levels of NO with O3. Further away from the sources, O3 can reform through the oxidation of NO to NO2 with peroxy radicals (formed from the reaction of VOCs with OH) and subsequent photolysis of NO2 to form O3. To account for this photochemistry, we also report changes in the total oxidant, OX, the sum of O3 and NO2, which should be approximately conserved in the absence of any change in the source strength of NOx or VOCs or a change in OH.
Figure S5 in the Supplement shows measurements of O3 in 2020 from 46 urban traffic and background AURN measurement sites across the UK, along with the daily difference of NO2 values from 2020 with mean O3 values from detrended values from 2015 to 2019. It shows the opposite trend to NO2, with clear increases across the majority of the sites. Figure 5 shows the percentage difference for all urban traffic and urban background sites for the lockdown period in 2020 compared to the same period averaged across 2015–2019. After we remove site-specific trends, as described in Sect. 2.3, we find that O3 at urban background sites increased by a mean value of (7.2±2.6) µg m−3 during the lockdown period when compared with the previous 5 years, equating to a percentage increase of (11±3.2) %. Leamington Spa (West Midlands) and London Hillingdon observed the largest mean increases of (21.3±2.7) µg m−3 ((35±3.6) %) and (21.6±3.6) µg m−3 ((54±7.5) %), respectively. Three sites observed a decrease during the lockdown, with Aberdeen seeing a large decrease in O3 of (24.0±4.5) µg m−3 ((36±8.6) %) even though this site also experienced a substantial decrease in NO2. We do not have a definitive explanation for this result, but it is consistent with a NOx-limited photochemical environment in which a decrease in NO2 would reduce O3 production. This could be achieved by possible fugitive emissions from the onshore gas terminals near Aberdeen, although we have no VOC measurements to confirm this, so the hypothesis is entirely speculative. Only three urban traffic sites measured O3 during our study period. Of those London Marylebone Road saw the largest increase ((32.0±4.8) µg m−3 or (104±10.1) %), followed by Exeter Roadside (South West) with an increase (20.0±2.8) µg m−3 ((47±5.5) %) and Birmingham A4540 Roadside (West Midlands) with an increase of (13.3±2.5) µg m−3 ((25±3.9) %).
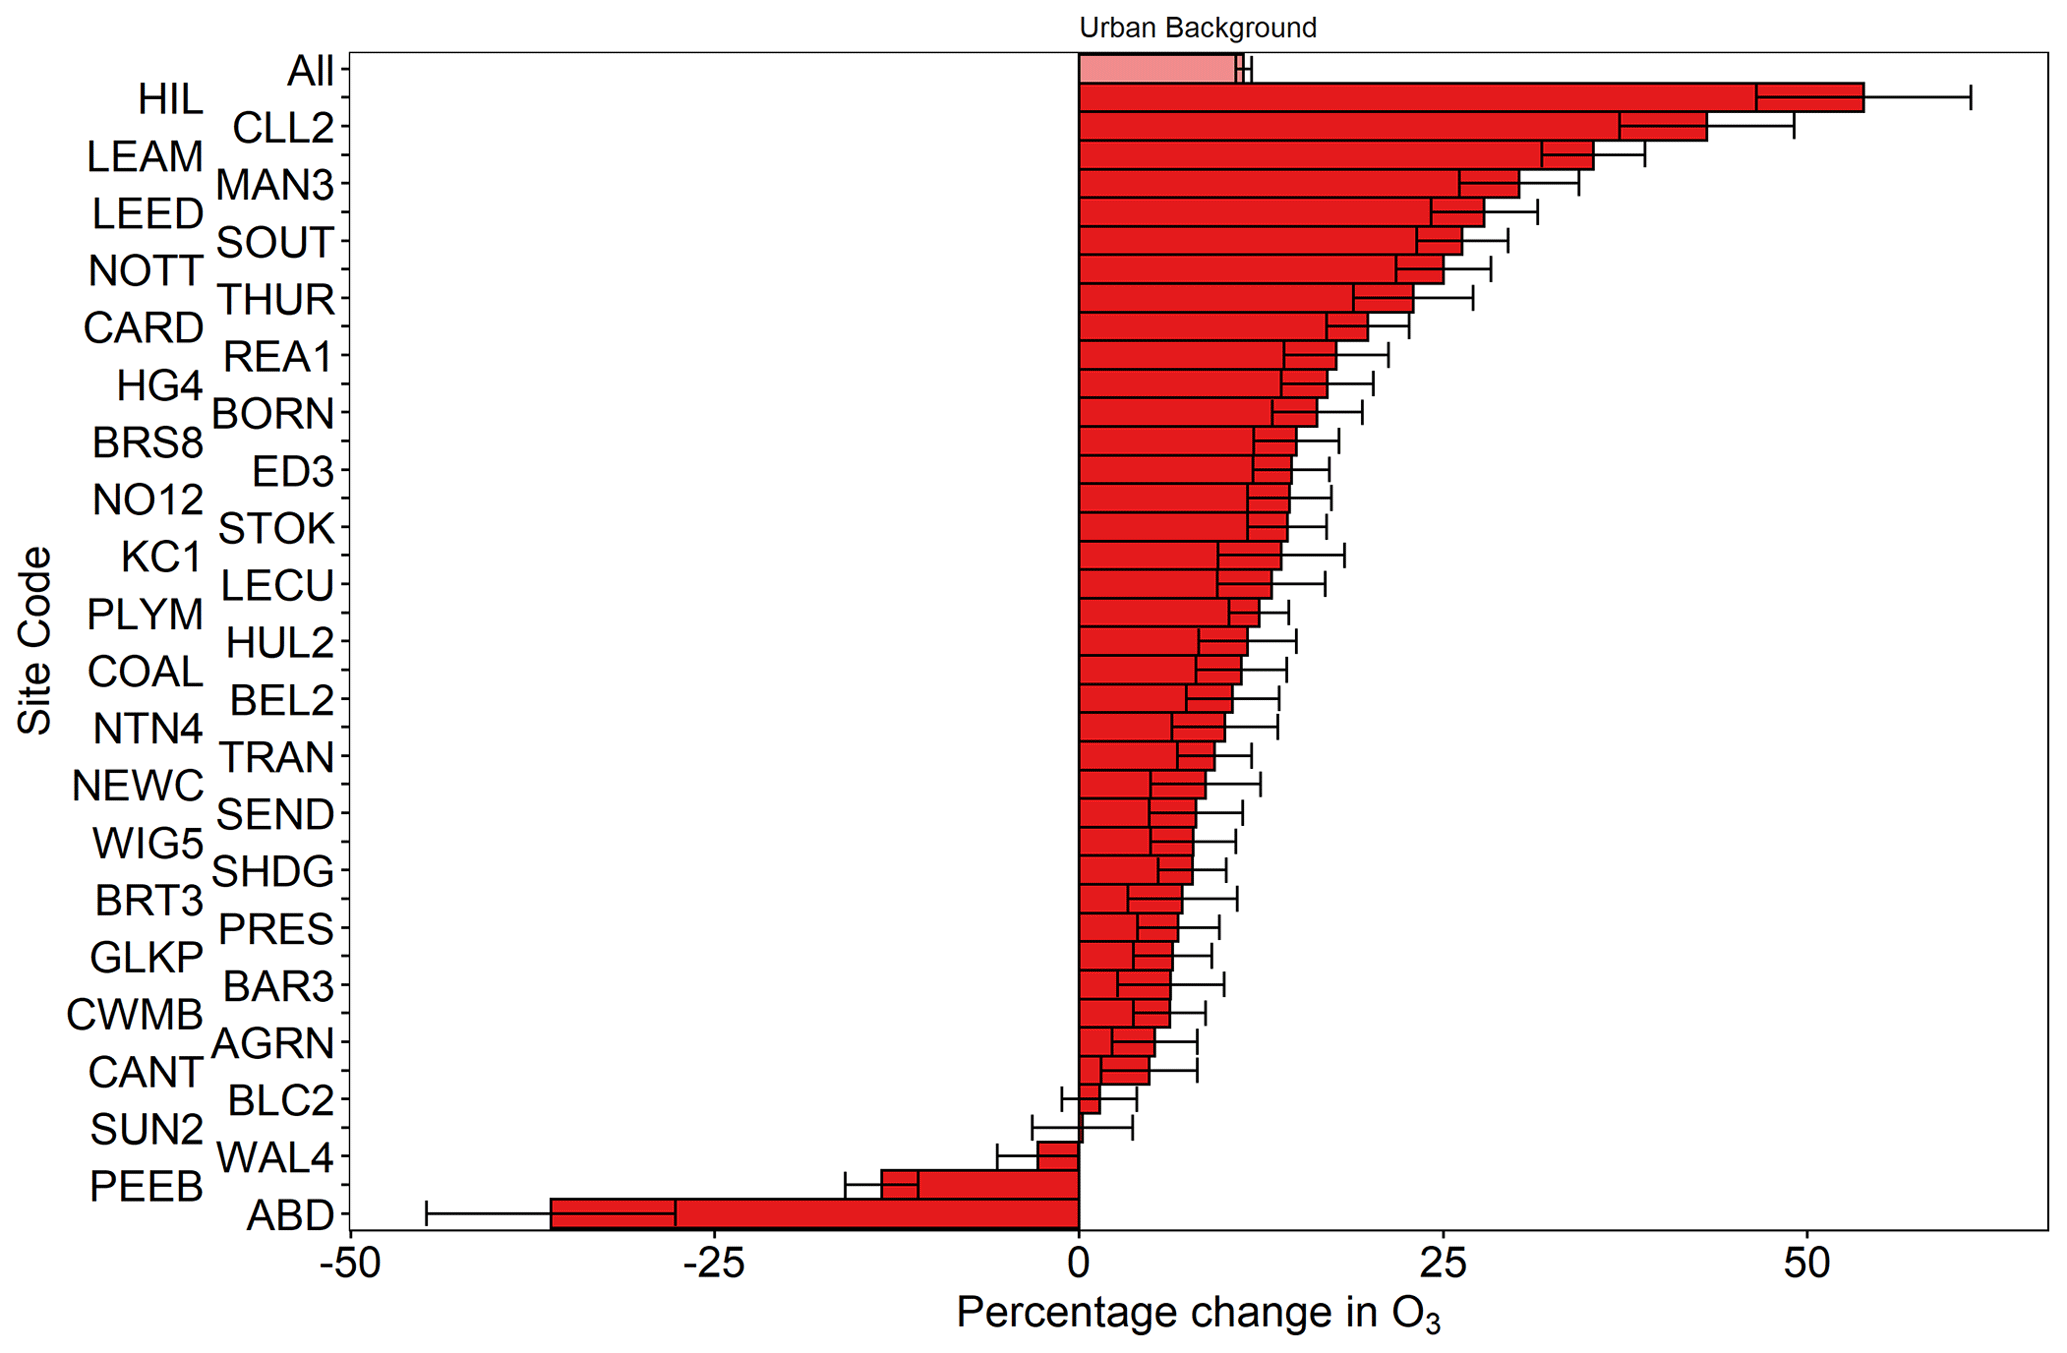
Figure 5Percentage change in O3 at all urban background sites for the lockdown period (23 March–31 May) in 2020 compared to the same period averaged across the previous 5 years, after removing site-dependent trends. The lighter-coloured bar at the top shows the average of all sites. Site acronyms can be found in the Supplement.
A similar statistical analysis has also been carried out for daytime (10:00–18:00 UTC) Ox (NO2+O3), and we find a mean increase of Ox at urban background sites of (3.5±0.3) µg m−3or (3.2±0.2) %. The two outliers are Leamington Spa (West Midlands), where we find the largest Ox increase of (32.5±1.2) µg m−3((18±3.4) %), and Aberdeen, where we find the largest OX decrease of () µg m−3 ((58±5.4) %). The three urban traffic sites measuring both O3 and NO2 show a large range in observed differences of (4.2±1.1) µg m−3 (() %) at Birmingham A4540 Roadside, () µg m−3 (() % ) at Exeter Roadside and () µg m−3 (() %) at London Marylebone Road.
Following our approach for NO2, we use independent Mann–Whitney U tests to determine the significance of changes in O3 in pre-lockdown and lockdown periods in 2020 and in the previous 5 years. We find that 36 out of 46 urban sites (78 %) show a statistically significant (p<.01) difference between the mean O3 observations during lockdown and the mean of the same period from 2015 to 2019. However, we also find that 41 of those sites (83 %) show a statistically significant difference between O3 measurements immediately prior to the lockdown compared to the mean of the same period from 2015 to 2019. Finally, we find that 40 sites (95 %) show a statistically significant difference between O3 observations during the lockdown period and values taken from the period immediately prior to the lockdown.
3.4 Relationship to emissions
During the lockdown period there was around a 75 % reduction in road traffic across the UK (using Google activity data as a proxy for traffic) (see Fig. 1). According to the National Atmospheric Emissions Inventory (NAEI), road transport is estimated to make up 53 % of NOx emissions in the 1 km×1 km grid square that both urban background and urban traffic sites are situated in (Defra, 2018b). Therefore, we might expect there to be a reduction in NO2 of around 40 % across all sites. Mean decreases in NOx are very similar to those for NO2 described above (47 % at urban traffic sites and 40 % at urban background sites – see Fig. S6 in the Supplement), which is in line with the 40 % reduction figure. However, it is clear that individual sites have very different behaviour, and the 75 % traffic reduction may not necessarily equate to 75 % reduction in emissions because different types of vehicle were affected differently, with the greatest reduction in passenger cars and less reduction in high emitters like HGVs. There are a wide range of contributions of NOx emissions from road traffic across the sites, and there does not appear to be much correlation between this and the reduction seen during lockdown (see Fig. S7 in the Supplement), suggesting that the change in traffic flow near to individual sites is variable and will be the largest contributing factor to NO2 reductions.
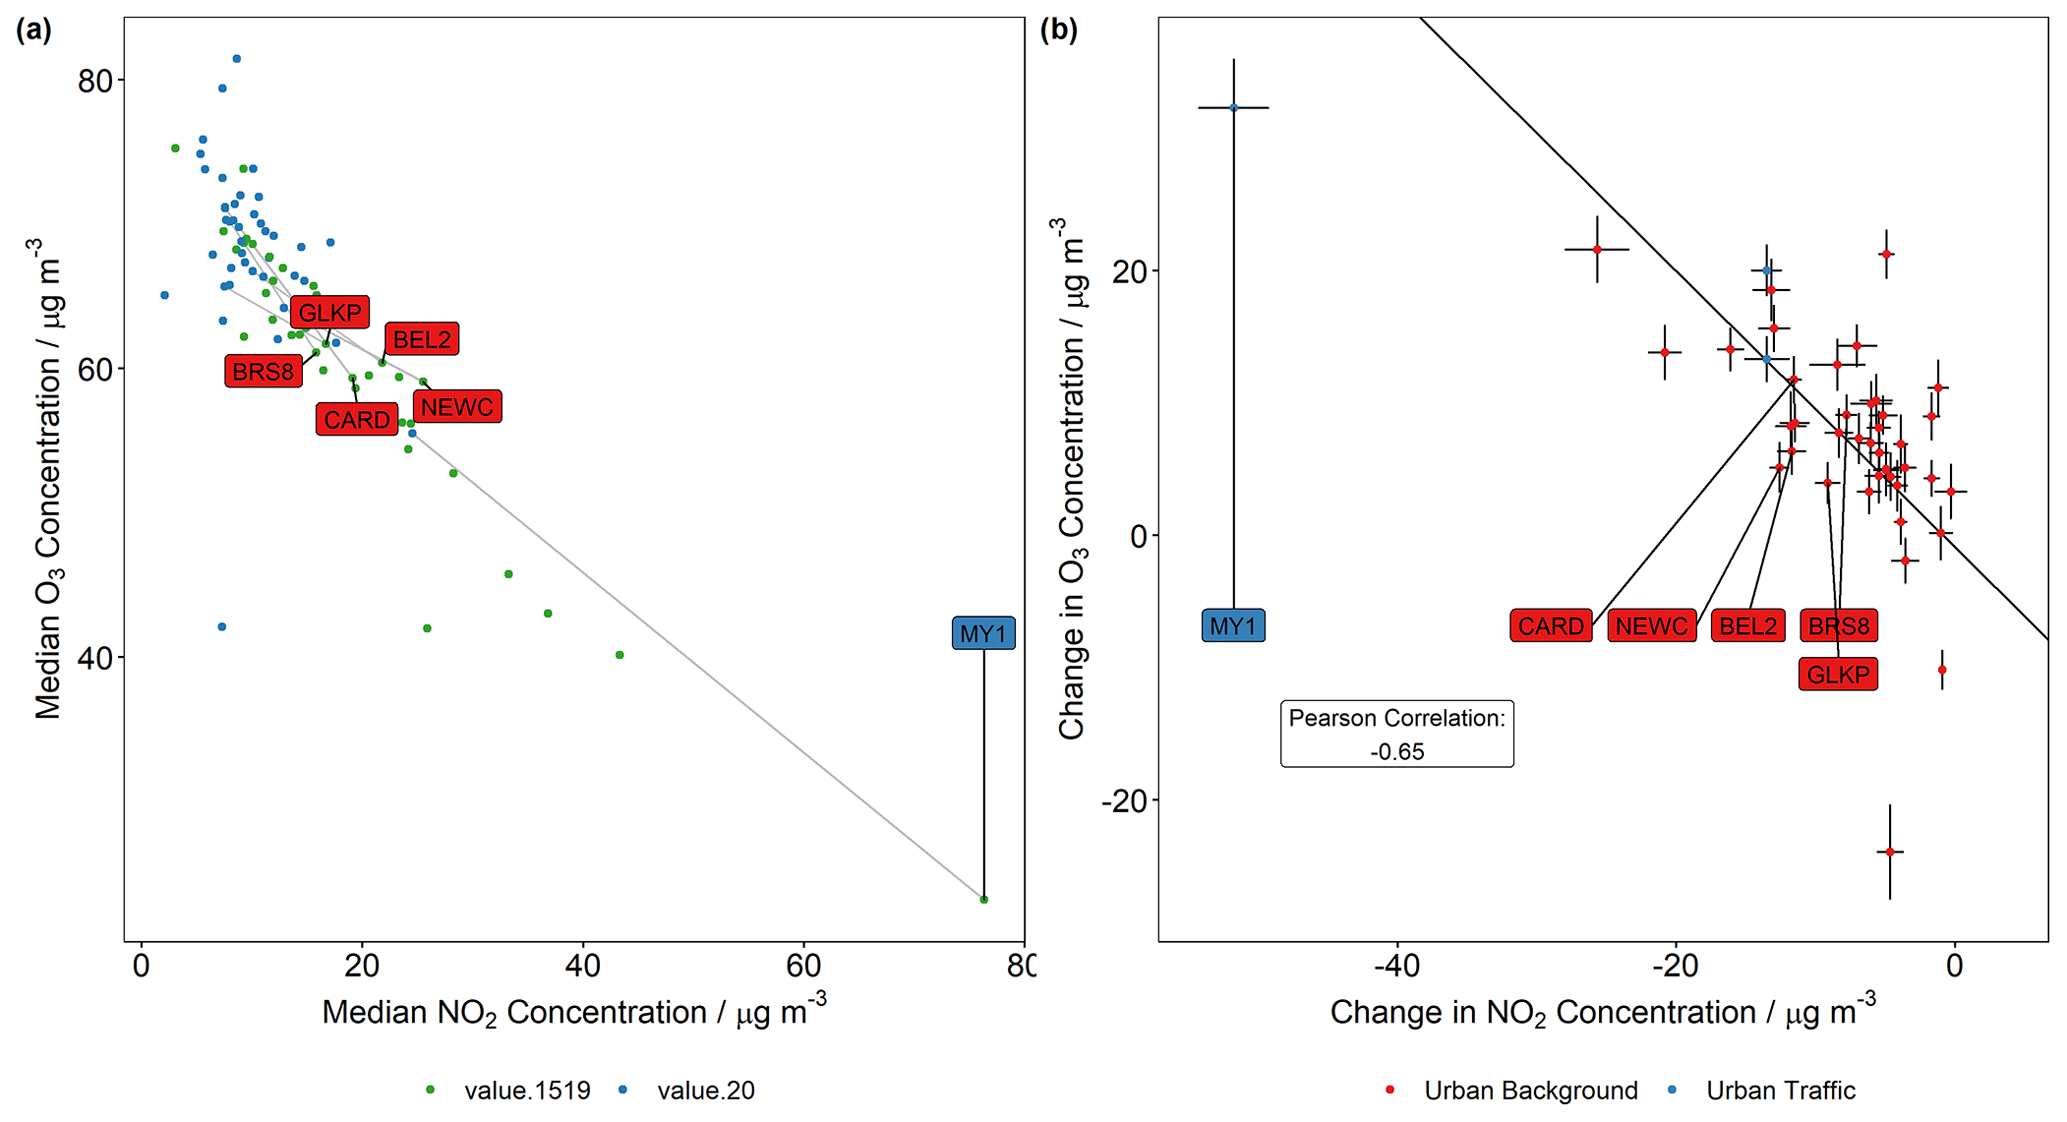
Figure 6Panel (a) shows median O3 concentration plotted against median daily NO2 concentration for each site. Data for 2020 and the average of 2015–2019 are coloured blue and green, respectively. Panel (b) shows change in O3 concentration between 2020 and the average of 2015–2019 plotted against the change in NO2 concentration for the same time period. Labelled are sites from six cities across the UK.
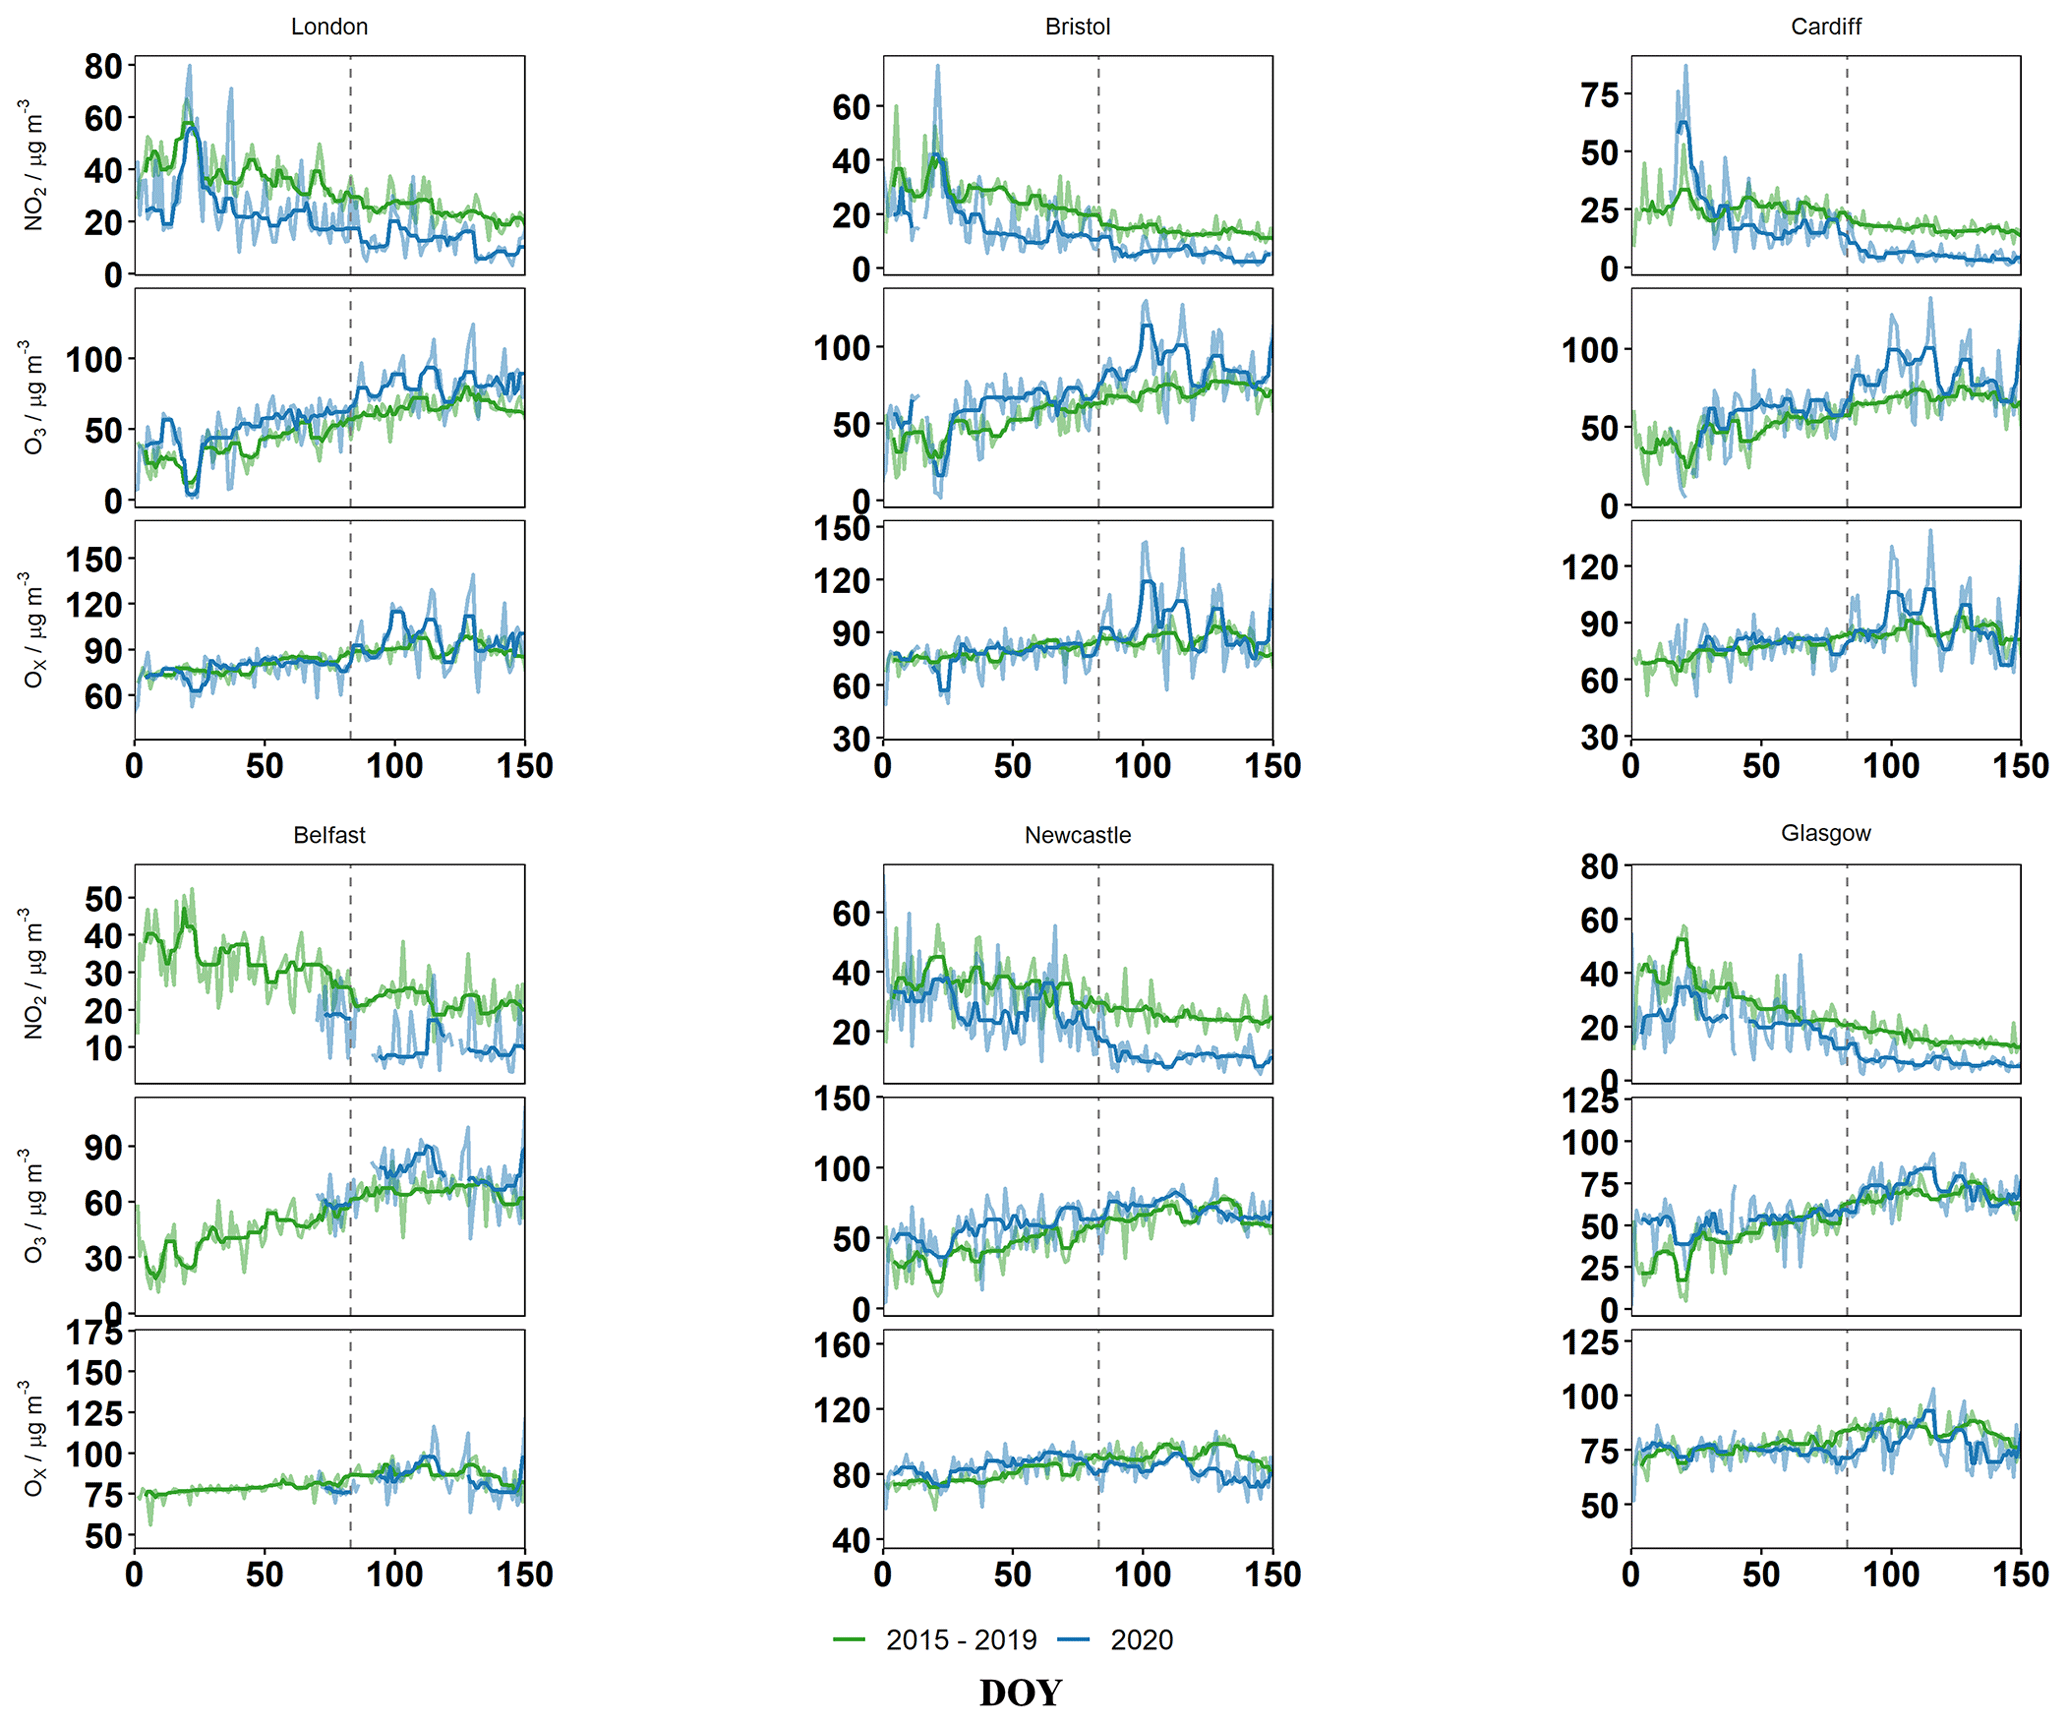
Figure 7Daily median time series of NO2, O3 and Ox (NO2+O3) for 2020 and the average of 2015–2019 at urban background sites in six cities representing a geographical and political spread across the UK. The thick line represents the 7 d rolling mean. The dashed grey line indicates the start of the lockdown period.
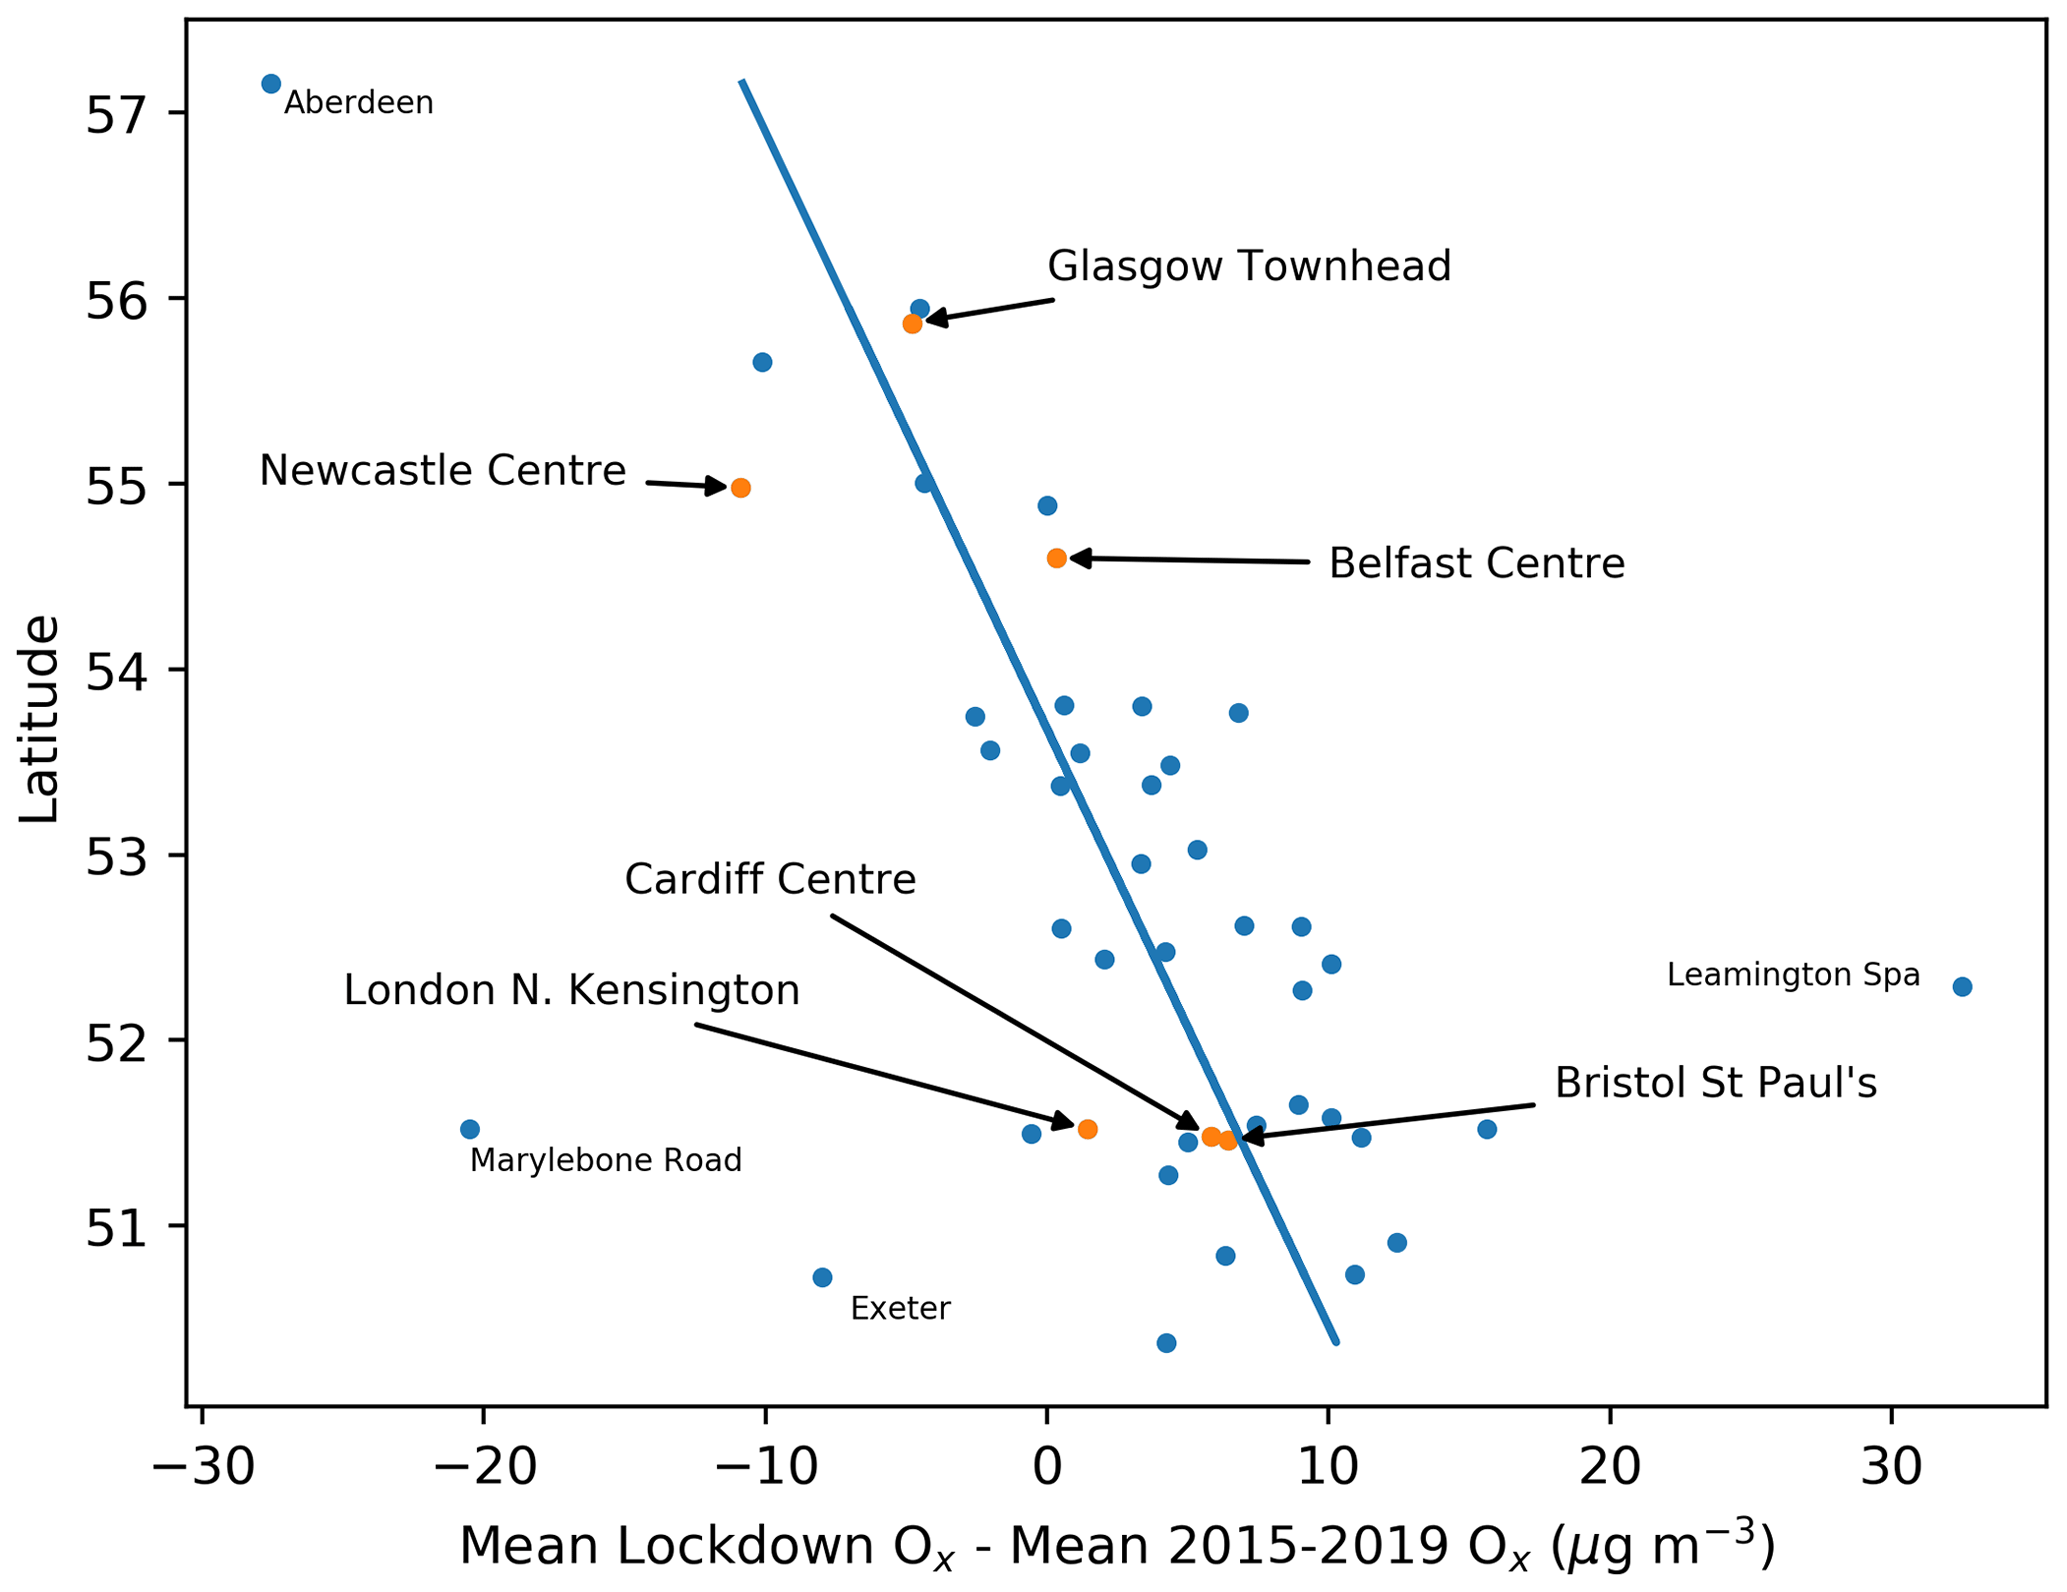
Figure 8Difference in mean Ox (µg m−3) and between the lockdown period and the detrended mean of the same period from 2015 to 2019 for urban background sites as a function of latitude. Sites examined in Fig. 6 are highlighted in orange.
4.1 Surface O3
The COVID-19 lockdown has resulted in a significant decrease in NO2 in cities across the UK, largely caused by the reduction of NOx emissions due to reduced traffic, and a concurrent increase in O3. NOx and O3 are closely linked through their photochemistry, and here we examine the reasons for the O3 increase (Lelieveld and Dentener, 2000). Figure 6 shows the relationship between NO2 and O3 during the lockdown period, across all the AURN sites we examined. There is a clear anti-correlation between median NO2 and median O3 for all data, with data from 2020 tending towards lower NO2 and high O3 (Fig. 6b). We also see that there is a correlation between the change in NO2 and the change in O3 between 2020 and the previous 5 years (Fig. 6a). Another key factor that plays a role in O3 concentrations is meteorology (Monks, 2000). High levels of actinic radiation cause the photochemistry involved in O3 formation to happen faster, and low wind speed conditions allow precursor species such as NOx and VOCs to build up and react to form O3. Therefore, observed variations of O3 in different UK cities will be influenced by a number of processes to varying degrees. Figure 7 examines NO2, O3 and total daytime (10:00–18:00 UTC) Ox during the lockdown period for urban background sites in six different cities across the UK. Any change in Ox can be thought of as a change in the abundance of oxidants, taking into account the repartitioning of NO2 and O3 caused by changes in NOx emissions. Whilst all cities have seen an increase in O3 in the urban background compared to previous years, only southern UK cities saw a significant increase in total Ox, with London, Bristol and Cardiff showing increases of 5.1 %±0.3 %, 5.8 %±0.6 % and 5.6 %±1.2 %, respectively. In contrast, Ox slightly decreased in Newcastle (), Glasgow () and Belfast (). To assess if OH is the cause of changes in Ox, we examine six measurements of total UV-A at eight sites in the UK and compare data from 2020 to the mean of the previous 5 years (Fig. S8 in the Supplement). We find levels of UV across the UK were higher in 2020 compared to previous years, with the largest increases in the southern UK. London, Chilton and Camborne saw increases of around 50 % compared to previous years, with Glasgow and Inverness showing smaller increases of around 30 %. Figure 8 shows a summary of the Ox change in 2020 compared to 2015–2019 from individual sites across the UK as a function of latitude. We find a positive trend in Ox towards lower latitudes, consistent with the higher excess UV levels further south. Therefore we conclude that in the cities in the southern UK some of the O3 increase is attributable not solely to reduced NOx but also to an increase in photochemistry related to the hot, sunny weather experienced in 2020.
Observed variations in O3 may also be affected by changes in precursor VOCs. Online measurements of VOCs are only available at a small number of sites, and here we consider measurements made at London Marylebone Road (an urban traffic site) and London Eltham (an urban background site). Figure S9 in the Supplement shows measurements of a range of different VOCs for each site during 2020 and mean values for 2017–2019 when data are available at both sites. The data show most VOCs decrease in concentration during the post-lockdown period in 2020 compared to previous years. This is particularly true at the urban traffic site and for species such as benzene and toluene, which have traffic emissions as a main source and saw a decrease of 23 %±5.1 % and 29 %±6.5 %, respectively, compared to previous years. At London Eltham the decreases were both around 12 %. VOCs have a wide range of lifetimes and emissions sources, and they can be transported large distances, meaning their concentrations at a given site are much more affected by meteorology and chemistry than NO2. Indeed, in London according to the NAEI (in 2018), road transport only contributes 11 % to sources of benzene, with other major sources being domestic or commercial combustion (69 %), other transport (10 %) and offshore oil and gas production (6 %) (Vaughan et al., 2016). Therefore it is not surprising that VOCs show less of a reduction during the lockdown than NO2. When examining O3, it can be useful to look at the total VOC loading and OH reactivity (k′). Figure S10 in the Supplement shows total VOC loading in parts per billion and total OH reactivity for each day in 2020, with colours showing the percentage change from the previous 3 years for that day. A full analysis of the behaviour of different VOCs during the lockdown period is beyond the scope of this work, and it is unlikely that the measurements made at the AURN sites cover all VOCs that contribute to OH reactivity (e.g. few oxygenated compounds or larger VOCs are measured). Our focused analysis shows that, whilst the picture is not straightforward, there is an apparent decrease in total VOCs at both sites compared to previous years. Mean values for total VOCs at London Marylebone Road were 17 % lower, and the corresponding k′ 15 % lower, than the 2017–2019 mean. At London Eltham total VOCs saw a decrease of 10 %, with a slight increase in the total k′, largely driven by an increase in biogenically emitted isoprene.
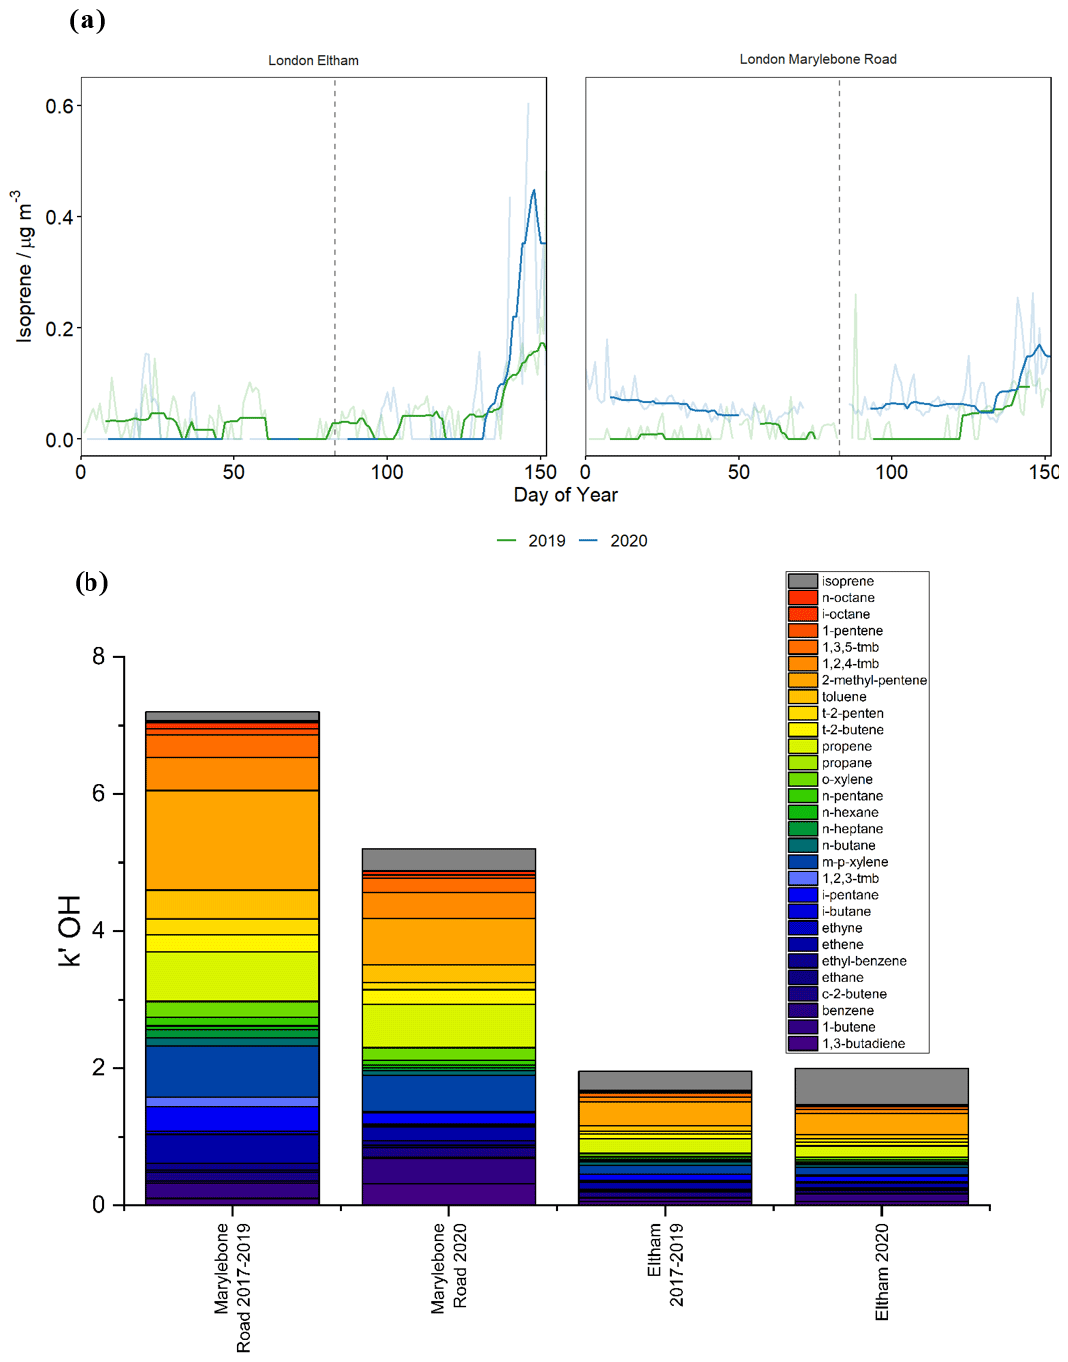
Figure 9(a) Levels of isoprene at the London Eltham (urban background) and London Marylebone Road (urban traffic) sites in 2020 and 2019. Panel (b) shows the contribution of isoprene (grey slice) and other VOCs to total OH reactivity (k′) for each site for 2019 vs. 2020.
Figure 9 shows daytime mean (10:00–18:00 UTC) isoprene data and its contribution to k′ at two sites in 2019 and 2020 (the only years where reliable isoprene data are available). Observed isoprene was a factor of 2 higher at both London Marylebone Road and London Eltham during April and May 2020 compared to those months in previous years. Isoprene represents only a small contributor to OH reactivity at London Marylebone Road, but at London Eltham in 2020 it represents around 25 % of total k′. Biogenic emissions of isoprene, originating from a variety of trees and shrubs, are driven in part by temperature, and so it is perhaps not surprising that isoprene levels at the London sites were higher in 2020 compared to 2019 due to the fact that temperature was approximately 2 ∘C higher in 2020 compared to 2019 for the lockdown period. Further detailed chemical modelling studies, beyond the scope of this study, are required to assess in detail the chemistry behind O3 formation and how this has been affected by the lockdown; however we observe that O3 has increased across the UK and see a clear anti-correlation with a decrease in NO2 across the sites. We also see an increase in total Ox at urban background sites in the south of England, likely due to increased radiation and biogenically emitted VOCs compared to previous years, things that are unlikely to be linked to the COVID-19 lockdown.
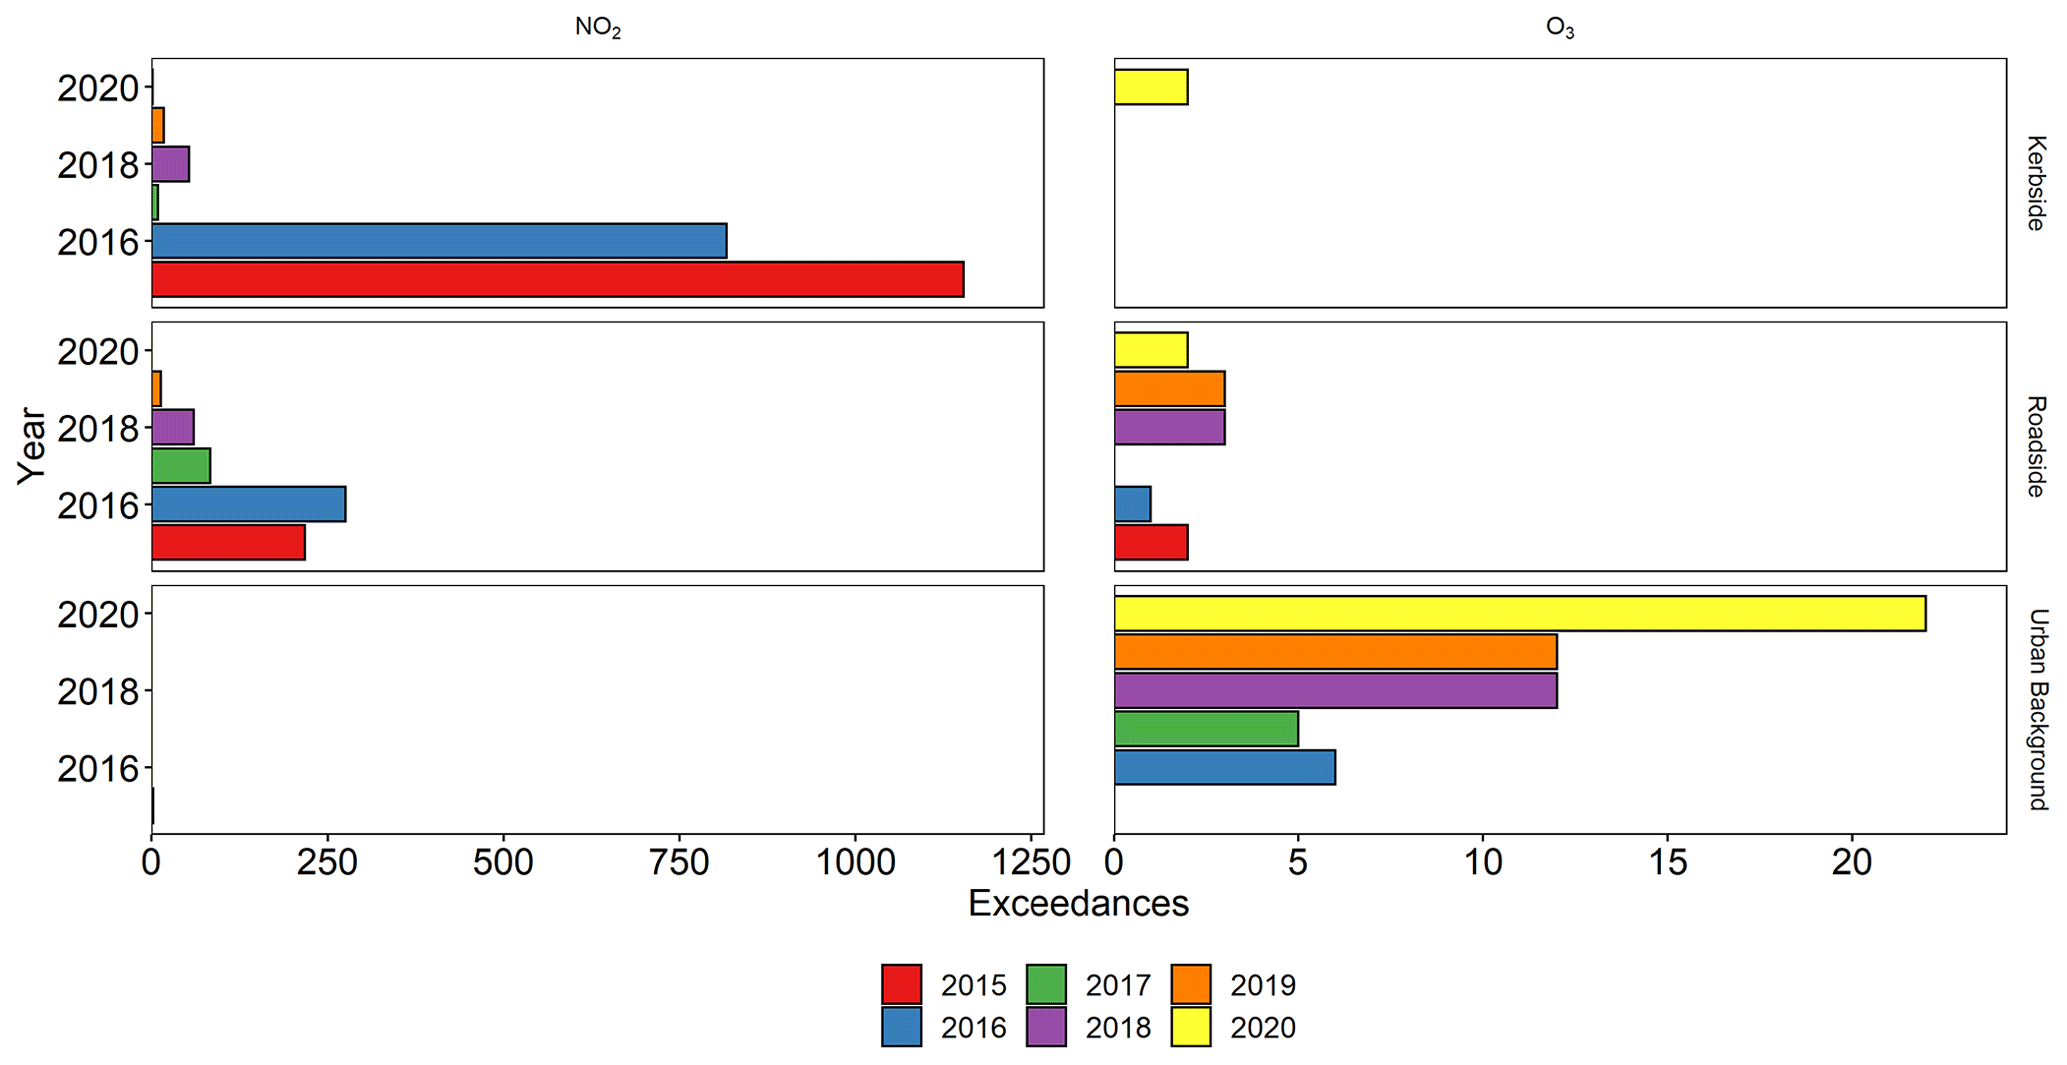
Figure 10Exceedances of the UK air quality objectives for NO2 and O3 across the London Air Quality Network.
4.2 Exceedances
To put the changes in air pollutants in context with human health effects, we have examined the number of exceedances of UK air quality objectives (Defra, 2019) and EU directive limits (EEA, 2016) for both NO2 and O3 in 2020 compared to previous years (see Table 2). For this analysis, we have used data from the London Air Quality Network (LAQN) consisting of 9 kerbside, 31 roadside and 14 background sites for NO2 and 1 kerbside, 7 roadside and 5 urban background sites for O3 in the Greater London area. London has historically had by far the largest number of air quality exceedances in the UK, so this analysis allows us to see the effect of the lockdown on the city with the most acute air pollution problems.
Exceedances were calculated on a per-site basis and then summed across all sites of a given type. For NO2 a simple 1 h mean was calculated, and each hour greater than 200 µg m−3 was counted as an exceedance. We calculated a rolling mean value for O3, using a window of 8 h and a step size of 1 h. If a given calendar day saw this rolling mean exceed 100 µg m−3, an exceedance was counted. Using this method, multiple exceedances (contiguous or separated in time) were only counted as one to avoid ambiguity in their definition, and therefore they can be thought of as “days when an O3 exceedance occurred”.
Table 2UK air quality objectives (Defra, 2019). Note that the UK has adopted the EU NO2 limit as a part of its air quality objectives but improves upon the O3 obligations, where O3 must not exceed 120 µg m−3 more than 25 times per year in a given 3 yr window (EEA, 2016).

Figure 10 shows the results for the lockdown period in 2020 and comparisons to the same time period in 2015–2019. We find a general downward trend of NO2 exceedances at roadside and kerbside sites in London, due to the continued reduction in NOx emissions from the vehicle fleet. At kerbside sites, the number of exceedances dropped quickly from 1154 in 2015 to only 17 in 2019. At roadside sites, exceedances dropped consistently from 275 in 2016 to 13 in 2019, with 9 of these 13 at the site London Wandsworth (Putney High Street). In 2020, up until the end of May, there was only one NO2 exceedance at sites across the LAQN network, again at Putney High Street. Because we have only analysed data up until the end of May 2020, we do not know the cumulative effect on exceedances for the year or how many exceedances will breach the 18 allowed by the air quality objective. Consequently, further analysis on data collected for the whole of 2020, including the period when lockdown restrictions were relaxed, is required to put 2020 into the context of the previous year. As an estimate of the effect the lockdown may have on total exceedances in 2020, we replaced the number of exceedances during the lockdown period in 2019 with the number from 2020. This resulted in a 47 % decrease (34 to 18) in total exceedances of NO2 at kerbside sites and a 12 % decrease (76 to 67) at roadside sites. As the effects of lockdown certainly extend beyond the end of the time period explored by this study, we would expect there to be fewer exceedances still during the remainder of 2020.
When considering any health benefits to this apparent improvement in air quality due to reduced NO2, we should also consider exceedances to O3 limits. The WHO has set a guideline value for ozone levels at 100 µg m−3 for an 8 h daily mean. Figure 10 also shows the total number of exceedances of this limit across kerbside, roadside and urban background sites in the LAQN network for March–May in all years from 2015–2020. Urban background sites have seen an increase from 6 in 2016 to 12 in 2019, followed by a drop to 18 in 2019 and an increase to 22 exceedances up until the end of May in 2020. Peak O3 in the UK often occurs in June and July, so it will be necessary to analyse data from the whole year, alongside NO2, in order to fully assess the importance, but it is clear that any perceived benefits of reduced NO2, both during the lockdown and in a lower-NOx future, should be considered alongside any concurrent increase in O3.
We examined NO2 and O3 measurements from urban traffic and urban background sites across the UK during the COVID-19 lockdown period in 2020 (23 March–31 May). We compared data to the detrended average from the previous 5 years in order to assess how these air pollutants have changed as a result of the reduced activity caused by the nationwide lockdown. NO2 decreased by an average of 48 and 40 % at urban traffic and urban background sites, respectively. This is in broad agreement with the expected reduction based on the reduction in traffic and the proportion of NOx in the UK that comes from vehicles. For O3, we find that values increased on average by 11 % at urban background sites and by 48 % at the three urban traffic sites. Total Ox increased by 3 % on average, suggesting the majority of the increase in O3 is due to photochemical repartitioning as NOx is decreased. However there are difference across the UK, with the southern cities London, Bristol and Cardiff showing a 5 % increase in Ox and Newcastle, Belfast and Glasgow showing only a slight decrease in Ox. Whilst anthropogenic VOCs are slightly decreased during the lockdown, we find some evidence that suggests that biogenic VOCs such as isoprene are higher due to warmer temperatures and higher UV levels across the southern UK in 2020 compared to previous years; we find no evidence to suggest that higher UV levels were due to cleaner skies related to air pollution changes due to the lockdown. Analysis of exceedances of air quality objectives in London for NO2 and O3 shows that, whilst there has been a decrease in exceedances of the NO2 objective, this has come alongside an increase in O3 exceedances. If we are to take the COVID-19 lockdown as an analogue of how air quality will respond to future reductions in emissions from vehicles (e.g. over the next 10–20 years), then observations show that there could be a corresponding increase in O3, which should be considered in any air quality abatement strategy. In China, NOx reductions have led to increases in O3 (Li et al., 2019a; Ma et al., 2016; Sun et al., 2016), and therefore air quality abatement strategies are being developed in order to offset this, largely by also controlling VOCs (Li et al., 2019b; Le et al., 2020). These changes are attributable to photochemical processes (e.g. the reduction in particles causing increased radiation and photochemistry); however our study shows that a large reduction in NOx directly causes an increase in O3 due to a reduction in titration with NO. In addition, a warming climate may lead to increased emissions of biogenic VOCs, further adding to the O3 burden. Therefore it will be vital to control anthropogenic VOCs in the UK to avoid any health gains made by the reduction of NO2 being offset by O3 increases.
The AURN data are all available for public download from the UK-AIR website (https://uk-air.defra.gov.uk, last access: 15 December 2020). The LAQN data are available from the LondonAir website (https://londonair.org.uk, last access: 15 December 2020). UV-A data are available on request from Public Health England.
The supplement related to this article is available online at: https://doi.org/10.5194/acp-20-15743-2020-supplement.
WSD and DPF carried out the data analysis and designed the figures. JDL and PIP wrote the manuscript with input from WSD and DPF. SEW designed and created figures and reviewed the manuscript.
The authors declare that they have no conflict of interest.
The authors acknowledge Defra and https://uk-air.defra.gov.uk (last access: 15 December 2020) for provision of the NO2, O3, VOC and meteorological data; Public Health England for the UV-A data; and Ricardo PLC for temperature data. NO2 and O3 data for the exceedance analysis are courtesy of the London Air Quality Network (operated by Imperial College London).
This research has been supported by the UK Natural Environment Research Council (grant nos. NE/T001917/1 and NE/R011532/1).
This paper was edited by Astrid Kiendler-Scharr and reviewed by two anonymous referees.
An, Z., Jin, Y., Li, J., Li, W., and Wu, W.: Impact of Particulate Air Pollution on Cardiovascular Health, Current Allergy and Asthma Reports, 18, 15, https://doi.org/10.1007/s11882-018-0768-8, 2018.
Bao, R., and Zhang, A.: Does lockdown reduce air pollution? Evidence from 44 cities in northern China, Sci. Total Environ., 731, 139052, https://doi.org/10.1016/j.scitotenv.2020.139052, 2020.
Bekbulat, B., Apte, J., Millet, D., Robinson, A., Wells, K., and Marshall, J.: PM2.5 and Ozone Air Pollution Levels Have Not Dropped Consistently Across the US Following Societal Covid Response, 2020.
Cooper, O. R., Gao, R.-S., Tarasick, D., Leblanc, T., and Sweeney, C.: Long-term ozone trends at rural ozone monitoring sites across the United States, 1990–2010. J. Geophys. Res., 117, D22307, https://doi.org/10.1029/2012JD018261, 2012.
Cooper, O. R., Parrish, D. D, Ziemke, J., Balashov, N. V., Cupeiro, M., Galbally, I. E., Gilge, Horowitz, S., Jensen, L. H., Lamarque, J.-F., Naik, V., Oltmans, S., Schwab, J., Shindell, D. T., Thompson, A. M., Thouret, V., Wang, Y., and Zbinden, R. M.: Global distribution and trends of tropospheric ozone: An observation-based review, Elem. Sci. Anth., 2, 29, https://doi.org/10.12952/journal.elementa.000029, 2014.
Dantas, G., Siciliano, B., França, B. B., da Silva, C. M., and Arbilla, G.: The impact of COVID-19 partial lockdown on the air quality of the city of Rio de Janeiro, Brazil, Sci. Total Environ., 729, 139085, https://doi.org/10.1016/j.scitotenv.2020.139085, 2020.
Defra: Emissions of air pollutants in the UK, 1970 to 2018 – Nitrogen oxides (NOx): https://www.gov.uk/government/statistics/emissions-of-air-pollutants (last access: 15 December 2020), 2018a.
Defra: NAEI data: http://naei.defra.gov.uk/ (last access: 15 December 2020), 2018b.
Defra: UK and EU Air Quality Limits: https://uk-air.defra.gov.uk/air-pollution/uk-eu-limits (last access: 15 December 2020), 2019.
European Environment Agency: Air quality standards under the Air Quality Directive, and WHO air quality guidelines: https://www.eea.europa.eu/themes/data-and-maps/figures/air-quality-standards-under-the (last access: 15 December 2020), 2016.
Finch, D. and Palmer, P.: Increasing ambient surface ozone levels over the UK accompanied by fewer extreme events, Atmos. Env., 117627, https://doi.org/10.1016/j.atmosenv.2020.117627, 2020.
Fleming, Z. L., Doherty, R. M., von Schneidemesser, E., Malley, C., Cooper, O. R., Pinto, J. P., Colette, A., Xu, X., Simpson, D., Schultz, M. G., Lefohn, A. S., Hamad, S., Moolla, R., Solberg, S., and Feng, Z.: Tropospheric Ozone Assessment Report: Present-day ozone distribution and trends relevant to human health, Elementa-Sci. Anthrop., 6, 12, https://doi.org/10.1525/elementa.273, 2018.
Grange, S. K., and Carslaw, D. C.: Using meteorological normalisation to detect interventions in air quality time series, Sci. Total Environ., 653, 578–588, https://doi.org/10.1016/j.scitotenv.2018.10.344, 2019.
Huang, X., Ding, A., Gao, J., Zheng, B., Zhou, D., Qi, X., Tang, R., Wang, J., Ren, C., Nie, W., Chi, X., Xu, Z., Chen, L., Li, Y., Che, F., Pang, N., Wang, H., Tong, D., Qin, W., Cheng, W., Liu, W., Fu, Q., Liu, B., Chai, F., Davis, S. J., Zhang, Q., and He, K.: Enhanced secondary pollution offset reduction of primary emissions during COVID-19 lockdown in China, Natl. Sci. Rev., nwaa137, https://doi.org/10.1093/nsr/nwaa137, 2020.
Kerimray, A., Baimatova, N., Ibragimova, O. P., Bukenov, B., Kenessov, B., Plotitsyn, P., and Karaca, F.: Assessing air quality changes in large cities during COVID-19 lockdowns: The impacts of traffic-free urban conditions in Almaty, Kazakhstan, Sci. Total Environ., 730, 139179, https://doi.org/10.1016/j.scitotenv.2020.139179, 2020.
Koukouli, M.-E., Skoulidou, I., Karavias, A., Parcharidis, I., Balis, D., Manders, A., Segers, A., Eskes, H., and van Geffen, J.: Sudden changes in nitrogen dioxide emissions over Greece due to lockdown after the outbreak of COVID-19, Atmos. Chem. Phys. Discuss., https://doi.org/10.5194/acp-2020-600, in review, 2020.
Kurt, O. K., Zhang, J., and Pinkerton, K. E.: Pulmonary health effects of air pollution, Curr. Opin. Pulm. Med., 22, 138–143, https://doi.org/10.1097/MCP.0000000000000248, 2016.
Le, T., Wang, Y., Liu, L., Yang, J., Yung, Y. L., Li, G., and Seinfeld, J. H.: Unexpected air pollution with marked emission reductions during the COVID-19 outbreak in China, Science, 369, 702–706, https://doi.org/10.1126/science.abb7431, 2020.
Lefohn, A., Malley, C., Smith, L., Wells, B., Hazucha, M., Simon, H., Naik, V., Mills, G., Schultz, M., Paoletti, E., De Marco, A., Xu, X., Zhang, L., Tao, W., Neufeld, H., Musselman, R., Tarasick, D., Brauer, M., and Gerosa, G.: Tropospheric ozone assessment report: Global ozone metrics for climate change, human health, and crop/ecosystem research, Elementa-Sci. Anthrop., 6, 28, https://doi.org/10.1525/elementa.279, 2018.
Lelieveld, J., and Dentener, F. J.: What controls tropospheric ozone?, J. Geophys. Res.-Atmos., 105, 3531–3551, https://doi.org/10.1029/1999jd901011, 2000.
Li, K., Jacob, D. J., Liao, H., Shen, L., Zhang, Q., and Bates, K. H.: Anthropogenic drivers of 2013-2017 trends in summer surface ozone in China, P. Natl. Acad. Sci. USA, 116, 422–427, https://doi.org/10.1073/pnas.1812168116, 2019a.
Li, K., Jacob, D. J., Liao, H., Zhu, J., Shah, V., Shen, L., Bates, K. H., Zhang, Q., and Zhai, S.: A two-pollutant strategy for improving ozone and particulate air quality in China, Nat. Geosci., 12, 906–910, 2019b.
Liu, F., Page, A., Strode, S. A., Yoshida, Y., Choi, S., Zheng, B., Lamsal, L. N., Li, C., Krotkov, N. A., Eskes, H., van der A, R., Veefkind, P., Levelt, P. F., Hauser, O. P., and Joiner, J.: Abrupt decline in tropospheric nitrogen dioxide over China after the outbreak of COVID-19, Sci. Adv., 6, eabc2992, https://doi.org/10.1126/sciadv.abc2992, 2020.
Ma, Z., Xu, J., Quan, W., Zhang, Z., Lin, W., and Xu, X.: Significant increase of surface ozone at a rural site, north of eastern China, Atmos. Chem. Phys., 16, 3969–3977, https://doi.org/10.5194/acp-16-3969-2016, 2016.
Mahato, S., Pal, S., and Ghosh, K. G.: Effect of lockdown amid COVID-19 pandemic on air quality of the megacity Delhi, India, Sci. Total Environ., 730, 139086, https://doi.org/10.1016/j.scitotenv.2020.139086, 2020.
Mannucci, P. M., Harari, S., Martinelli, I., and Franchini, M.: Effects on health of air pollution: a narrative review, Intern. Emerg. Med., 10, 657-662, https://doi.org/10.1007/s11739-015-1276-7, 2015.
Monks, P. S.: A review of the observations and origins of the spring ozone maximum, Atmos. Env., 34, 3545–3561, https://doi.org/10.1016/S1352-2310(00)00129-1, 2000.
Monks, P. S., Archibald, A. T., Colette, A., Cooper, O., Coyle, M., Derwent, R., Fowler, D., Granier, C., Law, K. S., Mills, G. E., Stevenson, D. S., Tarasova, O., Thouret, V., von Schneidemesser, E., Sommariva, R., Wild, O., and Williams, M. L.: Tropospheric ozone and its precursors from the urban to the global scale from air quality to short-lived climate forcer, Atmos. Chem. Phys., 15, 8889–8973, https://doi.org/10.5194/acp-15-8889-2015, 2015.
Nakada, L. Y. K. and Urban, R. C.: COVID-19 pandemic: Impacts on the air quality during the partial lockdown in São Paulo state, Brazil, Sci. Total Environ., 730, 139087, https://doi.org/10.1016/j.scitotenv.2020.139087, 2020.
Otmani, A., Benchrif, A., Tahri, M., Bounakhla, M., Chakir, E. M., El Bouch, M., and Krombi, M. H.: Impact of Covid-19 lockdown on PM10, SO2 and NO2 concentrations in Salé City (Morocco), Sci. Total Environ., 735, 139541, https://doi.org/10.1016/j.scitotenv.2020.139541, 2020.
Paoletti, E., De Marco, A., Beddows, D. C. S., Harrison, R. M., and Manning, W. J.: Ozone levels in European and USA cities are increasing more than at rural sites, while peak values are decreasing, Environ. Pollut., 192, 295–299, https://doi.org/10.1016/j.envpol.2014.04.040, 2014.
Parrish, D. D. and Fehsenfeld, F. C.: Methods for gas-phase measurements of ozone, ozone precursors and aerosol precursors, Atmos. Environ. 34, 1921–1957, https://doi.org/10.1016/S1352-2310(99)00454-9, 2000.
Pathakoti, M., Muppalla, A., Hazra, S., Dangeti, M., Shekhar, R., Jella, S., Mullapudi, S. S., Andugulapati, P., and Vijayasundaram, U.: An assessment of the impact of a nation-wide lockdown on air pollution – a remote sensing perspective over India, Atmos. Chem. Phys. Discuss., https://doi.org/10.5194/acp-2020-621, 2020.
Petetin, H., Bowdalo, D., Soret, A., Guevara, M., Jorba, O., Serradell, K., and Pérez García-Pando, C.: Meteorology-normalized impact of the COVID-19 lockdown upon NO2 pollution in Spain, Atmos. Chem. Phys., 20, 11119–11141, https://doi.org/10.5194/acp-20-11119-2020, 2020.
Public Health England: Improving outdoor air quality and health: review of interventions: https://www.gov.uk/government/publications/improving-outdoor-air-quality-and-health-review-of-interventions (last access: 15 December 2020), 2019.
Royal College of Physicians: Every breath we take: the lifelong impact of air pollution, available at: https://www.rcplondon.ac.uk/projects/outputs/every-breath-we-take-lifelong-impact-air-pollution (last access: 15 December 2020), 2016.
Shi, X. and Brasseur, G. P.: The Response in Air Quality to the Reduction of Chinese Economic Activities During the COVID-19 Outbreak, Geophys. Res. Lett., 47, e2020GL088070, https://doi.org/10.1029/2020gl088070, 2020.
Sicard, P., De Marco, A., Troussier, F., Renou, C., Vas, N., and Paoletti, E.: Decrease in surface ozone concentrations at Mediterranean remote sites and increase in the cities, Atmos. Env., 79, 705-715, https://doi.org/10.1016/j.atmosenv.2013.07.042, 2013.
Sicard, P., De Marco, A., Agathokleous, E., Feng, Z., Xu, X., Paoletti, E., Rodriguez, J. J. D., and Calatayud, V.: Amplified ozone pollution in cities during the COVID-19 lockdown, Sci. Total Environ., 735, 139542, https://doi.org/10.1016/j.scitotenv.2020.139542, 2020.
Steinbacher, M., Zellweger, C., Schwarzenbach, B., Bugmann, S., Buchmann, B., Ordóñez, C., Prevot, A. S. H., and Hueglin, C.: Nitrogen oxide measurements at rural sites in Switzerland: Bias of conventional measurement techniques, J. Geophys. Res., 112, https://doi.org/10.1029/2006jd007971, 2007.
Strode, S. A., Rodriguez, J. M., Logan, J. A., Cooper, O. R., Witte, J. C., Lamsal, L. N., Damon, M., Van Aartsen, B., Steenrod, S. D., and Strahan, S. E.: Trends and variability in surface ozone over the United States, J. Geophys. Res.-Atmos., 120, 9020–9042, 2015.
Sun, L., Xue, L., Wang, T., Gao, J., Ding, A., Cooper, O. R., Lin, M., Xu, P., Wang, Z., Wang, X., Wen, L., Zhu, Y., Chen, T., Yang, L., Wang, Y., Chen, J., and Wang, W.: Significant increase of summertime ozone at Mount Tai in Central Eastern China, Atmos. Chem. Phys., 16, 10637–10650, https://doi.org/10.5194/acp-16-10637-2016, 2016.
UK Government: Clean Air Strategy 2019, available at: https://www.gov.uk/government/publications/clean-air-strategy-2019 (last access: 15 December 2020), 2019.
Vaughan, A. R., Lee, J. D., Misztal, P. K., Metzger, S., Shaw, M. D., Lewis, A. C., Purvis, R. M., Carslaw, D. C., Goldstein, A. H., Hewitt, C. N., Davison, B., Beevers, S. D., and Karl, T. G.: Spatially resolved flux measurements of NOx from London suggest significantly higher emissions than predicted by inventories, Faraday Discuss., 189, 455–472, https://doi.org/10.1039/C5FD00170F, 2016.
Villena, G., Bejan, I., Kurtenbach, R., Wiesen, P., and Kleffmann, J.: Interferences of commercial NO2 instruments in the urban atmosphere and in a smog chamber, Atmos. Meas. Tech., 5, 149–159, https://doi.org/10.5194/amt-5-149-2012, 2012.
World Health Organization: Novel coronavirus (2019-nCoV), available at: http://www.euro.who.int/en/health-topics/health-emergencies/novel-coronavirus-2019-ncov_old (last access: 15 December 2020), 2020.