the Creative Commons Attribution 4.0 License.
the Creative Commons Attribution 4.0 License.
 | 17 Dec 2020
Role of ammonia in European air quality with changing land and ship emissions between 1990 and 2030
Giancarlo Ciarelli
Urs Baltensperger
André S. H. Prévôt
The focus of this modeling study is on the role of ammonia in European air quality in the past as well as in the future. Ammonia emissions have not decreased as much as the other secondary inorganic aerosol (SIA) precursors – nitrogen oxides (NOx) and sulfur dioxide (SO2) – since the 1990s and are still posing problems for air quality and the environment. In this study, air quality simulations were performed with a regional chemical transport model at decadal intervals between 1990 and 2030 to understand the changes in the chemical species associated with SIA under varying land and ship emissions. We analyzed the changes in air concentrations of ammonia, nitric acid, ammonium, particulate nitrate and sulfate as well as changes in the dry and wet deposition of ammonia and ammonium. The results show that the approximately 40 % decrease in SIA concentrations between 1990 and 2010 was mainly due to reductions in NOx and SO2 emissions. The ammonia concentrations on the other hand decreased only near the high-emission areas such as the Netherlands and northern Italy by about 30 %, while there was a slight increase in other parts of Europe. Larger changes in concentrations occurred mostly during the first period (1990–2000). The model results indicate a transition period after 2000 for the composition of secondary inorganic aerosols due to a larger decrease in sulfate concentrations than nitrate. Changes between 2010 and 2030 – assuming the current legislation (CLE) scenario – are predicted to be smaller than those achieved earlier for all species analyzed in this study. The scenario simulations suggest that if ship emissions will be regulated more strictly in the future, SIA formation will decrease especially around the Benelux area, North Sea, Baltic Sea, English Channel and the Mediterranean region, leaving more ammonia in the gas phase, which would lead to an increase in dry deposition. In the north of the domain, the decrease in SIA would be mainly due to reduced formation of particulate nitrate, while the change around the Mediterranean would be caused mainly by decreased sulfate aerosol concentrations. One should also keep in mind that potentially higher temperatures in the future might increase the evaporation of ammonium nitrate to form its gaseous components NH3 and HNO3. Sensitivity tests with reduced NOx and NH3 emissions indicate a shift in the sensitivity of aerosol formation from NH3 towards NOx emissions between 1990 and 2030 in most of Europe except the eastern part of the model domain.
- Article
(17898 KB) - Full-text XML
-
Supplement
(1800 KB) - BibTeX
- EndNote


Ammonia (NH3) plays an important role in atmospheric chemistry. As an alkaline gas, it affects the acidity of clouds and precipitation, and it is one of the main sources of reactive nitrogen (Simpson et al., 2011; Fowler et al., 2015). Studies show that ammonia emissions not only are toxic for plants and lead to a loss of biodiversity (Jones et al., 2014; Roth et al., 2015), but they also contribute significantly to the formation of particulate matter (Fowler et al., 2009, 2015). Ammonia reacts very rapidly with sulfuric acid (H2SO4), which is formed from the oxidation of SO2 by OH in the gas phase and by O3, hydrogen peroxide (H2O2) and other oxidants in the aqueous phase, to form ammonium sulfate ((NH4)2SO4) or ammonium bisulfate (NH4HSO4) (Seinfeld and Pandis, 2012). If there is enough ammonia available after the neutralization of H2SO4, it reacts with nitric acid (HNO3) to produce ammonium nitrate. These secondary inorganic aerosols (SIAs) contribute most to the fine particulate matter (PM2.5) in Europe (Ciarelli et al., 2016, 2019; Aksoyoglu et al., 2017). Although ammonia and ammonium are nutrients for plants and are used as fertilizers, they are the largest contributors to nitrogen pollution of ecosystems through eutrophication and acidification (Jones et al., 2014). The main sources of ammonia emissions are agricultural, including volatilization of animal waste and synthetic fertilizers, but a small fraction (<10 %) also comes from other sources such as industry, household and traffic (UNECE, 2019).
European anthropogenic emissions have decreased substantially since the 1990s as a result of large emission reductions following the Gothenburg Protocol (GP) (UNECE, 1999), revised Gothenburg Protocol (revised on 4 May 2012; https://www.unece.org/env/lrtap/multi_h1.html, last access: 10 December 2020) and EU Directives (https://www.eea.europa.eu/data-and-maps/indicators/main-anthropogenic-air-pollutant-emissions/assessment-6, last access: 10 December 2020). Several studies investigated the effects of reduced land emissions on the air quality in various parts of Europe (Guerreiro et al., 2014, Aksoyoglu et al., 2014; Wichink Kruit et al., 2017; van Zanten et al., 2017; Theobald et al., 2019; Ciarelli et al., 2019). The largest decrease was in SO2 emissions (by more than 90 % in 2017 compared to 1990), followed by NOx and NMVOC (non-methane volatile organic compound) emission reductions (more than 50 %), while ammonia emissions decreased less – approximately 23 % on average in the EU-28 countries. Ammonia emissions have been increasing again since 2014, however, posing problems for Europe (NEC, 2019). This is mainly due to the difficulty in implementing additional emission reductions in the agriculture sector, especially in the housing of animals and the storage and application of animal manures. The large decrease in sulfur emissions over the last few decades has changed the aerosol composition: particulate nitrogen was dominated by sulfates in the 1990s, while today nitrate predominates (Colette et al., 2016).
Recent studies showed that the decline in nitrogen deposition in the past was mainly due to the decreased deposition of oxidized nitrogen components as a consequence of large emission reductions in Europe. Deposition of reduced nitrogen (ammonia, NH3; particulate ammonium, PNH4) was predicted to increase further in the future (Aksoyoglu et al., 2014; Simpson et al., 2014; Colette et al., 2016).
While land emissions have been significantly reduced over the last few decades, emissions from the least regulated sector, maritime transport, have been increasing (Jonson et al., 2015). The International Maritime Organization (IMO) controls ship emissions globally through the Marine Pollution Convention (MARPOL) Annex VI, which limits the main air pollutants contained in ship exhaust gas and prohibits deliberate emissions of ozone-depleting substances (ODSs) (http://www.imo.org/OurWork/Environment/PollutionPrevention/Pages/Default.aspx, last access: 10 December 2020). The revised MARPOL Annex VI with the aim of significantly strengthening the emission limits entered into force on 1 July 2010. In addition, emission control areas (ECAs) were introduced to reduce emissions further in designated sea areas. For example, in Europe, the North Sea and Baltic Sea areas were defined as SECAs (sulfur emission control areas), where the limits were restricted to 1.0 % in July 2010 and further reduced to 0.1 % in 1 January 2015. New global sulfur emission regulations, which reduce limits from 3.5 % to 0.5 %, came into force on 1 January 2020 (https://www.imo.org/en/MediaCentre/HotTopics/Pages/Sulphur-2020.aspx, last access: 10 December 2020). On the other hand, there has been an increase in the emissions of other species, especially NOx, in all European sea areas (Colette et al., 2016). The nitrogen emission control area (NECA) around the North Sea, Baltic Sea and the English Channel will enter into force in 2021 but only for newly built ships (EEA, 2013). NOx emissions from all existing and new ships outside the NECA areas will continue to be under-regulated.
Based on recent studies, ship emissions are considered to be a major source of air pollution especially around the coastal areas of Europe (Jonson et al., 2019; Pay et al., 2019; Toscana and Murena, 2019). According to the European Environment Agency, emissions of nitrogen oxides from international maritime transport in European waters are projected to increase and could be equal to land-based sources by 2020 (EEA, 2013). Viana et al. (2014) reviewed a series of studies performed before 2012 dealing with the impact of shipping emissions on air quality in the European coastal areas and reported that contributions of ship emissions to PM2.5 and to NO2 varied between 1 %–14 % and 7 %–24 %, respectively, depending on location and time. In a recent model intercomparison study, Karl et al. (2019) evaluated the contribution of ship emissions to air quality in the Baltic Sea region in 2012 to investigate the differences among model predictions and showed that variations in ship-related PM2:5 were mainly due to differences in the models' schemes for inorganic aerosol formation. Another study reported a contribution of 45 % to PM2.5 concentrations by ship emissions in the Mediterranean and 10 %–15 % around the Baltic Sea and concluded that the evolution of NOx emissions from ships and land-based NH3 emissions would play a significant role in future European air quality (Aksoyoglu et al., 2016).
In a previous study, we investigated the changes in ozone and PM2.5 during the period of 1990–2030 (Jiang et al., 2020). In the present paper, we focus on ammonia as an important precursor of secondary inorganic aerosols to investigate (1) how it affected the air quality in Europe between 1990 and 2010, when land emissions were reduced significantly; (2) how it will affect the air quality between 2010 and 2030, when there will also be more strict reductions in ship emissions in addition to further reductions in land emissions; and (3) how the sensitivity of aerosol formation to NOx and NH3 emissions would vary between 1990 and 2030.
2.1 Air quality model
We performed simulations over the European domain using the regional air quality model CAMx (Comprehensive Air quality Model with eXtensions) version 6.50 (Ramboll, 2018) for 1990, 2000, 2010, 2020 and 2030. The model domain covers an area from 17∘ W to 39.8∘ E and from 32 to 70∘ N with a horizontal resolution of 0.25 and 0.4∘. We selected from the meteorological layers 14 terrain-following vertical layers ranging from 50 to 8000 m a.s.l. to be used in CAMx. The gas-phase chemical mechanism was Carbon Bond 6 revision 2 (CB6r2) (Hildebrandt Ruiz and Yarwood, 2013). The static two-mode coarse/fine (CF) option for the particle size was selected to calculate the aerosol concentrations in the PM2.5 fraction. Organic aerosols were calculated using the secondary organic aerosol chemistry/partitioning (SOAP2.1) module (Ramboll, 2018), and the ISORROPIA thermodynamic model was used for the partitioning of inorganic aerosol components (Nenes et al., 1998).
2.2 Deposition scheme
Dry and wet depositions of species were calculated using the Zhang scheme (Zhang et al., 2003; Ramboll, 2018). Although bi-directional air–surface exchange of NH3 has been observed over a variety of land surfaces, most of the chemical transport models (CTMs) treat this exchange only as dry deposition, which might lead to an underestimation of daytime NH3 concentration because of overestimated dry deposition (Zhang et al., 2010). Wichink Kruit et al. (2012) reported that the inclusion of a stomatal compensation point led to increased modeled ammonia concentrations in agricultural areas in the Netherlands. Since stomatal compensation points are affected by the canopy type, temperature, growth stage, meteorological conditions, nitrogen status and cutting practices, it is very difficult to implement it in CTMs due to imprecise knowledge about the sub-grid variations in concentration, vegetation type and fertilizer applications (Huijsmans et al., 2018; Skjoth et al., 2011). Although the introduction of such a compensation point improves the model performance, the modeling of ammonia remains challenging due to temporal and spatial variations in emissions and grid resolution (Sutton et al., 2013). The bi-directional ammonia algorithm of Zhang et al. (2010) has been added recently as an option to the original Zhang deposition algorithm in the latest version of CAMx (v7.00). Default land-use-dependent emission potentials control ammonia compensation points along the surface–air transport circuit. When the atmospheric ammonia concentration exceeds the compensation point, the net flux is from air to surface; in the opposite case, the net flux is from surface to air. Although the Zhang dry-deposition algorithm in the previous version of the CAMx (v6.50) model used in this study did not include compensation points, it did treat bi-directionality indirectly by using a deposition parameter that strongly influenced ammonia deposition via surface resistance. The surface resistance is an area of great uncertainty in deposition models. Surface wetness plays an important role for both cuticular and ground resistance. This effect is included in some deposition velocity algorithms. The parameterizations for wet cuticles and ground are quite variable between models. Some models such as CMAQ (Community Multiscale Air Quality Modeling System) use the Henry's law constant to account for the solubility of chemical species; the EMEP (European Monitoring and Evaluation Programme) model (Simpson et al., 2012) considers the chemical content of dew by treating co-deposition of species such as SO2 and NH3, while Zhang et al. (2003) include the consideration of friction velocity. Wichink Kruit et al. (2017) showed the effects of co-deposition, chemistry and meteorology during 1993–2014 in the Netherlands. Relatively wet conditions led to lower ammonia concentrations, while warm and dry conditions led to higher levels.
Wet deposition is the predominant removal process for fine particles. Particles act as cloud condensation nuclei, and the resulting cloud droplets grow into precipitation. The CAMx wet-deposition model employs a scavenging approach using the three-dimensional cloud/rain input from the meteorological model. Banzhaf et al. (2012) reported that droplet pH variation within atmospheric ranges affects modeled air concentrations and wet-deposition fluxes significantly. The pH-dependent parameterizations are incorporated, and cloud water pH is calculated by the aqueous-phase chemistry algorithms in the CAMx model.
2.3 Input data
Some of the input data used in this study were obtained from the EURODELTA-Trends (EDT) project (Colette et al., 2017). The meteorological data in the EDT project were produced by the Weather Research and Forecast Model (WRF version 3.3.1) in the EuroCordex domain with a resolution of 0.44∘. We re-gridded the data to our model domain and prepared the meteorological input parameters for the CAMx model by means of the preprocessor WRFCAMx version 4.4 (http://www.camx.com/download/support-software.aspx, last access: 10 December 2020). Another input dataset provided by the EDT project was the initial and boundary conditions, which were based on monthly climatological data (Colette et al., 2017). The ozone column densities were prepared using the Total Ozone Mapping Spectrometer (TOMS) data from NASA, and photolysis rates were calculated using the Tropospheric Ultraviolet and Visible (TUV) radiation model version 4.8.
Anthropogenic emissions for the three base cases (1990, 2000 and 2010) were obtained from the EDT database and adjusted to the CB6r2 chemical mechanism in CAMx as described in Jiang et al. (2020). The biogenic emissions (isoprene, monoterpenes, sesquiterpenes and soil NO) were generated using the Model of Emissions of Gases and Aerosol from Nature (MEGAN) version 2.1 (Guenther et al., 2012). The anthropogenic emissions were distributed to various vertical layers depending on their sources using the vertical profile given by Bieser et al. (2011). The ship emissions over the sea were injected into the second model layer. All the biogenic emissions were released into the surface layer.
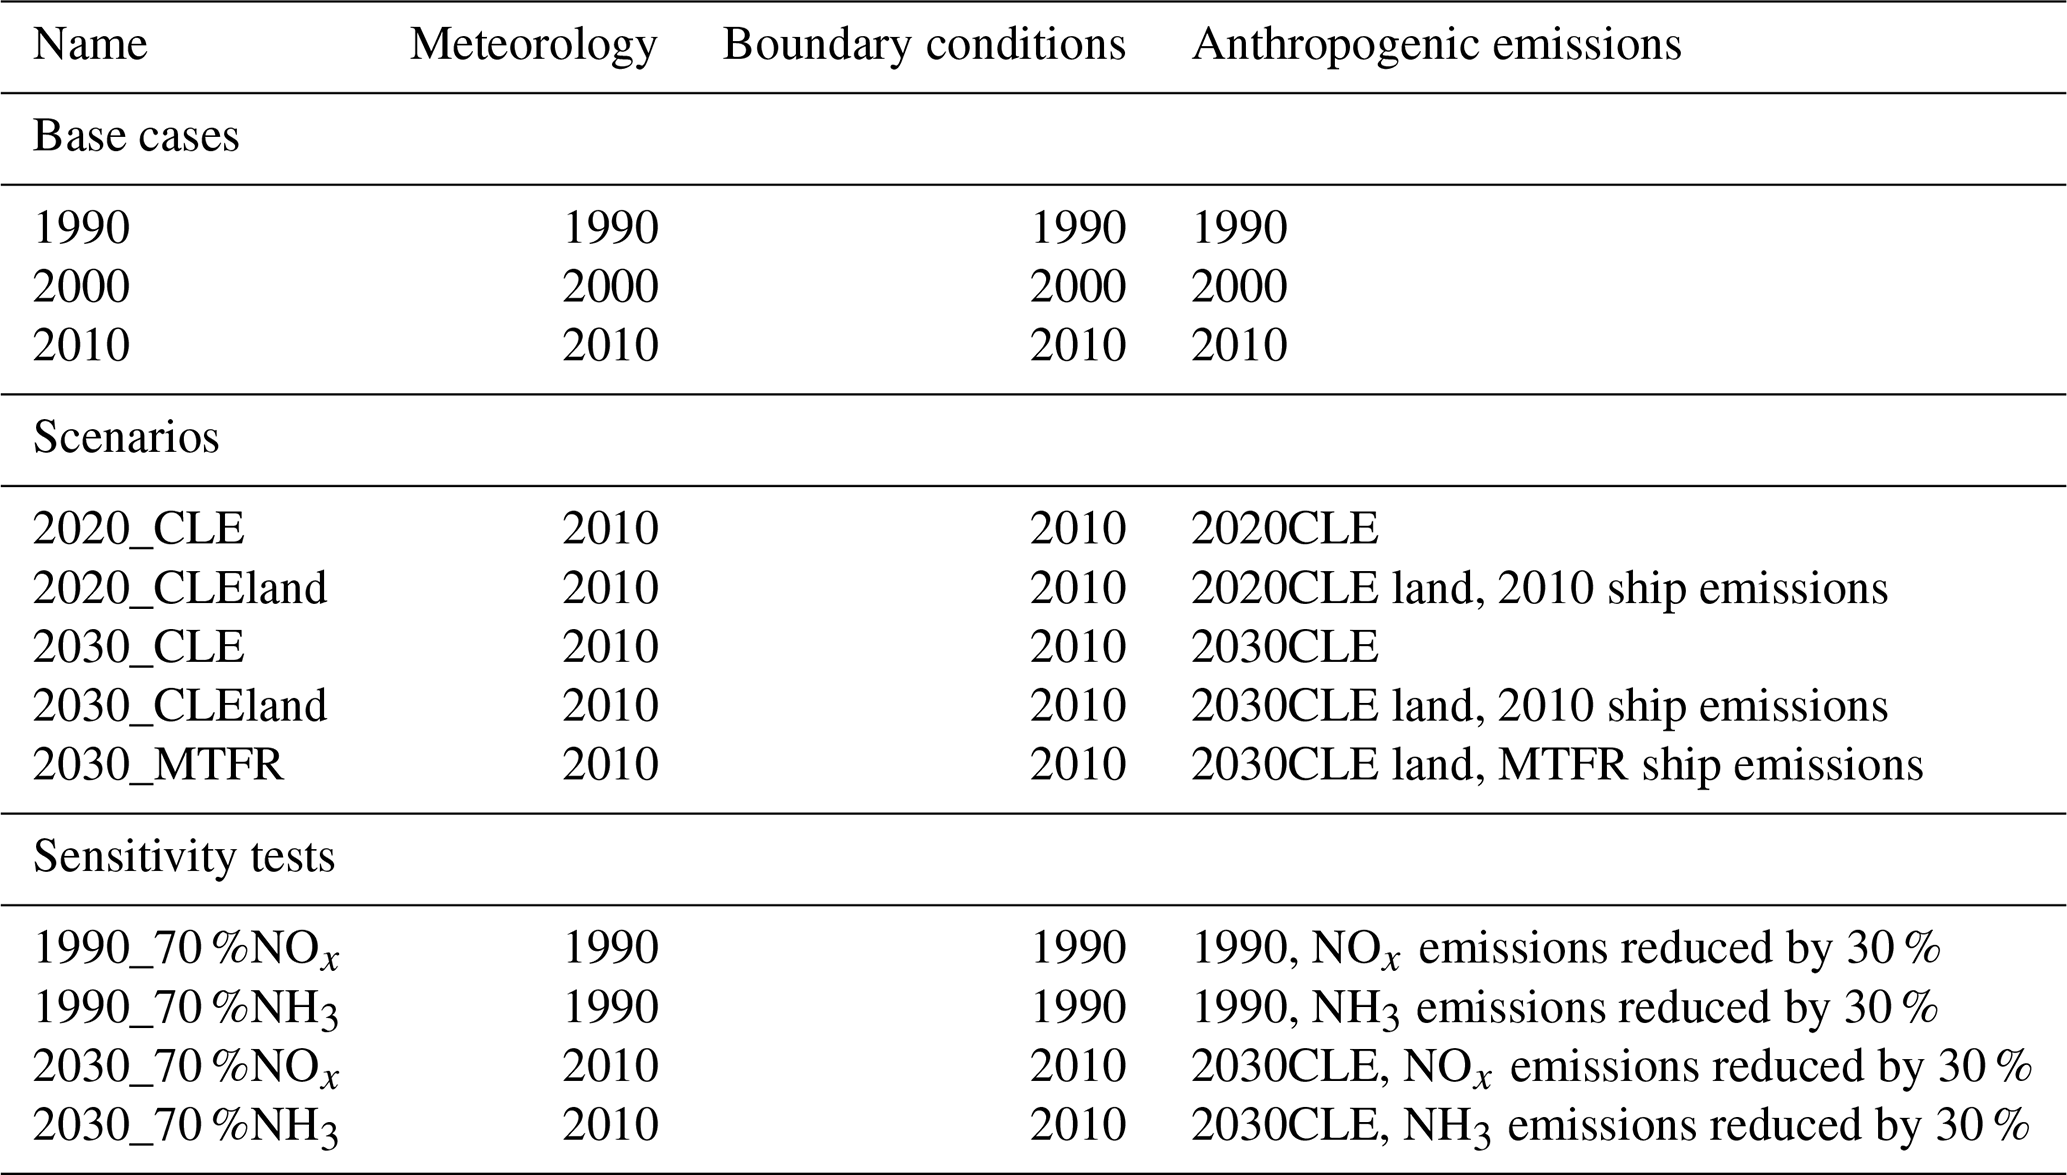
The anthropogenic emissions for scenarios in 2020 and 2030 were prepared using the current legislations in Europe according to the revised Gothenburg Protocol (revised on 4 May 2012; https://www.unece.org/env/lrtap/multi_h1.html, last access: 10 December 2020) and the National Emissions Ceilings (NEC) Directive (2016/2284/EU), respectively. The ship emissions in 2020 and 2030 are projected based on current legislation (CLE) of the International Maritime Organization (IMO) and EU (2020_CLE, 2030_CLE). We also carried out two more scenarios for 2020 and 2030 in which ship emissions were kept the same as in 2010 to estimate the expected changes in their contributions to air pollution. Another scenario, 2030_MTFR (maximum technically feasible emission reductions), was used to investigate the effect of maximum reductions in ship emissions (Jiang et al., 2020). In all scenarios for 2020 and 2030, meteorology and boundary conditions were kept the same as in 2010, and only anthropogenic emissions were changed.
Some additional tests were also performed to determine whether there has been any change in the sensitivity of aerosol formation to NOx and NH3 emissions due to changes in the European emissions over the 4 decades. The simulations for 1990 and 2030_CLE were repeated with 30 % reductions in NOx and NH3 emissions: (1) 1990 with 70 % NOx, (2) 1990 with 70 % NH3, (3) 2030_CLE with 70 % NOx, (4) 2030_CLE with 70 % NH3. The modeled SIA concentrations in each case were compared with those in the corresponding base cases, i.e., 1990 and 2030_CLE, respectively. A description of all simulations performed in this study is shown in Table 1.
Table 1Description of simulations. CLE: current legislation; MTFR: maximum technically feasible reductions.
3.1 Model evaluation
The model results for 1990, 2000 and 2010 were compared with the measurements available at the EDT project database, which is based on EMEP datasets (https://wiki.met.no/emep/emep-experts/tfmmtrendstations, last access: 10 December 2020). The number of available measurement stations varies between 15 and 64 depending on the year and species. For ozone, only measurements at the background rural stations were used to reduce uncertainties due to the model resolution. Model performance for SO2, NO2, PM10, PM2.5 and hourly O3 was discussed in detail in Jiang et al. (2020). In the present study, we performed additional evaluations for ammonia, total ammonium, total nitrate and secondary inorganic aerosol components. Since measurements with large spatial and temporal coverage for such species are scarce, only the 2010 measurements from the EBAS (Emep dataBASe) database (http://ebas.nilu.no, last access: 10 December 2020) were compared with the model results.
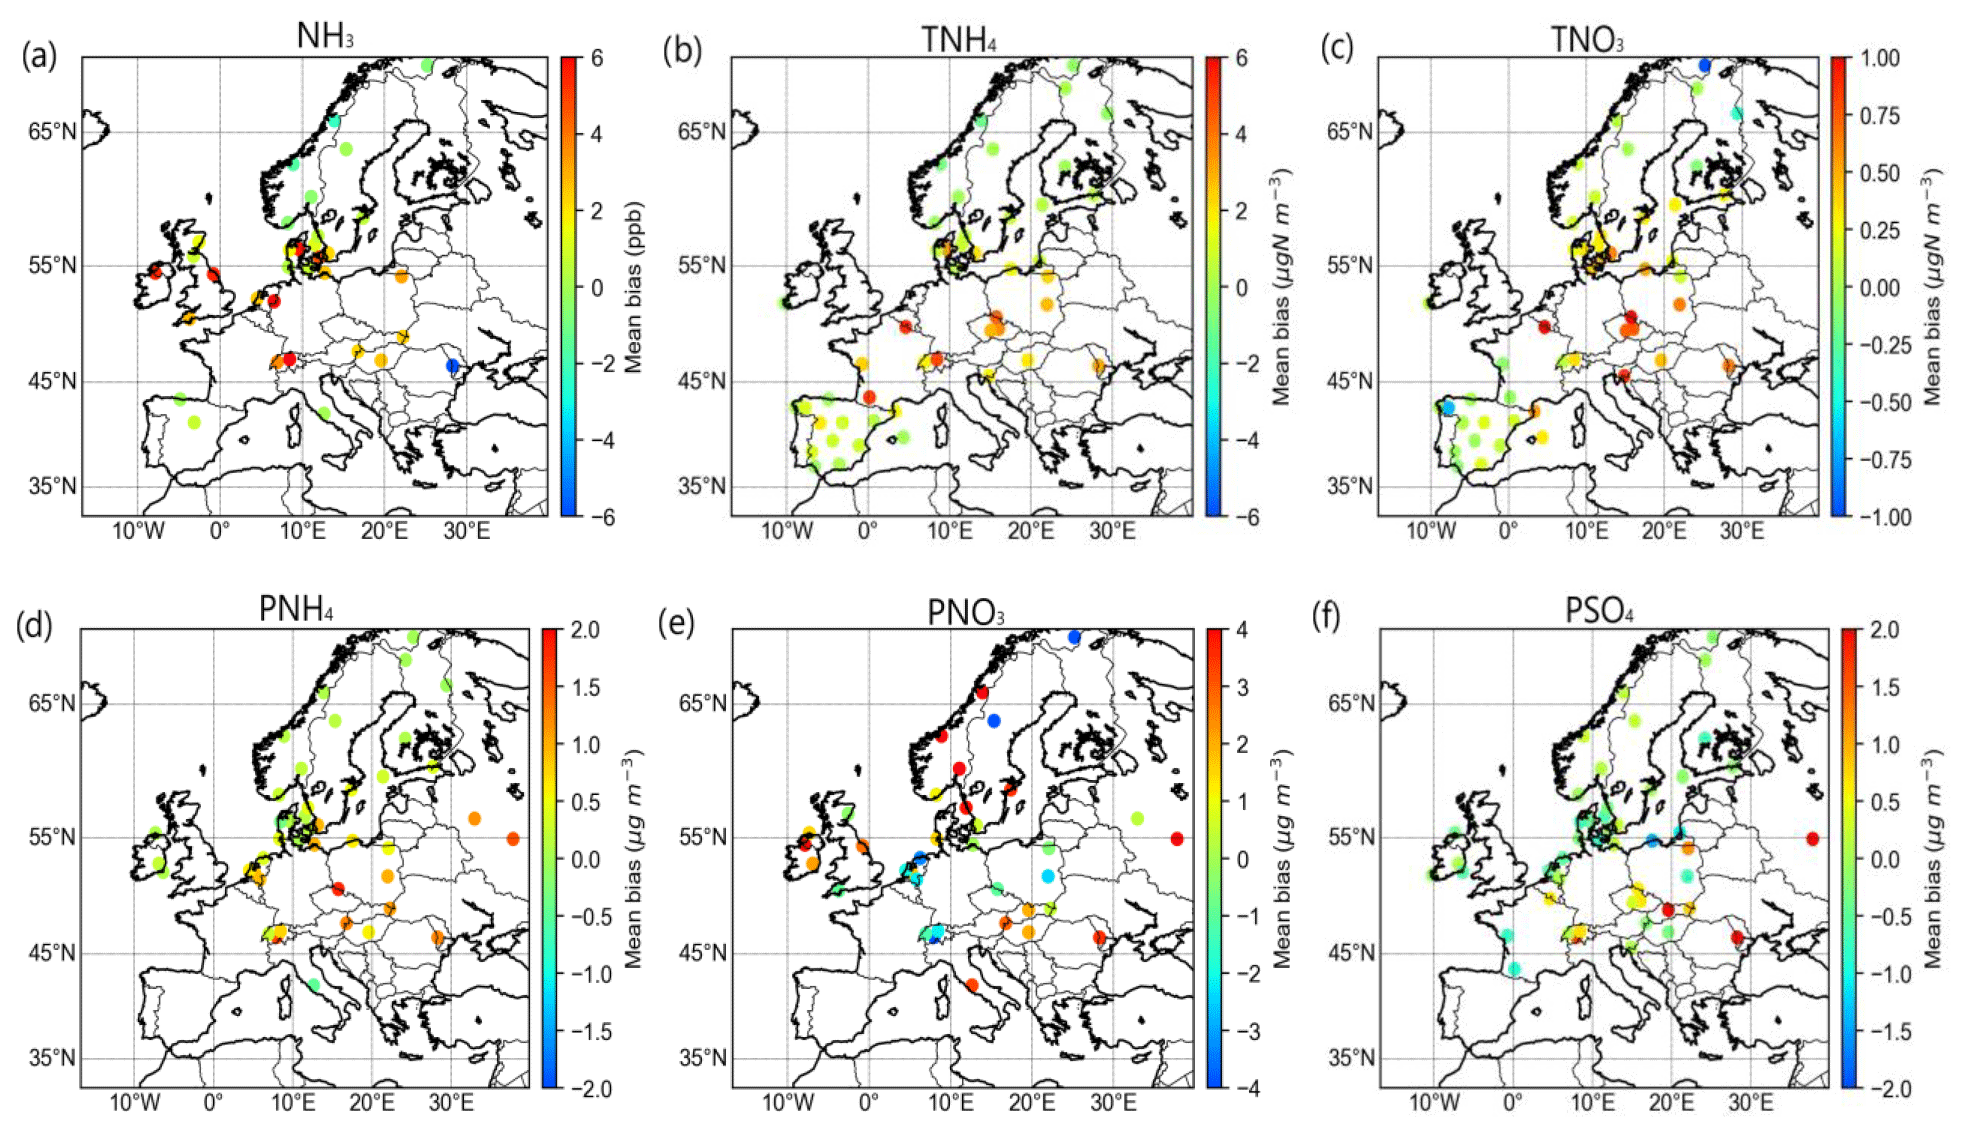
Figure 1Mean bias between measured and modeled concentrations of (a) ammonia (ppb), (b) total ammonium (µg N m−3), (c) total nitrate (µg N m−3), (d) ammonium (µg m−3), (e) particulate nitrate (µg m−3) and (f) sulfate (µg m−3) at various sites in 2010.
Atmospheric concentrations of ammonia are not well characterized due to the relatively small number of monitoring sites, the short lifetime of NH3 in the air and the difficulty of measuring non-point source emissions such as agricultural fields. Most of the measurement sites used in this study are located in the north; only very few stations are in the other parts of Europe (Fig. 1). Detailed information about the measurements (location, methods, temporal resolution) at each site is given in Table S1 in the Supplement. Most of the measurements are daily concentrations, except for some sites in the Netherlands (hourly), Spain and Italy (weekly), Switzerland (bi-weekly), and the UK (monthly). Measurement methods also differ; most of the stations use filter-pack sampling, while passive samplers were used at two sites in Spain, and denuder systems were adopted at sites in the Netherlands, Great Britain and Switzerland. One should keep in mind that sampling artifacts due to the volatile nature of ammonium nitrate and the possible interaction with strong acids make separation of gases and particles by simple aerosol filters less reliable as indicated by EMEP (https://projects.nilu.no/ccc/reports/cccr1-2019_Data_Report_2017.pdf, last access: 10 December 2020). Modeled ammonia concentrations are similar to the measured ones at the few sites in the south, while one site in eastern Europe shows an underestimation of the model (Fig. 1). On the other hand, ammonia is overestimated at several sites such as in the UK and in high-emission areas around the Netherlands and Denmark. The mean fractional bias at all sites is 37.9 % (Table S2). Overestimation might originate from either overestimated emissions or underestimated removal (deposition, particle formation). There are still large uncertainties about ammonia emissions. Recent studies show that better agreement between models and measurements can be achieved when ammonia emissions are modulated with local meteorological conditions (Backes et al., 2016; Hendriks et al., 2016). Most models, however, rely on the static ammonia emission profiles provided in the emission inventories (Ciarelli et al., 2019).
Comparison of measured and modeled total ammonium (sum of gaseous ammonia and particulate ammonium) is an additional test for model evaluation. There are more stations with measurements of total ammonium and total nitrate (sum of nitric acid and particulate nitrate) than for ammonia (Table S2). Statistical parameters indicate an overestimation for total ammonium and nitrate; the variation in the mean bias among the measurement sites, however, suggests that overestimation mostly occurs around high-emission areas in central Europe, while modeled and measured concentrations are similar at most of the sites, especially in the Iberian Peninsula and in Scandinavia (Fig. 1).
These results suggest that ammonia emissions in the emission inventory might be too high around the main emission sources in central Europe, and/or deposition is underestimated by the model, for which the resolution might also be a critical factor. The model estimate for a grid cell might not be representative of the specific location of the measurement site. Especially in mountainous areas with highly spatially variable precipitation patterns, spatial representativeness of the measurement sites is not possible. Furthermore, measurement sites close to farming areas may overestimate deposition of reduced nitrogen with respect to the modeled average deposition within the grid cell. In addition, several studies show that the dry-deposition velocity of ammonia (which is calculated using turbulent diffusion and surface characteristics in models) might vary significantly depending on the season and region (Flechard et al., 2011; Aksoyoglu and Prévôt, 2018). Therefore, different regional parameters used in the calculations might lead to different model performance for deposition. Moreover, as reported by Theobald et al. (2019), the tendency of models to underestimate wet deposition and overestimate atmospheric concentrations is likely due to deficiencies in simulating wet-deposition processes, which are related to the vertical concentration profiles; scavenging coefficients; or in-cloud processes, including the parameterization of clouds.
Evaluation of total nitrogen deposition is challenging because of a lack of measurements, especially of dry deposition; estimates are therefore based on the concentrations and deposition velocities (Flechard et al., 2011). On the other hand, model performance for wet deposition depends strongly on the performance of the meteorological model (Vivanco et al., 2018). Our model results for wet deposition of WNHx, WNOx and WSOx in 2010 are shown together with the available measurements in Fig. S1 in the Supplement. The correlation between model results and measurements for wet deposition is high (between 0.61 for WSOx and 0.81 for WNHx); the wet deposition of all three species, however, is underestimated, with the mean fractional bias (MFB) ranging from −40 % to −58 % (Table S2). In the EURODELTA-Trends model intercomparison study, a significant negative correlation was found for reduced nitrogen, i.e., the tendency that the more the model underestimates the wet deposition, the more it overestimates the atmospheric concentrations (Theobald et al., 2019).
Measurements of total nitrate and ammonium concentrations are mainly available for northern Europe, and they have very little overlap with the wet-deposition sites in central and western Europe (see Figs. 1b, c and S1). Comparison of model performance for TNHx and WNHx with observations at 15 common sites (Fig. S2) suggests that at nine stations, overestimation of TNHx might partially be attributed to underestimation of WNHx (with the largest anti-correlation of bias at sites in the Czech Republic and Poland), as also found by other models used in the EDT model intercomparison study (Theobald et al., 2019).
Among the SIA components, the best agreement between model and measurements is for sulfate (MFB =4.7 %) (Table S2, Fig. 1). The modeled concentrations of the other SIA components – for which the spatial coverage in central and western Europe is rather poor – are higher than the measured ones, especially for nitrate (MFB = 54.6 %) (Fig. 1, Table S2). Overall, the performance of the CAMx model in this study is similar to the other models participating in the EDT project (Ciarelli et al., 2019; Theobald et al., 2019).

Figure 2Ammonia (left) and nitric acid (right): (a) annual average concentrations (ppb) in 1990; changes (ppb) between (b) 1990–2000, (c) 2000–2010 and (d) 2010–2030_CLE.
3.2 Changes in concentrations
3.2.1 Gaseous species: NH3 and HNO3
The highest ammonia concentrations are predicted around the Benelux area and northern Italy, where emissions are the highest in Europe (Fig. 2a, left panel). The model results suggest that between 1990 and 2000, the annual average concentrations of ammonia decreased only around the Netherlands and in the eastern part of the model domain by about 30 %–40 %, while an increase was predicted in the rest of the domain (Fig. 2b, left panel; see Fig. S3a for relative changes). This is consistent with the observed trends in Europe during the same period (Colette et al., 2016). Ammonia concentrations decreased further around the Netherlands and started to decline also in northern Italy between 2000 and 2010, while they continued to increase in other parts of Europe (Fig. 2c, left panel). The predictions based on the current legislation (CLE) scenario emissions suggest that the changes during the period between 2010 and 2030 will be much smaller (Fig. 2d, left panel).
Concentrations of nitric acid (HNO3) are generally higher in areas with both high NOx emissions and photochemical activity, such as coastal areas and the shipping routes, especially in the Mediterranean region (Fig. 2a, right panel). The large decline (50 %–60 %) in nitric acid concentrations in those areas between 1990 and 2000 is mainly due to a decrease in NOx emissions as a result of significant reductions in emission standards in Europe (Fig. 2b, right panel, and Fig. S3b). The results show an increase in nitric acid concentrations later between 2000 and 2010 around the English Channel, North Sea, Baltic Sea and the Mediterranean Sea as well as northern Italy (Fig. 2c, right panel). These results suggest that decreased ammonia concentrations in the same period around the Netherlands, Denmark and northern Italy led to a lower ammonium nitrate formation and higher nitric acid concentrations in the air. Our calculations suggest that with further reductions in NOx emissions, nitric acid levels would continue to decrease until 2030 due to reductions in both land and ship emissions (Fig. 2d, right panel). On the other hand, since simulations for 2030 were performed using the meteorological parameters of 2010, one should keep in mind that potentially higher temperatures in the future might increase the evaporation of ammonium nitrate to form its gaseous components NH3 and HNO3 (Fowler et al., 2015).
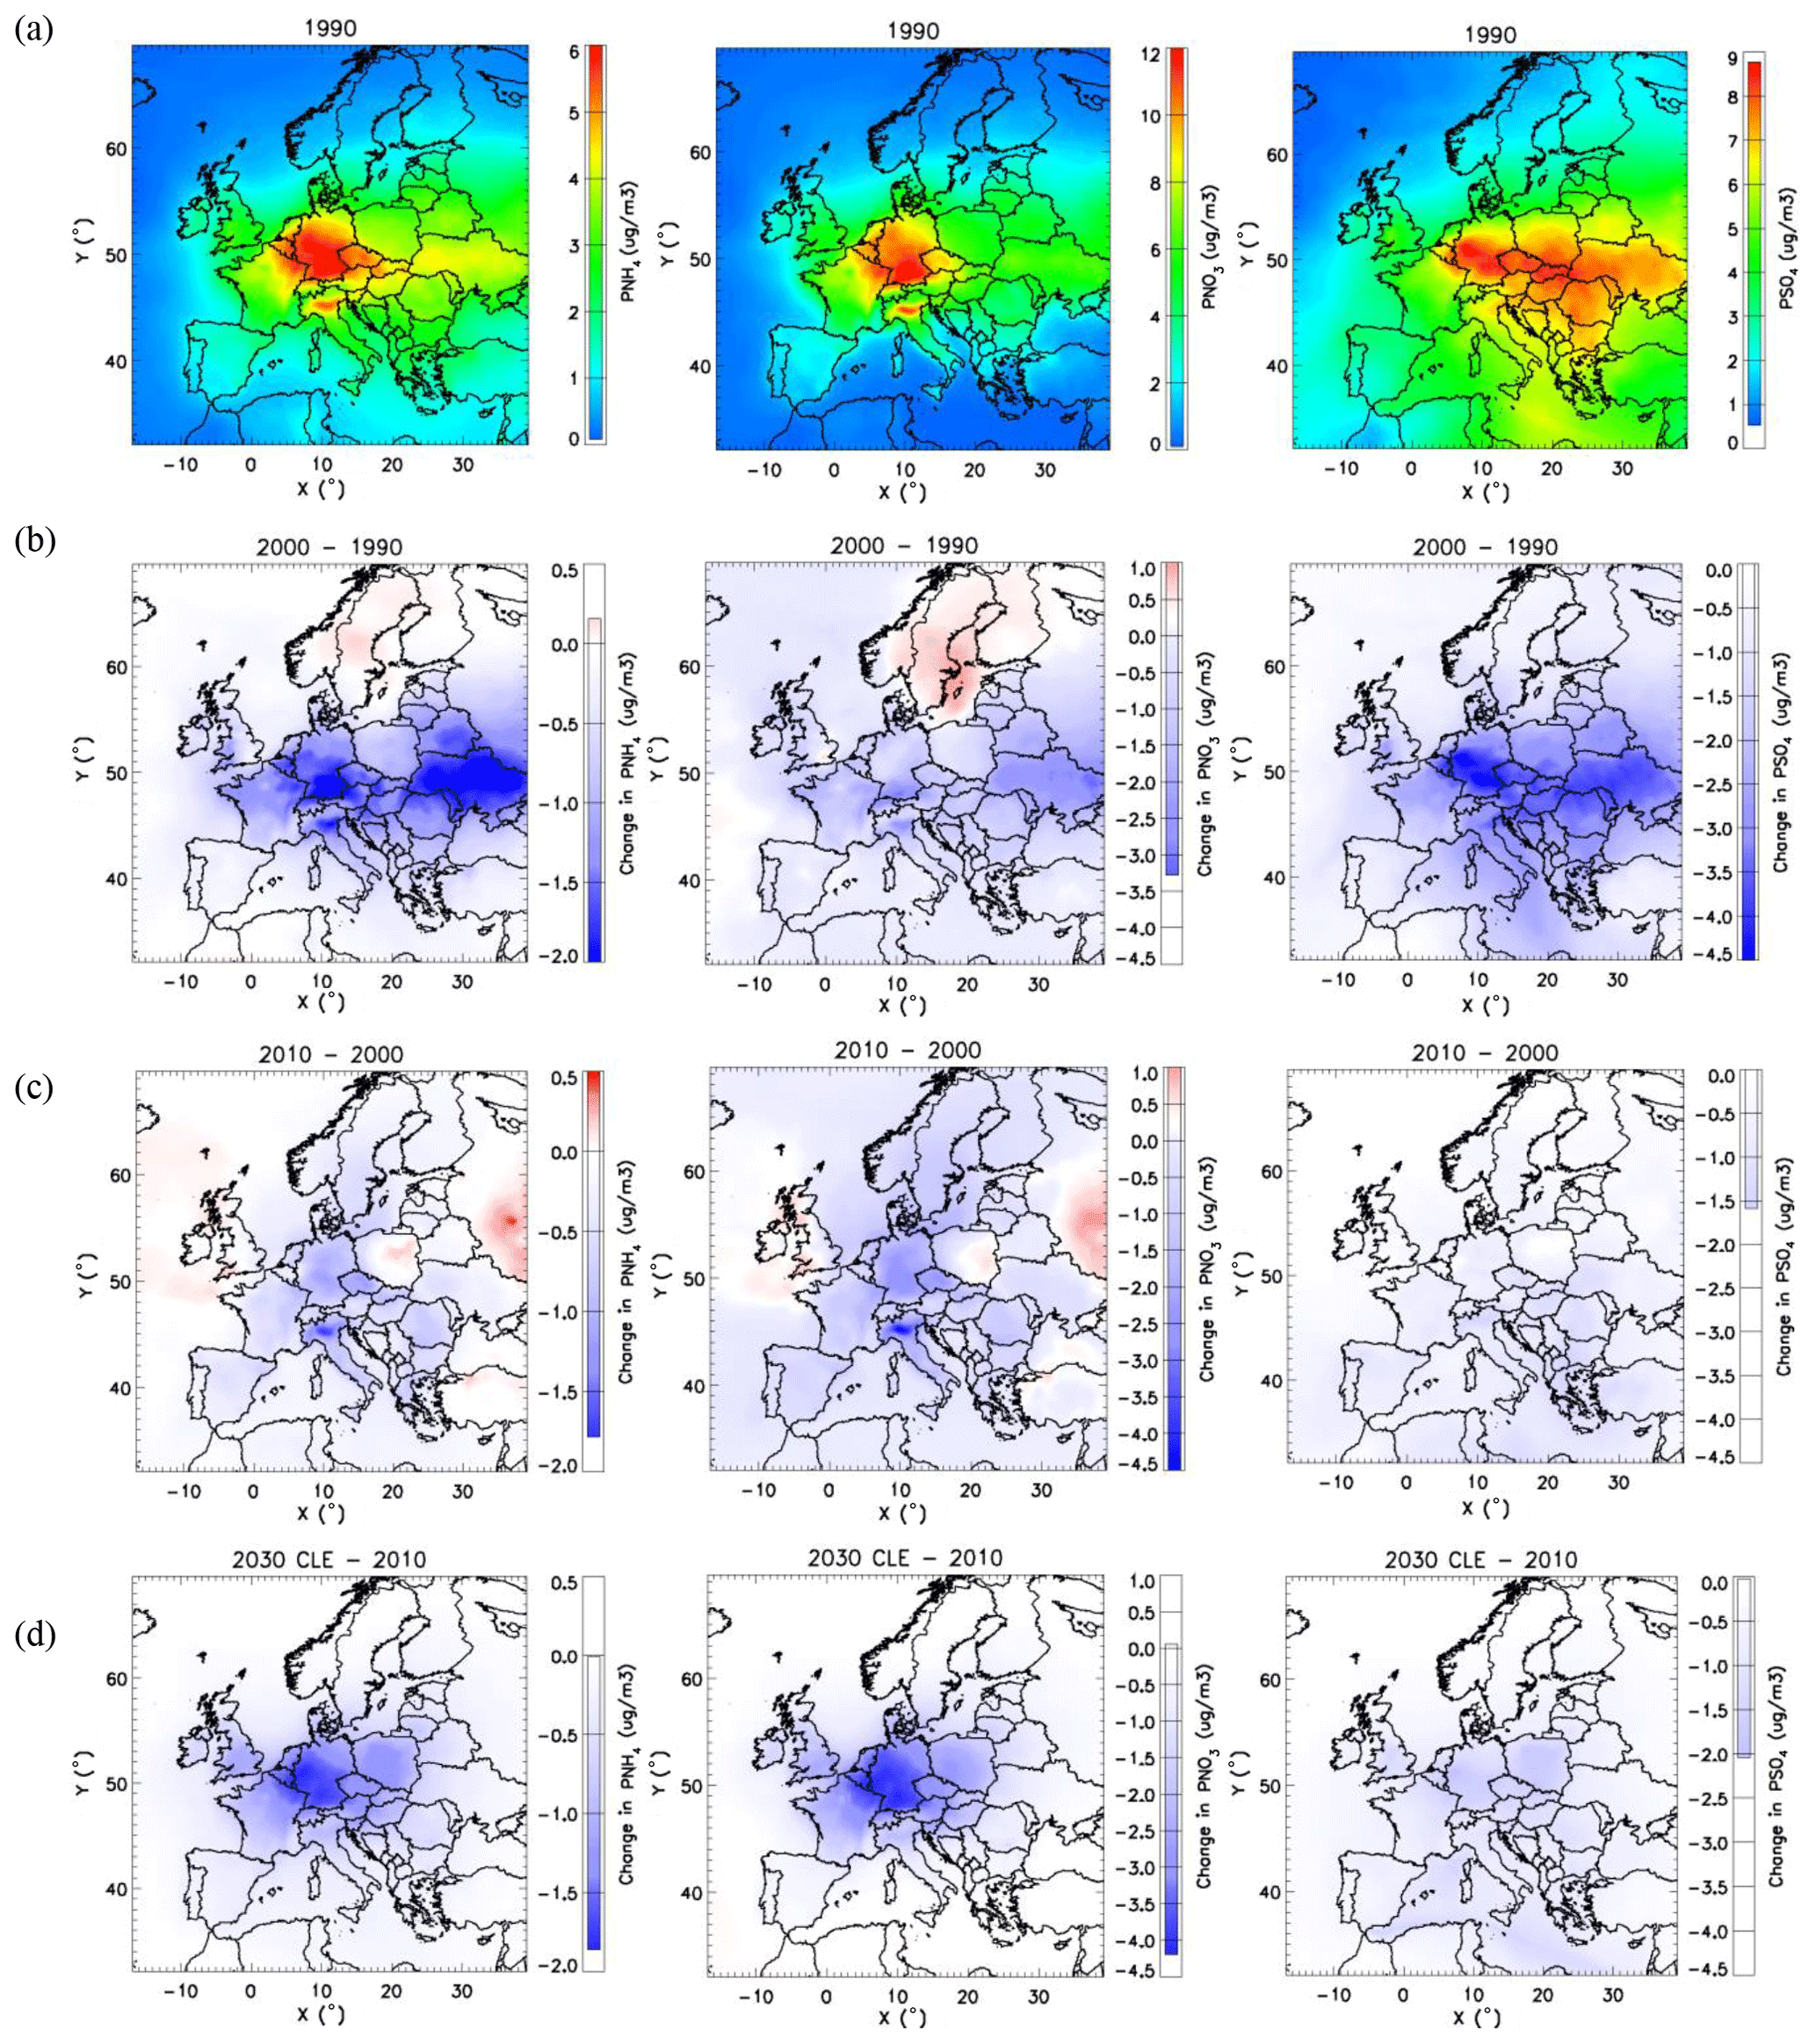
Figure 3Ammonium (left), particulate nitrate (middle) and sulfate (right): (a) annual average concentrations (µg m−3) in 1990; changes (µg m−3) between (b) 1990–2000, (c) 2000–2010 and (d) 2010–2030_CLE.
3.2.2 Secondary inorganic aerosols
Annual average concentrations of SIA components (PNH4, PNO3, PSO4) in 1990 as well as changes in their concentrations between 1990–2000, 2000–2010 and 2010–2030_CLE are shown in Fig. 3. The highest ammonium concentrations are predicted for central Europe and the Po valley (Fig. 3a, left panel). The concentrations in eastern Europe are relatively high as well. As seen in the left panel of Fig. 3b, the ammonium concentrations decreased significantly (by 40 %–50 %) between 1990 and 2000 in central and eastern Europe (see Fig. S3c for relative changes), while there was some increase in the east after 2000 (Fig. 3c, left panel). Simulations using the CLE emission scenarios suggest that the ammonium concentrations will continue to decrease between 2010 and 2030 with no more increase anywhere in the whole model domain (Fig. 3d, left panel). A similar trend can be observed in the particulate nitrate concentrations, with a significant decrease over the continent between 1990 and 2010 (Fig. 3a–c, middle panels). A slight increase, however, is noticeable over the Baltic Sea and Scandinavia between 1990 and 2000 as well as in the eastern part of the model domain between 2000 and 2010. On the other hand, particulate nitrate concentrations will decrease in all of Europe between 2010 and 2030 (Fig. 3d, middle panel).
The concentrations of particulate sulfate (PSO4) in 1990 were higher in central and eastern Europe, the Balkans, and along shipping routes than for the rest of Europe (Fig. 3a, right panel). They decreased continuously (by 60 %–70 %) over the period between 1990–2010 (Fig. 3b–c, right panels, and Fig. S3e). Results of future scenario simulations suggest that sulfate concentrations will continue to decrease in central Europe as well as along shipping routes until 2030 assuming a current legislation (CLE) scenario (Fig. 3d, right panel).
Table 2Differences in emissions between various years and future scenarios.

The results obtained from these simulations indicate that a significant reduction (>40 %) in the secondary inorganic aerosol concentrations was achieved especially between 1990 and 2000 (Fig. S3f), consistent with the larger reductions in emissions during the first decade (Table 2). Continuous reductions in land and ship emissions until 2030 will lead to a further decrease in SIA concentrations in Europe. The model results suggest that the relative composition of secondary inorganic aerosols will be different in 2030 compared to 1990 due to a larger decrease in sulfate concentrations than nitrate in most of the model domain. An example for the change in the SIA composition is shown for Payerne, a rural site in Switzerland, in Fig. S4. The sulfate fraction decreases from 30 % to 21 %, while the particulate nitrate fraction increases from 47 % to 56 % between 1990 and 2030, assuming the CLE scenario.
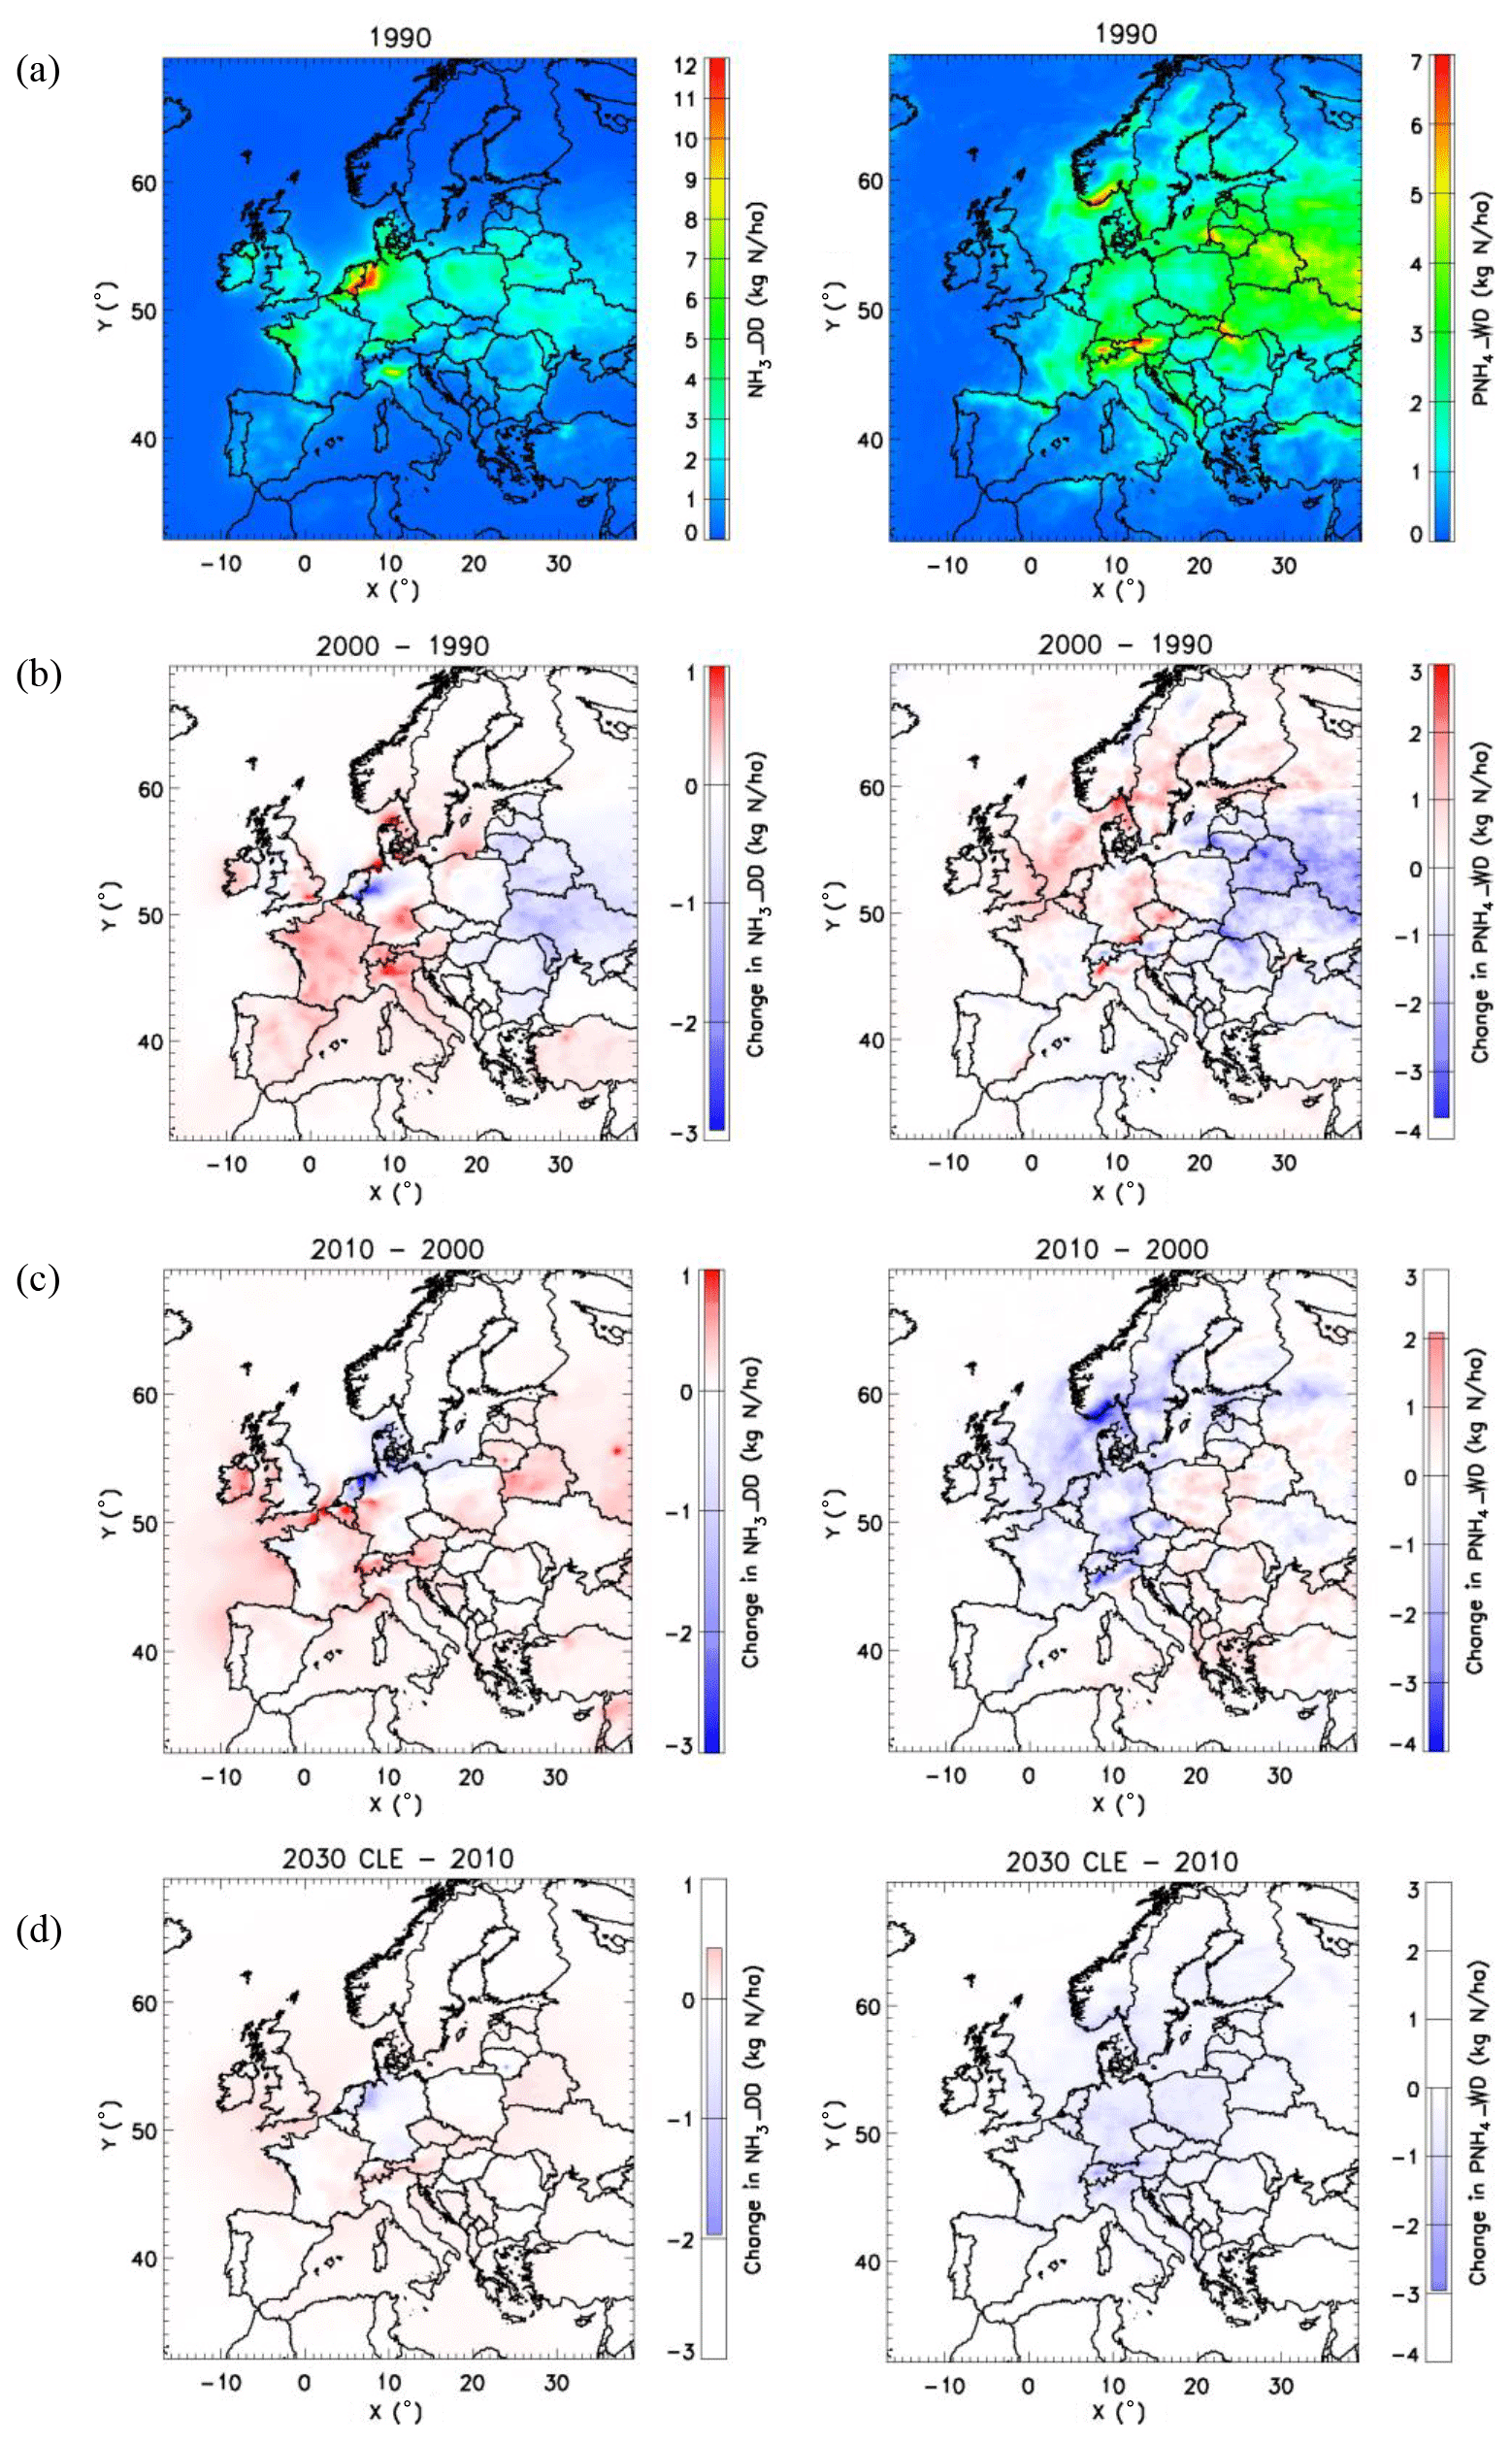
Figure 4Dry deposition of ammonia (left panels) and wet deposition of ammonium (right panels): (a) accumulated deposition (kg N ha−1) in 1990; changes (kg N ha−1) between (b) 1990 and 2000, (c) 2000 and 2010, and (d) 2010 and 2030_CLE.
3.3 Changes in deposition
3.3.1 Dry deposition
A large fraction of the total nitrogen deposition in Europe is due to the deposition of reduced nitrogen compounds, with dry deposition of ammonia being the dominant one (Aksoyoglu et al., 2014; Aksoyoglu and Prévôt, 2018; Simpson et al., 2014). Removal of ammonia from the atmosphere through dry deposition is quite fast; i.e., deposition occurs in areas close to the emission sources (Fig. 4a, left panel). The model results show that dry deposition of ammonia decreased around the Netherlands, northern Germany and slightly also in the eastern part of the model domain between 1990 and 2000, while there was an increase in the rest of Europe (Fig. 4b, left panel). After 2000, however, dry deposition started increasing also in eastern Europe (Fig. 4c, left panel). Simulations for 2030 calculated by changing only the emissions according to the CLE scenario suggest that there will be a small decrease in dry deposition only in the north around the Netherlands and northern Germany between 2010 and 2030 (Fig. 4d, left panel). A slight increase along the coastal areas in western and northern Europe is probably caused by the changes in ship emissions (see Sect. 3.4).
3.3.2 Wet deposition
The amount of precipitation which is generated by the meteorological models is crucial for simulating wet deposition in air quality models. The performance evaluation of the accumulated precipitation used in the EURODELTA-Trends exercise is discussed in detail in Theobald et al. (2019). The model biases are very small for accumulated annual precipitation for the meteorological model used in this study; there is an underestimation of 4 %–8 %. The wet deposition of ammonium in 1990 is shown in the right panel of Fig. 4a. The modeled wet deposition decreased in eastern Europe between 1990 and 2000, while it slightly increased around the English Channel and North Sea (Fig. 4b, right panel). The decrease in the east is in line with the largest emission reductions in that area. The increase in wet deposition in the north around the English Channel could be due to increased precipitation between 1990–2000 (Theobald et al., 2019). Increased emissions from ships, however, could also be the reason for the increased wet deposition of ammonium. After 2000, there was a decrease in wet deposition in most of the domain (Fig. 4c, right panel). Other models which participated in the EDT project and simulated the whole 21-year period between 1990 and 2010 found similar results, with a decrease in wet deposition in the east and an increase in northwestern Europe during the first period between 1990–2000 (Theobald et al., 2019). Assuming the CLE scenario (using the meteorology of 2010), wet deposition of ammonium is predicted to decrease in Europe significantly (20 %–40 %) between 2010 and 2030 (Fig. 4d, right panel). The change in wet deposition between 1990 and 2010 might be due to a change in both the air concentrations and the amount of precipitation, but it can only be due to a change in the concentrations between 2010 and 2030_CLE since the same meteorological parameters were used for both years.
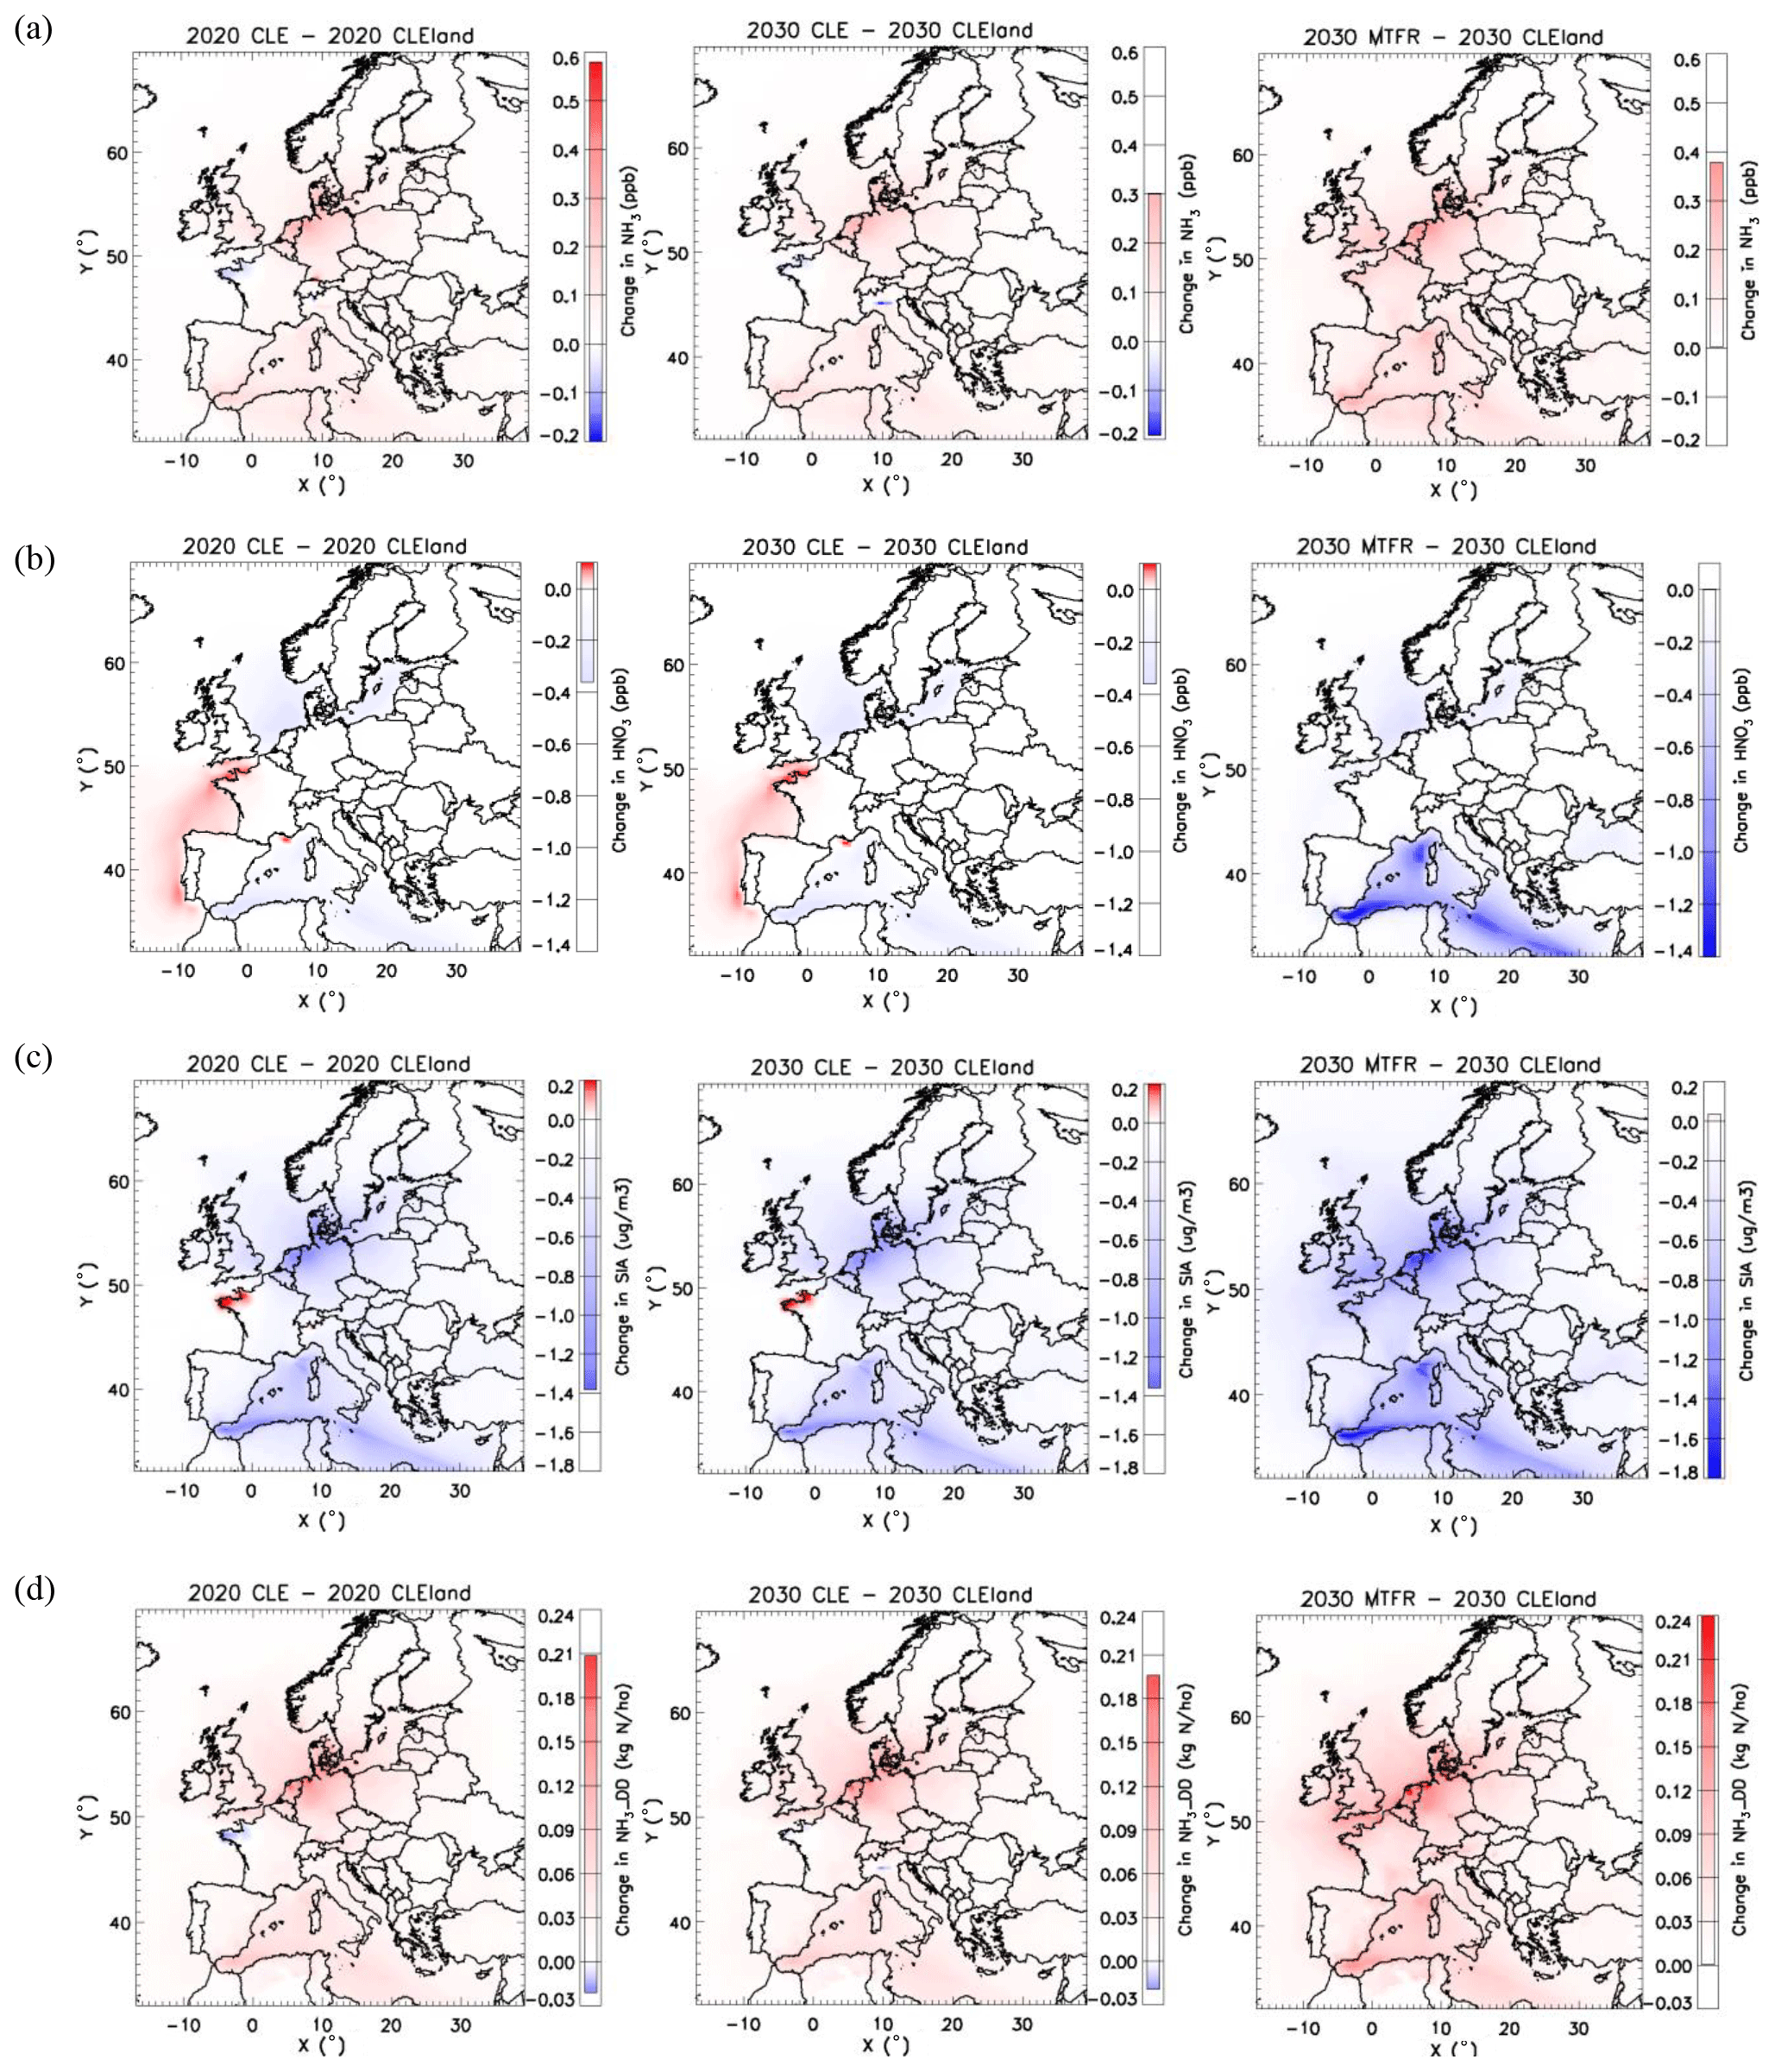
Figure 5Effect of ship emissions on annual average concentrations of (a) ammonia (ppb), (b) nitric acid (ppb), (c) secondary inorganic aerosols (µg m−3) and (d) dry deposition of ammonia (kg N ha−1) in scenarios 2020 CLE (left), 2030 CLE (middle) and 2030 MTFR (right). CLEland: with ship emissions of 2010; CLE: with ship emissions under current legislation; MTFR: with ship emissions under maximum technically feasible reductions.
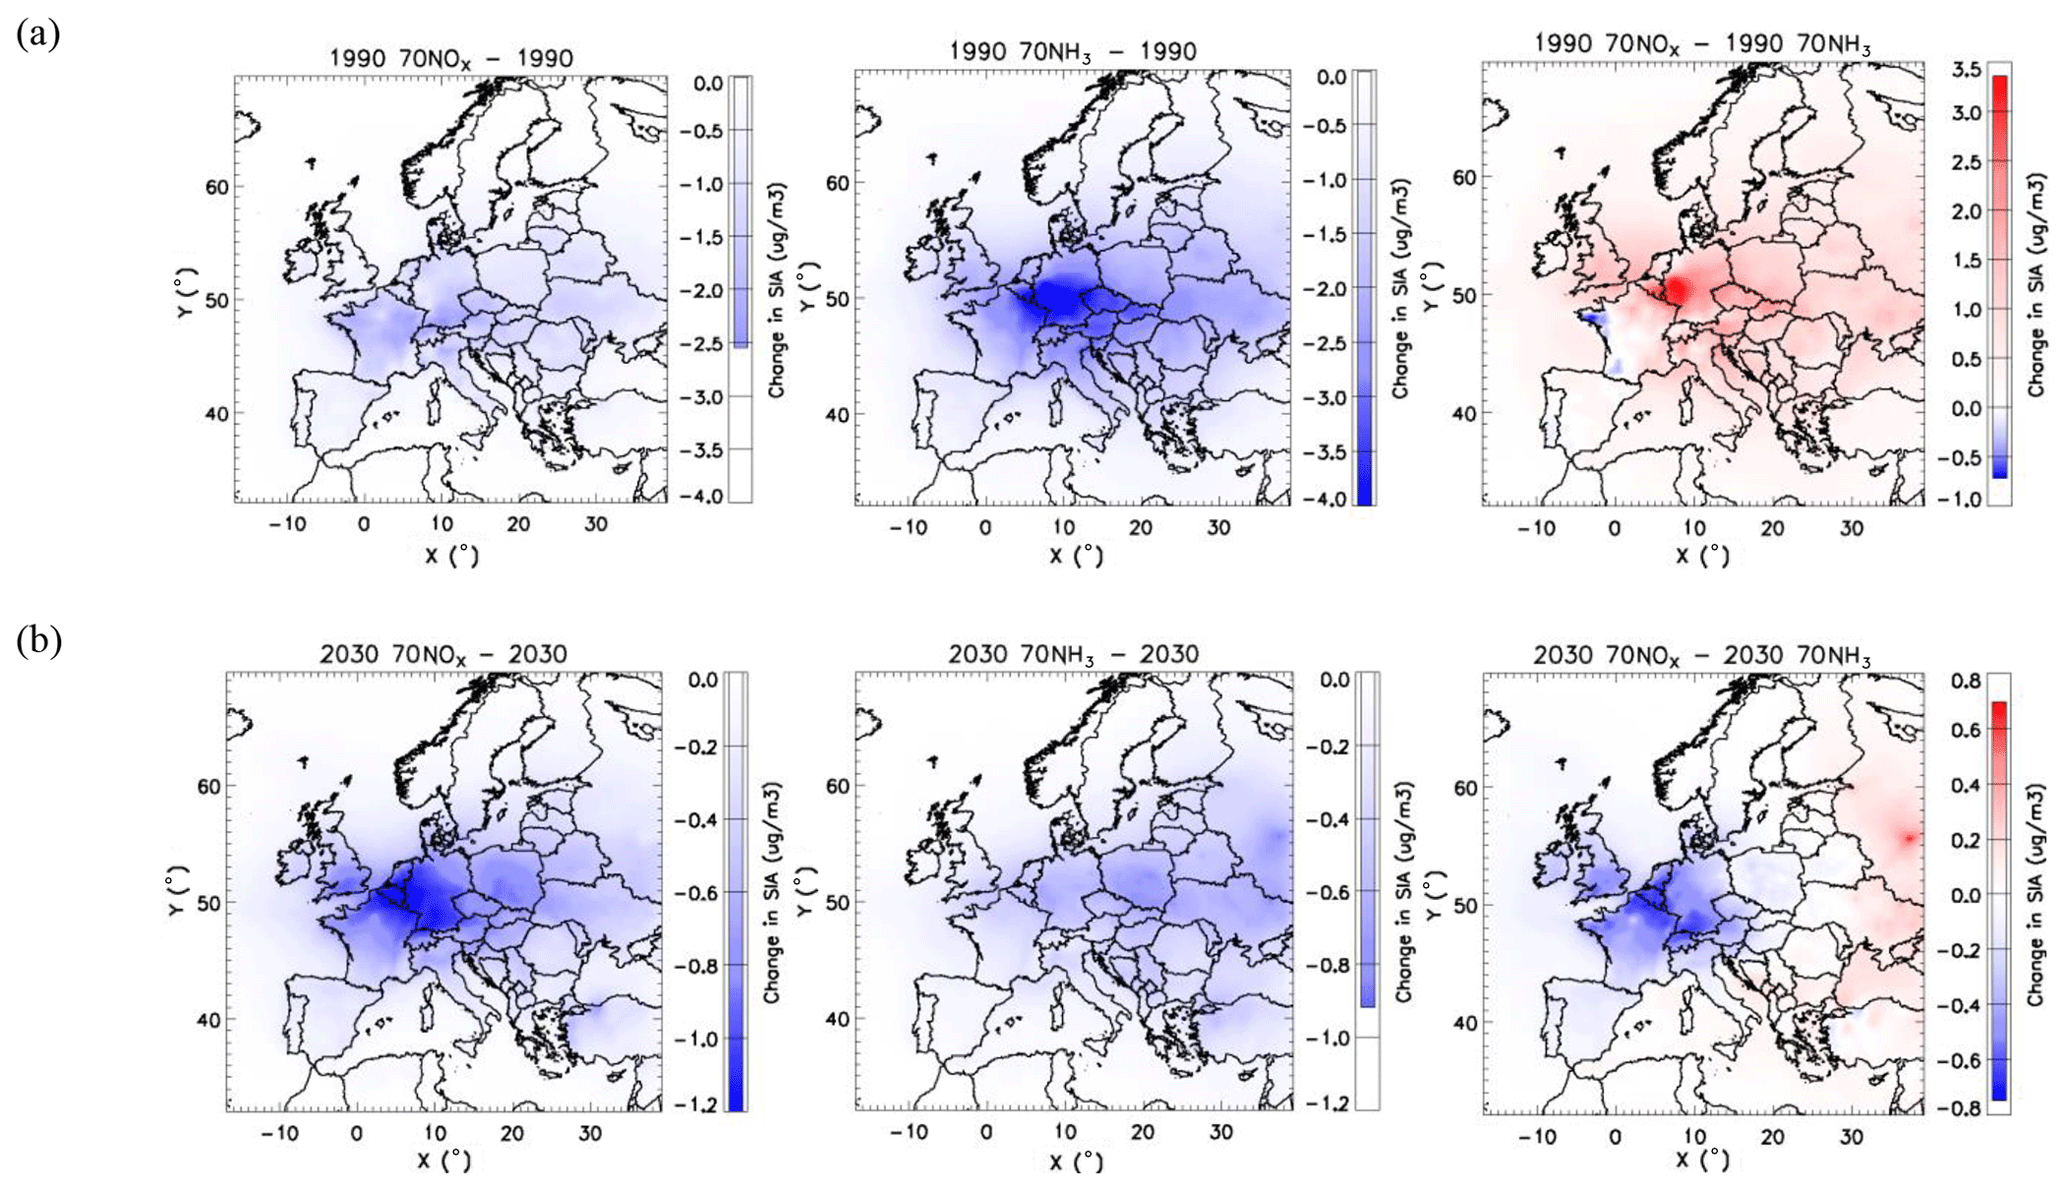
Figure 6Change in SIA concentrations (µg m−3) due to 30 % reduction in NOx emissions (left), due to 30 % reduction in NH3 emissions (middle) and the difference between the two figures (right) (a) in 1990 and (b) in 2030_CLE. The red color in the right panels shows NH3-sensitive areas; the blue color shows NOx-sensitive areas.
3.4 Effects of ship emissions
The two scenarios 2020_CLE and 2030_CLE take both land and ship emissions into account according to the current legislation. In order to investigate the effect of ship emissions on the gaseous and particulate species, we compared two ship emission scenarios for both 2020 and 2030 as described in Table 1. In scenarios 2020_CLEland and 2030_CLEland, ship emissions were kept the same as in 2010, while they were projected to 2020 and 2030 using the CLE scenario in 2020_CLE and 2030_CLE, respectively. The difference in concentrations between CLE and CLEland scenarios therefore shows the effect due to the changes in ship emissions in the corresponding years (Figs. 5, S5).
In all three cases (2020, 2030_CLE and 2030_MTFR), gaseous-ammonia concentrations are predicted to increase due to changes in ship emissions especially around the Benelux area and along the Mediterranean coast (Fig. 5a). On the other hand, nitric acid concentrations will decrease in the North Sea, Baltic Sea and the Mediterranean Sea and increase along the Atlantic coast under the assumptions of the CLE scenario in 2020 and 2030 (Fig. 5b). The effect of emissions from international shipping activities along the Atlantic coast and Gibraltar Strait can also be seen in the particulate nitrate concentrations (Fig. S5d). The importance of shipping activities due to their relatively high NOx emissions was also reported for southwestern Europe by Pay et al. (2019). Our scenario calculations suggest that when ship emissions are reduced according to the MTFR scenario in 2030, nitric acid and particulate nitrate would no longer increase along the Atlantic coast but decrease (see Figs. 5b, S5d).
The decrease in concentrations of secondary inorganic aerosols along the coastal areas – especially with the MTFR scenario (Figs. 5c, S5) – is due to a significant decrease in nitrate and sulfate concentrations around the Benelux region and the Mediterranean, respectively, as shown in Jiang et al. (2020). These results suggest that when ship emissions are reduced further in the future, particulate ammonium formation will decrease especially around the Benelux area, North Sea, Baltic Sea, English Channel and the Mediterranean region, leaving more ammonia in the gas phase (Figs. 5a, S5a). This would then lead to an increase in the dry deposition of ammonia along the coastal areas (Figs. 5d, S5g). On the other hand, wet deposition of ammonium will decrease along the Scandinavian and Adriatic coasts due to future reductions in ship emissions (Fig. S6).
3.5 Sensitivity of aerosol formation to NOx and NH3 emissions
SIA formation depends strongly on its precursor emissions. Ammonia reacts rapidly with atmospheric sulfuric and nitric acids to form ammonium sulfate and ammonium nitrate (Behera et al., 2013). Reaction with sulfuric acid (or with ammonium bisulfate) is favored over the reaction with nitric acid; ammonium nitrate is formed only after all sulfate is neutralized by NH3. Ammonium nitrate formation, which is favored by low temperatures and high relative humidity, is in a reversible equilibrium with ammonia and nitric acid.
An earlier model study covering Switzerland and northern Italy, using emissions from the year 2000, showed that aerosol formation was rather limited by NOx emissions in northern Switzerland, while it was dependent on both NOx and NH3 emissions in northern Italy (Andreani-Aksoyoglu et al., 2008). Other sensitivity studies performed over the whole European domain for the period 2004–2006 suggested that SIA formation was more sensitive to NH3 emissions in most of Europe, except the Netherlands, northern Switzerland and northwestern France, where ammonia emissions are high (Aksoyoglu et al., 2011; Pay et al., 2012). Since sulfate and nitrate aerosol formation depends on the availability of their precursors SO2, NOx and NH3, changes in emissions since the 1990s might have affected the sensitivity of aerosol formation in Europe.
We tested the sensitivity of aerosol formation to emissions by reducing NOx and NH3 emissions by 30 % in two separate simulations for the past (1990) and the future (2030_CLE). The change in the annual average SIA concentrations for these simulations is shown in Fig. 6. Decreasing NH3 emissions are predicted to be more effective in reducing SIA concentrations in 1990 for a large part of the model domain (Fig. 6, upper panels) as also reported in Aksoyoglu et al. (2011). In 2030_CLE, however, the effectiveness of emission reductions looks different as a result of the larger reductions in NOx emissions compared to NH3 emissions in Europe (Fig. 6, lower panels). The change in the colors from red in 1990 to blue in 2030_CLE in central and western Europe as well as the UK (right panels) suggests that aerosol formation will become more NOx-sensitive in 2030 in those areas, while in the eastern part of the model domain it will still be more sensitive to ammonia emissions (Fig. 6, lower right panel). It should be noted, however, that the sensitivity to emissions is weaker in 2030_CLE than in 1990 (see scales in Fig. 6).
In this study we investigated the role of ammonia in European air quality by means of CAMx model simulations for the period between 1990 and 2030 with 10-year intervals. We analyzed the modeled annual average concentrations of ammonia (NH3), nitric acid (HNO3), secondary inorganic aerosol (SIA) and its components as well as dry ammonia and wet ammonium deposition. The model results suggest that the decrease in SIA concentrations by about 40 % between 1990 and 2010 was mainly due to reductions in NOx and SO2 emissions in Europe. Ammonia concentrations, on the other hand, decreased by about 30 % only around high-emission areas (Benelux area, northern Italy), while there was a slight increase in the other parts of the model domain, leading also to an increase in dry deposition of ammonia. The modeled changes in the annual concentrations were larger for the first decade (1990–2000), especially for nitric acid, particulate ammonium and sulfate. On the other hand, changes during the period between 2010 and 2030, assuming the current legislation (CLE) scenario, are predicted to be smaller than those achieved earlier for all analyzed species in this study.
Simulations using the current legislation (CLE) and maximum technically feasible reduction (MTFR) scenarios for 2020 and 2030 suggest that when ship emissions will be regulated more strictly in the future, particle formation will decrease, especially around the Benelux area, North Sea, Baltic Sea, English Channel and the Mediterranean region, leaving more ammonia in the gas phase, which will lead to an increase in dry deposition. In the north, the decrease in aerosol concentrations will be mainly due to reduced particulate nitrate formation, while the change in the Mediterranean area will be caused mainly by decreased sulfate aerosols.
In order to investigate whether the sensitivity of aerosol formation to NOx or NH3 emissions changes during the period between 1990 and 2030, we performed sensitivity tests by repeating the simulations for 1990 and 2030_CLE with NOx and NH3 emissions reduced by 30 % separately. In 1990, SIA formation was more affected by NH3 emission reductions in central Europe because of relatively high NOx emissions at that time. In 2030, however, NOx emission reductions reduce SIA concentrations more than NH3 reductions. These results indicate a shift in the sensitivity of aerosol formation from NH3 towards NOx emissions in a large part of Europe between 1990 to 2030 due to a larger change in NOx levels during that period compared to changes in NH3 concentrations.
Data are available online at https://doi.org/10.5281/zenodo.4249297 (Aksoyoglu and Jiang, 2020).
The supplement related to this article is available online at: https://doi.org/10.5194/acp-20-15665-2020-supplement.
SA and JJ developed the idea and analyzed the results; JJ performed the simulations; SA wrote the paper; GC contributed to input preparation; SA and ASHP supervised the project. All authors contributed to the text, interpretation of the results and review of the article.
The authors declare that they have no conflict of interest.
We acknowledge the EURODELTA-Trends project for providing meteorological data, anthropogenic emissions and boundary conditions as model input for 1990–2010; the National Aeronautics and Space Administration (NASA) and its data-contributing agencies (NCAR, UCAR) for the TOMS and MODIS data and the TUV model; and the International Institute for Applied Systems Analysis (IIASA) for the GAINS ship emissions in 2020 and 2030. We would like to thank RAMBOLL for the continuous support of the CAMx model. Model simulations were performed at the Swiss National Supercomputing Centre (CSCS).
This study was financially supported by the Swiss Federal Office for the Environment (FOEN; contract no. 16.0096 PJ/Q233-1014).
This paper was edited by Veli-Matti Kerminen and reviewed by two anonymous referees.
Aksoyoglu, S. and Jiang, J.: Role of ammonia in European air quality with changing land and ship emissions between 1990 and 2030, Zenodo, https://doi.org/10.5281/zenodo.4249297, 2020.
Aksoyoglu, S. and Prévôt, A. S. H.: Modelling nitrogen deposition: dry deposition velocities on various land-use types in Switzerland, Int. J. Environ. Pollut., 64, 230–245, https://doi.org/10.1504/IJEP.2018.10020573, 2018.
Aksoyoglu, S., Keller, J., Barmpadimos, I., Oderbolz, D., Lanz, V. A., Prévôt, A. S. H., and Baltensperger, U.: Aerosol modelling in Europe with a focus on Switzerland during summer and winter episodes, Atmos. Chem. Phys., 11, 7355–7373, https://doi.org/10.5194/acp-11-7355-2011, 2011.
Aksoyoglu, S., Keller, J., Ciarelli, G., Prévôt, A. S. H., and Baltensperger, U.: A model study on changes of European and Swiss particulate matter, ozone and nitrogen deposition between 1990 and 2020 due to the revised Gothenburg protocol, Atmos. Chem. Phys., 14, 13081–13095, https://doi.org/10.5194/acp-14-13081-2014, 2014.
Aksoyoglu, S., Baltensperger, U., and Prévôt, A. S. H.: Contribution of ship emissions to the concentration and deposition of air pollutants in Europe, Atmos. Chem. Phys., 16, 1895–1906, https://doi.org/10.5194/acp-16-1895-2016, 2016.
Aksoyoglu, S., Ciarelli, G., El-Haddad, I., Baltensperger, U., and Prévôt, A. S. H.: Secondary inorganic aerosols in Europe: sources and the significant influence of biogenic VOC emissions, especially on ammonium nitrate, Atmos. Chem. Phys., 17, 7757–7773, https://doi.org/10.5194/acp-17-7757-2017, 2017.
Andreani-Aksoyoglu, S., Keller, J., Prévôt, A. S. H., Baltensperger, U., and Flemming, J.: Secondary aerosols in Switzerland and northern Italy: Modeling and sensitivity studies for summer 2003, J. Geophys. Res., 113, D06303, https://doi.org/10.1029/2007JD009053, 2008.
Backes, A., Aulinger, A., Bieser, J., Matthias, V., and Quante, M.: Ammonia emissions in Europe, part I: Development of a dynamical ammonia emission inventory, Atmos. Environ., 131, 55–66, https://doi.org/10.1016/j.atmosenv.2016.01.041, 2016.
Banzhaf, S., Schaap, M., Kerschbaumer, A., Reimer, E., Stern, R., van der Swaluw, E., and Builtjes, P.: Implementation and evaluation of pH-dependent cloud chemistry and wet deposition in the chemical transport model REM-Calgrid, Atmos. Environ., 49, 378–390, https://doi.org/10.1016/j.atmosenv.2011.10.069, 2012.
Behera, S. N., Sharma, M., Aneja, V. P., and Balasubramanian, R.: Ammonia in the atmosphere: a review on emission sources, atmospheric chemistry and deposition on terrestrial bodies, Environ. Sci. Pollut. R., 20, 8092–8131, https://doi.org/10.1007/s11356-013-2051-9, 2013.
Bieser, J., Aulinger, A., Matthias, V., Quante, M., and Denier van der Gon, H. A. C.: Vertical emission profiles for Europe based on plume rise calculations, Environ. Pollut., 159, 2935–2946, https://doi.org/10.1016/j.envpol.2011.04.030, 2011.
Ciarelli, G., Aksoyoglu, S., Crippa, M., Jimenez, J.-L., Nemitz, E., Sellegri, K., Äijälä, M., Carbone, S., Mohr, C., O'Dowd, C., Poulain, L., Baltensperger, U., and Prévôt, A. S. H.: Evaluation of European air quality modelled by CAMx including the volatility basis set scheme, Atmos. Chem. Phys., 16, 10313–10332, https://doi.org/10.5194/acp-16-10313-2016, 2016.
Ciarelli, G., Theobald, M. R., Vivanco, M. G., Beekmann, M., Aas, W., Andersson, C., Bergström, R., Manders-Groot, A., Couvidat, F., Mircea, M., Tsyro, S., Fagerli, H., Mar, K., Raffort, V., Roustan, Y., Pay, M.-T., Schaap, M., Kranenburg, R., Adani, M., Briganti, G., Cappelletti, A., D'Isidoro, M., Cuvelier, C., Cholakian, A., Bessagnet, B., Wind, P., and Colette, A.: Trends of inorganic and organic aerosols and precursor gases in Europe: insights from the EURODELTA multi-model experiment over the 1990–2010 period, Geosci. Model Dev., 12, 4923–4954, https://doi.org/10.5194/gmd-12-4923-2019, 2019.
Colette, A., Aas, W., Banin, L., Braban, C. F., Ferm, M., González Ortiz, A., Ilyin, I., Mar, K., Pandolfi, M., Putaud, J.-P., Shatalov, V., Solberg, S., Spindler, G., Tarasova, O., Vana, M., Adani, M., Almodovar, P., Berton, E., Bessagnet, B., Bohlin-Nizzetto, P., Boruvkova, J., Breivik, K., Briganti, G., Cappelletti, A., Cuvelier, K., Derwent, R., D'Isidoro, M., Fagerli, H., Funk, C., Garcia Vivanco, M., Haeuber, R., Hueglin, C., Jenkins, S., Kerr, J., de Leeuw, F., Lynch, J., Manders, A., Mircea, M., Pay, M. T., Pritula, D., Querol, X., Raffort, V., Reiss, I., Roustan, Y., Sauvage, S., Scavo, K., Simpson, D., Smith, R. I., Tang, Y. S., Theobald, M., Tørseth, K., Tsyro, S., van Pul, A., Vidic, S., Wallasch, M., and Wind, P.: Air pollution trends in the EMEP region between 1990 and 2012 EMEP: CCCP Report 1/2016, available at: https://projects.nilu.no/ccc/reports/cccr1-2016.pdf (last access: 10 December 2020), NILU, Oslo, 2016.
Colette, A., Andersson, C., Manders, A., Mar, K., Mircea, M., Pay, M.-T., Raffort, V., Tsyro, S., Cuvelier, C., Adani, M., Bessagnet, B., Bergström, R., Briganti, G., Butler, T., Cappelletti, A., Couvidat, F., D'Isidoro, M., Doumbia, T., Fagerli, H., Granier, C., Heyes, C., Klimont, Z., Ojha, N., Otero, N., Schaap, M., Sindelarova, K., Stegehuis, A. I., Roustan, Y., Vautard, R., van Meijgaard, E., Vivanco, M. G., and Wind, P.: EURODELTA-Trends, a multi-model experiment of air quality hindcast in Europe over 1990–2010, Geosci. Model Dev., 10, 3255–3276, https://doi.org/10.5194/gmd-10-3255-2017, 2017.
EEA: The impact of international shipping on European air quality and climate forcing, European Environment Agency, Copenhagen, Technical Report No 4/2013, 2013.
Flechard, C. R., Nemitz, E., Smith, R. I., Fowler, D., Vermeulen, A. T., Bleeker, A., Erisman, J. W., Simpson, D., Zhang, L., Tang, Y. S., and Sutton, M. A.: Dry deposition of reactive nitrogen to European ecosystems: a comparison of inferential models across the NitroEurope network, Atmos. Chem. Phys., 11, 2703–2728, https://doi.org/10.5194/acp-11-2703-2011, 2011.
Fowler, D., Pilegaard, K., Sutton, M. A., Ambus, P., Raivonen, M., Duyzer, J., Simpson, D., Fagerli, H., Fuzzi, S., Schjoerring, J. K., Granier, C., Neftel, A., Isaksen, I. S. A., Laj, P., Maione, M., Monks, P. S., Burkhardt, J., Daemmgen, U., Neirynck, J., Personne, E., Wichink-Kruit, R., Butterbach-Bahl, K., Flechard, C., Tuovinen, J. P., Coyle, M., Gerosa, G., Loubet, B., Altimir, N., Gruenhage, L., Ammann, C., Cieslik, S., Paoletti, E., Mikkelsen, T. N., Ro-Poulsen, H., Cellier, P., Cape, J. N., Horváth, L., Loreto, F., Niinemets, Ü., Palmer, P. I., Rinne, J., Misztal, P., Nemitz, E., Nilsson, D., Pryor, S., Gallagher, M. W., Vesala, T., Skiba, U., Brüggemann, N., Zechmeister-Boltenstern, S., Williams, J., O'Dowd, C., Facchini, M. C., de Leeuw, G., Flossman, A., Chaumerliac, N., and Erisman, J. W.: Atmospheric composition change: Ecosystems–Atmosphere interactions, Atmos. Environ., 43, 5193–5267, https://doi.org/10.1016/j.atmosenv.2009.07.068, 2009.
Fowler, D., Steadman, C. E., Stevenson, D., Coyle, M., Rees, R. M., Skiba, U. M., Sutton, M. A., Cape, J. N., Dore, A. J., Vieno, M., Simpson, D., Zaehle, S., Stocker, B. D., Rinaldi, M., Facchini, M. C., Flechard, C. R., Nemitz, E., Twigg, M., Erisman, J. W., Butterbach-Bahl, K., and Galloway, J. N.: Effects of global change during the 21st century on the nitrogen cycle, Atmos. Chem. Phys., 15, 13849–13893, https://doi.org/10.5194/acp-15-13849-2015, 2015.
Guenther, A. B., Jiang, X., Heald, C. L., Sakulyanontvittaya, T., Duhl, T., Emmons, L. K., and Wang, X.: The Model of Emissions of Gases and Aerosols from Nature version 2.1 (MEGAN2.1): an extended and updated framework for modeling biogenic emissions, Geosci. Model Dev., 5, 1471–1492, https://doi.org/10.5194/gmd-5-1471-2012, 2012.
Guerreiro, C. B. B., Foltescu, V., and de Leeuw, F.: Air quality status and trends in Europe, Atmos. Environ., 98, 376–384, https://doi.org/10.1016/j.atmosenv.2014.09.017, 2014.
Hendriks, C., Kranenburg, R., Kuenen, J. J. P., Van den Bril, B., Verguts, V., and Schaap, M.: Ammonia emission time profiles based on manure transport data improve ammonia modelling across north western Europe, Atmos. Environ., 131, 83–96, https://doi.org/10.1016/j.atmosenv.2016.01.043, 2016.
Hildebrandt Ruiz, L. and Yarwood, G.: Interactions between Organic Aerosol and NOy: Influence on Oxidant Production., Prepared for the Texas AQRP (Project 12-012), University of Texas at Austin, and ENVIRON International Corporation, Novato, CA, 2013.
Huijsmans, J. F. M., Vermeulen, G. D., Hol, J. M. G., and Goedhart, P. W.: A model for estimating seasonal trends of ammonia emission from cattle manure applied to grassland in the Netherlands, Atmos. Environ., 173, 231–238, https://doi.org/10.1016/j.atmosenv.2017.10.050, 2018.
Jiang, J., Aksoyoglu, S., Ciarelli, G., Baltensperger, U., and Prévôt, A. S. H.: Changes in ozone and PM2.5 in Europe during the period of 1990–2030: Role of reductions in land and ship emissions, Sci. Total Environ., 741, 140467, https://doi.org/10.1016/j.scitotenv.2020.140467, 2020.
Jones, L., Provins, A., Holland, M., Mills, G., Hayes, F., Emmett, B., Hall, J., Sheppard, L., Smith, R., Sutton, M., Hicks, K., Ashmore, M., Haines-Young, R., and Harper-Simmonds, L.: A review and application of the evidence for nitrogen impacts on ecosystem services, Ecosyst. Serv., 7, 76–88, https://doi.org/10.1016/j.ecoser.2013.09.001, 2014.
Jonson, J. E., Jalkanen, J. P., Johansson, L., Gauss, M., and Denier van der Gon, H. A. C.: Model calculations of the effects of present and future emissions of air pollutants from shipping in the Baltic Sea and the North Sea, Atmos. Chem. Phys., 15, 783–798, https://doi.org/10.5194/acp-15-783-2015, 2015.
Jonson, J. E., Gauss, M., Jalkanen, J.-P., and Johansson, L.: Effects of strengthening the Baltic Sea ECA regulations, Atmos. Chem. Phys., 19, 13469–13487, https://doi.org/10.5194/acp-19-13469-2019, 2019.
Karl, M., Jonson, J. E., Uppstu, A., Aulinger, A., Prank, M., Sofiev, M., Jalkanen, J.-P., Johansson, L., Quante, M., and Matthias, V.: Effects of ship emissions on air quality in the Baltic Sea region simulated with three different chemistry transport models, Atmos. Chem. Phys., 19, 7019–7053, https://doi.org/10.5194/acp-19-7019-2019, 2019.
NEC: National Emission Ceilings (NEC) Directive reporting status, Briefing no. 2/2019, PDF TH-AM-19-003-EN-N, available at: https://www.eea.europa.eu/themes/air/air-pollution-sources-1/national-emission-ceilings/nec-directive-reporting-status-2019 (last access: 10 December 2020), 2019.
Nenes, A., Pandis, S. N., and Pilinis, C.: ISORROPIA: A new thermodynamic equilibrium model for multiphase multicomponent inorganic aerosols, Aquat. Geochem., 4, 123–152, 1998.
Pay, M. T., Jiménez-Guerrero, P., and Baldasano, J. M.: Assessing sensitivity regimes of secondary inorganic aerosol formation in Europe with the CALIOPE-EU modeling system, Atmos. Environ., 51, 146–164, https://doi.org/10.1016/j.atmosenv.2012.01.027, 2012.
Pay, M. T., Gangoiti, G., Guevara, M., Napelenok, S., Querol, X., Jorba, O., and Pérez García-Pando, C.: Ozone source apportionment during peak summer events over southwestern Europe, Atmos. Chem. Phys., 19, 5467–5494, https://doi.org/10.5194/acp-19-5467-2019, 2019.
Ramboll: User's Guide: The Comprehensive Air Quality Model With Extensions (CAMx) Version 6.5, Ramboll, California, 2018.
Roth, T., Kohli, L., Rihm, B., Amrhein, V., and Achermann, B.: Nitrogen deposition and multi-dimensional plant diversity at the landscape scale, Roy. Soc. Open Sci., 2, 150017, https://doi.org/10.1098/rsos.150017, 2015.
Seinfeld, J. H. and Pandis, S. N.: Atmospheric Chemistry and Physics: From Air Pollution to Climate Change, Wiley, Hoboken (New Jersey), 2012.
Simpson, D., Aas, W., Bartnicki, J., Berge, H., Bleeker, A., Cuvelier, K., Dentener, F., Dore, T., Erisman, J. W., Fagerli, H., Flechard, C., Hertel, O., van Jaarsveld, H., Jenkin, M., Schaap, M., Semeena, V. S., Thunis, P., Vautard, R., and Vieno, M.: Atmospheric transport and deposition of reactive nitrogen in Europe, in: The European Nitrogen Assessment: Sources, Effects and Policy Perspectives, edited by: Bleeker, A., Grizzetti, B., Howard, C. M., Billen, G., van Grinsven, H., Erisman, J. W., Sutton, M. A., and Grennfelt, P., Cambridge University Press, Cambridge, 298–316, 2011.
Simpson, D., Benedictow, A., Berge, H., Bergström, R., Emberson, L. D., Fagerli, H., Flechard, C. R., Hayman, G. D., Gauss, M., Jonson, J. E., Jenkin, M. E., Nyíri, A., Richter, C., Semeena, V. S., Tsyro, S., Tuovinen, J.-P., Valdebenito, Á., and Wind, P.: The EMEP MSC-W chemical transport model – technical description, Atmos. Chem. Phys., 12, 7825–7865, https://doi.org/10.5194/acp-12-7825-2012, 2012.
Simpson, D., Andersson, C., Christensen, J. H., Engardt, M., Geels, C., Nyiri, A., Posch, M., Soares, J., Sofiev, M., Wind, P., and Langner, J.: Impacts of climate and emission changes on nitrogen deposition in Europe: a multi-model study, Atmos. Chem. Phys., 14, 6995–7017, https://doi.org/10.5194/acp-14-6995-2014, 2014.
Skjøth, C. A., Geels, C., Berge, H., Gyldenkærne, S., Fagerli, H., Ellermann, T., Frohn, L. M., Christensen, J., Hansen, K. M., Hansen, K., and Hertel, O.: Spatial and temporal variations in ammonia emissions – a freely accessible model code for Europe, Atmos. Chem. Phys., 11, 5221–5236, https://doi.org/10.5194/acp-11-5221-2011, 2011.
Sutton, M. A., Reis, S., Riddick, S. N., Dragosits, U., Nemitz, E., Theobald, M. R., Tang, Y. S., Braban, C. F., Vieno, M., Dore, A. J., Mitchell, R. F., Wanless, S., Daunt, F., Fowler, D., Blackall, T. D., Milford, C., Flechard, C. R., Loubet, B., Massad, R., Cellier, P., Personne, E., Coheur, P. F., Clarisse, L., Van Damme, M., Ngadi, Y., Clerbaux, C., Skjøth, C. A., Geels, C., Hertel, O., Wichink Kruit, R. J., Pinder, R. W., Bash, J. O., Walker, J. T., Simpson, D., Horvath, L., Misselbrook, T. H., Bleeker, A., Dentener, F., and de Vries, W.: Towards a climate-dependent paradigm of ammonia emission and deposition, Phil. T. R. Soc. B, 368, 20130166, https://doi.org/10.1098/rstb.2013.0166, 2013.
Theobald, M. R., Vivanco, M. G., Aas, W., Andersson, C., Ciarelli, G., Couvidat, F., Cuvelier, K., Manders, A., Mircea, M., Pay, M.-T., Tsyro, S., Adani, M., Bergström, R., Bessagnet, B., Briganti, G., Cappelletti, A., D'Isidoro, M., Fagerli, H., Mar, K., Otero, N., Raffort, V., Roustan, Y., Schaap, M., Wind, P., and Colette, A.: An evaluation of European nitrogen and sulfur wet deposition and their trends estimated by six chemistry transport models for the period 1990–2010, Atmos. Chem. Phys., 19, 379–405, https://doi.org/10.5194/acp-19-379-2019, 2019.
Toscano, D. and Murena, F.: Atmospheric ship emissions in ports: A review. Correlation with data of ship traffic, Atmos. Environ., 4, 100050, https://doi.org/10.1016/j.aeaoa.2019.100050, 2019.
UNECE: The 1999 Gothenburg Protocol to Abate Acidification, Eutrophication and Ground-level Ozone, available at: http://www.unece.org/env/lrtap/multi_h1.html (last access: 10 December 2020), 1999.
UNECE: Assessment report on ammonia – 2019, available at: https://www.unece.org/fileadmin/DAM/env/documents/2019/AIR/EMEP_WGE_Joint_Session/Assessment_Report_on_Ammonia_20190827.pdf (last access: 16 December 2020), First draft August 2019.
van Zanten, M. C., Wichink Kruit, R. J., Hoogerbrugge, R., Van der Swaluw, E., and van Pul, W. A. J.: Trends in ammonia measurements in the Netherlands over the period 1993–2014, Atmos. Environ., 148, 352–360, https://doi.org/10.1016/j.atmosenv.2016.11.007, 2017.
Viana, M., Hammingh, P., Colette, A., Querol, X., Degraeuwe, B., Vlieger, I., and Aardenne, J.: Impact of maritime transport emissions on coastal air quality in Europe, Atmos. Environ., 90, 96–105, https://doi.org/10.1016/j.atmosenv.2014.03.046, 2014.
Vivanco, M. G., Theobald, M. R., García-Gómez, H., Garrido, J. L., Prank, M., Aas, W., Adani, M., Alyuz, U., Andersson, C., Bellasio, R., Bessagnet, B., Bianconi, R., Bieser, J., Brandt, J., Briganti, G., Cappelletti, A., Curci, G., Christensen, J. H., Colette, A., Couvidat, F., Cuvelier, C., D'Isidoro, M., Flemming, J., Fraser, A., Geels, C., Hansen, K. M., Hogrefe, C., Im, U., Jorba, O., Kitwiroon, N., Manders, A., Mircea, M., Otero, N., Pay, M.-T., Pozzoli, L., Solazzo, E., Tsyro, S., Unal, A., Wind, P., and Galmarini, S.: Modeled deposition of nitrogen and sulfur in Europe estimated by 14 air quality model systems: evaluation, effects of changes in emissions and implications for habitat protection, Atmos. Chem. Phys., 18, 10199–10218, https://doi.org/10.5194/acp-18-10199-2018, 2018.
Wichink Kruit, R. J., Schaap, M., Sauter, F. J., van Zanten, M. C., and van Pul, W. A. J.: Modeling the distribution of ammonia across Europe including bi-directional surface–atmosphere exchange, Biogeosciences, 9, 5261–5277, https://doi.org/10.5194/bg-9-5261-2012, 2012.
Wichink Kruit, R. J., Aben, J., de Vries, W., Sauter, F., van der Swaluw, E., van Zanten, M. C., and van Pul, W. A. J.: Modelling trends in ammonia in the Netherlands over the 1990–2014, Atmos. Environ., 154, 20–30, https://doi.org/10.1016/j.atmosenv.2017.01.031, 2017.
Zhang, L., Brook, J. R., and Vet, R.: A revised parameterization for gaseous dry deposition in air-quality models, Atmos. Chem. Phys., 3, 2067–2082, https://doi.org/10.5194/acp-3-2067-2003, 2003.
Zhang, L., Wright, L. P., and Asman, W. A. H.: Bi-directional air-surface exchange of atmospheric ammonia: A review of measurements and a development of a big-leaf model for applications in regional-scale air-quality models, J. Geophys. Res., 115, D20310, https://doi.org/10.1029/2009JD013589, 2010.