the Creative Commons Attribution 4.0 License.
the Creative Commons Attribution 4.0 License.
 | 11 Dec 2020
Technical note: Lowermost-stratosphere moist bias in ECMWF IFS model diagnosed from airborne GLORIA observations during winter–spring 2016
Wolfgang Woiwode
Andreas Dörnbrack
Inna Polichtchouk
Sören Johansson
Ben Harvey
Michael Höpfner
Jörn Ungermann
Felix Friedl-Vallon
Numerical weather forecast systems like the ECMWF IFS (European Centre for Medium-Range Weather Forecasts – Integrated Forecasting System) are known to be affected by a moist bias in the extratropical lowermost stratosphere (LMS) which results in a systematic cold bias there. We use high-spatial-resolution water vapor measurements by the airborne infrared limb-imager GLORIA (Gimballed Limb Observer for Radiance Imaging of the Atmosphere) during the PGS (POLSTRACC/GW-LCYCLE-II/SALSA) campaign to study the LMS moist bias in ECMWF analyses and 12 h forecasts from January to March 2016. Thereby, we exploit the two-dimensional observational capabilities of GLORIA, when compared to in situ observations, and the higher vertical and horizontal resolution, when compared to satellite observations. Using GLORIA observations taken during five flights in the polar sub-vortex region around Scandinavia and Greenland, we diagnose a systematic moist bias in the LMS exceeding +50 % (January) to +30 % (March) at potential vorticity levels from 10 PVU (∼ highest level accessed with suitable coverage) to 7 PVU. In the diagnosed time period, the moist bias decreases at the highest and driest air masses observed but clearly persists at lower levels until mid-March. Sensitivity experiments with more frequent temporal output, and lower or higher horizontal and vertical resolution, show the short-term forecasts to be practically insensitive to these parameters on timescales of < 12 h. Our results confirm that the diagnosed moist bias is already present in the initial conditions (i.e., the analysis) and thus support the hypothesis that the cold bias develops as a result of forecast initialization. The moist bias in the analysis might be explained by a model bias together with the lack of water vapor observations suitable for assimilation above the tropopause.
- Article
(4751 KB) - Full-text XML
- BibTeX
- EndNote


Accurate representation of water vapor in the lowermost stratosphere (LMS) is important for numerical weather forecasting and climate simulations. Water vapor mixing ratios in the tropopause region affect the temperature distribution and the location of the thermal tropopause, and hence stratospheric dynamics (Stenke et al., 2008, and references therein). Radiative forcing has been shown to respond sensitively to changes in LMS water vapor mixing ratios (Solomon et al., 2010; Riese et al., 2012). Furthermore, water vapor in the tropopause region controls the formation of high-altitude cirrus clouds and contrails.
Atmospheric general circulation models are known to be affected by a systematic cold bias in the extratropical LMS, which is strongest in the summer hemisphere, but also significant in the winter hemisphere (Gates et al., 1999; Stenke et al., 2008, and references therein). The cold bias is known to be the consequence of a moist bias which results in too strong longwave cooling. State-of-the-art high-resolution numerical weather prediction systems such as the ECMWF IFS (European Centre for Medium-Range Weather Forecasts – Integrated Forecast System) are also affected by this cold bias (Hogan et al., 2017; Shepherd et al., 2018) at all forecast ranges and at all resolutions. As specific humidity observations are not assimilated above the tropopause, accurate observations of water vapor in the LMS with wide coverage and high spatial resolution are required to validate analyses and forecasts and to aid in model development.
Airborne remote sensing observations using lidar or infrared limb sounding fill the observational “gap” between focused in situ and global satellite observations in terms of spatial coverage and resolution. They allow the study of mesoscale water vapor distributions across the tropopause with high vertical and horizontal resolution (e.g., Flentje et al., 2005; Ungermann et al., 2012; Schäfler et al., 2018; Woiwode et al., 2018). Here, we use observations by the infrared limb imager GLORIA (Gimballed Limb Observer for Radiance Imaging of the Atmosphere) (Friedl-Vallon et al., 2014; Riese et al., 2014) to quantify the LMS moist bias under Arctic winter and spring conditions. In particular, we investigate the development of the moist bias from January to March 2016. For a flight on 26 February 2016, we furthermore discuss moist bias sensitivity in short 12 h forecasts with more frequent temporal output and lower or higher horizontal and vertical resolutions. In Sect. 2, we introduce the data and diagnostics used. The results are presented in Sect. 3, and discussed in Sect. 4. Conclusions are given in Sect. 5.
2.1 GLORIA observations in Arctic winter 2015/16
GLORIA is an airborne thermal infrared limb-imaging Fourier transform spectrometer (Friedl-Vallon et al., 2014). It was deployed on board the German High Altitude and Long Range Research Aircraft (HALO) during the combined PGS (POLSTRACC/GW-LCYCLE II/SALSA) field campaign in the Arctic winter 2015/16 (Oelhaf et al., 2019). The PGS campaign was designated to study the polar stratosphere in a changing climate, the life cycle of gravity waves, and the seasonality of air mass transport and composition in the LMS. Based in Oberpfaffenhofen (Germany) and Kiruna (Sweden), HALO enabled maximum flight distances exceeding ∼ 8000 km and ceiling altitudes exceeding ∼ 14 km.
GLORIA measures infrared spectra in the spectral range from 780 to 1400 cm−1 and views to the right-hand side of the flight track. From the spectra, vertical profiles of temperature, trace gases, and cloud parameters are retrieved. Here, we use GLORIA observations in the high-spectral-resolution “chemistry mode” which involves a spectral sampling of 0.0625 cm−1 and an associated horizontal sampling of ∼ 3 km. The water vapor data are characterized by a typical vertical resolution of 400–700 m and combined random and systematic 1σ errors of typically 10 %–20 % (Johansson et al., 2018a). The errors are expected to cancel out mostly when the data are analyzed as an ensemble (e.g., in correlation analyses). As analyzed by Johansson et al. (2018a), the median difference and the median absolute deviation between GLORIA and FISH (Fast In situ Stratospheric Hygrometer, Zöger et al., 1999; Meyer et al., 2015) in situ water vapor observations in the upper troposphere–lowermost stratosphere (UT–LMS) during PGS are only 0.13 and ±0.63 ppmv, respectively. From the water vapor profiles derived from the GLORIA observations, two-dimensional vertical cross sections of water vapor along the HALO flight tracks are constructed.
In the present study, we use GLORIA observations during five Arctic flights. The flights on 12, 18, and 20 January 2016 provide a robust estimate of the LMS moist bias in mid-winter, since extended two-dimensional water vapor distributions associated with independent flights and different meteorological scenarios are analyzed. The flights on 26 February and 13 March 2016 allow us to investigate how the moist bias develops in the late winter and early spring. The choice of the shown data was constrained by the dates of the flights, availability of the GLORIA chemistry mode data, observations under sufficiently cloud-free conditions, and availability of observations within the LMS in the polar sub-vortex region (for explanation of the “sub-vortex” region, see e.g., Werner et al., 2010). In the following, we show two-dimensional vertical cross sections of GLORIA water vapor observations along the HALO flight tracks and compare the observations to the ECMWF system.
2.2 ECMWF IFS data
The ECMWF IFS is a global weather forecasting and analysis system (https://www.ecmwf.int/en/research/modelling-and-prediction, last access: 7 December 2020) based on a semi-Lagrangian hydrostatic formulation. Between 26 June 2013 and 8 March 2016, the high-resolution forecasts and analysis were at TL1279L137 resolution, corresponding to 16 km in the horizontal and 300–400 m in the vertical at the tropopause. On 8 March 2016, the horizontal resolution was upgraded to 9 km (or TCo1279) (Hólm et al., 2016; Malardel and Wedi, 2016), which was made possible by the introduction of a cubic octahedral (TCo) grid (Malardel et al., 2016; see also Wedi, 2014). For comparison to GLORIA observations, we use 00:00 and 12:00 UTC analysis and hourly output from a 12 h deterministic forecast in between the analysis cycles.
In particular, we compare the forecasted specific humidity (qv), converted to volume mixing ratio (parts per million by volume, ppmv), with gas-phase water vapor volume mixing ratios derived from the GLORIA observations. The model output is interpolated in space and time to the geolocations of the tangent points of the GLORIA limb observations. In this manner, vertical cross sections of IFS water vapor corresponding to the vertical cross sections derived from the GLORIA observations are obtained. For vertical assignment of comparable air masses during the winter, we use potential vorticity (PV, unit: PVU) interpolated from the IFS in the same way.
We furthermore perform short (< 12 h) sensitivity forecasts with higher frequency of temporal output (450 s instead of 1 h), lower/higher horizontal resolution (TCo319 or ∼ 36 km, TCo639 or ∼ 18 km, and TCo1279 or ∼ 9 km all on a cubic octahedral grid, instead of the operational TL1279 or ∼ 18 km resolution on the linear grid), and lower/higher vertical resolution (91 and 198 levels instead of 137 levels) to investigate whether the moist bias is sensitive to these model changes. These sensitivity forecasts are performed for comparison with the 26 February 2016 flight and have all been initialized from the operational 4D-Var analysis with the outer loop trajectory performed at TL1279L137 resolution (and the three inner loops are performed at TL399L137, TL319L137, and TL255L137 resolution).
2.3 Data selection and correlation analysis
The first step in our analysis is the identification of flight sections located in the LMS and inside the polar sub-vortex region. To identify sub-vortex air masses, we analyze vertical cross sections of water vapor retrieved from the GLORIA observations and interpolated from the IFS in combination with potential vorticity interpolated from the IFS (Fig. 1). Air masses located in the sub-vortex LMS are characterized by low humidity and a low tropopause. We use the 2 PVU level as an indicator for the dynamical tropopause.
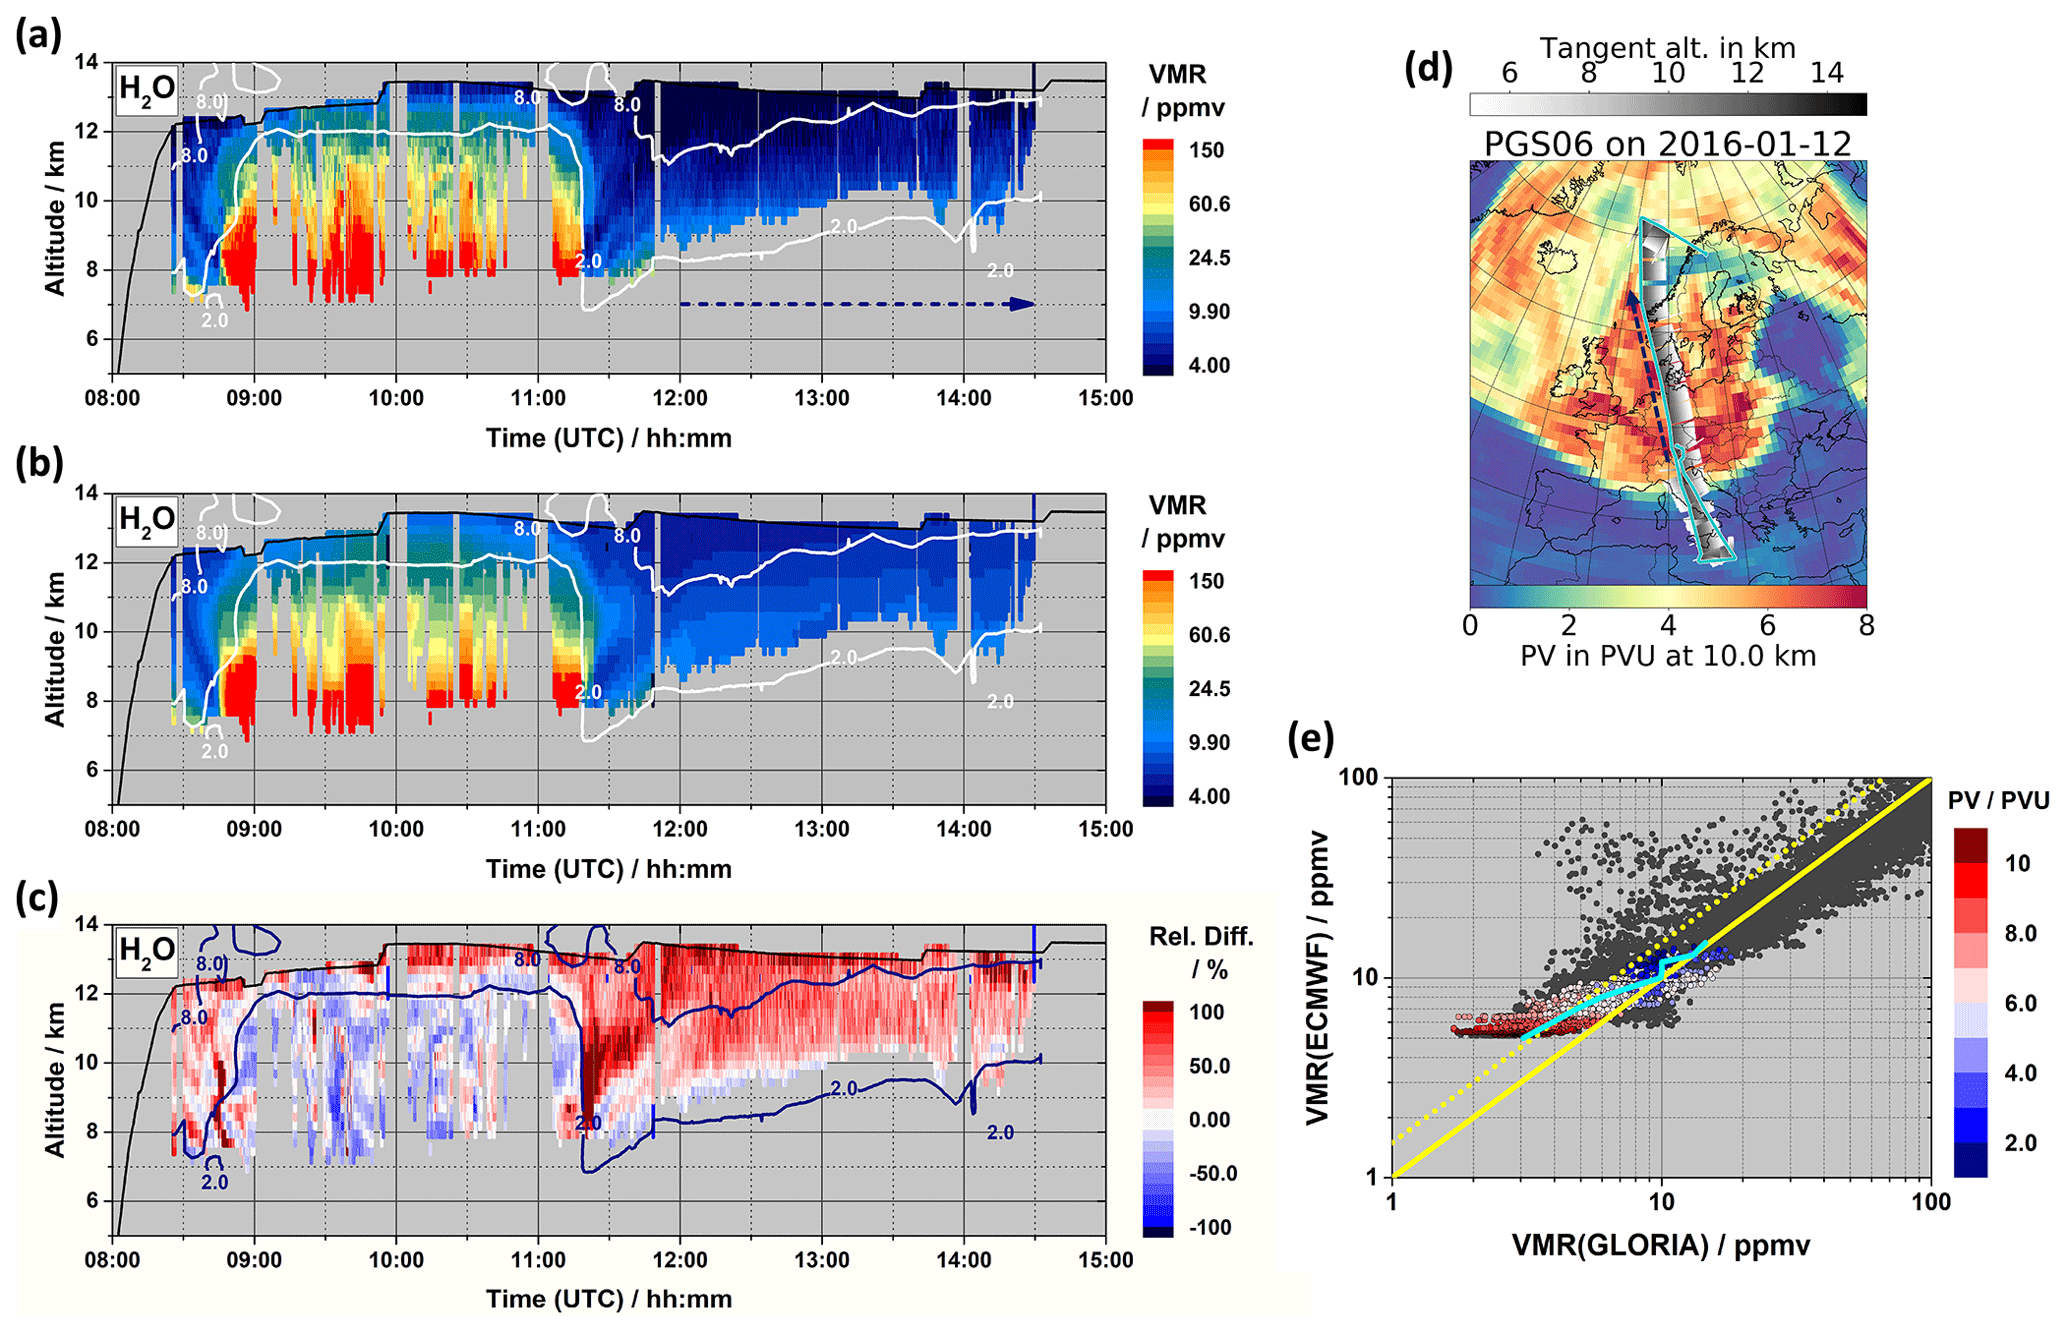
Figure 1Principle of LMS moist bias quantification. Vertical cross section of water vapor during the flight on 12 January 2016 (a) derived from GLORIA observations and (b) forecasted by the IFS. (c) Relative difference of water vapor IFS minus GLORIA. Solid contour lines (white and dark blue, respectively) in panels (a)–(c) indicate the PV levels of 2 and 8 PVU. Black solid lines indicate the flight altitude. (d) Flight path of HALO (cyan), tangent points of GLORIA limb observations (grey to white dots) and PV field at 10 km (contour). (e) Correlation between water vapor IFS and GLORIA (grey). Data points selected for the quantification are color-coded with PV (see flight sections marked by dashed dark blue lines in panels a and d) and average line (cyan). The yellow solid line denotes a 1 : 1 correlation and the yellow dotted line a bias of +50%. Panels (a) and (b) are modified from Woiwode et al. (2018).
Using these parameters, the LMS in the sub-vortex region can be clearly identified in the vertical cross sections and the PV maps, as shown in Fig. 1a–d for the flight on 12 January 2016. To quantify the bias, we use flight sections with the dynamical tropopause being mostly located below 10 km. Regions characterized by strong horizontal gradients are avoided, since certain features may be forecasted in a realistic way but do not exactly coincide with the observed location, thus inducing an overestimation of differences between forecast and observation (compare Fig. 1a–c tropopause fold between 11:00 and 12:00 UTC). The section of the discussed flight used in our analysis is marked by blue dashed arrows in Fig. 1a and d.
The residuals between the vertical cross sections show the moist bias of the ECMWF IFS data relative to the GLORIA observations. For the flight on 12 January 2016, the LMS moist bias can be clearly identified above the tropopause, in particular in the sub-vortex region after 12:00 UTC (Fig. 1c). To quantify the moist bias in the sub-vortex region, we correlate IFS specific humidity with specific humidity measured by GLORIA in the selected flight sections (see Fig. 1e). Vertical assignment of the selected sub-vortex data points is done using the IFS PV data. Using this quantity, dynamically similar air masses can be compared during the course of the winter, which is not possible using for example geometric altitude or potential temperature due to diabatic air mass descent. Furthermore, the mean correlation of the selected data points is shown for quantification (Fig. 1e). Finally, we calculate the mean bias and the standard deviation of the individual data points at selected, rounded levels of potential vorticity. Note that slightly different values are diagnosed here when compared to the mean correlations, since the mean correlations shown in the correlation plots are a function of volume mixing ratio and not potential vorticity. However, the overall conclusions are the same in both cases.
In Fig. 1a–c, we present the GLORIA and IFS data corresponding to the flight on 12 January 2016 and their residuals. During this flight, a wide range of sub-vortex air masses characterized by high PV values (Fig. 1d) were accessed from the Alps to the Arctic Sea after crossing the polar front jet stream. A developed tropopause fold is clearly and consistently identified in both observations and forecast between 11:00 and 12:00 UTC (see also Woiwode et al., 2018). North of the tropopause fold, a lower tropopause and a mostly unperturbed LMS are found in the polar sub-vortex region.
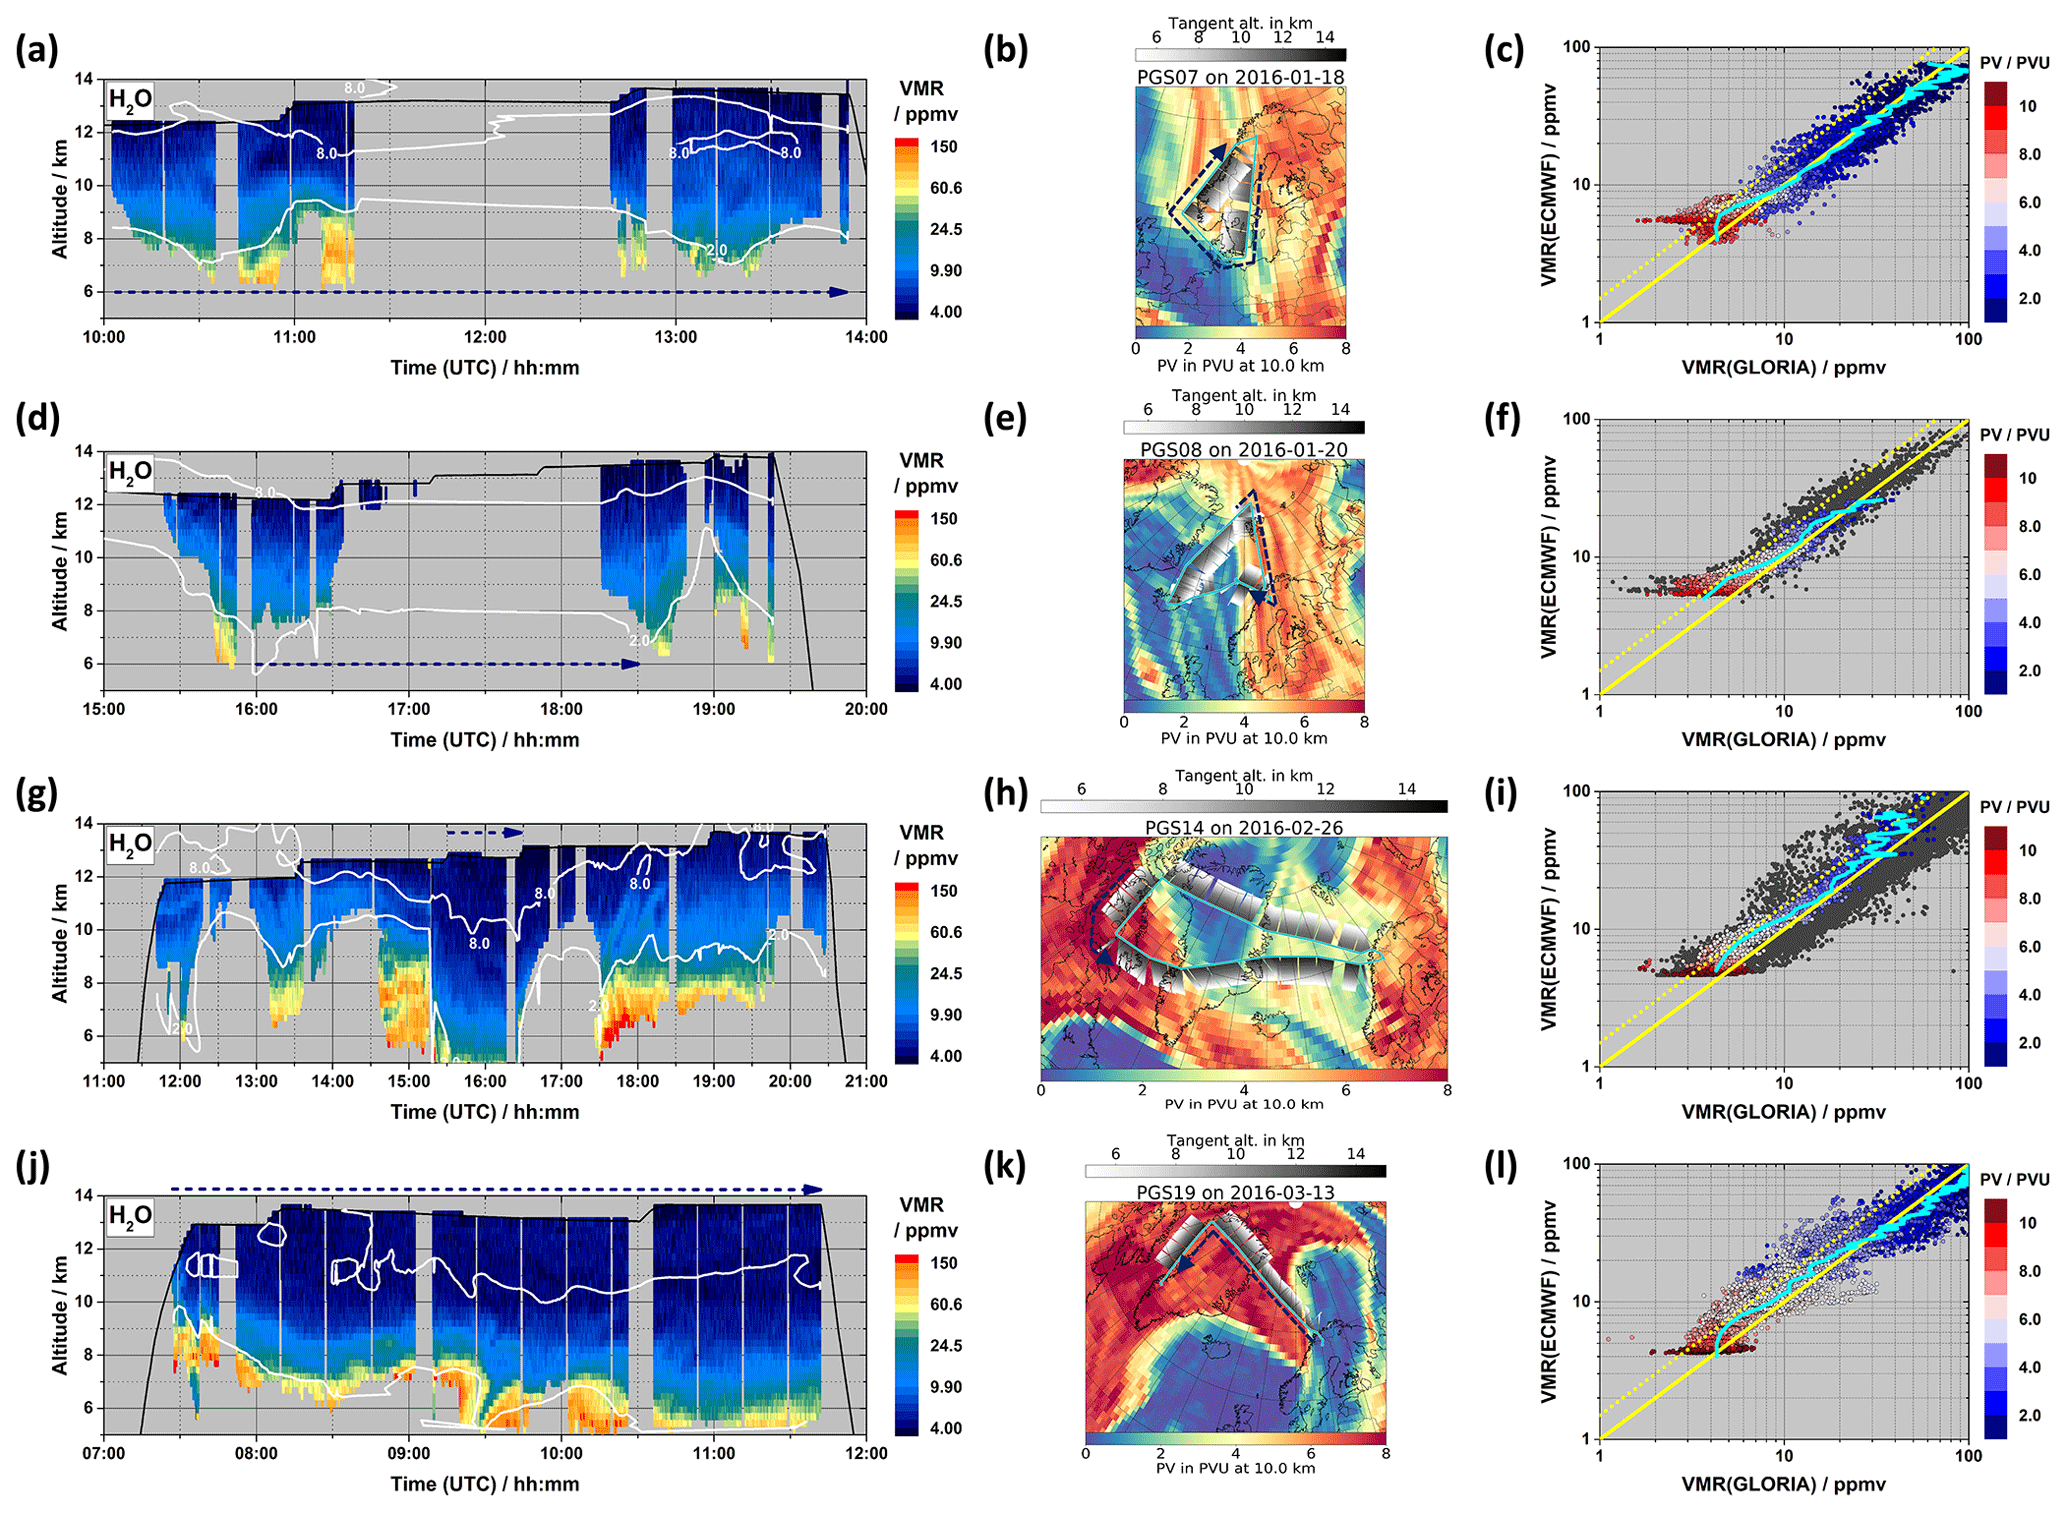
Figure 2LMS moist bias quantification for selected flights from January to March 2016. GLORIA water vapor (left column), flight path and observation geolocations (middle column), and correlation IFS versus GLORIA (right column) for the flights on 18 January 2016, 20 January 2016, 26 February 2016, and 13 March 2016. For legend see Fig. 1.
In the residual, noticeable differences between observation and ECMWF analysis and forecasts are found (Fig. 1c). In the first flight part before 12:00 UTC, positive and negative residuals are mostly a consequence of differences inside the tropopause fold and further mesoscale fine structures. North of the tropopause fold, a relatively homogeneous systematic moist bias is clearly identified. Figure 1e shows the correlation of the selected IFS data with the GLORIA observations. While the whole ensemble of data points (grey) is mostly scattered around the 1 : 1 line (yellow solid line), the color-coded data points beyond 12:00 UTC (see blue arrows in Fig. 1a, d) clearly show the moist bias increasing with PV. The observed average bias slightly exceeds +50 % at 9 to 10 PVU in Fig. 1e. When the data points are filtered for a rounded potential vorticity of 10 PVU, a mean bias of +70 % and a standard deviation of 15 % are diagnosed at the highest and driest levels that were accessed. Note that individual data points scattering to very dry values in the correlation (see also corresponding panels in Fig. 2) are a consequence of scattering of the GLORIA data within their random and systematic uncertainties (see Sect. 2.1) and are not indicative of extreme dehydration events, for example. Such data points are furthermore emphasized due to the large overall number of data points (i.e., overlapping of data points) and the logarithmic scale of the x axes.
Using the same approach, the subsequent flights are analyzed in Fig. 2. The GLORIA observations of the flight on 18 January 2016 (Fig. 2a) were performed in a partly perturbed sub-vortex region, with structures characterized by lower PV stretching into the air volume observed by GLORIA (Fig. 2b). The correlation of the IFS and GLORIA data shows a systematic moist bias of the IFS data, which is lower than during the previous flight. When the data points are filtered for a rounded potential vorticity of 9 PVU, a mean bias of +32 % and a standard deviation of 25 % are diagnosed. The observed decreasing mean bias towards the highest PV values is attributed to the structures from outside the sub-vortex region which are not affected by the moist bias. For the flight on 20 January 2016, again a slightly lower systematic moist bias is found in the IFS data when compared to the flight on 12 January 2016. When the data points are filtered for a rounded potential vorticity of 9 PVU, a mean bias of +45 % and a standard deviation of 19 % are diagnosed.
Note that in situ comparisons with FISH show water vapor mixing ratios measured by GLORIA during PGS until the end of January 2016 to be systematically lower by 0.01 to 0.75 ppmv at flight altitude (Johansson et al., 2018a). Differences between FISH and GLORIA practically cancel out on average in February and March. While the results in January might be partially caused by the different sampling characteristics of the GLORIA limb observations when compared to in situ observations (e.g., GLORIA viewing deeper into sub-vortex air masses in some cases), remaining issues in the calibration of the GLORIA data version used here cannot be excluded. To avoid a potential overestimation of the moist bias peak value in the IFS data in January, we therefore provide a conservative estimate for the flight on 12 January 2016 of > +50 % at 10 PVU instead of the value of +70 % (see above) to account for this potential uncertainty.
At the end of the winter, during the flight on 26 February 2016, largely unperturbed sub-vortex air masses were probed by GLORIA from east Canada to West Greenland (Fig. 2g, h). For the correlation analysis, we use the data points characterized by the strongest downwelling (dashed blue arrows in Fig. 2g, h). Here, the mean moist bias peaks at 7 PVU, stretches down to ∼ 4 PVU, and also decreases towards higher PV values (Fig. 2i). When the data points are filtered for a rounded potential vorticity of 7 PVU (10 PVU), a mean bias of +38 % (+14 %) and a standard deviation of 16 % (14 %) are diagnosed.
During the first flight of the double flight on 13 March 2019 (see Oelhaf et al., 2019; only first flight used in Fig. 2j–l), again largely unperturbed sub-vortex air was probed in early spring. Similar to the previous flight, the average moist bias peaks at lower altitudes. When the data points are filtered for a rounded potential vorticity of 7 PVU (10 PVU), a mean bias of +35 % (+6 %) and a standard deviation of 23 % (11 %) are diagnosed. Recall that the horizontal resolution of the operational high-resolution ECMWF system was upgraded from 18 to 9 km on 8 March 2019. Therefore, the presence of the moist bias for the 13 March 2019 flight indicates that the bias is unaffected by this horizontal resolution upgrade. In all correlation analyses, the average correlation (cyan solid line) is mostly situated close to the 1 : 1 line around and below the dynamical tropopause.
In Fig. 3, an overlay of the mean IFS/GLORIA correlations is shown for all flights except of the flight on 18 January 2016, which is excluded due to the effects of air masses from outside the sub-vortex region (see above). The overlay shows that the moist bias of the IFS data is largest on 12 January 2016 and peaks in the highest and driest air masses accessed by the observations. During the subsequent flights, the mean bias systematically declines in the highest and driest air masses observed. In February and March, the mean bias persists and still approaches peak values exceeding 30 % at a potential vorticity of 7 PVU.
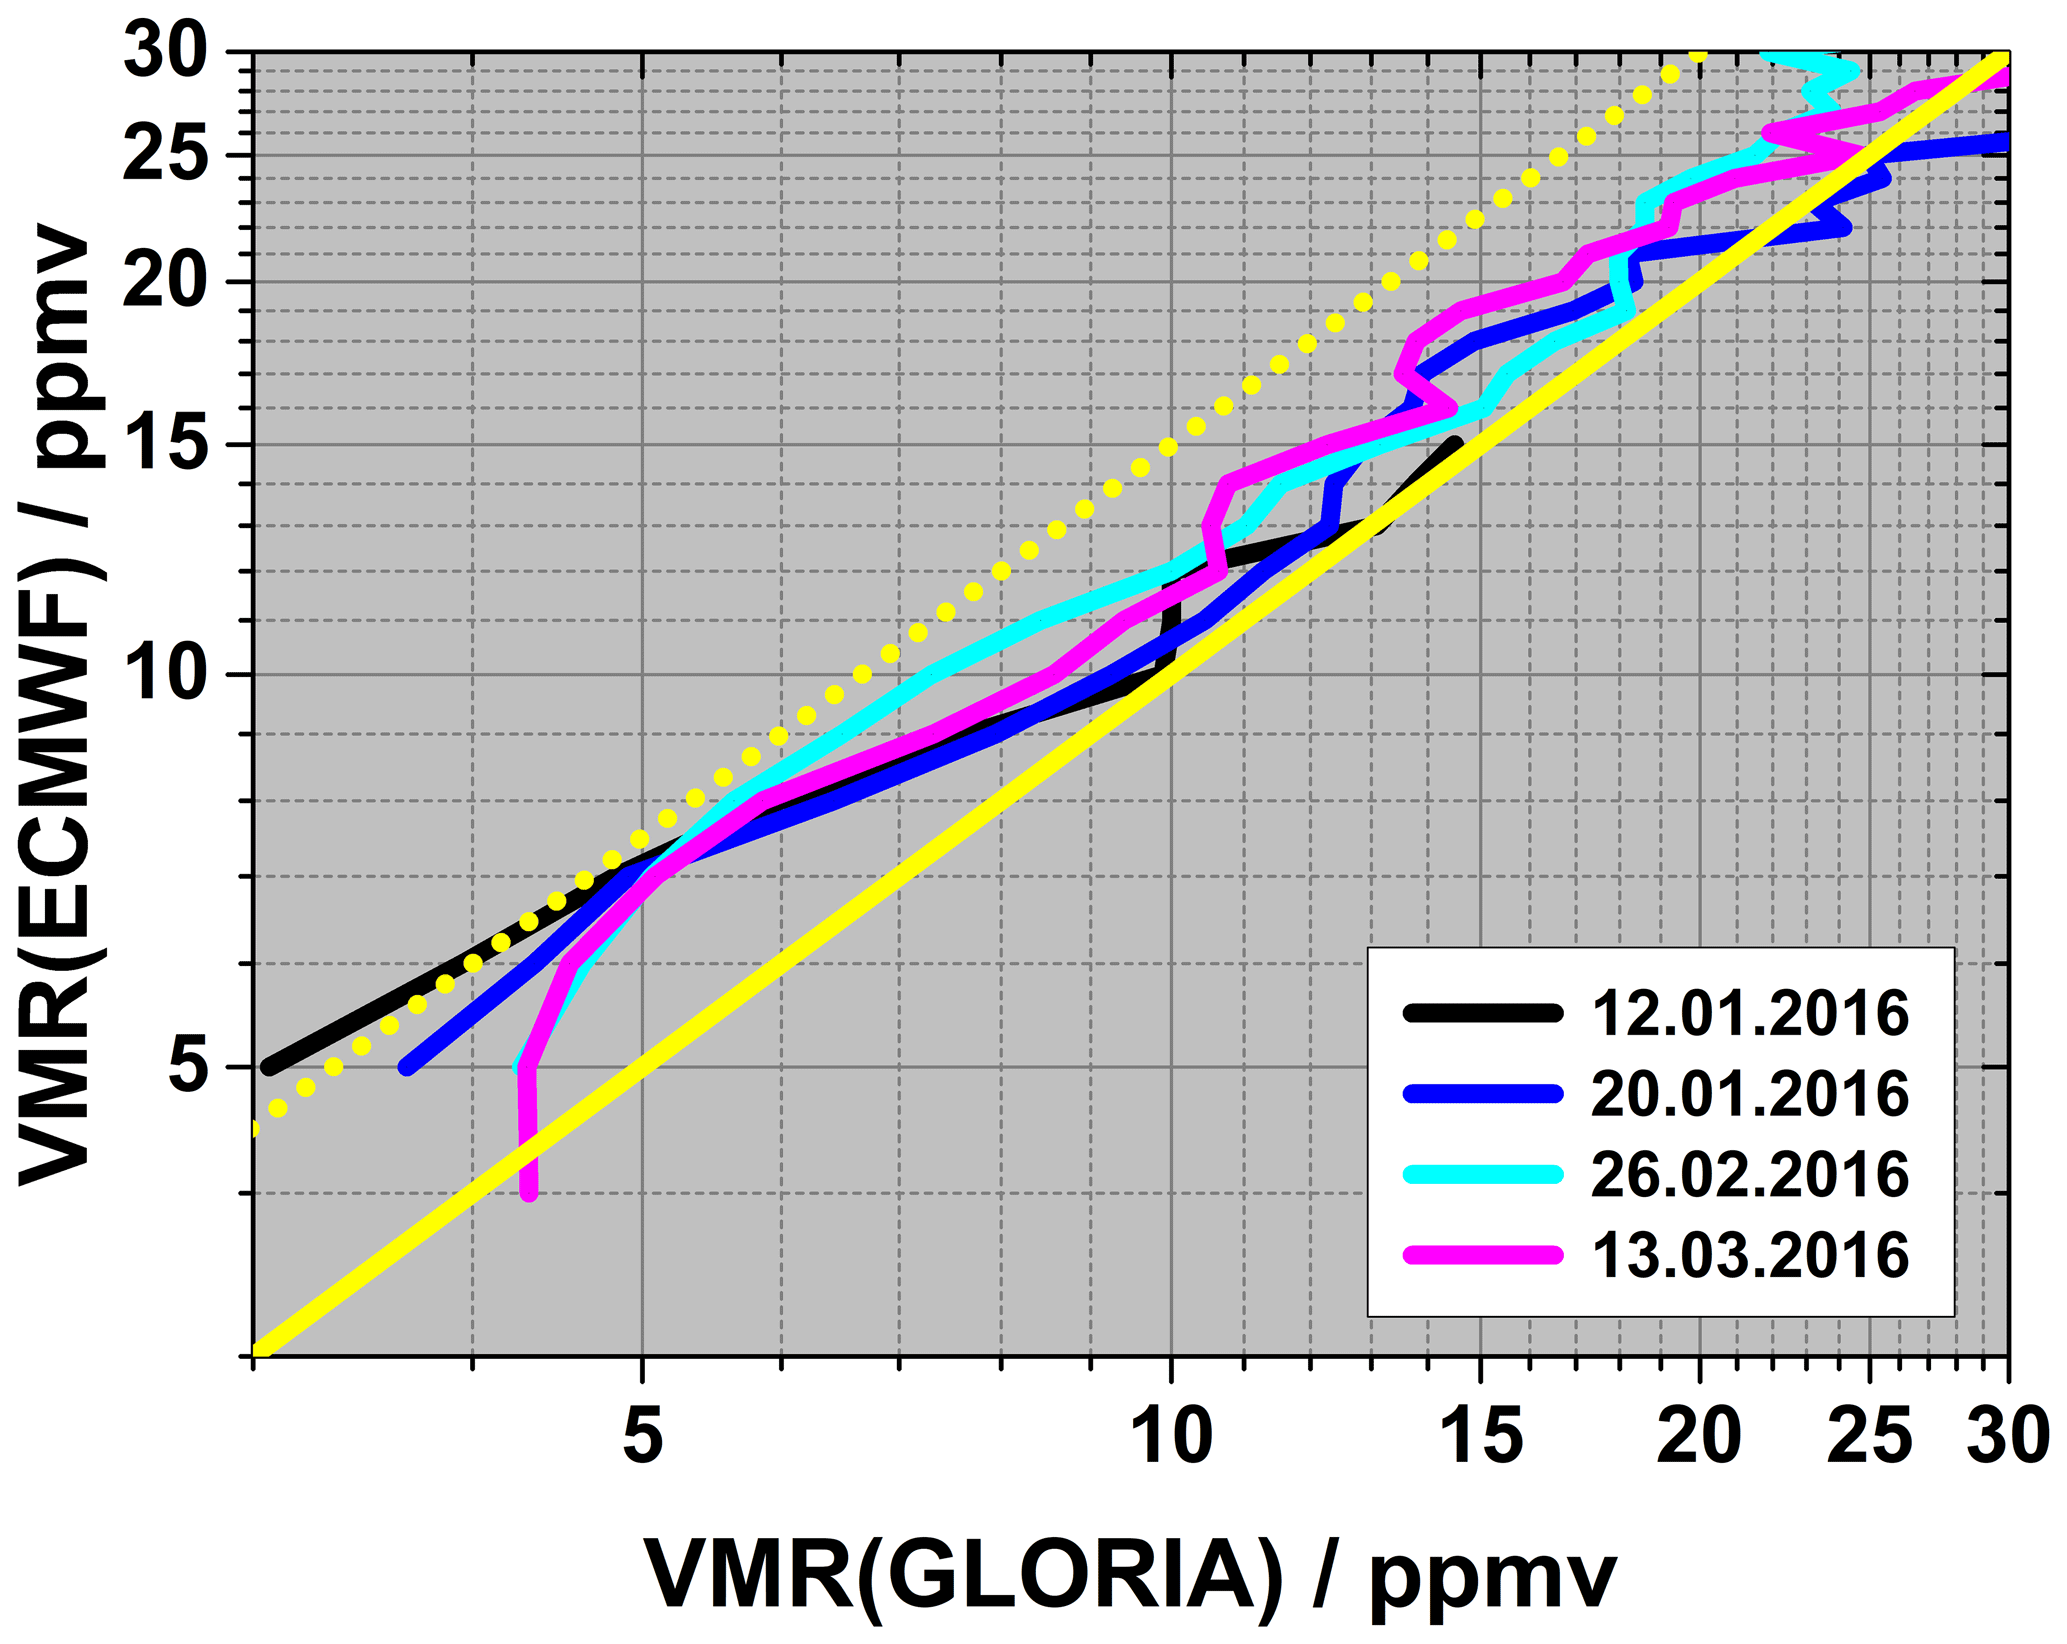
Figure 3Overlay of mean correlations for flights from January to March 2016 (i.e., cyan lines in Figs. 1e and 2f, i, l).
The mean IFS/GLORIA correlations for the 12 h forecast sensitivity experiments for the flight on 26 February 2016 including more frequent temporal output and higher or lower horizontal and vertical resolutions are shown in Fig. 4. None of the experiments notably affect the resulting mean correlation of the analyzed short-term forecasts.
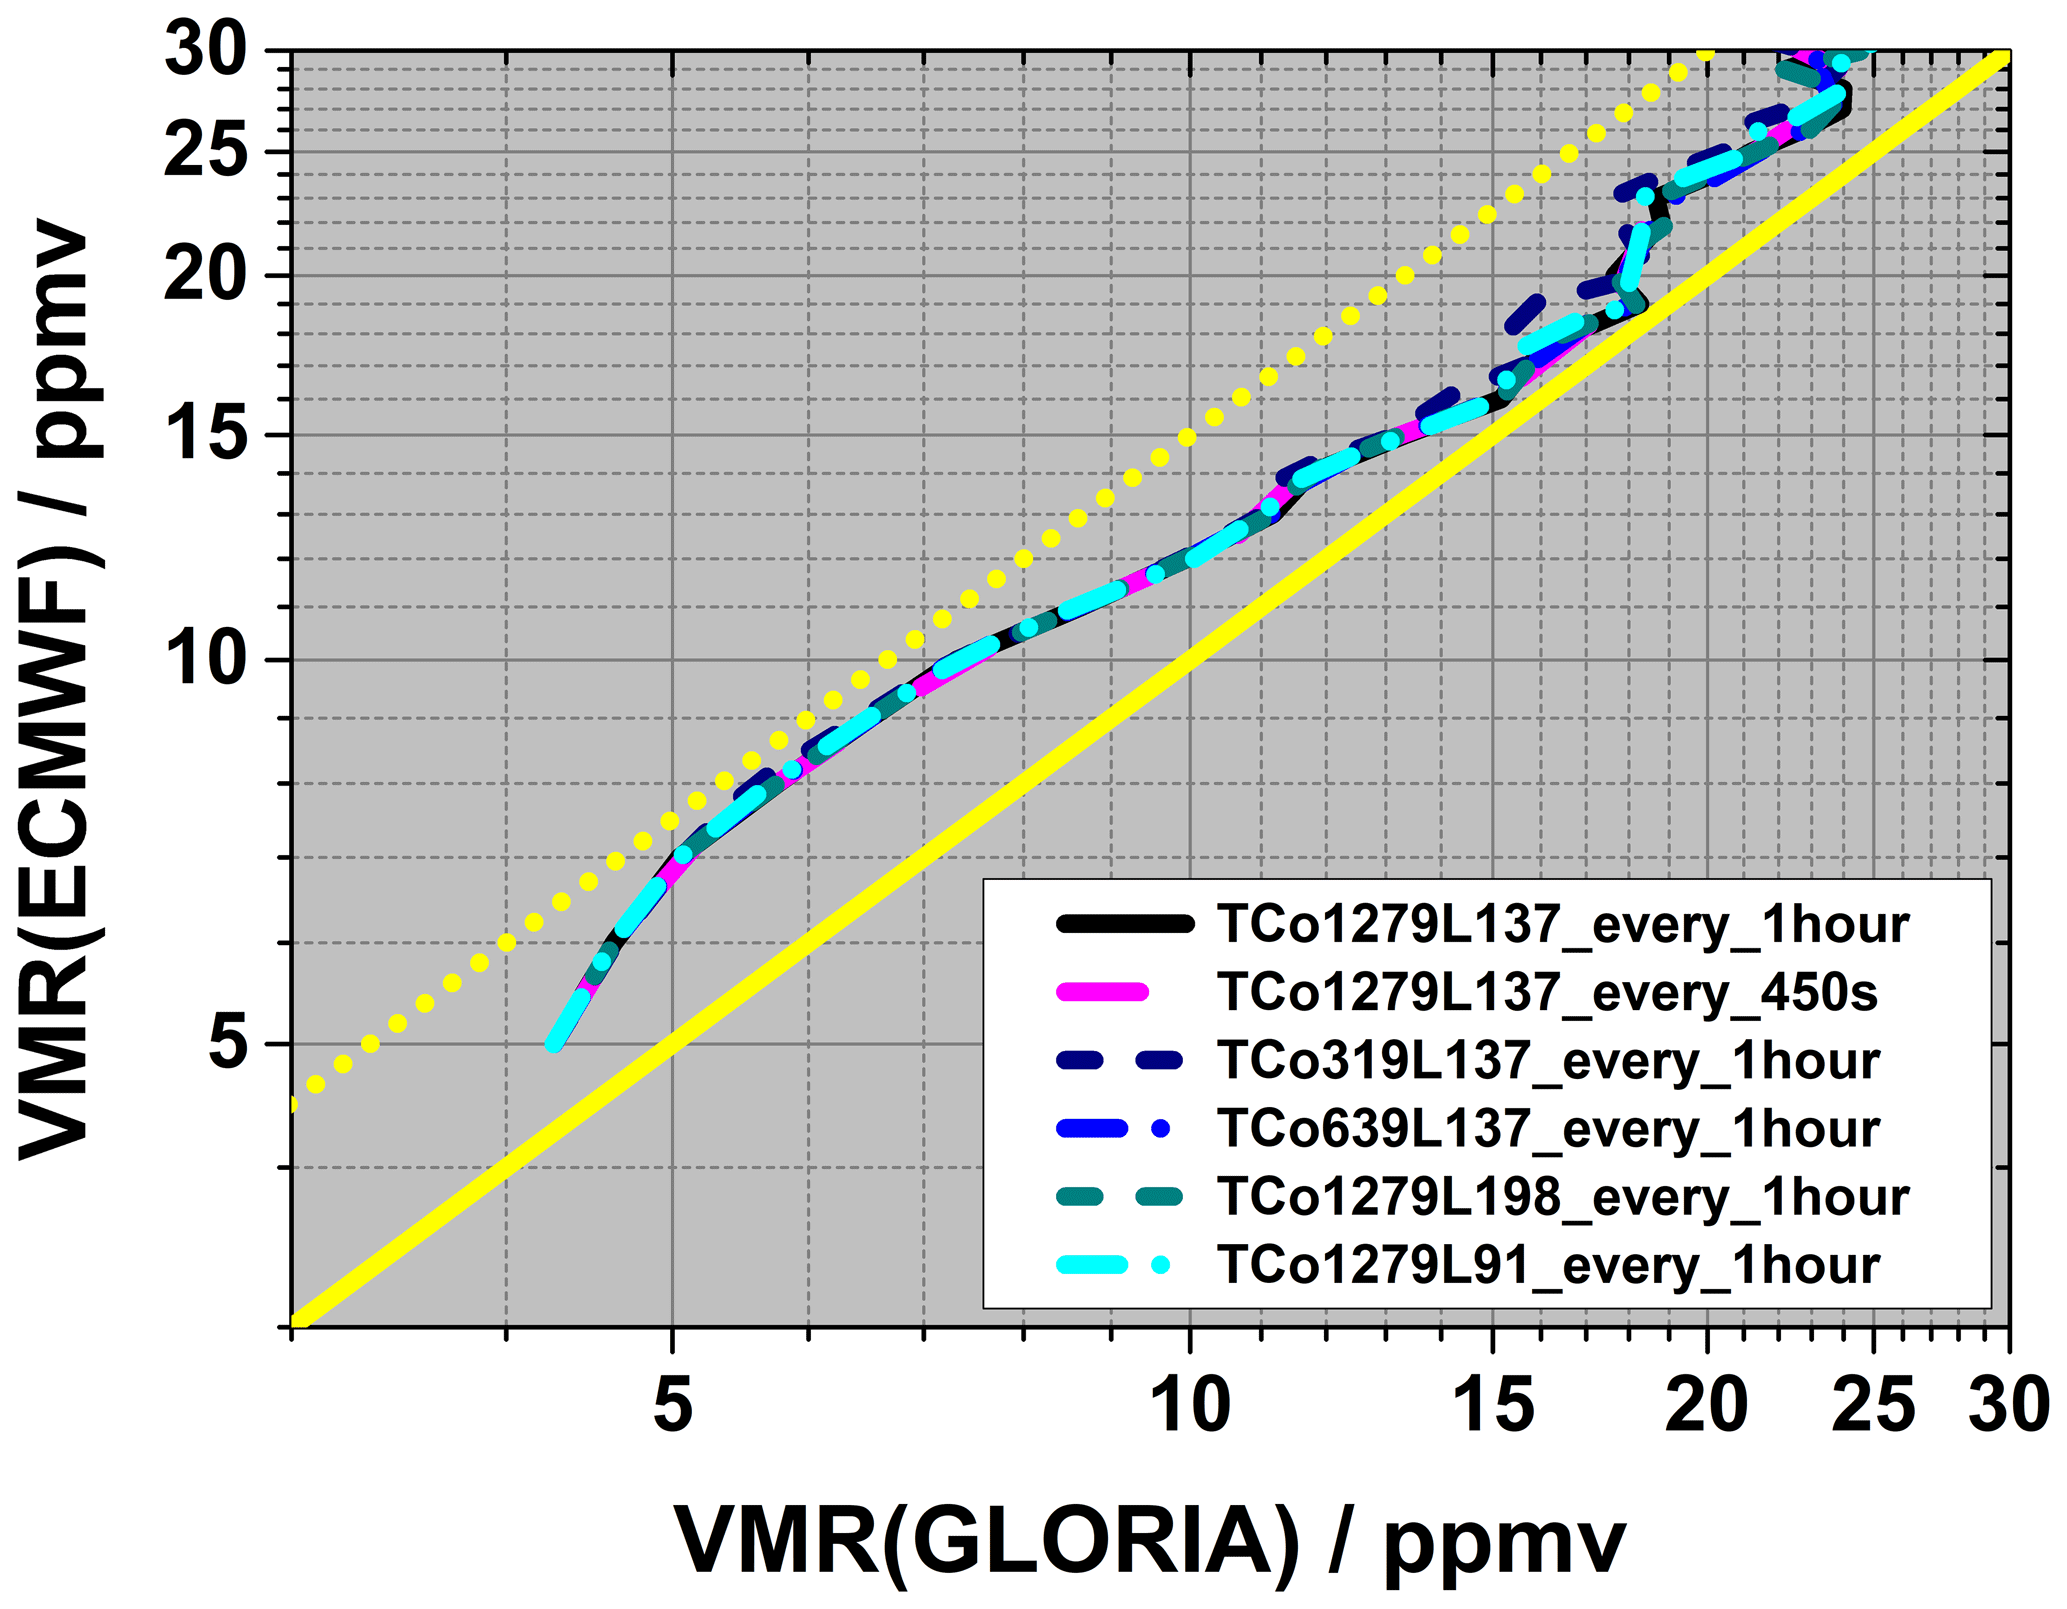
Figure 4Low sensitivity of mean correlations between IFS sensitivity forecasts and GLORIA observations during the flight on 26 February 2016. IFS sensitivity forecasts include more frequent temporal output [450 s (magenta) instead of 1 h (black)], lower or higher horizontal resolution (TCo319 (dark blue), TCo639 (blue), and TCo1279 (black) all on cubic octahedral grid, instead of the operational TL1279 on the linear grid) and higher or lower vertical resolution [L198 (dark cyan) and L91 (cyan) instead of L137 (black)].
Several possible reasons for the moist bias have been previously discussed in the literature. Due to a sharp water vapor contrast present around the tropopause, it is known that numerical diffusion (both explicit and implicit) can lead to too strong water vapor “leakage” from the moist troposphere into the dry stratosphere in low-resolution model simulations. Mesoscale fine structures such as tropopause folding, intrusions, and filamentary structures on horizontal and vertical scales smaller than the model resolution are likely to contribute to the observed moist bias. Consistently, a moderate increase in model resolution (up to 60 km in the horizontal and up to 1 km in the vertical at the tropopause) has been shown to reduce the moist bias and consequently the cold bias (Roeckner et al., 2006; Polichtchouk et al., 2019). Nevertheless, ECMWF forecasts at 9–18 km horizontal resolution and better than 400 m vertical resolution at the tropopause are still affected by the cold bias in the mid-latitude and polar LMS (Shepherd et al., 2018). Our long-range two-dimensional observations clearly confirm the moist bias to be present at such a high resolution and furthermore show how the moist bias develops from January to March in the vertical domain.
Since water vapor is not assimilated by ECMWF above the tropopause in any analysis/reanalysis products, it is possible that the cold bias in high-resolution forecasts develops as a result of initialization from too moist analysis in the mid-latitude and polar LMS. Indeed, using CARIBIC (Civil Aircraft for the Regular Investigation of the atmosphere Based on an Instrument Container) in situ observations on board passenger aircraft from 2005–2012, Dyroff et al. (2015) found specific humidity in ECMWF analyses and 18 and 24 h forecasts to be overestimated by 100 % to 150 % in the summer and autumn and by 50 % to 100 % in the winter and spring. They suggest that the observed moist bias is caused by small-scale stratospheric intrusions which are still unresolved by the model, numerical diffusion of water vapor across the hydropause from the advection scheme, and a lack of constraint on humidity in the stratosphere. Other possible model processes contributing to the moistening of the LMS include vertical diffusion parametrization.
Consistently, Kaufmann et al. (2018) found a wet bias of 100 % to 150 % in the lowermost mid-latitude stratosphere in the ECMWF system in late spring 2014 and attributed it mainly to a too weak humidity gradient at the tropopause in the model. Consistent with Kuntz et al. (2014), who analyzed in situ observations from 2001 to 2011 and also diagnosed a wet lowermost stratosphere bias in the ECMWF system, Kaufmann et al. (2018) found the wet bias to decrease significantly towards higher altitudes.
It should be kept in mind that the previous studies covered years from 2001 to 2014, making direct comparisons to the more recent ECMWF system with better horizontal and vertical resolution difficult. However, while a mostly lower wet bias is diagnosed in our study, our results confirm the conclusion that the moist bias is already present in the ECMWF analyses during forecast initialization. Our results furthermore show that the bias is unaffected by the forecast resolution on short (< 12 h) timescales. Similar to the previous studies, we find the wet bias to decrease towards higher altitudes. Thereby, we characterize the analyzed levels by potential vorticity rather than geometric altitude or potential temperature and find a coherent picture of the moist bias evolution from January to March 2016.
Using satellite observations, Hogan et al. (2017) and Shepherd et al. (2018) also found that specific humidity in the polar LMS is overestimated in the ECMWF analysis when compared to MLS (Microwave Limb Sounder observations). However, MLS observations have a comparably poor vertical resolution of ∼ 5 km in the LMS, making the exact quantification of the moist bias across the sharp tropopause difficult. Therefore, global high-vertical and high-horizontal-resolution observations of water vapor across the tropopause, such as demonstrated by state-of-the-art airborne remote sensing instruments, would be desirable to better quantify and to help resolve the moist bias in the ECMWF system.
The comparison of state-of-the art high-resolution ECMWF analysis and short forecasts with high-resolution GLORIA observations clearly shows a systematic moist bias in the ECMWF system peaking at 7 to 10 PVU. The moist bias decreases at the highest and driest levels at 8 to 10 PVU from mid-winter to early spring but persists until mid-March at lower levels in the LMS. It extends down to altitudes below 8 km in strongly subsided air masses at the end of February. Sensitivity forecasts using more frequent temporal output and higher or lower horizontal and vertical resolutions show practically no response of the mean bias to these changes. While it is possible that for longer lead times resolution will have an impact on the moist bias, we note that a unique 1 km horizontal resolution seasonal forecast with the IFS has a moister LMS than in a similar forecast at 9 km horizontal resolution (Wedi et al., 2020), implying that the lack of horizontal resolution is not the reason behind this bias in the forecasts. We also note that vertical resolution increase beyond 137 levels does not reduce the LMS cold bias in the medium-range forecasts with IFS (Polichtchouk et al., 2019). It should be emphasized that all the sensitivity forecasts here were started from the same operational analysis. If the 4D-Var analysis itself was performed at different resolutions, the conclusion might be different. Similar to previous studies, the presented results support the conclusion that the moist bias is already present in ECMWF analysis – during forecast initialization. Our results show furthermore that on short (< 12 h) timescales the bias is unaffected by the forecast resolution.
The moist bias in the ECMWF analysis could be explained by the lack of observational constraint on specific humidity, as water vapor observations are not assimilated above the tropopause (i.e., the humidity increments are switched off above the hygropause, while temperature and winds are assimilated and thus affect moisture analysis). Therefore, the lower-stratospheric moist bias in the analysis is dominated by errors in the model, allowing water vapor leakages into the LMS. One possibility to minimize the LMS moist bias in the ECMWF system might be the systematic correction of the water vapor fields above the tropopause. This would, however, require a comprehensive characterization of the moist bias in the extratropical LMS during the different seasons and a robust identification of the tropopause, also in dynamically perturbed regions. Thereby, data from further field campaigns like PGS, regular passenger aircraft observations such as CARIBIC, and the SPARC initiative (see https://www.sparc-climate.org/activities/water-vapour/, last access: 7 December 2020) could be helpful. Another possibility could be the assimilation of future spaceborne global water vapor observations (e.g., infrared limb-imaging or lidar) with high spatial resolution in the LMS.
The GLORIA observations can be accessed at the HALO database (https://doi.org/10.17616/R39Q0T, HALO consortium, 2020) and at the KITopen repository (https://doi.org/10.5445/IR/1000086506, Johansson et al., 2018b). The operational forecast data used here can be accessed via https://apps.ecmwf.int/archive-catalogue/?type=fc&class=od&stream=oper&expver=1 (last access: 7 December 2020). The specific output of the discussed horizontal and vertical resolution sensitivity forecasts is available from the authors on request.
IP and BH conceived the study. WW, AD, and IP elaborated the analyses. WW wrote the manuscript, with contributions from all co-authors. SJ, MH, JU, and WW processed and analyzed the GLORIA data, with further contributions by the GLORIA team from KIT and JÜLICH. FFV and the GLORIA team performed the GLORIA measurements and operations.
The authors declare that they have no conflict of interest.
This article is part of the special issue “The Polar Stratosphere in a Changing Climate (POLSTRACC) (ACP/AMT inter-journal SI)”. It is not associated with a conference.
We acknowledge support by the German Research Foundation (Deutsche Forschungsgemeinschaft, DFG Priority Program SPP 1294). We furthermore acknowledge partial support by the BMBF within the research initiatives ROMIC and ROMIC II. We acknowledge ECMWF for providing the IFS data. We thank Elias Holm for helpful discussion. We thank the PGS coordination and flight-planning teams, the GLORIA team from KIT and JÜLICH, and DLR-FX for planning and carrying out the flights and observations. We thank the two anonymous reviewers for valuable comments which helped us to improve the manuscript.
This research has been supported by the German Research Foundation (Deutsche Forschungsgemeinschaft, DFG Priority Program SPP 1294, grant no. WO 2160/1-1) and the BMBF within the research initiatives
ROMIC (project GW-LCYCLE, subproject 2, 01LG1206B) and ROMIC II (project
WASCLIM, subproject 5, 01LG1907E).
The article processing charges for this open-access
publication were covered by a Research
Centre of the Helmholtz Association.
This paper was edited by Jianzhong Ma and reviewed by two anonymous referees.
Dyroff, C., Zahn, A., Christner, E., Forbes, R., Tompkins, A. M., and van Velthoven, P. F. J.: Comparison of ECMWF analysis and forecast humidity data with CARIBIC upper troposphere and lower stratosphere observations, Q. J. Roy. Meteor. Soc., 141, 833–844, https://doi.org/10.1002/qj.2400, 2015.
Flentje, H., Dörnbrack, A., Ehret, G., Fix, A., Kiemle, C., Poberaj, G., and Wirth, M.: Water vapor heterogeneity related to tropopause folds over the North Atlantic revealed by airborne water vapor differential absorption lidar, J. Geophys. Res., 110, D03115, https://doi.org/10.1029/2004JD004957, 2005.
Friedl-Vallon, F., Gulde, T., Hase, F., Kleinert, A., Kulessa, T., Maucher, G., Neubert, T., Olschewski, F., Piesch, C., Preusse, P., Rongen, H., Sartorius, C., Schneider, H., Schönfeld, A., Tan, V., Bayer, N., Blank, J., Dapp, R., Ebersoldt, A., Fischer, H., Graf, F., Guggenmoser, T., Höpfner, M., Kaufmann, M., Kretschmer, E., Latzko, T., Nordmeyer, H., Oelhaf, H., Orphal, J., Riese, M., Schardt, G., Schillings, J., Sha, M. K., Suminska-Ebersoldt, O., and Ungermann, J.: Instrument concept of the imaging Fourier transform spectrometer GLORIA, Atmos. Meas. Tech., 7, 3565–3577, https://doi.org/10.5194/amt-7-3565-2014, 2014.
Gates, W. L., Boyle, J. S., Covey, C., Dease, C. G., Doutriaux,C. M., Drach, R. S., Fiorino, M., Glecker, P. J., Hnilo, J. J., Mar-lais, S. M., Phillips, T. J., Potter, G. L., Santer, B. D., Sperber,K. R., Taylor, K. E., and Williams, D. N.: An overview of the results of the Atmospheric Model Intercomparison Project (AMIPI), B. Am. Meteorol. Soc., 80, 29–55, 1999.
HALO consortium: HALO database, re3data.org – Registry of Research Data Repositories, https://doi.org/10.17616/R39Q0T, 2020.
Hólm, E., Forbes, R., Lang, S., Magnusson, L., and Malardel, S.: New model cycle brings higher resolution, ECMWF Newsletter, No. 147, ECMWF, Reading, UK, 14–19, 2016.
Hogan, R. J., Ahlgrimm, M., Balsamo, G., Beljaars, A., Berrisford, P., Bozzo, A., Di Giuseppe, F., Forbes, R. M., Haiden, T., Lang, S., and Mayer, M.: Radiation in numerical weather prediction, ECMWF Technical Memorandum no. 816, https://doi.org/10.21957/2bd5dkj8x, 2017.
Johansson, S., Woiwode, W., Höpfner, M., Friedl-Vallon, F., Kleinert, A., Kretschmer, E., Latzko, T., Orphal, J., Preusse, P., Ungermann, J., Santee, M. L., Jurkat-Witschas, T., Marsing, A., Voigt, C., Giez, A., Krämer, M., Rolf, C., Zahn, A., Engel, A., Sinnhuber, B.-M., and Oelhaf, H.: Airborne limb-imaging measurements of temperature, HNO3, O3, ClONO2, H2O and CFC-12 during the Arctic winter 2015/2016: characterization, in situ validation and comparison to Aura/MLS, Atmos. Meas. Tech., 11, 4737–4756, https://doi.org/10.5194/amt-11-4737-2018, 2018a.
Johansson, S., Woiwode, W., and Höpfner, M.: GLORIA Chemistry Mode temperature and trace gas retrievals from the POLSTRACC/GW-LCYCLEII/GWEX/SALSA campaigns 2015/2016, Institut für Meteorologie und Klimaforschung – Atmosphärische Spurenstoffe und Fernerkundung (IMK-ASF), Karlsruher Institut für Technologie, https://doi.org/10.5445/IR/1000086506, 2018b.
Kaufmann, S., Voigt, C., Heller, R., Jurkat-Witschas, T., Krämer, M., Rolf, C., Zöger, M., Giez, A., Buchholz, B., Ebert, V., Thornberry, T., and Schumann, U.: Intercomparison of midlatitude tropospheric and lower-stratospheric water vapor measurements and comparison to ECMWF humidity data, Atmos. Chem. Phys., 18, 16729–16745, https://doi.org/10.5194/acp-18-16729-2018, 2018.
Kunz, A., Spelten, N., Konopka, P., Müller, R., Forbes, R. M., and Wernli, H.: Comparison of Fast In situ Stratospheric Hygrometer (FISH) measurements of water vapor in the upper troposphere and lower stratosphere (UTLS) with ECMWF (re)analysis data, Atmos. Chem. Phys., 14, 10803–10822, https://doi.org/10.5194/acp-14-10803-2014, 2014.
Malardel, S. and Wedi, N. P.: How does subgrid-scale parametrization influence nonlinear spectral energy fluxes in global NWP models?, J. Geophys. Res.-Atmos., 121, 5395–5410, https://doi.org/10.1002/2015JD023970, 2016.
Malardel, S., Wedi, N., Deconinck, W., Diamantakis, M., Kühnlein, C., Mozdzynski, G., Hamrud, M., and Smolarkiewicz, P.: A new grid for the IFS, ECMWF Newsletter, No. 146, ECMWF, Reading, UK, 23–28, 2016.
Meyer, J., Rolf, C., Schiller, C., Rohs, S., Spelten, N., Afchine, A., Zöger, M., Sitnikov, N., Thornberry, T. D., Rollins, A. W., Bozóki, Z., Tátrai, D., Ebert, V., Kühnreich, B., Mackrodt, P., Möhler, O., Saathoff, H., Rosenlof, K. H., and Krämer, M.: Two decades of water vapor measurements with the FISH fluorescence hygrometer: a review, Atmos. Chem. Phys., 15, 8521–8538, https://doi.org/10.5194/acp-15-8521-2015, 2015.
Oelhaf, H., Sinnhuber, B.-M., Woiwode, W., Bönisch, H., Bozem, H., Engel, A., Fix, A., Friedl-Vallon, F., Grooß, J., Hoor, P., Johansson, S., Jurkat-Witschas, T., Kaufmann, S., Krämer, M., Krause, J., Kretschmer, E., Lörks, D., Marsing, A., Orphal, J., Pfeilsticker, K., Pitts, M., Poole, L., Preusse, P., Rapp, M., Riese, M., Rolf, C., Ungermann, J., Voigt, C., Volk, C.M., Wirth, M., Zahn, A., and Ziereis, H.: Polstracc: Airborne Experiment for Studying the Polar Stratosphere in a Changing Climate with the High Altitude and Long Range Research Aircraft (HALO), B. Am. Meteorol. Soc., 100, 2634–2664, https://doi.org/10.1175/BAMS-D-18-0181.1, 2019.
Polichtchouk, I., Stockdale, T., Bechtold, P., Diamantakis, M., Malardel, S., Sandu, I., Vána, F., and Wedi, N.: Control on stratospheric temperature in IFS: resolution and vertical advection, ECMWF Technical Memorandum no. 847, https://doi.org/10.21957/cz3t12t7e, 2019.
Riese, M., Ploeger, F., Rap, A., Vogel, B., Konopka, P., Dameris, M., and Forster, P.: Impact of uncertainties in atmospheric mixing on simulated UTLS composition and related radiative effects, J. Geophys. Res., 117, D16305, https://doi.org/10.1029/2012JD017751, 2012.
Riese, M., Oelhaf, H., Preusse, P., Blank, J., Ern, M., Friedl-Vallon, F., Fischer, H., Guggenmoser, T., Höpfner, M., Hoor, P., Kaufmann, M., Orphal, J., Plöger, F., Spang, R., Suminska-Ebersoldt, O., Ungermann, J., Vogel, B., and Woiwode, W.: Gimballed Limb Observer for Radiance Imaging of the Atmosphere (GLORIA) scientific objectives, Atmos. Meas. Tech., 7, 1915–1928, https://doi.org/10.5194/amt-7-1915-2014, 2014.
Roeckner, E., Brokopf, R., Esch, M., Giorgetta, M., Hagemann, S., Kornblueh, L., Manzini, E., Schlese, U., and Schulzweida, U.: Sensitivity of simulated climate to horizontal and vertical resolution in the ECHAM5 atmosphere model, J. Climate, 19, 3771–3791, https://doi.org/10.1175/jcli3824.1, 2006.
Schäfler, A., Craig, G., Wernli, H., Arbogast, P., Doyle, J.D., McTaggart-Cowan, R., Methven, J., Rivière, G., Ament, F., Boettcher, M., Bramberger, M., Cazenave, Q., Cotton, R., Crewell, S., Delanoë, J., Dörnbrack, A., Ehrlich, A., Ewald, F., Fix, A., Grams, C.M., Gray, S.L., Grob, H., Groß, S., Hagen, M., Harvey, B., Hirsch, L., Jacob, M., Kölling, T., Konow, H., Lemmerz, C., Lux, O., Magnusson, L., Mayer, B., Mech, M., Moore, R., Pelon, J., Quinting, J., Rahm, S., Rapp, M., Rautenhaus, M., Reitebuch, O., Reynolds, C.A., Sodemann, H., Spengler, T., Vaughan, G., Wendisch, M., Wirth, M., Witschas, B., Wolf, K., and Zinner, T.: The North Atlantic Waveguide and Downstream Impact Experiment, B. Am. Meteorol. Soc., 99, 1607–1637, https://doi.org/10.1175/BAMS-D-17-0003.1, 2018.
Shepherd, T. G., Polichtchouk, I., Hogan, R. J., and Simmons, A. J.: Report on Stratosphere Task Force, ECMWF Technical Memorandum no. 824, https://doi.org/10.21957/0vkp0t1xx, 2018.
Solomon, S., Rosenlof, K. H., Portmann, R. W., Daniel, J. S., Davis, S. M., Sanford, T. J., and Plattner, G.-K.: Contributions of Stratospheric Water Vapor to Decadal Changes in the Rate of Global Warming, Science, 327, 1219–1223, 2010.
Stenke, A., Grewe, V., and Ponater, M.: Lagrangian transport of water vapour and cloud water in the ECHAM4 GCM and its impact on the cold bias, Clim. Dynam., 31, 491–506, https://doi.org/10.1007/s00382-007-0347-5, 2008.
Ungermann, J., Kalicinsky, C., Olschewski, F., Knieling, P., Hoffmann, L., Blank, J., Woiwode, W., Oelhaf, H., Hösen, E., Volk, C. M., Ulanovsky, A., Ravegnani, F., Weigel, K., Stroh, F., and Riese, M.: CRISTA-NF measurements with unprecedented vertical resolution during the RECONCILE aircraft campaign, Atmos. Meas. Tech., 5, 1173–1191, https://doi.org/10.5194/amt-5-1173-2012, 2012.
Wedi, N. P.: Increasing horizontal resolution in numerical weather prediction and climate simulations: illusion or panacea?, Philos. T. R. Soc., A372, 20130289, https://doi.org/10.1098/rsta.2013.0289, 2014.
Wedi, N. P., Polichtchouk, I., Dueben, P., Anantharaj, V. G., Bauer, P., Boussetta, S., Browne, P., Deconinck, W., Gaudin, W., Hadade, I., Hatfield, S., Iffrig, O., Lopez, P., Maciel, P., Mueller, A., Saarinen, S., Sandu, I., Quintino, T., and Vitart, F.: A baseline for global weather and climate simulations at 1 km resolution, J. Adv. Model.Earth Syst., 12, e2020MS002192, https://doi.org/10.1029/2020MS002192, 2020.
Werner, A., Volk, C. M., Ivanova, E. V., Wetter, T., Schiller, C., Schlager, H., and Konopka, P.: Quantifying transport into the Arctic lowermost stratosphere, Atmos. Chem. Phys., 10, 11623–11639, https://doi.org/10.5194/acp-10-11623-2010, 2010.
Woiwode, W., Dörnbrack, A., Bramberger, M., Friedl-Vallon, F., Haenel, F., Höpfner, M., Johansson, S., Kretschmer, E., Krisch, I., Latzko, T., Oelhaf, H., Orphal, J., Preusse, P., Sinnhuber, B.-M., and Ungermann, J.: Mesoscale fine structure of a tropopause fold over mountains, Atmos. Chem. Phys., 18, 15643–15667, https://doi.org/10.5194/acp-18-15643-2018, 2018.
Zöger, M., Afchine, A., Eicke, N., Gerhards, M.-T., Klein, E., McKenna, D. S., Mörschel, U., Schmidt, U., Tan, V., Tuitjer, F., Woyke, T., and Schiller, C.: Fast in situ stratospheric hygrometers: A new family of balloon–borne and airborne Lyman alpha photofragment fluorescence hygrometers, J. Geophys. Res.-Atmos., 104, 1807–1816, https://doi.org/10.1029/1998JD100025, 1999.