the Creative Commons Attribution 4.0 License.
the Creative Commons Attribution 4.0 License.
 | 02 Dec 2020
Elevated levels of OH observed in haze events during wintertime in central Beijing
Eloise J. Slater
Lisa K. Whalley
Robert Woodward-Massey
Chunxiang Ye
James D. Lee
Freya Squires
James R. Hopkins
Rachel E. Dunmore
Marvin Shaw
Jacqueline F. Hamilton
Alastair C. Lewis
Leigh R. Crilley
Louisa Kramer
William Bloss
Weiqi Xu
Siyao Yue
Lujie Ren
W. Joe F. Acton
C. Nicholas Hewitt
Xinming Wang
Pingqing Fu
Wintertime in situ measurements of OH, HO2 and RO2 radicals and OH reactivity were made in central Beijing during November and December 2016. Exceptionally elevated NO was observed on occasions, up to ∼250 ppbv. The daily maximum mixing ratios for radical species varied significantly day-to-day over the ranges 1–8×106 cm−3 (OH), 0.2–1.5×108 cm−3 (HO2) and 0.3–2.5×108 cm−3 (RO2). Averaged over the full observation period, the mean daytime peak in radicals was 2.7×10⁶, 0.39×10⁸ and 0.88×108 cm−3 for OH, HO2 and total RO2, respectively. The main daytime source of new radicals via initiation processes (primary production) was the photolysis of HONO (∼83 %), and the dominant termination pathways were the reactions of OH with NO and NO2, particularly under polluted haze conditions. The Master Chemical Mechanism (MCM) v3.3.1 operating within a box model was used to simulate the concentrations of OH, HO2 and RO2. The model underpredicted OH, HO2 and RO2, especially when NO mixing ratios were high (above 6 ppbv). The observation-to-model ratio of OH, HO2 and RO2 increased from ∼1 (for all radicals) at 3 ppbv of NO to a factor of ∼3, ∼20 and ∼91 for OH, HO2 and RO2, respectively, at ∼200 ppbv of NO. The significant underprediction of radical concentrations by the MCM suggests a deficiency in the representation of gas-phase chemistry at high NOx. The OH concentrations were surprisingly similar (within 20 % during the day) in and outside of haze events, despite j(O1D) decreasing by 50 % during haze periods. These observations provide strong evidence that gas-phase oxidation by OH can continue to generate secondary pollutants even under high-pollution episodes, despite the reduction in photolysis rates within haze.
- Article
(14477 KB) - Full-text XML
-
Supplement
(1713 KB) - BibTeX
- EndNote


In China, especially in its capital city, Beijing, air pollution and air quality are serious concerns (Tang et al., 2017). Beijing can experience severe haze episodes (Hu et al., 2014; Lang et al., 2017) with high particulate matter loadings during winter months and high ozone episodes during the summer (Cheng et al., 2016; Wang et al., 2015). China has one of the world's fastest expanding economies and has rapidly increased its urban population to form numerous megacities. From 1980 to 2005, the fraction of the population living in urban areas of China increased from 20 % to 40 %. China's economic growth has led to an increase in energy consumption, with 50 % of the global demand for coal accounted for by China in 2016 (Qi et al., 2016). The Chinese government have been implementing air quality controls in China (Zhang et al., 2016a), and emission and concentrations of primary pollutants have been decreasing nationwide; however, secondary pollutants still remain a major concern (Huang et al., 2014).
The OH radical mediates virtually all oxidative chemistry during the daytime and converts primary pollutants into secondary pollutants, as shown in Fig. 1. The reaction of OH with primary-pollutant emissions (particularly NOx – NO+NO2 – SO2 and VOCs – volatile organic compounds) can form secondary pollutants such as HNO3, H2SO4 and secondary oxygenated organic compounds (OVOCs). These secondary pollutants can lead to the formation of secondary aerosols and contribute to the mass of PM2.5. During the photochemical cycle initiated by OH, NO can be oxidised to form NO2 via reaction with HO2 and organic peroxy radicals, RO2, and the subsequent photolysis of NO2 can lead to the net formation of ozone. It has been shown in previous field campaigns that measured mixing ratios of radicals have a strong dependence on j(O1D) (Ehhalt and Rohrer, 2000; Ma et al., 2019; Stone et al., 2012; Tan et al., 2018). Hence, the radical concentrations measured during wintertime are typically expected to be lower than in the summertime due to lower photolysis rates of primary radical sources such as O3, HONO and HCHO. Here we define primary production as any process which initiates the formation of radicals and hence the photochemical chain reaction. Also, the lower temperatures experienced in the winter lead to lower water vapour concentrations, and this is expected to further limit primary OH formation via (O1D) + H2O (Heard and Pilling, 2003).
In contrast to the expectation of limited photochemistry in winter, particularly during haze episodes when light levels are reduced, aerosol composition analysis has highlighted that the contribution of secondary aerosols to the total particulate mass increases during pollution events in the North China Plain (NCP; Huang et al., 2014), suggesting that chemical oxidation still plays an important role in aerosol formation in winter. To fully understand the role of the OH radical during haze events experienced in central Beijing, direct in situ measurements of ambient OH concentration are required.
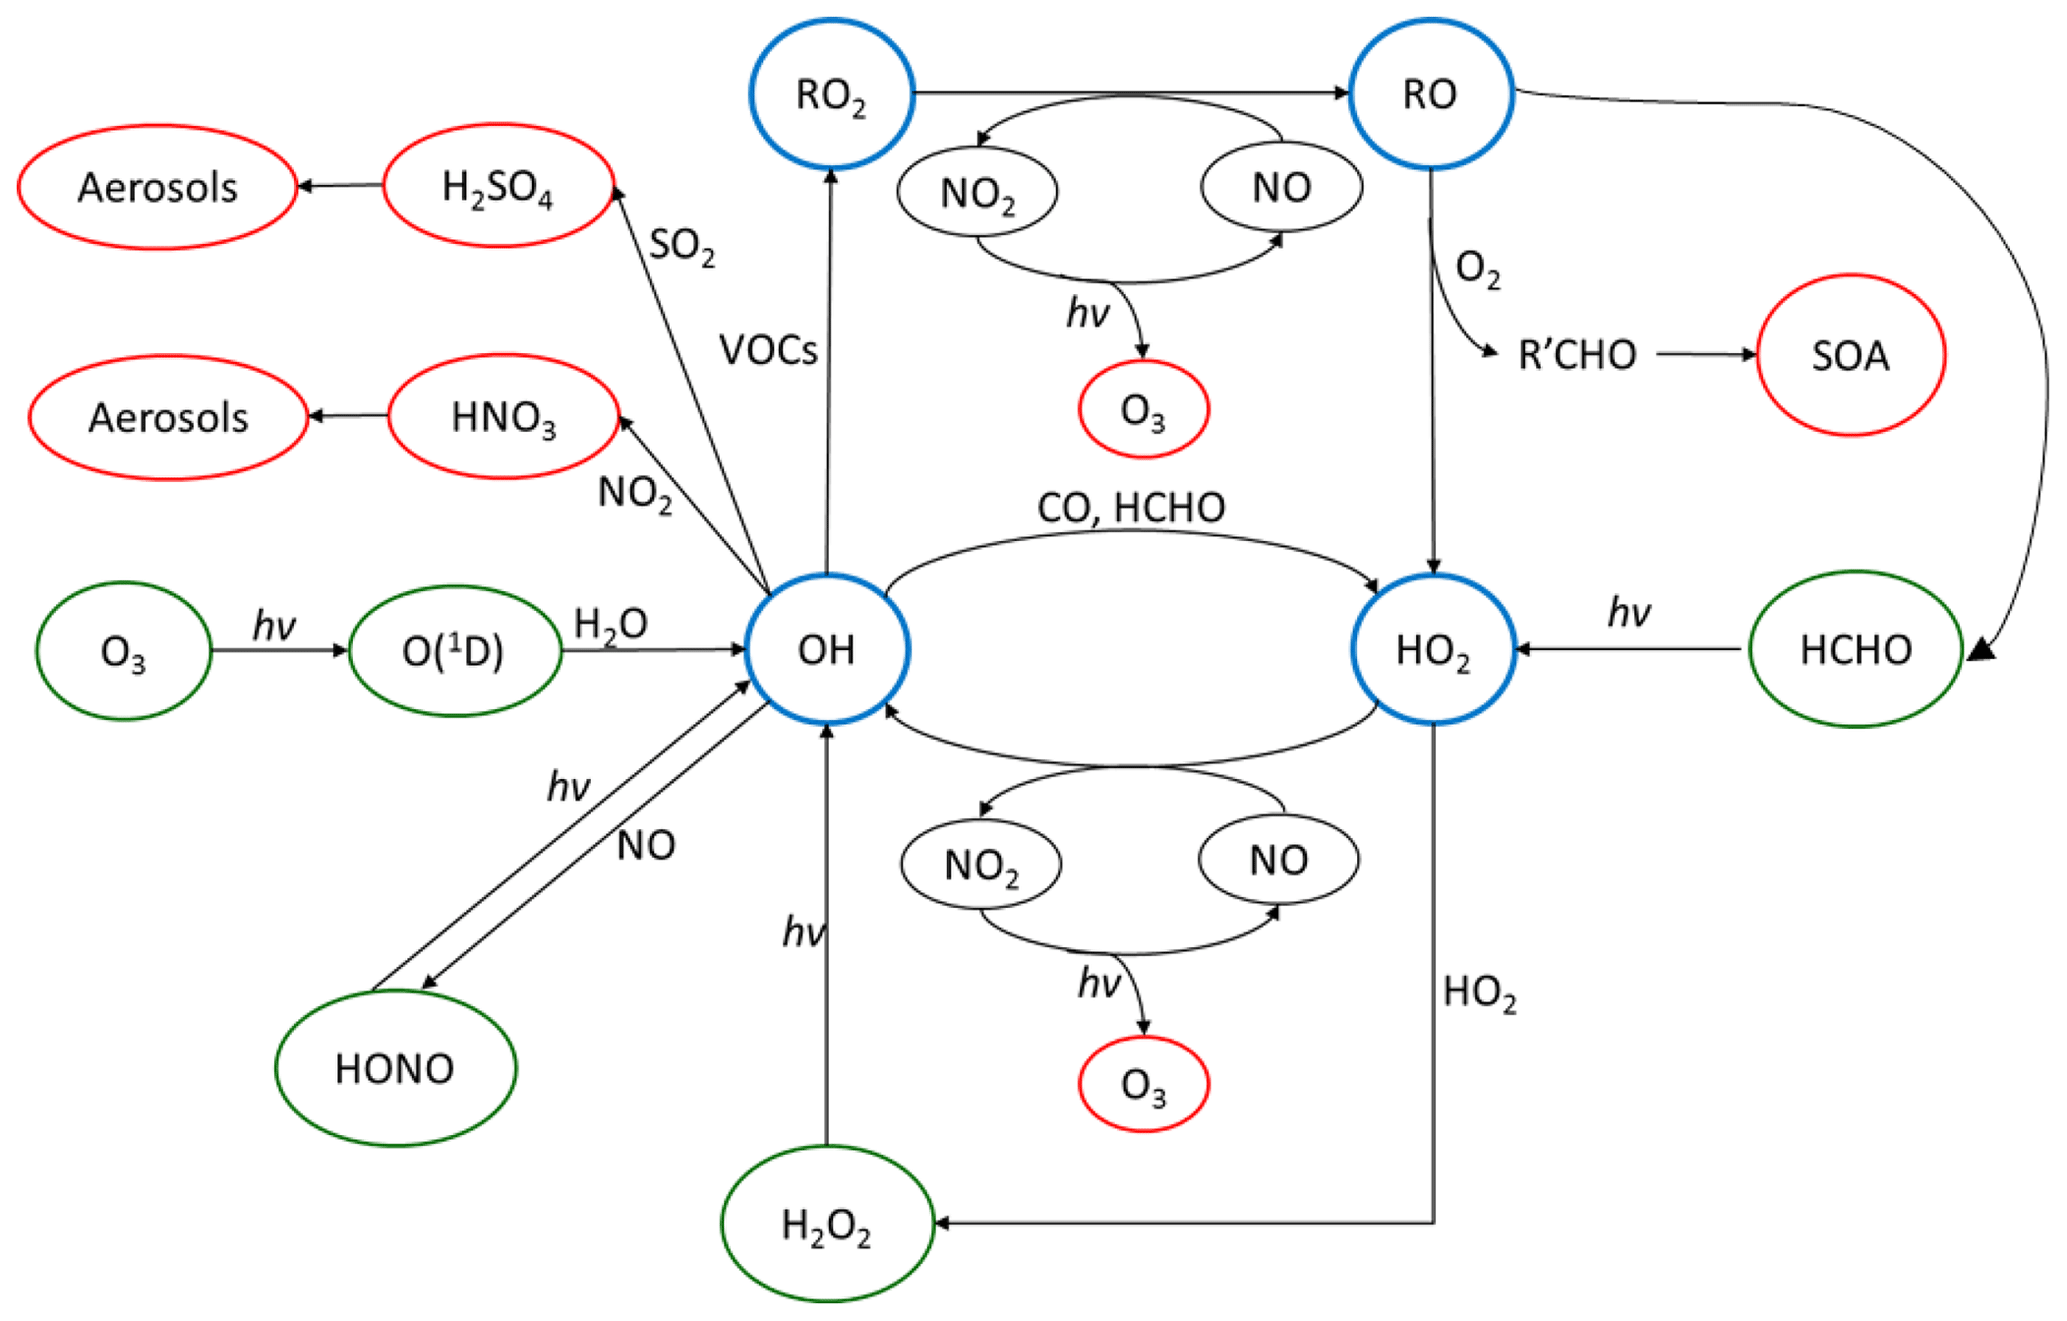
Figure 1The tropospheric photochemical cycle, with the green circles representing species acting as routes for radical formation, the blue circles representing the radical species themselves and the red circles representing the formation of secondary pollutants. The cycle does not show any heterogeneous source (e.g. heterogeneous production of HONO) or loss processes for the radical species. It should be noted the measured HONO abundance cannot be explained by the reaction of OH + NO alone.
Measurements of OH and HO2 in northern China during the wintertime have only recently been made. The first measurements were made during the BEST-ONE campaign (Tan et al., 2017) that took place in January 2016 in Huairou, which is a suburban site 60 km northeast of Beijing. The average daytime maximum concentrations observed during the BEST-ONE campaign for OH, HO2 and RO2 were 2.5×10⁶, 0.8×10⁸ (3.2 pptv) and 0.6×108 cm−3 (2.4 pptv), respectively. The concentration of OH during the BEST-ONE campaign was an order of magnitude higher than predicted by global models over the North China Plain region (Lelieveld et al., 2016) and is consistent with the increase in secondary-aerosol contribution to PM2.5 observed during haze events (Huang et al., 2014). The radical measurements during the BEST-ONE campaign were separated into clean and polluted periods (OH reactivity (kOH) >15 s−1) with an average daily maximum OH concentration for these periods of 4×10⁶ and 2.3×106 cm−3, respectively. The RACM2–LIM1 (Regional Atmospheric Chemistry Mechanism coupled with Leuven Isoprene Mechanism 1) box model was used to simulate the radical concentrations measured during BEST-ONE (Tan et al., 2018), but these could not reproduce the OH concentration observed when NO was above 1 ppbv or below 0.6 ppbv, consistent with previous campaigns when OH was measured and modelled under NO concentrations >1 ppbv (Emmerson et al., 2005; Kanaya et al., 2007; Lu et al., 2013; Tan et al., 2017; Zhou et al., 2003). More recently, OH and HO2 were measured in central Beijing during wintertime at the Peking University (PKU) campus in November and December 2017 (Ma et al., 2019). The radical measurements were simulated using the RACM2–LIM1 box model which highlighted an underprediction of the OH concentration when NO exceeded 1 ppbv (Ma et al., 2019). Two further campaigns have taken place in northern China during the summertime. The first took place in 2006 at a suburban site in Yufa (Lu et al., 2013), which is 40 km south of Beijing. The second took place in 2014 at the rural site in Wangdu (Tan et al., 2017). In both the Wangdu and Yufa field campaigns, the box model calculations underestimated the OH concentration when NO was below 0.5 ppbv. When NO exceeded 2 ppbv, a missing peroxy radical source was found, leading to a large underestimation of local ozone production by the model.
To try to understand the link between radical chemistry and the extremely high air pollution that is seen during Beijing in the wintertime, a field campaign, Air Pollution and Human Health in Chinese Megacities (APHH), took place in central Beijing from November to December in 2016. Simultaneous measurements of OH, HO2 and RO2 concentrations were performed during the APHH campaign. Measurements of OH reactivity (k(OH)), which is the sum of the concentration of species (Xi) that react with OH multiplied by the corresponding bimolecular rate coefficient, , along with other trace gas and aerosol measurements were made alongside the radicals.
In this paper we present the measurements of OH, HO2, RO2 and OH reactivity from the winter campaign. The concentrations of the radical species are compared to model results from the Master Chemical Mechanism (MCM3.3.1.) to assess if the radical concentrations can be simulated across the range of measured NOx, with a particular focus on the high-NOx conditions that were experienced. The importance of OH-initiated oxidation processes in the formation of ozone and secondary organic aerosol (SOAs) in the wintertime in Beijing are demonstrated.
2.1 Location of the field measurement site
The observations took place in central Beijing at the Institute of Atmospheric Physics (IAP), which is part of the Chinese Academy of Sciences; the location of the site is shown in Fig. 2 and is ∼6.5 km from the Forbidden City. Beijing is the capital city of China and is located on the northwest border of the North China Plain (NCP). It is surrounded by the Yan Mountains in the west, north and northeast (Chan and Yao, 2008). The topography of Beijing allows for the accumulation of pollutants, especially when southerly winds carrying emissions from the industrial regions are experienced. As shown by Fig. 2, the measurement site was within 100 m of a major road; thus local anthropogenic emissions likely influence the site, although no rush hour was observed from the diel variation in the trace gas measurements (see Fig. 5). The site was also close to local restaurants and a petrol station. More details of the measurement site and instrumentation can be found in the APHH overview paper (Shi et al., 2019). The instruments were housed in containers and located on the ground at the IAP site on a grassed area; the distance between the Leeds and York containers (VOC and trace gas measurements) was ∼3 m.
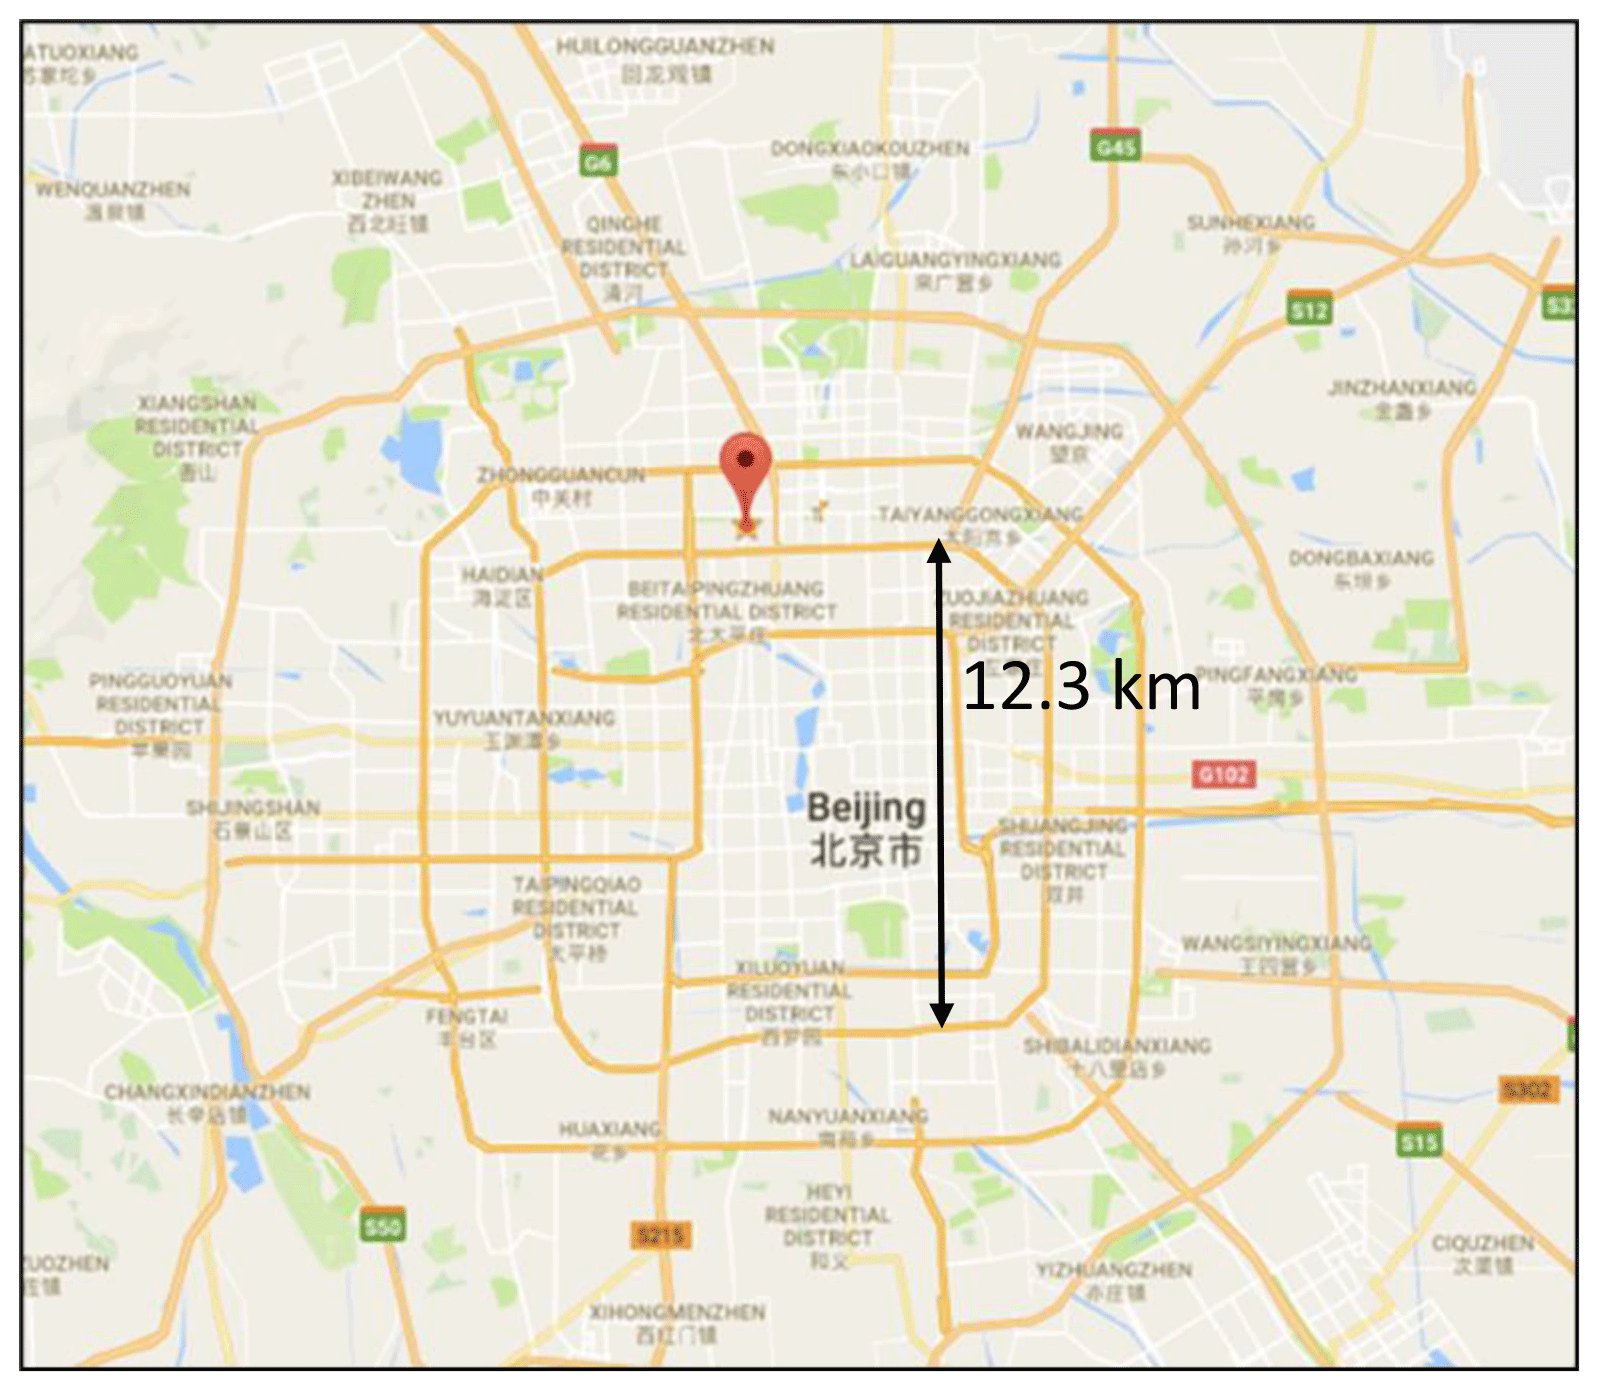
Figure 2Location of the Institute of Atmospheric Physics, Chinese Academy of Sciences (source: © Google Maps) – the location (39∘58′33′′ N, 116∘22′41′′ E) of the APHH campaign.
2.2 Instrumental details
2.2.1 OH, HO2 and RO2 measurements
The University of Leeds ground-based FAGE (fluorescence assay by gas expansion) instrument (Whalley et al., 2010) was deployed at the IAP site and made measurements of OH, HO2 and RO2 radicals, as well as OH reactivity (k(OH)). A general outline, specific set-up and the running conditions during APHH are described here. Further details on the methodology for sequential measurements of OH and HO2 that are made in the first fluorescence cell (HOx) and sequential measurements of HO and RO2 using the ROxLIF method (described in detail below) in the second cell (ROx) can be found in Whalley et al. (2018). HO refers to the measurement of HO2 and complex RO2 species; complex RO2 are either RO2 species that are formed from alkene and aromatic VOCs or VOCs that have a carbon chain greater than C4 and which under certain conditions are detected together with HO2 (Whalley et al., 2018). The radical measurements were made from a 6.1 m air-conditioned shipping container which had been converted into a mobile laboratory. The FAGE instrument has two detection cells which are located on top of the shipping container (sampling height of 3.5 m) within a weatherproof housing. An Nd:YAG pumped Ti:sapphire laser (Photonics Industries) generated pulsed tuneable near-IR radiation at a pulse repetition rate of 5 kHz, which was frequency doubled and then tripled using two non-linear crystals to produce UV light at 308 nm and used to excite OH via the Q1(1) transition of the , band.
During the APHH campaign the configuration of the two detection cells was the same as deployed during the ClearfLo campaign in London (Whalley et al., 2018), with the two cells coupled together via a connecting side arm, which enabled the laser light exiting the HOx cell to pass directly into the ROx cell. The channel photomultiplier (CPM) detectors that had been used to detect fluorescence previously (Whalley et al., 2018) were replaced by gated MCPs (microchannel plates; Photek PMT325/Q/BI/G) and fast gating units (Photek GM10-50B) for the APHH project.
The ROxLIF flow reactor (83 cm in length, 6.4 cm in diameter) was coupled to the second FAGE detection cell to allow for detection of RO2 (total, complex and simple) using the method outlined by Fuchs et al. (2008). The flow reactor was held at ∼30 Torr and drew ∼7.5 slpm through a 1 mm pinhole i.d. (internal diameter). The flow reactor was operated in two modes: in the first (HOx mode), 125 sccm of CO (Messer, 10 % in N2) was mixed with ambient air close to the pinhole to convert OH to HO2. In the second (ROx mode), 25 sccm of NO in N2 (Messer, 500 ppmv) was also added to the CO flow to convert RO2 into OH. The CO present during ROx mode rapidly converts the OH formed into HO2. The air from the ROxLIF flow reactor was drawn (5 slpm) into the FAGE fluorescence cell (held at ∼1.5 Torr), and NO (Messer, 99.9 %) was injected into the fluorescence cell to convert HO2 to OH. In HOx mode a measure of (complex RO2) was obtained, whilst ROx measured . sRO2 (simple RO2) concentration was determined by subtracting the concentration of cRO2, HO2 and OH from ROx.
In previous laboratory experiments the sensitivity of the instrument to a range of different RO2 species was investigated and can be found in Whalley et al. (2018). Similar sensitivities were determined for a range of RO2 species that were tested and agreed well with model-determined sensitivities. For comparison of the modelled RO2 to the observed total RO2, complex RO2 and simple RO2, the ROxLIF instrument sensitivity towards each RO2 species in the model was determined by running a model first under the ROxLIF reactor and then under the ROxLIF FAGE cell conditions (NO concentrations and residence times) to determine the conversion efficiency of each modelled RO2 species to HO2. The potential interference in the RO2 measurements from HO2NO2 and CH3O2NO2 is explored in Sect. S1.4 in the Supplement; however the data presented throughout the paper are the uncorrected data since the correction is small (correction from the decomposition of HO2NO2 and CH3O2NO2 is ∼6 %, ∼8 % and 4 % for total, complex and simple RO2, respectively.)
Inlet pre-injector
For part of the campaign, an inlet pre-injector (IPI) was attached to the HOx cell. The IPI removes ambient OH by the injection of propane directly above the cell inlet and facilitates a background measurement whilst the laser wavelength is still tuned to an OH transition, with this type of OH measurement known as “OHchem”. The OHchem background signal will include a signal from laser-scattered light and scattered solar radiation and may potentially also include a fluorescence signal from any OH that is generated internally from an interference precursor within the LIF (laser-induced fluorescence) cell. Internally generated OH constitutes an interference but can be readily identified by comparing the OHchem background signal to the background signal measured when the laser wavelength is tuned away from the OH transition, with this type of OH measurement known as “OHwave”. The OHwave background signal is from laser-scattered light and solar-scattered radiation only. OHchem is the online OH signal − OHchem background, and OHwave is the OH online signal − OHwave background.
The Leeds IPI was first implemented during the ICOZA campaign in Norfolk, UK, in the summer of 2015 and is described in further detail elsewhere (Woodward-Massey et al., 2020). During the APHH winter campaign the laser online (wavelength tuned to the OH transition) period lasted 300 s for both OHchem and OHwave data acquisition cycles. When the IPI was physically taken off the HOx fluorescence cell, OH and HO2 were measured sequentially in this cell with a 150 s online period each. The other (ROx) fluorescence cell measured HO and RO2 simultaneously with OH and HO2, respectively, when the IPI was removed. When the IPI was being operated during the APHH campaign, OHwave, OHchem and HO2 were measured in the HOx cell sequentially for 120, 120 and 60 s, respectively. The ROx cell measured HO and RO2 for 240 and 60 s, respectively, when the IPI was operated. The laser offline period for both data acquisition cycles lasted 30 s, with NO injected for the final 15 s of this laser offline period. From 8 to 24 November 2016 the HOx cell was operated without the IPI assembly in place; the IPI was then installed and run on the HOx cell from 2 to 8 December 2016.
The correlation of OHwave and OHchem during the APHH winter campaign is shown in Fig. 3. The slope of 1.05±0.07 demonstrates that within the errors in the linear fit no interference was evident during the winter campaign. OHwave data were corrected for the known interference from O3+H2O; see Woodward-Massey et al. (2020) for further details. The O3+H2O interference calculated was very small (median molecules cm−3) due to the low concentration of H2O and O3. All figures and calculations from now on use OHwave as it is the most extensive time series (12 d compared to 5 d).
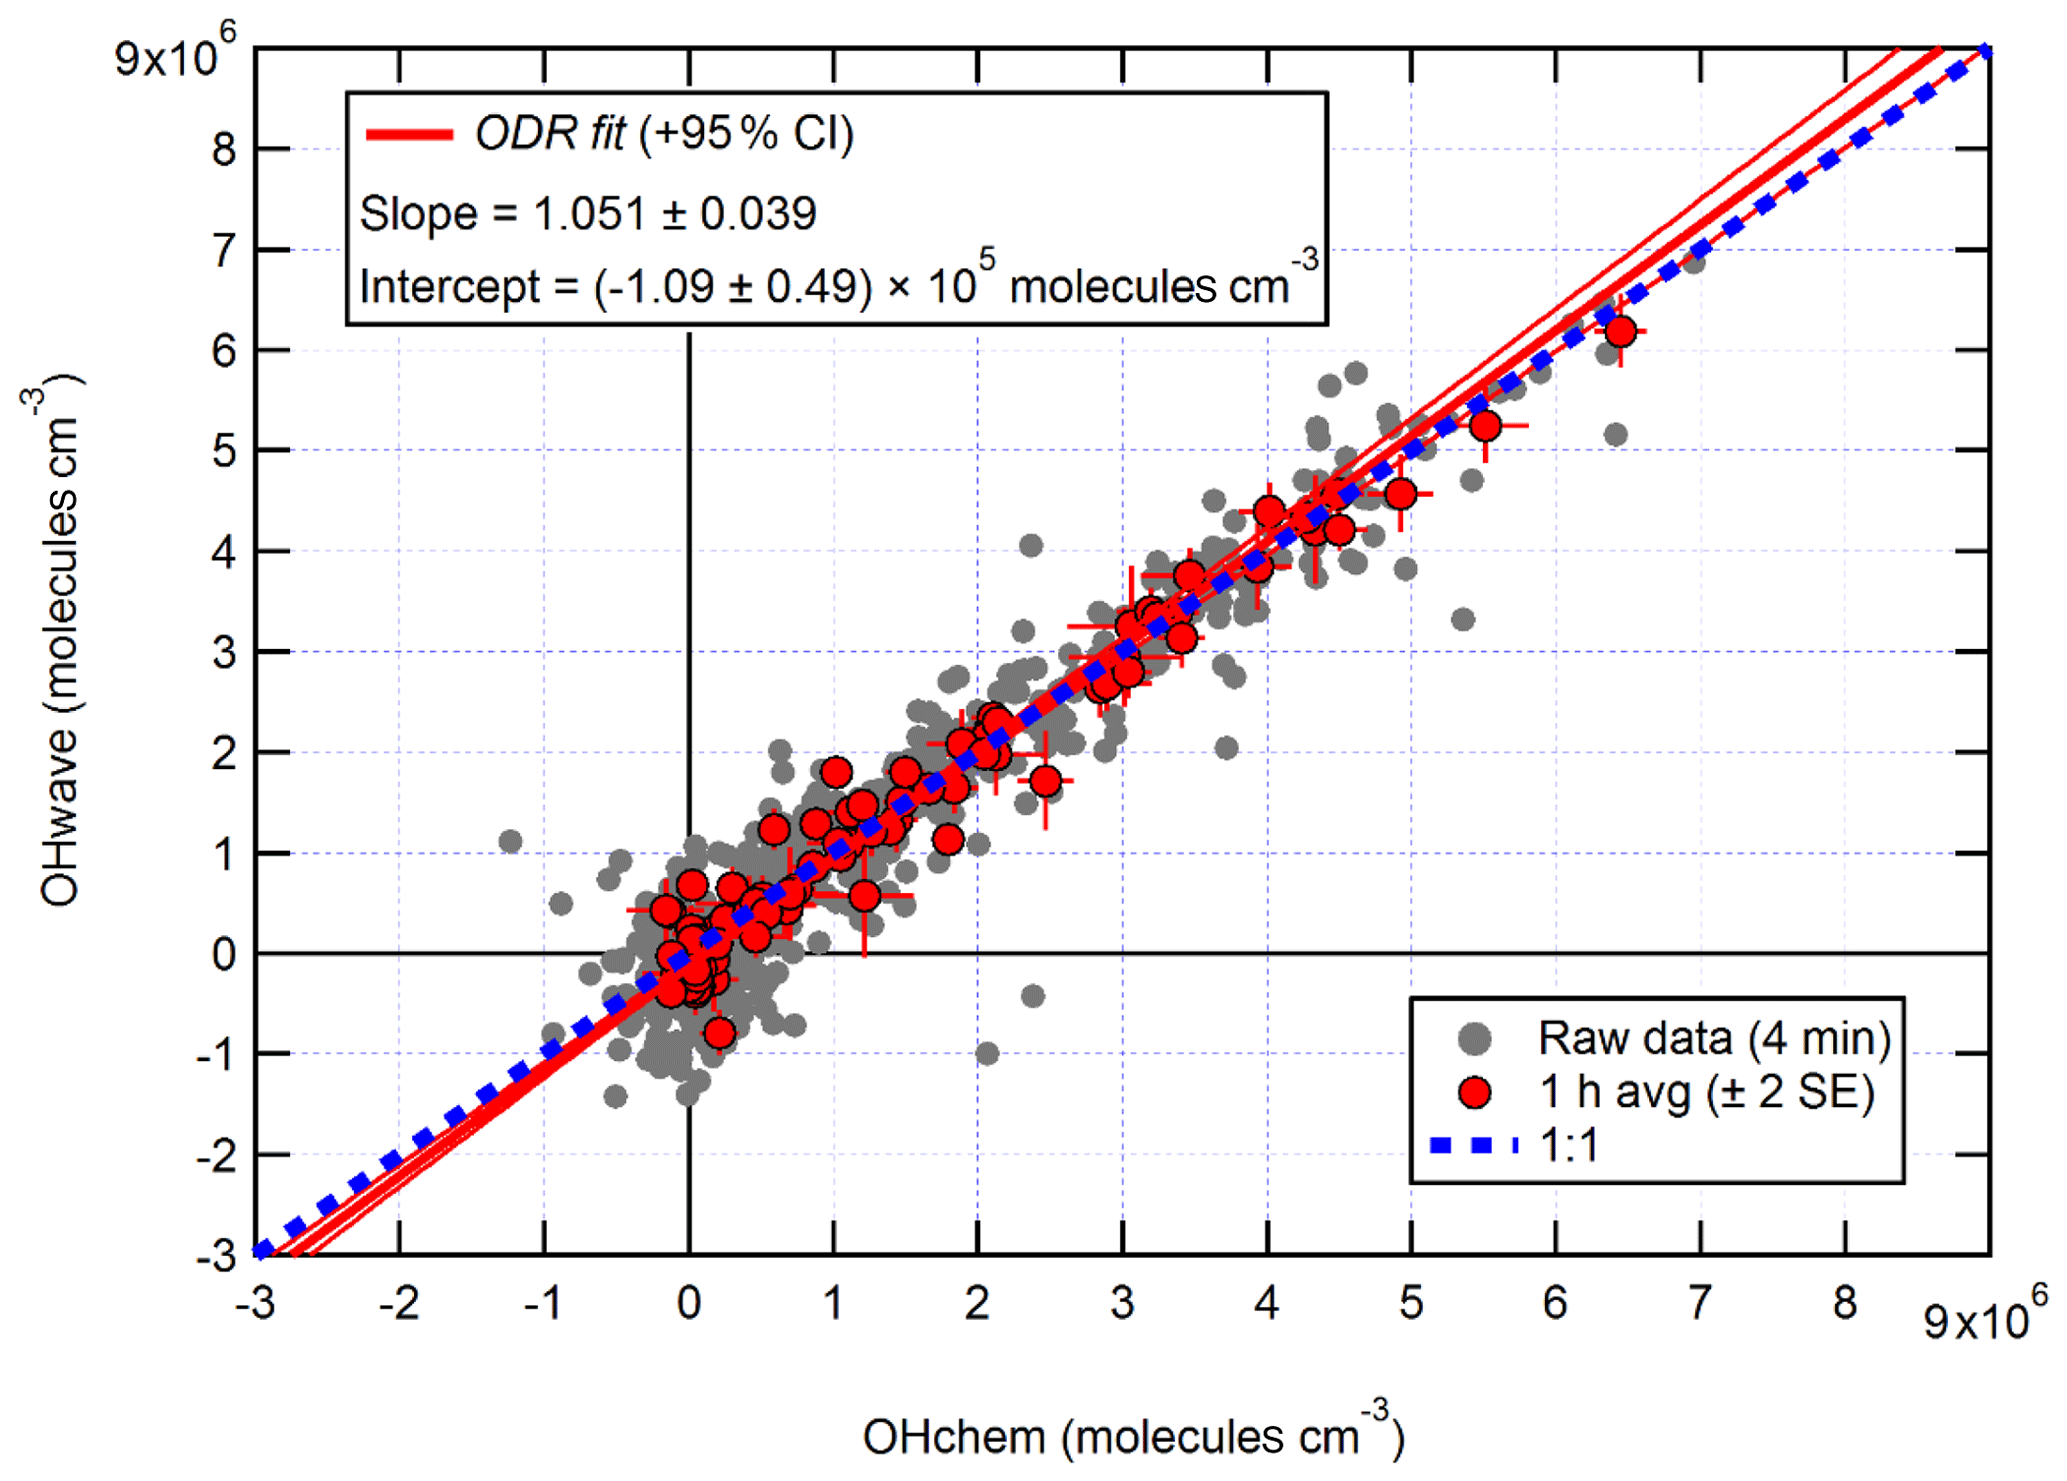
Figure 3Overall intercomparison of OHwave and OHchem observations from the winter 2016 APHH campaign. Grey markers represent raw data (6 min acquisition cycle, 4 and 2 min for the OH and HO2 measurements), with 1 h averages (±2 standard error, SE) in red. The thick red line is the orthogonal distance regression (ODR) fit to the hourly data, with its 95 % confidence interval (CI) bands given by the thin red lines; fit errors given at the 2σ level. For comparison, 1:1 agreement is denoted by the dashed blue line. OHwave data were corrected for the known interference from O3+H2O. Taken from Woodward-Massey et al. (2020), where further details can be found.
2.2.2 Calibration
The instrument was calibrated approximately every 3 d by photolysis of a known concentration of water vapour at 185 nm in synthetic air (Messer, Air Grade Zero 2) within a turbulent flow tube to generate equal concentrations of OH and HO2 as described in Whalley et al. (2018). The product of the photon flux at 185 nm and the water vapour photolysis time, which is required to calculate the concentration of OH and HO2, was measured using a N2O → NO chemical actinometer (Commane et al., 2010) both before and after the APHH campaign. For calibration of RO2 concentrations, methane (Messer, Grade 5, 99.99 %) was added to the humidified airflow in a sufficient quantity to rapidly titrate OH completely to CH3O2. For reporting the total concentration of RO2 the calibration factor for CH3O2 was used. More details on the ROxLIF and calibration, for example the sensitivity of the instrument towards various RO2 species which is taken into account when comparing RO2 measurements to model calculations, can be found in Whalley et al. (2018). The limit of detection (LOD) on average for the APHH campaign was 5.5×10⁵ molecules cm−3 for OH, 3.1×10⁶ molecules cm−3 for HO2 and 6.5×10⁶ molecules cm−3 for CH3O2 at a typical laser power of 11 mW for a 7 min data acquisition cycle (SNR = 2). The field measurements of all species were recorded with a 1 s time resolution, and the precision of the measurements was calculated using the standard errors in both the online and offline points. The accuracy of the measurements was ∼26 % (2σ) and is derived from the error in the calibration, which derives largely from that of the chemical actinometer (Commane et al., 2010).
2.2.3 OH reactivity
OH reactivity measurements were made using the laser flash photolysis pump-probe technique, and the instrument is described in detail in Stone et al. (2016). Ambient air was drawn into the reaction cell (85 cm in length, 5 cm in diameter) at 12 slpm. Humidified ultra-high-purity air (Messer, Air Grade Zero 2) passed a low-pressure Hg lamp at 0.5 slpm to generate ∼50 ppbv of O3 which was mixed with the ambient air. The O3 was photolysed at 266 nm to generate a uniform OH concentration across the reaction cell. The change in the OH radical concentration from pseudo-first-order loss with species present in ambient air was monitored by sampling the air from the reaction cell into a FAGE detection cell at ∼1.5 Torr. The 308 nm probe laser (same as the FAGE laser described above) was passed across the gas flow in the FAGE cell to excite OH radicals, and then the fluorescence signal at ∼308 nm was detected by a gated-channel photomultiplier tube. The OH decay profile owing to reactions with species in ambient air was detected in real time. The decay profile was averaged for 5 min and fitted with a first-order rate equation to find the rate coefficient describing the loss of OH (kloss), with kOH determined by subtracting the physical loss of OH (kphys). The OH reactivity data were fitted with a mono-exponential decay function as no bi-exponential behaviour was observed, even at the highest NO concentrations, and hence there was no evidence for recycling from HO2+NO impacting on the retrieved values. The total uncertainty in the ambient measurements of OH reactivity is ∼6 % (Stone et al., 2016).
2.2.4 The Master Chemical Mechanism (MCM)
A constrained zero-dimensional (box) model incorporating version 3.3.1 of the Master Chemical Mechanism (MCMv3.3.1; http://mcm.leeds.ac.uk/MCM/, last access: 29 November 2020) was used to predict the radical concentrations and OH reactivity and to compare with the field observations. The MCM is a detailed mechanism that almost explicitly describes the oxidative degradation of ∼140 VOCs ranging from methane to those containing 12 carbon atoms (C1–C12). The complete details of the kinetic and photochemical data used in the mechanism can be found at the MCM website (http://mcm.leeds.ac.uk/MCM/). For this work, the model was run with a subset of the MCM and treated the degradation of simultaneously measured non-methane VOCs, CH4 and CO following oxidation by OH, O3 and NO3, and it included 11 532 reactions and 3778 species. The model was constrained by measurements of NO, NO2, O3, CO, HCHO, HNO3, HONO, water vapour, temperature, pressure and individual VOC species measured by GC-FID (gas chromatography with flame ionisation detection). The accuracy and precision of trace gas species can be found in Table 2; details on the HONO measurements used in the modelling scenarios can be found in Crilley et al. (2019). Details for other measurements can be found in Shi et al. (2019). The time resolution for the GC-FID data was 1 h and has been interpolated to 15 min for the model input.
Table 1 shows the different species measured by the GC-FID whose degradation was included in the mechanism used. The model was constrained with the measured photolysis frequencies j(O1D), j(NO2) and j(HONO), which were calculated from the measured wavelength-resolved actinic flux and published absorption cross sections and photodissociation quantum yields. For other species which photolyse at near-UV wavelengths, such as HCHO and CH3CHO, the photolysis rates were calculated by scaling to the ratio of clear-sky j(O1D) to observed j(O1D) to account for clouds. For species which photolyse further into the visible spectrum, the ratio of clear-skyj(NO2) to observedj(NO2) was used. The variation in the clear-sky photolysis rates (j) with the solar zenith angle (χ) was calculated within the model using the following expression (Eq. 1):
with the parameters l,m and n optimised for each photolysis frequency (see Table 2 in Saunders et al., 2003).
A constant H2 concentration of 500 ppbv was assumed (Forster et al., 2012). The model inputs were updated every 15 min, and the species that were measured more frequently were averaged to 15 min whilst the measurements with a lower time resolution were interpolated. The loss of all non-constrained, model-generated species by deposition or mixing was represented as a first-order deposition rate equivalent to 0.1 MH−1 (MH represents the height of the boundary layer). The effect of changing the deposition rate is minor, as shown in Fig. S1 in the Supplement. The model was run for the entirety of the campaign in overlapping 7 d segments. To allow all the unmeasured, model-generated intermediate species time to reach steady-state concentrations, the model was initialised with inputs from the first measurement day (16 November 2016) and spun up for 2 d before comparison to measurements were made. The model described above is from now on called MCM-base.
An additional model was run using higher-weight VOCs that were measured using a PTR-MS (proton transfer reaction mass spectrometer) to assess the effect on modelled radical species (OH, HO2 and RO2) and modelled OH reactivity, with this model run showing there is a <10 % effect on the radical concentration and OH reactivity (see Figs. S2 and S3 in the Supplement).
Table 1VOC species measured by the DC-GC-FID (dual-channel gas chromatography with flame ionisation detection) that have been constrained in the box model utilising the Master Chemical Mechanism.

Table 2Instruments and techniques used to measure key model constraints. Quoted are 2σ uncertainties for the measured trace gas species used in the modelling scenarios.
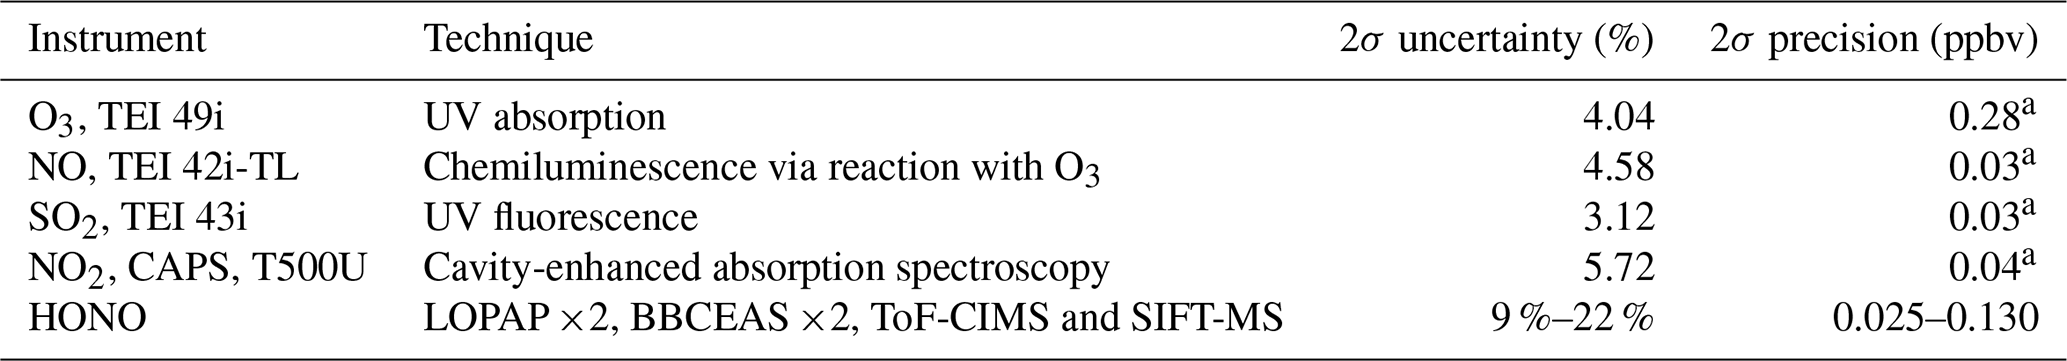
a Precision is given for 15 min averaging time. For details of the HONO measurements please see Crilley et al. (2019).
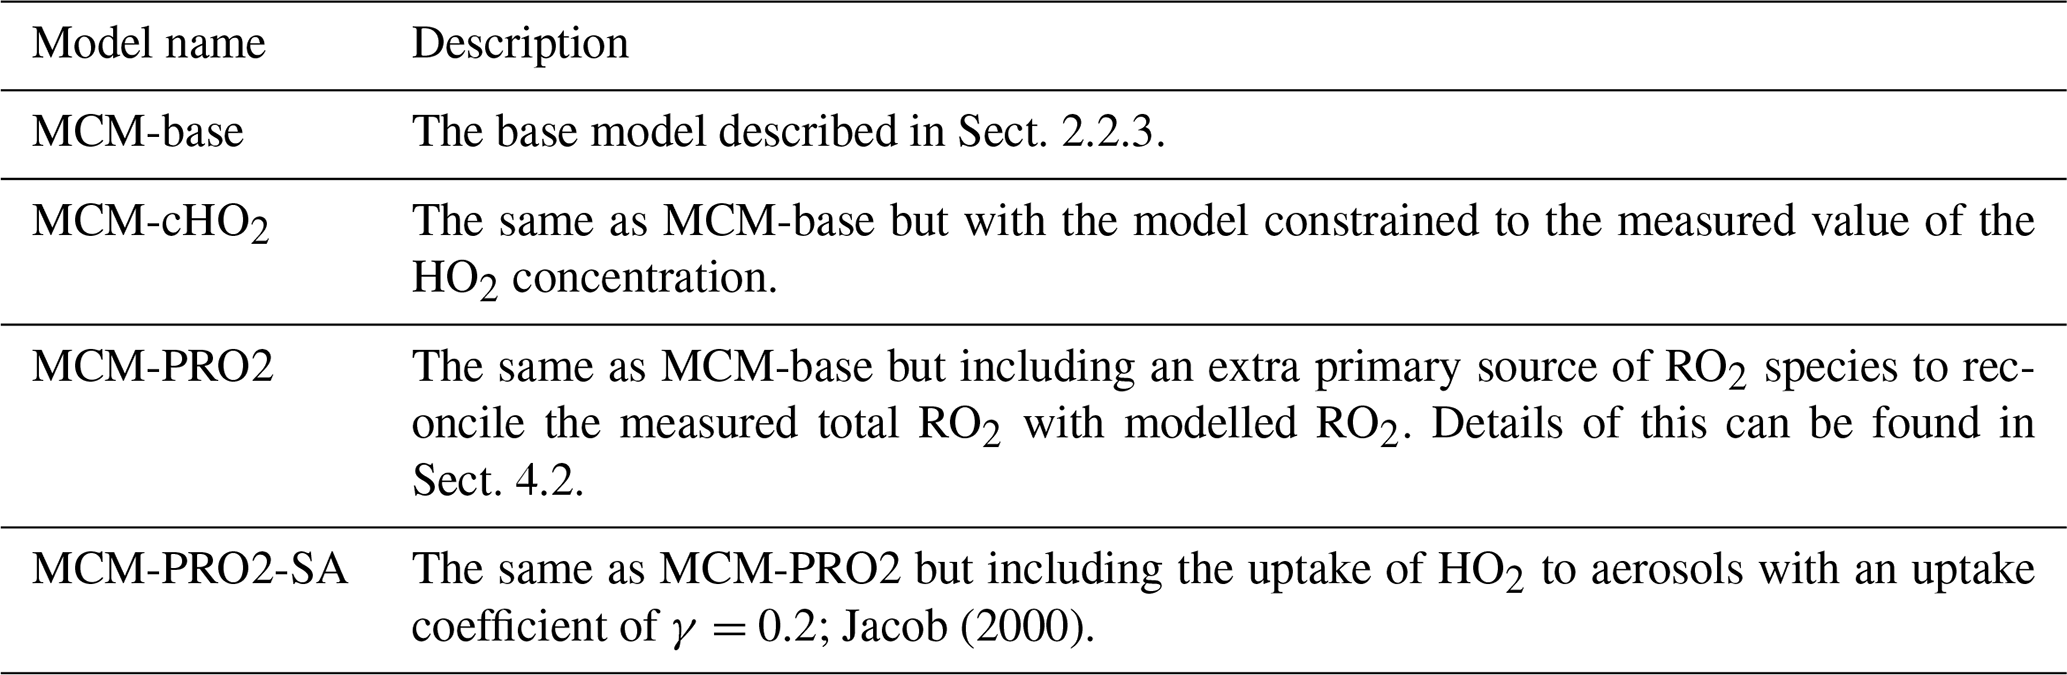
The model scenarios involved in this work are summarised in Table 3.
Table 3Description of the model scenarios and how they differ from the base model and the associated name of that model that has been used in the body of this work.
3.1 Chemical and meteorological conditions
During the campaign various chemical and meteorological conditions were observed, as shown in Fig. 4, including several haze periods. According to the meteorological standards (QX/T113-2010; Shi et al., 2019), haze is defined as (i) visibility <10 km at relative humidity (RH) < 80 % or (ii) if RH is between 80 % and 95 %, visibility <10 km and . For the purpose of this work the periods defined as haze are when PM2.5 exceeds 75 µg m−3. The wind rose for the winter 2016 campaign shows the dominant wind direction is from the northwest which coincides with higher wind speeds; southwesterly flows were also frequent in the winter APHH campaign (see Shi et al., 2019, for more details). The southwesterly wind direction observed in the winter 2016 campaign had the potential to bring more polluted air from the upwind Hebei province to the observation site in Beijing.
The time series of j(O1D), relative humidity (RH), temperature, CO, SO2, O3, NO, NO2, HONO, PM2.5, HCHO, butane and toluene are shown in Fig. 4. There were several co-located measurements of HONO made during the APHH campaign, and the HONO mixing ratios shown in Fig. 4 and used in the model were values taken from a combination of all measurements at the IAP site and recommended by Crilley et al. (2019), who provide further details for the methodology for selection of the HONO data. For a given time of day, large variations in j(O1D) during the campaign were observed, with the reductions caused by decreasing light levels driven by enhanced PM2.5. The temperature during the campaign varied between −10 and +15 ∘C. The relative humidity during the campaign varied between 20 % and 80 % RH, generally with higher RH coinciding with haze events. The time series for trace gas species showed high mole fractions for CO (1000–4000 ppbv), SO2 (5–25 pbbv) and NO (20–250 ppbv) but relatively low O3 (1–30 ppbv). HONO during the campaign was generally quite high, reaching up to 10 ppbv (Crilley et al., 2019). Frequent haze events were also observed during the winter campaign, with PM2.5 mass concentration reaching up 530 µg m−3. The VOC concentration (HCHO, toluene and butane) track pollution events and each other very well; the mole fraction of the VOCs varied between 0.2 and 11.3 ppbv.
The diel variation for j(O1D), NO, NO2, O3, Ox, HONO, boundary layer height (BLH) and CO separated into haze and non-haze periods is shown in Fig. 5; the periods defined as haze are shown in Table 4. During the haze events j(O1D) decreased by ∼50 % at midday (all times are in CST), as shown in Fig. 5. The photoactivity of j(HONO) and j(NO2) extends further into the visible region of the solar spectrum compared with j(O1D), and so the reductions in their photolysis rates within haze are less: ∼40 % for j(HONO) and ∼35 % for j(NO2) as discussed in Hollaway et al. (2019). During polluted and hazy periods NO on average reached 100 ppbv at 08:00; on some days NO was close to 250 ppbv, some of the highest levels ever recorded during an urban field campaign. On clearer days, the peak NO was ∼40 ppbv at 08:00 CST. A distinct increase in CO, NO2 and SO2 was also observed during haze periods, but no clear diurnal pattern in and outside of haze for these species was observed, as shown in Fig. 5. The O3 during the haze periods reduced on average by a factor of 3, due to titration by reaction with the high concentrations of NO observed. NO and O3 show an anti-correlation during the cleaner periods due to their inter-conversion. The sum of NO2 and O3, Ox, increased during pollution periods from 40 ppbv to a maximum of 53 ppbv on average. HONO in both clean and haze periods shows a distinct diel pattern, with a large decrease in the morning from loss through photolysis and a minimum in the afternoon; a large increase in HONO concentration overnight probably originates from heterogeneous sources (i.e. NO2 converting to HONO on humid surfaces; Finlayson-Pitts et al., 2003; Lee et al., 2016; Li et al., 2012; Lu et al., 2018; Zhang et al., 2016b; Zhou et al., 2003). The HONO concentration was a factor of 3 higher on average during haze periods at midday than during the clearer periods. The boundary layer height (BLH) shows a similar diurnal variation in and outside of haze, although the maximum BLH in haze is shifted to 14:30 compared to 12:30 outside of haze. The maximum and minimum BLH is similar in and outside of haze and shows that containment is not the only driving force for pollution periods.
Table 4The different haze periods observed during the winter campaign. Table recreated from Shi et al. (2019), in which further details can be found.

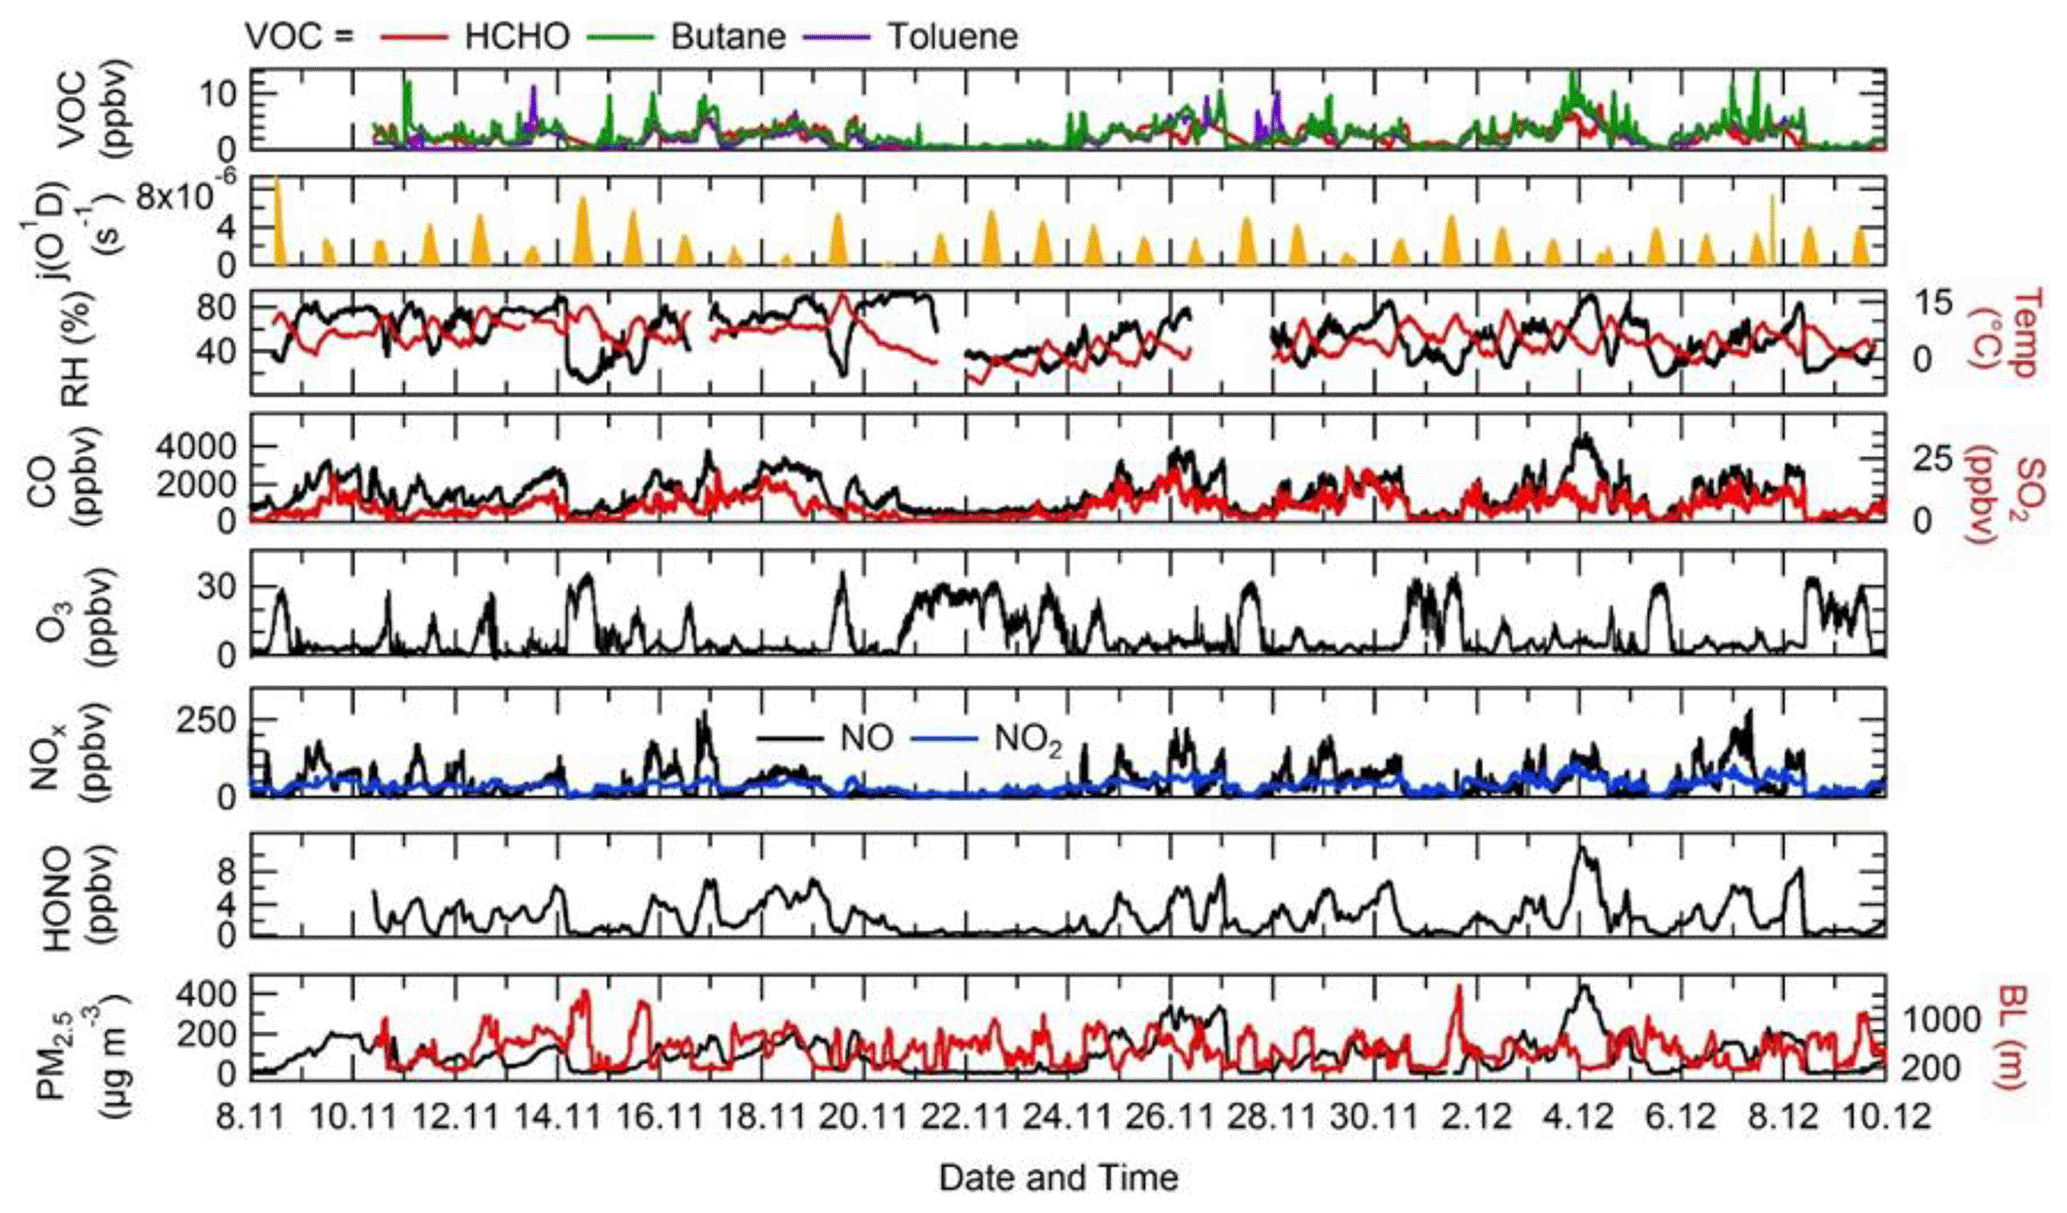
Figure 4Time series of j(O1D), relative humidity (RH), temperature (Temp), CO, SO2, O3, NOx, HONO, the boundary layer (BL), PM2.5, HCHO, butane and toluene from 8 November to 10 December 2016 at the Institute of Atmospheric Physics (IAP), Beijing.

Figure 5Comparison of the median average diel variation for j(O1D) (s−1), NO (ppbv), O3 (ppbv), CO (ppbv), Ox (ppbv), NO2 (ppbv), HONO (ppbv) and boundary layer height (m) in and outside of haze events, denoted by solid red and blue lines, respectively. The dashed lines represent the interquartile range for the respective species and pollution period.
3.2 Steady-state calculation of OH
Using measured quantities, a steady-state approach has been used to calculate the OH concentrations for comparison with measurements and also to determine the major sources of OH measured during the campaign. The photostationary steady-state equation for OH, obtained from , is given by a balance of the rate of production and the rate of destruction of OH:
where p(OH) is the measured rate of OH production from ozone photolysis and the subsequent reaction of O(1D) with water vapour, k is the rate coefficient for the reaction of HO2 with NO at the relevant temperature, and k(OH) is the measured OH reactivity. Equation (2) is a simplification and only takes into account the production of OH from two photolysis sources (O3 and HONO) and from the reaction of HO2+NO. O3+alkene and HO2+O3 reactions are not included as, owing to the generally low ozone experienced, these were found to contribute <1 % to the total OH production, as discussed in the MCM modelling section below. The pseudo-first-order rate of loss of OH was constrained using the measured OH reactivity during the campaign and hence includes all loss processes for OH.
Figure 6 shows the steady-state calculation for OH between 2 and 8 December 2016 where it is compared with the measured OH concentrations. These days were chosen as full data coverage for HONO, NO, j-value, radical and k(OH) measurements were available. The agreement between the observed OH and OH calculated by equating the rate of OH produced from HO2+NO and HONO photolysis and the loss of OH by reaction with all of its sinks, Eq. (2), is very good. The agreement highlights that the OH budget can be determined by field measurements of the parameters necessary to quantify its rate of production and loss and is closed to within 10 %, well within the 26 % error in the OH measurements themselves. The closure of the experimental budget suggests that measured OH and HO2 are internally consistent and that just from measured quantities the rate of production and the rate of destruction are the same within uncertainties. Although on 4 December 2016 the PSS (photostationary steady state) overpredicts the measured OH by a factor of ∼2.5, the differences between the PSS and measured OH could be due to a variety of reasons including errors in OH, HO2, NO, kOH and HONO measurements and NO segregation across the site. A further discussion on the PSS for 4 December can be found in Sect. S1.6 in the Supplement. The reaction of HO2 and NO is the dominant source of OH (∼80 %–90 %) for Beijing during wintertime, owing to NO being so high in concentration. The photolysis of HONO is the second-most-important source producing ∼10 %–20 % of OH (and a much larger primary source of radicals in general as discussed below). The PSS has been separated into haze and non-haze events, and it can be seen that during haze events the PSS captures the OH concentration, although it does overpredict the OH concentration by ∼1.35 between 09:30 and 14:30 in haze events. However, the overprediction by the PSS in haze events is highly influenced by the overprediction on 4 December 2016, whilst under non-haze conditions the PSS captures the OH concentration very well throughout the day. The production of HONO increases in non-haze events (∼19 %) compared with haze events (∼7 %). Due to low concentrations of O3 in winter, the photolysis of O3 and the subsequent reaction of O(1D) with water vapour is not an important source, being <1 % of the rate of production. In addition, the reaction of O3 with alkenes (whose concentrations were elevated in the winter) also contributed <1 % to the rate of OH production. The different HONO measurements present during the APHH campaign varied by up to ∼40 %; the sensitivity of the PSS on measured HONO is shown in Sect. S1.5 in the Supplement.
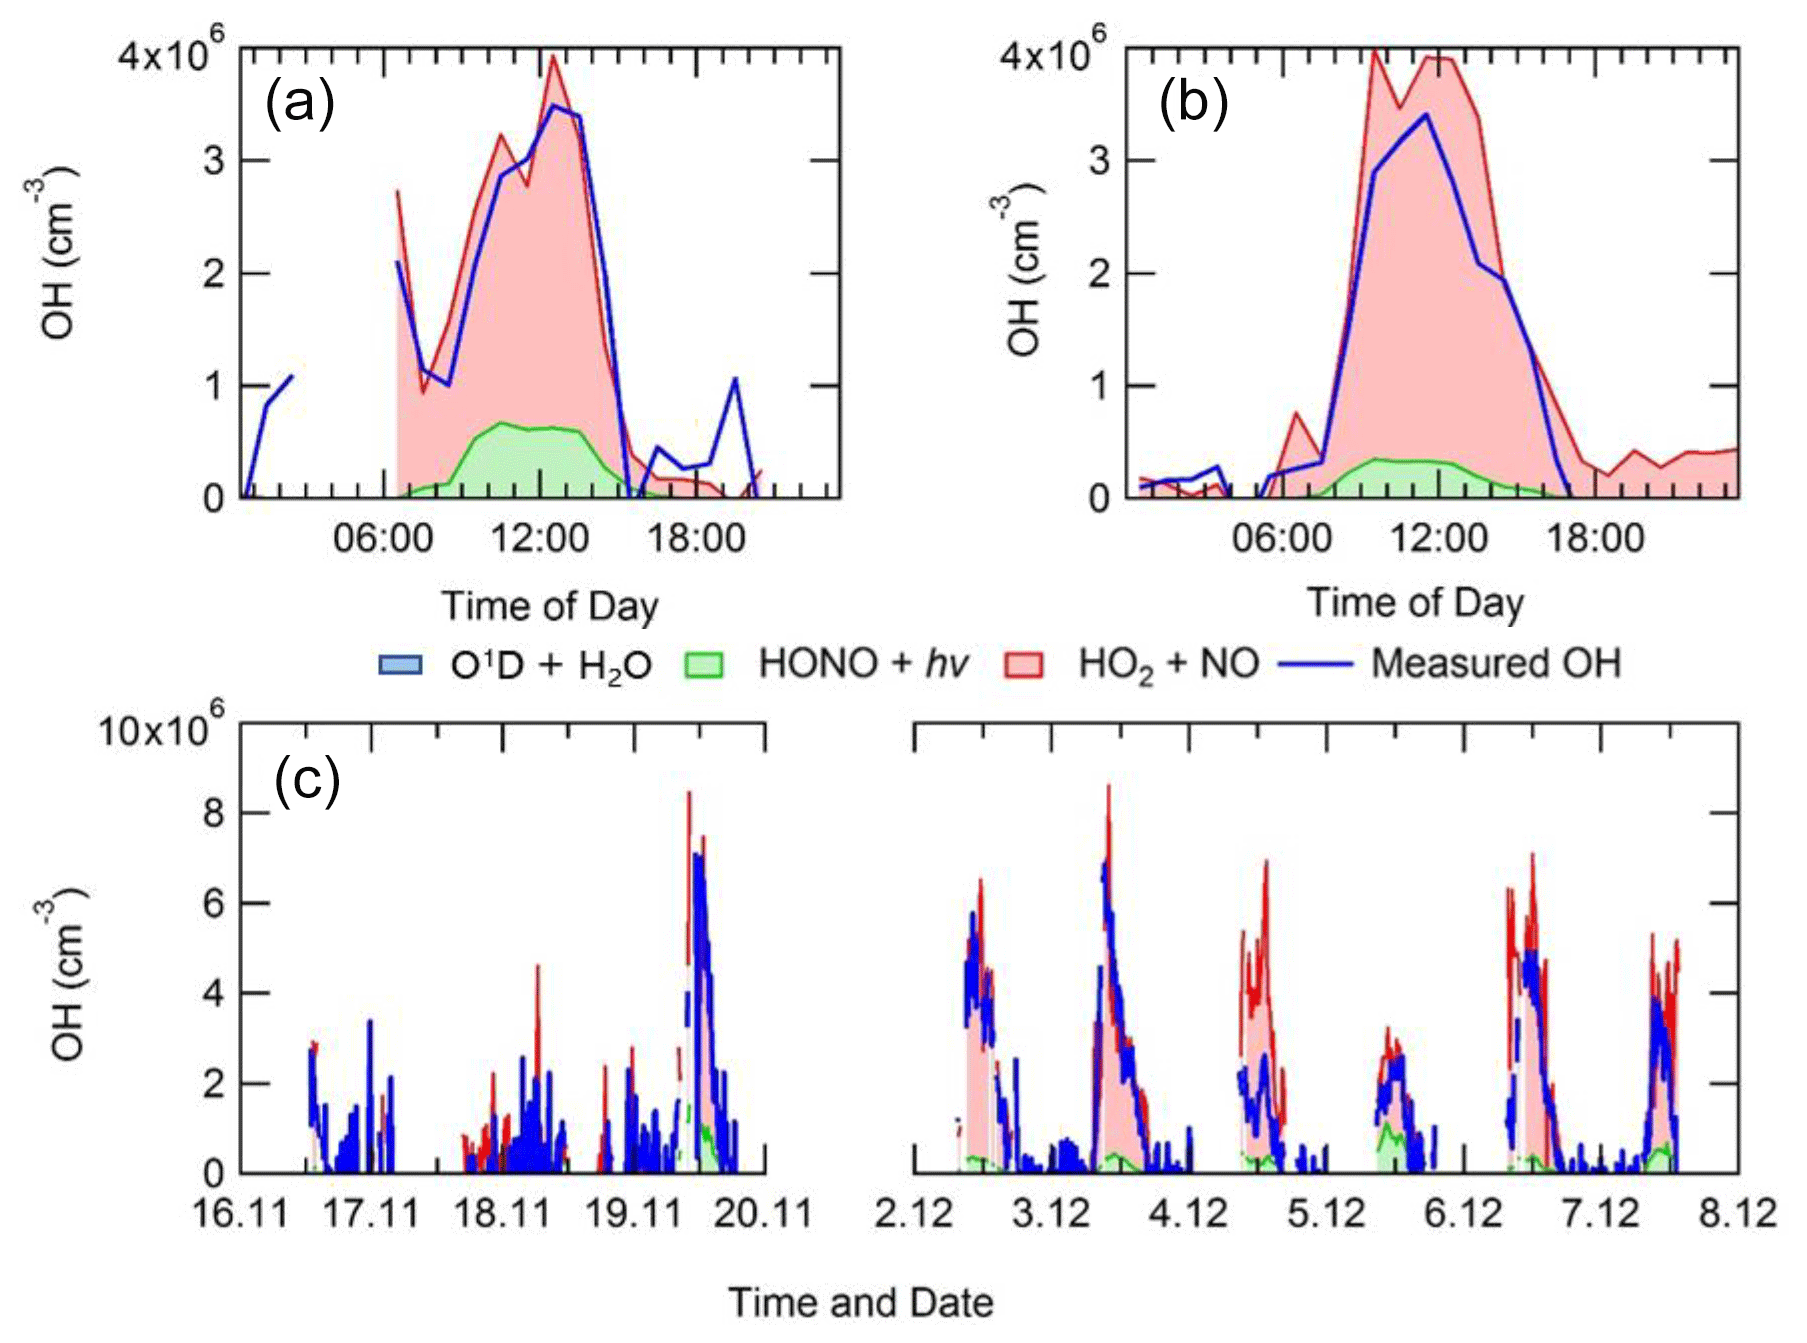
Figure 6Average diel profile for observed and steady-state calculated OH concentrations for (a) non-haze and (b) haze periods. (c) A comparison time series for the steady-state calculation of OH and measured OH. The OH generated by O1D+H2O, although included in the key, is too small to be visible.
3.3 Comparison of measured OH, HO2, RO2 radical concentrations and OH reactivity with calculations using a box model and the Master Chemical Mechanism
Figure 7 shows a comparison between measured and modelled (MCM-base, defined in Table 3) OH, HO2, RO2 (speciated into simple and complex RO2, defined in Sect. 2.2.1) and OH reactivity. As seen in Fig. 7, the measured daily maximum for the radical species varied day-to-day over the range 2.5 to 8×10⁶, 0.07 to 1.5×10⁸ and 0.8 to 2×108 cm−3 for OH, HO2 and the sum of RO2, respectively. The daily maximum concentration for the sum of simple RO2 varied between 0.2 to 1.3×108 cm−3, and the complex RO2 daily maximum concentration varied between 0.2 and 0.6×108 cm−3. On average, the model underpredicts the OH, HO2 and RO2 concentrations by a factor of 1.7, 5.8 and 25, as shown in Fig. 8. The figure shows the diel profile of OH, HO2 and RO2 averaged over the campaign, with a daily average maximum of 2.7×10⁶, 0.39×10⁸ and 0.88×108 cm−3 for OH, HO2 and total RO2, respectively. The complex and simple RO2 show a very similar diurnal profile, both peaking at 12:30 at a concentration of 4.4×10⁷ and 4.5×10⁷ molecules cm−3, respectively. The model underpredicts the simple and complex RO2 at 12:30 by a factor of 30 and 22, respectively. The large underprediction of both simple and complex RO2 highlights the needs for the additional primary sources forming both simple and complex species in the model. Section 4.2 explores the impact of additional primary source of RO2 added into the model on OH and HO2. The total measured OH reactivity during the campaign was quite large and varied between 10 to 145 s−1. Averaged over the full campaign period, the contributions to reactivity came from CO (17.3 %), NO (24.9 %), NO2 (22.1 %), alkanes (3.0 %), alkynes and alkenes (10.8 %), carbonyls (5.7 %), terpenes (3.7 %), and modelled intermediates (6.77 %). Unusually, the largest contribution to OH reactivity is from reaction with NO. As shown in Figs. 7 and 8, OH reactivity is reproduced within 10 %, implying that the OH reactivity budget is captured well by the model. The model OH reactivity is the sum of all measured and modelled intermediate species multiplied by the respective rate coefficient for their reaction with OH.
Consistent with the steady-state calculation and as shown also in Fig. 8, when the box model was constrained to the concentrations of HO2 measured using FAGE in the field (from now on this model scenario is called MCM-cHO2), the measured and modelled OH concentration are in agreement within 10 % which is less than the 26 % error in the OH measurements. MCM-cHO2 also increases the RO2 concentration by ∼3.5 compared to MCM-base, but the RO2 is still underpredicted by a factor of The HO2 was constrained in the model by inputting the HO2 concentration at every 15 min time step.

Figure 7Time series of OH, (b) HO2, (c) total RO2, (d) partly speciated RO2, and (e) measured (black) and modelled (stacked plot) OH reactivity. For (a–c), the raw measurements (6 min data acquisition cycle) are open blue circles with 15 min average represented by the solid blue line. The 15 min model output in (a–c) is represented by the red line for OH, HO2 and RO2. The partly speciated RO2 is separated into simple (open gold circles) and complex (open purple circles). The individual contributions of the model to the OH reactivity is given below the graph. The grey shaded areas show the haze periods when PM2.5>75 µg m−3.
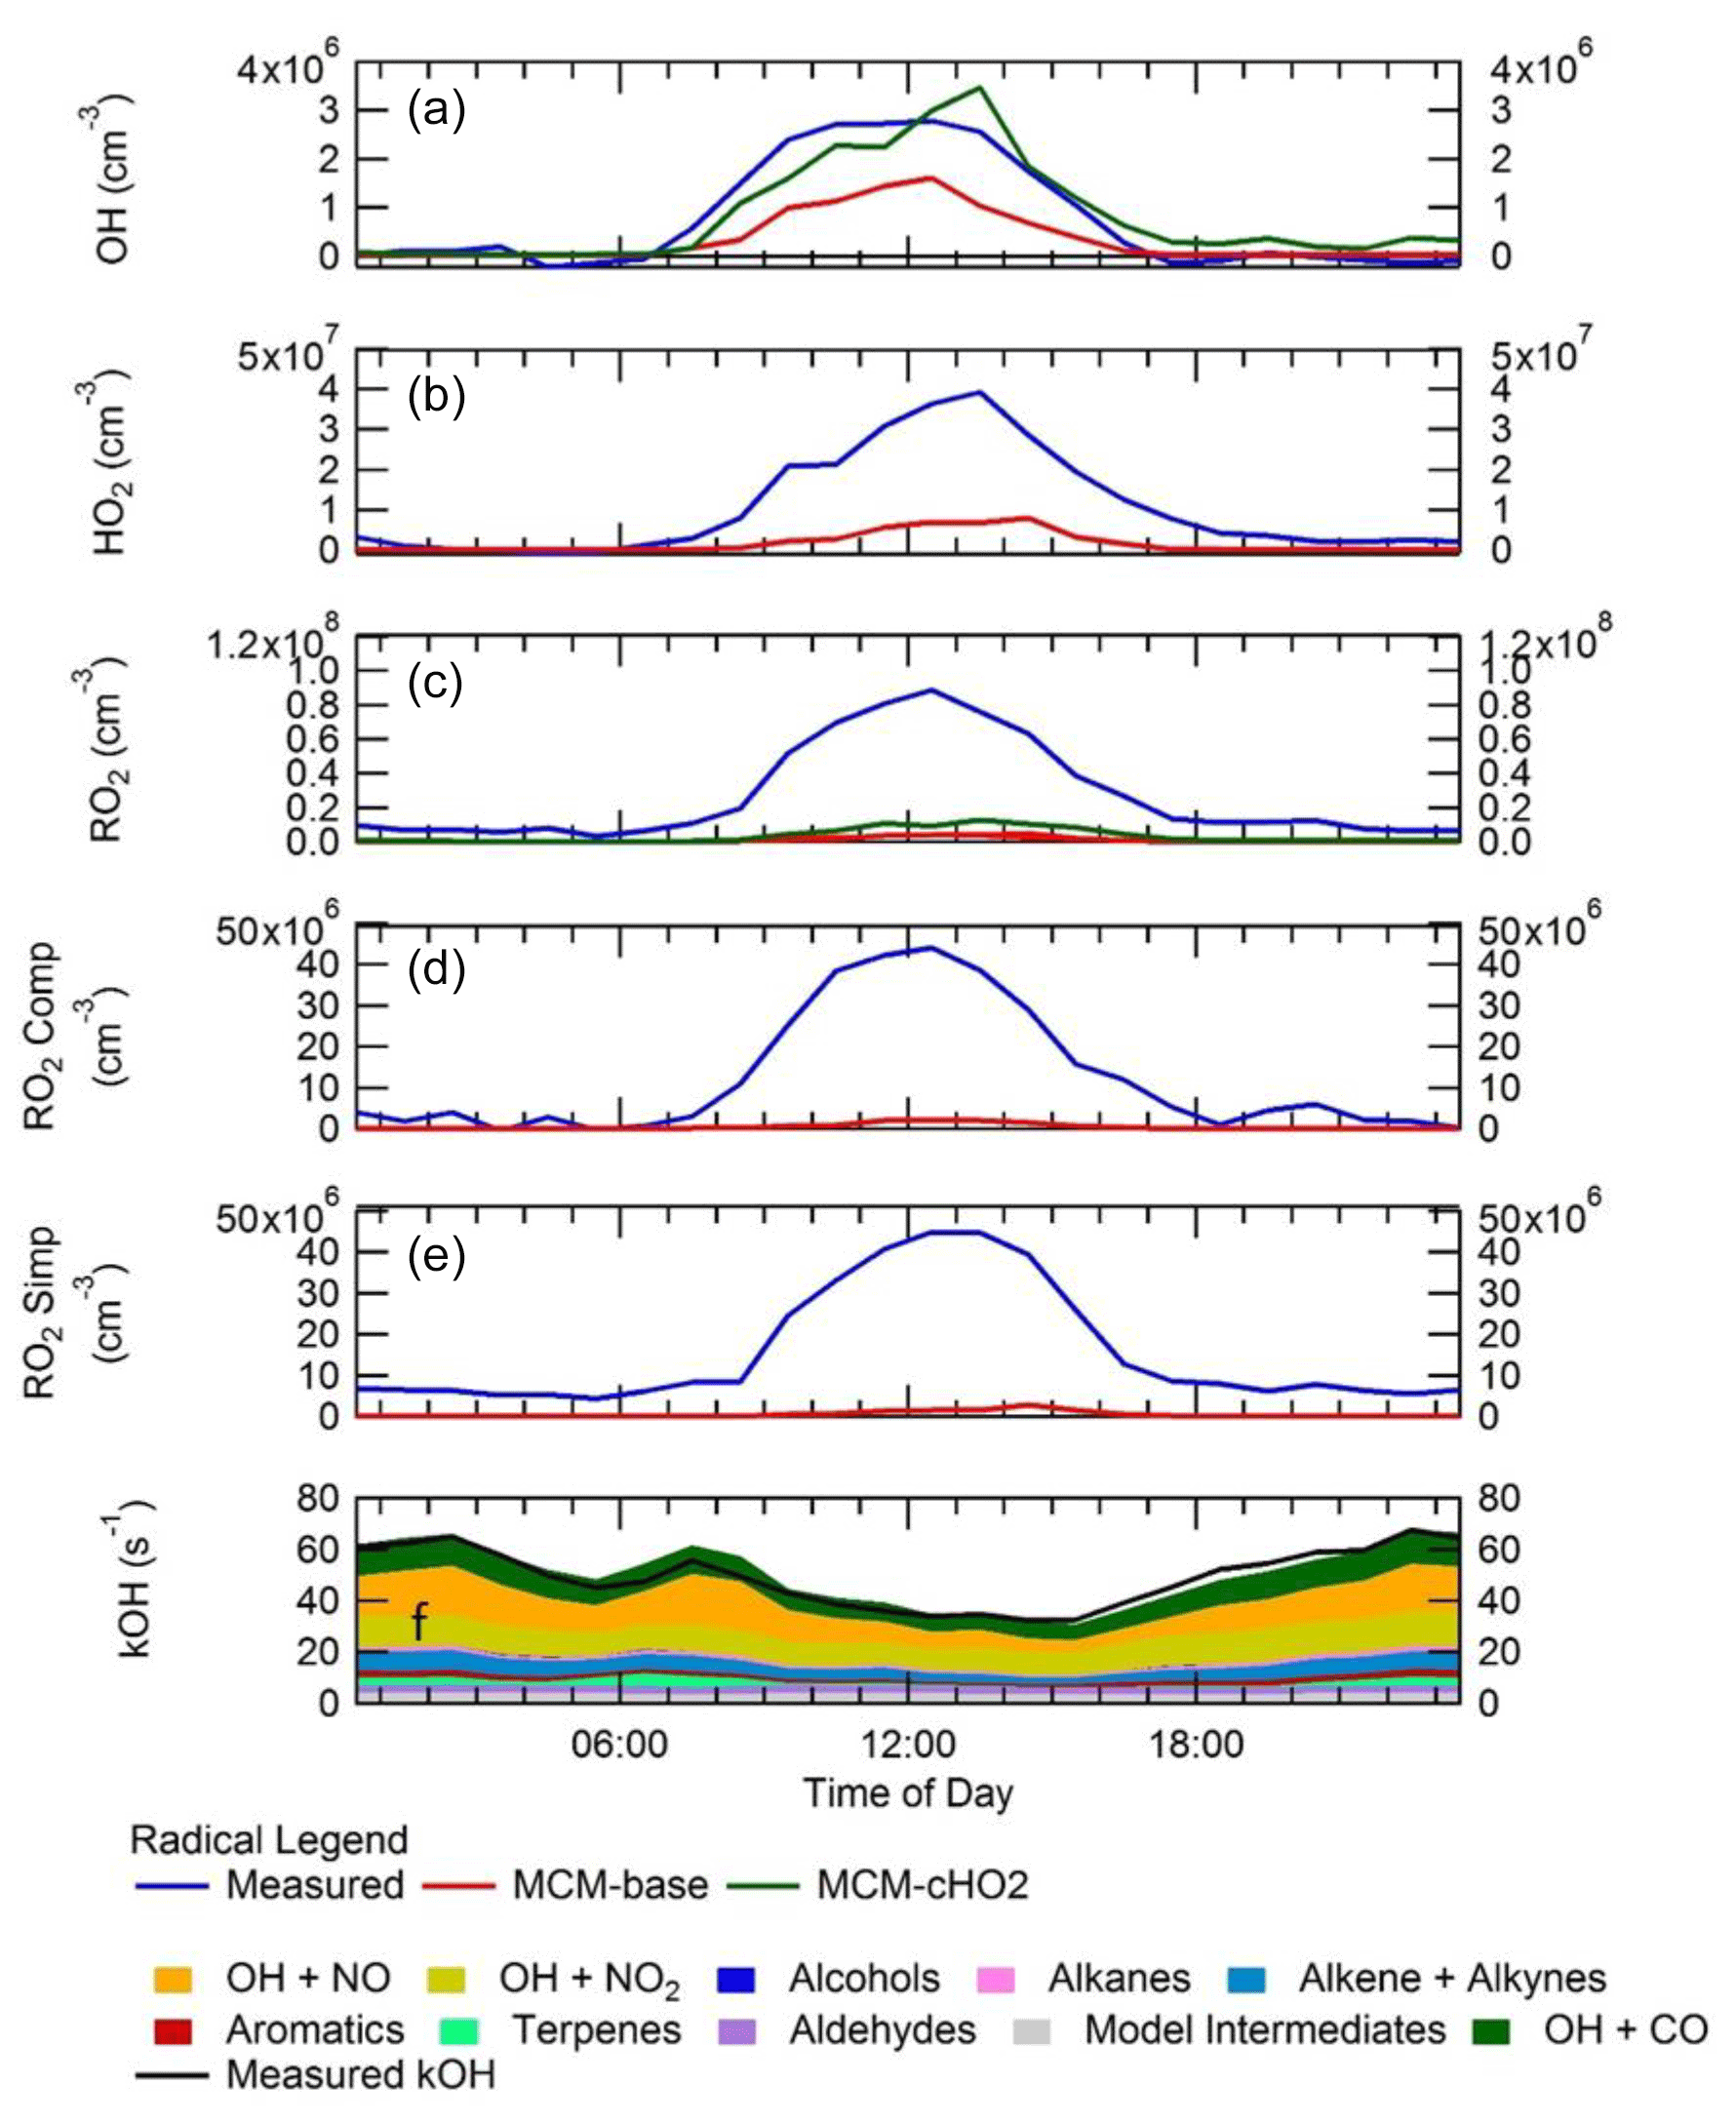
Figure 8Campaign-averaged diel profile of OH (a), HO2 (b), the sum of RO2 (c), complex RO2 (d) and simple RO2 (e) for measurements (blue) and box model calculations, MCM-base (red) and MCM-cHO2 (green). See text for descriptions of each model scenario. (f) OH reactivity (s−1) for measurements (black line) and model (stacked plot) with the contribution to reactivity from different measured species and modelled intermediates shown in the key.
The ability of the model to reproduce (to within ∼10 %) both the OH reactivity and the OH concentration when constrained to measured HO2 (in MCM-cHO2) but not to reproduce RO2 radicals (whether constrained or not to HO2) is suggestive of an incomplete representation of the chemistry of RO2 radicals in the winter Beijing environment. The significant model underprediction of RO2 implies either that additional sources of RO2 radicals are required or that it is inaccuracies in the recycling chemistry within RO2 species which lead to an overestimate of the loss rate of RO2 under the high-NOx conditions experienced in central Beijing. The cause of the model underprediction of RO2 is explored further in Sect. 4.
As summarised in Table 5, previous winter campaigns, where the environment controlling peroxy radicals is generally dominated by NO, have shown a similar underprediction of radical species at high levels of NOx (above 3 ppbv of NO; Lu et al., 2013; Ma et al., 2019; Tan et al., 2017, 2018). For the BEST-ONE campaign, which took place in suburban Beijing (∼60 km from the centre), it was suggested that in order to reconcile the model with the measurements, an additional source of RO2 was required.
The OH concentrations measured are surprisingly high for a winter campaign where photolysis rates and RH are low; the average 12:00 OH maximum for the campaign was 2.7×10⁶ molecules cm−3. Comparisons with the level of agreement between measured and modelled radicals for other winter field campaigns are given in Table 5. The OH concentration is ∼3, 2.3, 2, 1.65 and 1.5 times larger than winter measurements in New York (Ren et al., 2006), Beijing (Ma et al., 2019), Tokyo (Kanaya et al., 2007), Birmingham (Emmerson et al., 2005) and the BEST-ONE (Tan et al., 2018) campaigns, respectively, and similar to the campaign in Boulder (Kim et al., 2014). However, it should be noted that the Boulder campaign took place at a time of the year (late February and March) closer to mid-summer when there are higher levels of radiation and water vapour (see Table 5 for details). As shown in Fig. 7, the elevated OH concentrations in haze events – for example up to 6×10⁶ molecules cm−3 of OH was observed on 3 December 2016 – suggests gas-phase oxidation is still highly active (this is explored more in Sects. 4.3 and 4.4).
Table 5Previous field measurements of OH, HO2 and RO2 that have taken place during wintertime in urban areas, together with the campaign average observed-to-modelled ratio. Modified from Kanaya et al. (2007).

4.1 Sources and sinks of ROx radicals
As shown in Fig. 9, primary production of new radicals (radicals defined as RO) via initiation reactions was dominated by the photolysis of HONO (68 %, averaged over the campaign), with a small contribution from the photolysis of HCHO (2 %), photolysis of carbonyl species (8 %) and ozonolysis of alkenes (21 %). An increased rate of production of ROx radicals is observed during haze events, which is counterbalanced by an increase in the rate of termination. Figure 9 shows that alkene ozonolysis accounts for close to 2×10⁶ production of ROx radicals at night under non-haze conditions but does not play an important role in the production of ROx radicals at night during haze events and is reflected by little to no OH observed during the night-time as shown in Fig. 8a. Similarly ozone photolysis does not appear to play an important role for the formation of OH, due to the low O3 during the campaign, which is presumably a consequence of local titration via NO, as shown in Figs. 4 and 5. In addition, the low temperatures observed during winter caused a low water vapour concentration (∼0.5 % mixing ratio), and hence the fraction of O1D formed from the photolysis of ozone and which reacts with water vapour to form OH compared with collisional quenching (by N2 and O2) to form O(3P) was also low and varied between 1 % to 7 % throughout the campaign. Figure 9 shows that almost all of the RO2 species in the model are derived from OH sources, highlighting the need for additional primary RO2 sources in the model.
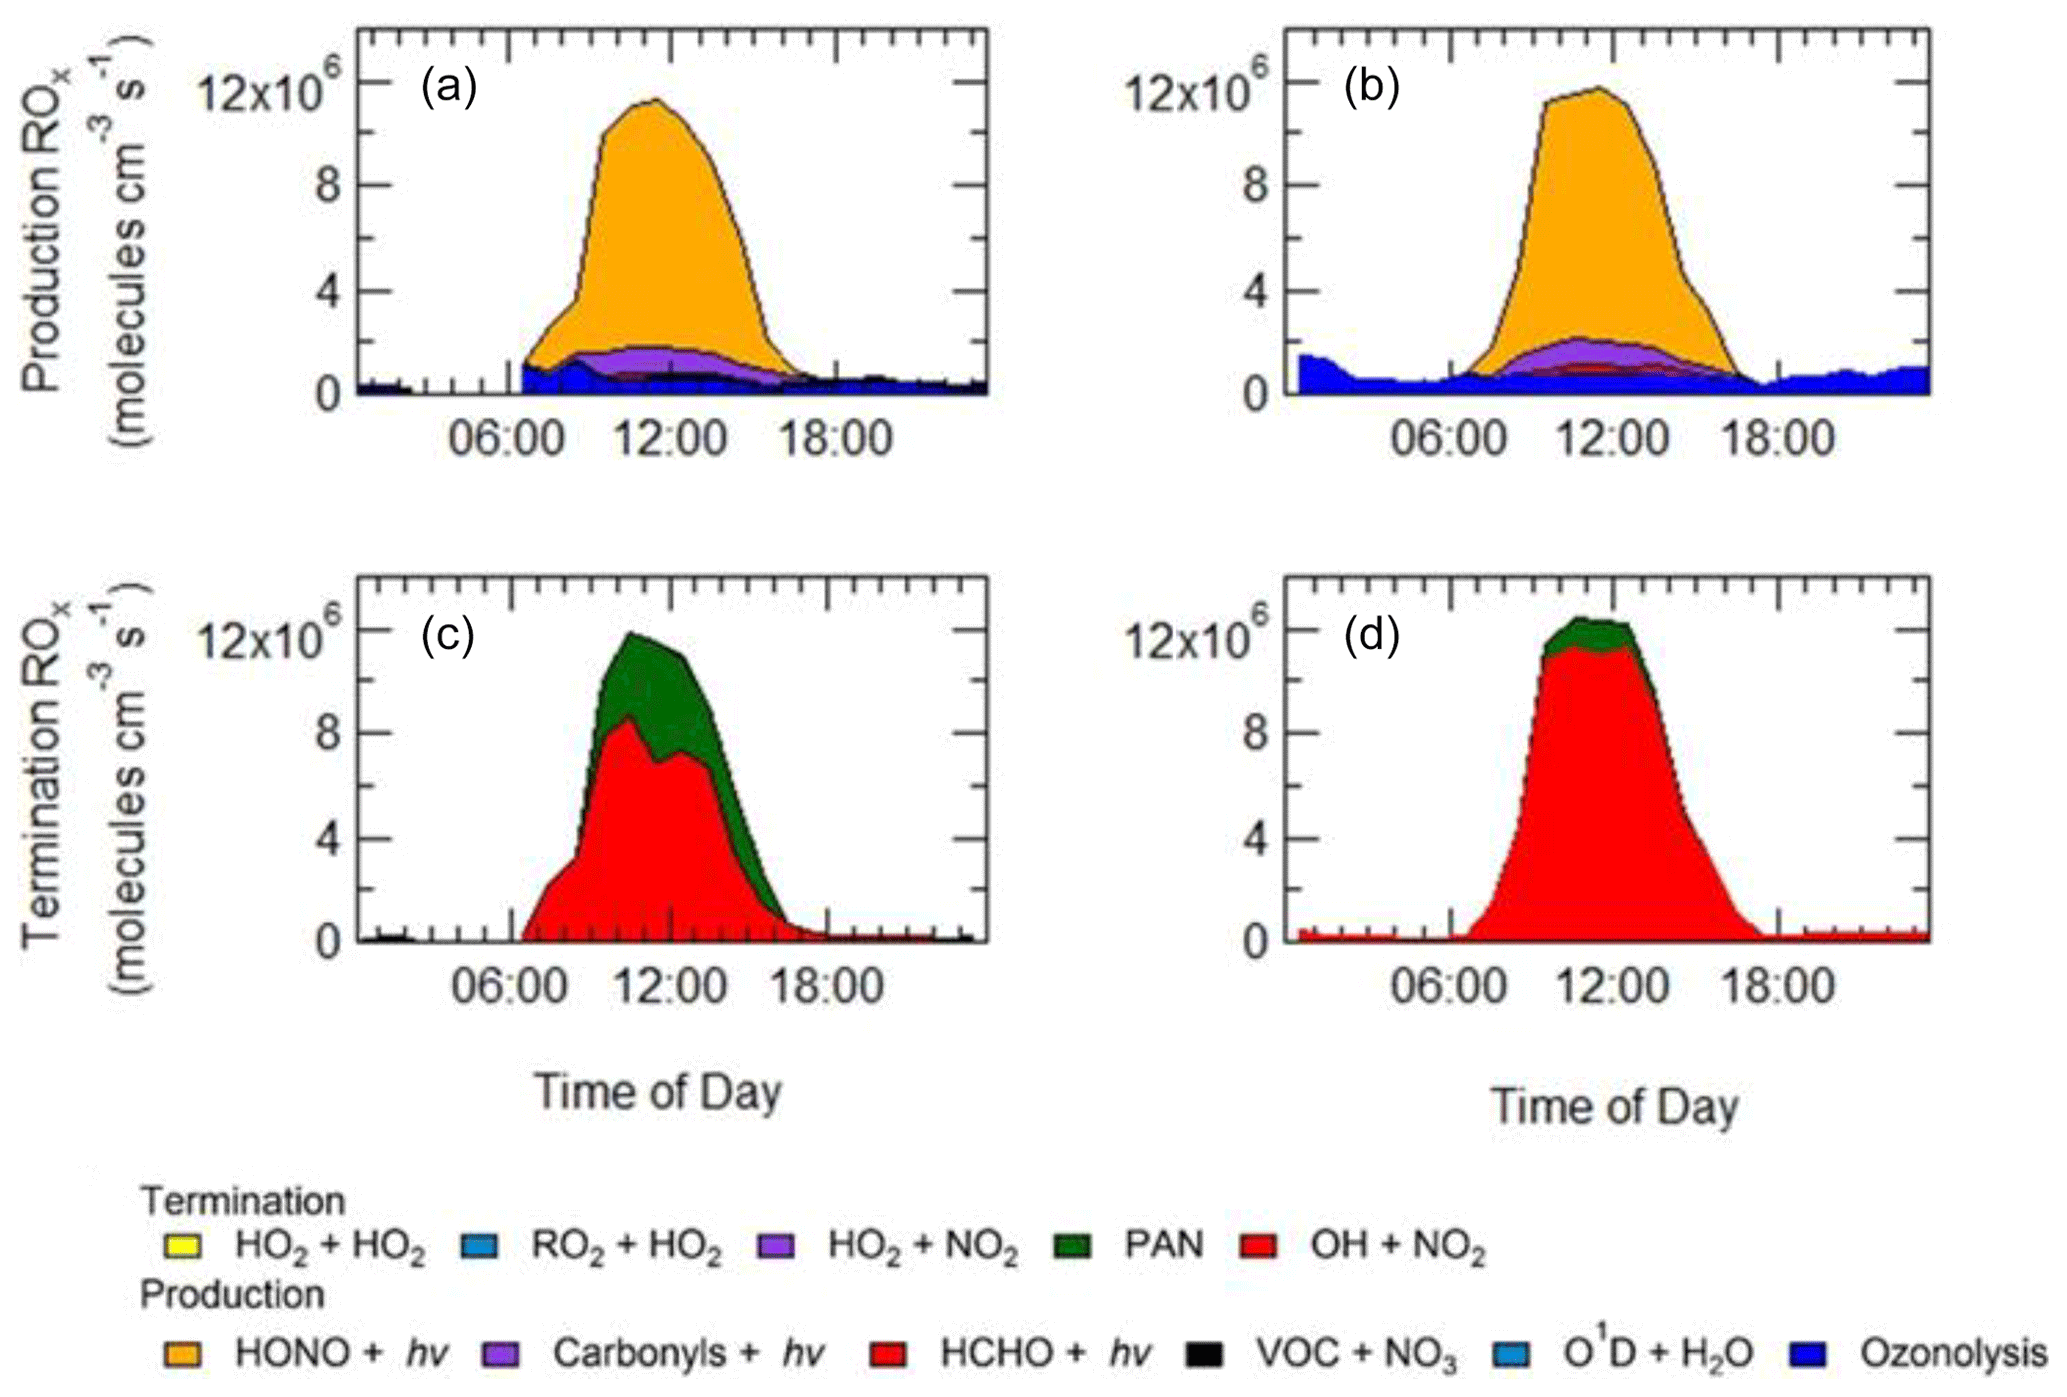
Figure 9Rates of primary production (a, b) and termination (c, d) for ROx radicals (defined as ) calculated for MCM-base model separated into haze (b, d) and non-haze (a, c) periods. The definition of haze is when PM2.5 exceeds 75 µm−3. The production from O1D + H2O and VOC + NO3 and the termination reactions RO2+HO2, HO2+HO2 and HO2+NO2, although shown in the key, are not visible and contributed <1 % of the total production and termination. The cycling between OH+NO and HONO photolysis has been removed from the termination reactions, and only HONO production from sources other than OH+NO is shown in the net production rates.
The importance of HONO photolysis as a source of OH has been highlighted in several previous studies in both urban and suburban sites as summarised in Table 5.
The BEST-ONE campaign, 60 km north of Beijing, showed HONO produced ∼46 % of the ROx during the campaign, although in comparison to the APHH campaign, ozonolysis and carbonyl photolysis in BEST-ONE made up a more significant portion of primary production of radicals, 28 % and 9 %, respectively. The larger contribution to primary production from ozonolysis during BEST-ONE is probably due to higher ozone concentrations (3 times higher at midday, Fig. 9). Both the APHH and BEST-ONE campaigns showed that ozone photolysis followed by the reaction of O(1D) atoms was not an important source of new radicals. A comparison between the primary production routes observed during the APHH and previous urban winter campaigns can be found in Sect. S1.2 in the Supplement.
In both haze and non-haze conditions, the key reaction which caused a termination of the radical cycling chain reaction was from OH+NO2. Figure 9 shows that OH+NO2 contributes up to 94 % and 65 % in haze and non-haze, respectively. Figure 9 shows that during non-haze conditions contribution to termination from the net formation of PAN (peroxy acetyl nitrate; ∼35 %) becomes important; but under haze conditions less than 6 % of ROx termination comes from the net formation of PAN. In comparison to the BEST-ONE campaign, during the clean periods (clean periods are defined as times when kOH < 15 s−1), the termination reactions of OH+NOx, net PAN and peroxy self-reaction contributed ∼55 %, 8 % and 30 %, respectively (Tan et al., 2018). During the polluted periods in the BEST-ONE campaign, the termination reaction of OH+NO2 increased to 80 %, and the net-PAN formation and peroxy self-reaction decreased to ∼12 % and 6 %, respectively. The BEST-ONE campaign shows very similar trends to the APHH campaign, except the APHH campaign shows a higher contribution to termination from OH+NO2 even in cleaner periods. This is potentially due to the higher NO values observed during the APHH (located in central Beijing ∼6.50 km from the Forbidden City) campaign compared to the BEST-ONE campaign. The work that took place at Peking University (PKU) (Ma et al., 2019) in Beijing (∼11 km from the Forbidden City) shows a very similar trend to the APHH campaign with 86 % of the primary production of radicals produced from the photolysis of HONO during the polluted periods. The PKU campaign also showed <1 % production from O1D + H2O, whilst there were small contributions from ozonolysis (6 %) and photolysis of carbonyls (including HCHO, ∼7 %) during the polluted periods. Similarly to the APHH campaign, the termination of radicals during the PKU campaign during the polluted periods was dominated by OH+NO (55 %) and OH+NO2 (43 %), whilst there was a small contribution (∼2 %) from the net formation of PAN. The termination trend is very similar to that of the APHH campaign.
4.2 Dependence of radicals concentrations with NOx
Figure 10 shows the ratio of measured to modelled OH, which is close to 1 at or below 10 ppbv of NO, similar to the BEST-ONE campaign. Above 6 ppbv of NO the model underpredicts the OH concentration. As shown in Fig. 10, at ∼6 ppbv of NO, HO2 and RO2 are underpredicted by a factor of 5.4 and 18, respectively; similar peroxy radical underpredictions were reported from the BEST-ONE campaign (Tan et al., 2017, 2018), with HO2 and RO2 being underpredicted by a factor of 5 and 10 at 6 ppbv. Many previous urban campaigns have a more extensive data coverage at lower NOx values due to the smaller levels of NOx observed; however, no other campaign with in situ measurements of OH has experienced NO values of up to 250 ppbv as observed during APHH. Figure 10 shows that the measured-to-modelled ratio for OH, HO2 and RO2 increases with NO concentration; for OH the ratio initially increases and then plateaus above 30 ppbv. There have been some suggestions for the origin of the discrepancy that is observed between modelled and measured concentrations of radicals at high concentrations of NO. Dusanter et al. (2009) suggest that poor mixing of a point source of NO with peroxy radicals across a site may cause some of the model-to-measurement discrepancy observed. There were several instruments for NO measurements located around the site, and no differences in concentrations were observed; hence there was no evidence of any obvious segregation during APHH. Tan et al. (2017) suggest that there may be a missing source of peroxy radicals under high-NOx conditions. Alternatively, the measured-to-modelled discrepancy could be driven by unknown oxidation pathways of the larger, more complex, RO2 species that are present in these urban environments, whose laboratory kinetics are understudied.
When the MCM is constrained to the measurements of HO2 (MCM-cHO2), the model can replicate the OH measurements to within ∼10 %, within the 26 % error in the measurements, as shown in Fig. 8. In addition, the MCM-base model can replicate the OH reactivity to within 10 % (Fig. 8), implying that almost all of the major sources and sinks of OH are captured. The underestimation of HO2 by the model could be explained by the underestimation of RO2 by the model, owing to an insufficient rate of recycling of RO2 into HO2. Both the ability to replicate OH when the model is constrained to HO2 and OH reactivity being captured well by the model suggest the presence of unknown RO2 chemistry, either additional sources of RO2 radicals under high levels of NOx or unknown chemistry or behaviour of RO2 under high levels of NOx. Indeed, many rate coefficients in the MCM for the more complex RO2 species are based on structure–activity relationships (SARs) determined from studies of simpler RO2 species (http://mcm.leeds.ac.uk/MCM; Jenkin et al., 2019). During the APHH campaign, measurements of partially speciated RO2 species were made: simple RO2 (deriving from alkanes up to C3) and complex RO2 (deriving from alkanes >C4, alkene and aromatics); see experimental Sect. 2.2.1 and Whalley et al. (2013) for details on RO2 speciation. The dependence of the concentration of speciated RO2 measurements on [NO], as shown in Fig. 11, highlights that the concentration of complex RO2 species steadily decreases across the NO range, whilst the concentration of simple RO2 species starts to decrease rapidly above 2.5 ppbv. The chemistry of the simpler RO2 species with NO should be well understood, owing to a more extensive laboratory database of the rate coefficients and product branching, so the model discrepancy for RO2 species may be due to inaccuracies within the MCM for the degradation of the more complex RO2 species into these simple RO2 species. The degradation pathways of the complex RO2 species appear not to be well understood and may be the reason why the real concentration of simple RO2 species remains high even under high-NOx conditions, whereas the modelled simple RO2 concentration decreases at high NO levels. The effect of reducing the RO2 propagation rate to HO2 via reaction with NO has been investigated and is shown in Sect. S1.7 in the Supplement. The results show that reducing the rate constant by a factor of ∼10 does improve the modelled-to-measurement agreement by a factor of 8.3 for total RO2. However, RO2 is still underpredicted by a factor of ∼12 at the highest NO level. Also the increased RO2 concentration in the model does not recycle into HO2 or OH efficiently. This work highlights that uncertainties in the rate constant for RO2+NO for different RO2 species cannot be the only explanation for the underprediction of RO2 in the model.

Figure 10The ratio of measurement / model for OH (a), HO2 (b) and total RO2 (c) across the range of NO concentrations experienced, for daytime values only ( s−1). CI = confidence interval.
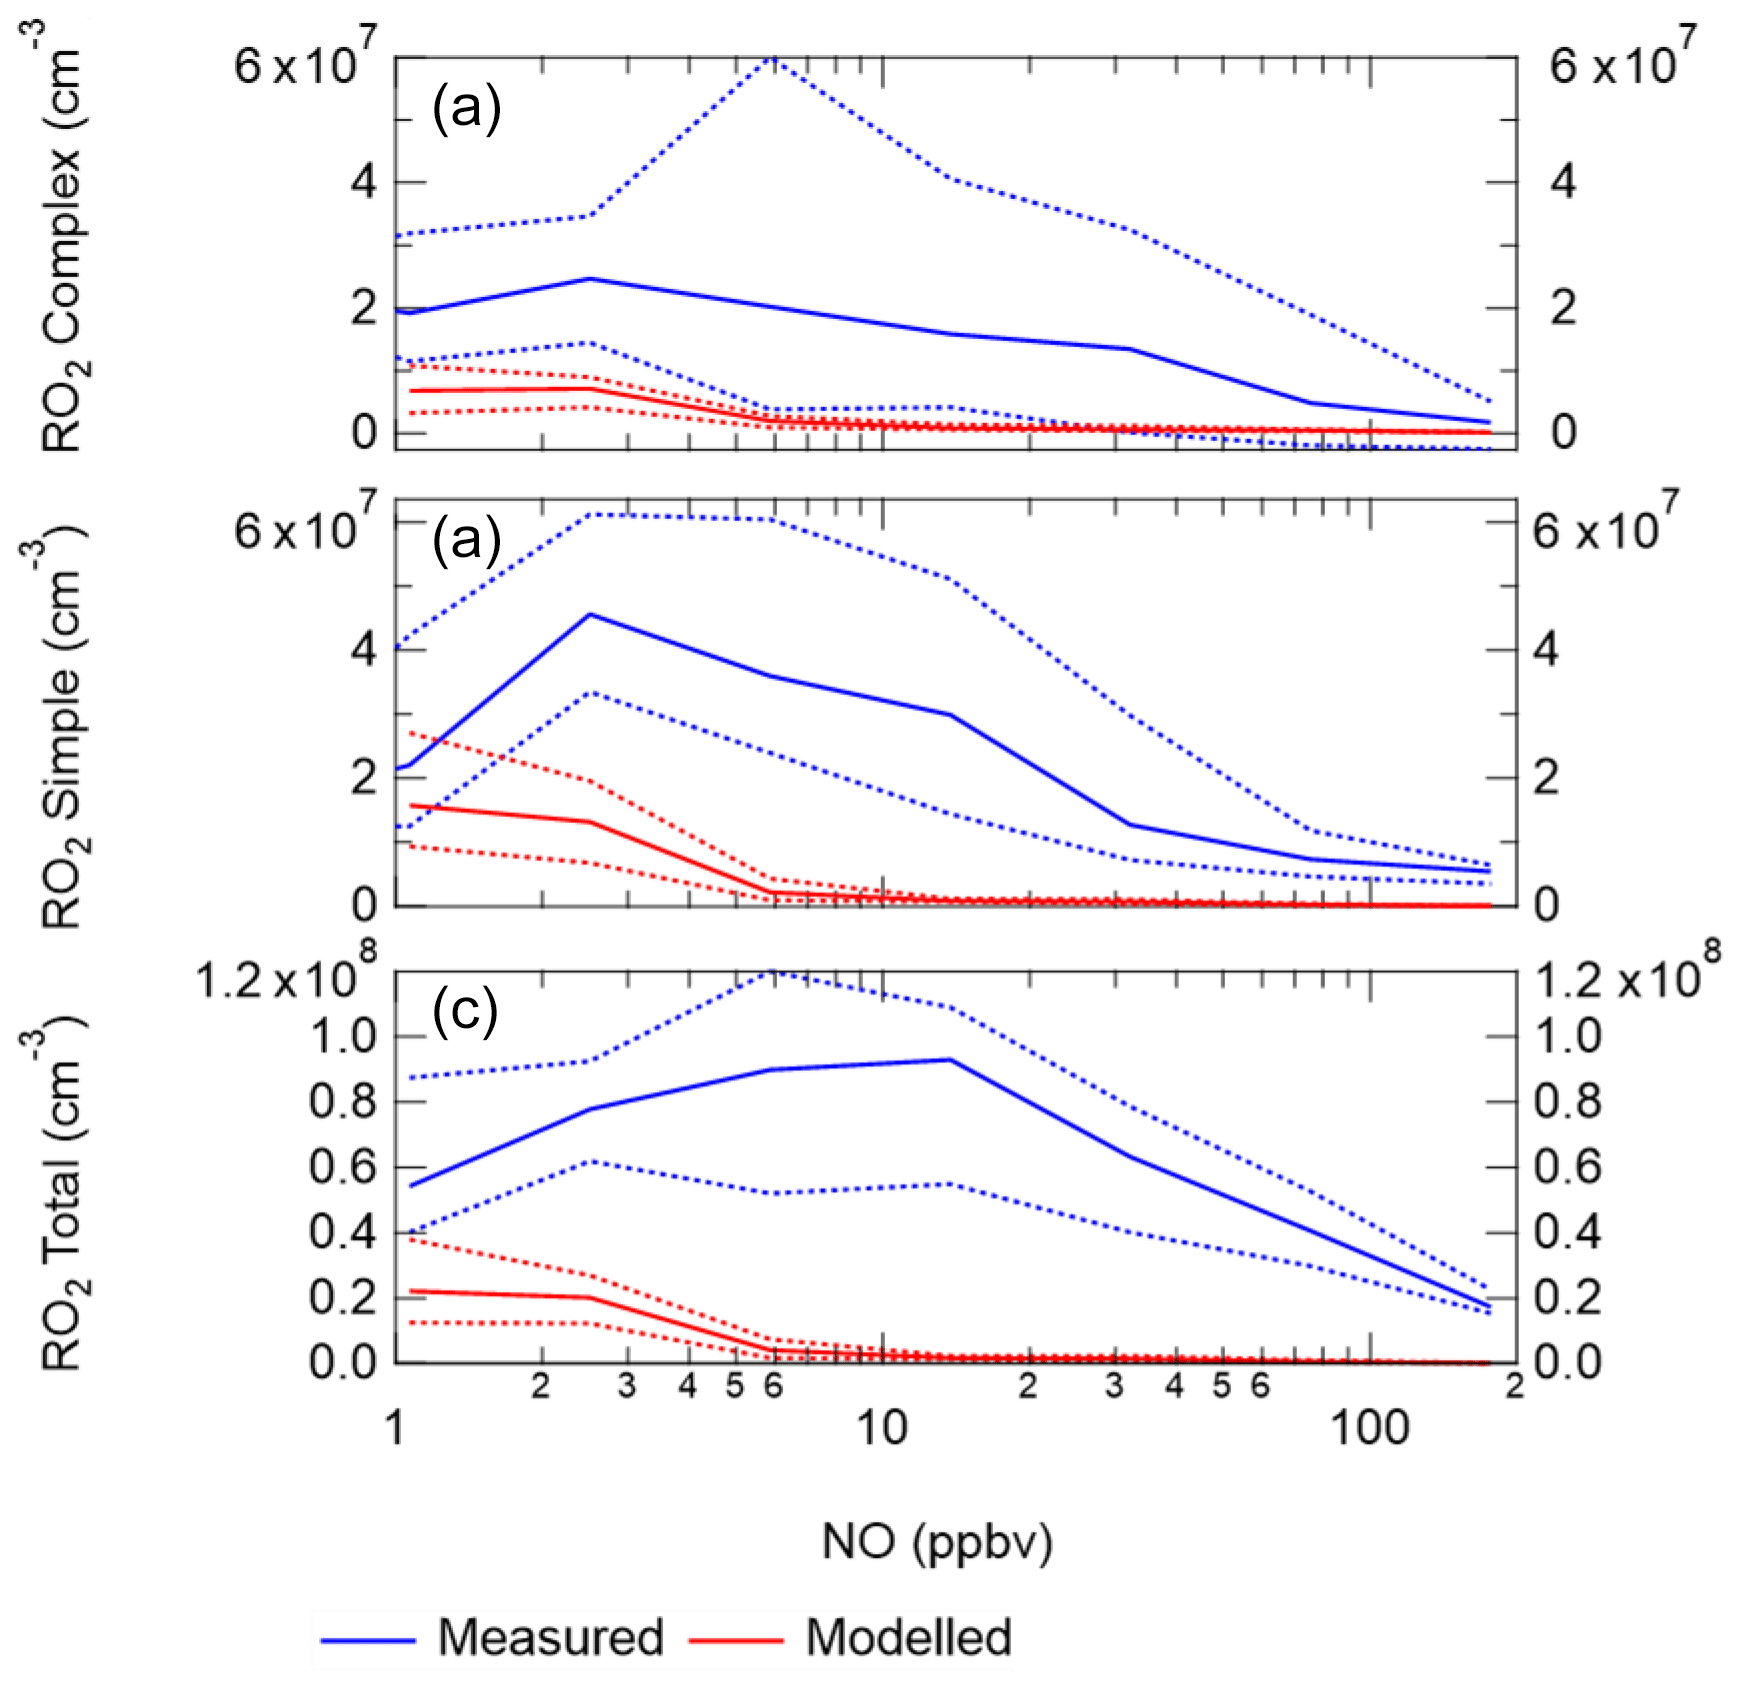
Figure 11(a) Complex RO2 measurements (blue) and complex modelled RO2 (red) vs. NO. (b) Simple RO2 measurements (blue) and simple modelled RO2 (red) vs. NO. (c) Total RO2 measurements (blue) and total modelled RO2 (red) vs. NO. The points used are for daytime values only ( s−1). See text for definition of “simple” and “complex” RO2.
The additional primary production of ROx (P′ROx) radicals required to bridge the gap between measured and modelled total RO2 was found to peak at an average of 3.5×10⁸ at 08:30 non-haze events. Under haze conditions, the gap between measured and modelled total RO2 was found to peak at an average of 4×10⁸ at 13:30 as shown in Fig. 12, calculated from Eq. (3) (Tan et al., 2018):
where P(HO2)prim, P(RO2)prim, L(HO2)term and L(RO2)term are the rates of primary production of HO2, primary production of RO2, termination of HO2 and termination of RO2, respectively. The overall additional primary production peaks at ∼44 ppbv h−1 (at 10:30), which is almost 9 times larger than the additional RO2 source that was required to resolve the measured and modelled RO2 during the BEST-ONE campaign (5 ppbv h−1 during polluted periods, also calculated using Eq. 3) and is much larger compared to the known noon-average modelled primary production of ROx during the APHH campaign of 1.7 ppbv h−1. The additional primary production required in non-haze conditions rises sharply in the morning peaking at 08:30 (3.5×10⁸ molecules cm−3) and then decreases rapidly, whilst the additional source needed in haze events peaks at 4×10⁸ . The additional primary source required during haze events throughout the day is ∼7 times higher than that during non-haze events. It has been suggested previously in Tan et al. (2017) that the missing primary radical source originates from the photolysis of ClNO2 and Cl2 to generate Cl atoms, which can further oxidise VOCs to generate peroxy radicals. However, as no measurements of ClNO2 or Cl2 were made during the campaign, this route cannot be quantified. However, Cl atom chemistry may only play a minor role, as the inclusion of ClNO2 in a model during a summer campaign in Wangdu (60 km from Beijing) could only close 10 %–30 % of the gap between the model and measurements (Tan et al., 2017). The ClNO2 concentration required to bridge the gap between model and measurements during APHH would be ∼5800 ppbv on average (see Sect. S1.8 in the Supplement for details). Previous measurements in China in suburban Beijing have shown ClNO2 peaking at 2.9 ppbv (Wang et al., 2017), however, and suggest other additional primary sources are needed in the model besides Cl chemistry.
Equation (3) has been used to calculate an additional primary source (P′(ROx)) required to reconcile measured and modelled RO2; on average this peaked at 1.05×10⁸ . The calculated additional RO2 (P′(ROx)) source was included in the model (model run is called MCM-PRO2) as a single species “A-I” that formed several RO2 species at the required RO2 production rate (i.e. missing primary production rate, P′(RO2)prim). Using the MCM nomenclature (http://mcm.leeds.ac.uk/MCM/), the RO2 species produced were HOCH2CH2O2, HYPROPO2, IBUTOLBO2, BUTDBO2, OXYBIPERO2, CH3O2 and BUT2OLO2, and NBUTOLAO2, and the structures of these RO2 species are shown in Table 6. The RO2 species were chosen after a rate of production analysis (ROPA) showed they were the most produced RO2 species in the model.
The comparison between the sum of observed RO2 and sum of modelled RO2 from the model run MCM-PRO2 demonstrates good agreement in general (Fig. 12), although there is a slight overprediction of RO2 in the afternoon and a slight underprediction of RO2 in the morning. However, the MCM-PRO2 run overpredicts the observed HO2 during haze and non-haze events by a factor of 3.4 and 2.5, respectively, with the large overprediction of HO2 in haze and non-haze events driving the overprediction of OH by a factor of 2.2 and 2.5. This highlights that the additional primary RO2 source may be an RO2 species that does not readily propagate to HO2; this has also been discussed in Whalley et al. (2020). To investigate whether the uptake of HO2 onto the surface of aerosols could improve the agreement between measured and modelled HO2, the MCM-PRO2 model was modified to include the uptake of HO2 with the uptake coefficient set equal to 0.2, as suggested by Jacob (2000), in model run MCM-PRO2-SA. The measured average aerosol surface area peaked at an average of cm2 cm−3. The comparison of MCM-PRO2-SA with both measurements and MCM-PRO2 (see Table 3 for details) shows that the uptake of HO2 only has a small impact of up to <9 % and <6 % on the modelled levels of OH, HO2 and RO2 during haze and non-haze events, respectively. The aerosol surface area used in the model may be a lower limit as it was calculated from a scanning mobility particle sizer (SMPS) that only measured aerosols ranging from 10 to 1000 nm. At the high levels of NO encountered, the lifetime of HO2 is short, and the decrease in HO2 in MCM-PRO2-SA owing to loss onto aerosols is not enough to reconcile measurements with the model and suggests that an additional primary source of RO2 may not be the cause of the model underprediction of RO2 species, as the inclusion of additional RO2 production worsens the model's ability to predict OH and HO2. If there is missing RO2 production, the rate of propagation of these species to HO2 would need to be slower than currently assumed in the model to reconcile the observations of OH, HO2 and RO2.
The small decrease in modelled HO2 by heterogeneous uptake contrasts with the recent work from Li et al. (2019) that has shown, using GEOS-Chem, that the observed increasing-ozone trend in the North China Plain is caused by reduced uptake of HO2 onto aerosols due to reduction in PM2.5 by ∼40 % between 2013 and 2017.
Table 6The names and associated structures of the RO2 species used to add additional primary production of RO2 species into MCM-PRO2 and MCM-PRO2-SA. See http://mcm.leeds.ac.uk/MCMv3.3.1/home.htt, last access: 10 April 2020, for more details.
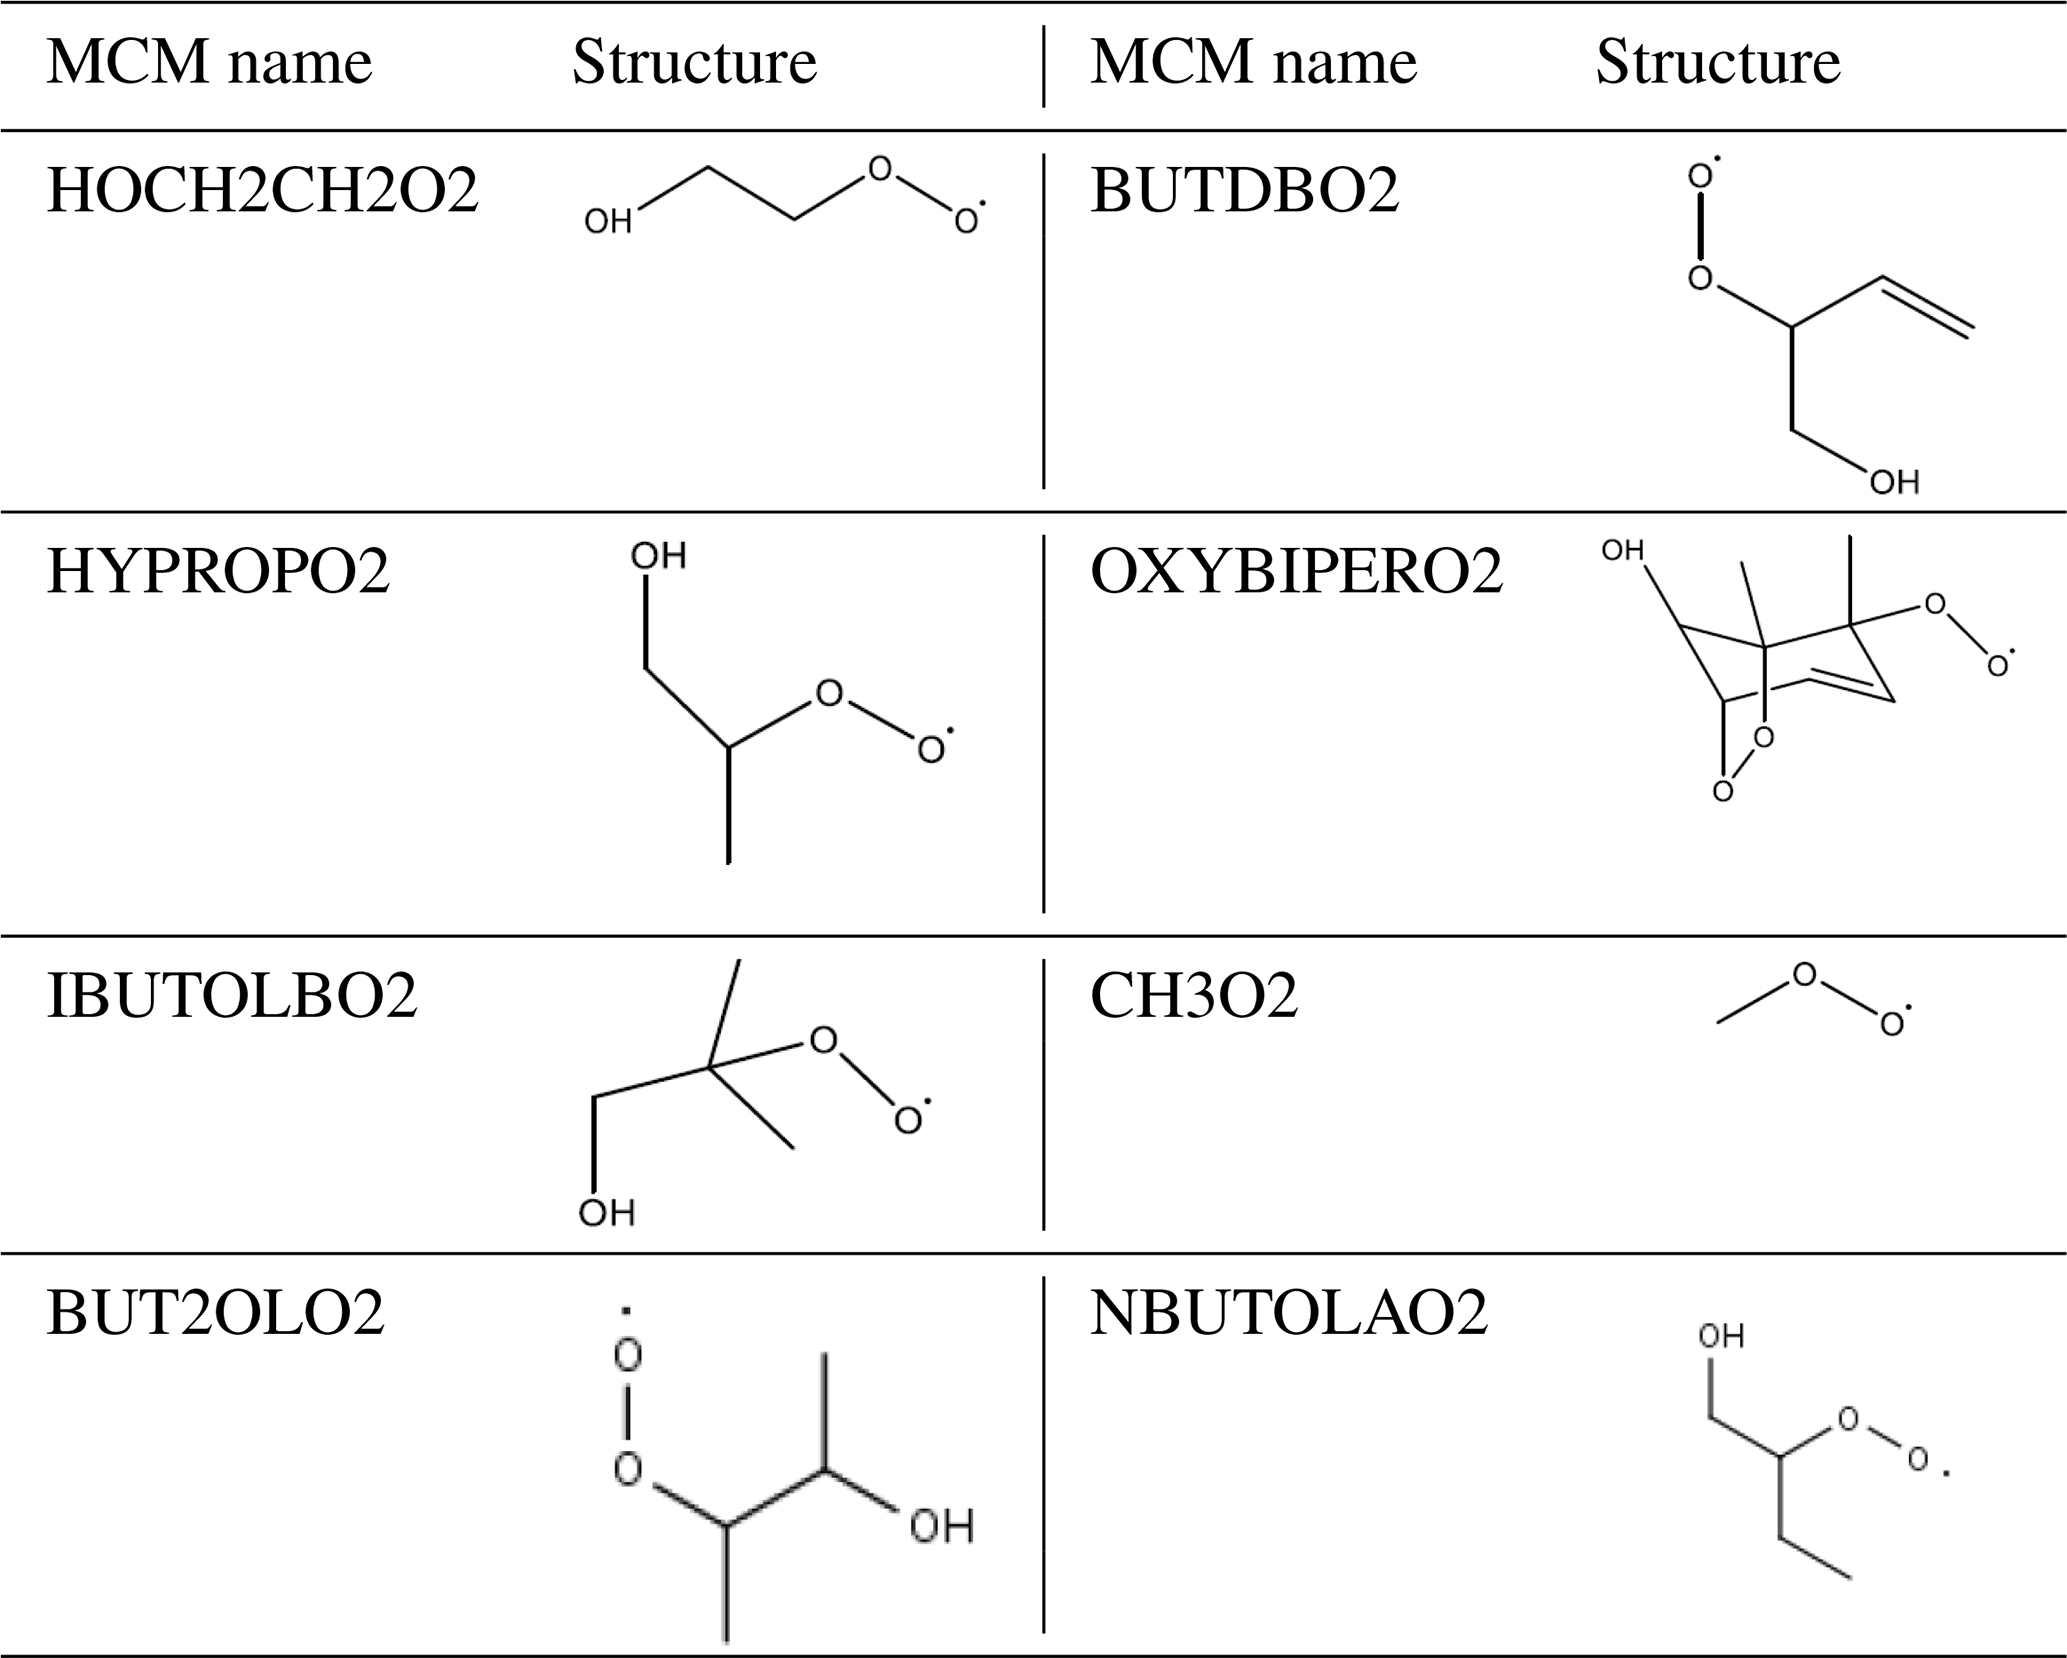
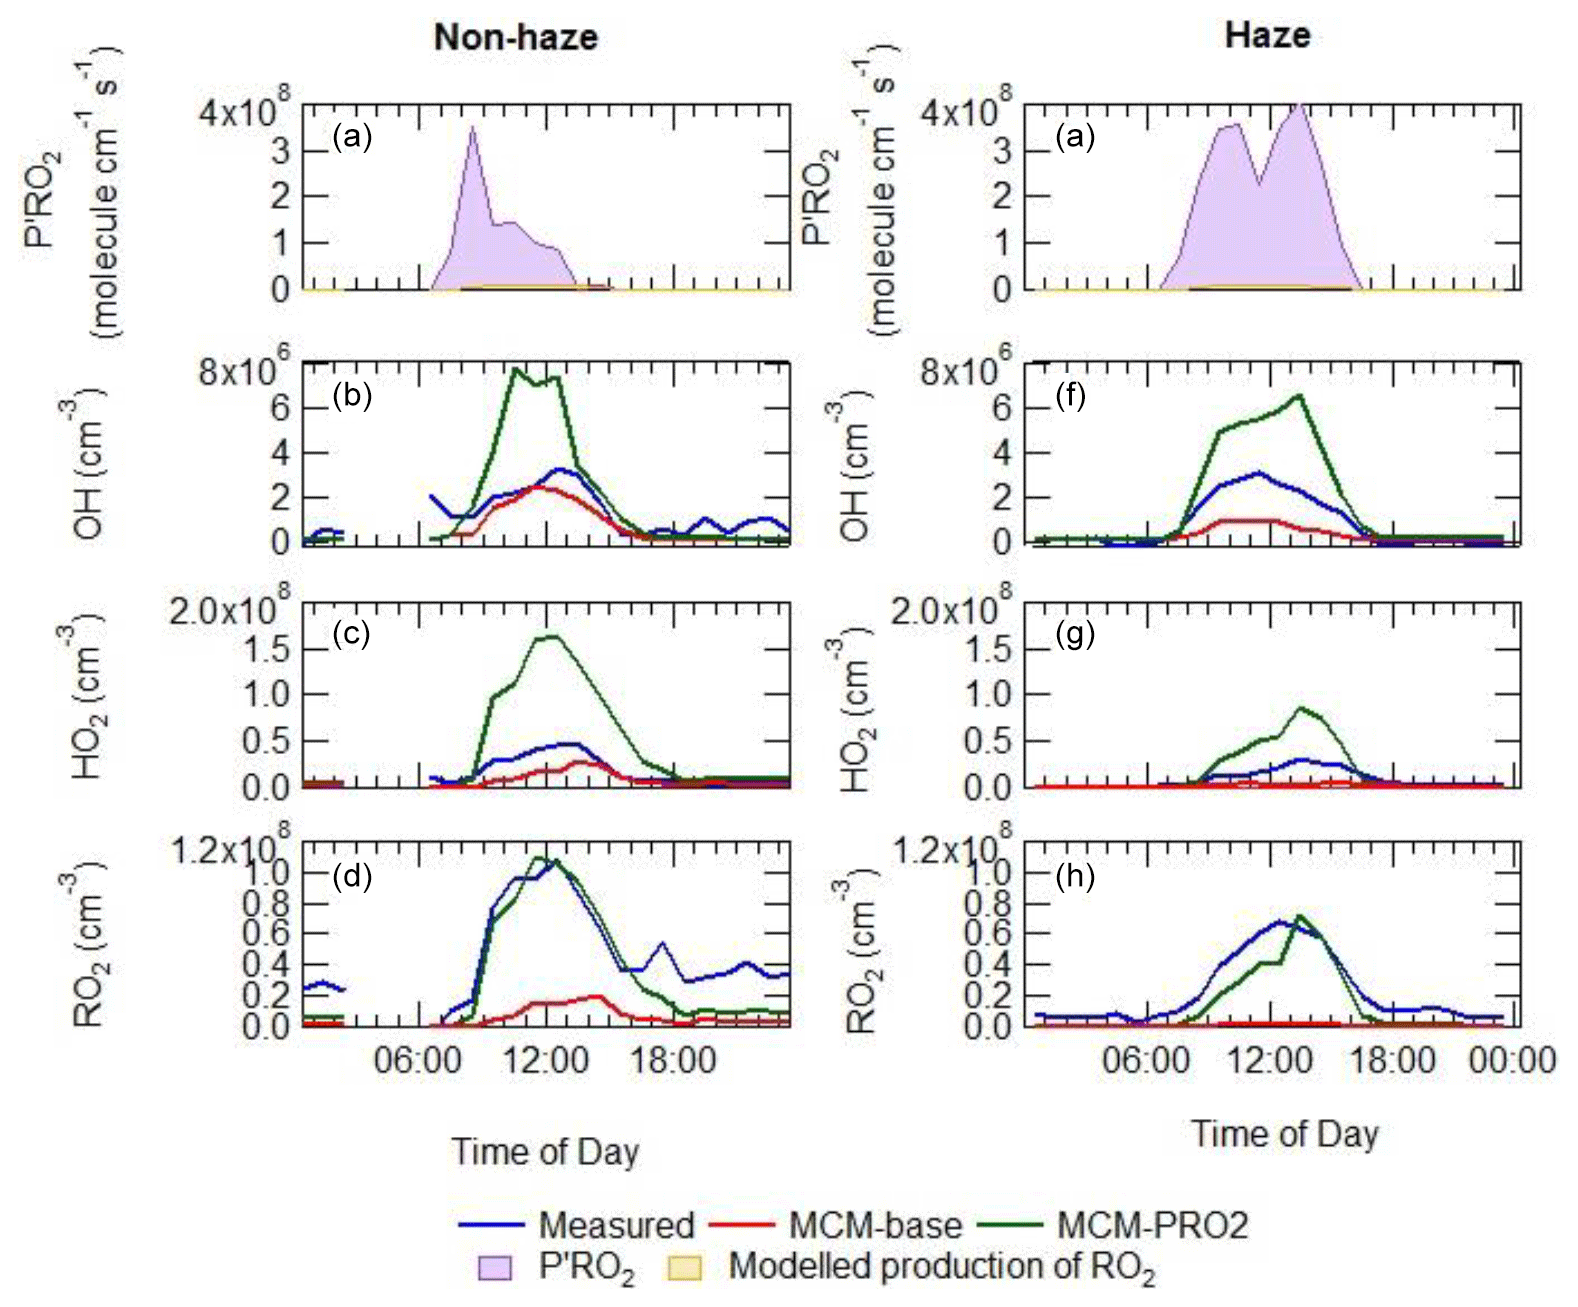
Figure 12Average diel comparison of measurements of P′RO2, OH, HO2 and sum of RO2 with the MCM-base and MCM-PRO2 box model runs in (e–h) and outside of (a–d) haze events. The average diel is from the entire APHH winter campaign. See text and Table 3 for definitions of each of the model runs.
4.3 Chemistry of radicals under haze conditions
The observed concentrations of OH during the APHH campaign are much higher than those predicted by global models ( cm−3, for a 24 h period average during summertime) in the North China Plain (NCP; Lelieveld et al., 2016), and the OH concentration in and outside of haze events are comparable, despite the lower light levels during these events (on average up to 50 % less j(O1D) during the haze events) as shown in Fig. 5. The levels of OH are partly sustained during haze events owing to a significant increase in [HONO] in haze (see Fig. 5), with HONO being a major source of OH, despite the reduction in j(HONO) in haze. The average midday OH reactivity measurements in and outside of haze were 47 (s−1) and 17 (s−1), respectively, and since the OH concentrations are comparable in and outside of haze, this implies there is a larger turnover rate (defined as the product of [OH] and k(OH)) or rate of chemical oxidation initiated by OH radicals, within haze, to balance this. The radical chain length, ChL, is defined by the rate of radical propagation divided by the rate of radical production and is given by Eq. (4):
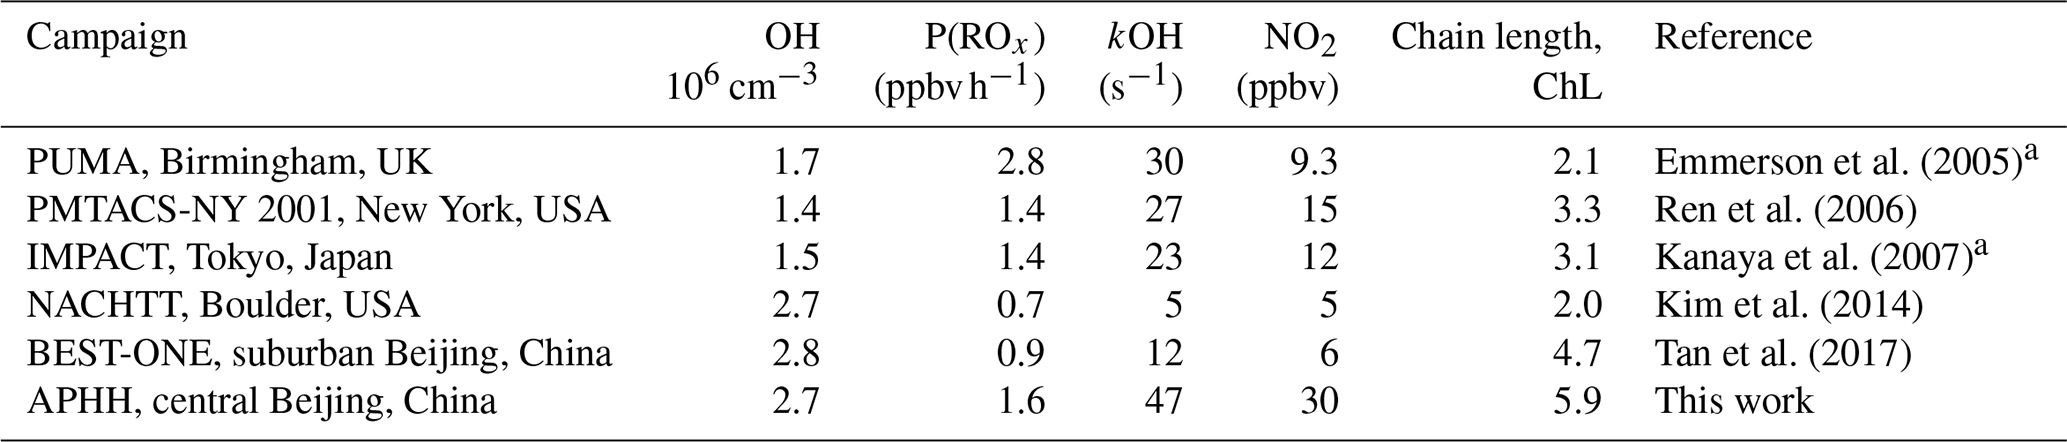
where kVOC is the total OH reactivity with VOCs and P(ROx) is the primary production of ROx radicals. As shown in Table 7 the average of ChL calculated using Eq. (4) during the APHH campaign was This large value indicates that radical propagation during the APHH campaign is very efficient; this ChL is higher than calculated for previous winter campaigns that had OH radical and OH reactivity measurements available, together with VOCs. The large chain length comes from the product of large OH concentrations and high-OH-reactivity measurements.
The average diel profiles of radical concentrations, both measured and calculated by the model, in and outside of haze periods are presented in Fig. 13: the maximum average OH concentration observed is almost the same in and outside of haze ( molecules cm−3), whilst the concentrations of the observed peroxy radicals decrease in haze. The model can replicate OH (within 20 %) outside of haze but significantly underpredicts OH in haze events. The model also underpredicts HO2 and RO2 during haze but overpredicts HO2 under the non-haze conditions. The measured complex RO2 radical species peak at similar concentrations in (4.3×10⁷ molecules cm−3) and outside of (4.6×10⁷ molecules cm−3) haze. Interestingly, unlike the complex RO2, the simple RO2 concentration peaks at a lower concentration in haze (3.4×10⁷ molecules cm−3) compared with outside of haze (5.5×10⁷ molecules cm−3). The complex RO2 is underpredicted by the model by a factor of ∼48 and ∼12 in and outside of haze, respectively, whilst the simple RO2 is underpredicted by a factor of ∼66 and ∼5.7 in and outside of haze, respectively. The sharp increase for the underprediction of both simple and complex RO2 in haze events highlights the need for a large additional primary source of both simple and complex RO2. The OH reactivity is replicated well by the model both in haze and non-haze conditions. The increased contribution to kOH (s−1) from VOCs going from non-haze to haze conditions is a factor of ∼10 for aromatics, ∼8 for alkenes and alkynes, ∼6 for alkanes, ∼9 for alcohols, and ∼2 for aldehydes. The large increase in the relative contribution to kOH from aromatics, alkenes and alkynes is consistent with the observation of higher complex RO2 (compared to simple RO2) during haze periods compared to non-haze periods. Figure 13 shows the OH concentration observed both in and outside of haze events is significant and indicates that gas-phase oxidation is taking place, hence the formation of secondary oxidation products, even within haze conditions. Secondary oxidation products, such as nitric acid and sulfuric acid, which partition to the aerosol phase, are major contributors towards the formation of secondary particulate matter (Huang et al., 2014). A discussion on the impact of similar OH concentration in and outside of haze on the oxidation of SO2 and NO2 can be found in Sect. S1.3 in the Supplement.
Table 7Comparison of OH concentration, primary production of ROx radicals (P(ROx)), OH reactivity (kOH), NO2 concentration and chain length defined by Eq. (4) for various campaigns. The values are a noontime average. Table modified from Tan et al. (2018).
a OH reactivity is calculated only.
4.4 Implications of model underprediction of RO2 radicals on the calculated rate of ozone production
Although ozone pollution is generally not considered a wintertime phenomenon in Beijing, the elevated levels of RO2 observed under high-NOx conditions suggest that ozone could be produced rapidly but then is rapidly titrated to NO2 by reaction with NO. As well as being an important greenhouse gas, O3 has a negative impact on both human health and crop yields (Lin et al., 2018) and in China led to 74 200 premature deaths and a cost to the economy of USD 7.6 billion in 2016 (Maji et al., 2019).
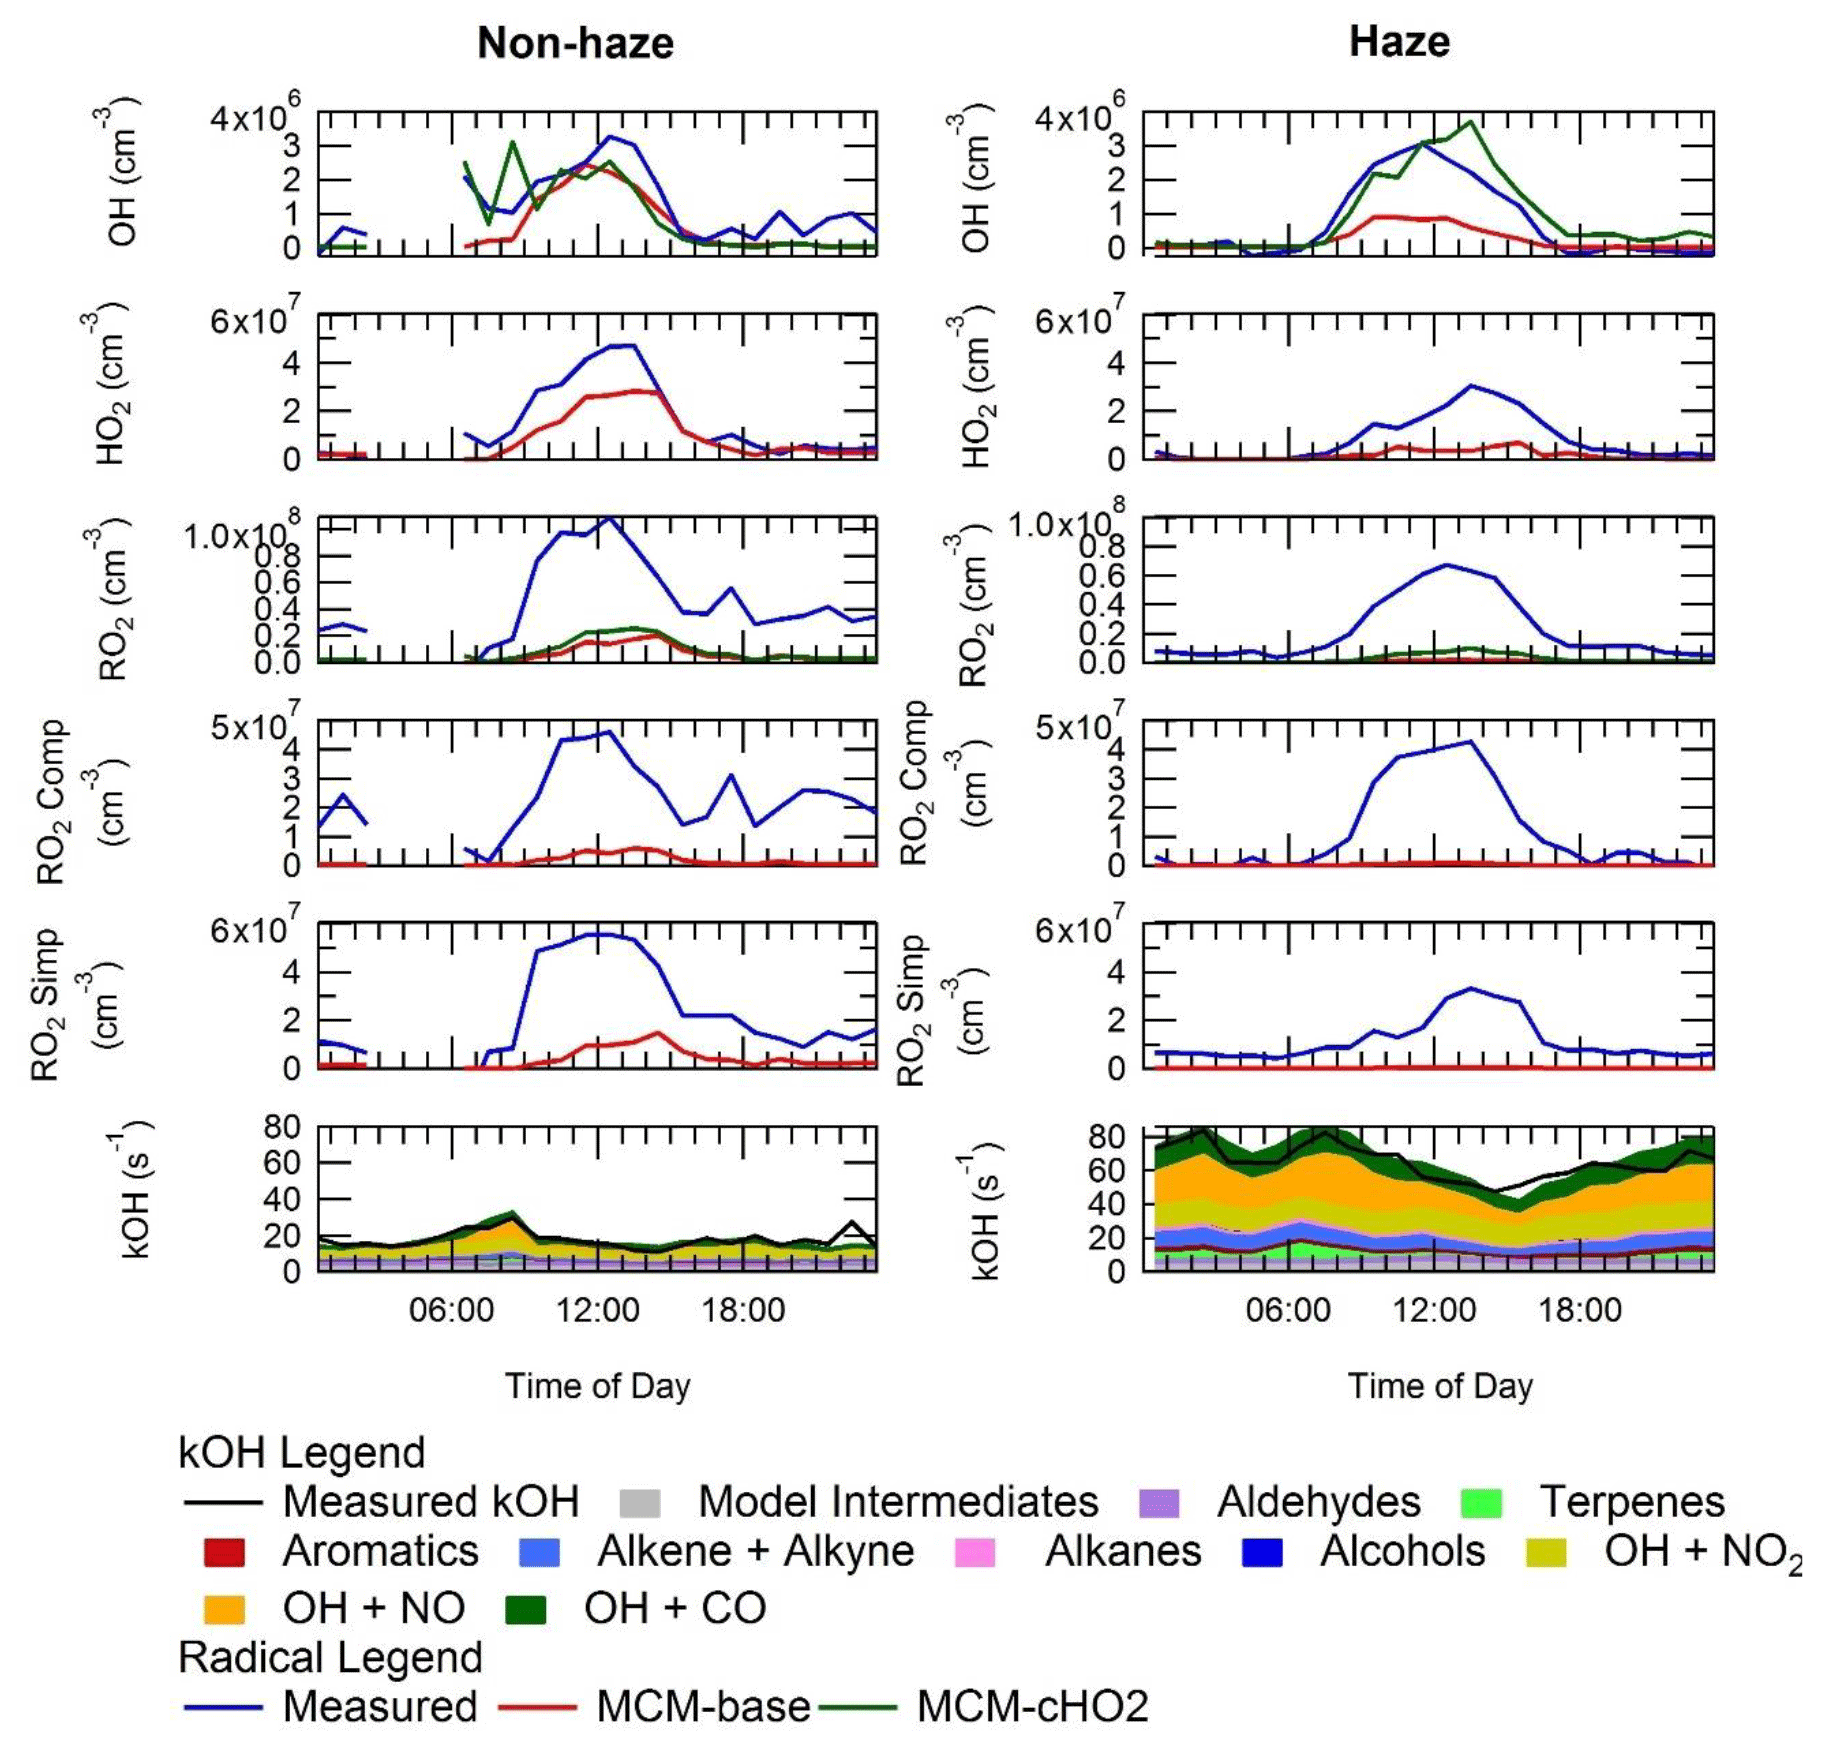
Figure 13Average diel profiles for measured and modelled OH, HO2, total RO2, complex RO2 (RO2 comp), simple RO2 (RO2 simp) and kOH separated into haze (right) and non-haze (left) periods.
The RO2 radicals are underpredicted in the model, especially under the higher-NOx conditions, and as shown in Fig. 14, this has an implication for the model's ability to predict the rate of in situ O3 production. The rate of O3 production is assumed to be equal to the net rate of NO2 production (Eq. 5):
where RO2 represents the sum of RO2 and the last three terms allow for the reduction in ozone production owing to reactions that remove NO2 or its precursors. The P(RONO2) term is the net rate of formation of organic nitrate, RONO2, species, for example peroxy acetyl nitrates (PANs).
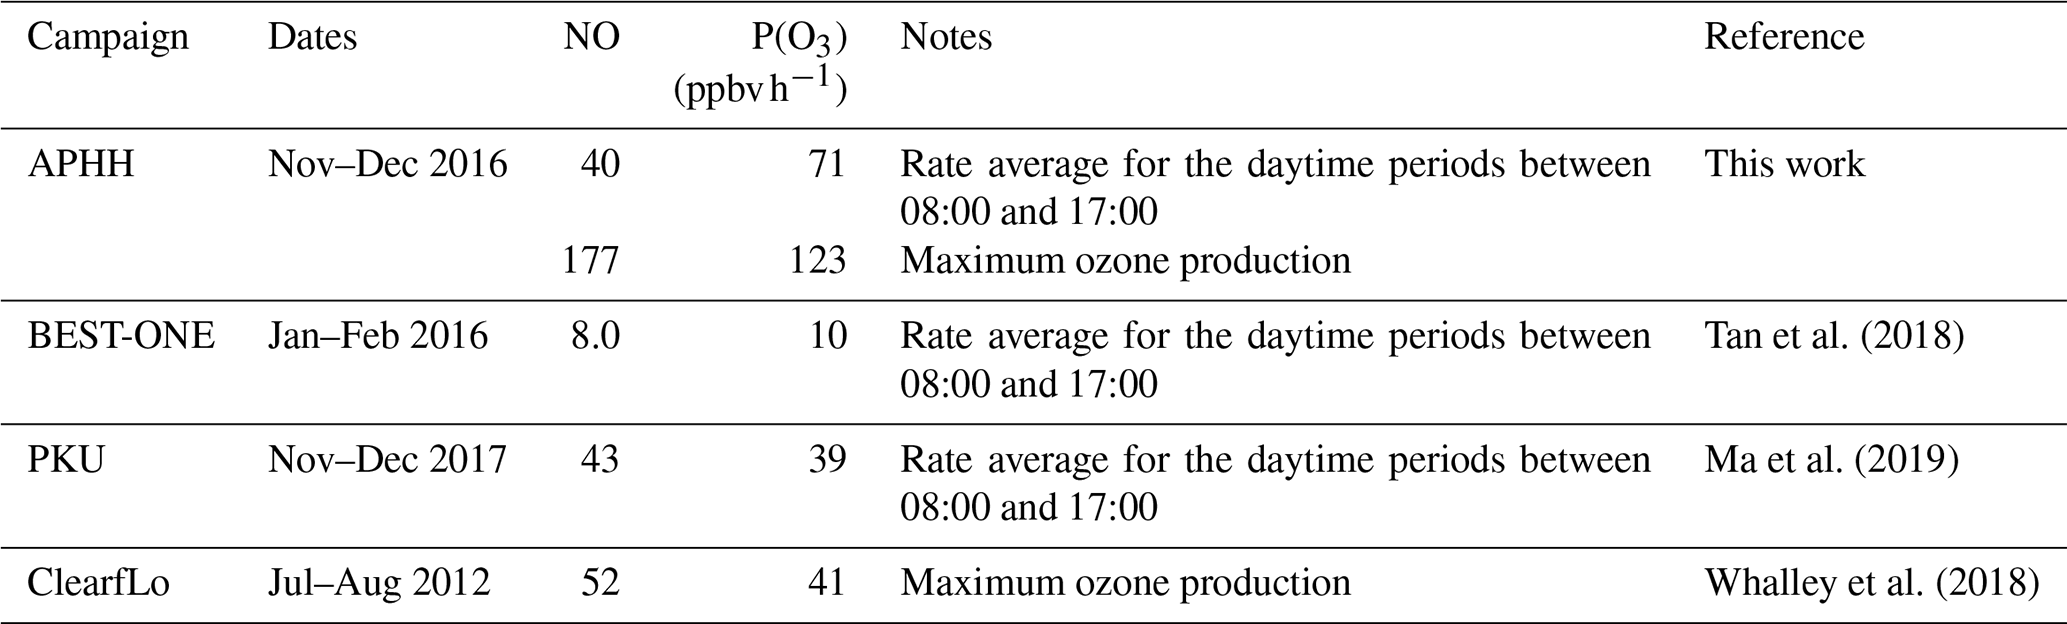
When the rate of O3 production is calculated using the measured values of HO2 and RO2, there is a positive trend with increasing NO. However, when the modelled concentrations of HO2 and RO2 are used, there is a constant P(O3) across the whole NO range, leading to a large underestimation of O3 production by the model at higher values of NO. At ∼2.5 and ∼177 ppbv of NO the model underestimates the O3 production by 1.8 and 66, respectively. Figure 14 also shows that there is a high rate of in situ ozone production in Beijing in winter, and, as shown in Table 8, the maximum rate of ozone production calculated from observed HO2 and RO2 is higher for the Beijing winter than the corresponding values during the summer-time ClearfLo campaign in London. However, because of the very high NO levels in the Beijing campaign, immediate titration of the O3 formed results in very low ambient amounts; see Fig. 5. As shown in Table 8, the average of the rate of ozone production calculated from observations of HO2 and RO2 between 08:00 and 17:00 during our APHH campaign (71 ppbv h−1, at 40 ppbv of NO) was higher than those calculated using observations during the BEST-ONE campaign (10 ppbv h−1, at 8 ppbv of NO) and those calculated from the measured HO2 and modelled RO2 in the PKU campaign (43 ppbv h−1, at 39 ppbv of NO). An isopleth for ozone showing production as a function of NOx and VOC for the BEST-ONE campaign (Lu et al., 2019) showed that a reduction in NOx alone would lead to an increase in O3 production and an increase in the amount of secondary organic aerosols produced.

Figure 14The calculated rate of in situ ozone production as a function of [NO] for Eq. (7) using modelled (red) and measured (blue) values of HO2 and the sum of RO2 radicals.
The top 10 RO2 species that react with NO to form NO2 are shown in Fig. 15; the top 10 RO2 species only contribute to 65.8 % of the ozone formed, whilst the other 34.2 % is from different RO2 species that individually contribute less than 1.5 % each. The figure shows that simple RO2 species (CH3O2 and C2H5O2) contribute 26.8 % of the total ozone production by RO2 species.
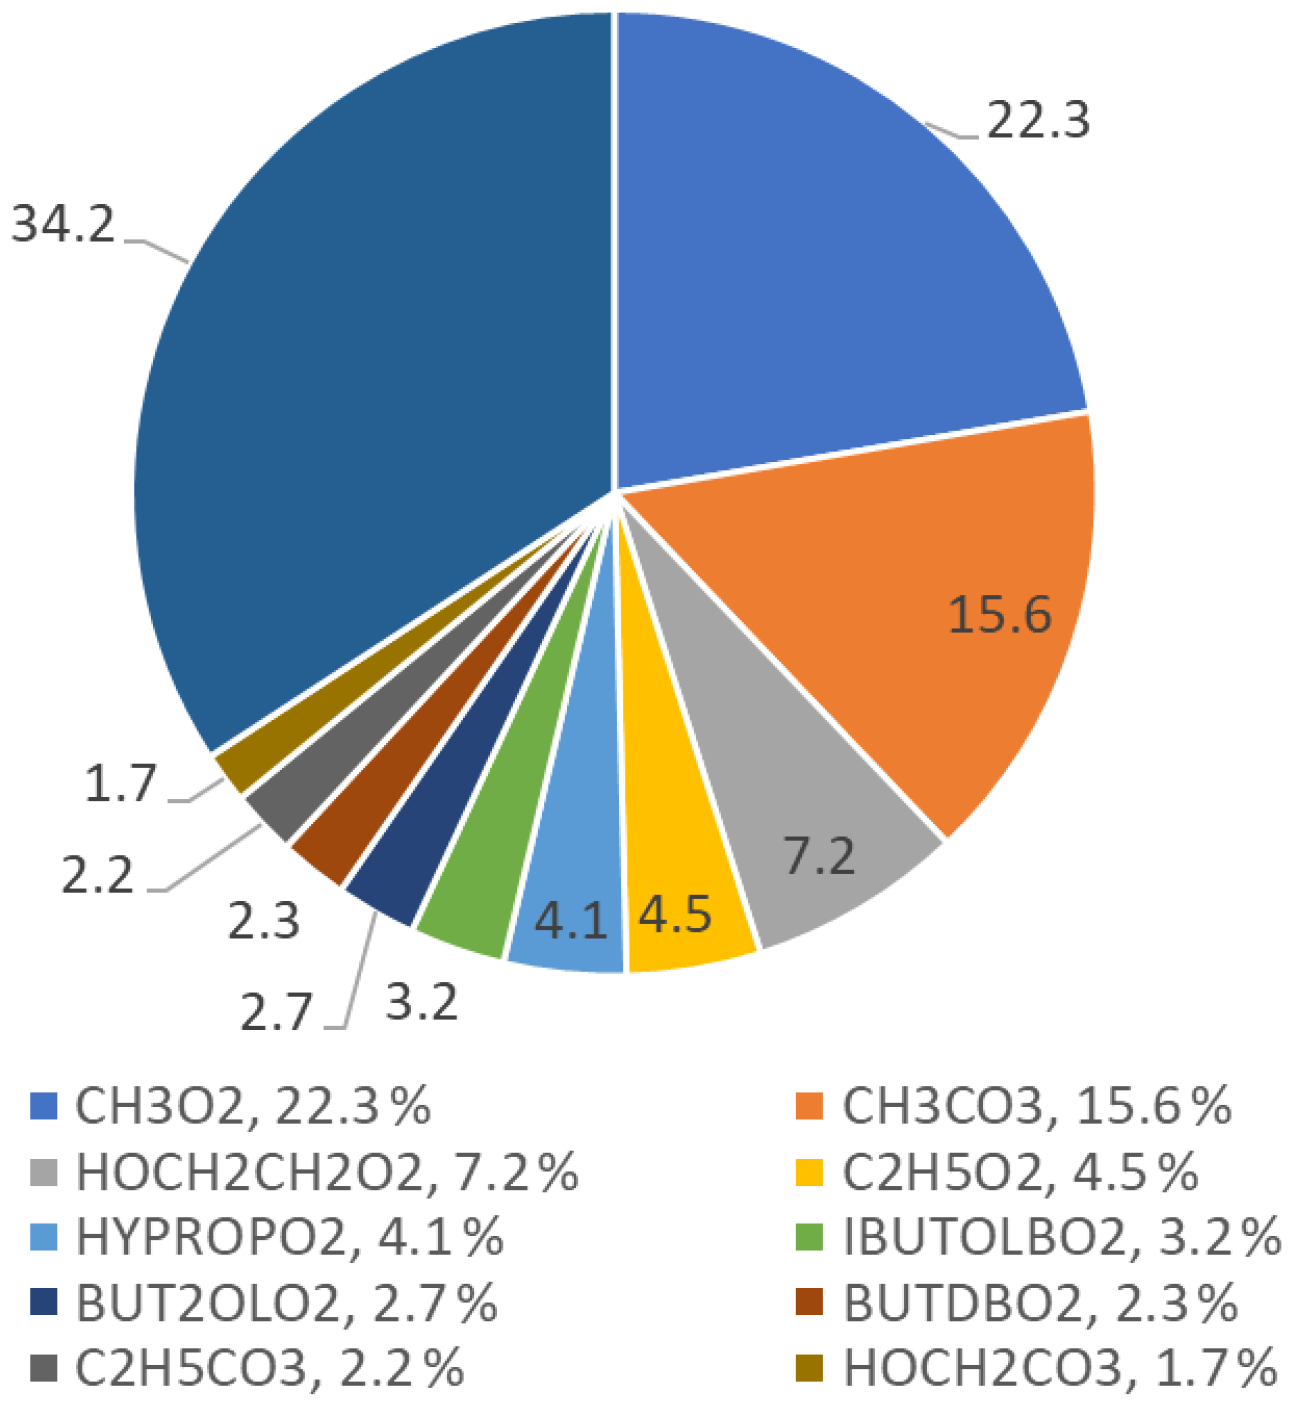
Figure 15Pie chart showing the top 10 RO2 species that form ozone in the MCM-base model. These top 10 RO2 species only contribute to a total of 65.8 % of the ozone production, the rest coming from other RO2 species (34.2 %), each with less than a 1.5 % contribution to the total production. The names of the RO2 species are from the MCM; the related structures can be found at http://mcm.leeds.ac.uk/MCM/.
Table 8The rate of in situ ozone production averaged between 08:00 and 17:00 for the APHH, BEST-ONE and PKU campaigns and the associated NO concentration. Also shown is the maximum rate of ozone production calculated from measured HO2 and RO2 during the APHH and ClearfLo campaigns.
The APHH campaign took place in central Beijing at the Institute for Atmospheric Physics (IAP) in November and December 2016, with detailed measurements of OH, HO2, the sum of RO2 and OH reactivity made using the FAGE technique. High radical concentrations were measured both in and outside of haze events, despite the lower intensity of solar radiation and therefore photolysis rates in haze. The daily maxima for the radical species varied day-to-day from 1 to 8×10⁶, 0.7 to 1.5×10⁸ and 1 to 2.5×108 cm−3 for OH, HO2 and RO2, respectively. Partial speciation of RO2 was achieved, with the sum of simple RO2 deriving from <C4 saturated VOCs reaching a daily maximum concentration of between 0.2 and 1.3 ×108 cm−3 and the complex RO2 deriving from larger alkyl, unsaturated and aromatic VOCs reaching a daily maximum concentration of between 0.2 and 0.6×108 cm−3. The partially speciated RO2 measurements showed on average an almost 50:50 ratio between the two. The complex RO2 species have higher mixing ratios under high-NO (>40 ppbv) conditions whilst simple RO2 have higher mixing ratios under lower-NO (<40 ppbv) conditions. The average daytime maximum of the radical species was 2.7×10⁶, 0.39×10⁸ and 0.88×108 cm−3 for OH, HO2 and total RO2, respectively. The OH radical concentrations are higher than in previous winter campaigns outside of China and comparable to the BEST-ONE campaign that took place in suburban Beijing (60 km northeast of Beijing). The OH reactivity was very high and showed a significant day-to-day variability from 10 up to 150 s−1 in the most polluted periods. The major contribution to reactivity came from CO (17.3 %), NO (24.9 %), NO2 (22.1 %), alkanes (3.0 %), alkynes and alkenes (10.8 %), carbonyls (5.7 %), terpenes (3.7 %), and model intermediates (6.77 %). A steady-state calculation for OH showed that the OH budget can be closed using measured HO2, HONO and k(OH).
The primary production of new radicals by initiation reactions, as opposed to formation via propagation reactions, was dominated (>83 %) by the photolysis of HONO, consistent with other winter campaigns. The rate of primary radical production from HONO was observed to increase during haze events, due to the large increase in HONO concentration, even though photolysis rates were considerably lower in haze. Radical termination was dominated by the reaction of OH with NO2, although under non-haze conditions, when PM2.5<75 µg m−3, the contribution from net-PAN formation became important (∼19 %).
The comparison of the measurements with a box model utilising the detailed Master Chemical Mechanism generally showed an underestimation of OH, HO2 and RO2. The MCM was able to replicate OH and HO2 concentrations quite well when [NO] was around 3 ppbv. The model underestimation occurred at [NO] > 2.5 ppbv for OH, HO2 and RO2. The underprediction of the radicals reached a measured : modelled ratio of 3, 20 and 91 at 177 ppbv of NO. The underprediction of the peroxy radicals (HO2 and RO2) by the model leads to an underestimation of in situ O3 production under high-NOx conditions. When the MCM is constrained to the measured HO2, the model can replicate measured OH, and the measured OH reactivity is captured well by the model. This suggests that under high-NOx and haze conditions there is either an additional source of the peroxy radicals or unknown recycling chemistry of RO2 into HO2. The OH concentrations in and outside of haze events were very similar, on average 2.7×10⁶ molecules cm−3, which suggests that rapid gas-phase oxidation, generating secondary species such as secondary nitrate, sulfate and organic aerosols, still occurs in haze events.
Data presented in this study are available from the authors upon request (l.k.whalley@leeds.ac.uk and d.e.heard@leeds.ac.uk).
The supplement related to this article is available online at: https://doi.org/10.5194/acp-20-14847-2020-supplement.
EJS, LKW, RWM, CY and DEH carried out the measurements; EJS and LKW developed the model and performed the calculations; JDL, FS, JRH, RED, MS, JFH, ACL, LRC, LK, WB, TV, YS, WX, PF, SY, LR, WJFA, CNH and XW provided logistical support and supporting data to constrain the model; EJS, LKW and DEH prepared the manuscript, with contributions from all co-authors.
The authors declare that they have no conflict of interest.
This article is part of the special issue “In-depth study of air pollution sources and processes within Beijing and its surrounding region (APHH-Beijing) (ACP/AMT inter-journal SI)”. It is not associated with a conference.
We are grateful to the Natural Environment Research Eloise J. Slater and Freya Squires acknowledge NERC SPHERES PhD studentships. We acknowledge the support from Zifa Wang and Jie Li from the Institute of Applied Physics (IAP), Chinese Academy of Sciences, for hosting the APHH-Beijing campaign. We thank Liangfang Wei, Hong Ren, Qiaorong Xie, Wanyu Zhao, Linjie Li, Ping Li, Shengjie Hou and Qingqing Wang from IAP; Kebin He and Xiaoting Cheng from Tsinghua University; and James Allan from the University of Manchester for providing logistic and scientific support for the field campaigns. We would also like to thank the other participants in the APHH field campaign.
This research has been supported by the Natural Environment Research Council (grant no. NE/N006895/1) and the National Natural Science Foundation of China (grant no. 41571130031).
This paper was edited by Frank Keutsch and reviewed by three anonymous referees.
Chan, C. K. and Yao, X.: Air pollution in mega cities in China, Atmos. Environ., 42, 1–42, 2008.
Cheng, N., Li, Y., Zhang, D., Chen, T., Sun, F., Chen, C., and Meng, F.: Characteristics of Ground Ozone Concentration over Beijing from 2004 to 2015: Trends, Transport, and Effects of Reductions, Atmos. Chem. Phys. Discuss., https://doi.org/10.5194/acp-2016-508, 2016.
Commane, R., Floquet, C. F. A., Ingham, T., Stone, D., Evans, M. J., and Heard, D. E.: Observations of OH and HO2 radicals over West Africa, Atmos. Chem. Phys., 10, 8783–8801, https://doi.org/10.5194/acp-10-8783-2010, 2010.
Crilley, L. R., Kramer, L. J., Ouyang, B., Duan, J., Zhang, W., Tong, S., Ge, M., Tang, K., Qin, M., Xie, P., Shaw, M. D., Lewis, A. C., Mehra, A., Bannan, T. J., Worrall, S. D., Priestley, M., Bacak, A., Coe, H., Allan, J., Percival, C. J., Popoola, O. A. M., Jones, R. L., and Bloss, W. J.: Intercomparison of nitrous acid (HONO) measurement techniques in a megacity (Beijing), Atmos. Meas. Tech., 12, 6449–6463, https://doi.org/10.5194/amt-12-6449-2019, 2019.
Dusanter, S., Vimal, D., Stevens, P. S., Volkamer, R., Molina, L. T., Baker, A., Meinardi, S., Blake, D., Sheehy, P., Merten, A., Zhang, R., Zheng, J., Fortner, E. C., Junkermann, W., Dubey, M., Rahn, T., Eichinger, B., Lewandowski, P., Prueger, J., and Holder, H.: Measurements of OH and HO2 concentrations during the MCMA-2006 field campaign – Part 2: Model comparison and radical budget, Atmos. Chem. Phys., 9, 6655–6675, https://doi.org/10.5194/acp-9-6655-2009, 2009.
Ehhalt, D. H. and Rohrer, F.: Dependence of the OH concentration on solar UV, J. Geophys. Res.-Atmos., 105, 3565–3571, 2000.
Emmerson, K., Carslaw, N., and Pilling, M.: Urban atmospheric chemistry during the PUMA campaign 2: Radical budgets for OH, HO2 and RO2, J. Atmos. Chem., 52, 165–183, 2005.
Finlayson-Pitts, B., Wingen, L., Sumner, A., Syomin, D., and Ramazan, K.: The heterogeneous hydrolysis of NO2 in laboratory systems and in outdoor and indoor atmospheres: An integrated mechanism, Phys. Chem. Chem. Phys., 5, 223–242, 2003.
Forster, G. L., Sturges, W. T., Fleming, Z. L., Bandy, B. J., and Emeis, S.: A year of H2 measurements at Weybourne Atmospheric Observatory, UK, Tellus B, 64, 17771, https://doi.org/10.3402/tellusb.v64i0.17771, 2012.
Fuchs, H., Holland, F. and Hofzumahaus, A.: Measurement of tropospheric RO2 and HO2 radicals by a laser-induced fluorescence instrument, Rev. Sci. Instrum., 79, 084104, https://doi.org/10.1063/1.2968712, 2008.
Heard, D. E. and Pilling, M. J.: Measurement of OH and HO2 in the troposphere, Chem. Rev., 103, 5163–5198, 2003.
Hollaway, M., Wild, O., Yang, T., Sun, Y., Xu, W., Xie, C., Whalley, L., Slater, E., Heard, D., and Liu, D.: Photochemical impacts of haze pollution in an urban environment, Atmos. Chem. Phys., 19, 9699–9714, https://doi.org/10.5194/acp-19-9699-2019, 2019.
Hopkins, J. R., Jones, C. E., and Lewis, A. C.: A dual channel gas chromatograph for atmospheric analysis of volatile organic compounds including oxygenated and monoterpene compounds, J. Environ. Monitor., 13, 2268–2276, 2011.
Hu, J., Wang, Y., Ying, Q., and Zhang, H.: Spatial and temporal variability of PM2.5 and PM10 over the North China Plain and the Yangtze River Delta, China, Atmos. Environ., 95, 598–609, 2014.
Huang, R.-J., Zhang, Y., Bozzetti, C., Ho, K.-F., Cao, J.-J., Han, Y., Daellenbach, K. R., Slowik, J. G., Platt, S. M., and Canonaco, F.: High secondary aerosol contribution to particulate pollution during haze events in China, Nature, 514, 218, https://doi.org/10.1038/nature13774, 2014.
Jacob, D. J.: Heterogeneous chemistry and tropospheric ozone, Atmos. Environ., 34, 2131–2159, 2000.
Jenkin, M. E., Valorso, R., Aumont, B., and Rickard, A. R.: Estimation of rate coefficients and branching ratios for reactions of organic peroxy radicals for use in automated mechanism construction, Atmos. Chem. Phys., 19, 7691–7717, https://doi.org/10.5194/acp-19-7691-2019, 2019.
Kanaya, Y., Cao, R., Akimoto, H., Fukuda, M., Komazaki, Y., Yokouchi, Y., Koike, M., Tanimoto, H., Takegawa, N., and Kondo, Y.: Urban photochemistry in central Tokyo: 1. Observed and modeled OH and HO2 radical concentrations during the winter and summer of 2004, J. Geophys. Res.-Atmos., 112, D21312, https://doi.org/10.1029/2007JD008670, 2007.
Kim, S., VandenBoer, T. C., Young, C. J., Riedel, T. P., Thornton, J. A., Swarthout, B., Sive, B., Lerner, B., Gilman, J. B., and Warneke, C.: The primary and recycling sources of OH during the NACHTT-2011 campaign: HONO as an important OH primary source in the wintertime, J. Geophys. Res.-Atmos., 119, 6886–6896, 2014.
Lang, J., Zhang, Y., Zhou, Y., Cheng, S., Chen, D., Guo, X., Chen, S., Li, X., Xing, X., and Wang, H.: Trends of PM2.5 and chemical composition in Beijing, 2000–2015, Aerosol Air Qual. Res., 17, 412–425, 2017.
Lee, J. D., Whalley, L. K., Heard, D. E., Stone, D., Dunmore, R. E., Hamilton, J. F., Young, D. E., Allan, J. D., Laufs, S., and Kleffmann, J.: Detailed budget analysis of HONO in central London reveals a missing daytime source, Atmos. Chem. Phys., 16, 2747–2764, https://doi.org/10.5194/acp-16-2747-2016, 2016.
Lelieveld, J., Gromov, S., Pozzer, A., and Taraborrelli, D.: Global tropospheric hydroxyl distribution, budget and reactivity, Atmos. Chem. Phys., 16, 12477–12493, https://doi.org/10.5194/acp-16-12477-2016, 2016.
Li, K., Jacob, D. J., Liao, H., Shen, L., Zhang, Q., and Bates, K. H.: Anthropogenic drivers of 2013–2017 trends in summer surface ozone in China, P. Natl. Acad. Sci. USA, 116, 422–427, 2019.
Li, X., Brauers, T., Häseler, R., Bohn, B., Fuchs, H., Hofzumahaus, A., Holland, F., Lou, S., Lu, K. D., Rohrer, F., Hu, M., Zeng, L. M., Zhang, Y. H., Garland, R. M., Su, H., Nowak, A., Wiedensohler, A., Takegawa, N., Shao, M., and Wahner, A.: Exploring the atmospheric chemistry of nitrous acid (HONO) at a rural site in Southern China, Atmos. Chem. Phys., 12, 14971–513, https://doi.org/10.5194/acp-12-1497-2012, 2012.
Lin, Y., Jiang, F., Zhao, J., Zhu, G., He, X., Ma, X., Li, S., Sabel, C. E., and Wang, H.: Impacts of O3 on premature mortality and crop yield loss across China, Atmos. Environ., 194, 41–47, 2018.
Lu, K., Fuchs, H., Hofzumahaus, A., Tan, Z., Wang, H., Zhang, L., Schmitt, S., Rohrer, F., Bohn, B., and Broch, S.: Fast photochemistry in wintertime haze: Consequences for pollution mitigation strategies, Environ. Sci. Technol., 53, 10676–10684, https://doi.org/10.1021/acs.est.9b02422, 2019.
Lu, K. D., Hofzumahaus, A., Holland, F., Bohn, B., Brauers, T., Fuchs, H., Hu, M., Häseler, R., Kita, K., Kondo, Y., Li, X., Lou, S. R., Oebel, A., Shao, M., Zeng, L. M., Wahner, A., Zhu, T., Zhang, Y. H., and Rohrer, F.: Missing OH source in a suburban environment near Beijing: observed and modelled OH and HO2 concentrations in summer 2006, Atmos. Chem. Phys., 13, 1057–1080, https://doi.org/10.5194/acp-13-1057-2013, 2013.
Lu, X., Wang, Y., Li, J., Shen, L., and Fung, J. C.: Evidence of heterogeneous HONO formation from aerosols and the regional photochemical impact of this HONO source, Environ. Res. Lett., 13, 114002, https://doi.org/10.1088/1748-9326/aae492, 2018.
Ma, X., Tan, Z., Lu, K., Yang, X., Liu, Y., Li, S., Li, X., Chen, S., Novelli, A., and Cho, C.: Winter photochemistry in Beijing: Observation and model simulation of OH and HO2 radicals at an urban site, Sci. Total Environ., 685, 85–95, 2019.
Maji, K. J., Ye, W.-F., Arora, M., and Nagendra, S. S.: Ozone pollution in Chinese cities: Assessment of seasonal variation, health effects and economic burden, Environ. Pollut., 247, 792–801, 2019.
Qi, Y., Stern, N., Wu, T., Lu, J., and Green, F.: China's post-coal growth, Nat. Geosci., 9, 564, https://doi.org/10.1038/ngeo2777, 2016.
Ren, X., Brune, W. H., Mao, J., Mitchell, M. J., Lesher, R. L., Simpas, J. B., Metcalf, A. R., Schwab, J. J., Cai, C., and Li, Y.: Behavior of OH and HO2 in the winter atmosphere in New York City, Atmos. Environ., 40, 252–263, 2006.
Saunders, S. M., Jenkin, M. E., Derwent, R. G., and Pilling, M. J.: Protocol for the development of the Master Chemical Mechanism, MCM v3 (Part A): tropospheric degradation of non-aromatic volatile organic compounds, Atmos. Chem. Phys., 3, 161–180, https://doi.org/10.5194/acp-3-161-2003, 2003.
Shi, Z., Vu, T., Kotthaus, S., Harrison, R. M., Grimmond, S., Yue, S., Zhu, T., Lee, J., Han, Y., Demuzere, M., Dunmore, R. E., Ren, L., Liu, D., Wang, Y., Wild, O., Allan, J., Acton, W. J., Barlow, J., Barratt, B., Beddows, D., Bloss, W. J., Calzolai, G., Carruthers, D., Carslaw, D. C., Chan, Q., Chatzidiakou, L., Chen, Y., Crilley, L., Coe, H., Dai, T., Doherty, R., Duan, F., Fu, P., Ge, B., Ge, M., Guan, D., Hamilton, J. F., He, K., Heal, M., Heard, D., Hewitt, C. N., Hollaway, M., Hu, M., Ji, D., Jiang, X., Jones, R., Kalberer, M., Kelly, F. J., Kramer, L., Langford, B., Lin, C., Lewis, A. C., Li, J., Li, W., Liu, H., Liu, J., Loh, M., Lu, K., Lucarelli, F., Mann, G., McFiggans, G., Miller, M. R., Mills, G., Monk, P., Nemitz, E., O'Connor, F., Ouyang, B., Palmer, P. I., Percival, C., Popoola, O., Reeves, C., Rickard, A. R., Shao, L., Shi, G., Spracklen, D., Stevenson, D., Sun, Y., Sun, Z., Tao, S., Tong, S., Wang, Q., Wang, W., Wang, X., Wang, X., Wang, Z., Wei, L., Whalley, L., Wu, X., Wu, Z., Xie, P., Yang, F., Zhang, Q., Zhang, Y., Zhang, Y., and Zheng, M.: Introduction to the special issue “In-depth study of air pollution sources and processes within Beijing and its surrounding region (APHH-Beijing)”, Atmos. Chem. Phys., 19, 7519–7546, https://doi.org/10.5194/acp-19-7519-2019, 2019.
Stone, D., Whalley, L. K., and Heard, D. E.: Tropospheric OH and HO2 radicals: field measurements and model comparisons, Chem. Soc. Rev., 41, 6348–6404, 2012.
Stone, D., Whalley, L. K., Ingham, T., Edwards, P. M., Cryer, D. R., Brumby, C. A., Seakins, P. W., and Heard, D. E.: Measurement of OH reactivity by laser flash photolysis coupled with laser-induced fluorescence spectroscopy, Atmos. Meas. Tech., 9, 2827–2844, https://doi.org/10.5194/amt-9-2827-2016, 2016.
Tan, Z., Fuchs, H., Lu, K., Hofzumahaus, A., Bohn, B., Broch, S., Dong, H., Gomm, S., Häseler, R., He, L., Holland, F., Li, X., Liu, Y., Lu, S., Rohrer, F., Shao, M., Wang, B., Wang, M., Wu, Y., Zeng, L., Zhang, Y., Wahner, A., and Zhang, Y.: Radical chemistry at a rural site (Wangdu) in the North China Plain: observation and model calculations of OH, HO2 and RO2 radicals, Atmos. Chem. Phys., 17, 663–690, https://doi.org/10.5194/acp-17-663-2017, 2017.
Tan, Z., Rohrer, F., Lu, K., Ma, X., Bohn, B., Broch, S., Dong, H., Fuchs, H., Gkatzelis, G. I., Hofzumahaus, A., Holland, F., Li, X., Liu, Y., Liu, Y., Novelli, A., Shao, M., Wang, H., Wu, Y., Zeng, L., Hu, M., Kiendler-Scharr, A., Wahner, A., and Zhang, Y.: Wintertime photochemistry in Beijing: observations of ROx radical concentrations in the North China Plain during the BEST-ONE campaign, Atmos. Chem. Phys., 18, 12391–12411, https://doi.org/10.5194/acp-18-12391-2018, 2018.
Tang, G., Zhao, P., Wang, Y., Gao, W., Cheng, M., Xin, J., Li, X., and Wang, Y.: Mortality and air pollution in Beijing: The long-term relationship, Atmos. Environ., 150, 238–243, 2017.
Wang, X., Wang, H., Xue, L., Wang, T., Wang, L., Gu, R., Wang, W., Tham, Y. J., Wang, Z., Yang, L. and Chen, J.: Observations of N2O5 and ClNO2 at a polluted urban surface site in North China: High N2O5 uptake coefficients and low ClNO2 product yields, Atmos. Environ., 156, 125–134, 2017.
Wang, Z., Li, Y., Chen, T., Zhang, D., Sun, F., Wei, Q., Dong, X., Sun, R., Huan, N., and Pan, L.: Ground-level ozone in urban Beijing over a 1-year period: Temporal variations and relationship to atmospheric oxidation, Atmos. Res., 164, 110–117, 2015.
Whalley, L. K., Furneaux, K. L., Goddard, A., Lee, J. D., Mahajan, A., Oetjen, H., Read, K. A., Kaaden, N., Carpenter, L. J., Lewis, A. C., Plane, J. M. C., Saltzman, E. S., Wiedensohler, A., and Heard, D. E.: The chemistry of OH and HO2 radicals in the boundary layer over the tropical Atlantic Ocean, Atmos. Chem. Phys., 10, 1555–1576, https://doi.org/10.5194/acp-10-1555-2010, 2010.
Whalley, L. K., Blitz, M. A., Desservettaz, M., Seakins, P. W., and Heard, D. E.: Reporting the sensitivity of laser-induced fluorescence instruments used for HO2 detection to an interference from RO2 radicals and introducing a novel approach that enables HO2 and certain RO2 types to be selectively measured, Atmos. Meas. Tech., 6, 3425–3440, https://doi.org/10.5194/amt-6-3425-2013, 2013.
Whalley, L. K., Stone, D., Dunmore, R., Hamilton, J., Hopkins, J. R., Lee, J. D., Lewis, A. C., Williams, P., Kleffmann, J., Laufs, S., Woodward-Massey, R., and Heard, D. E.: Understanding in situ ozone production in the summertime through radical observations and modelling studies during the Clean air for London project (ClearfLo), Atmos. Chem. Phys., 18, 2547–2571, https://doi.org/10.5194/acp-18-2547-2018, 2018.
Whalley, L. K., Slater, E. J., Woodward-Massey, R., Ye, C., Lee, J. D., Squires, F., Hopkins, J. R., Dunmore, R. E., Shaw, M., Hamilton, J. F., Lewis, A. C., Mehra, A., Worrall, S. D., Bacak, A., Bannan, T. J., Coe, H., Ouyang, B., Jones, R. L., Crilley, L. R., Kramer, L. J., Bloss, W. J., Vu, T., Kotthaus, S., Grimmond, S., Sun, Y., Xu, W., Yue, S., Ren, L., Acton, W. J. F., Hewitt, C. N., Wang, X., Fu, P., and Heard, D. E.: Evaluating the sensitivity of radical chemistry and ozone formation to ambient VOCs and NOx in Beijing, Atmos. Chem. Phys. Discuss., https://doi.org/10.5194/acp-2020-785, in review, 2020.
Woodward-Massey, R., Slater, E. J., Alen, J., Ingham, T., Cryer, D. R., Stimpson, L. M., Ye, C., Seakins, P. W., Whalley, L. K., and Heard, D. E.: Implementation of a chemical background method for atmospheric OH measurements by laser-induced fluorescence: characterisation and observations from the UK and China, Atmos. Meas. Tech., 13, 3119–3146, https://doi.org/10.5194/amt-13-3119-2020, 2020.
Zhang, H., Wang, S., Hao, J., Wang, X., Wang, S., Chai, F., and Li, M.: Air pollution and control action in Beijing, J. Clean. Prod., 112, 1519–1527, 2016a.
Zhang, L., Wang, T., Zhang, Q., Zheng, J., Xu, Z., and Lv, M.: Potential sources of nitrous acid (HONO) and their impacts on ozone: A WRF-Chem study in a polluted subtropical region, J. Geophys. Res.-Atmos., 121, 3645–3662, 2016b.
Zhou, X., Gao, H., He, Y., Huang, G., Bertman, S. B., Civerolo, K., and Schwab, J.: Nitric acid photolysis on surfaces in low-NOx environments: Significant atmospheric implications, Geophys. Res. Lett., 30, 2217, https://doi.org/10.1029/2003GL018620, 2003.