the Creative Commons Attribution 4.0 License.
the Creative Commons Attribution 4.0 License.
 | 27 Nov 2020
Source apportionment of black carbon aerosols from light absorption observation and source-oriented modeling: an implication in a coastal city in China
Jialei Zhu
Xin Wang
Pingqing Fu
Black carbon (BC) is the most important light-absorbing aerosol in the atmosphere. However, sources of atmospheric BC aerosols are largely uncertain, making it difficult to assess its influence on radiative forcing and climate change. In this study, year-round light-absorption observations were conducted during 2014 using an aethalometer in Xiamen, a coastal city in Southeast China. Source apportionment of BC was performed and temporal variations in BC sources were characterized based on both light absorption measurements and a source-oriented air quality model. The annual average concentrations of BC from fossil fuel (BCff) and biomass burning (BCbb) by the aethalometer method were 2932 ± 1444 ng m−3 and 1340 ± 542 ng m−3, contributing 66.7 % and 33.3 % to total BC, respectively. A sensitivity analysis was performed with different absorption Ångström exponent (AAE) values of fossil fuel combustion (αff) and biomass burning (αbb), suggesting that the aethalometer method was more sensitive to changes in αbb than αff. BCbb contribution exhibited a clear diurnal cycle, with the highest level (37.9 %) in the evening rush hour and a seasonal pattern with the maximum (39.9 %) in winter. Conditional probability function (CPF) analysis revealed the large biomass-burning contributions were accompanied by east-northeasterly and northerly winds. Backward trajectory indicated that air masses from North and East–Central China were associated with larger biomass-burning contributions. Potential source contribution function (PSCF) and concentration-weighted trajectory (CWT) suggested that North and East–Central China and Southeast Asia were potential sources of both BCff and BCbb. The source-oriented modeling results showed that transportation, residential and open biomass burning accounting for 45.3 %, 30.1 % and 17.6 % were the major BC sources. Among the three fuel catalogs, liquid fossil fuel (46.5 %) was the largest source, followed by biomass burning (32.6 %) and coal combustion (20.9 %). Source contributions of fossil fuel combustion and biomass burning identified by the source-oriented model were 67.4 % and 32.6 %, respectively, close to those obtained by the aethalometer method. The findings provide solid support for controlling fossil fuel sources to limit the impacts of BC on climate change and environmental degradation in the relatively clean region in China.
- Article
(14606 KB) - Full-text XML
-
Supplement
(1283 KB) - BibTeX
- EndNote


Black carbon (BC) aerosol is a vital air pollutant throughout the surface earth system and has attracted great concern regarding its multiple impacts on human health, climate change and atmospheric visibility (Bond et al., 2013; Zhuang et al., 2018, 2019; Chen et al., 2020). As the most important light-absorbing component of PM2.5 (particulate matters with aerodynamic diameter less than 2.5 µm), BC exerts a key and unique role in the climate system by absorbing solar radiation, affecting chemical/physical properties of cloud and influencing snow and ice cover (Jacobson, 2002; Ramanathan and Carmichael, 2008; Bond et al., 2013; Qian et al., 2014; Kim et al., 2015). BC is even found as the second most important climate-warming agent after carbon dioxide, with a positive climate forcing of 1.1 W m−2, greater than that of methane (Bond et al., 2013). BC also has impacts on urban weather conditions and may play a key role in extreme weather (Ding et al., 2013; Fan et al., 2015; Saide et al., 2015; Wang et al., 2018). Under polluted environments, BC has significant influence on pollution development (Ding et al., 2016; Peng et al., 2016; Lou et al., 2019). In addition, BC leads to visibility impairment because of its strong absorption of visible light (Watson, 2002) and has adverse impacts on human health due to its adsorption captivity (Janssen et al., 2011; Colicino et al., 2017). Nevertheless, due to lacking observational constraints and uncertainties in emission inventories, large uncertainties still exist in BC emissions including absolute fluxes and relative source contributions of fossil versus biomass combustion, which will complicate our knowledge on the multiple BC effects. It is also necessary to clarify the contributions of different sources to BC in order to determine efficient emission mitigation strategies. At global scale, BC emission sources can be attributed to fossil fuels (∼ 40 %), open biomass burning (∼ 40 %) and biofuels (∼ 20 %) (Ramanathan and Carmichael, 2008). However, these fractions vary significantly because of the substantial spatial and temporal variations in BC emissions (Venkataraman et al., 2005; Rehman et al., 2011; Cheng et al., 2013; Andersson et al., 2015).
Several source apportionments for quantitatively differentiating between biomass and fossil sources of ambient BC aerosol have been conducted using observation-based methods, such as the isotope (e.g., radiocarbon) analysis technique and light-absorbing property analysis (Sandradewi et al., 2008; Gustafsson et al., 2009; Liu et al., 2014; Vaishya et al., 2017; Helin et al., 2018; Kalogridis et al., 2018; Mousavi et al., 2018; Jing et al., 2019; Kant et al., 2020). For example, Andersson et al. (2015) presented dual carbon isotope constrained BC source apportionment in three key hotspot regions in China during a severe haze event, finding that biomass burning contributed ∼ 30 % to BC, whereas fossil fuel sources were dramatically different between north and south. The aethalometer model was adopted to analyze light absorption at multi-wavelengths to assess the fossil fuel and biomass combustion contributions to BC in Delhi, revealing that the contribution of biomass burning was 28 % on average (Dumka et al., 2018). Mousavi et al. (2019) apportioned BC in the Milan metropolitan area to the fossil fuel and biomass-burning emission using the aethalometer model with the absorption Ångström exponent (AAE) values derived from the 14C radiocarbon analysis, highlighting the significant impact of residential wood burning on BC. Such observation-based source apportionment methods are powerful to understand the BC sources at given receptor locations. However, the methods are highly dependent on accurate observations with high temporal resolution, which is unavailable for most regions without the measurement instruments. For example, the isotope method, especially the 14C analysis, is costly and lacks high temporal resolution. Therefore, although many observation-based BC source apportionments have been carried out, the source-based method can still be a strong supplement. For example, Winiger et al. (2019) conducted observation-based source apportionment of circum-Arctic BC with carbon isotope analysis and found that comparison of Lagrangian atmospheric transport model (FLEXPART-ECLIPSE-GFED) predictions with the observations agreed well with each other for BC concentrations, with larger discrepancies for (fossil/biomass-burning) sources, indicating the misallocations of emissions in the emission inventories.
Source-oriented modeling, which estimates pollution levels and identifies sources using chemical transport models (CTMs) with the inputs of emission inventory and meteorology, is another useful tool to study potential factors deriving BC. Such a source apportionment technique has been developed and used for direct source apportionment of PM in more than a decade (Kleeman et al., 2007; Ying et al., 2008; Zhang et al., 2014). For example, Hu et al. (2015) found that residential emission was the major contributor to BC in spring and winter, while industrial emission was important in summer and fall in China. Guo et al. (2017) quantified the contributions of different sources in northern India and found that industry was the largest source of BC. Although the source-oriented modeling is powerful, limitations exist, such as the inability to take into account unknown sources and the imprecise information on emission inventories and meteorology. The method is highly dependent on accuracy of emission inventory, which is unfortunately an enormous challenge. A pollution source not in the emission inventory will not emerge as a contributor to the CTM results. Taking into account the advantages and disadvantages of the observation- and modeling-based methods, a combination of the two methods can be a complement to each other for providing reliable and reasonable information on pollution sources and contributions.
China is the largest source of BC aerosols in the world (Wang et al., 2012; Bond et al., 2013; Huang et al., 2016); remarkable influences of BC on air quality, weather condition and climate change were revealed in China (Menon et al., 2002; Ding et al., 2016; Huang et al., 2016; Yang et al., 2017). Spatiotemporal distributions and regional transport mechanisms of BC in China as well as their affecting factors have been widely investigated with field measurements or model simulations (Cao et al., 2010; Wu et al., 2013; Wang et al., 2015; Zhang et al., 2019; Zheng et al., 2019; Deng et al., 2020). In contrast, source apportionment studies on BC aerosols in China are still limited and mostly distributed in heavily polluted areas (Chen et al., 2013; Andersson et al., 2015; K. Li et al., 2016; N. Li et al., 2016; Yu et al., 2018; Jing et al., 2019). In this study, the observation-based method was combined with the source-oriented modeling to quantify the contributions of different sources of BC in a relatively clean region in China. The results of the two source apportionment methods were inter-compared. Temporal variability, potential sources and transport pathways of BC from fossil fuel and biomass burning were also characterized. The findings help better understand the main sources and relative contributions of BC and provide valuable information to adopt effective emission reduction measures to control BC pollution in not heavily polluted regions.
2.1 Observation site and measurements
The field campaign was performed in the Institute of Urban Environment, Chinese Academy of Sciences (118∘ 03'E, 24∘ 36'N) in the coastal city of Xiamen in China (Deng et al., 2016, 2020). Xiamen is located in the western Taiwan Strait region, which is adjacent to the Yangtze River Delta region (YRD) and the Pearl River Delta region (PRD) (Fig. 1). Xiamen has a small local emission of BC (Fig. 1) and a better diffusion condition compared to some developed cities in East China, which might lead to a lower BC concentration in Xiamen (Deng et al., 2020). However, Xiamen is often affected by emissions from polluted areas by long-range transport under the influence of the East Asia monsoon (Deng et al., 2020). Therefore, conducting source apportionment of BC over Xiamen is very representative for improving our understanding of the sources of BC and their transport characteristics in a relatively clean region.

Figure 1Location of Xiamen, China, with spatial distribution of annual average BC emission rate (g s−1). BC emission data in China are from the MEIC inventory developed by Tsinghua University.
The observation site (10 m above sea level) lies approximately 15 km away from the downtown to the southeast. None of the large industrial sources was within 10 km away, and there were only a few construction and traffic sources. The measurement instruments were arranged on the rooftop (8 m above ground level) of the site. Real-time measurements of BC mass concentration were conducted with a seven-wavelength (370, 470, 520, 590, 660, 880 and 950 nm) aethalometer (AE31, Magee Scientific) in January–December 2014. An aethalometer with a PM2.5 cut-off inlet worked at a flow rate of 5 L min−1 and estimated light attenuation under the principle of optical transmission (Hansen et al., 1984). BC concentration was then calculated according to the light attenuation. The concentration measured at 880 nm is considered to be the standard value of atmospheric BC because BC is the predominant light-absorbing species at this wavelength, with little impact from other compounds (Ganguly et al., 2005). The method reported in Virkkula et al. (2007) was applied to correct BC mass concentration due to shadowing effects and multiple scattering effects.
2.2 Observation-based source apportionment
Observation-based source apportionment of BC in Xiamen was performed with the aethalometer method. The method based on the two-component assumption has been widely adopted to assess the contribution from fossil fuel combustion and biomass burning (Sandradewi et al., 2008; Favez et al., 2010; Liu et al., 2014; Rajesh and Ramachandran, 2017; Martinsson et al., 2017; Dumka et al., 2018; Helin et al., 2018; Mousavi et al., 2019; Mbengue et al., 2020). The aethalometer method apportions the total BC to BCff (BC emitted by fossil fuels) and BCbb (BC emitted by biomass burning) contributions. BCff and BCbb are expressed as follows:
where babs(λ) is light absorption at a wavelength of λ, and babs,ff and babs,bb are light absorption coefficients for fossil fuel and biomass burning, respectively. The light absorption depends on the wavelength, satisfying the following relation:
where α is the AAE value. babs is assumed to apportion to babs,ff and babs,bb contributions in the two-component method (Sandradewi et al., 2008):
Using Eqs. (3)–(4) and babs measured at two different wavelengths, the fossil fuel and biomass-burning contribution can be derived using the following equations:
where αff and αbb are the AAE values for fossil fuel and biomass burning, respectively. For preselected αff and αbb values, babs,ff and babs,bb can be calculated by Eqs. (7)–(8). BCff and BCbb can be obtained by combining all the above equations and assumed values for αff and αbb. In this study, 470 and 950 nm were selected as λ1 and λ2 in accordance with previous studies (Sandradewi et al., 2008; Favez et al., 2010; Zotter et al., 2017; Helin et al., 2018; Kalogridis et al., 2018).
In the aethalometer model, one of the largest uncertainties is related to the choice of the αff and αbb values (Sciare et al., 2011; Healy et al., 2017; Zotter et al., 2017; Helin et al., 2018). The site-specific α values are affected by the type of fuel, combustion regime, and mixing state of BC aerosols with non-absorbing materials (Favez et al., 2010; Lack and Langridge, 2013; Garg et al., 2016). All of these factors increase the uncertainty of observation-based source apportionment. In the literature, fixed αff and αbb values were commonly used in source apportionment studies for simplicity (Favez et al., 2010; Herich et al., 2011; Sciare et al., 2011; Harrison et al., 2012; Fuller et al., 2014; Rajesh and Ramachandran, 2017; Zotter et al., 2017; Helin et al., 2018). For example, Sandradewi et al. (2008) suggested that αff was 1.1 and αbb was 1.8–1.9 from the light absorption at 470 and 950 nm. Zotter et al. (2017) suggested the AAE values in the aethalometer model were site- and source-specific and recommended using an αff of 0.9 and an αbb of 1.68 in Switzerland. Based on a comprehensive investigation of previous studies using the aethalometer model (Table S1 in the Supplement), αff and αbb values were most commonly in the ranges of 0.9–1.1 and 1.7–2.2, respectively. In this work, the empirical value of αff and αbb is adopted as 1.0 and 2.0 following many previous studies (Kirchstetter et al., 2004; Favez et al., 2010; Crippa et al., 2013; Fuller et al., 2014; Crilley et al., 2015; Petit et al., 2017; Vaishya et al., 2017; Xiao et al., 2020). In addition, in order to test the impact of AAE values on the performance of the aethalometer model, a sensitivity analysis with various combinations of AAE pairs was implemented. Except for the base assessment with αff=1.0 and αbb=2.0, the analysis was conducted by changing the αff from 0.9 to 1.1 and the αbb from 1.7 to 2.2.
2.3 Potential sources of BCff and BCbb
The conditional probability function (CPF) was used to investigate the possible predominant directions of local sources of BCff and BCbb relative to wind directions in different seasons (Ashbaugh et al., 1985). The CPF is calculated as
where nΔθ is the total occurrences from wind sector Δθ and mΔθ is occurrences from the same wind sector with the BCff (BCbb) concentration exceeding the threshold criterion. The CPF analysis was also performed for the ratio of BCbb to BC (BCbb∕BC) to analyze the impact of local sources on the contribution from biomass burning. In this analysis, a threshold criterion of the top 25 % concentration (ratio) was chosen (Deng et al., 2020).
Backward trajectories were simulated with the Hybrid Single Particle Lagrangian Integrated Trajectory model (HYSPLIT) from NOAA/ARL to characterize the regional sources and transport of air masses arriving in Xiamen (Stein et al., 2015). Five-day backward trajectories ending at a height of 500 m were calculated every hour using the Global Data Assimilation System (GDAS) reanalysis meteorological dataset with a 1∘ × 1∘ latitude–longitude resolution. Hourly trajectory endpoints implying the geographical distribution and the height of the air parcel were derived from the model. Trajectory clusters were then obtained from cluster analysis, which was performed based on the inputs of hourly backward trajectories with the TrajStat plugin of the Meteoinfo (http://www.meteothink.org/, last access: April 2020) software. Four clusters were obtained for each season with the clustering option of angle Euclidean distance. The outflow regimes for air masses to the receptor site with the potential origins were traced with the trajectory clusters.
Potential regional source contributions of BCff and BCbb were further identified with the potential source contribution function (PSCF) method on the basis of the backward trajectories. PSCF is a widely adopted tool to identify regional source distributions of air pollutants at a receptor site (Hopke et al., 1995; Bari et al., 2015; Zhang et al., 2017). The study domain is divided into i × j grid cells, and PSCF values can be calculated as follows:
where ni,j is the number of endpoints in the ijth grid cell and mi,j is the number of endpoints for the same grid cell that have BCff (BCbb) concentration higher than a criterion. These grid cells with high PSCF values are the maximum probability potential source areas contributing to high BCff (BCbb) mass concentrations at the receptor location. In this work, the top 25 % concentrations were set as the threshold. The study domain covered 10–55∘ N and 80–140∘ E, which comprises 10800 grid cells with a size of 0.5∘ × 0.5∘ latitude and longitude.
To minimize the uncertainty in grid cells with low ni,j, an empirical weight function wi,j was multiplied by the PSCF values. wi,j was defined as follows.
It is difficult for the PSCF method to identify the source intensity and separate strong sources and weak sources. Therefore, the concentration-weighted trajectory (CWT) model was also performed to overcome this limitation. In this method, each grid cell is assigned a weighted concentration by averaging the sample concentrations that have associated trajectories crossing the grid cell (Hsu et al., 2003). The average weighted concentration Ci,j in the ijth grid cell was calculated as follows:
where M is the total number of trajectories, Cl is the observed BCff (BCbb) concentration at receptor site on arrival of trajectory l and is the number of endpoints in the ijth grid cell of trajectory l. In general, the grid cells with high CWT values are high-strength sources. The weighting function wi,j was also adopted in the CWT analysis to reduce the effect of the small values of ni,j.
2.4 Source-oriented modeling
In this analysis, source apportionment of BC over Xiamen using an updated source-oriented Community Multiscale Air Quality Modeling System (CMAQ) model for primary particulate matter (CMAQ-PPM) (Hu et al., 2015; Guo et al., 2017) was also implemented in addition to the observation-based source apportionment. The CMAQ-PPM model was updated on the basis of CMAQ v5.0.1, which was developed by the U.S. EPA Atmospheric Science Modeling Division. The photochemical mechanism and aerosol chemistry mechanism adopted in this study were SAPRC-11 and AERO6, respectively. In the source-oriented model, tagged non-reactive PM tracers are used to estimate the source contributions of PPM and its chemical components. The PM tracers are set to undergo the same atmospheric processes as other species. The emissions of the tracers are set to 0.001 % of the PPM emissions from each corresponding source sector and region. This ensures that the tracers will not significantly change the particle mass and size. After scaling up by 105, the simulated tracer concentration represents the PPM concentrations from a specific source type/region. The concentrations of the inert chemical components in PPM can be estimated with source-specific emission profiles as follows:
where Ci,j is the concentration of the jth component from the ith source, Ai,j is the ratio of the jth component in PPM mass from the ith source and PPMi is the simulated concentration for the ith source. Detailed descriptions of the model can be found in Hu et al. (2015).
The sourced-oriented modeling with tagged tracers is similar to the particulate source apportionment technology (PSAT). However, PSAT does not track the species from different sources directly in each time step. Instead, it allocates the changes in bulk concentrations to different sources after each time step based on the ratio of each source to total emissions. Compared with the source-oriented model, the brute force method (BFM) is more suitable for estimating the change in PM due to proposed emission control measures than for determining the contributions of certain sources because removal of PM emissions could affect the transport, chemistry, deposition and interactions with meteorology, although they are not chemically reactive (Zhang and Ying, 2011). The results simulated with the BFM are different from “source apportionment” since the summation of the contributions of all source categories will not always equal the total concentration. In addition, the BFM needs to repeat chemical transport model simulations multiple times and greatly increases the computational cost.
Regional distributions of BC from different categories (sectors) as well as the source category (sector) contributions to BC at the receptor site were determined with the source-oriented CMAQ-PPM model. A 36 km horizontal resolution domain that covers China and surrounding countries in East Asia (Fig. 1) was applied. There are 18 vertical layers with a surface layer thickness of 35 m and an overall model height of 20 km. The Weather Research and Forecasting model (WRF) v3.9.1 was utilized to generate meteorology inputs with initial and lateral boundary conditions from NCEP FNL reanalysis data from NCAR, which are available on 1∘ × 1∘ grids continuously for every 6 h (http://dss.ucar.edu/datasets/ds083.2/, last access: April 2020). There are 29 vertical layers in the WRF domain. The first eight layers of the WRF and CMAQ domains are identical. The outputs of WRF were post-processed by Meteorology-Chemistry Interface Processor (MCIP) v4.2 to the format CMAQ requires. Anthropogenic emissions in China were generated according to the Multi-resolution Emission Inventory for China (MEIC) developed by Tsinghua University (http://www.meicmodel.org, last access: April 2020). Emissions from other countries and regions outside China were generated with the Regional Emission inventory in ASia version 2 (REAS2) (Kurokawa et al., 2013). The fire emissions were derived from the Fire Inventory from NCAR (FINN) based on satellite observations (Wiedinmyer et al., 2011). Anthropogenic emissions were grouped into four sectors, including industrial, power, transportation and residential. Open burning emissions are considered to be the fifth emission sector. Open biomass burning generally refers to open combustion of various biomass materials such as forest vegetation, crop residue and municipal solid waste (Permadi and Oanh, 2013). Sources from five sectors were further classified into three categories, such as solid fossil fuel (i.e., coal) combustion, liquid fossil fuel combustion and biomass burning, on the basis of the energy consumption data provided by Wang et al. (2012). The performance of the source-oriented model on BC was evaluated by all available observations within China in Hu et al. (2015), which found that the model could reproduce the BC concentrations well, and there was good agreement between the BC observation and simulation. Spatial distributions of BC concentrations over China are depicted in Fig. S1, suggesting that BC concentration in the western Taiwan Strait region was much lower than that in other urban agglomerations in North China, East–Central China and the Sichuan Basin. However, Xiamen had relatively higher abundance compared to the surrounding areas.
3.1 Light absorption-based source apportionment of BC
Figure 2 demonstrates the temporal variations in daily mean concentrations of BCff and BCbb with the BCbb∕BC fraction in Xiamen during the field campaign. The missing data were due to the instrument maintenance. Daily concentrations of BCff and BCbb were 445–9545 ng m−3 (average: 2932 ± 1444 ng m−3) and 334–4031 ng m−3 (1340 ± 542 ng m−3), respectively. Daily contribution of BCbb to total BC varied significantly in the range of 18.4 %–58.3 %, and the daily BCff∕BC fraction ranged from 41.7 % to 81.6 %. The annual average contribution of BCbb to BC was 33.3 %, much smaller than that of BCff (66.7 %), indicating the predominant contribution of fossil fuel combustion in Xiamen. The sensitivity of the aethalometer model was investigated by using different αff and αbb combinations (Fig. 3). The BCff∕BC fraction increased with an increase in αff value, and there was even a more rapid increase in that fraction when αbb increased. Contrarily, the BCbb∕BC fraction decreased with the increasing αff and αbb values. In the sensitivity tests, the BCff contributions were in the range from 42 % (αff=0.9, αbb=1.7) to 79 % (αff=1.1, αbb=2.2). The sensitivity analysis also indicates that the apportionment results are more sensitive to the changing αbb values than to αff values. For example, keeping the αff value at 1.0, the BCff∕BC increased from 46 % to 75 % for the αbb value from 1.7 to 2.2. However, a slower increase in the BCff∕BC fraction from 64 % to 72 % was found when the αff value changes from 0.9 to 1.1 by fixing the αbb value at 2.0. It is different from previous studies over Granada in Spain (Titos et al., 2017) and Delhi in India (Dumka et al., 2018), which both found the aethalometer model was more sensitive to αbb than to αff.
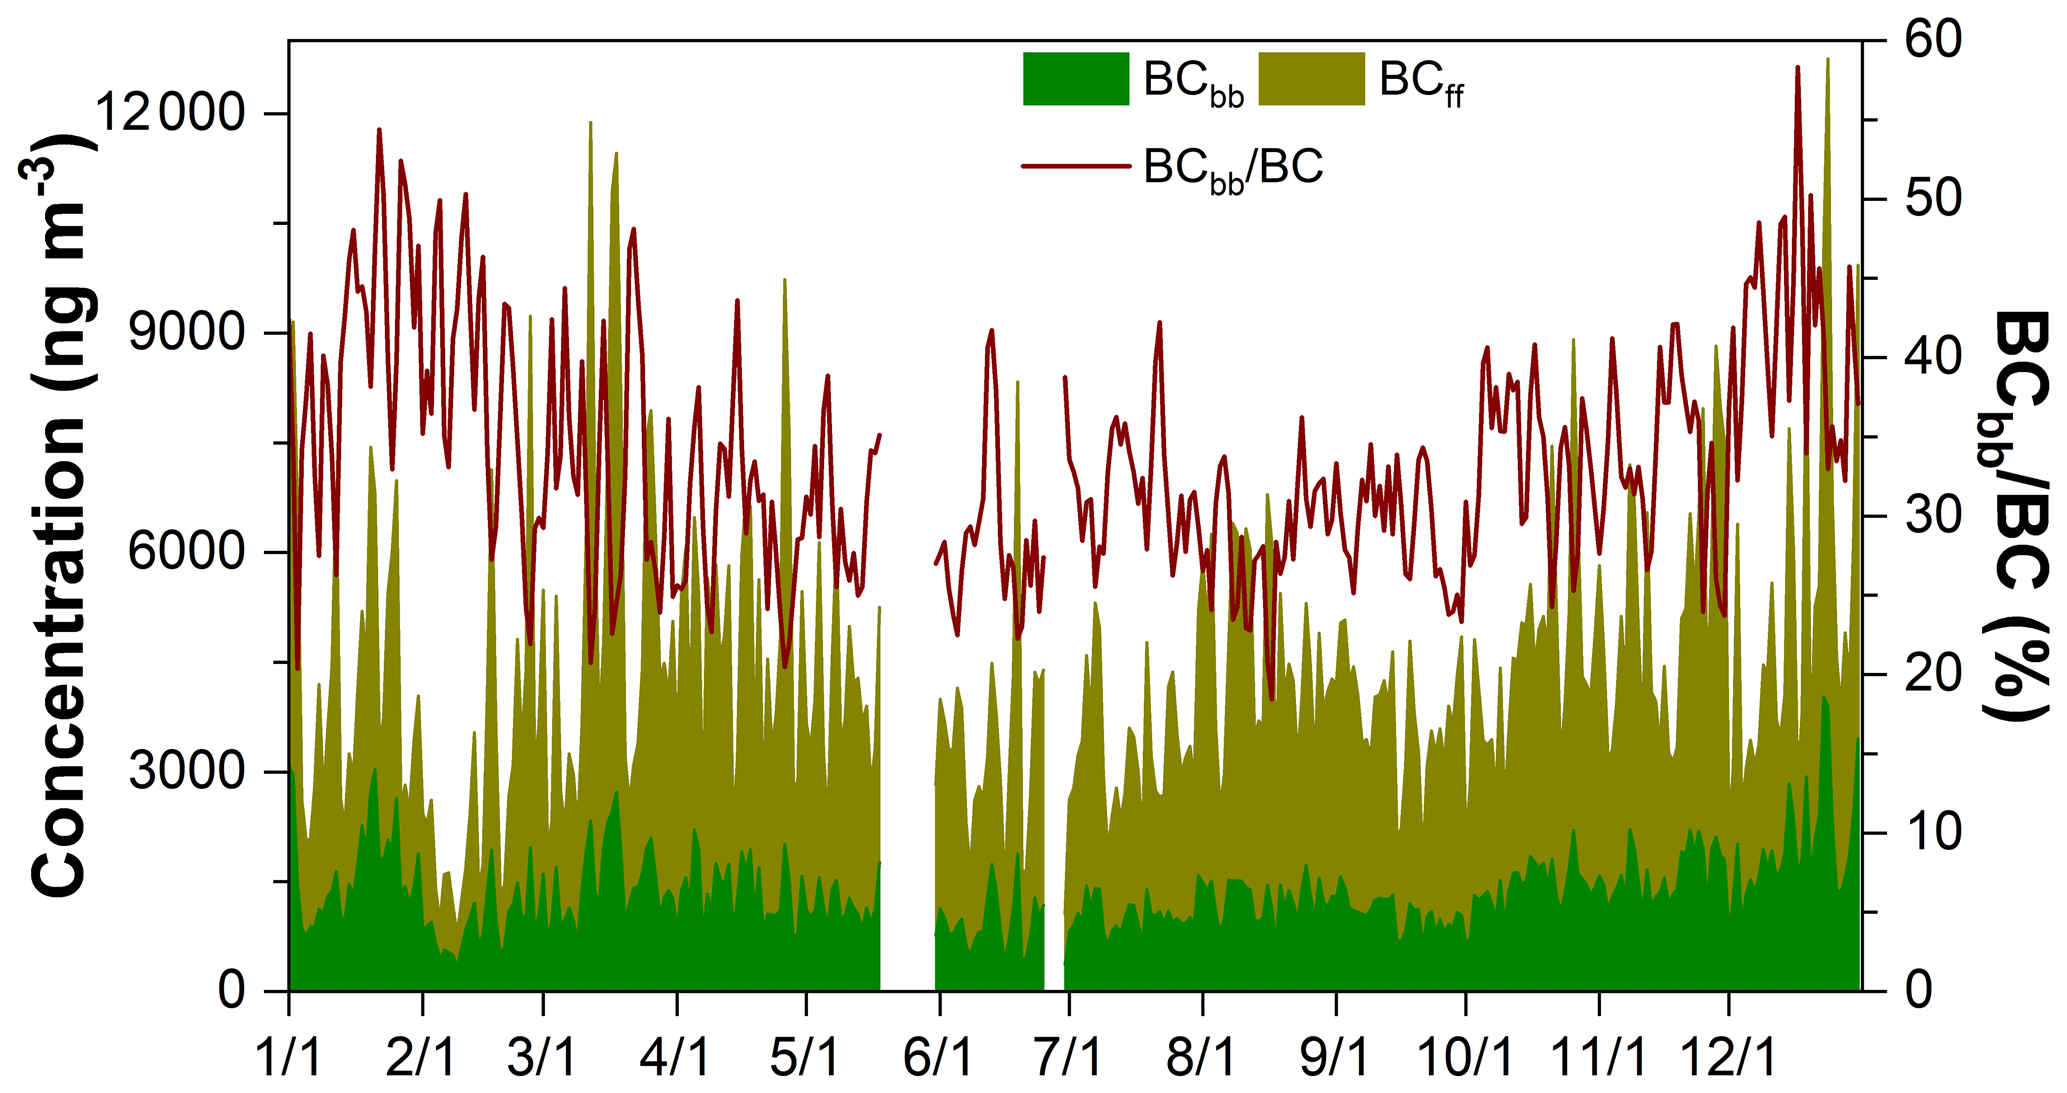
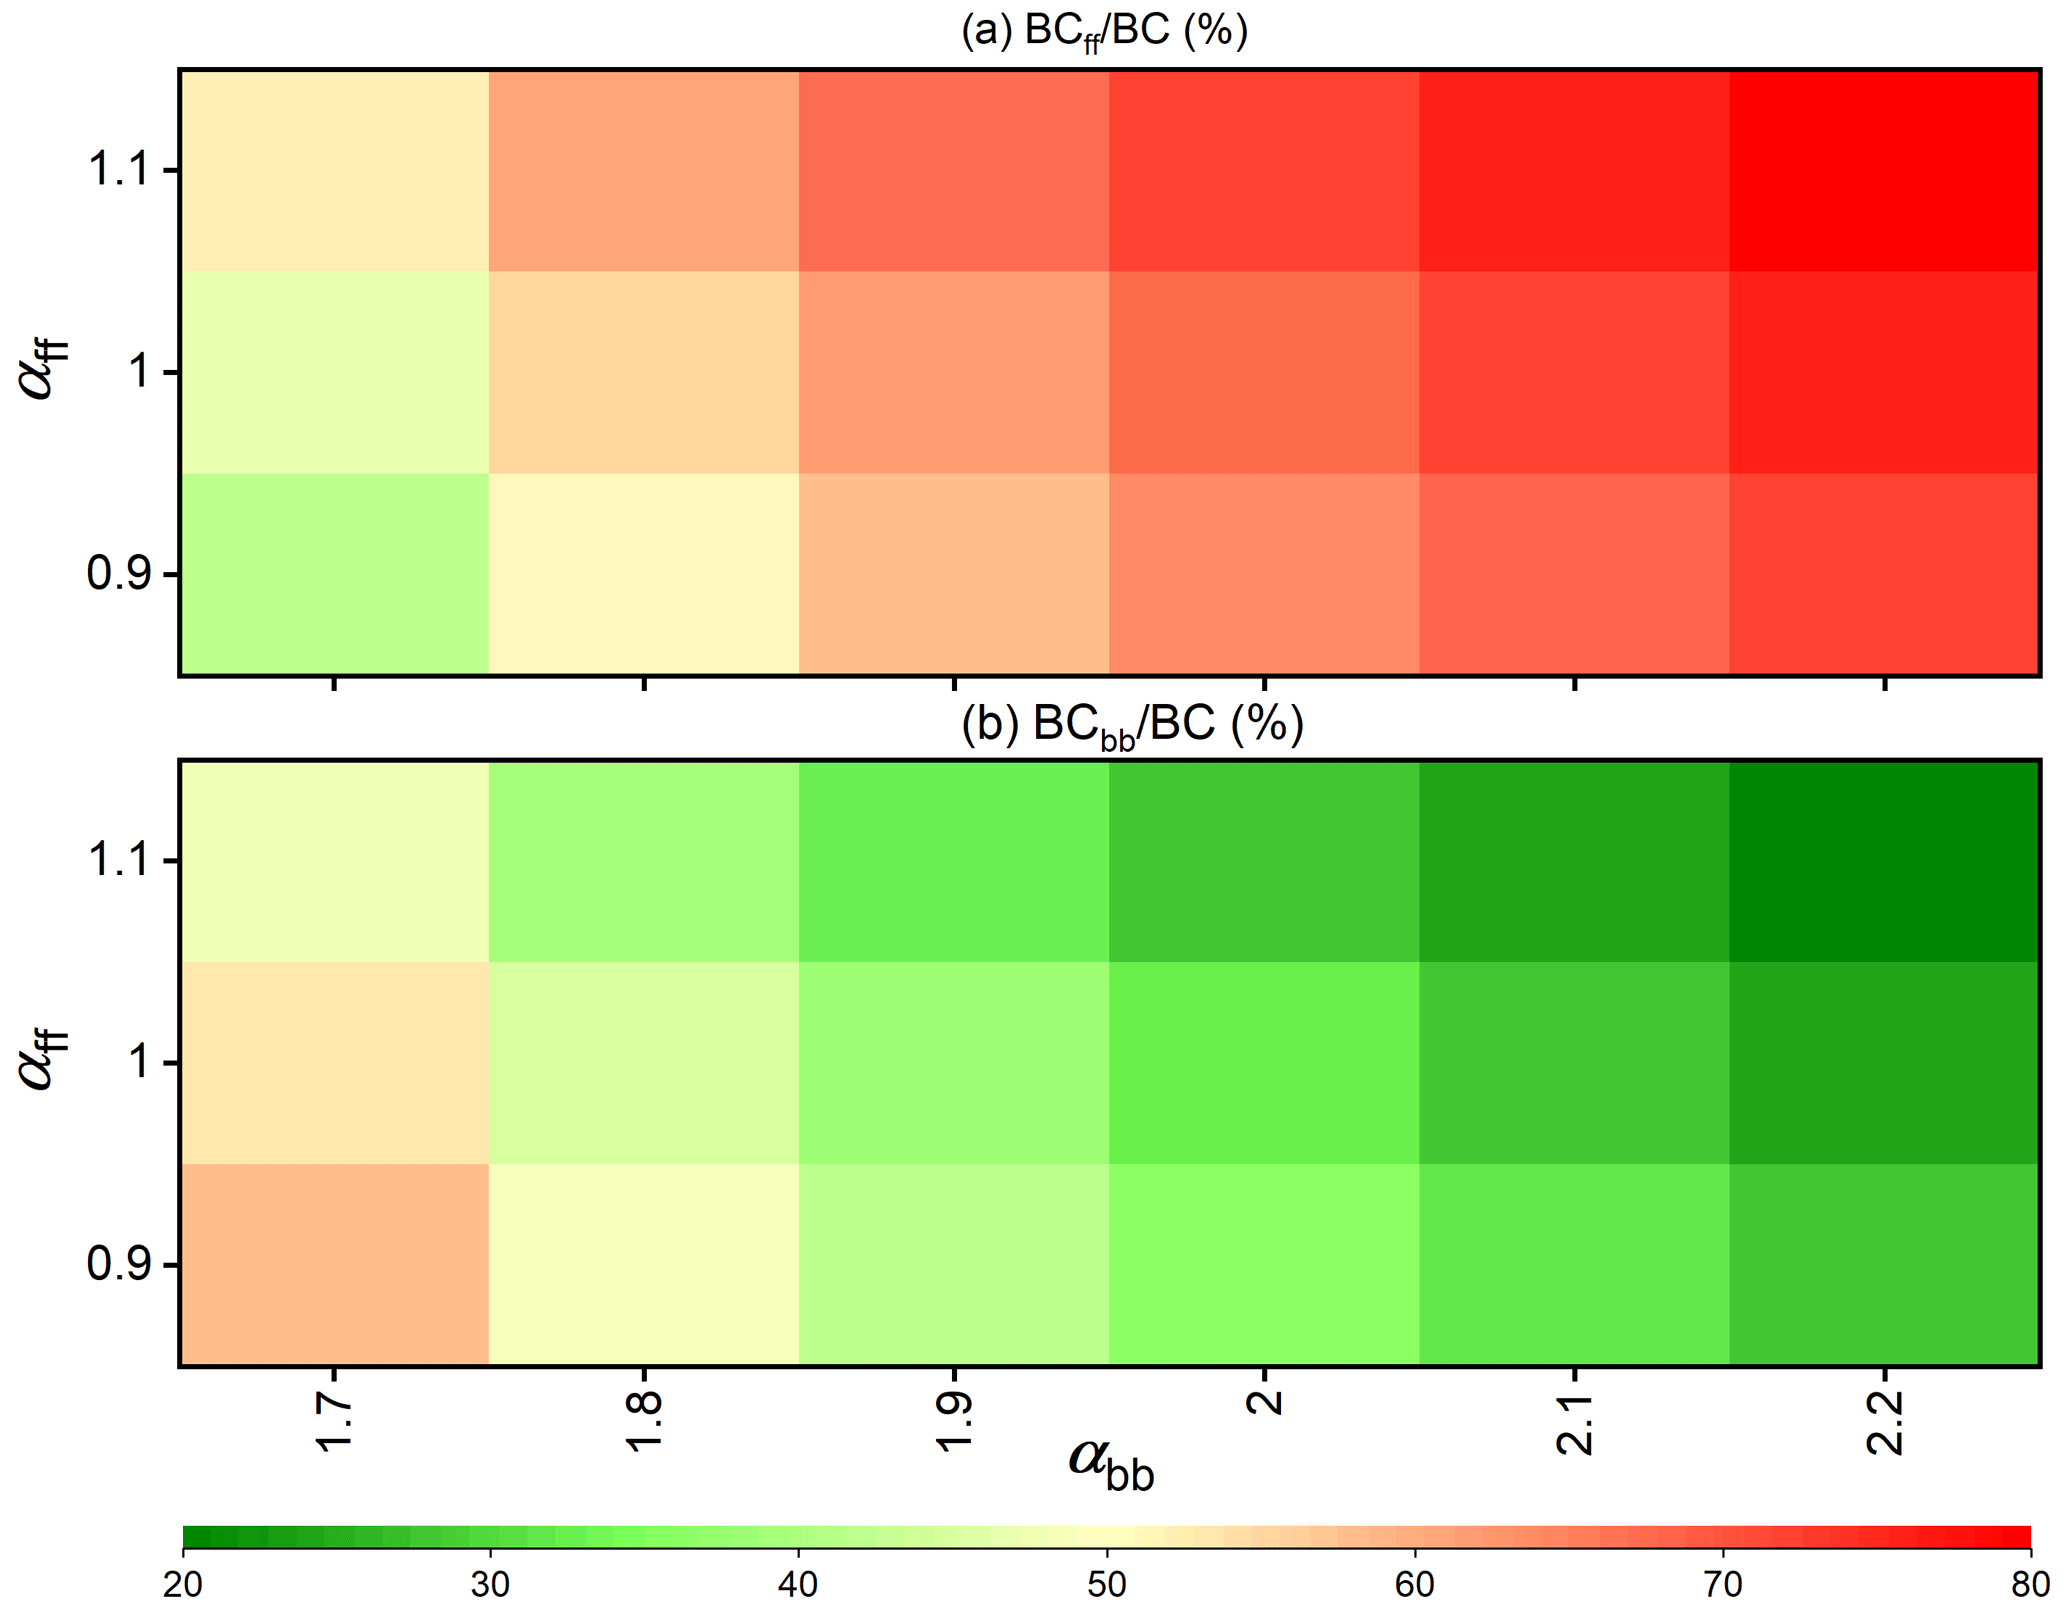
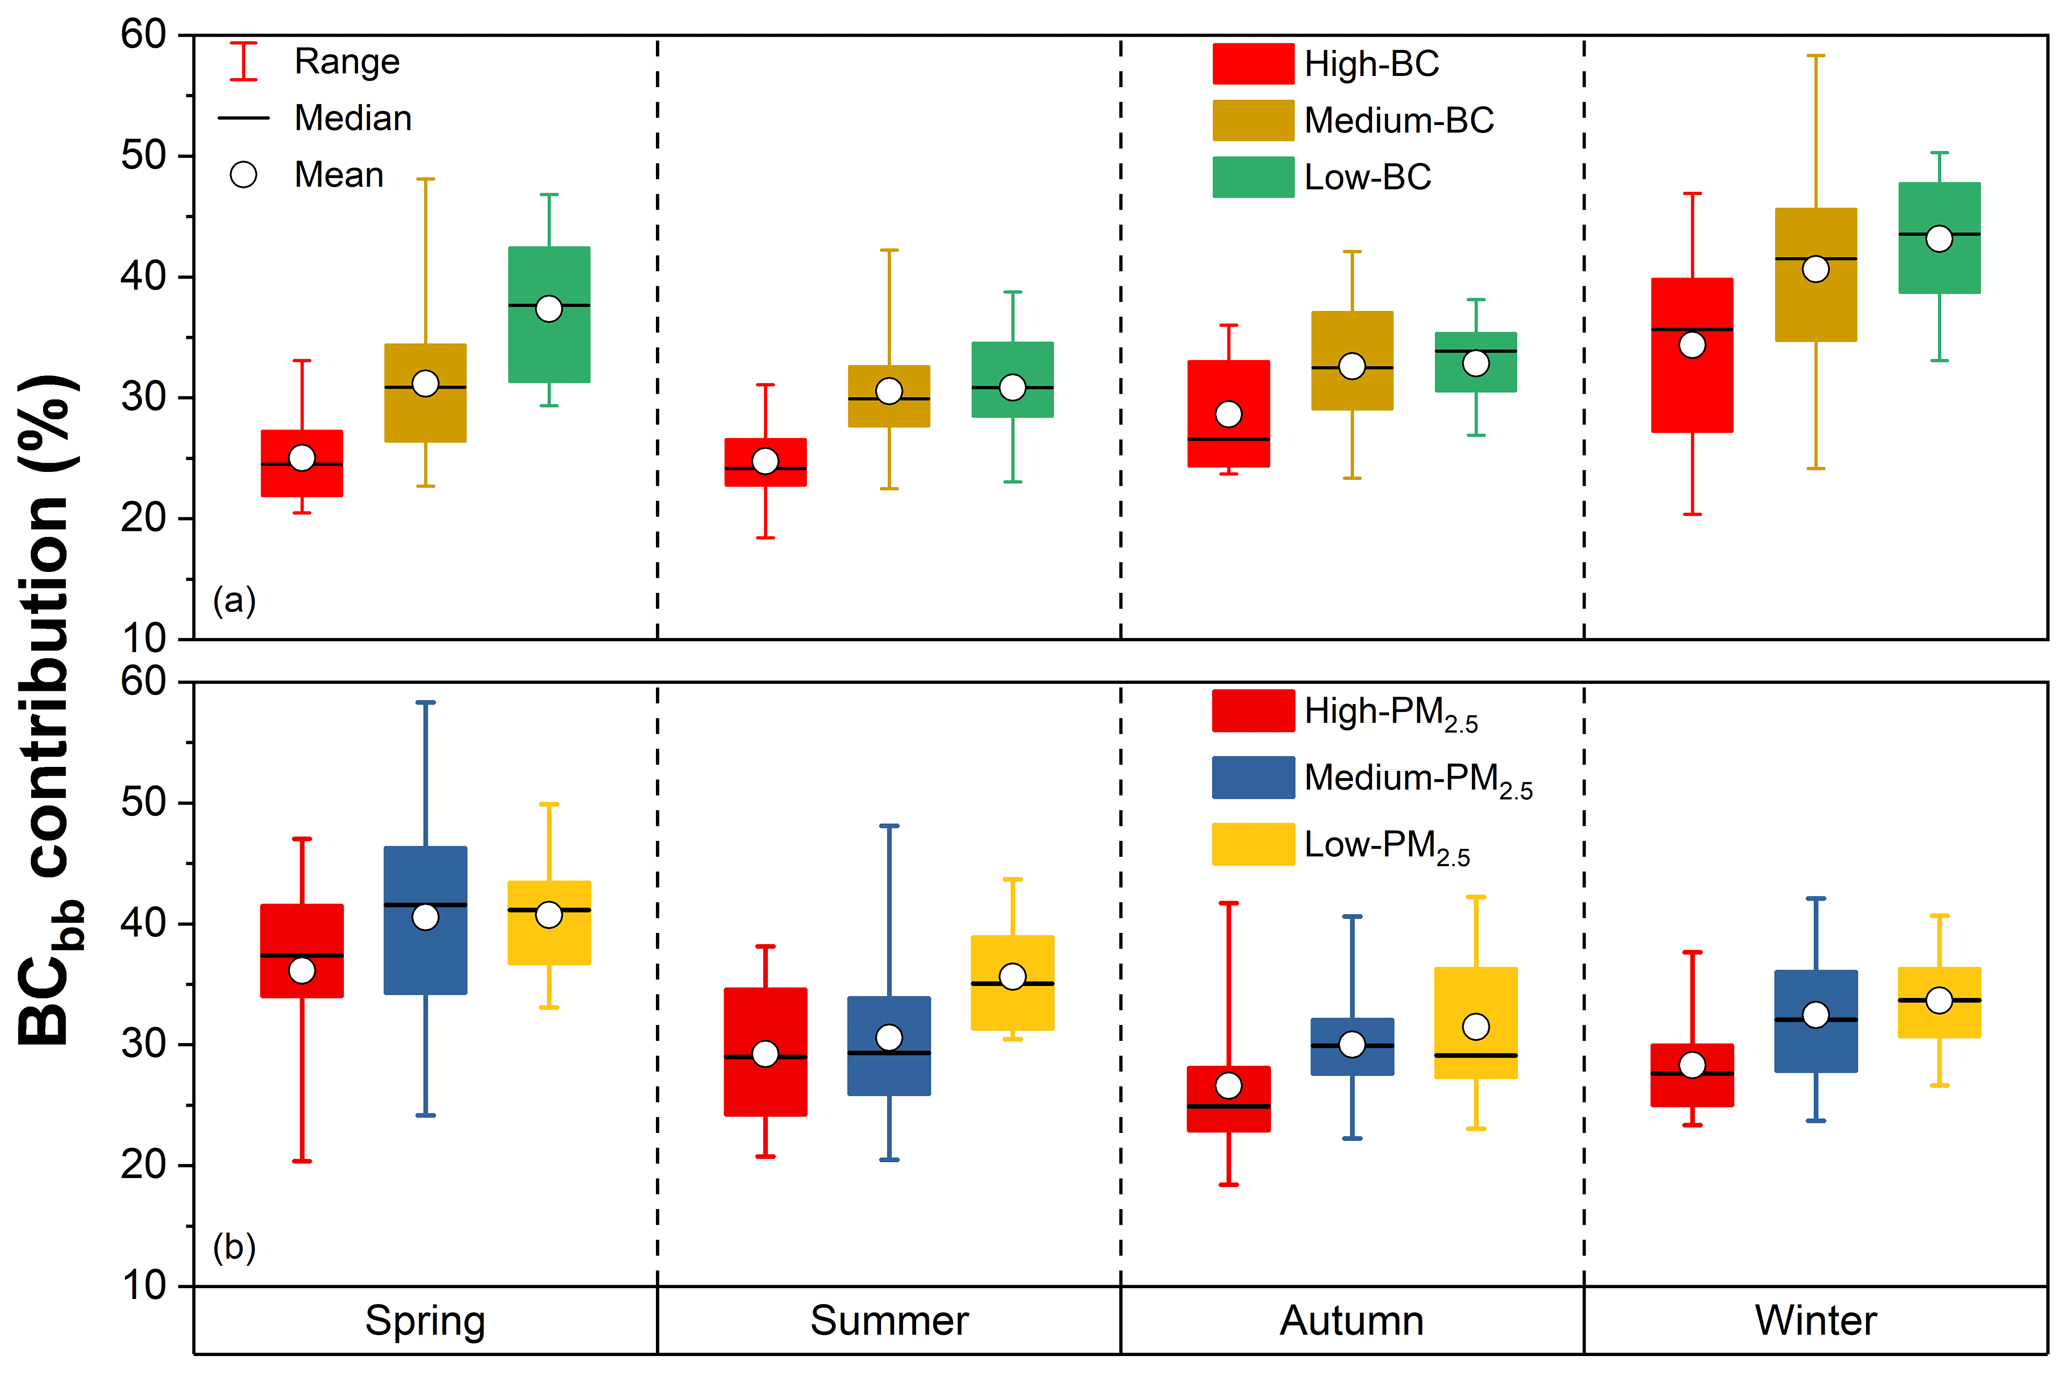
Figure 4Box plots of BCbb contributions with different concentrations of (a) BC and (b) PM2.5 in different seasons.
Source apportionment results under different levels of air pollutants (i.e., BC and PM2.5) in each season were further investigated to understand BC sources of pollution and clean days (Fig. 4). The data of PM2.5 concentration measured by a Tapered Element Oscillating Microbalance (TEOM) sampler (RP1400, Thermo Fisher Scientific) were from Xiamen Environmental Monitoring Central Station. High-pollutant periods are the days with a daily average concentration higher than the seasonal average plus 1 standard deviation, while low-pollutant periods are the days with a daily average concentration lower than the seasonal average minus 1 standard deviation. Generally, source contributions of BC show obvious variability among different pollution levels in all seasons, and the BCbb percentage decreases with the increasing concentrations of BC and PM2.5. Biomass burning contributed more during low-BC (30.8 %–43.1 %) and low-PM2.5 days (31.5 %–40.7 %) compared to high-BC (24.8 %–34.4 %) and high-PM2.5 episodes (26.6 %–36.1 %), implying that emissions from coal combustion and vehicle exhausts are major contributors of particulate pollution in Xiamen. The fractional contribution of fossil fuel to BC in Xiamen derived by the aethalometer method in this work suggests a slighter larger role of fossil fuel compared to that (61 %) estimated according to the “bottom-up” emission inventories (Chen et al., 2013). However, it was similar to the contribution (∼ 70 %) in YRD and PRD, which was estimated based on dual carbon isotope constrained source apportionment (Andersson et al., 2015). BCff and BCbb percentages in different regions calculated with the aethalometer method were summarized in Table S2 for comparison. BCbb fractions in Xiamen were overall larger than that in Nanjing in China and other sites in India, suggesting that the contribution of biomass burning increases over the relatively clean region due to the weak emissions of traffic and coal combustion.
Figure 5 illustrates the diurnal and monthly cycles of BCff and BCbb concentrations as well as the relative contribution of biomass burning (BCbb∕BC) during the measurements. BCff exhibited a pronounced diurnal variation, increasing steadily before dawn with the major morning peak (4427 ng m−3) observed around 06:00 in the morning. The high BCff concentrations at the observation site from late night to the early morning (∼ 21:00 to 08:00) may be ascribed to enhanced traffic emissions from diesel trucks during nighttime and cars during rush hours. The heavy diesel trucks, which are major emission sources of BCff, were allowed to enter the city from 22:00 to 07:00. Therefore, BCff decreased during daytime and reached a diurnal minimum of 1950 ng m−3 at 13:00 in the afternoon. BCbb exhibited a diurnal trend that was different with BCff. The morning peak (1755 ng m−3) at 06:00 was also found for BCbb. However, BCbb concentration kept a steady state rather than increased after 20:00 since BCbb was not influenced by traffic-related emission. Clear diurnal variation in contribution of BCbb to total BC was found. The BCbb fraction reached its valley of 30.4 % at 08:00, increased due to the decrease in traffic emission, and maximized with a ratio of 37.9 % at 19:00 in the evening due to increases in biomass-burning activities. The diurnal cycles of BCff and BCbb were affected by not only the BC emission trend, but also the evolution of the atmospheric boundary layer. According to our previous study on atmospheric boundary layer height in Xiamen (Deng et al., 2020), the boundary layer height was ∼ 3 times larger in the afternoon than that in the early morning, leading to the better diffusion conditions in the afternoon.
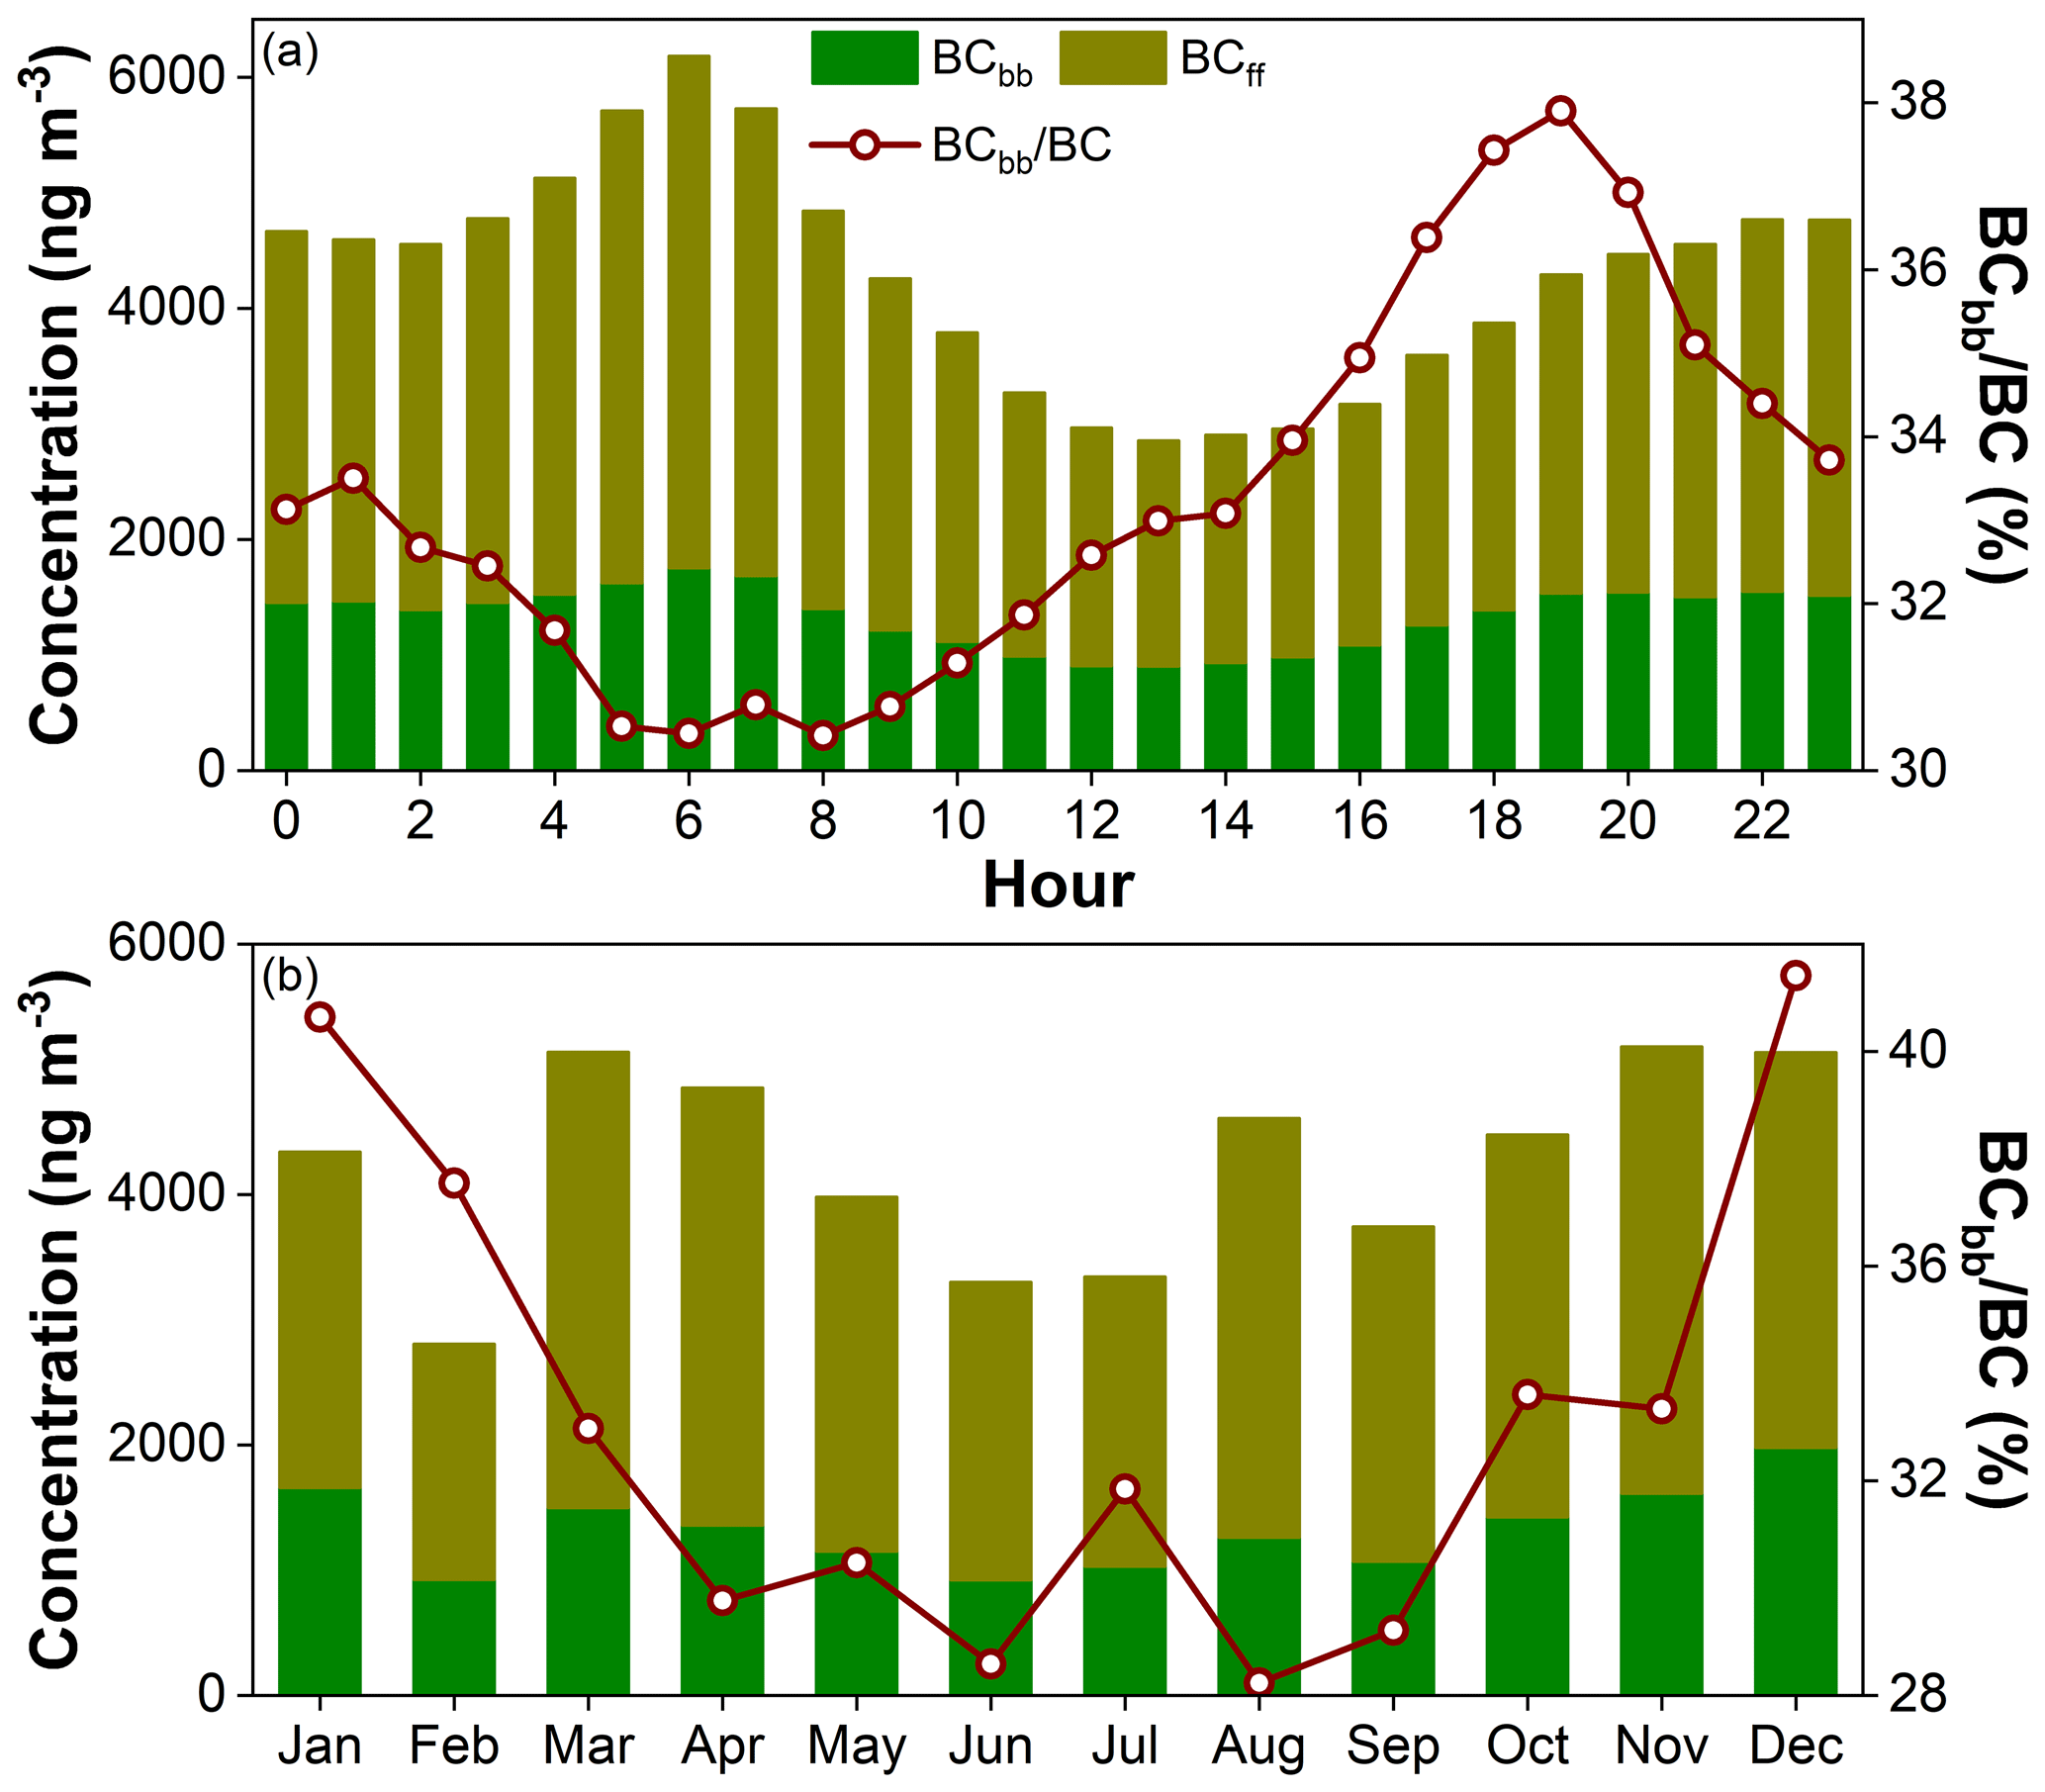
Figure 5Diurnal and monthly variations in BCff and BCbb concentrations with the BCbb∕BC fraction.
Monthly mean BCbb concentration peaked with a value of 1979 ng m−3 in December and reached its valley of 923 ng m−3 in June. The monthly pattern of BCff was similar but a bit different with that of BCbb. The maximum monthly mean BCff concentration was 3636 ng m−3 in March, while the minimum was 1881 ng m−3 in February. The valley of BCff concentration occurring in February was maybe because of the lack of vehicle (e.g., diesel trucks) emissions around the Spring Festival holiday, which again proves the conjecture in the diurnal pattern of BCff. Similar to the seasonal pattern of the absorption Ångstrom exponent (Qiu et al., 2019), noticeable seasonal variation in the BCbb∕BC fraction was found. Winter (December–February) had the largest BCbb contribution (39.9 %), followed by fall (September–November) (32.1 %), spring (March–May) (31.1 %) and summer (June–August) (29.6 %). The much larger contributions in winter are possibly due to the enhanced source from open-field biomass and domestic burning in China (He et al., 2011). The higher BCbb concentration and contribution lasted from fall to early winter, consistent with a previous emission inventory of biomass burning, which found higher BC emissions from November to February than other months (He et al., 2011). Unlike BCff, BCbb exhibited an increasing trend in July, leading to a relatively large contribution of BCbb. It might be affected by the long-range transport of air pollutants emitted from biomass burning in Southeast Asia under the control of summer monsoon (Qiu et al., 2019). The monthly variation in boundary layer height, which was larger in the warm season and smaller in the cold season, also affected the monthly patterns of BCff and BCbb (Deng et al., 2020).
3.2 Sources and transport pathways of BCff and BCbb
The CPF results for the top 25 % thresholds of concentrations of BCff (3797 ng m−3) and BCbb (1813 ng m−3) as well as BCbb contribution (45 %) over different periods are shown in Fig. 6. In the whole year, high BCff concentrations were mainly associated with winds from west-southwest to north-northeast with wind speed (ws) < 2 m s−1 (Fig. 6a). In particular, high BCff concentrations were most remarkably distributed in winds from the northwest at low ws (< ∼ 1 m s−1) and to a lesser extent from the west and north-northeast at moderate ws (< 3 m s−1). It implies the impacts of local sources such as the traffic emissions to the northwest of the site within a short distance. The CPF pattern for BCbb was similar to but not the same as that of BCff (Fig. 6b). In addition to northwesterly wind with low ws, northeasterly and easterly winds with ws < 5 m s−1 were also accompanied by high BCbb concentration. Correspondingly, the CPF plot for the BCbb∕BC fraction implies the significant influence of east-northeasterly wind with ws > 2 m s−1 on a large contribution of biomass burning (Fig. 6c). In addition, northerly winds with wind speeds > ∼ 4 m s−1 were also frequently associated with a large BCbb fraction. CPF patterns presented obvious seasonality. For BCff and BCbb, the CPF distributions over spring, summer and fall were similar and the high concentrations were mainly associated with northwesterly wind with ws < 2 m s−1. However, in winter, additionally with wind from the northwest, high BCff and BCbb concentrations were also frequently associated with wind from the southwest and west with ws < 3 m s−1. For the BCbb∕BC fraction, large fractions were mainly distributed in northeasterly wind with ws > 4 m s−1 and most remarkably distributed in winds from the northeast at high ws (> 6 m s−1) in spring and summer. In fall, east-northeasterly wind with ws > 3 m s−1 was more frequently associated with a large contribution of biomass burning. However, in winter, northerly wind with ws > 4 m s−1 and northeasterly wind with ws > 2 m s−1 were most remarkably associated with a large BCbb percentage.
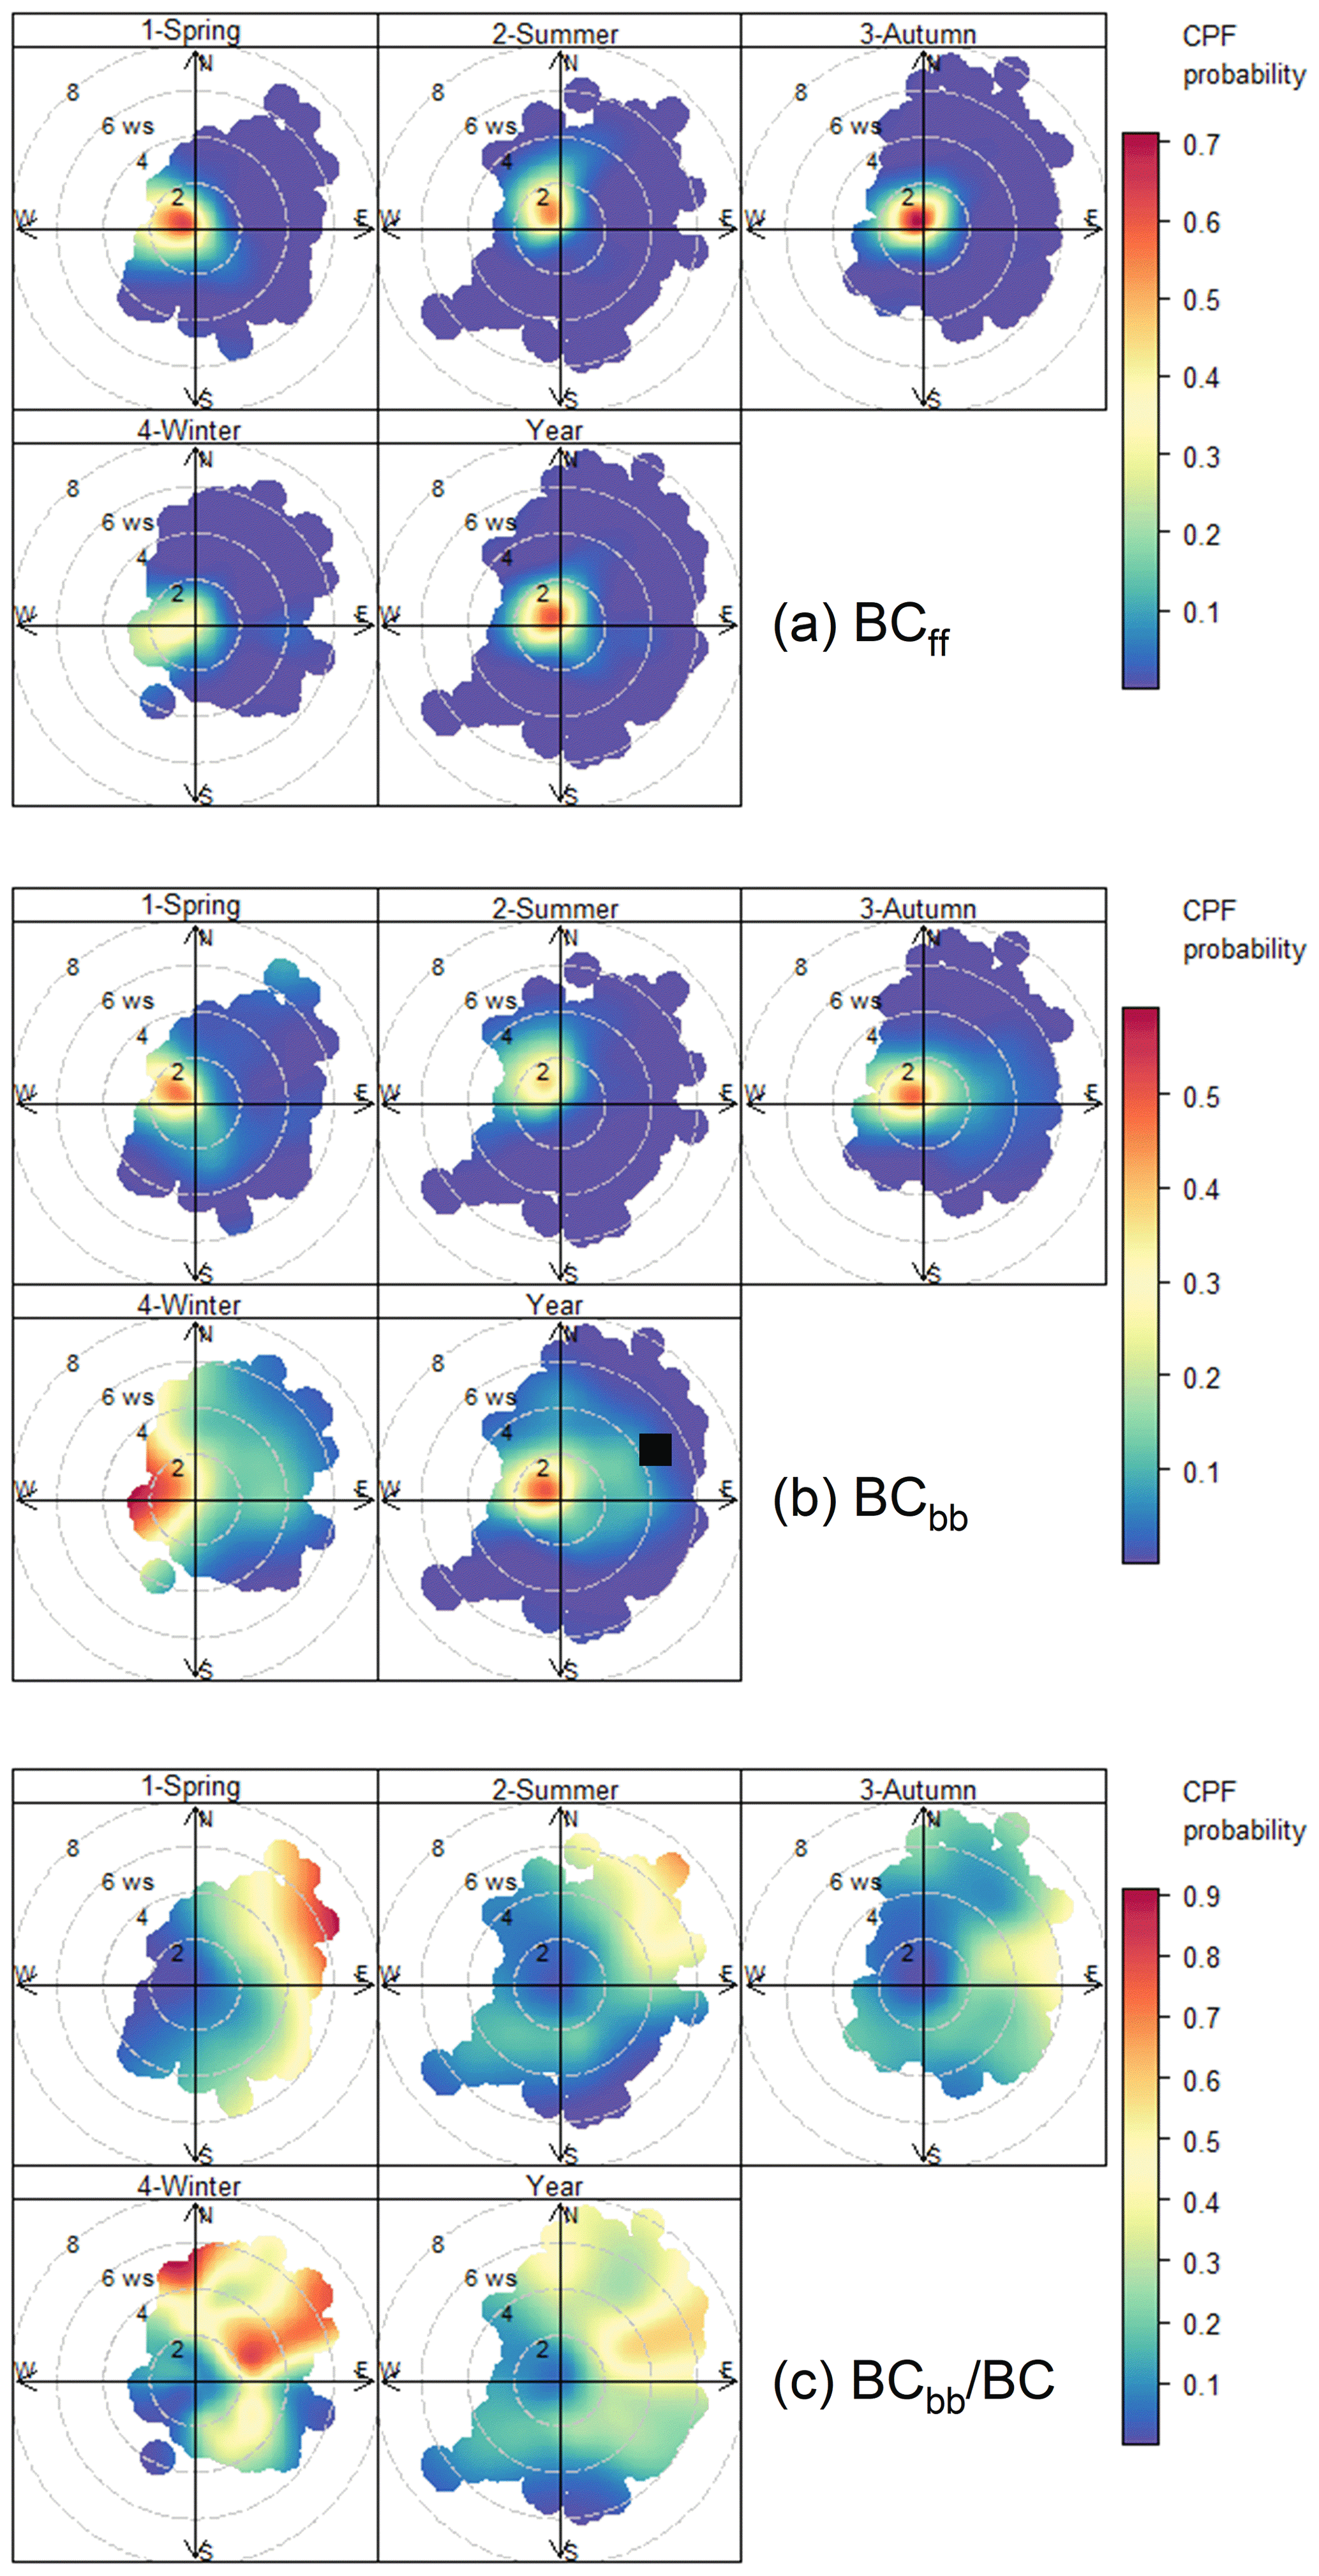
Figure 6CPF plots for (a) BCff, (b) BCbb and (c) BCbb contributions in Xiamen in 2014. ws represents wind speed (m s−1).
Seasonal clusters of backward trajectories obtained by the HYSPLIT model with the average BCbb contributions are illustrated in Fig. 7. Mean concentrations of BCff, BCbb and BC of each cluster in different seasons are summarized in Table S3. It is clearly shown that origins and transport pathways of air masses arriving in Xiamen exhibited distinct seasonal variations. In summer, air masses were characterized by a predominance of southerly origin. In contrast, in other seasons, air masses from the north had a dominant position, which was particularly the case in winter. Generally, air masses from the northern inland region such as North China and East–Central China had larger biomass-burning contributions compared to those from seas such as the East China Sea and South China Sea, since there are dense emissions of biomass burning in North and East China, including Hebei, Henan, Shandong and Jiangsu (Huang et al., 2012; Wu et al., 2018). In spring, the eastern cluster (C4) originating from the East China Sea had the lowest BCbb fraction (31 %). However, the northern cluster (C3) originating from Siberia and passing through Mongolia and North and East China had a much larger biomass-burning contribution (42 %) in comparison to the other clusters. In summer, the northeastern coastal cluster (C4) originating from the East China Sea and passing along with East China coast region had a larger biomass-burning contribution (38 %). The northern cluster passing through Jiangsu, Zhejiang and northern Fujian Province also had a relatively higher BCbb fraction (35 %). In fall, the northern inland cluster (C3) originating from Siberia and passing through the heavily polluted areas such as the North China Plain and YRD were associated the largest biomass-burning contribution (40 %), followed by the other long-range inland cluster (C2) with the BCbb fraction of 36 %. In winter, similar to spring and fall, the northern cluster from Siberia (C2) had the largest biomass-burning contribution (48 %). Contrarily, the northeastern marine air masses passing along the coastal region had the lowest BCbb fraction (35 %).
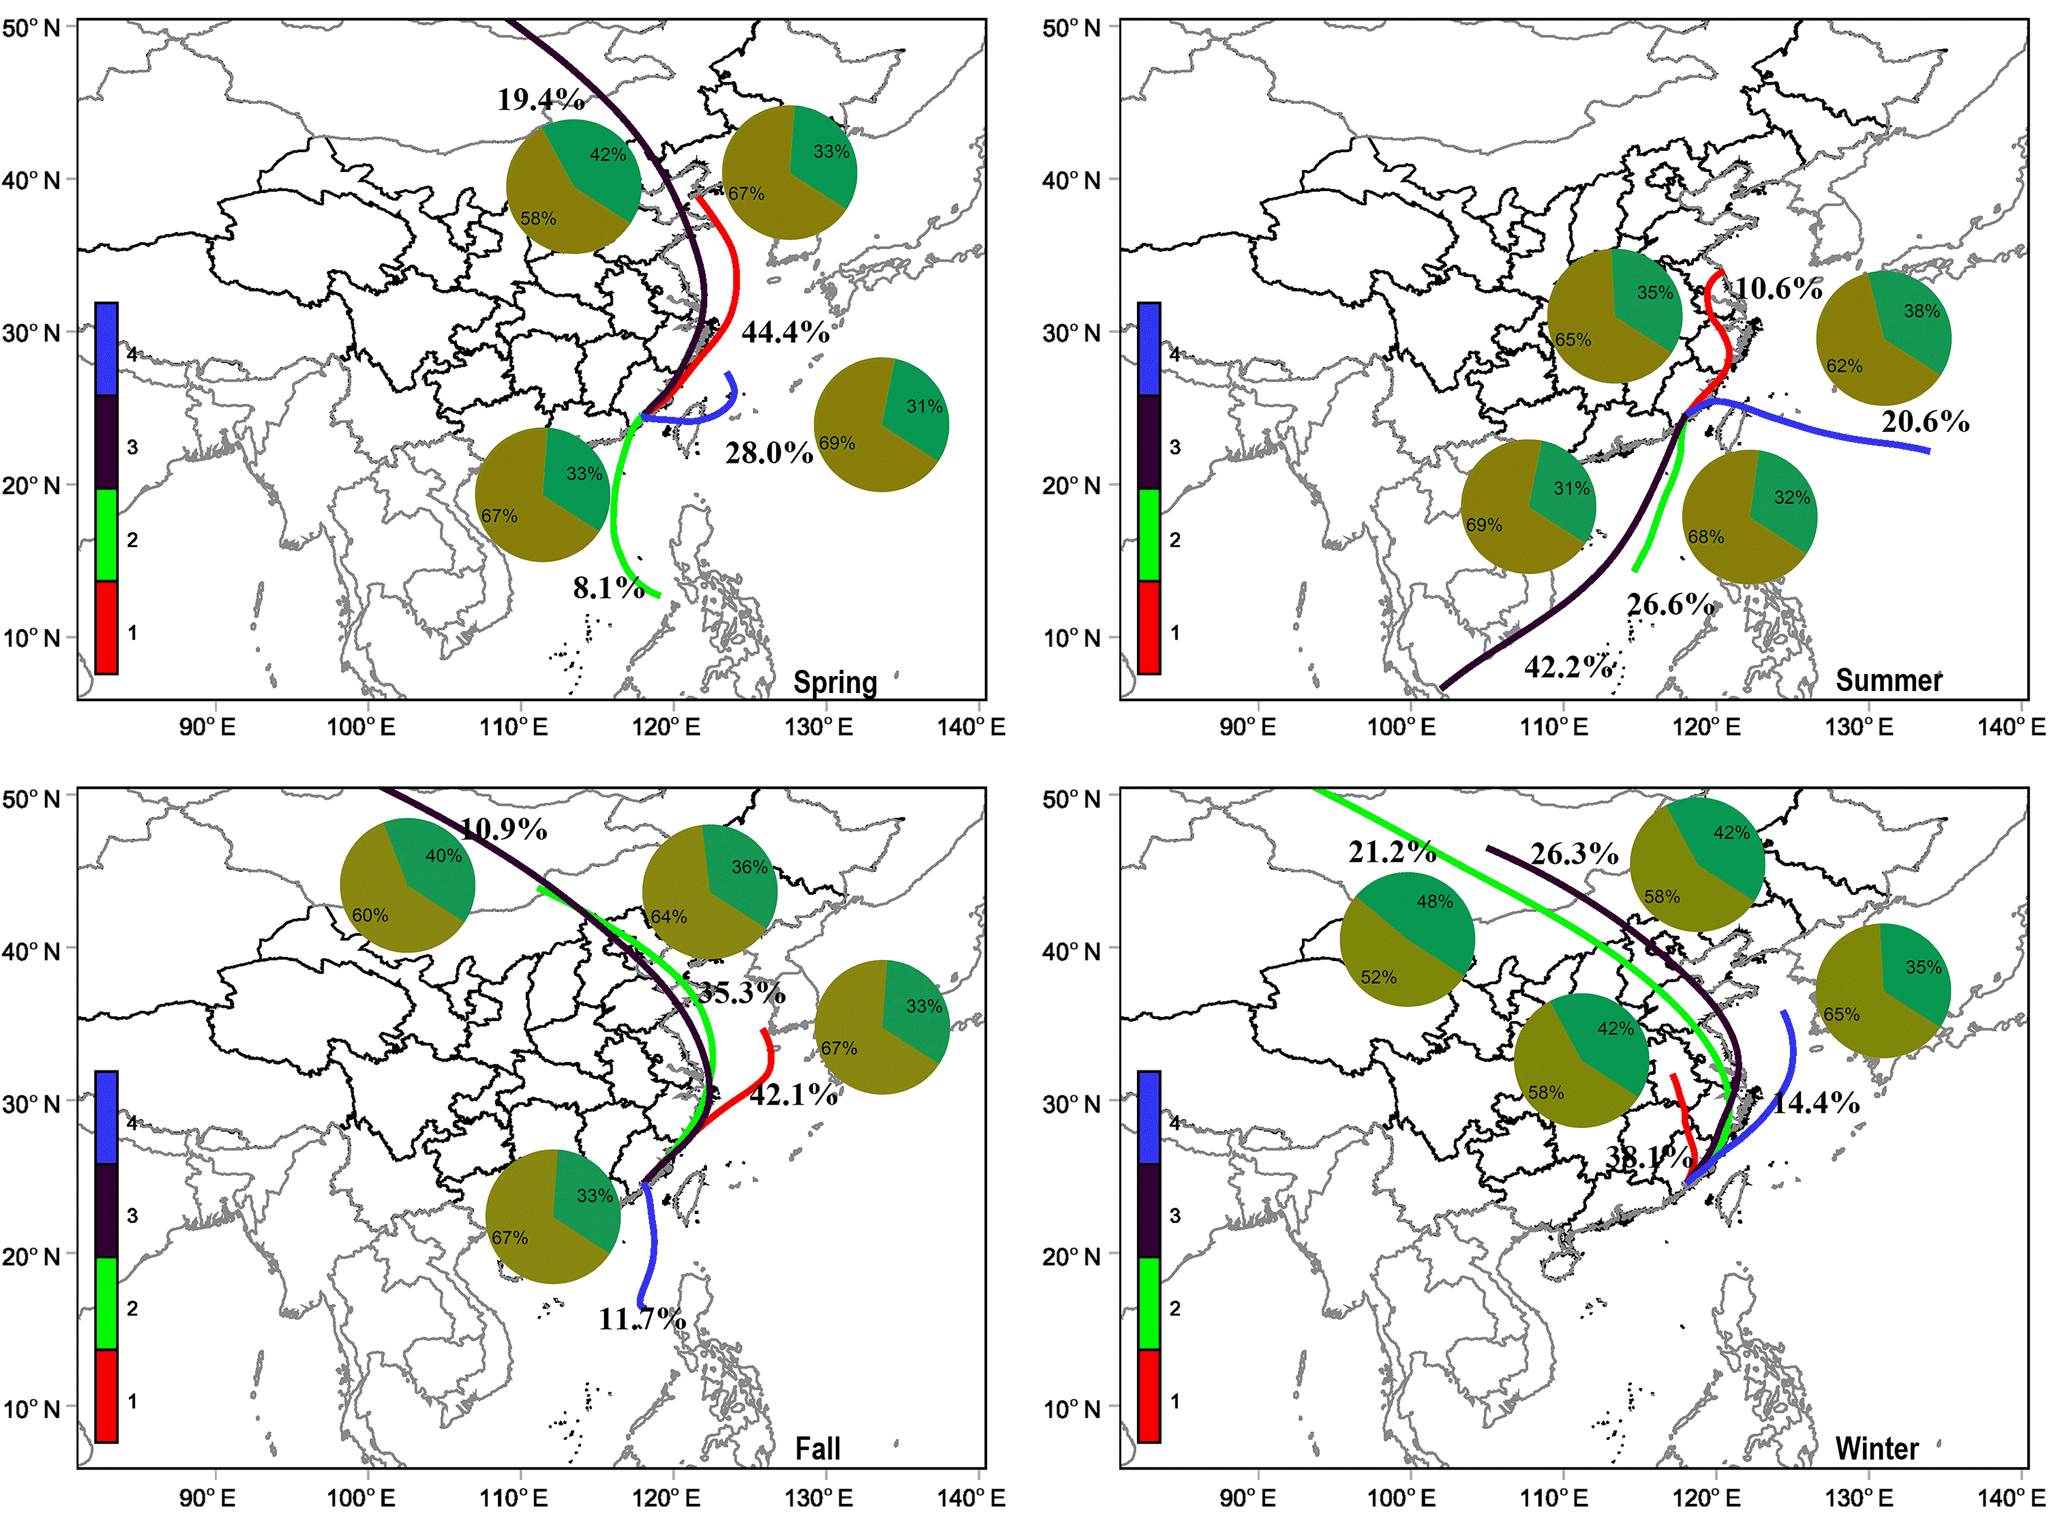
Figure 7Seasonal cluster mean of 5 d backward trajectories at 500 m with the corresponding trajectory percentages and BCbb contributions in Xiamen. The pie charts represent relative contributions of BCff (dark yellow) and BCbb (olive green). The four-colored legend indicates the four different trajectory clusters. The percentages along the trajectories represent the percentage of each cluster in all trajectories.
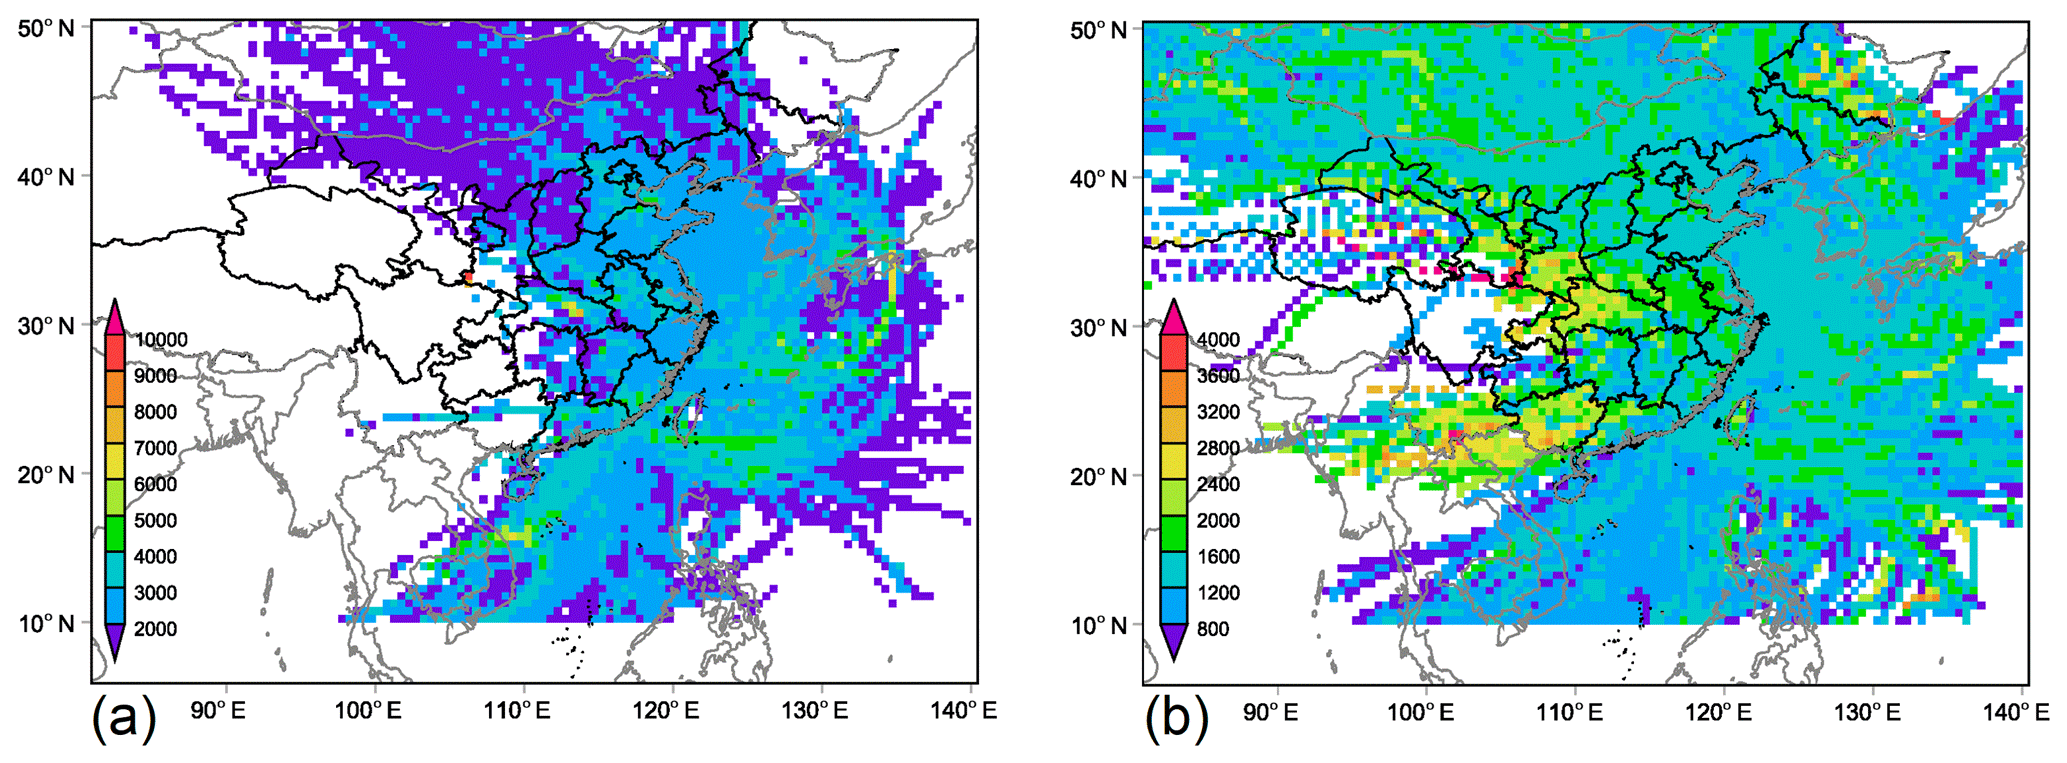
Figure 8Concentration-weighted trajectory (CWT) maps (ng m−3) for (a) BCff and (b) BCbb in Xiamen in 2014.
Potential sources of BCff and BCbb in Xiamen with their contributions were characterized with CWT and PSCF analyses, and the results are presented in Figs. 8 and S2. According to the PSCF and CWT maps of BCff (Figs. S2a and 8a), the strong potential source probabilities for BCff were distributed to the southwest of Xiamen, including southwestern Fujian Province as well as Guangdong Province. Significant potential sources were also located in Hubei, Anhui, Jiangxi and Henan provinces in East–Central China and Hebei and Shandong provinces in North China, again implying the influences of long-range transport on BCff in Xiamen. Southeast Asia with strong regional BC emissions (Permadi et al., 2018) was also indicated as a potential source region. For BCbb, similar to BCff, the PSCF and CWT distributions (Figs. S2b and 8b) show that the exogenous potential sources were mainly distributed in East–Central China, which belonged to the major areas of biomass burning in China (Yan et al., 2006; Huang et al., 2012; Wu et al., 2018). Guangdong Province in South China was also suggested as the source of BCbb. Unlike BCff, the strong potential source probabilities from Southeast Asia to BCbb were less significant.
Figures 9 and S3 depict the seasonal CWT and PSCF distributions for BCff and BCbb. Source distributions of both BCff and BCbb in different seasons significantly varied due to the variability in the airflows. In spring, the terrestrial contributions from Guangdong Province and North China to BCff and BCbb were significant. In addition, high PSCF and CWT values for summer BCbb were also found in North China. In the fall season, similar to spring, high PSCF and CWT values for BCff and BCbb were distributed in East–Central China. In winter, the main potential sources of BCff and BCbb were also located in East–Central China. The potential sources of BCbb in Central China were much stronger in winter than that in other seasons. The East China Sea and South China Sea were also indicated as the potential source areas for BCff and BCbb by the PSCF and CWT analysis. However, they should not be real source areas and were identified due to the trailing effect (Lee et al., 2014; Deng et al., 2020).
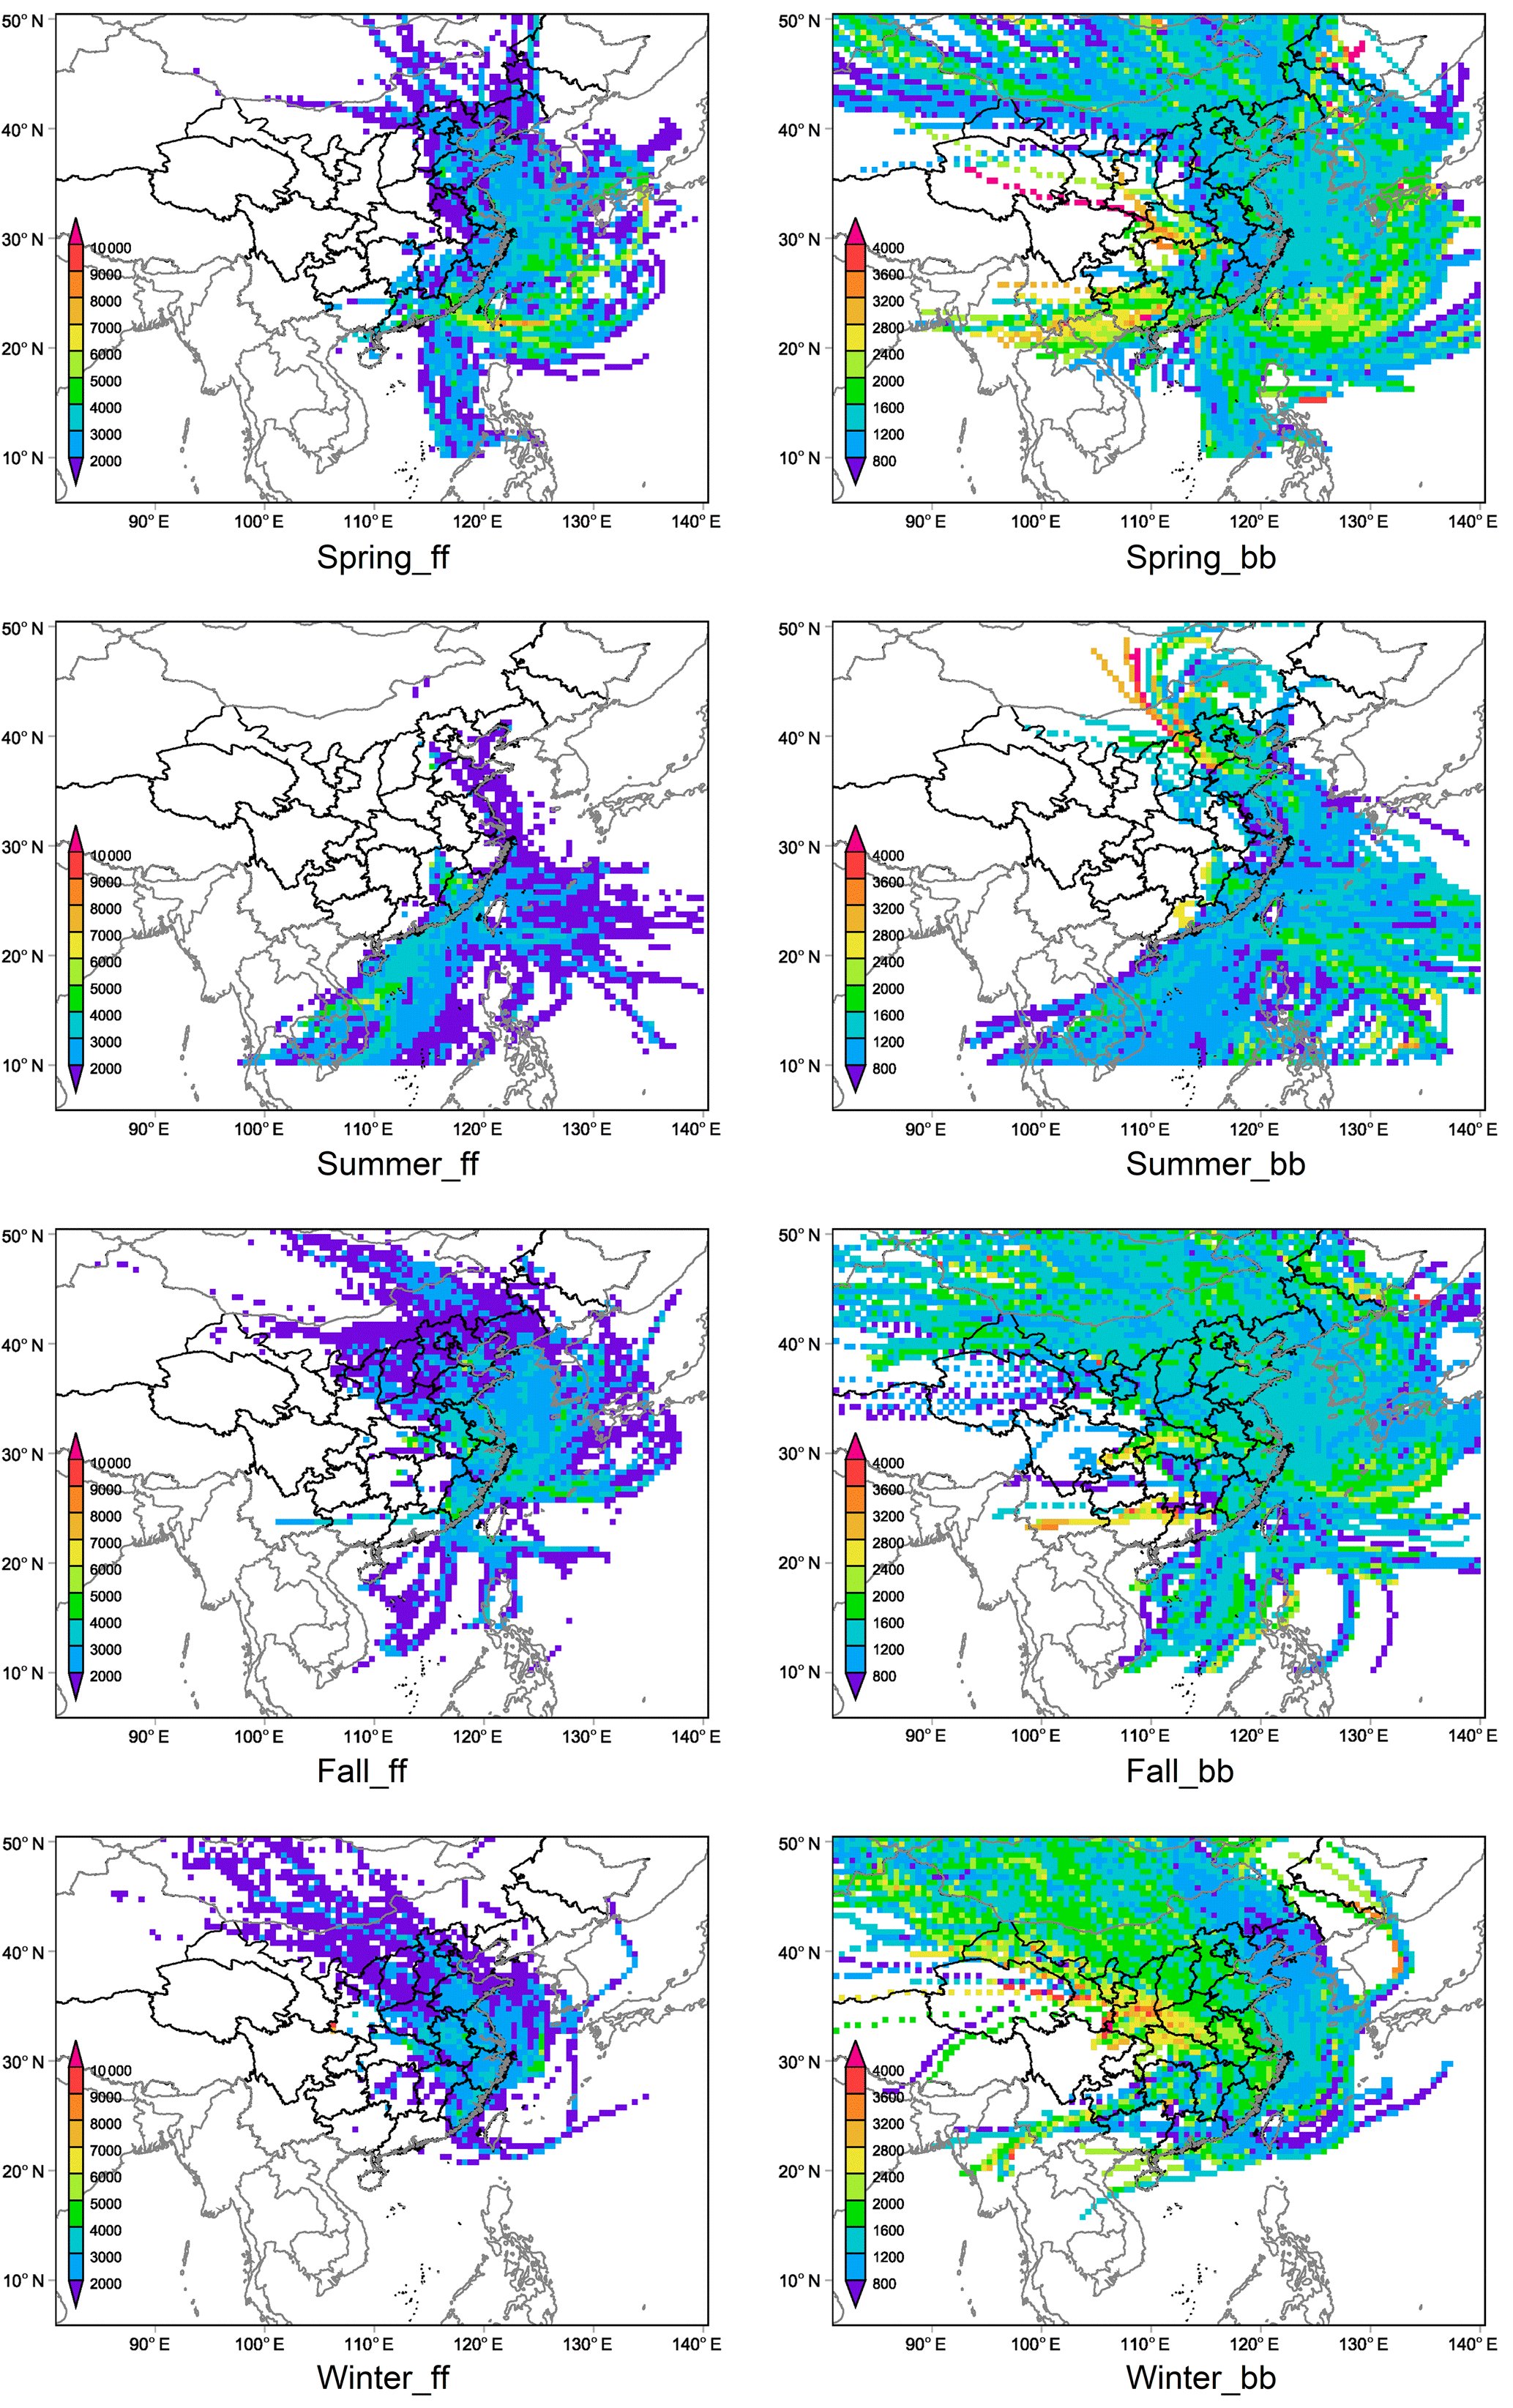
Figure 9CWT maps for BCff and BCbb in Xiamen for different seasons in 2014.
3.3 Source-oriented modeling-based source apportionment of BC
Relative source contributions to BC in Xiamen from different source sectors and fuel catalogs were assessed with the source-oriented CMAQ-PPM model. Figure 10 illustrates the seasonal and annual average contributions of each source sector in Xiamen. Overall, transportation, residential and open burning sectors were the major sources of BC, with annual contributions of 45.3 %, 30.1 % and 17.6 %, respectively. By comparison, power plants and industrial sectors made minor contributions to BC, accounting for 3.4 % and 3.6 %, respectively. The transportation sector was the dominant source in all seasons, especially in summer, contributing 36.5 %–56.6 % to total BC. The residential sector contributing 20.5 %–37.2 % was the second largest source in all seasons except spring. By contrast, power plants and industrial sectors were minor sources in all seasons, with seasonal contributions of 2.2 %–6.2 % and 2.8 %–4.6 %, respectively. An obvious seasonal pattern of contribution of open burning was found. In spring and summer, open burning played a vital role by contributing 35.5 % and 17.8 %, respectively. However, its relative contributions dramatically decreased to 7.6 % in fall and 7.5 % in winter. Source contributions of the five sectors to BC over China in different periods are depicted in Fig. S4. The remarkable seasonal and spatial variations from open burning are consistent with those derived in a previous study (Hu et al., 2015). In spring, strong open burning in South China might significantly influence BC concentrations in the surrounding regions near the sources, which would contribute to a larger biomass-burning contribution in Xiamen. Intensive open burning in South Asia and Southeast Asia countries (Sharma et al., 2010; Vadrevu et al., 2015; Singh et al., 2020) in spring also affected the biomass-burning contribution in Xiamen through long-range transport (Fig. 9).
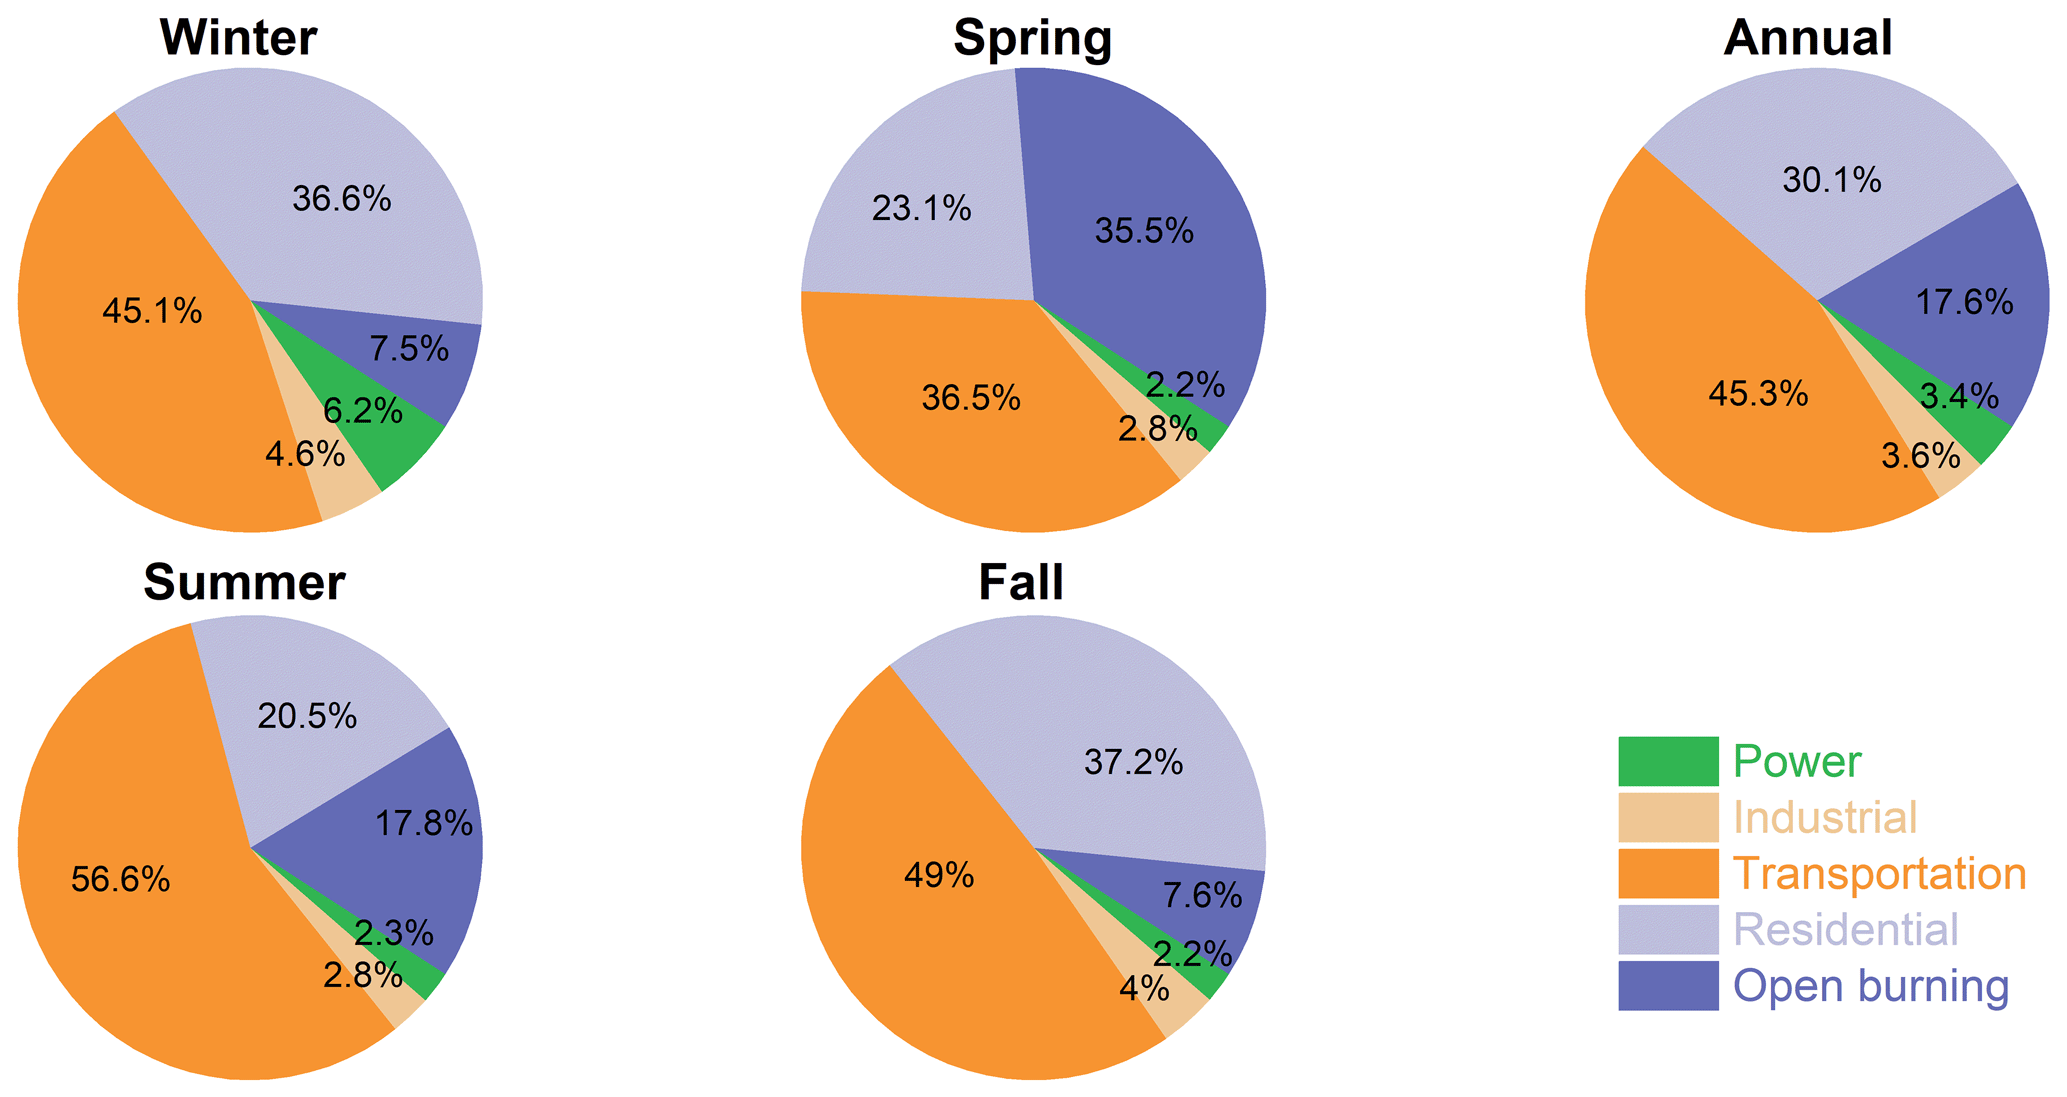
Figure 10Source contributions to BC of five source sectors in each period based on the source-oriented model.
Seasonal variations in simulated relative contributions of three fuel catalogs (i.e., coal, liquid fossil fuel and biomass) to BC in Xiamen were demonstrated in Fig. 11. For the entire year, liquid fossil fuel combustion had the largest contribution (46.5 %), followed by biomass burning (32.6 %) and coal combustion (20.9 %). Contributions of different fuel catalogs exhibited distinct seasonality. Seasonal contributions of coal combustion were on the order of winter (27.8 %) > fall (23.4 %) > spring (15.6 %) > summer (14.5 %). For liquid fossil fuel combustion, its largest contribution (57.5 %) was in summer, and its smallest contribution (37.4 %) was in spring. Seasonal contributions of biomass burning were in the range of 25.7 %–47.0 %, and the average contribution was much larger in spring than in other seasons. Contribution of fossil fuel combustion, which is the sum of liquid fossil fuel and coal combustion, followed the order of winter > fall > summer > spring.
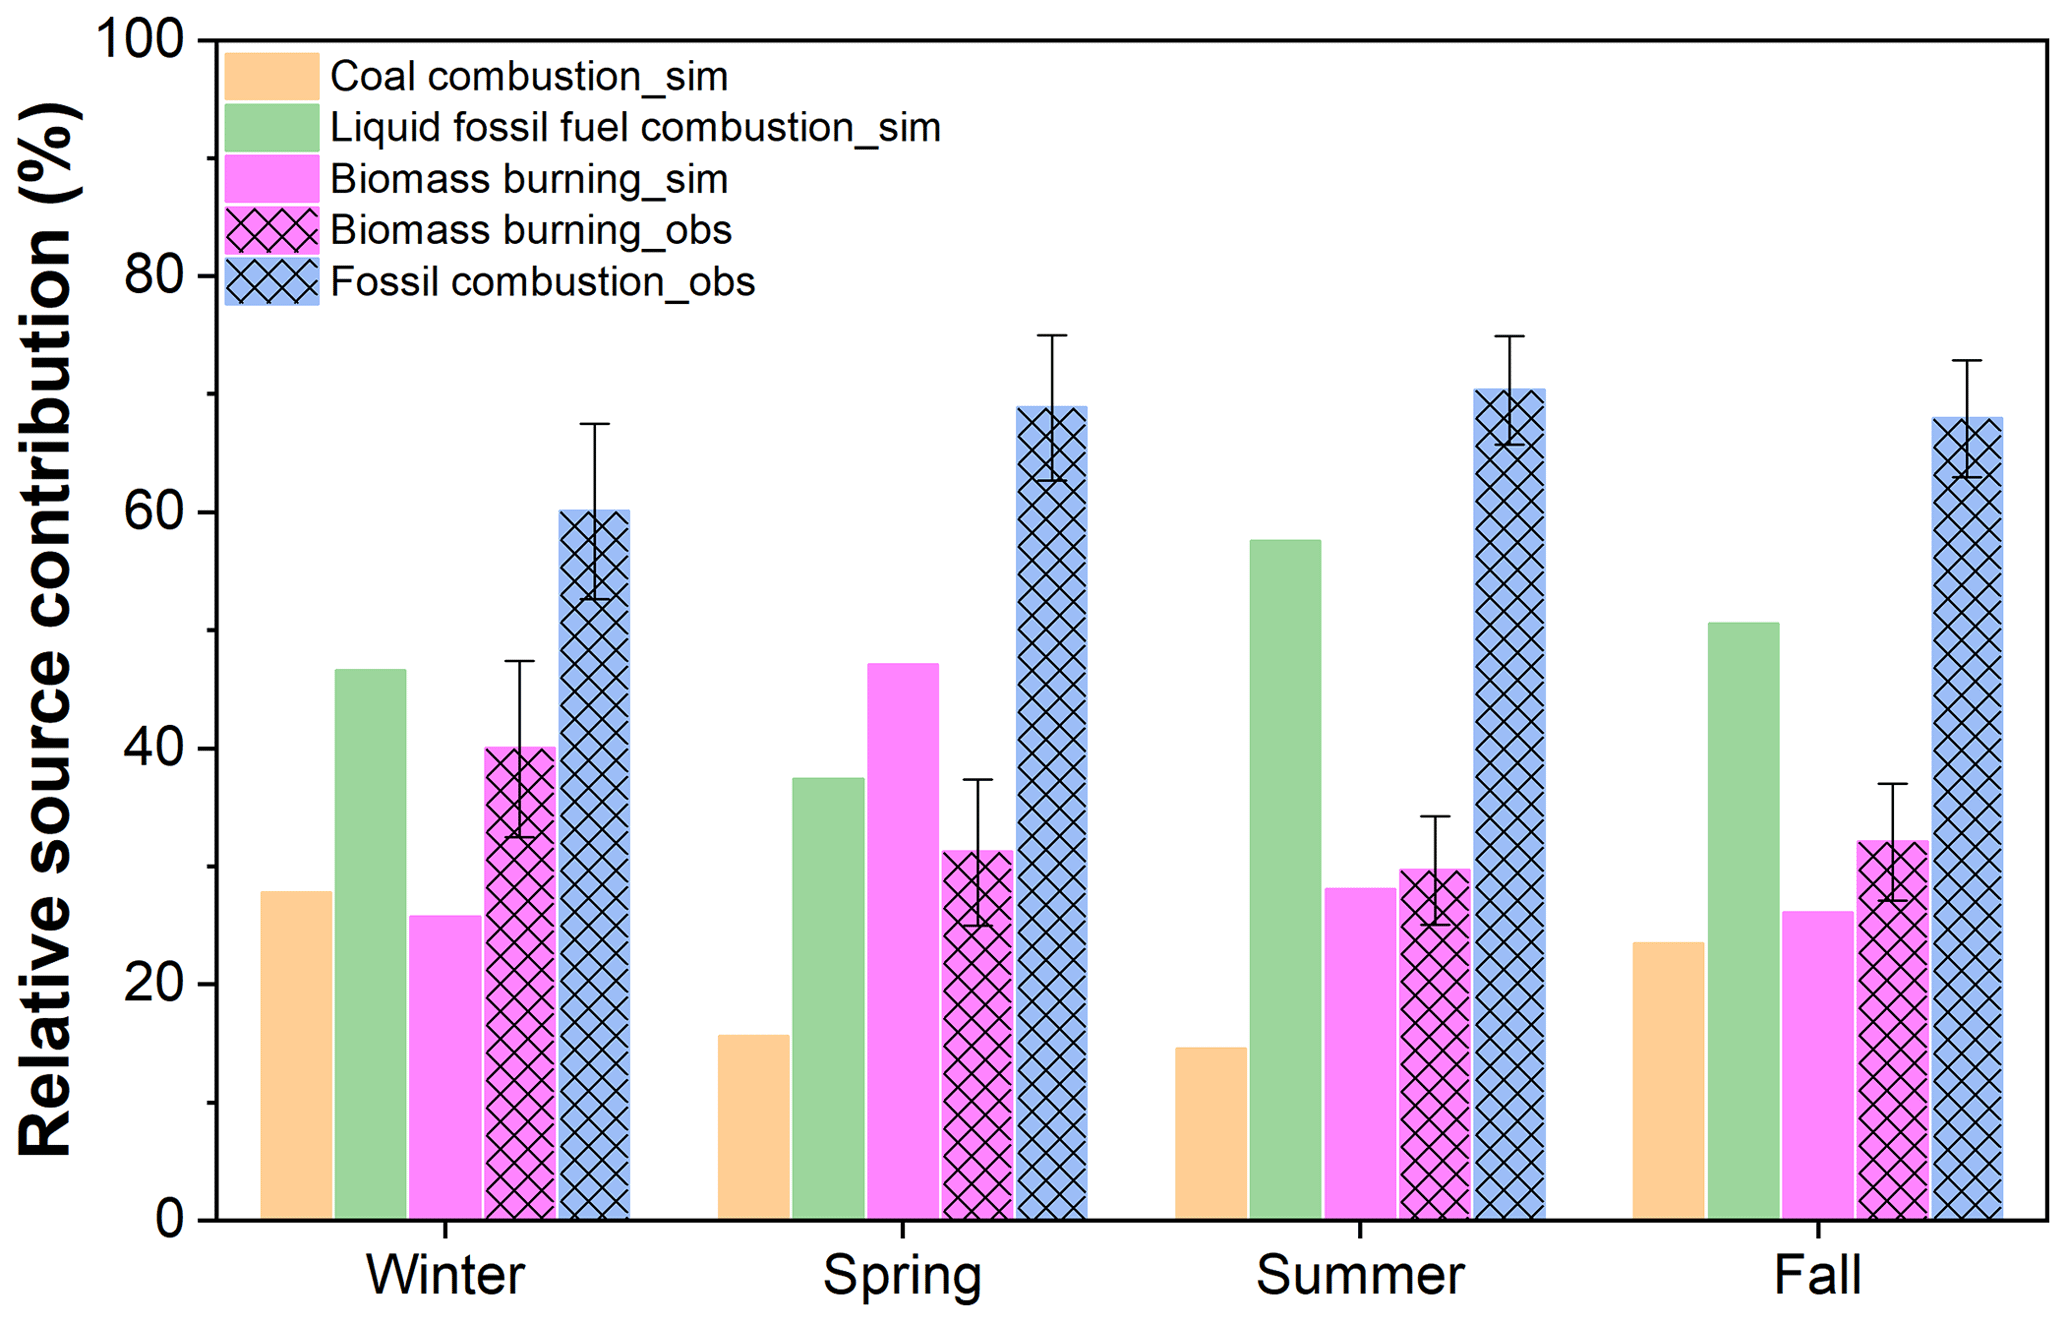
Figure 11Comparison of seasonal source contribution to BC between the source-oriented model and the aethalometer method.
The simulated contributions were compared with the source apportionment results estimated according to light-absorption properties. For the whole year, the annual average relative contributions of BCff and BCbb derived by the source-oriented model were 67.4 % and 32.6 %, respectively. They were very close to the results (i.e., 66.7 % for BCff and 33.3 % for BCbb) obtained by the aethalometer method. The overall consistency of the two apportionment methods confirms that the source apportionment results in Xiamen from this study are reasonable and benefit future emission-control strategies. Simulated contributions of BCff and BCbb were 72.0 % and 28.0 % in summer and 73.9 % and 26.1 % in fall. The simulated contributions in summer and fall were comparable to those derived by the aethalometer method, and the discrepancies between the results from the two methods were 1.7 % in summer and 6.0 % in fall. However, there were considerable differences between the BC source apportionment results from the aethalometer method and source-oriented CMAQ model in winter and spring. Relative contributions of BCff and BCbb derived by the source-oriented modeling were 74.3 % and 25.7 % in winter and 47.0 % and 53.0 % in spring. Simulated BCff (BCbb) contribution was 14.3 % larger (smaller) in winter and 15.9 % smaller (larger) in spring compared to the observation-based results. Both the uncertainties in the aethalometer method and the emission inventory used in the source-oriented model may lead to the gap between observation-based and model results. For example, due to a lack of auxiliary measurements, the AAE values of BCff and BCbb adopted in this study were based on a comprehensive literature review. It would lead to uncertainties in the apportionment results from the aethalometer model, as discussed in Sect. 3.1. On the other hand, the large gap in spring and winter may partly have resulted from the uncertainties in the satellite-based inventory of biomass-burning emissions in South Asia and China (Wiedinmyer et al., 2011; Huang et al., 2012; Zhou et al., 2017). In China, some open burning activities such as local-/small-scale open burning and smoldering are important sources of biomass-burning BC, which was particularly the case in winter. However, these burning activities are difficult to accurately detect by satellite, leading to considerable uncertainties in biomass-burning emissions. In addition, low resolution of simulation could lead to uncertainties in model results. The peak values close to emission sources may not be captured after the dilution of emissions in large grid cells. In future, high resolution is suggested as long as high-resolution emission inventories are available.
In this study, the observation-based light absorption and source-oriented modeling were combined to reveal the contributions of biomass-burning and fossil fuel combustion to ambient BC aerosol as well as their temporal variations in a relatively clean region in China. The annual average concentrations of BCff and BCbb identified by the aethalometer method with αff=1.0 and αbb=2.0 were 2932±1444 ng m−3 and 1340 ± 542 ng m−3, accounting for 66.7 % and 33.3 % of total BC, respectively. A sensitivity analysis conducted by changing the αff and αbb values suggested that increase in αff or αbb values would lead to increase in BCff against BCbb, and the aethalometer method was more sensitive to changes in αbb rather than αff. For biomass-burning contribution, its highest level occurred in the evening rush hour, while the maximum seasonal value was in winter. East-northeasterly and northerly wind was more likely to result in a large biomass-burning contribution. Air masses from the northern inland region including North China and East–Central China had larger biomass-burning contributions. Potential sources of BCff and BCbb indicate the impact of long-range transport from North and East–Central China and Southeast Asia. Based on the source-oriented model, the transportation, residential and open burning sectors were the larger contributors to BC compared to the power and industrial sectors. The largest contribution of liquid fossil fuel combustion to BC was identified by the source-oriented model, followed by biomass burning and coal combustion. The simulated contributions of BCff and BCbb were 67.4 % and 32.6 %, respectively, close to the results of the aethalometer method. The simulated contributions in summer and fall were comparable to those derived by the aethalometer method. However, the differences between the two apportionment methods in winter and spring were considerable. The discrepancies between the two source apportionment methods suggest an accurate emission inventory with higher spatiotemporal resolution is required in future studies. Source apportionment of BC in Xiamen from both light absorption observation and source-oriented modeling indicates that the fossil fuel sources should be strictly controlled to limit the BC pollution. The findings also suggest that it is essential to reduce biomass burning in future pollution management strategies.
The data are available upon request from Junjun Deng (dengjunjun@tju.edu.cn).
The supplement related to this article is available online at: https://doi.org/10.5194/acp-20-14419-2020-supplement.
JD and HZ designed the experiments and carried them out. JD and WZ performed the analysis of the observation. HG and HZ performed the source-oriented modeling. JZ, WH, LW, XW and PF provided suggestions for data analysis. JD prepared the manuscript with contributions from all the co-authors.
The authors declare that they have no conflict of interest.
The authors are grateful for helpful comments from the editor and four anonymous reviewers.
This research has been supported by the National Key Research and Development Program of China (grant no. 2019YFA0606801) and the National Natural Science Foundation of China (grant no. 21607148).
This paper was edited by Leiming Zhang and reviewed by four anonymous referees.
Andersson, A., Deng, J., Du, K., Zheng, M., Yan, C., Skold, M., and Gustafsson, O.: Regionally-varying combustion sources of the January 2013 severe haze events over Eastern China, Environ. Sci. Technol., 49, 2038–2043, https://doi.org/10.1021/es503855e, 2015.
Ashbaugh, L. L., Malm, W. C., and Sadeh, W. Z.: A residence time probability analysis of sulfur concentrations at Grand Canyon National Park, Atmos. Environ., 19, 1263–1270, https://doi.org/10.1016/0004-6981(85)90256-2, 1985.
Bari, M. A., Kindzierski, W. B., Wallace, L. A., Wheeler, A. J., MacNeill, M., and Heroux, M. E.: Indoor and outdoor levels and sources of submicron particles (PM1) at homes in Edmonton, Canada, Environ. Sci. Technol., 49, 6419–6429, https://doi.org/10.1021/acs.est.5b01173, 2015.
Bond, T. C., Doherty, S. J., Fahey, D. W., Forster, P. M., Berntsen, T., DeAngelo, B. J., Flanner, M. G., Ghan, S., Kärcher, B., Koch, D., Kinne, S., Kondo, Y., Quinn, P. K., Sarofim, M. C., Schultz, M. G., Schulz, M., Venkataraman, C., Zhang, H., Zhang, S., Bellouin, N., Guttikunda, S. K., Hopke, P. K., Jacobson, M. Z., Kaiser, J. W., Klimont, Z., Lohmann, U., Schwarz, J. P., Shindell, D., Storelvmo, T., Warren, S. G., and Zender, C. S.: Bounding the role of black carbon in the climate system: A scientific assessment, J. Geophys. Res.-Atmos., 118, 5380–5552, https://doi.org/10.1002/jgrd.50171, 2013.
Cao, J., Tie, X., Xu, B., Zhao, Z., Zhu, C., Li, G., and Liu, S.: Measuring and modeling black carbon (BC) contamination in the SE Tibetan Plateau, J. Atmos. Chem., 67, 45, https://doi.org/10.1007/s10874-011-9202-5, 2010.
Chen, B., Andersson, A., Lee, M., Kirillova, E. N., Xiao, Q., Krusa, M., Shi, M., Hu, K., Lu, Z., Streets, D. G., Du, K., and Gustafsson, O.: Source Forensics of Black Carbon Aerosols from China, Environ. Sci. Technol., 47, 9102–9108, https://doi.org/10.1021/es401599r, 2013.
Chen, H. M., Zhuang, B. L., Liu, J., Li, S., Wang, T. J., Xie, X. D., Xie, M., Li, M. M., and Zhao, M.: Regional climate responses in East Asia to the black carbon aerosol direct effects from India and China in summer, J. Climate, 33, 9783–9800, https://doi.org/10.1175/JCLI-D-19-0706.1, 2020.
Cheng, Y., Engling, G., He, K.-B., Duan, F.-K., Ma, Y.-L., Du, Z.-Y., Liu, J.-M., Zheng, M., and Weber, R. J.: Biomass burning contribution to Beijing aerosol, Atmos. Chem. Phys., 13, 7765–7781, https://doi.org/10.5194/acp-13-7765-2013, 2013.
Colicino, E., Wilson, A., Frisardi, M. C., Prada, D., Power, M. C., Hoxha, M., Dioni, L., Spiro, A., Vokonas, P. S., Weisskopf, M. G., Schwartz, J. D., and Baccarelli, A. A.: Telomere length, long-term black carbon exposure, and cognitive function in a cohort of older men: The VA normative aging study, Environ. Health Persp., 125, 76–81, https://doi.org/10.1289/EHP241, 2017.
Crilley, L. R., Bloss, W. J., Yin, J., Beddows, D. C. S., Harrison, R. M., Allan, J. D., Young, D. E., Flynn, M., Williams, P., Zotter, P., Prevot, A. S. H., Heal, M. R., Barlow, J. F., Halios, C. H., Lee, J. D., Szidat, S., and Mohr, C.: Sources and contributions of wood smoke during winter in London: assessing local and regional influences, Atmos. Chem. Phys., 15, 3149–3171, https://doi.org/10.5194/acp-15-3149-2015, 2015.
Crippa, M., DeCarlo, P. F., Slowik, J. G., Mohr, C., Heringa, M. F., Chirico, R., Poulain, L., Freutel, F., Sciare, J., Cozic, J., Di Marco, C. F., Elsasser, M., Nicolas, J. B., Marchand, N., Abidi, E., Wiedensohler, A., Drewnick, F., Schneider, J., Borrmann, S., Nemitz, E., Zimmermann, R., Jaffrezo, J.-L., Prévôt, A. S. H., and Baltensperger, U.: Wintertime aerosol chemical composition and source apportionment of the organic fraction in the metropolitan area of Paris, Atmos. Chem. Phys., 13, 961–981, https://doi.org/10.5194/acp-13-961-2013, 2013.
Deng, J., Zhang, Y., Hong, Y., Xu, L., Chen, Y., Du, W., and Chen, J.: Optical properties of PM2.5 and the impacts of chemical compositions in the coastal city Xiamen in China, Sci. Total Environ., 557–558, 665–675, https://doi.org/10.1016/j.scitotenv.2016.03.143, 2016.
Deng, J., Zhao, W., Wang, X., Wu, L., Hu, W., Ren, L., and Fu, P.: Black carbon in Xiamen, China: temporal variations, transport pathways and impacts of synoptic circulation, Chemosphere, 241, 125133, https://doi.org/10.1016/j.chemosphere.2019.125133, 2020.
Ding, A. J., Fu, C. B., Yang, X. Q., Sun, J. N., Petäjä, T., Kerminen, V.-M., Wang, T., Xie, Y., Herrmann, E., Zheng, L. F., Nie, W., Liu, Q., Wei, X. L., and Kulmala, M.: Intense atmospheric pollution modifies weather: a case of mixed biomass burning with fossil fuel combustion pollution in eastern China, Atmos. Chem. Phys., 13, 10545–10554, https://doi.org/10.5194/acp-13-10545-2013, 2013.
Ding, A. J., Huang, X., Nie, W., Sun, J. N., Kerminen, V. M., Petaja, T., Su, H., Cheng, Y. F., Yang, X. Q., Wang, M. H., Chi, X. G., Wang, J. P., Virkkula, A., Guo, W. D., Yuan, J., Wang, S. Y., Zhang, R. J., Wu, Y. F., Song, Y., Zhu, T., Zilitinkevich, S., and Kulmala, M.: Enhanced haze pollution by black carbon in megacities in China, Geophys. Res. Lett., 43, 2873–2879, https://doi.org/10.1002/2016GL067745, 2016.
Dumka, U. C., Kaskaoutis, D. G., Tiwari, S., Safai, P. D., Attri, S. D., Soni, V. K., Singh, N., and Mihalopoulos, N.: Assessment of biomass burning and fossil fuel contribution to black carbon concentrations in Delhi during winter, Atmos. Environ., 194, 93–109, https://doi.org/10.1016/j.atmosenv.2018.09.033, 2018.
Fan, J., Rosenfeld, D., Yang, Y., Zhao, C., Leung, L. R., and Li, Z.: Substantial contribution of anthropogenic air pollution to catastrophic floods in Southwest China, Geophys. Res. Lett., 43, 2873–2879, https://doi.org/10.1002/2015GL064479, 2015.
Favez, O., El Haddad, I., Piot, C., Boréave, A., Abidi, E., Marchand, N., Jaffrezo, J.-L., Besombes, J.-L., Personnaz, M.-B., Sciare, J., Wortham, H., George, C., and D'Anna, B.: Inter-comparison of source apportionment models for the estimation of wood burning aerosols during wintertime in an Alpine city (Grenoble, France), Atmos. Chem. Phys., 10, 5295–5314, https://doi.org/10.5194/acp-10-5295-2010, 2010.
Fuller, G. W., Tremper, A. H., Baker, T. D., Yttri, K. E., and Butterfield, D.: Contribution of wood burning to PM10 in London, Atmos. Environ., 87, 87–94, https://doi.org/10.1016/j.atmosenv.2013.12.037, 2014.
Ganguly, D., Jayaraman, A., Gadhavi, H., and Rajesh, T. A.: Features in wavelength dependence of aerosol absorption observed over central India, Geophys. Res. Lett., 32, L13821, https://doi.org/10.1029/2005GL023023, 2005.
Garg, S., Chandra, B. P., Sinha, V., Sarda-Esteve, R., Gros, V., and Sinha, B.: Limitation of the use of the absorption angstrom exponent for source apportionment of equivalent black carbon: a case study from the north west indo-gangetic plain, Environ. Sci. Technol., 50, 814–824, http://https://doi.org/10.1021/acs.est.5b03868, 2016.
Guo, H., Kota, S. H., Sahu, S. K., Hu, J., Ying, Q., Gao, A., and Zhang, H.: Source apportionment of PM2.5 in North India using source-oriented air quality models, Environ. Pollut., 231, 426–436, https://doi.org/10.1016/j.envpol.2017.08.016, 2017.
Gustafsson, O., Krusa, M., Zencak, Z., Sheesley, R. J., Granat, L., Engstrom, E., Praveen, P. S., Rao, P. S. P., Leck, C., and Rodhe, H.: Brown Clouds over South Asia: Biomass or Fossil Fuel Combustion?, Science, 323, 495–498, https://doi.org/10.1126/science.1164857, 2009
Hansen, A. D. A., Rosen, H., and Novakov, T.: The aethalometer – An instrument for the real-time measurements of optical absorption by aerosol particles, Sci. Total Environ., 36, 191–196, https://doi.org/10.1016/0048-9697(84)90265-1, 1984.
Harrison, R. M., Beddows, D. C. S., Hu, L., and Yin, J.: Comparison of methods for evaluation of wood smoke and estimation of UK ambient concentrations, Atmos. Chem. Phys., 12, 8271–8283, https://doi.org/10.5194/acp-12-8271-2012, 2012.
He, M., Zheng, J., Yin, S., and Zhang, Y.: Trends, temporal and spatial characteristics, and uncertainties in biomass burning emissions in the Pearl River Delta, China, Atmos. Environ., 45, 4051–4059, https://doi.org/10.1016/j.atmosenv.2011.04.016, 2011.
Healy, R. M., Sofowote, U., Su, Y., Debosz, J., Noble, M., Jeong, C. H., Wang, J. M., Hilker, N., Evans, G. J., Doerksen, G., Jones, K., and Munoz, A.: Ambient measurements and source apportionment of fossil fuel and biomass burning black carbon in Ontario, Atmos. Environ., 161, 34–47, https://doi.org/10.1016/j.atmosenv.2017.04.034, 2017.
Helin, A., Niemi, J. V., Virkkula, A., Pirjola, L., Teinila, K., Backman, J., Aurela, M., Saarikoski, S., Ronkko, T., Asmi, E., and Timonen, H.: Characteristics and source apportionment of black carbon in the Helsinki metropolitan area, Finland, Atmos. Environ., 190, 87–98, https://doi.org/10.1016/j.atmosenv.2018.07.022, 2018.
Herich, H., Hueglin, C., and Buchmann, B.: A 2.5 year's source apportionment study of black carbon from wood burning and fossil fuel combustion at urban and rural sites in Switzerland, Atmos. Meas. Tech., 4, 1409–1420, https://doi.org/10.5194/amt-4-1409-2011, 2011.
Hopke, P. K., Barrie, L. A., Li, S. M., Cheng, M. D., Li, C., and Xie, Y.: Possible sources and preferred pathways for biogenic and non-sea salt sulfur for the high Arctic, J. Geophys. Res.-Atmos., 100, 16595–16603, https://doi.org/10.1029/95JD01712, 1995.
Hsu, Y. K., Holsen, T. M., and Hopke, P. K.: Comparison of hybrid receptor models to locate PCB sources in Chicago, Atmos. Environ., 37, 545–562, https://doi.org/10.1016/S1352-2310(02)00886-5, 2003.
Hu, J., Wu, L., Zheng, B., Zhang, Q., He, K., Chang, Q., Li, X., Yang, F., Ying, Q., and Zhang, H.: Source contributions and regional transport of primary particulate matter in China, Environ. Pollut., 207, 31–42, https://doi.org/10.1016/j.envpol.2015.08.037, 2015.
Huang, X., Li, M., Li, J., and Song, Y.: A high-resolution emission inventory of crop burning in fields in China based on MODIS Thermal anomalies/fire products, Atmos. Environ., 50, 9–15, https://doi.org/10.1016/j.atmosenv.2012.01.017, 2012.
Huang, X., Ding, A., Liu, L., Liu, Q., Ding, K., Niu, X., Nie, W., Xu, Z., Chi, X., Wang, M., Sun, J., Guo, W., and Fu, C.: Effects of aerosol–radiation interaction on precipitation during biomass-burning season in East China, Atmos. Chem. Phys., 16, 10063–10082, https://doi.org/10.5194/acp-16-10063-2016, 2016.
Jacobson, M. Z.: Control of fossil-fuel particulate black carbon and organic matter, possibly the most effective method of slowing global warming, J. Geophys. Res.-Atmos., 107, 4410–4431, https://doi.org/10.1029/2001JD001376, 2002.
Janssen, N. A., Hoek, G., Simic-Lawson, M., Fischer, P., van Bree, L., ten Brink, H., Keuken, M., Atkinson, R. W., Anderson, H. R., Brunekreef, B., and Casses, F. R.: Black Carbon as an Additional Indicator of the Adverse Health Effects of Airborne Particles Compared with PM10 and PM2.5, Environ. Health Persp., 119, 1691–1699, https://doi.org/10.1289/ehp.1003369, 2011.
Jing, A., Zhu, B., Wang, H., Yu, X., An, J., and Kang, H.: Source apportionment of black carbon in different seasons in the northern suburb of Nanjing, China, Atmos. Environ., 201, 190–200, https://doi.org/10.1016/j.atmosenv.2018.12.060, 2019.
Kalogridis, A.-C., Vratolis, S., Liakakou, E., Gerasopoulos, E., Mihalopoulos, N., and Eleftheriadis, K.: Assessment of wood burning versus fossil fuel contribution to wintertime black carbon and carbon monoxide concentrations in Athens, Greece, Atmos. Chem. Phys., 18, 10219–10236, https://doi.org/10.5194/acp-18-10219-2018, 2018.
Kant, Y., Shaik, D. S., Mitra, D., Chandola, H. C., Babu, S. S., and Chauhan, P.: Black carbon aerosol quantification over north-west Himalayas: Seasonal heterogeneity, source apportionment and radiative forcing, Environ. Pollut., 257, 113446, https://doi.org/10.1016/j.envpol.2019.113446, 2020
Kim, H., Kang, S. M., Hwang, Y. T., and Yang, Y. M.: Sensitivity of the Climate Response to the Altitude of Black Carbon in the Northern Subtropics in an Aquaplanet GCM, J. Climate, 16, 6351–6359, https://doi.org/10.1175/JCLI-D-15-0037.1, 2015.
Kirchstetter, T. W., Novakov, T., and Hobbs, P. V.: Evidence that the spectral dependence of light absorption by aerosols is affected by organic carbon, J. Geophys. Res.-Atmos., 109, D21208, https://doi.org/10.1029/2004JD004999, 2004.
Kleeman, M. J., Ying, Q., Lu, J., Mysliwiec, M. J., Griffin, R. J., Chen, J. J., and Clegg, S.: Source apportionment of secondary organic aerosol during a severe photochemical smog episode, Atmos. Environ., 41, 576–591, https://doi.org/10.1016/j.atmosenv.2006.08.042, 2007.
Kurokawa, J., Ohara, T., Morikawa, T., Hanayama, S., Janssens-Maenhout, G., Fukui, T., Kawashima, K., and Akimoto, H.: Emissions of air pollutants and greenhouse gases over Asian regions during 2000–2008: Regional Emission inventory in ASia (REAS) version 2, Atmos. Chem. Phys., 13, 11019–11058, https://doi.org/10.5194/acp-13-11019-2013, 2013.
Lack, D. A. and Langridge, J. M.: On the attribution of black and brown carbon light absorption using the Ångström exponent, Atmos. Chem. Phys., 13, 10535–10543, https://doi.org/10.5194/acp-13-10535-2013, 2013.
Lee, G., Kim, P., Han, Y., Holsen, T., and Lee, S.: Tracing sources of total gaseous mercury to Yongheung Island off the coast of Korea, Atmosphere-Basel, 5, 273–291, http://https://doi.org/10.3390/atmos5020273, 2014.
Li, K., Liao, H., Mao, Y., and Ridley, D. A.: Source sector and region contributions to concentration and direct radiative forcing of black carbon in China, Atmos. Environ., 124, 351–366, https://doi.org/10.1016/j.atmosenv.2015.06.014, 2016.
Li, N., He, Q., Tie, X., Cao, J., Liu, S., Wang, Q., Li, G., Huang, R., and Zhang, Q.: Quantifying sources of elemental carbon over the Guanzhong Basin of China: A consistent network of measurements and WRF-Chem modeling, Environ. Pollut., 214, 86–93, https://doi.org/10.1016/j.envpol.2016.03.046, 2016.
Liu, D., Allan, J. D., Young, D. E., Coe, H., Beddows, D., Fleming, Z. L., Flynn, M. J., Gallagher, M. W., Harrison, R. M., Lee, J., Prevot, A. S. H., Taylor, J. W., Yin, J., Williams, P. I., and Zotter, P.: Size distribution, mixing state and source apportionment of black carbon aerosol in London during wintertime, Atmos. Chem. Phys., 14, 10061–10084, https://doi.org/10.5194/acp-14-10061-2014, 2014.
Lou, S., Yang, Y., Wang, H., Smith, S. J., Qian, Y., and Rasch, P. J.: Black Carbon Amplifies Haze Over the North China Plain by Weakening the East Asian Winter Monsoon, Geophys. Res. Lett., 46, 452–460, https://doi.org/10.1029/2018GL080941, 2019.
Martinsson, Martinsson, J., Abdul Azeem, H., Sporre, M. K., Bergström, R., Ahlberg, E., Öström, E., Kristensson, A., Swietlicki, E., and Eriksson Stenström, K.: Carbonaceous aerosol source apportionment using the Aethalometer model – evaluation by radiocarbon and levoglucosan analysis at a rural background site in southern Sweden, Atmos. Chem. Phys., 17, 4265–4281, https://doi.org/10.5194/acp-17-4265-2017, 2017.
Mbengue, S., Serfozo, N., Schwarz, J., Zikova, N., Smejkalova, A. H., and Holoubek, I.: Characterization of Equivalent Black Carbon at a regional background site in Central Europe: Variability and source apportionment, Environ. Pollut., 260, 113771, https://doi.org/10.1016/j.envpol.2019.113771, 2020
Menon, S., Hansen, J., Nazarenko, L., and Luo, Y.: Climate effects of black carbon aerosols in China and India, Science, 297, 2250–2253, https://doi.org/10.1126/science.1075159, 2002.
Mousavi, A., Sowlat, M. H., Hasheminassab, S., Polidori, A., and Sioutas, C.: Spatio-temporal trends and source apportionment of fossil fuel and biomass burning black carbon (BC) in the Los Angeles Basin, Sci. Total Environ., 640–641, 1231–1240, https://doi.org/10.1016/j.scitotenv.2018.06.022, 2018.
Mousavi, A., Sowlat, M. H., Lovett, C., Rauber, M., Szidat, S., Boffi, R., Borgini, A., Marco, C. D., Ruprecht, A. A., and Sioutas, C.: Source apportionment of black carbon (BC) from fossil fuel and biomass burning in metropolitan Milan, Italy, Atmos. Environ., 203, 252–261, https://doi.org/10.1016/j.atmosenv.2019.02.009, 2019.
Peng, J., Hu, M., Guo, S., Du, Z., Zheng, J., Shang, D., Zamora, M. L., Zeng, L., Shao, M., Wu, Y. S., Zheng, J., Wang, Y., Glen, C. R., Collins, D. R., Molina, M. J., and Zhang, R: Markedly enhanced absorption and direct radiative forcing of black carbon under polluted urban environments, P. Natl. Acad. Sci. USA, 113, 4266–4271, https://doi.org/10.1073/pnas.1602310113, 2016.
Permadi, D. A., and Kim Oanh, N. T.: Assessment of biomass open burning emissions in Indonesia and potential climate forcing impact, Atmos. Environ., 78, 250–258, https://doi.org/10.1016/j.atmosenv.2012.10.016, 2013.
Permadi, D. A., Kim Oanh, N. T., and Vautard, R.: Integrated emission inventory and modeling to assess distribution of particulate matter mass and black carbon composition in Southeast Asia, Atmos. Chem. Phys., 18, 2725–2747, https://doi.org/10.5194/acp-18-2725-2018, 2018.
Petit, J.-E., Amodeo, T., Meleux, F., Bessagnet, B., Menut, L., Grenier, D., Pellan, Y., Ockler, A., Rocq, B., Gros, V., Sciare, J., and Favez, O.: Characterising an intense PM pollution episode in March 2015 in France from multi-site approach and near real time data: Climatology, variabilities, geographical origins and model evaluation, Atmos. Environ., 155, 68–84, https://doi.org/10.1016/j.atmosenv.2017.02.012, 2017.
Qian, Y., Wang, H., Zhang, R., Flanner, M. G., and Rasch, P. J.: A sensitivity study on modeling black carbon in snow and its radiative forcing over the Arctic and Northern China, Environ. Res. Lett., 9, 064001, https://doi.org/10.1088/1748-9326/9/6/064001, 2014.
Qiu, Y., Wu, X., Zhang, Y., Xu, L., Hong Y., Chen, J., Chen, X., and Deng, J.: Aerosol light absorption in a coastal city in Southeast China: temporal variations and implications for brown carbon, J. Environ. Sci., 80, 257–266, https://doi.org/10.1016/j.jes.2019.01.002, 2019.
Rajesh, T. A. and Ramachandran, S.: Characteristics and source apportionment of black carbon aerosols over an urban site, Environ. Sci. Pollu. Res., 24, 8411–8424, https://doi.org/10.1007/s11356-017-8453-3, 2017.
Ramanathan, V. and Carmichael, G.: Global and regional climate changes due to black carbon, Nat. Geosci., 1, 221–227, https://doi.org/10.1038/ngeo156, 2008.
Rehman, I. H., Ahmed, T., Praveen, P. S., Kar, A., and Ramanathan, V.: Black carbon emissions from biomass and fossil fuels in rural India, Atmos. Chem. Phys., 11, 7289–7299, https://doi.org/10.5194/acp-11-7289-2011, 2011.
Saide, P. E., Spak, S. N., Pierce, R. B., Otkin, J. A., Schaack, T. K., Heidinger, A. K., daSilva, A. M., Kacenelenbogen, M., Redemann, J., and Carmichael, G. R.: Central American biomass burning smoke can increase tornado severity in the U.S., Geophys. Res. Lett., 42, 956–965, https://doi.org/10.1002/2014GL062826, 2015.
Sandradewi, J., Prevot, A. S. H., Szidat, S., Perron, N., Alfarra, M. R., Lanz, V. A., Weingartner, E., and Baltensperger, U.: Using aerosol light absorption measurements for the quantitative determination of wood burning and traffic emission contributions to particulate matter, Environ. Sci. Technol., 42, 3316–3323, https://doi.org/10.1021/es702253m, 2008.
Sciare, J., d'Argouges, O., Sarda-Esteve, R., Caimoz, C., Dolgorouky, C., Bonnaire, N., Favez, O., Bonsang, B., and Gros, V.: Large contribution of water–insoluble secondary organic aerosols in the region of Paris (France) during wintertime, J. Geophys. Res., 116, D22203, https://doi.org/10.1029/2011JD015756, 2011
Sharma, A. R., Kharol, S. K., Badarinath, K. V. S., and Singh, D.: Impact of agriculture crop residue burning on atmospheric aerosol loading – A study over Punjab State, India, Ann. Geophys., 28, 367–379, https://doi.org/10.5194/angeo-28-367-2010, 2010.
Singh, P., Sarawade, P., and Adhikary, B.: Carbonaceous Aerosol from Open Burning and its Impact on Regional Weather in South Asia, Aerosol Air Qual. Res., 20, 419–431, https://doi.org/10.4209/aaqr.2019.03.0146, 2020.
Stein, A. F., Draxler, R. R., Rolph, G. D., Stunder, B. J. B., Cohen, M. D., and Ngan, F.: NOAA's HYSPLIT atmospheric transport and dispersion modeling system, B. Am. Meteorol. Soc., 96, 2059–2077, https://doi.org/10.1175/BAMS-D-14-00110.1, 2015.
Titos, G., del Águila, A., Cazorla, A., Lyamani, H., Casquero-Vera, J. A., Colombi, C., Cuccia, E., Gianelle, V., Močnik, G., Alastuey, A., Olmo, F. J., and Alados-Arboledas, L.: Spatial and temporal variability of carbonaceous aerosols: assessing the impact of biomass burning in the urban environment, Sci. Total Environ. 578, 613–625, https://doi.org/10.1016/j.scitotenv.2016.11.007, 2017.
Vadrevu, K. P., Lasko, K., Giglio, L., and Justice, C.: Vegetation fires, absorbing aerosols and smoke plume characteristics in diverse biomass burning regions of Asia, Environ. Res. Lett., 10, 105003, https://doi.org/10.1088/1748-9326/10/10/105003, 2015.
Vaishya, A., Singh, P., Rastogi, S., and Babu, S. S.: Aerosol black carbon quantification in the central Indo-Gangetic Plain: Seasonal heterogeneity and source apportionment, Atmos. Res., 185, 13–21, https://doi.org/10.1016/j.atmosres.2016.10.001, 2017.
Venkataraman, C., Habib, G., Eiguren-Fernandez, A., Miguel, A. H., and Friedlander, S. K.: Residential biofuels in south Asia: carbonaceous aerosol emissions and climate impacts, Science, 307, 1454–1456, https://doi.org/10.1126/science.1104359, 2005.
Virkkula, A., Mäkelä, T., Hillamo, R., Yli-Tuomi, T., Hirsikko, A., Hämeri, K., and Koponen, I. K.: A simple procedure for correcting loading effects of Aethalometer data, J. Air Waste Manage., 57, 10, 1214–1222, https://doi.org/10.3155/1047-3289.57.10.1214, 2007.
Wang, Q. Y., Huang, R.-J., Cao, J. J., Tie, X. X., Ni, H. Y., Zhou, Y. Q., Han, Y. M., Hu, T. F., Zhu, C. S., Feng, T., Li, N., and Li, J. D.: Black carbon aerosol in winter northeastern Qinghai–Tibetan Plateau, China: the source, mixing state and optical property, Atmos. Chem. Phys., 15, 13059–13069, https://doi.org/10.5194/acp-15-13059-2015, 2015.
Wang, R., Tao, S., Wang, W., Liu, J., Shen, H., Shen, G., Wang, B., Liu, X., Li, W., Huang, Y., Zhang, Y., Lu, Y., Chen, H., Chen, Y., Wang, C., Zhu, D., Wang, X., Li, B., Liu, W., and Ma, J.: Black carbon emissions in China from 1949 to 2050, Environ. Sci. Technol., 46, 7595–7603, https://doi.org/10.1021/es3003684, 2012.
Wang, Z., Huang, X., and Ding, A.: Dome effect of black carbon and its key influencing factors: a one-dimensional modelling study, Atmos. Chem. Phys., 18, 2821–2834, https://doi.org/10.5194/acp-18-2821-2018, 2018.
Watson, J. G.: Visibility: science and regulation, J. Air Waste Manage., 52, 628–713, https://doi.org/10.1080/10473289.2002.10470813, 2002.
Wiedinmyer, C., Akagi, S. K., Yokelson, R. J., Emmons, L. K., Al-Saadi, J. A., Orlando, J. J., and Soja, A. J.: The Fire INventory from NCAR (FINN): a high resolution global model to estimate the emissions from open burning, Geosci. Model Dev., 4, 625–641, https://doi.org/10.5194/gmd-4-625-2011, 2011.
Winiger, P., Barrett, T. E., Sheesley, R. J., Huang, L., Sharma, S., Barrie, L. A., Yttri, K. E., Evangeliou, N., Eckhardt, S., Stohl, A., Klimont, Z., Heyes, C., Semiletov, I. P., Dudarev, O. V., Charkin, A., Shakhova, N., Holmstrand, H., Andersson, A., and Gustafsson, O.: Source apportionment of circum-Arctic atmospheric black carbon from isotopes and modeling, Sci. Adv., 5, eaau8052, https://doi.org/10.1126/sciadv.aau8052, 2019.
Wu, D., Wu, C., Liao, B., Chen, H., Wu, M., Li, F., Tan, H., Deng, T., Li, H., Jiang, D., and Yu, J. Z.: Black carbon over the South China Sea and in various continental locations in South China, Atmos. Chem. Phys., 13, 12257–12270, https://doi.org/10.5194/acp-13-12257-2013, 2013.
Wu, J., Kong, S., Wu, F., Cheng, Y., Zheng, S., Yan, Q., Zheng, H., Yang, G., Zheng, M., Liu, D., Zhao, D., and Qi, S.: Estimating the open biomass burning emissions in central and eastern China from 2003 to 2015 based on satellite observation, Atmos. Chem. Phys., 18, 11623–11646, https://doi.org/10.5194/acp-18-11623-2018, 2018.
Yan, X., Ohara, T., and Akimoto, H.: Bottom-up estimate of biomass burning in mainland China, Atmos. Environ., 40, 5262–5273, https://doi.org/10.1016/j.atmosenv.2006.04.040, 2006.
Xiao, S., Yu, X., Zhu, B., Kumar, K. R., Li, M., and Li, L.: Characterization and source apportionment of black carbon aerosol in the Nanjing Jiangbei New Area based on two years of measurements from Aethalometer, J. Aerosol. Sci., 139, 105461, https://doi.org/10.1016/j.jaerosci.2019.105461, 2020.
Yang, Y., Wang, H., Smith, S. J., Ma, P.-L., and Rasch, P. J.: Source attribution of black carbon and its direct radiative forcing in China, Atmos. Chem. Phys., 17, 4319–4336, https://doi.org/10.5194/acp-17-4319-2017, 2017.
Ying, Q., Lu, J., Kaduwela, A., and Kleeman, M.: Modeling air quality during the California REGIONAL PM10/PM2.5 Air Quality Study (CPRAQS) using the UCD/CIT Source Oriented Air Quality Model - Part II. Regional source apportionment of primary airborne particulate matter, Atmos. Environ., 42, 8967–8978, https://doi.org/10.1016/j.atmosenv.2008.05.065, 2008.
Yu, K., Xing, Z., Huang, X., Deng, J., Andersson, A., Fang, W., Gustafsson, O., Zhou, J., and Du, K.: Characterizing and sourcing ambient PM2.5 over key emission regions in China III: Carbon isotope based source apportionment of black carbon, Atmos. Environ., 177, 12–17, https://doi.org/10.1016/j.atmosenv.2018.01.009, 2018.
Zhang, H. and Ying, Q.: Contributions of local and regional sources of NOx to ozone concentrations in Southeast Texas, Atmos. Environ., 45, 2877–2887, https://doi.org/10.1016/j.atmosenv.2011.02.047, 2011.
Zhang, H., DeNero, S. P., Joe, D. K., Lee, H.-H., Chen, S.-H., Michalakes, J., and Kleeman, M. J.: Development of a source oriented version of the WRF/Chem model and its application to the California regional PM10∕PM2.5 air quality study, Atmos. Chem. Phys., 14, 485–503, https://doi.org/10.5194/acp-14-485-2014, 2014.
Zhang, Y., Zhang, H., Deng, J., Du, W., Hong, Y., Xu, L., Qiu, Y., Hong, Z., Wu, X., Ma, Q., and Yao, J.: Source regions and transport pathways of PM2.5 at a regional background site in East China, Atmos. Environ., 167, 202–211, https://doi.org/10.1016/j.atmosenv.2017.08.031, 2017.
Zhang, Y., Li, M., Cheng, Y., Geng, G., Hong, C., Li, H., Li, X., Tong, D., Wu, N., Zhang, X., Zheng, B., Zheng, Y., Bo, Y., Su, H., and Zhang, Q.: Modeling the aging process of black carbon during atmospheric transport using a new approach: a case study in Beijing, Atmos. Chem. Phys., 19, 9663–9680, https://doi.org/10.5194/acp-19-9663-2019, 2019.
Zheng, H., Kong, S., Wu, F., Cheng, Y., Niu, Z., Zheng, S., Yang, G., Yao, L., Yan, Q., Wu, J., Zheng, M., Chen, N., Xu, K., Yan, Y., Liu, D., Zhao, D., Zhao, T., Bai, Y., Li, S., and Qi, S.: Intra-regional transport of black carbon between the south edge of the North China Plain and central China during winter haze episodes, Atmos. Chem. Phys., 19, 4499–4516, https://doi.org/10.5194/acp-19-4499-2019, 2019.
Zhou, Y., Xing, X., Lang, J., Chen, D., Cheng, S., Wei, L., Wei, X., and Liu, C.: A comprehensive biomass burning emission inventory with high spatial and temporal resolution in China, Atmos. Chem. Phys., 17, 2839–2864, https://doi.org/10.5194/acp-17-2839-2017, 2017.
Zhuang, B. L., Chen, H. M., Li, S., Wang, T. J., Liu, J., Zhang, L. J., Liu, H. N., Xie, M., Chen, P. L., Li, M. M., and Zhao, M.: The direct effects of black carbon aerosols from different source sectors in East Asia in summer, Clim. Dynam., 53, 5293–5310, https://doi.org/10.1007/s00382-019-04863-5, 2019.
Zhuang, B. L., Li, S., Wang, T. J., Liu, J., Chen, P. L., Chen, H. M., Li, M. M, and Xie, M.: Interaction between the black carbon aerosol warming effect and East Asian monsoon using RegCM4, J. Climate, 31, 9367–9388, https://doi.org/10.1175/JCLI-D-17-0767.1, 2018.
Zotter, P., Herich, H., Gysel, M., El-Haddad, I., Zhang, Y., Močnik, G., Hüglin, C., Baltensperger, U., Szidat, S., and Prévôt, A. S. H.: Evaluation of the absorption Ångström exponents for traffic and wood burning in the Aethalometer-based source apportionment using radiocarbon measurements of ambient aerosol, Atmos. Chem. Phys., 17, 4229–4249, https://doi.org/10.5194/acp-17-4229-2017, 2017.