the Creative Commons Attribution 4.0 License.
the Creative Commons Attribution 4.0 License.
 | 17 Nov 2020
Understanding processes that control dust spatial distributions with global climate models and satellite observations
Mingxuan Wu
Xiaohong Liu
Hongbin Yu
Hailong Wang
Kang Yang
Anton Darmenov
Chenglai Wu
Zhien Wang
Ziming Ke
Dust aerosol is important in modulating the climate system at local and global scales, yet its spatiotemporal distributions simulated by global climate models (GCMs) are highly uncertain. In this study, we evaluate the spatiotemporal variations of dust extinction profiles and dust optical depth (DOD) simulated by the Community Earth System Model version 1 (CESM1) and version 2 (CESM2), the Energy Exascale Earth System Model version 1 (E3SMv1), and the Modern-Era Retrospective analysis for Research and Applications version 2 (MERRA-2) against satellite retrievals from Cloud-Aerosol Lidar with Orthogonal Polarization (CALIOP), Moderate Resolution Imaging Spectroradiometer (MODIS), and Multi-angle Imaging SpectroRadiometer (MISR). We find that CESM1, CESM2, and E3SMv1 underestimate dust transport to remote regions. E3SMv1 performs better than CESM1 and CESM2 in simulating dust transport and the northern hemispheric DOD due to its higher mass fraction of fine dust. CESM2 performs the worst in the Northern Hemisphere due to its lower dust emission than in the other two models but has a better dust simulation over the Southern Ocean due to the overestimation of dust emission in the Southern Hemisphere. DOD from MERRA-2 agrees well with CALIOP DOD in remote regions due to its higher mass fraction of fine dust and the assimilation of aerosol optical depth. The large disagreements in the dust extinction profiles and DOD among CALIOP, MODIS, and MISR retrievals make the model evaluation of dust spatial distributions challenging. Our study indicates the importance of representing dust emission, dry/wet deposition, and size distribution in GCMs in correctly simulating dust spatiotemporal distributions.
- Article
(7394 KB) - Full-text XML
-
Supplement
(3105 KB) - BibTeX
- EndNote


Mineral dust plays an important role in the Earth's climate system. It can impact the Earth's radiation budget directly through scattering and absorbing solar and terrestrial radiation (e.g., Tegen et al., 1996; Balkanski et al., 2007) and indirectly through acting as cloud condensation nuclei and ice-nucleating particles (e.g., Rosenfeld et al., 2001; DeMott et al., 2003; Shi and Liu, 2019). Dust can reduce the snow albedo when deposited on snow (e.g., Yasunari et al., 2015; C. Wu et al., 2018b; Rahimi et al., 2019), participate in the heterogeneous atmospheric chemistry reactions (e.g., Dentener et al., 1996), and provide nutrients such as iron to oceans through deposition (e.g., Jickells et al., 2005). Dust aerosols are reported to have a negative radiative forcing (RF) due to aerosol–radiation interactions (RFari); however, large uncertainties exist in the dust RFari estimates (Boucher et al., 2013). Whether mineral dust warms or cools the climate is still controversial (e.g., Boucher et al., 2013; Scanza et al., 2015; Kok et al., 2017).
The large uncertainties in estimating dust RFari can be mainly attributed to the large diversities in the dust life cycle (i.e., emission, transport, and deposition) simulated by current global climate models (GCMs) (e.g., Huneeus et al., 2011; Boucher et al., 2013; Kim et al., 2014, 2019; Pu and Ginoux, 2018; C. Wu et al., 2018a), which is not well constrained by observations. Huneeus et al. (2011) found that global total dust emission from 14 GCMs participating in the Aerosol Comparisons between Observations and Models (AeroCom) phase I ranges from 514 to 4313 Tg yr−1, while global annual mean dust optical depth (DOD) ranges from 0.010 to 0.053. Pu and Ginoux (2018) showed that the Coupled Model Intercomparison Project Phase 5 (CMIP5) models underestimate DOD, especially in spring, compared with land DOD derived from the Moderate Resolution Imaging Spectroradiometer (MODIS). C. Wu et al. (2018a) found that dust emission from CMIP5 models differs greatly in spatial distribution and intensity over East Asia. Kim et al. (2014, 2019) compared DOD from five GCMs participating in the AeroCom phase II with DOD derived from the Cloud-Aerosol Lidar with Orthogonal Polarization (CALIOP), MODIS, and Multi-angle Imaging SpectroRadiometer (MISR) in the trans-Atlantic and trans-Pacific regions, respectively. Large diversities are found in the modeled DOD over the source regions of North Africa and East Asia, implying large uncertainties associated with dust emissions in these models. The low model biases of DOD across the North Atlantic and North Pacific indicate that current GCMs underestimate the trans-Atlantic transport of North African dust and the trans-Pacific transport of East Asian dust, respectively, likely due to an overestimation of dust removal.
Apart from horizontal distribution, the vertical distribution of mineral dust can strongly influence the radiative effects of dust (e.g., Zhang et al., 2013), which is poorly constrained by observations. Few studies directly compared dust extinction profiles in GCMs with retrievals from CALIOP on board Cloud-Aerosol Lidar and Infrared Pathfinder Satellite Observation (CALIPSO) (e.g., Yu et al., 2010; Johnson et al., 2012; Kim et al., 2019; Wu et al., 2019). Yu et al. (2010) separated the dust extinction from the total aerosol extinction in the nighttime cloud-free CALIOP level 2 (CAL-L2) version 2.01 product using the volume depolarization ratio. They compared the dust extinction simulated by the Goddard Chemistry Aerosol Radiation Transport (GOCART) model with CALIPSO observations from June 2006 to November 2007. Johnson et al. (2012) evaluated the dust extinction simulated by GEOS-Chem, a global 3D chemical transport model driven by meteorological input from the Goddard Earth Observing System (GEOS), with the CAL-L2 version 3.01 product from March 2009 to February 2010, and found high model biases of dust extinction in the lower troposphere over main source regions, similar to Yu et al. (2010). Wu et al. (2019) compared dust extinction modeled by the Community Earth System Model (CESM) with satellite retrievals from Luo et al. (2015a, b) (L15), Yu et al. (2015) (Y15), and the standard CALIOP level 3 (CAL-L3) product and found high model biases of dust extinction in the upper troposphere and large uncertainties in different CALIPSO products over East Asia.
A major challenge in evaluating mineral dust in GCMs is the lack of high-quality and long-term measurements of dust (Evan et al., 2014). The limited spatiotemporal coverage of ground-based and aircraft observations is insufficient to provide global-scale dust information. Pu and Ginoux (2016) derived DOD over land from MODIS Deep Blue (DB) aerosol products using Ångström exponent and single-scattering albedo. Compared to coarse-mode aerosol optical depth (AOD) from Aerosol Robotic Network (AERONET) ground-based observations, MODIS DOD over land is slightly underestimated. Yu et al. (2009) derived DOD over ocean from MODIS Dark Target (DT) aerosol products using prescribed fine-mode fractions of combustion, dust, and marine aerosols. MODIS DOD over ocean shows that Asian dust can contribute substantially to the aerosol loading over North America (Yu et al., 2012). Luo et al. (2015a) developed a dust separation method to retrieve dust extinction from the CALIOP level 1B (CAL-L1B) product, which gives lower dust extinction in the lower troposphere (< 4 km) than the CAL-L2 product. Luo et al. (2015b) developed a dust identification method to better detect optically thin dust layers and found significantly frequent dust occurrences in the upper troposphere than the CAL-L2 product. Ridley et al. (2016) estimated the global DOD to be 0.030 ± 0.005 by combining satellite retrievals of AOD with DOD simulated by four GCMs, which is close to AeroCom mean (0.028 ± 0.011, Huneeus et al., 2011) but has lower uncertainties.
In this study, we compare dust extinction profiles and DOD simulated from CESM1, CESM2, the Energy Exascale Earth System Model version 1 (E3SMv1), and the Modern-Era Retrospective analysis for Research and Applications version 2 (MERRA-2) with satellite retrievals from CALIOP (L15 and Y15), MODIS, and MISR on a global scale. We pay attention not only to the physical processes responsible for the model biases of dust but also to the uncertainties in satellite retrievals and the impacts of these uncertainties on the model evaluation. The goal of this study is to evaluate the performance of CESM1, CESM2, E3SMv1, and MERRA-2 in the simulations of (1) dust mass budgets, (2) dust extinction profiles and DOD, and (3) dust surface concentrations. The paper is organized as follows. Section 2 first introduces the models (CESM1, CESM2, E3SMv1, and MERRA-2) and then gives a detailed description of the satellite retrievals used in this study. Section 3 first shows the global dust mass budgets from the three models and one reanalysis and then compares modeled dust extinction profiles and DOD with satellite retrievals. Discussion and conclusions are presented in Sect. 4.
In this section, we give a brief description of the GCMs (Sect. 2.1), experiments design (Sect. 2.2), and satellite retrievals (Sect. 2.3) used in this study. Some important model features for simulating dust in CESM1, CESM2, E3SMv1, and MERRA-2 are summarized in Table 1.
Table 1Description of the models and their dust physical characteristics.
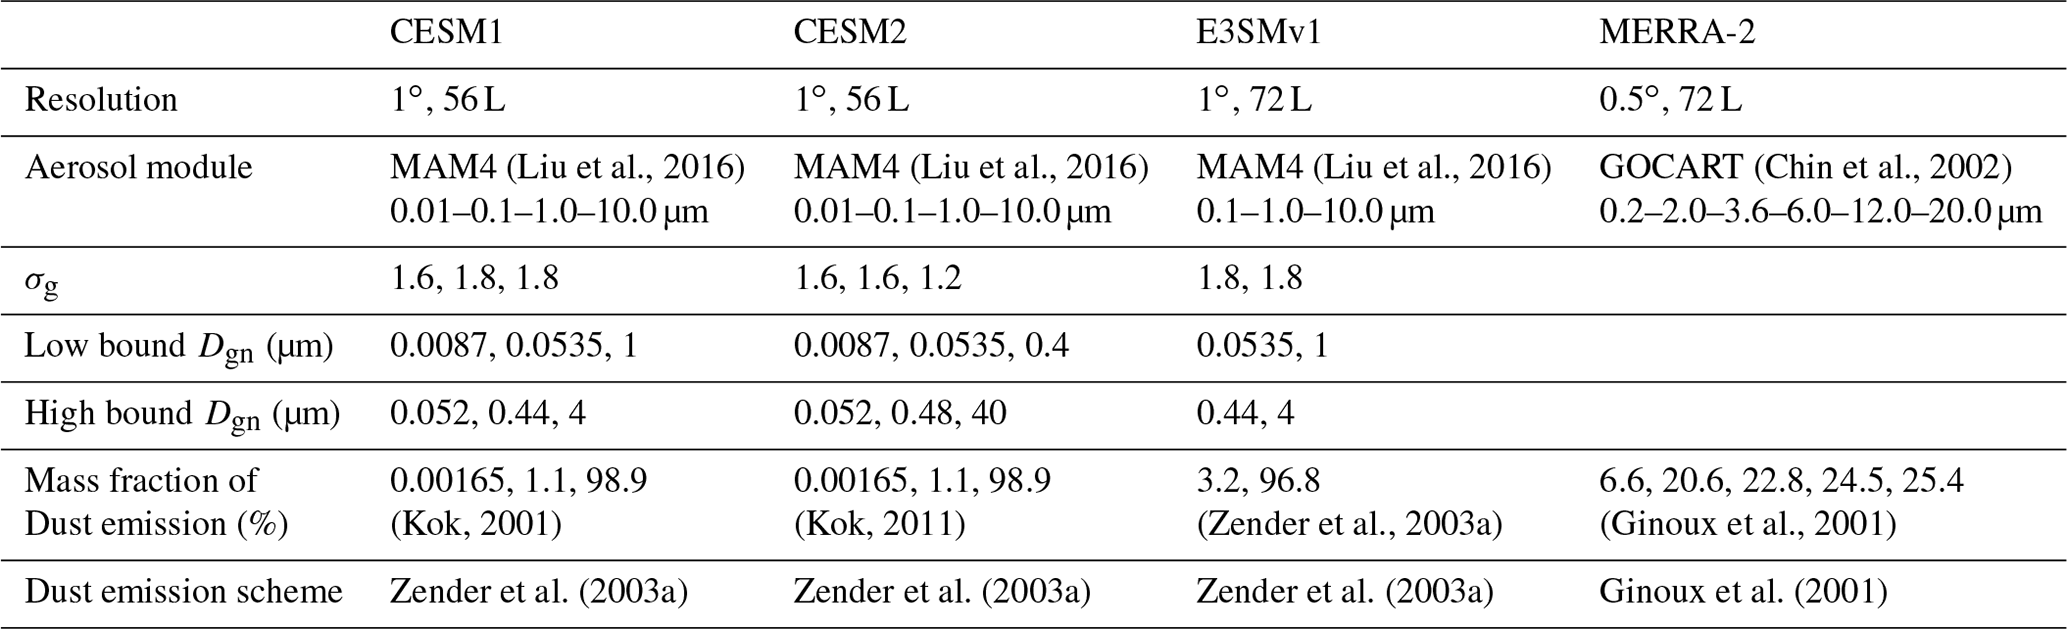
σg is the geometric standard deviation; Dgn is number median diameter.
2.1 Model description
2.1.1 CESM
In this study, we use the latest CESM2.1 (Danabasoglu et al., 2020) with the Community Atmosphere Model version 6 (CAM6) and the Community Land Model version 5 (CLM5, Lawrence et al., 2019) as the atmosphere and land component, respectively. CAM6 has replaced earlier schemes for boundary layer turbulence, shallow convection, and cloud macrophysics with the Cloud Layers Unified by Binormals (CLUBB, Golaz et al., 2002; Bogenschutz et al., 2013) scheme. CAM6 uses an improved two-moment cloud microphysics (MG2, Gettelman and Morrison, 2015) scheme and the four-mode version of the Modal Aerosol Module (MAM4, Liu et al., 2016). Dust is represented in the Aitken mode, accumulation mode, and coarse mode with emission diameter bounds at 0.01–0.1, 0.1–1.0, and 1.0–10.0 µm, respectively. Dust emission is parameterized following Zender et al. (2003a). A geomorphic source function is used to account for global variations in soil erodibility, which is proportional to the upstream runoff collection area (Zender et al., 2003b). The size distribution of emitted dust particles follows the brittle fragmentation theory (Kok, 2011) with prescribed mass fractions of 0.00165 %, 1.1 %, and 98.9 % for the three modes, respectively.
For comparison, we also use CESM1.2 (Hurrell et al., 2013) with CAM5 (Neale et al., 2010) and CLM4 (Oleson et al., 2010) as the atmosphere and land component, respectively. As shown in Table 1, the representation of dust in aerosol module, dust emission scheme, and size distribution in CESM2.1 is the same as in CESM1.2. The main difference of dust treatment is that CESM2.1 reduces the geometric standard deviations (σg) in the accumulation and coarse mode from 1.8 to 1.6 and 1.2, respectively. The upper and lower bound of the number median diameter (Dgn) in the coarse mode changes from 1–4 to 0.4–40 µm. These changes in mode size parameters greatly reduce the dry deposition velocities for dust particles in the accumulation and coarse mode, which further leads to the decrease in dust dry deposition fluxes. The geomorphic source function used in CESM2.1 is also different from the one used in CESM1.2 (see Fig. S1 in the Supplement), which substantially changes the spatial distributions of dust emission.
2.1.2 E3SM
We use E3SMv1 (Golaz et al., 2019) with the atmosphere model (EAM, Rasch et al., 2019) and land model (ELM), which are based on CAM5 and CLM4.5, respectively, as the atmosphere and land component. Compared with CAM6, EAMv1 includes new treatments of convective transport, wet removal, and resuspension of aerosols to the coarse mode (Wang et al., 2013, 2020), which can reduce the high model biases of dust extinction in the upper troposphere. Dust is carried in the accumulation and coarse mode with emission diameter bounds at 0.1–1.0, and 1.0–10.0 µm, respectively. Unlike CESM1.2 and CESM2.1, the size distribution of emitted dust particles follows Zender et al. (2003a) with prescribed mass fractions of 3.2 % and 96.8 % for the accumulation and coarse mode, respectively (see Table 1). The higher mass fraction of emitted accumulation mode dust in E3SMv1, which is 3 times larger than that in CESM2.1, can increase the dust transport to remote regions (e.g., Arctic, Antarctic, and Southern Ocean). However, it overestimates the mass fraction of emitted fine dust compared with observations, as shown in Kok (2011). E3SMv1 uses the same source function as CESM1.2 for dust emission, indicating that E3SMv1 has similar spatial distributions of dust emission to CESM1.2. Compared with CESM1.2 and CESM2.1, E3SMv1 has 72 vertical layers, and its bottom layer is thinner than that in CESM1.2 and CESM2.1, which can affect the dry deposition of dust.
2.1.3 MERRA-2
MERRA-2 (Gelaro et al., 2017) is the latest atmospheric reanalysis of the modern satellite era produced by combining GEOS atmospheric model version 5 (GEOS-5) with a 3D variational data assimilation (3D-Var) algorithm to ingest a wide range of observational data. MERRA-2 assimilates AOD from the Advanced Very High Resolution Radiometer (AVHRR), MODIS, MISR, and AERONET. GEOS-5 is run with the GOCART aerosol module (Chin et al., 2002). The dust emission flux is calculated based on Ginoux et al. (2001). A topographic source function (see Fig. S1) is used to shift dust emission toward the most erodible regions, which is characterized by the relative elevation of source regions in surrounding basins (Ginoux et al., 2001). We should note that the assimilation of AOD results in the imbalance of global dust mass. Because the assimilation of AOD increases dust concentrations in remote regions, the total deposition (dry and wet) is considerably larger than the dust emission in MERRA-2. As shown in Table 1, dust is carried in five size bins with diameter bounds at 0.2–2.0, 2.0–3.6, 3.6–6.0, 6.0–12.0, and 12.0–20.0 µm, respectively. The size distribution of emitted dust particles follows Tegen and Lacis (1996), with mass fractions of 6.6 %, 20.6 %, 22.8 %, 24.5 %, and 25.4 %, respectively. MERRA-2 includes very coarse dust (10.0–20.0 µm), which is neglected by CESM and E3SM. MERRA-2 uses the emitted dust size distribution following Tegen and Lacis (1996) and has the highest mass fraction of emitted fine dust (0.1–1.0 µm) among the three models and one reanalysis (see Fig. 3 in Kok, 2011, for the comparison of emitted dust size distribution), which can increase the dust transport.
2.2 Experiments design
We ran CESM1.2 and CESM2.1 with the finite-volume (FV) dynamical core for CAM5.3 and CAM6, respectively, at 0.9∘ × 1.25∘ horizontal resolution with 56 vertical levels from 2006 to 2009, and the last 3-year results were used for analysis. We ran E3SMv1 with the spectral-element (SE) dynamical core for EAMv1 at 100 km horizontal resolution on a cubed-sphere geometry with 72 vertical layers from 2006 to 2009. The horizontal wind components u and v in the three models were all nudged toward the MERRA-2 meteorology using a relaxation timescale of 6 h. Monthly mean climatological SST and sea ice concentrations were used. The global annual mean dust emission in CESM1.2, CESM2.1, and E3SMv1 was tuned so that AOD in the dusty regions (DOD/AOD > 0.5) matches the observations from MODIS on board Terra and Aqua. Thus, the tuning factors are different among the three models. Generally, CESM1 and E3SMv1 produce quite similar dust emission. However, due to the longer dust lifetime in CESM2, it is tuned to have a much lower dust emission in order to achieve a similar global mean DOD as in the other models.
2.3 Satellite retrievals
2.3.1 MODIS and MISR
Pu and Ginoux (2016) derived DOD over land from MODIS Collection 6 (C6) DB aerosol products (Hsu et al., 2013) by using a continuous function relating the Ångström exponent (α) to fine-mode AOD established by Anderson et al. (2005), which was derived based on ground measurements. The formula is given as
where ω is the single-scattering albedo at 470 nm. DOD is derived only when α is less than 0.3 and ω is less than 1. As discussed in Baddock et al. (2016), we use the lowest-quality (QA = 1) AOD over dust source regions and AOD flagged as very good quality (QA = 3) for other land areas. Although the derived MODIS DOD over land is in good agreement with coarse-mode AOD from AERONET (Pu and Ginoux, 2016), it may overestimate DOD in reality. We calculate coarse-mode AOD, which is used as a proxy of DOD, only when AOD is mainly contributed by dust (α < 0.3, ω < 1).
Yu et al. (2020) derived DOD over ocean from MODIS C6 DT aerosol products as follows:
where f is the fine-mode fraction retrieved directly from MODIS; AODm is the marine AOD; and fc, fd, and fm are fine-mode fractions of combustion, dust, and marine aerosol, respectively. fc, fd, and fm are set to be 0.92 (0.89), 0.26 (0.31), and 0.55 (0.48) for MODIS on board Terra (Aqua), respectively. These differences in the fractions may be caused by the difference in instrument calibrations (Levy et al., 2018). We also use the nonspherical fraction of AOD from MISR level 3 version 23 (V23) products (Witek et al., 2018) as a proxy of DOD over ocean (e.g., Kim et al., 2014, 2019; H. Yu et al., 2019). We do not use MODIS and MISR DOD over high-latitude regions (> 60∘) because of large uncertainties in retrievals.
2.3.2 CALIOP
Luo et al. (2015a) developed a new dust separation method which derives the dust backscatter coefficient (βd, m−1 sr−1) in the lidar equation inversion stage using the CAL-L1B data. The original single-scattering lidar equation is
where β′ (CAL-L1B product) is the total attenuated backscatter coefficient; βa (CAL-L2 product) and βm are backscatter coefficients for aerosol and molecules, respectively; and Sa and Sm are lidar ratios for aerosol and molecules, respectively. Assuming that dust is externally mixed with nondust aerosols, Eq. (3) can be rewritten as
where βd and βnd are backscatter coefficients for dust and nondust aerosols, respectively; Sd is the lidar ratio for dust and set to be 40 sr; and Snd is the lidar ratio for nondust aerosols and set to be 25 sr. The new separation method also requires a priori knowledge of depolarization ratios of dust (δd) and nondust (δnd), which are given values of 0.25 and 0.05, respectively. The dust extinction can then be easily converted from βd by multiplying Sd of 55 sr, which accounts for the multiple scattering effects as suggested in Wandinger et al. (2010). The new separation method can resolve dust extinction from polluted dust (i.e., dust mixing with other types of aerosols), whereas CAL-L2 products fail to do so. It also tends to have lower uncertainties than doing the partition based on lidar inversion products (i.e., CAL-L2) in previous studies (e.g., Amiridis et al., 2013; Yu et al., 2015; Proestakis et al., 2018). Additionally, Luo et al. (2015b) developed a new dust identification method by using combined lidar–radar cloud masks from CloudSat and CALIPSO, which significantly improves the detection of optically thin dust layer, especially in the upper troposphere. In this study, we use both the new separation method (Luo et al., 2015a) and the new identification method (Luo et al., 2015b) to produce the nighttime dust extinction dataset (L15) for the period of 2007 to 2009.
Yu et al. (2015) derived βd from CAL-L2 βa with a priori knowledge of δd and δnd as follows:
where δ is the CALIOP-observed particulate depolarization ratio. To minimize the uncertainties, we calculate βd in two scenarios: the “lower-bound dust fraction” scenario (δd = 0.30, δnd = 0.07) and the “upper-bound dust fraction” scenario (δd = 0.20, δnd = 0.02). We then converted dust extinction from βd by multiplying Sd of 45 sr. In this study, we use the dust separation method to retrieve nighttime dust extinction under the cloud-free condition based on CAL-L2 version 4.10 lidar products. To ensure the retrieval quality, we only select high-confidence data based on the cloud-aerosol discrimination (CAD) scores (−100 to −70) and extinction quality control flag values (0, 1, 16, and 18) (Yu et al., 2010, 2015). The aerosol free condition (dust extinction is zero) is also included in the retrieval.
To make an apple-to-apple comparison of modeled dust extinction with satellite observations, two treatments were applied to collocate model results and CALIOP data. First, dust extinction retrievals from L15 and Y15 were averaged into 0.9∘ × 1.25∘ grid boxes (same as CAM5.3 and CAM6) and interpolated to pressure levels at 25 hPa intervals. Modeled dust extinction profiles from CESM1.2, CESM2.1, and E3SMv1 were sampled every 10 s along the CALIPSO satellite tracks. Dust extinction profiles from MERRA-2 were calculated offline based on 3-hourly output of 3D dust mixing ratio and then sampled along the CALIPSO satellite tracks. Second, the dust extinction in and below the vertical layer where cloud fraction is 100 % was set to missing values to account for the fact that dust inside clouds, adjacent to the cloud bottom, and below optically thick clouds cannot be retrieved from CALIOP. Collocated dust extinction from model experiments is then integrated vertically to get the DOD value.
Figure 1a shows 12 selected regions including both dust source regions and transport pathway regions, in which we evaluate the seasonal variations of modeled dust extinction and DOD with satellite retrievals. Figure 1b shows the network of stations, at which we evaluate dust surface concentrations (Huneeus et al., 2011; Prospero et al., 2012; Fan, 2013).
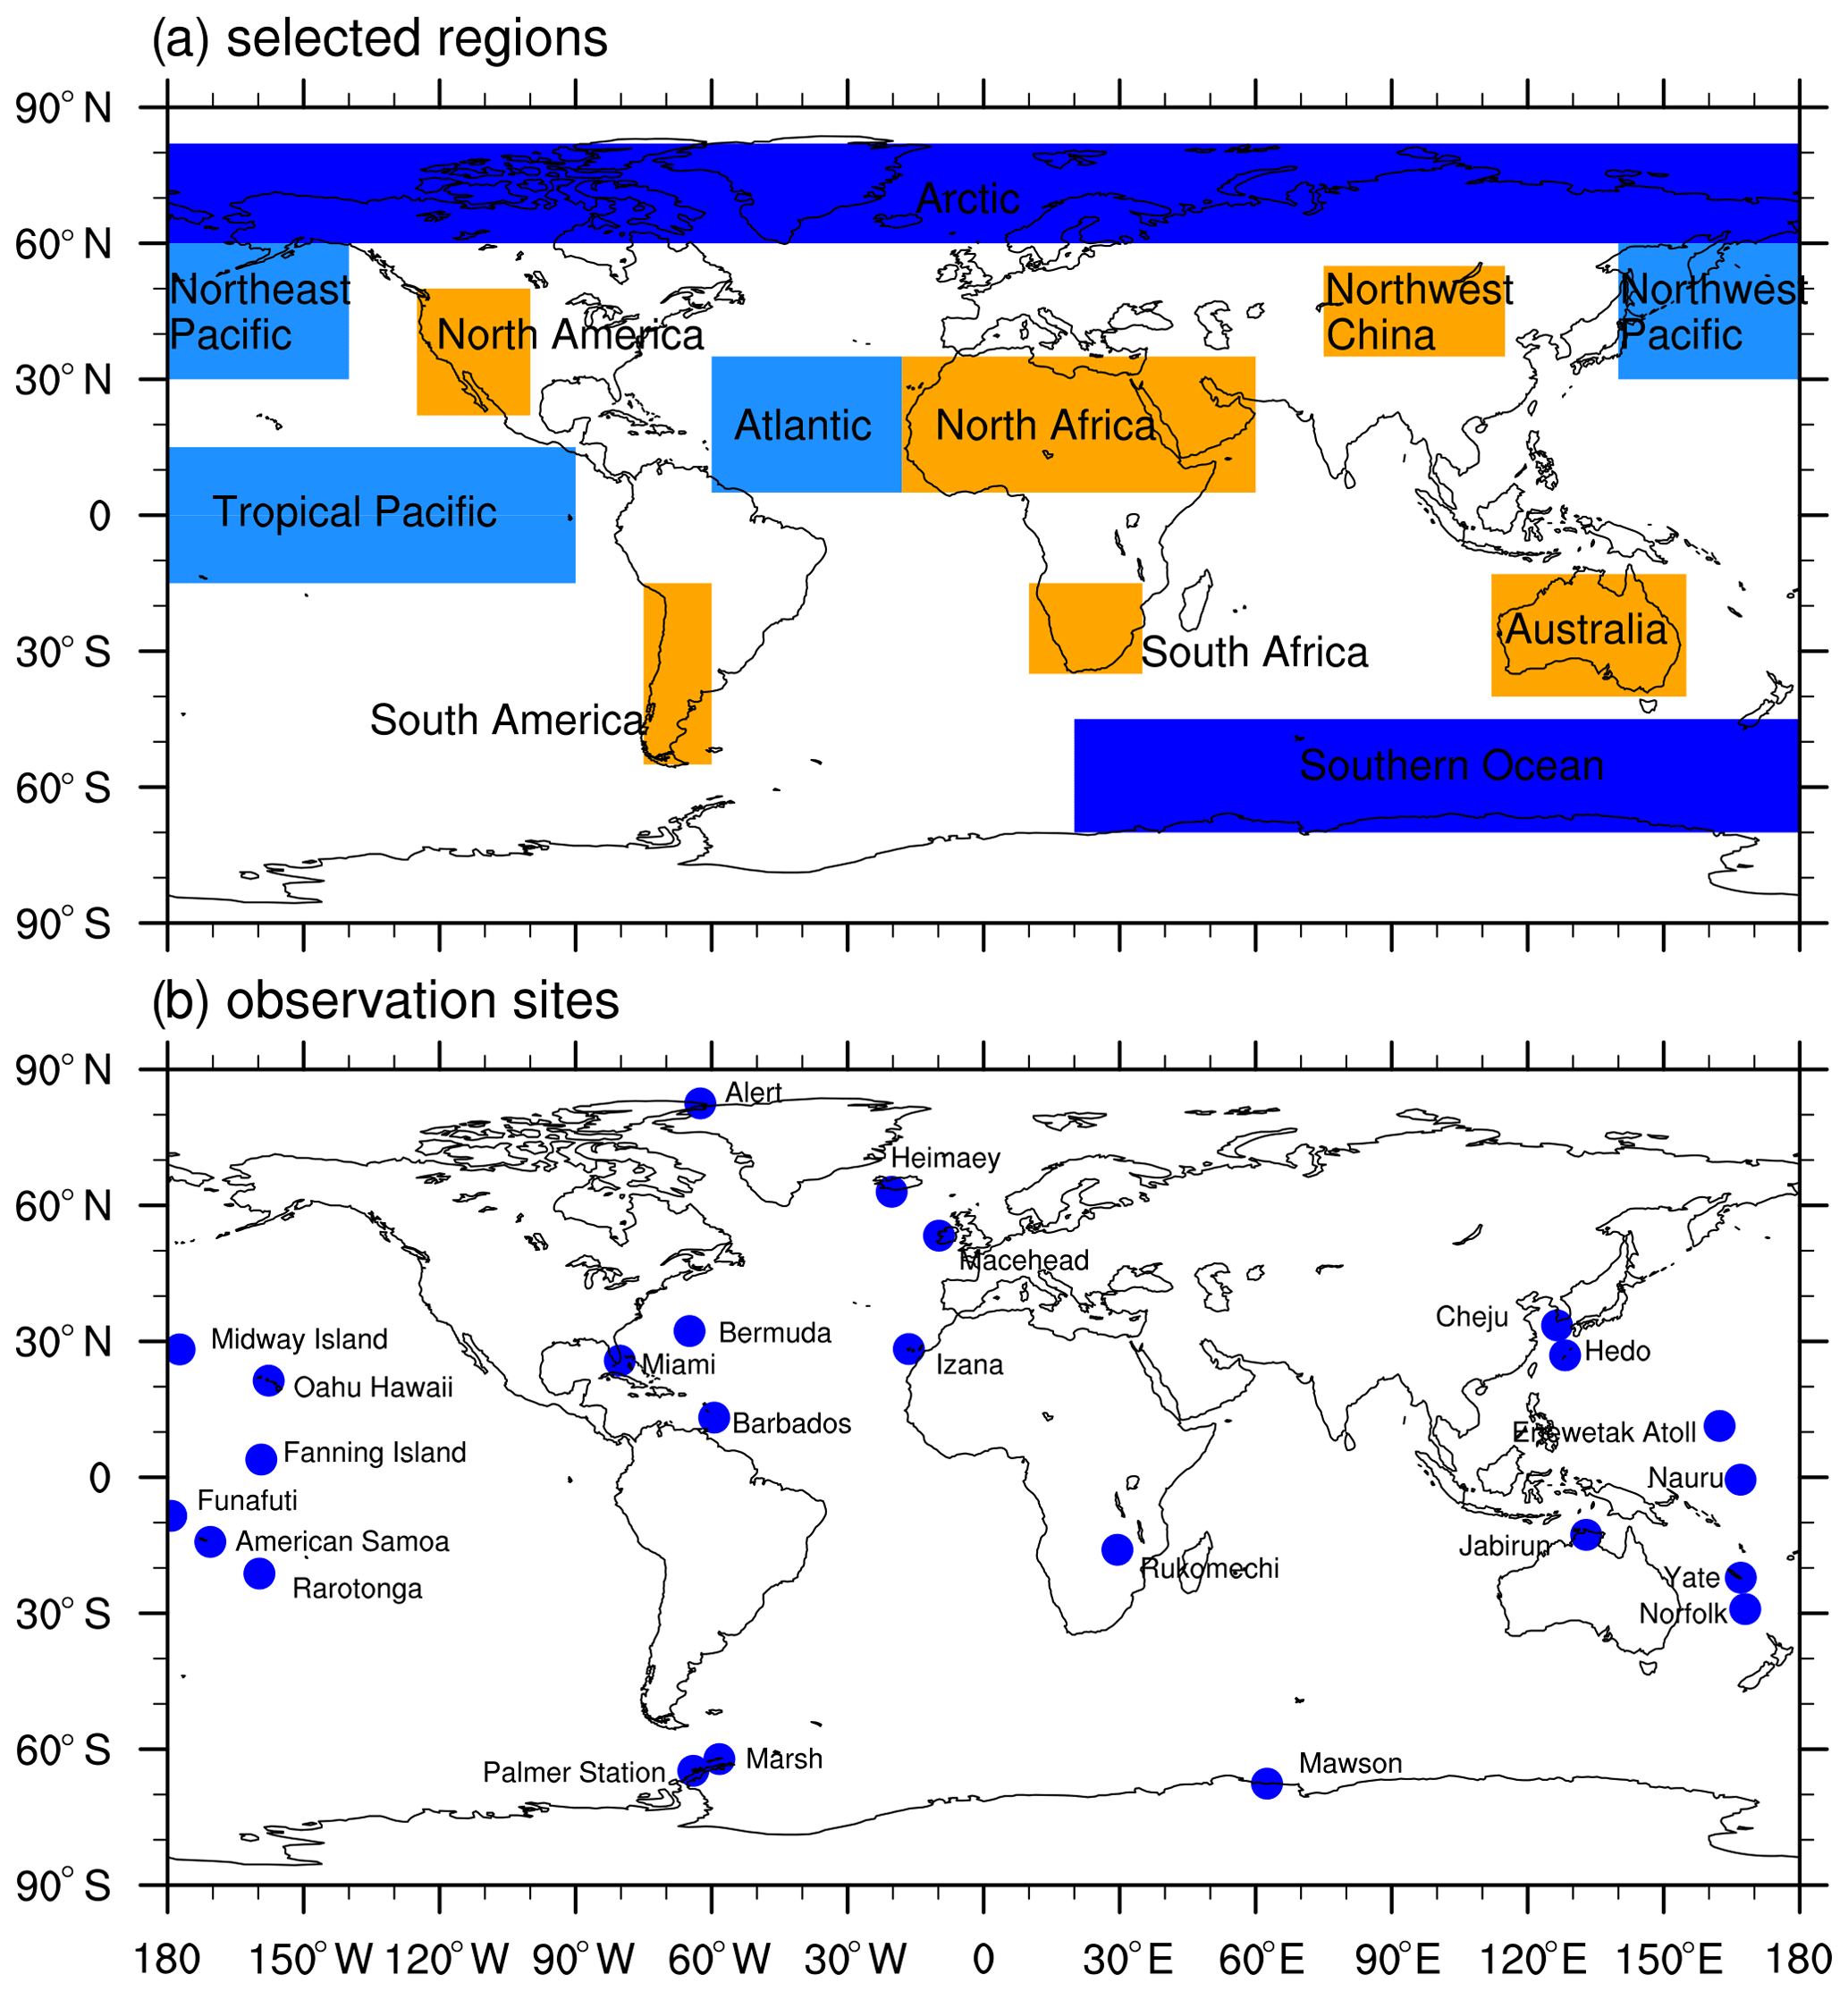
Figure 1Illustration of (a) 12 selected domains and (b) network of stations measuring dust surface concentrations.
3.1 Dust mass budgets
Table 2 gives the global annual mean dust mass budgets, DOD, and mass extinction efficiency (MEE) from model experiments. We can see that dust emissions in CESM1 and E3SMv1 are much larger than those in CESM2 and MERRA-2, which can be attributed to the model tuning and uses of different dust emission schemes and source functions. Dust emission schemes in CESM1, CESM2, and E3SMv1 are the same and based on Zender et al. (2003a), while the dust emission scheme in MERRA-2 is based on Ginoux et al. (2001). CESM1 and E3SMv1 use the same dust source function, which is different from those in CESM2 and MERRA-2. Dry deposition is the dominant removal process of dust compared with wet deposition in CESM1, E3SMv1, and MERRA-2, whereas CESM2 has less dry deposition (675 Tg yr−1) than wet deposition (1151 Tg yr−1). Due to the changes in size parameters (σg, low and high bound of Dgn) in the accumulation and coarse mode of CESM2 MAM4 (see Table 1), aerosol dry deposition velocities for the accumulation and coarse mode greatly reduce, leading to the decrease in dry deposition. Note that MERRA-2 has less dry deposition (750 Tg yr−1) than wet deposition (865 Tg yr−1) for dust aerosols with diameter between 0.2 and 12.0 µm. We also find that E3SMv1 produces notably higher dry deposition than CESM1, although both models have a similar amount of dust emission. In CESM and E3SM, dust emission fluxes (kg m−2 s−1) are divided by the model bottom layer thickness and converted to dust mixing ratio tendencies (kg kg−1 s−1). Because the bottom layer in E3SMv1 is thinner with higher vertical resolution than the one in CESM1, more dust in the bottom layer is removed through the dry deposition process.
Table 2Global annual mean dust mass budgets, DOD, and MEE.
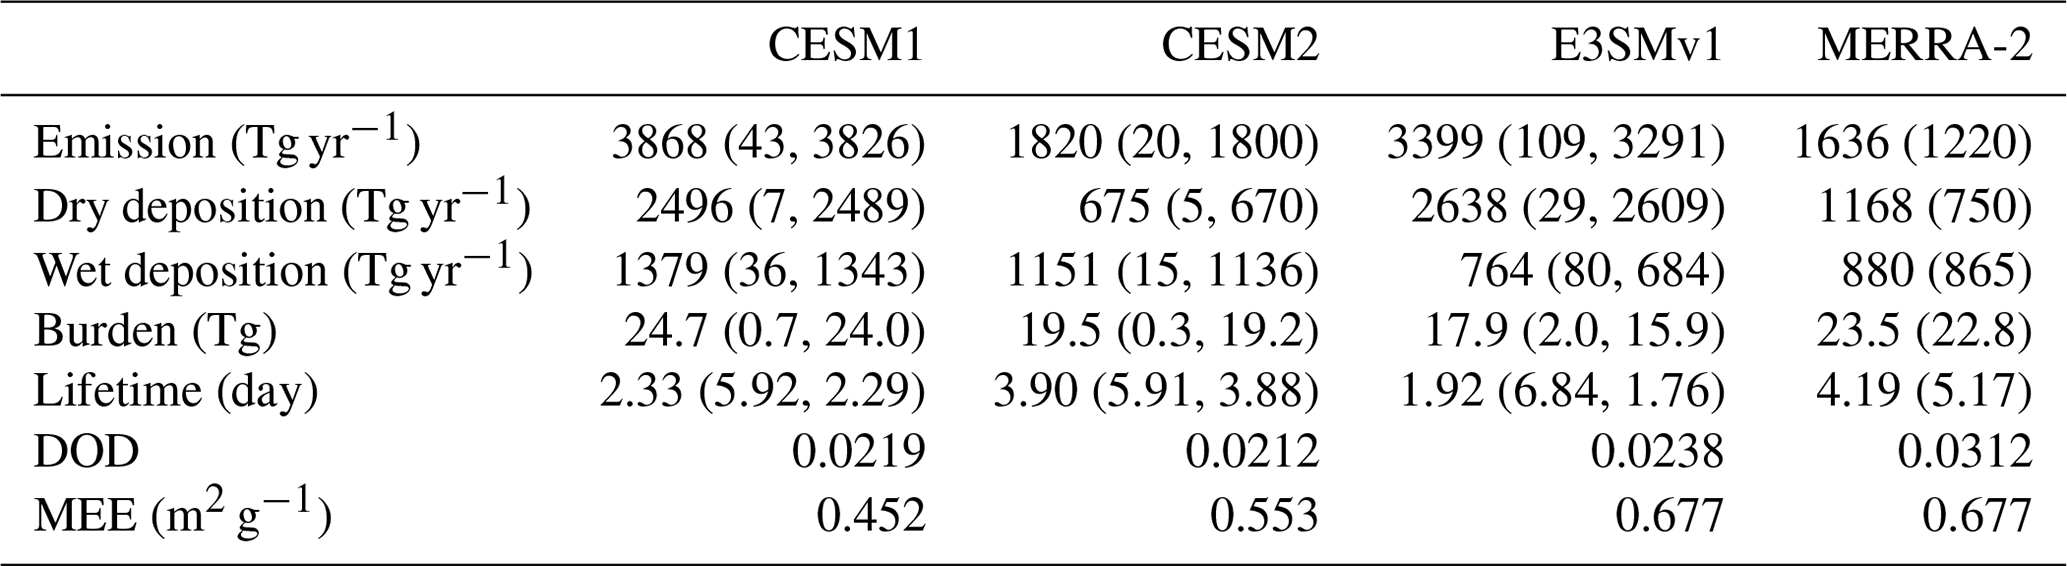
Note that the values in parentheses for CESM1, CESM2, and E3SMv1 correspond to the accumulation mode (0.1–1 µm) and coarse mode (1–10 µm), respectively; the values in parentheses for MERRA-2 correspond to bins 1–4 (0.2–12.0 µm).
As CESM2 has much less dust dry deposition than wet deposition, a larger fraction of dust is transported away from the major source regions in CESM2 than CESM1. Dust lifetime in CESM2 (3.90 d) is longer than that in CESM1 (2.33 d). E3SMv1 has a smaller dust burden and a shorter lifetime but larger DOD than CESM1 due to the larger dry deposition and higher mass fraction of dust in the accumulation mode, respectively. Since MERRA-2 has the largest mass fraction of fine dust and assimilates AOD, dust in MERRA-2 has the longest lifetime (4.19 d) and largest global mean DOD (0.0312), despite its lowest dust emission. Note that MERRA-2 has considerably larger dust deposition (dry and wet, 2048 Tg yr−1) than dust emission (1636 Tg yr−1), which is significantly imbalanced due to the assimilation of AOD. In remote regions where AOD is underestimated, the assimilation of AOD increases dust concentrations, resulting in the increase in dust deposition. MEE (DOD/dust burden) is often used for converting dust mass to DOD. As shown in Table 2, it varies from 0.452 (CESM1) to 0.677 m2 g−1 (MERRA-2). In Huneeus et al. (2011), MEE from AeroCom phase I models varies from 0.25 to 1.28 m2 g−1. Haywood et al. (2003) measured MEE of 0.37 m2 g−1 (0.32–0.43 m2 g−1) based on aircraft campaigns, which is used in many studies (e.g., Kaufman et al., 2005; Yu et al., 2015). Pu and Ginoux (2018) used a MEE of 0.6 m2 g−1 to convert dust burden simulated by CMIP5 models to DOD.
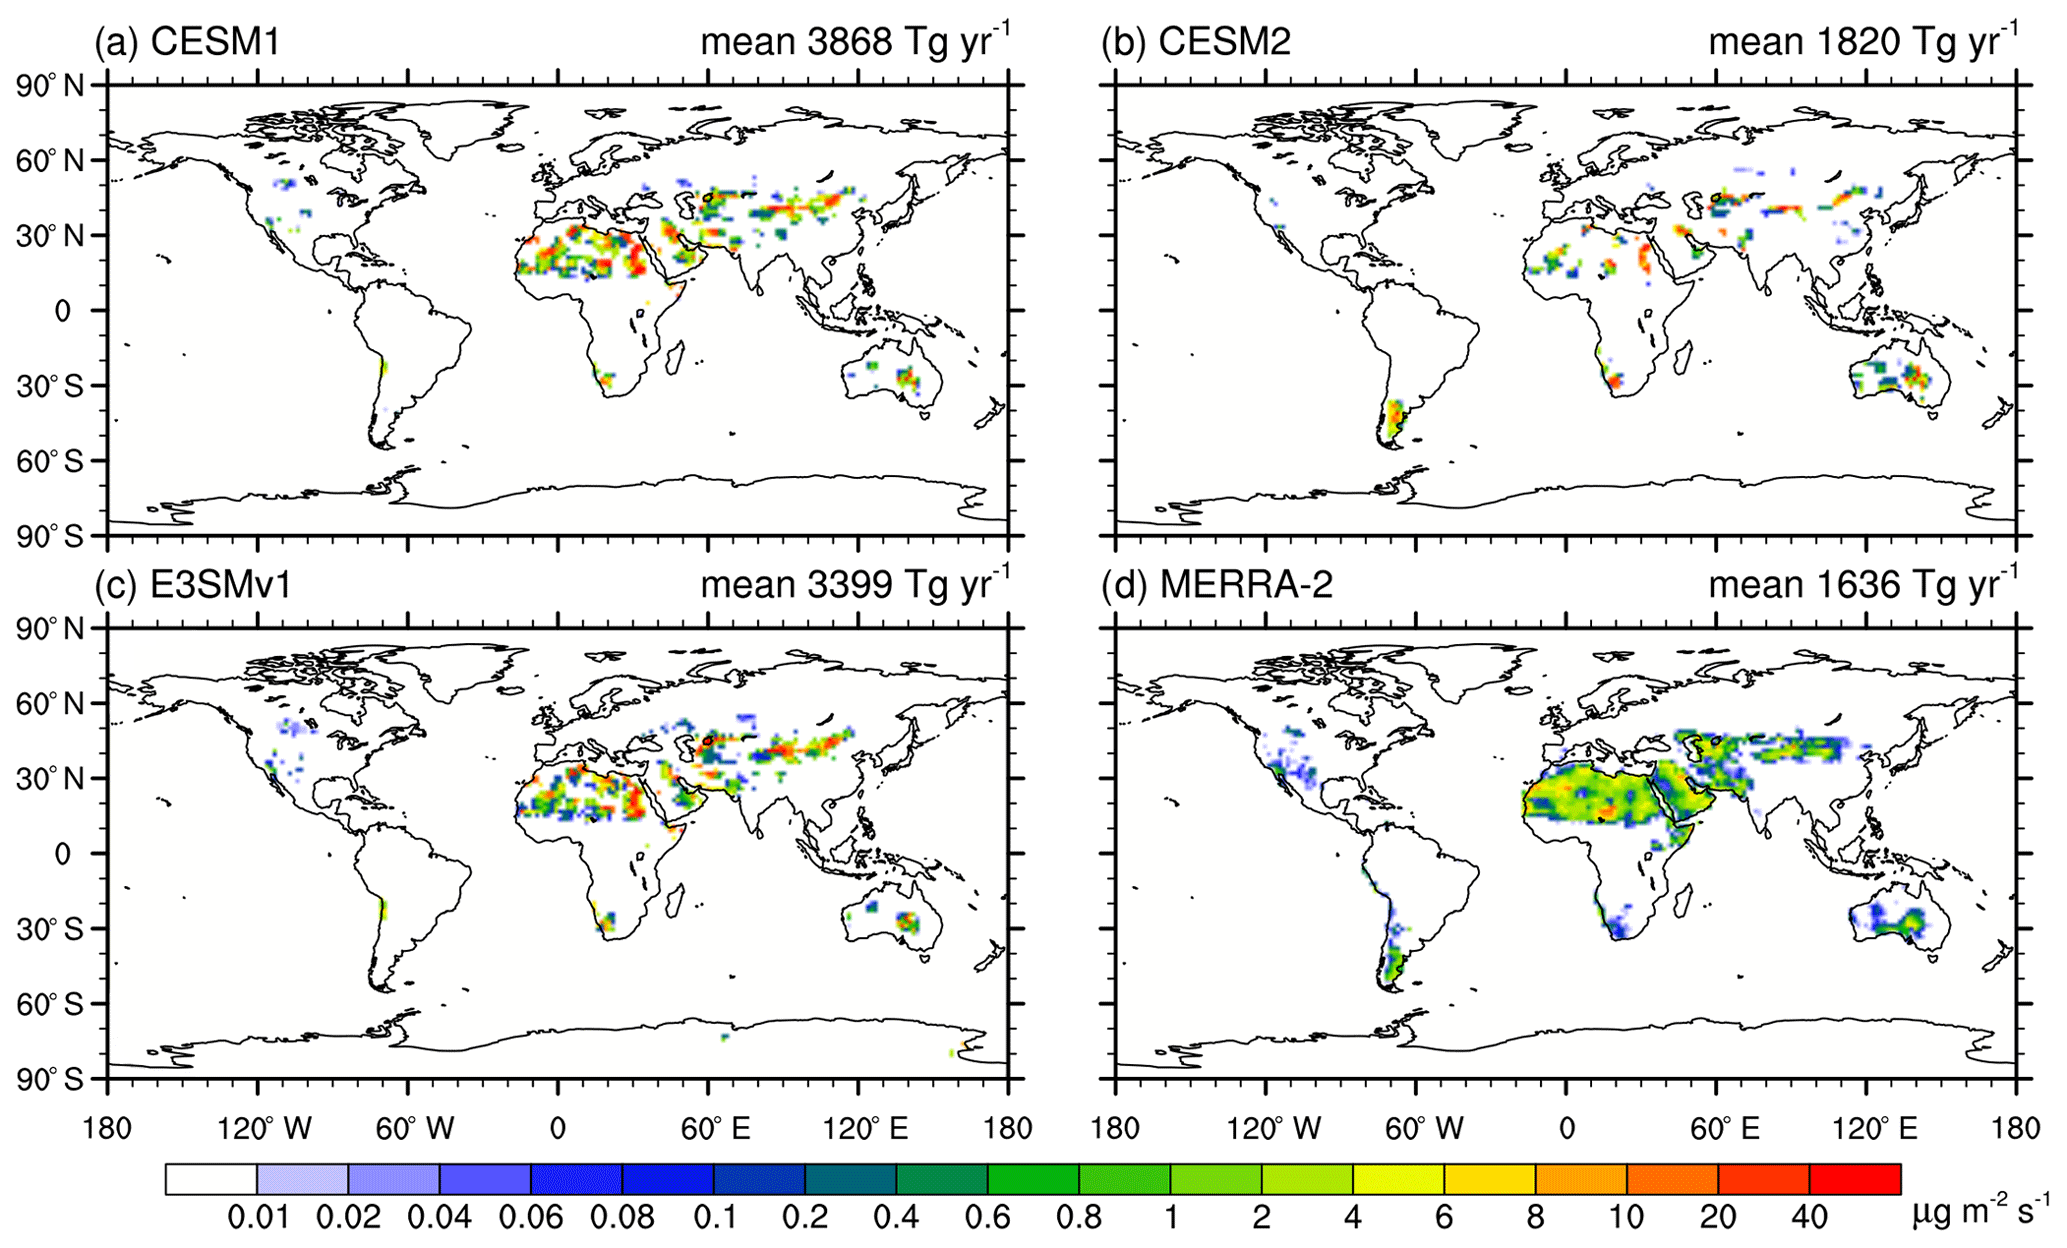
Figure 2Spatial distributions of global annual mean dust emission (µg m−2 s−1) from model experiments. The values are global annual mean dust emission.
Figure 2 shows the spatial distributions of global annual mean dust emissions from the model experiments. We can see that CESM1 (Fig. 2a) has similar spatial distributions of dust emission as E3SMv1 (Fig. 2c) due to the use of the same source function and dust emission scheme. Dust emission in MERRA-2 (Fig. 2d) spreads more uniformly than that in CESM1 and E3SMv1, while CESM2 (Fig. 2b) has smaller areas emitting mineral dust than CESM1 and E3SMv1. CESM2 has lower dust emission in main source regions, such as North Africa, the Middle East, and East Asia, but has much higher dust emission in South America, South Africa, and Australia than CESM1, E3SMv1, and E3SMv1. E3SMv1 produces a small amount of dust emission in the Antarctic (Fig. 2c) due to its low soil moisture along the coast of the Antarctic.
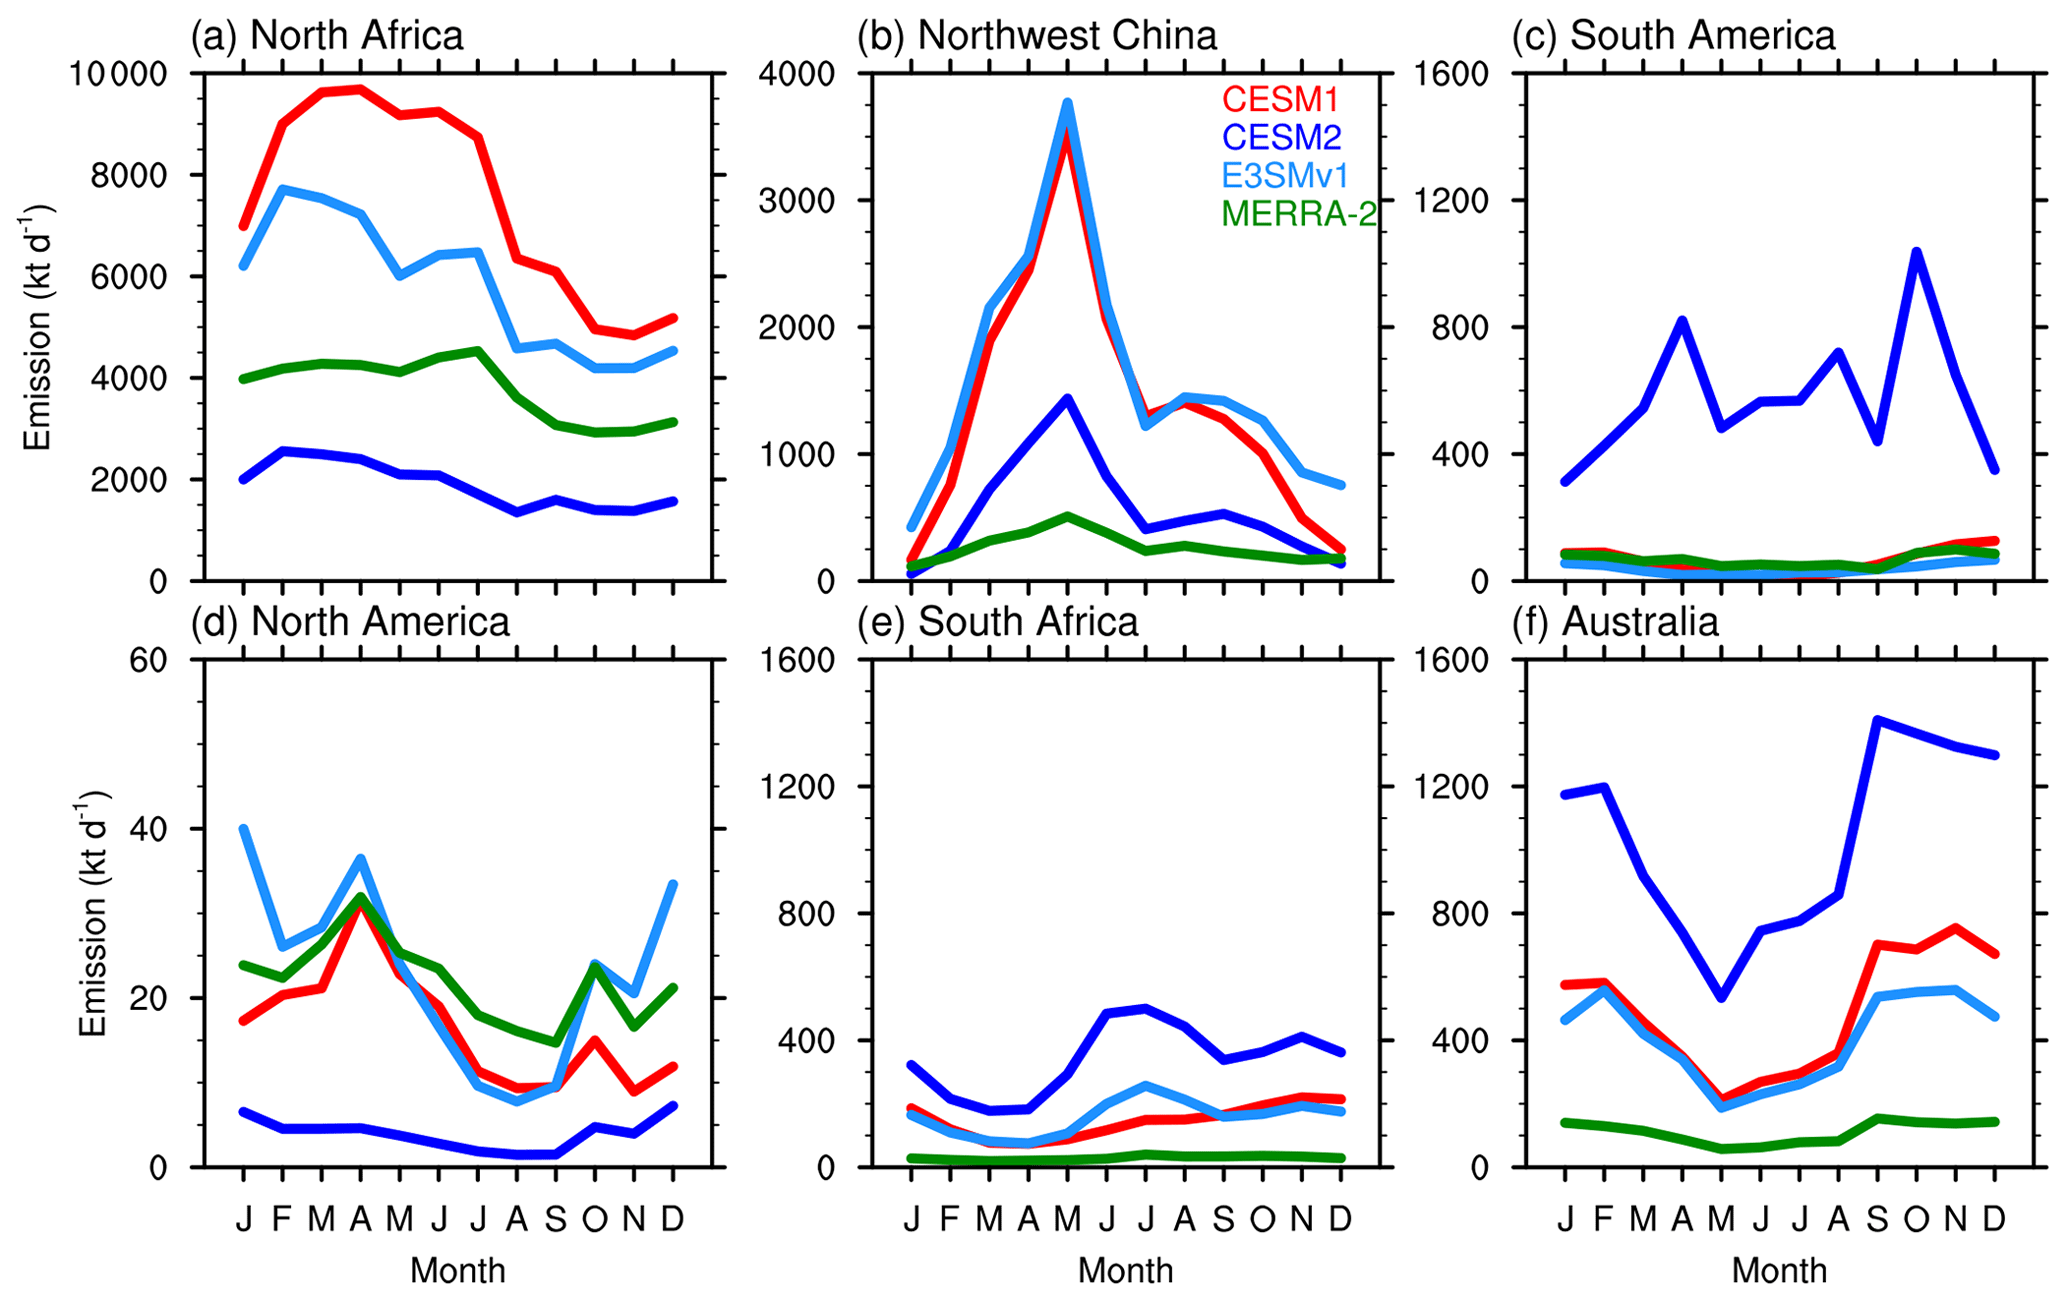
Figure 3Seasonal variations of dust emission (kt d−1) in source regions: (a) North Africa, (b) Northwest China, (c) South America, (d) North America, (e) South Africa, and (f) Australia.
Figure 3 shows the seasonal variations of dust emissions from model experiments in six source regions (Fig. 1a). In North Africa (Fig. 3a), CESM1 has the largest dust emission (5000–10000 kt d−1) with the strongest seasonality, while CESM2 has the lowest dust emission (∼ 2000 kt d−1). Dust emissions in CESM1, CESM2, E3SMv1, and MERRA-2 peak in April, February, February, and July, respectively. Although CESM1 and E3SMv1 use the same source function and dust emission scheme, E3SMv1 produces considerably lower dust emission than CESM1. Large differences of dust emission can also be found in Northwest China (Fig. 3b). However, dust emissions in the three models and one reanalysis have similar seasonality and all peak in May. E3SMv1 produces slightly higher dust emission than CESM1, especially from September to January. CESM1, CESM2, and MERRA-2 produces similar low dust emissions in December and January. In North America (Fig. 3d), CESM2 produces the lowest dust emission with the weakest seasonality among the three models and one reanalysis. In the Southern Hemisphere (SH) source regions (Fig. 3c, e and f), CESM2 produces much larger dust emission than CESM1, E3SMv1, and MERRA-2. In South America, the seasonality of dust emission in CESM2 is significantly different from those in other models, which results from the different location of dust emission (see Fig. 2).
Figure 4 shows the seasonal variations of dust burdens from model experiments in the 12 selected regions marked in Fig. 1a. In North Africa (Fig. 4a), CESM1 has the highest dust burden while CESM2 has the lowest dust burden. Although MERRA-2 produces much lower dust emission than E3SMv1, dust burden in MERRA-2 is larger than that in E3SMv1 due to a higher mass fraction of fine dust. Because the assimilation of AOD increases the dust concentrations on the trans-Atlantic pathway, MERRA-2 has the highest dust burden among the three models and one reanalysis across the Atlantic (Fig. 4e). In North America (Fig. 4i), dust burden in MERRA-2 is much larger than those in other models, whereas dust emission in MERRA-2 is similar to those in CESM1 and E3SMv1. This is due to the enhanced dust transport over the Pacific, which is further caused by the assimilation of AOD over the Pacific (see Fig. 4f and j). We can see that CESM2 produces the highest dust burden with the strongest seasonality in SH source regions (Fig. 4c, g, and k) due to its large dust emission. MERRA-2 has similar dust burden in the Arctic (Fig. 4d) as in Northwest China, indicating that MERRA-2 may overestimate dust burden in the Arctic.
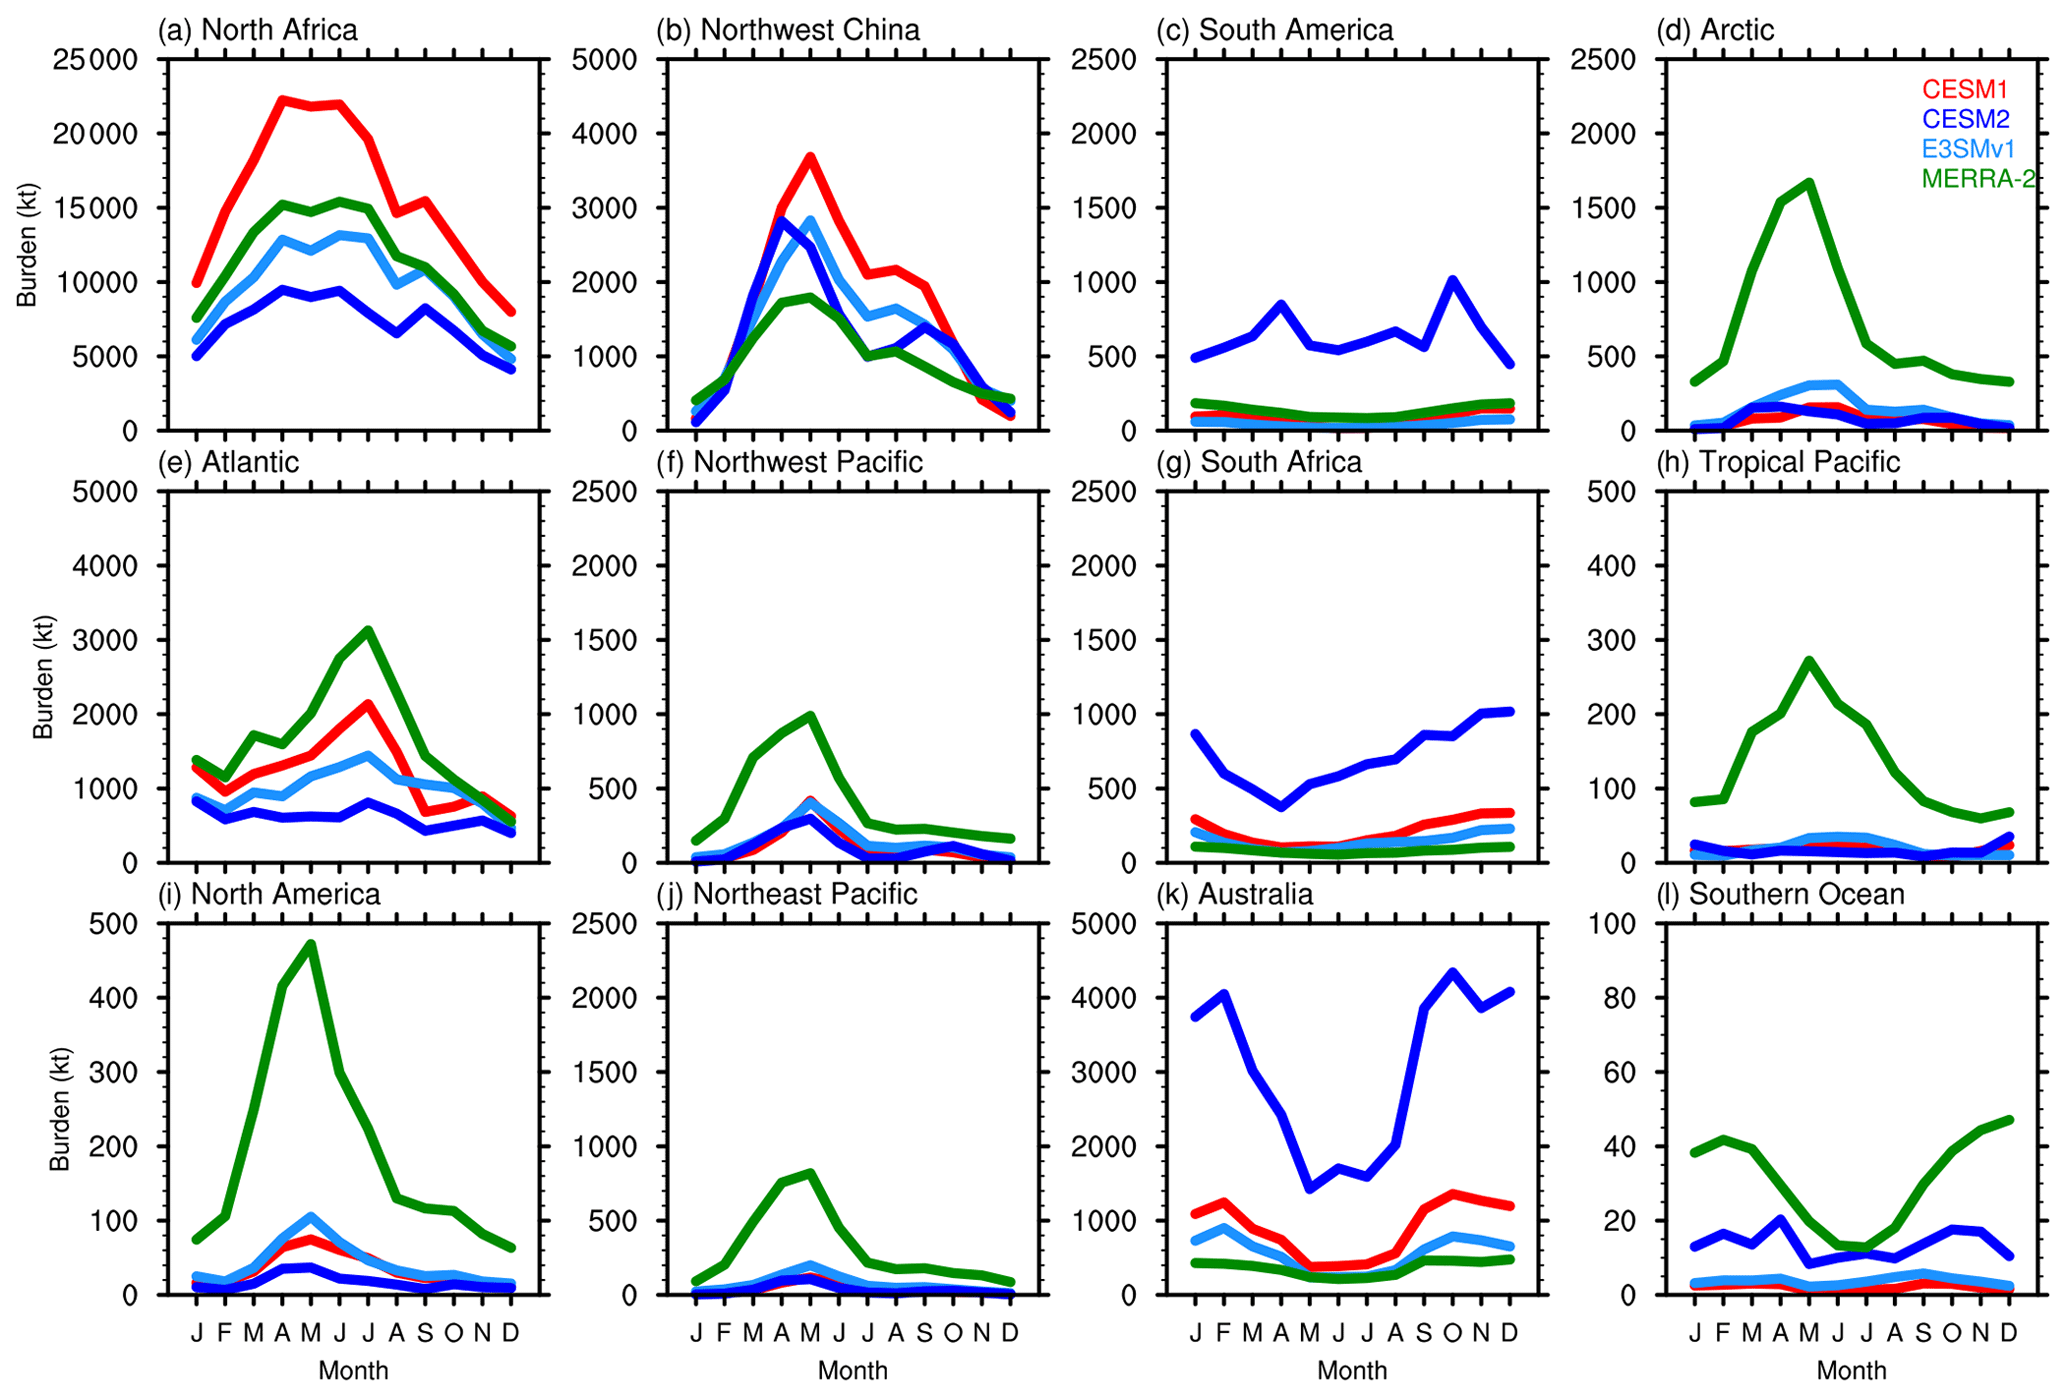
Figure 4Seasonal variations of dust burden (kt) from model experiments over 12 selected regions during 2007–2009.
3.2 Dust optical depth
Figure 5 compares the spatial distributions of modeled DOD with satellite retrievals from CALIOP (82∘ S–82∘ N), MODIS (60∘ S–60∘ N), and MISR (ocean, 60∘ S–60∘ N). The annual mean values are averaged between 60∘ S and 60∘ N for a better comparison. In general, CESM1, CESM2, and E3SMv1 underestimate global mean DOD compared with CALIOP (L15 and Y15) and MODIS; DOD in MERRA-2 is higher than CALIOP but is still much lower than MODIS DOD. CESM1 overestimates the land DOD (0.0678) compared with observations from L15 (0.0614) and Y15 (0.0625); DOD over land in E3SMv1 (0.0615) is between L15 and Y15. However, modeled DOD over ocean in CESM1 (0.0074), CESM2 (0.0087), and E3SMv1 (0.0094) is much lower than retrievals from L15 (0.0137) and Y15 (0.0181), which mainly contributes to the low model biases of global mean DOD. This indicates that CESM1, CESM2, and E3SMv1 underestimate dust transport to remote regions (e.g., Arctic and Southern Ocean). In the Northern Hemisphere (NH), CESM2 produces the lowest DOD over major source regions such as North Africa, the Middle East, and East Asia among the three models and one reanalysis due to its low dust emission. Since E3SMv1 has higher mass fraction (3.2 %) of accumulation mode dust than CESM1 and CESM2 (1.1 %), it performs better than CESM1 and CESM2 and simulates more dust transport to the Arctic. In SH, CESM2 produces much larger DOD in South America, South Africa, and Australia than CALIOP due to high dust emission in these three source regions (see Fig. 3), which also leads to a higher DOD over the Southern Ocean than other models and improves the agreement with observations. MERRA-2 tends to have the best agreement with CALIOP in DOD, especially in remote regions, which can be attributed to the assimilation of AOD from satellites and ground-based measurements and high mass fraction of emitted fine dust.
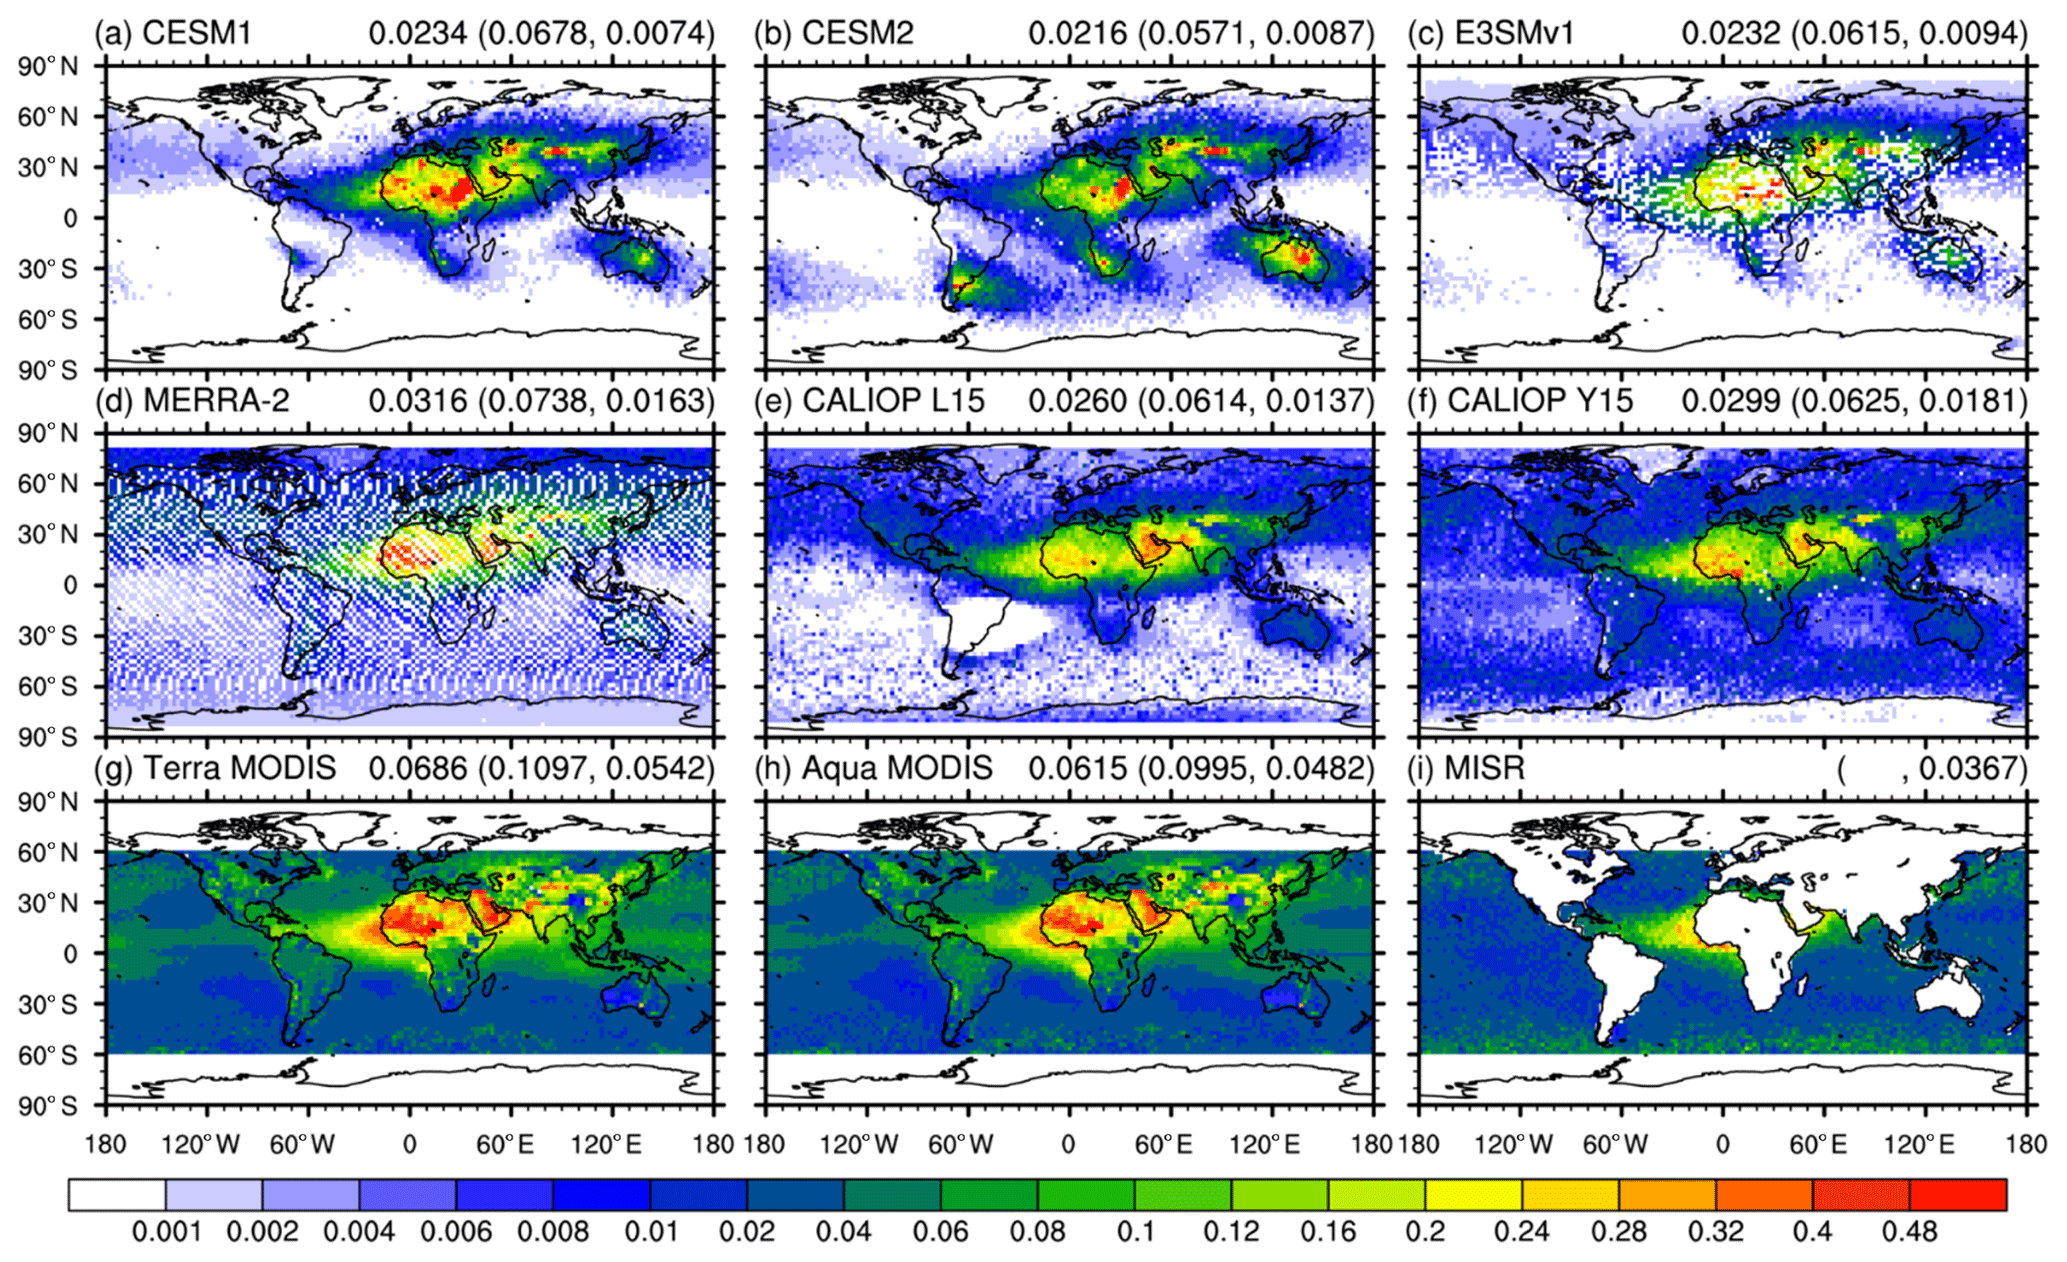
Figure 5Spatial distributions of global annual mean DOD from model experiments, CALIOP, MODIS, and MISR during 2007–2009. We integrate the collocated dust extinction profiles from the three models and one analysis to get the nighttime DOD values. DOD from MODIS and MISR is for daytime. The values are annual mean DOD between 60∘ S and 60∘ N. The values in the parentheses are annual mean DOD over land and ocean, respectively. The stripe pattern of white space in panels (c) and (d) is due to the date collocation.
Comparing to the DOD estimates from AeroCom models (0.028 ± 0.011, Huneeus et al., 2011) and Ridley et al. (2016) (0.030 ± 0.005), global mean DOD in MERRA-2 and Y15 is close to the global mean value from Ridley et al. (2016); DOD from model experiments is within the uncertainty range of AeroCom models. MODIS DOD (> 0.06) is substantially larger than CALIOP DOD (< 0.03). MISR DOD over ocean is between CALIOP and MODIS DOD. Large uncertainties also exist in DOD retrievals from different sensors, which can affect the model evaluation. The DOD differences between MODIS and CALIOP can come from two main aspects: (1) the differences between AOD retrieved from MODIS and CALIOP and (2) the differences of retrieval algorithms in separating DOD from AOD.
Previous studies found that MODIS and MISR AOD agrees reasonably well with AERONET (e.g., Sayer et al., 2014; Garay et al., 2020), while CALIOP AOD has a notable low bias (e.g., Schuster et al., 2012; Omar et al., 2013; Kim et al., 2018). Sayer et al. (2014) evaluated C6 DB, DT, and merged AOD from MODIS Aqua against AERONET observations at 111 sites during 2006–2008. A small median bias of −0.0047 for merged AOD was found if the three products are validated independently. Garay et al. (2020) showed that MISR level 2 V23 AOD has a low bias of −0.002 compared with AERONET observations. Schuster et al. (2012) compared CAL-L2 version 3 AOD with measurements at 147 AERONET sites from June 2006 to May 2009. They found that CALIOP AOD has relative and absolute biases of −13 % and −0.029, which is mainly caused by low biases for columns that contain dust subtype. This indicates that a higher lidar ratio (> 40 sr) may be needed to improve CALIPSO dust retrievals. Ma et al. (2013) compared CAL-L3 version 1.00 AOD with MODIS C5 AOD from 2006 to 2011 and found a low bias. Global annual mean AOD from nighttime CAL-L3 over ocean is 0.089, while MODIS AOD over ocean is 0.148 and 0.140 for Terra and Aqua, respectively. Ma et al. (2013) also showed that CAL-L3 has lower AOD than MODIS over major dust source regions. More recently, Kim et al. (2018) evaluated CAL-L2 version 3 and 4.10 AOD against measurements from 176 AERONET sites and MODIS level 2 C6 products from 2007 to 2009. They found that global annual mean CAL-L2 AOD has increased from 0.084 in version 3 to 0.128 in version 4.10 for nighttime, which is mostly due to lidar ratio revisions for different aerosol subtypes. The low AOD bias relative to AERONET is improved from −0.064 in version 3 to −0.051 in version 4.10.
MODIS DOD is subject to cloud contamination that can cause a high bias in DOD (e.g., Zhang et al., 2005). In Fig. 5g and h, we can see the apparent discontinuity along the tropical African coast, because MODIS DOD is derived from DB and DT products over land and ocean, respectively. In addition, MODIS DOD derived from Dark Target products over the turbid-water coastal region is subject to high bias due to the underestimation of surface reflectance. Since Eq. (1) is used to calculate the coarse-mode AOD in Anderson et al. (2005) and we derived DOD only when AOD is mainly contributed by dust (α < 0.3, ω < 1), MODIS DOD over land may be subject to high bias. Unlike passive sensors, CALIOP may do a better job in discriminating dust from clouds and other types of aerosols and providing the vertical distributions of dust. However, CALIOP cannot penetrate optically thick cloud layers due to strong attenuation of the signals, missing the lowest part of aerosol plumes. CALIOP also fails to detect tenuous dust layers due to weak signals. Notable differences are found between MODIS DOD from Terra (0.0686) and Aqua (0.0615) as well, which can be attributed to the calibration issues of MODIS Terra (e.g., Levy et al., 2018). Ma and Yu (2015) showed that MISR AOD over ocean (0.157) is higher than MODIS Aqua AOD over ocean (0.139). MISR DOD over ocean, especially over the Southern Ocean, may be biased high due to artifacts (e.g., Witek et al., 2013). In this study, we use the latest version (V23) of MISR aerosol products, which significantly reduces AOD over ocean compared to the previous V22 products (Garay et al., 2020).
Table 3Global seasonal mean DOD (60∘ S–60∘ N).
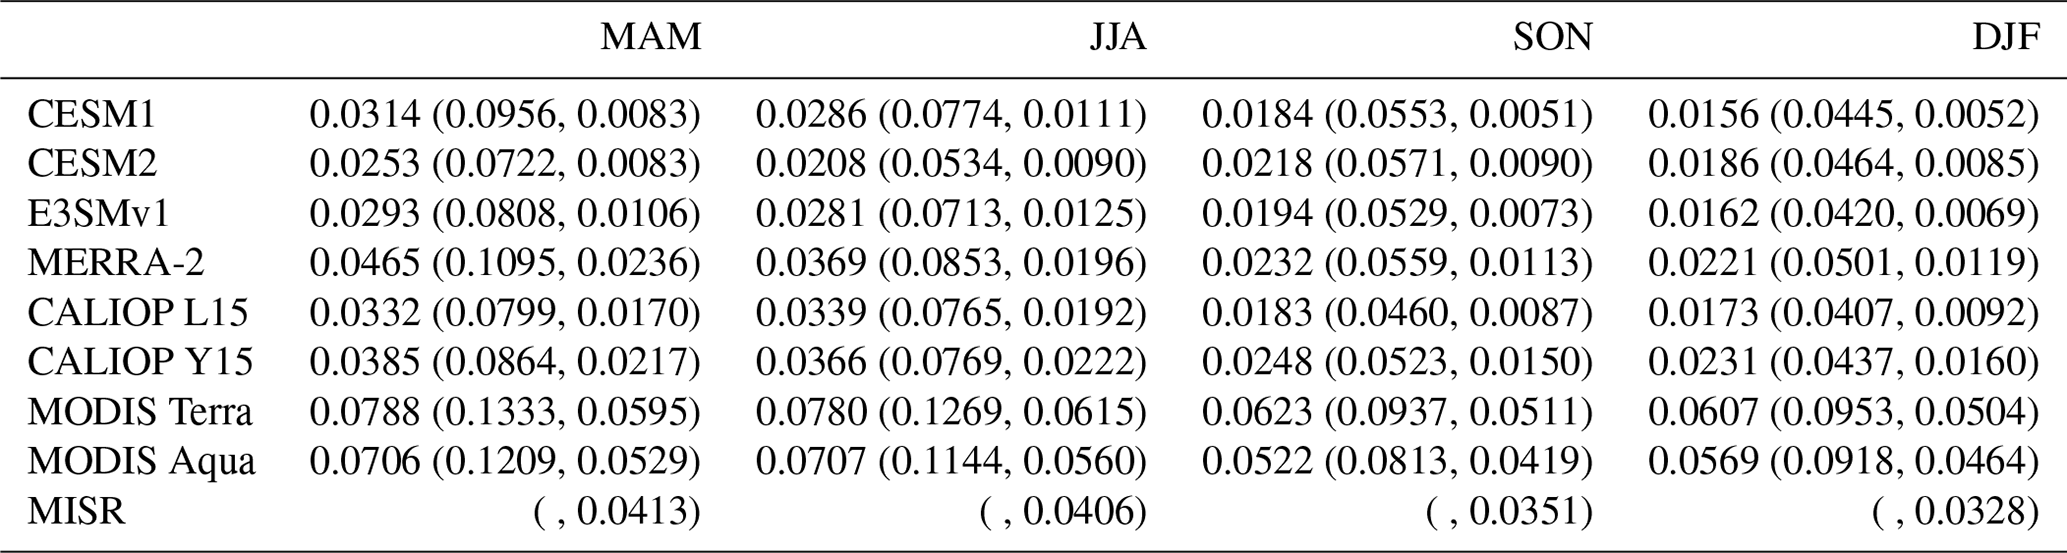
Note that the values in parentheses are for land and ocean, respectively.
Table 3 gives the global seasonal mean DOD (averaged over 60∘ S–60∘ N) from model experiments and satellite observations. CESM1, CESM2, and E3SMv1 underestimate global mean DOD in all seasons compared with MODIS and CALIOP, which is mainly attributed to the low model biases of DOD over ocean. DOD from model experiments, Y15, and Terra MODIS all peaks in MAM (March–April–May) and reaches its minimum in DJF (December–January–February) due to the seasonal variations of global dust emission. However, DOD from L15 and Aqua MODIS slightly increases from MAM to JJA (June–July–August) and peaks in JJA. Notable decreases in DOD from MAM to JJA are found in model experiments. The decrease ranges from 0.0012 (E3SMv1) to 0.0096 (MERRA-2), while DOD from Terra MODIS and Y15 slightly decreases by 0.0008 and 00019, respectively. Unlike observations and other models, DOD from CESM2 increases from JJA to SON (September–October–November), which can be attributed to the overestimation of dust emission in SH. CESM2 also has the weakest seasonal contrast, and the DOD difference between MAM and DJF is only 0.0067. MERRA-2 has the strongest seasonal contrast, and the DOD difference between MAM and DJF is 0.0244.
We further examine the dust transport across the Atlantic (0–35∘ N) and Pacific (30–60∘ N) by comparing the meridional means of modeled DOD with satellite retrievals from CALIOP, MODIS (combined Terra and Aqua), and MISR, as shown in Fig. 6. In Fig. 6a, satellite retrievals of DOD show high values in North Africa (15∘ W–30∘ E). As dust is transported from North Africa to the Atlantic, DOD gradually decreases. In the source regions, MODIS and CALIOP DOD all peaks between 5∘ W and 5∘ E, whereas DOD from CESM1, CESM2, and E3SMv1 peaks in Northeast Africa (30∘ E) determined by the geomorphic source function used in the models. Although MERRA-2 captures the meridional variations of DOD well due to the use of a topographic source function, it overestimates the DOD compared with CALIOP. This may be caused by the contribution of very coarse dust (10–20 µm) and high mass fraction of fine dust (0.1–1 µm). DOD in E3SMv1 agrees the best with CALIOP DOD among the three models. CESM1 produces substantially larger DOD (0.25-0.38) in Northeast Africa (15–30∘ E) than CALIOP but agrees well with CALIOP in Northwest Africa (15∘ W–5∘ E). CESM2 significantly underestimates DOD (∼ 0.1) in Northwest Africa (15∘ W–5∘ E) compared with CALIOP due to its underestimation of dust emission (see Fig. 3a).
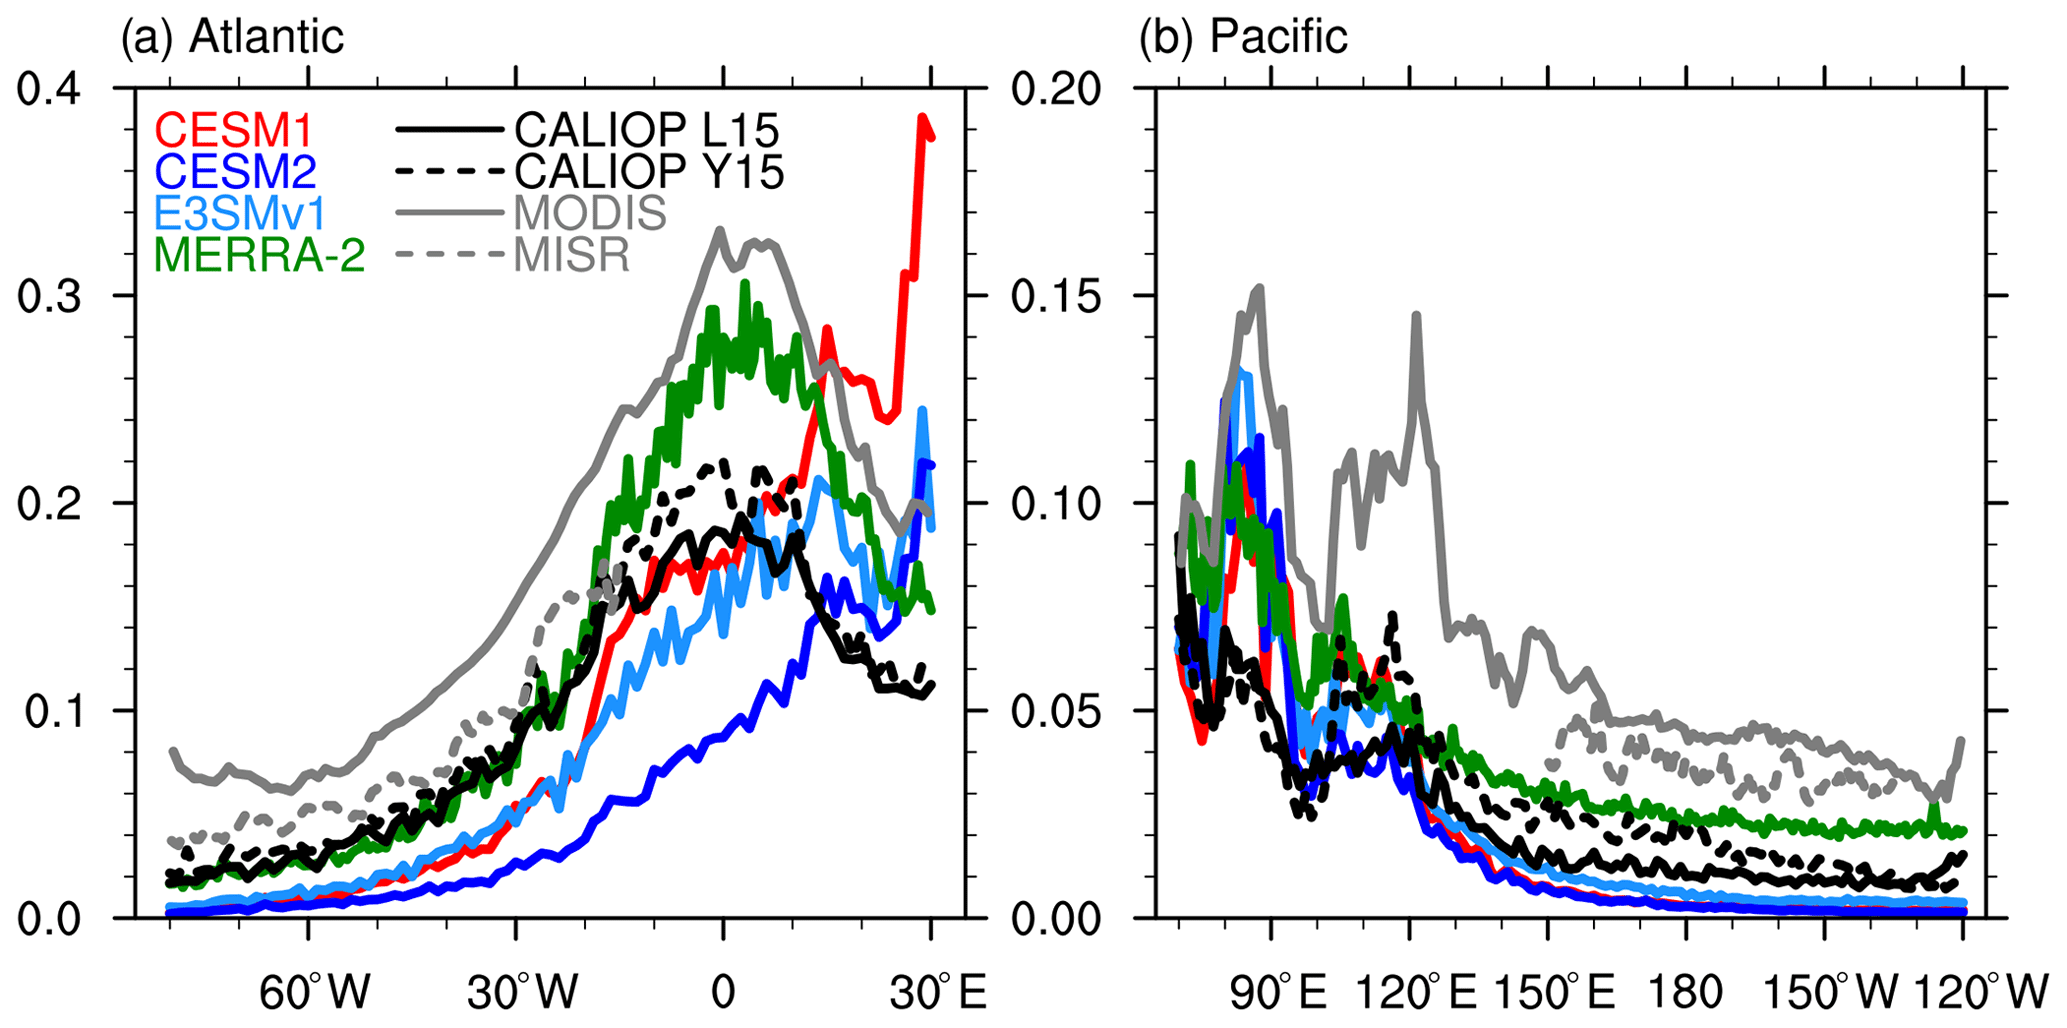
Figure 6Meridional mean of DOD from model experiments, CALIOP, MODIS, and MISR across the (a) Atlantic (0–35∘ N) and (b) Pacific (30–60∘ N).
Over the entire Atlantic, modeled DOD in CESM1, CESM2, and E3SMv1 is lower than observations, which may result from the fast deposition and short lifetime (see Table 2). E3SMv1 performs better than CESM1 and CESM2 because of its higher mass fraction of fine dust. Although DOD in MERRA-2 agrees well with CALIOP DOD over the Atlantic, it tends to have much faster drop than CALIOP along the transport pathway, especially between 20∘ W and 0∘. This suggests that dust in MERRA-2 may also deposit too fast. The decline rate of DOD in E3SMv1 agrees well with that in CALIOP. Because of the reduced σg and wider Dgn range in the coarse mode in CESM2 (Table 1), dust dry deposition decreases, and dust lifetime increases significantly, which explains the weak longitudinal gradient of DOD in CESM2. Similar conclusions can be drawn from Fig. 6b for dust transport across the Pacific. CESM1, CESM2, and E3SMv1 underestimate DOD over the Pacific but overestimate DOD in source regions (i.e., Taklamakan and Gobi Desert) of East Asia compared with CALIOP. DOD from MERRA-2 is higher than CALIOP over both East Asia and the Pacific. Large disparities of DOD from CALIOP, MODIS, and MISR are found over both land and ocean. CALIOP DOD is lower than MODIS DOD, and the differences are larger over land (∼ 0.1). MISR DOD over ocean is close to CALIOP DOD over the Atlantic and MODIS DOD over the Pacific.
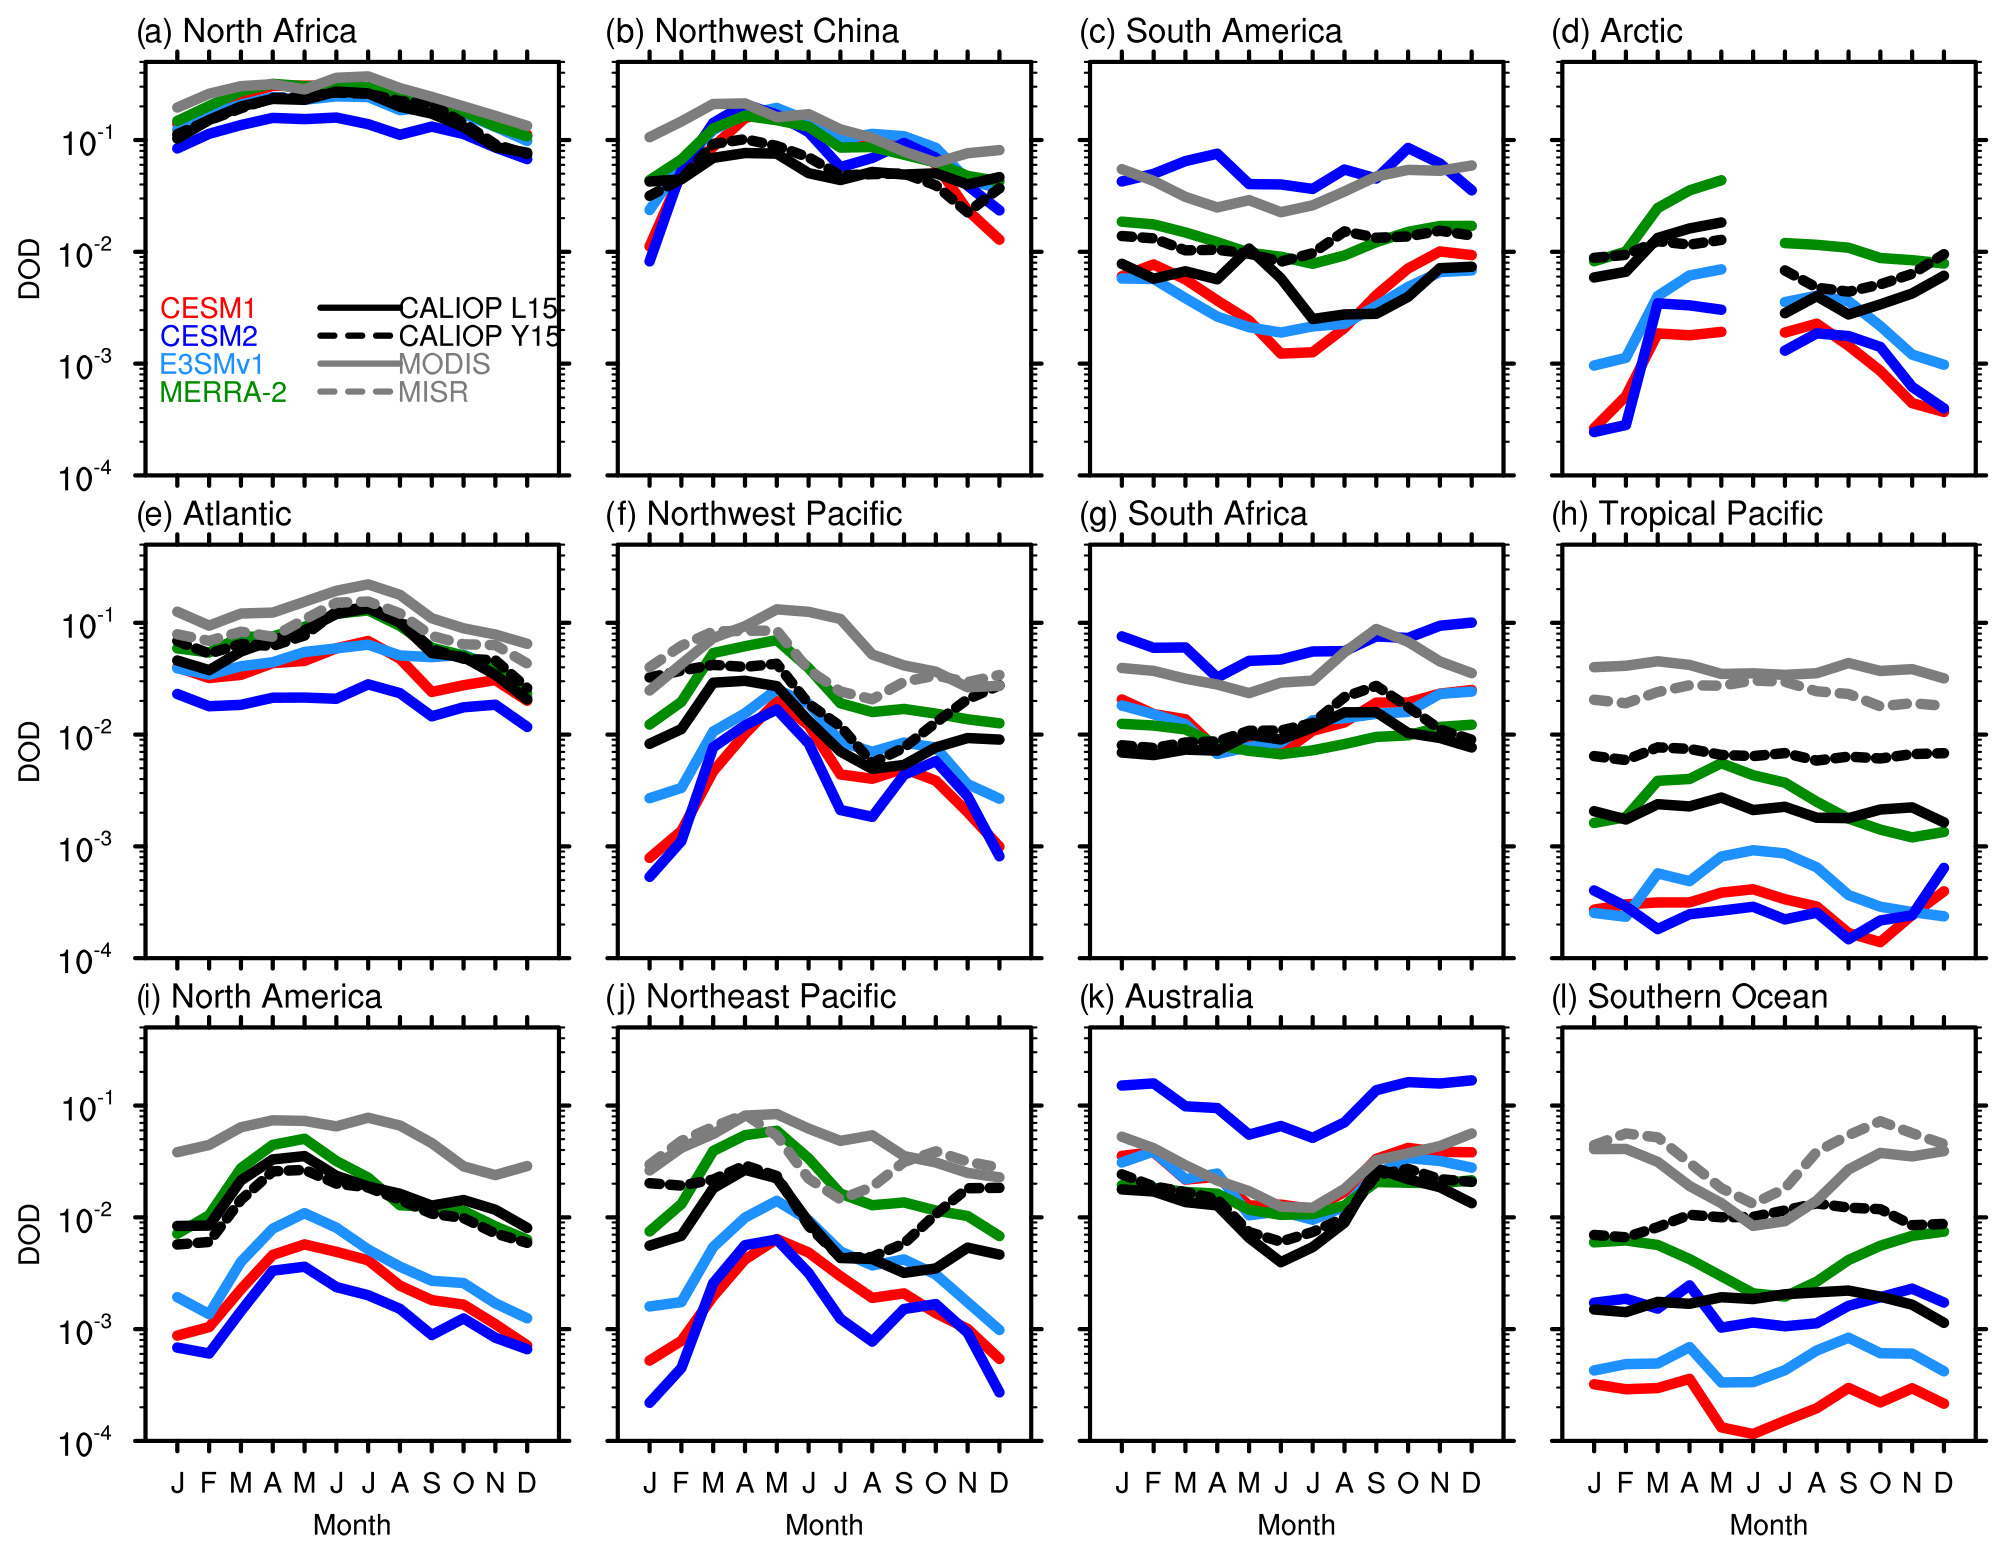
Figure 7Seasonal variations of DOD from model experiments, CALIOP, MODIS, and MISR over 12 selected regions during 2007–2009. The gap in panel (d) is due to the missing of nighttime data during the polar day.
Figure 7 shows the seasonal variations of modeled DOD in comparison with satellite retrievals from CALIOP, MODIS, and MISR at 12 selected regions. In North Africa (Fig. 7a), CESM2 significantly underestimates DOD in MAM, JJA, and SON due to its low dust emission (see Figs. 3a and 4a). DOD in E3SMv1 agrees well with CALIOP DOD, while CESM1 and MERRA-2 overestimates DOD in all seasons compared with CALIOP. Over the Atlantic (Fig. 7e), DOD in MERRA-2 agrees well with CALIOP DOD in all seasons, while E3SMv1 underestimates DOD in MAM and JJA. This suggests that wet removal of dust in E3SMv1 over the Atlantic in MAM and JJA may be too strong. In North America (Fig. 7i), CESM1, CESM2, and E3SMv1 produce much lower DOD due to the underestimation of dust transport across the Pacific. MODIS DOD peaks in July similar to the seasonality of trans-Atlantic dust transport, while CALIOP DOD peaks in May similar to the seasonality of trans-Pacific dust transport. Unlike North Africa, all models overestimate DOD in MAM, JJA, and SON compared with CALIOP in Northwest China (Fig. 7b) due to overestimation of dust emission. Because E3SMv1 has larger dust emission than CESM1 and CESM2 in DJF (Fig. 3b), the low bias of DOD is improved. This suggests that CESM1 and CESM2 may underestimate dust emission in DJF over Northwest China. Over the Pacific (Fig. 7f and j), DOD in E3SMv1 agrees well with CALIOP DOD from May to October, while CESM1 and CESM2 underestimate DOD in all seasons, especially in DJF by over 1 order of magnitude. DOD in all models and MODIS reaches its minimum in December or January, whereas CALIOP DOD has its minimum in August.
Figure 7c, g, and k focus on the source regions in SH. The seasonal variations of DOD in SH are opposite to NH due to opposite seasons in SH. CESM2 significantly overestimates DOD in all seasons compared with CALIOP, by 1 order of magnitude due to the overestimation of dust emission, while CESM1, E3SMv1, and MERRA-2 perform reasonably well. Figure 7d, h, and l focus on the three remote regions where the largest disagreements between model simulations and observations are found. In the Arctic (Fig. 7d), CESM1, CESM2, and E3SMv1 all have low biases of DOD, but E3SMv1 performs better than CESM1 and CESM2, especially in DJF. CESM2 performs slightly better than CESM1 due to the reduced σg and wider Dgn range in the accumulation and coarse mode. MERRA-2 overestimates DOD compared with CALIOP due to excessive dust transport from NH source regions. Over the Tropical Pacific (Fig. 7h), CALIOP, MODIS, and MISR DOD all show small seasonal contrast, while MERRA-2 shows considerable seasonal contrast of DOD with its maximum in May and its minimum in November, which is influenced by dust transport over the North Pacific. In the Southern Ocean (Fig. 7l), MODIS and MISR DOD has much stronger seasonal variations than CALIOP DOD. Because of the assimilation of AOD, MERRA-2 also has opposite seasonal variations to CALIOP DOD as MODIS and MISR. The difference in the seasonality of retrieved DOD may come from cloud contamination over the Southern Ocean. In the selected regions, DOD from Y15 is generally larger than that from L15, because the differences in retrieval algorithms lead to higher dust extinction in the lower troposphere for Y15.
3.3 Dust extinction
Figure 8 compares annual mean vertical profiles of modeled dust extinction with satellite retrievals from L15 and Y15 in 12 selected regions. In North Africa (Fig. 8a), modeled dust extinction agrees well with observations from L15 and Y15 in the lower and middle troposphere (> 500 hPa). In the upper troposphere (< 400 hPa), significant high model biases of dust extinction are found in all models and over 1 order of magnitude in CESM1 and MERRA-2, which comes from JJA and SON (see Figs. S2–S5). It is likely due to excessive convective transport (e.g., Allen and Landuyt, 2014) and lack of secondary activation of aerosols entrained into convective updrafts (e.g., Wang et al., 2013; P. Yu et al., 2019) in the models. As E3SMv1 uses a unified aerosol convective transport scheme with secondary activation (Wang et al., 2013, 2020), the high model biases of dust extinction are reduced. Due to its lower dust emission in North Africa (Fig. 3a), less dust is lifted up throughout the troposphere in CESM2 than in the other models. MERRA-2 has the largest high biases of dust extinction in the upper troposphere because of its highest fine-mode mass fraction. As dust is transported to the Atlantic, the dust extinction decreases at all levels (Fig. 8e). Dust extinction in E3SMv1 agrees well with CALIOP. CESM1 underestimates dust extinction below 500 hPa but overestimates dust extinction above 500 hPa. MERRA-2 agrees well with the observations below 500 hPa but is much larger than observations in the upper troposphere. In North America (Fig. 8i), CESM1, CESM2, and E3SMv1 greatly underestimate dust extinction in the lower troposphere by 1 order of magnitude. The low model biases reach the maximum in JJA (Fig. S3) and the minimum in DJF (Fig. S5). Since MERRA-2 has similar dust emission as CESM1 and E3SMv1 but only slightly underestimates dust extinction in the lower troposphere. The low biases of dust extinction in CESM1, CESM2, and E3SMv1 are mainly caused by the underestimation of dust transport across the Pacific. We can see that in the Northeast Pacific (Fig. 8j) MERRA-2 and L15 still have dust extinction of 0.001–0.002 km−1 in the bottom layer. The high biases of dust extinction in MERRA-2 above 600 hPa are consistent with the overly strong transport across the Atlantic and Pacific.
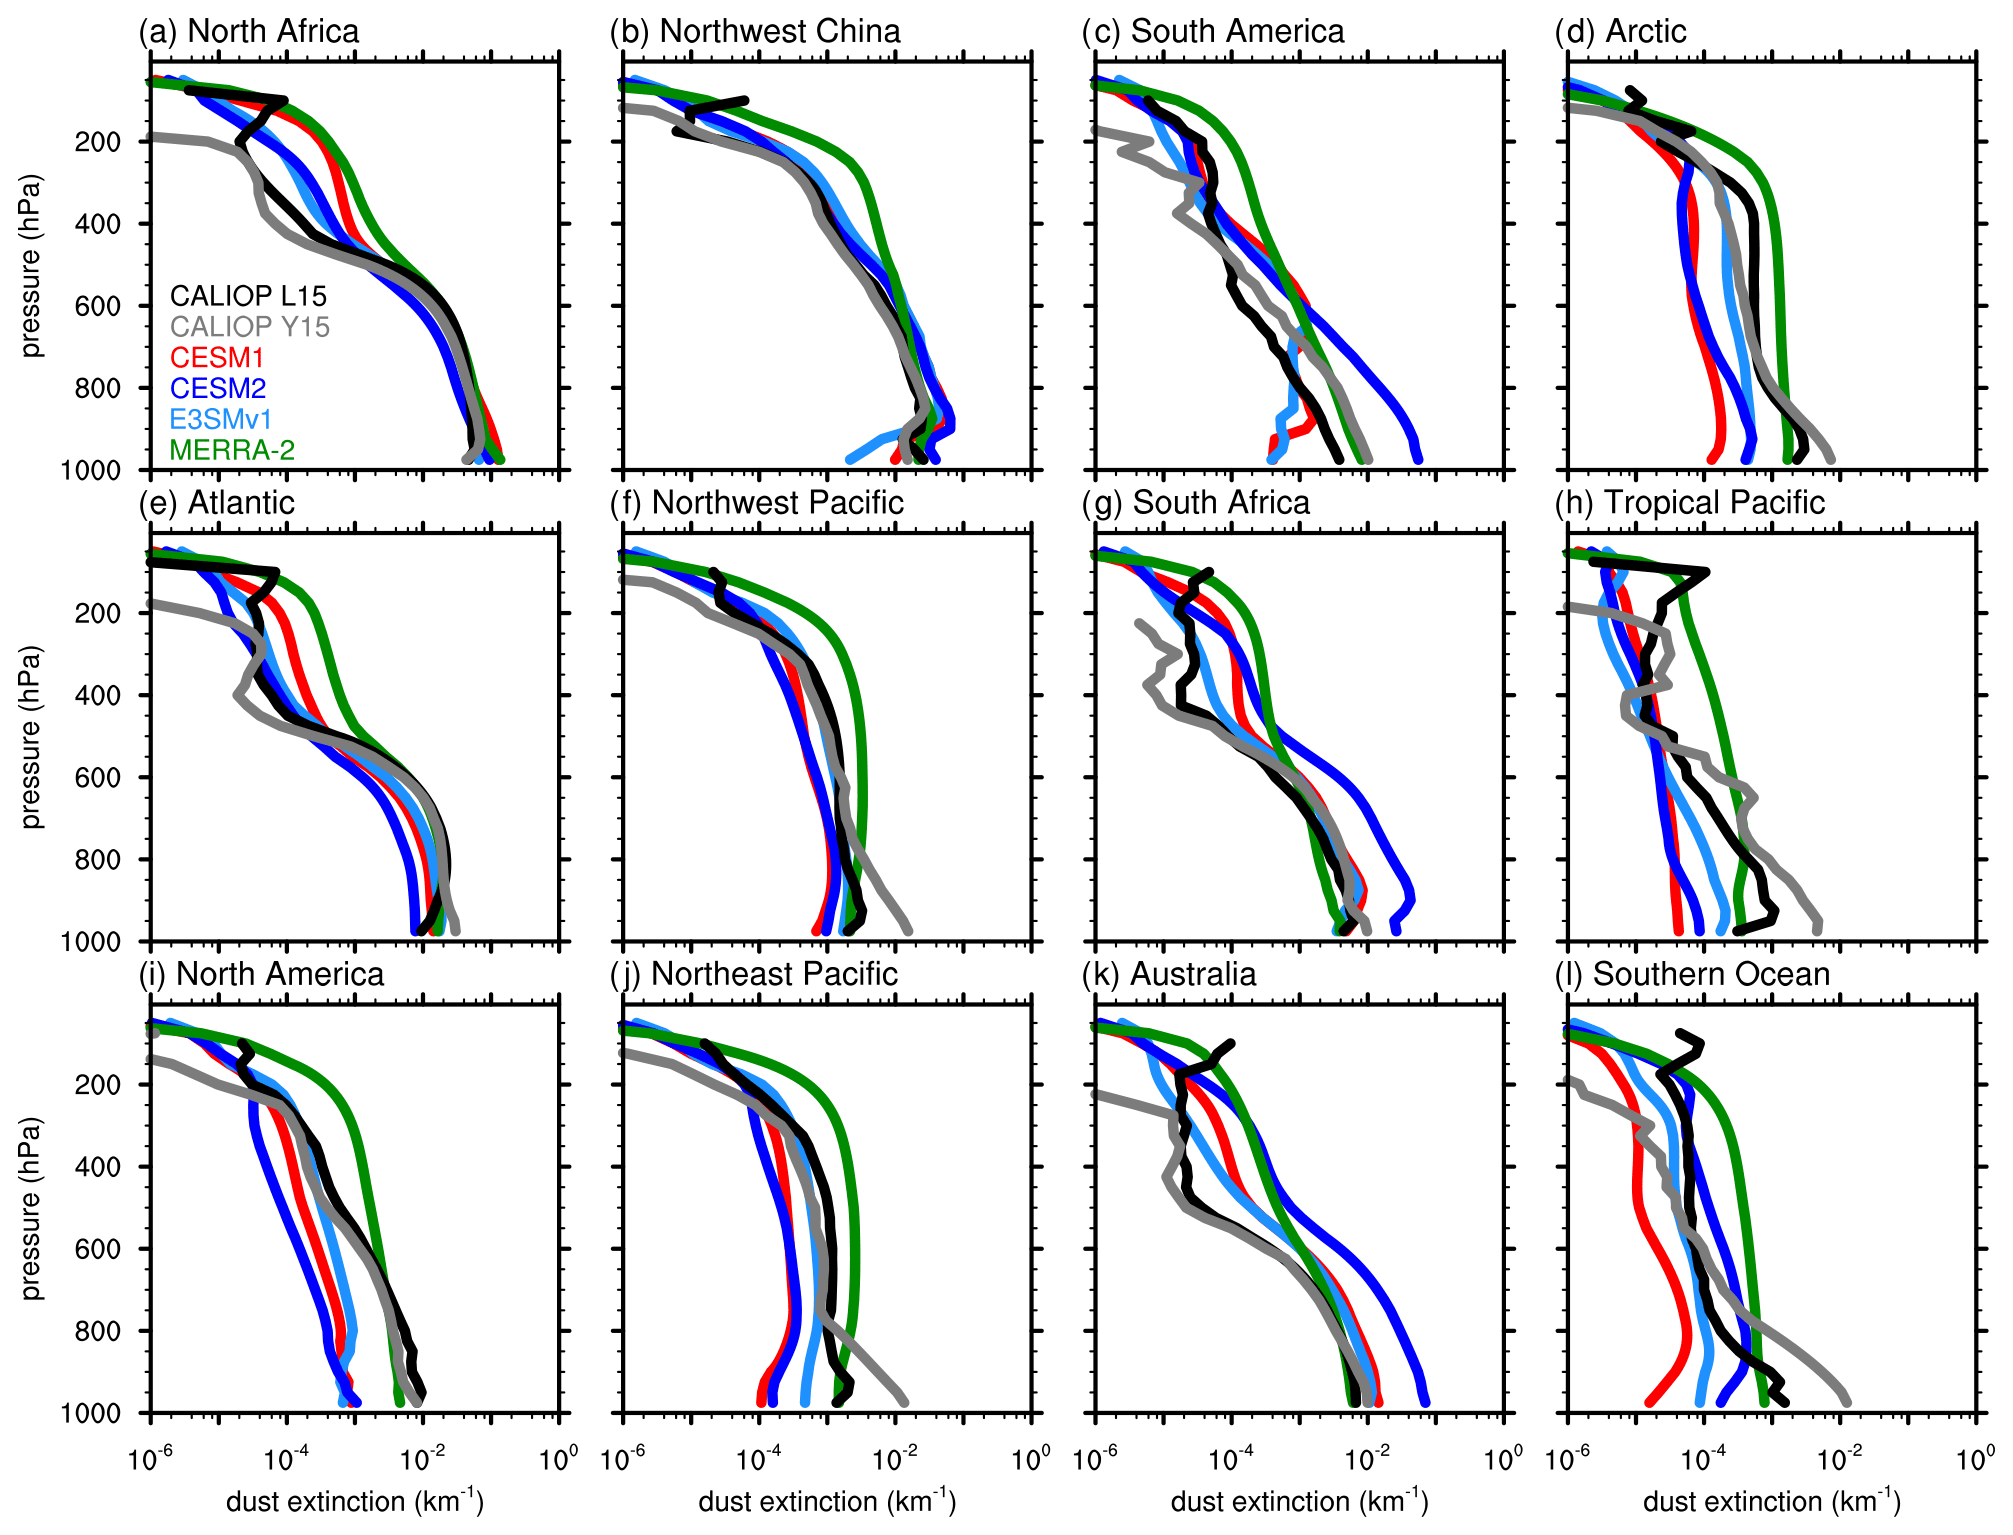
Figure 8Vertical profiles of annual mean dust extinction (km−1) from model simulations and CALIOP over 12 selected regions during 2007–2009.
As shown in Fig. 8b, f, and j, CESM1, CESM2, and E3SMv1 have high biases of dust extinction in Northwest China but low biases over the Pacific. The magnitude of the low biases of dust extinction peaks in DJF (Fig. S5), which corresponds to the low biases of DOD in Fig. 7. CALIOP dust extinction profiles vary little across the Pacific, while dust extinction at all levels in CESM1, CESM2, and E3SMv1 decreases notably, resulting in the increase in low biases of DOD with distance from the source. MERRA-2 overestimates dust extinction above 800 hPa over the Pacific and shows a slight increase from 1000 to 600 hPa. This indicates that MERRA-2 significantly overestimates the dust transport across the Pacific. CESM2 significantly overestimates dust extinction at all levels in the three SH source regions (Fig. 8c, g, and k) due to the overestimation of dust emission. In South America, CESM1 and E3SMv1 underestimate dust extinction below 900 hPa. This suggests that the two models may underestimate the dust emission. In the Arctic (Fig. 8d), E3SMv1 improves dust extinction at all levels compared with CESM1, while CESM2 only increases dust extinction below 800 hPa. Over the Southern Ocean, CESM1, CESM2, and E3SMv1 all underestimate dust extinction below 850 hPa and produce an increase compared to the bottom level. The overestimation of dust extinction above 800 hPa by MERRA-2 is also evident in Fig. 8d, h, and l. We note that there are considerable differences between satellite retrievals from L15 and Y15. Dust extinction from L15 is larger in the upper troposphere and lower in the lower troposphere than that from Y15, which is due to different dust identification and separation methods (Wu et al., 2019).
3.4 Dust surface concentration
Figure 9 compares simulated annual mean dust surface concentrations with observations at 24 sites, as shown in Fig. 1b. We use the dust surface concentrations for 0.2–12 µm (bins 1–4) in MERRA-2 for better comparison with CESM1, CESM2, and E3SMv1. Note that all measurements of dust surface concentrations except for observations at Barbados and Miami were conducted prior to 2007–2009. Some observations are derived from measurements of aluminum by assuming a certain fraction. CESM1, CESM2, and E3SMv1 have low biases, while MERRA-2 has high biases at most sites. E3SMv1 performs better than CESM1 and CESM2 in terms of the overall correlation (R), mean bias (MB), and mean normalized bias (MNB). CESM2 has the lowest correlation and the highest overall MB and MNB. The overall underestimation of dust surface concentrations in CESM1, CESM2, and E3SMv1 mainly results from the low biases at sites in the Arctic, Antarctic, and Tropical Pacific.
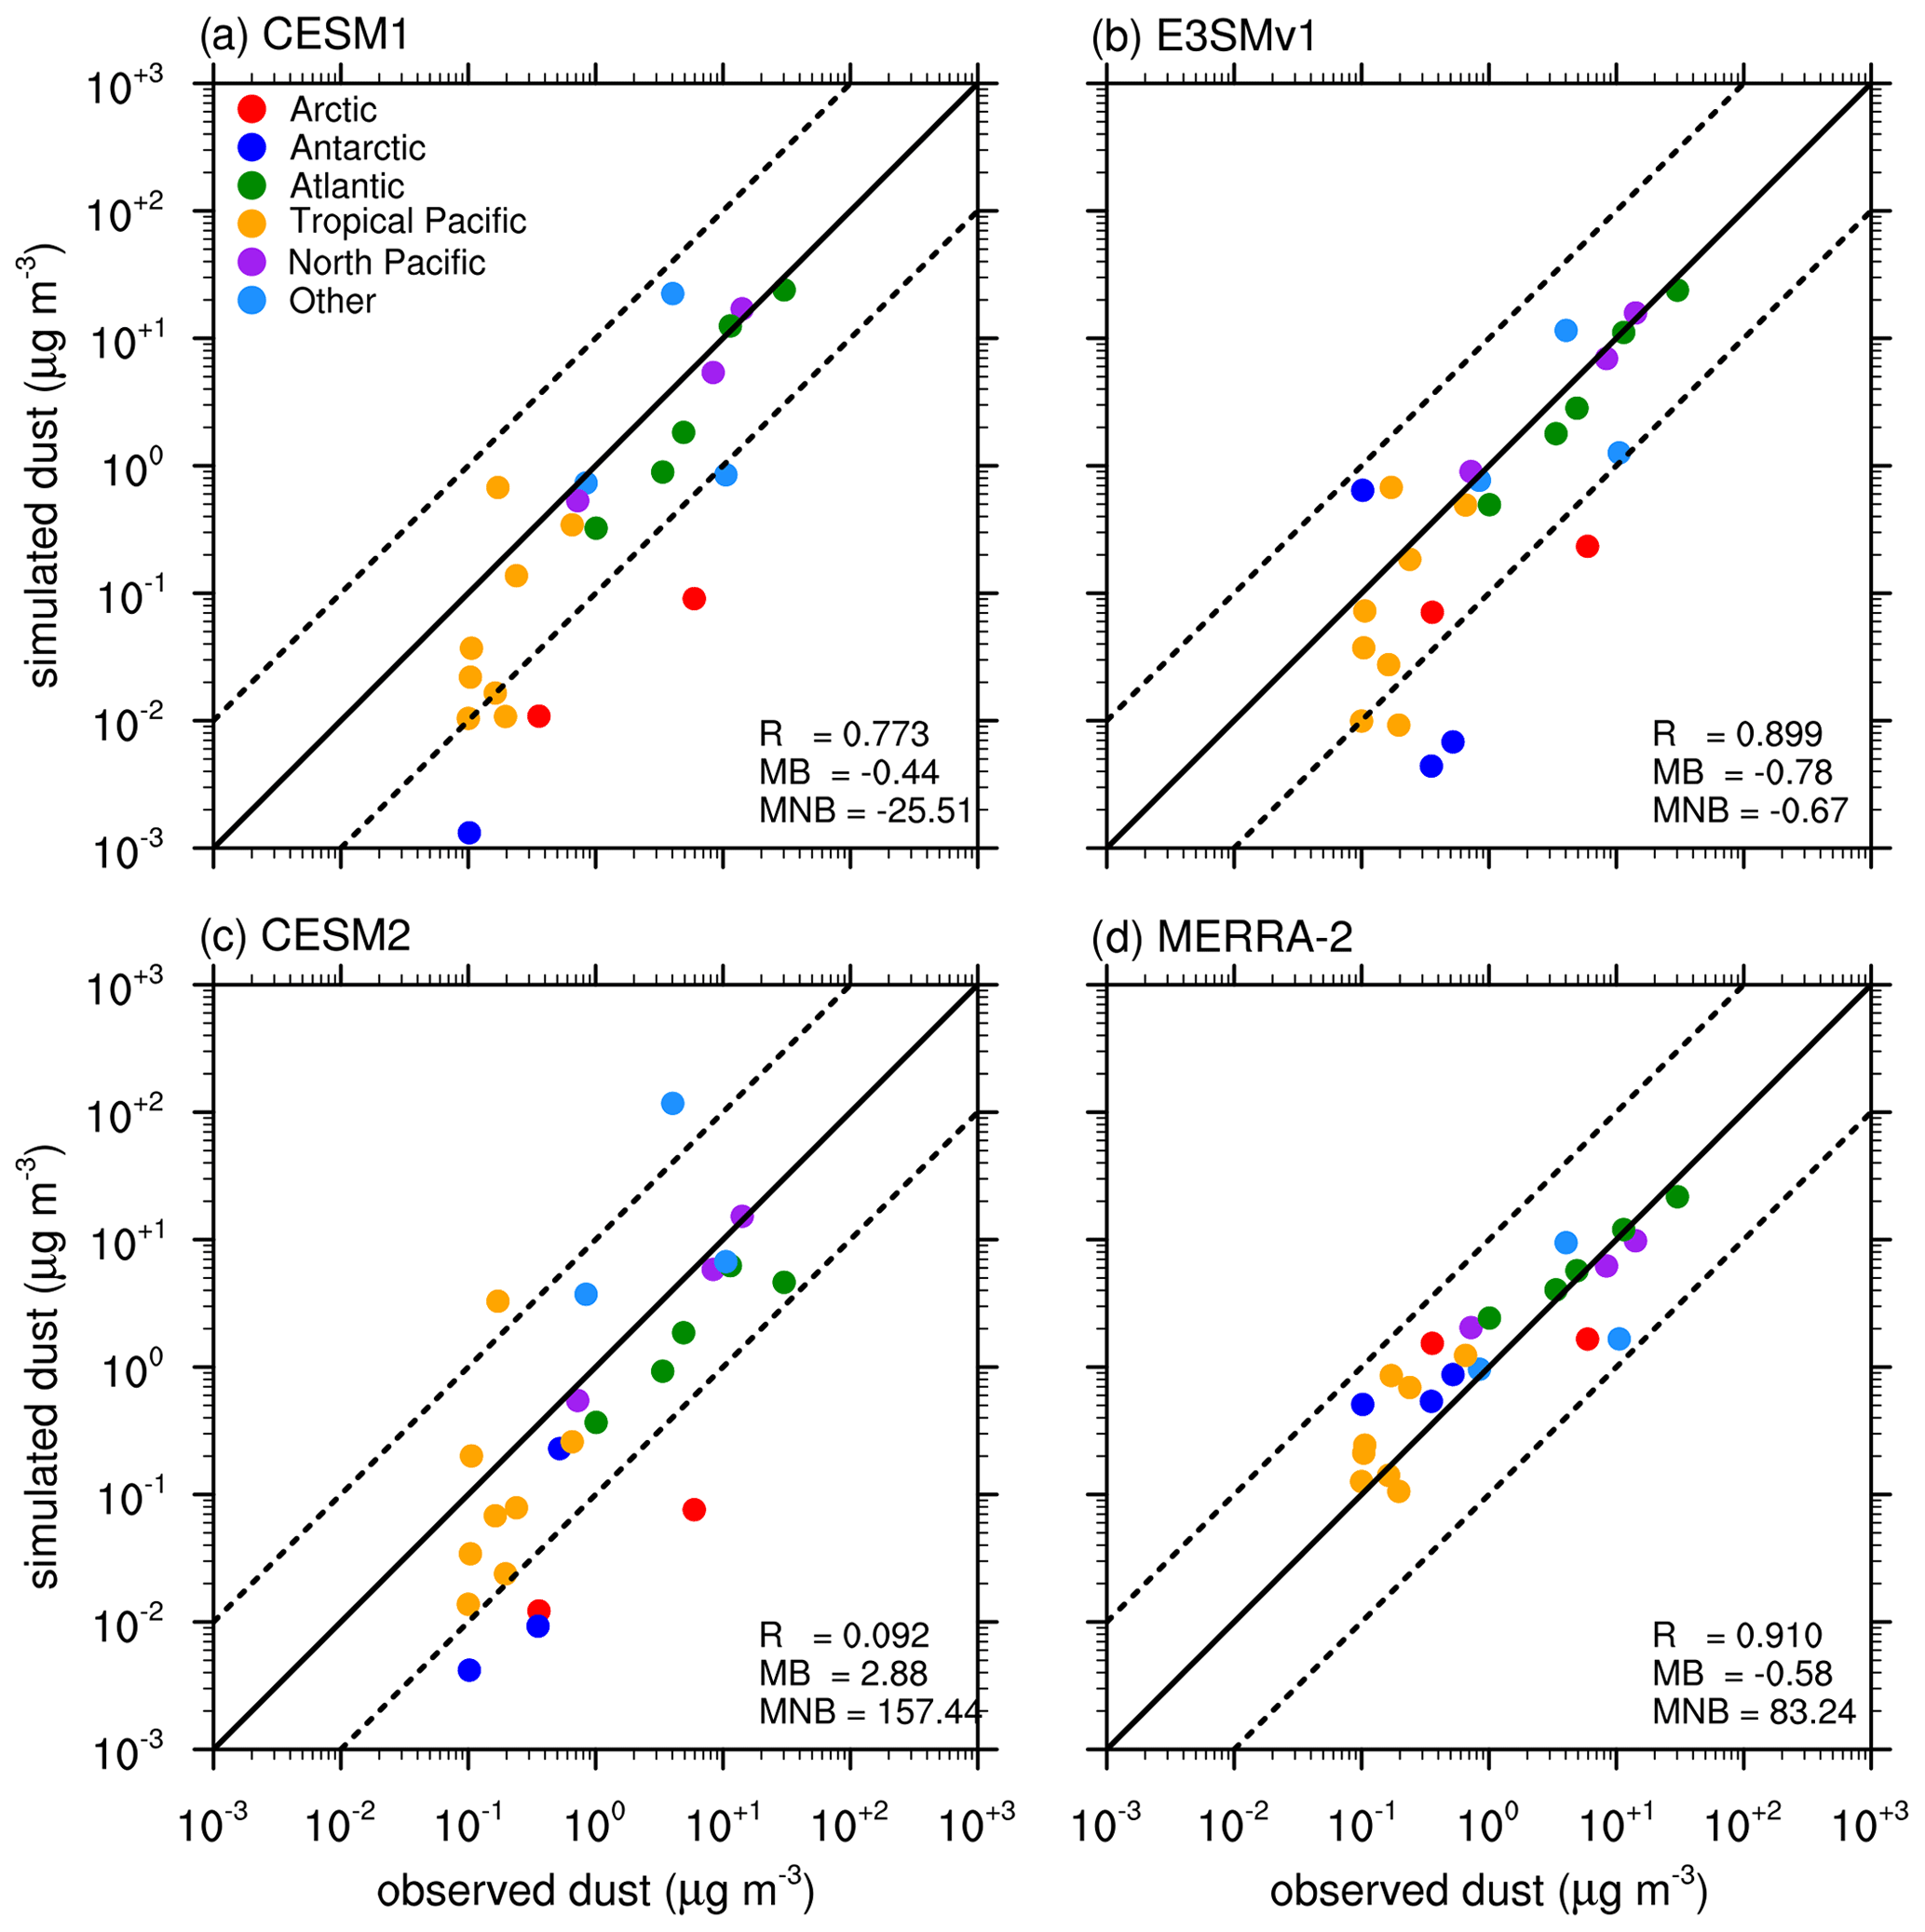
Figure 9Observed and simulated annual mean dust surface concentrations (µg m−3) at 24 sites. The measurements at Alert are from Fan (2013); the observations at Heimaey, Barbados, and Miami are from Prospero et al. (2012); the dataset for the other 20 sites are from Huneeus et al. (2011). These sites were operated by the University of Miami (Arimoto et al., 1996; Prospero et al., 1989; Prospero, 1996). Different color represents different regions.
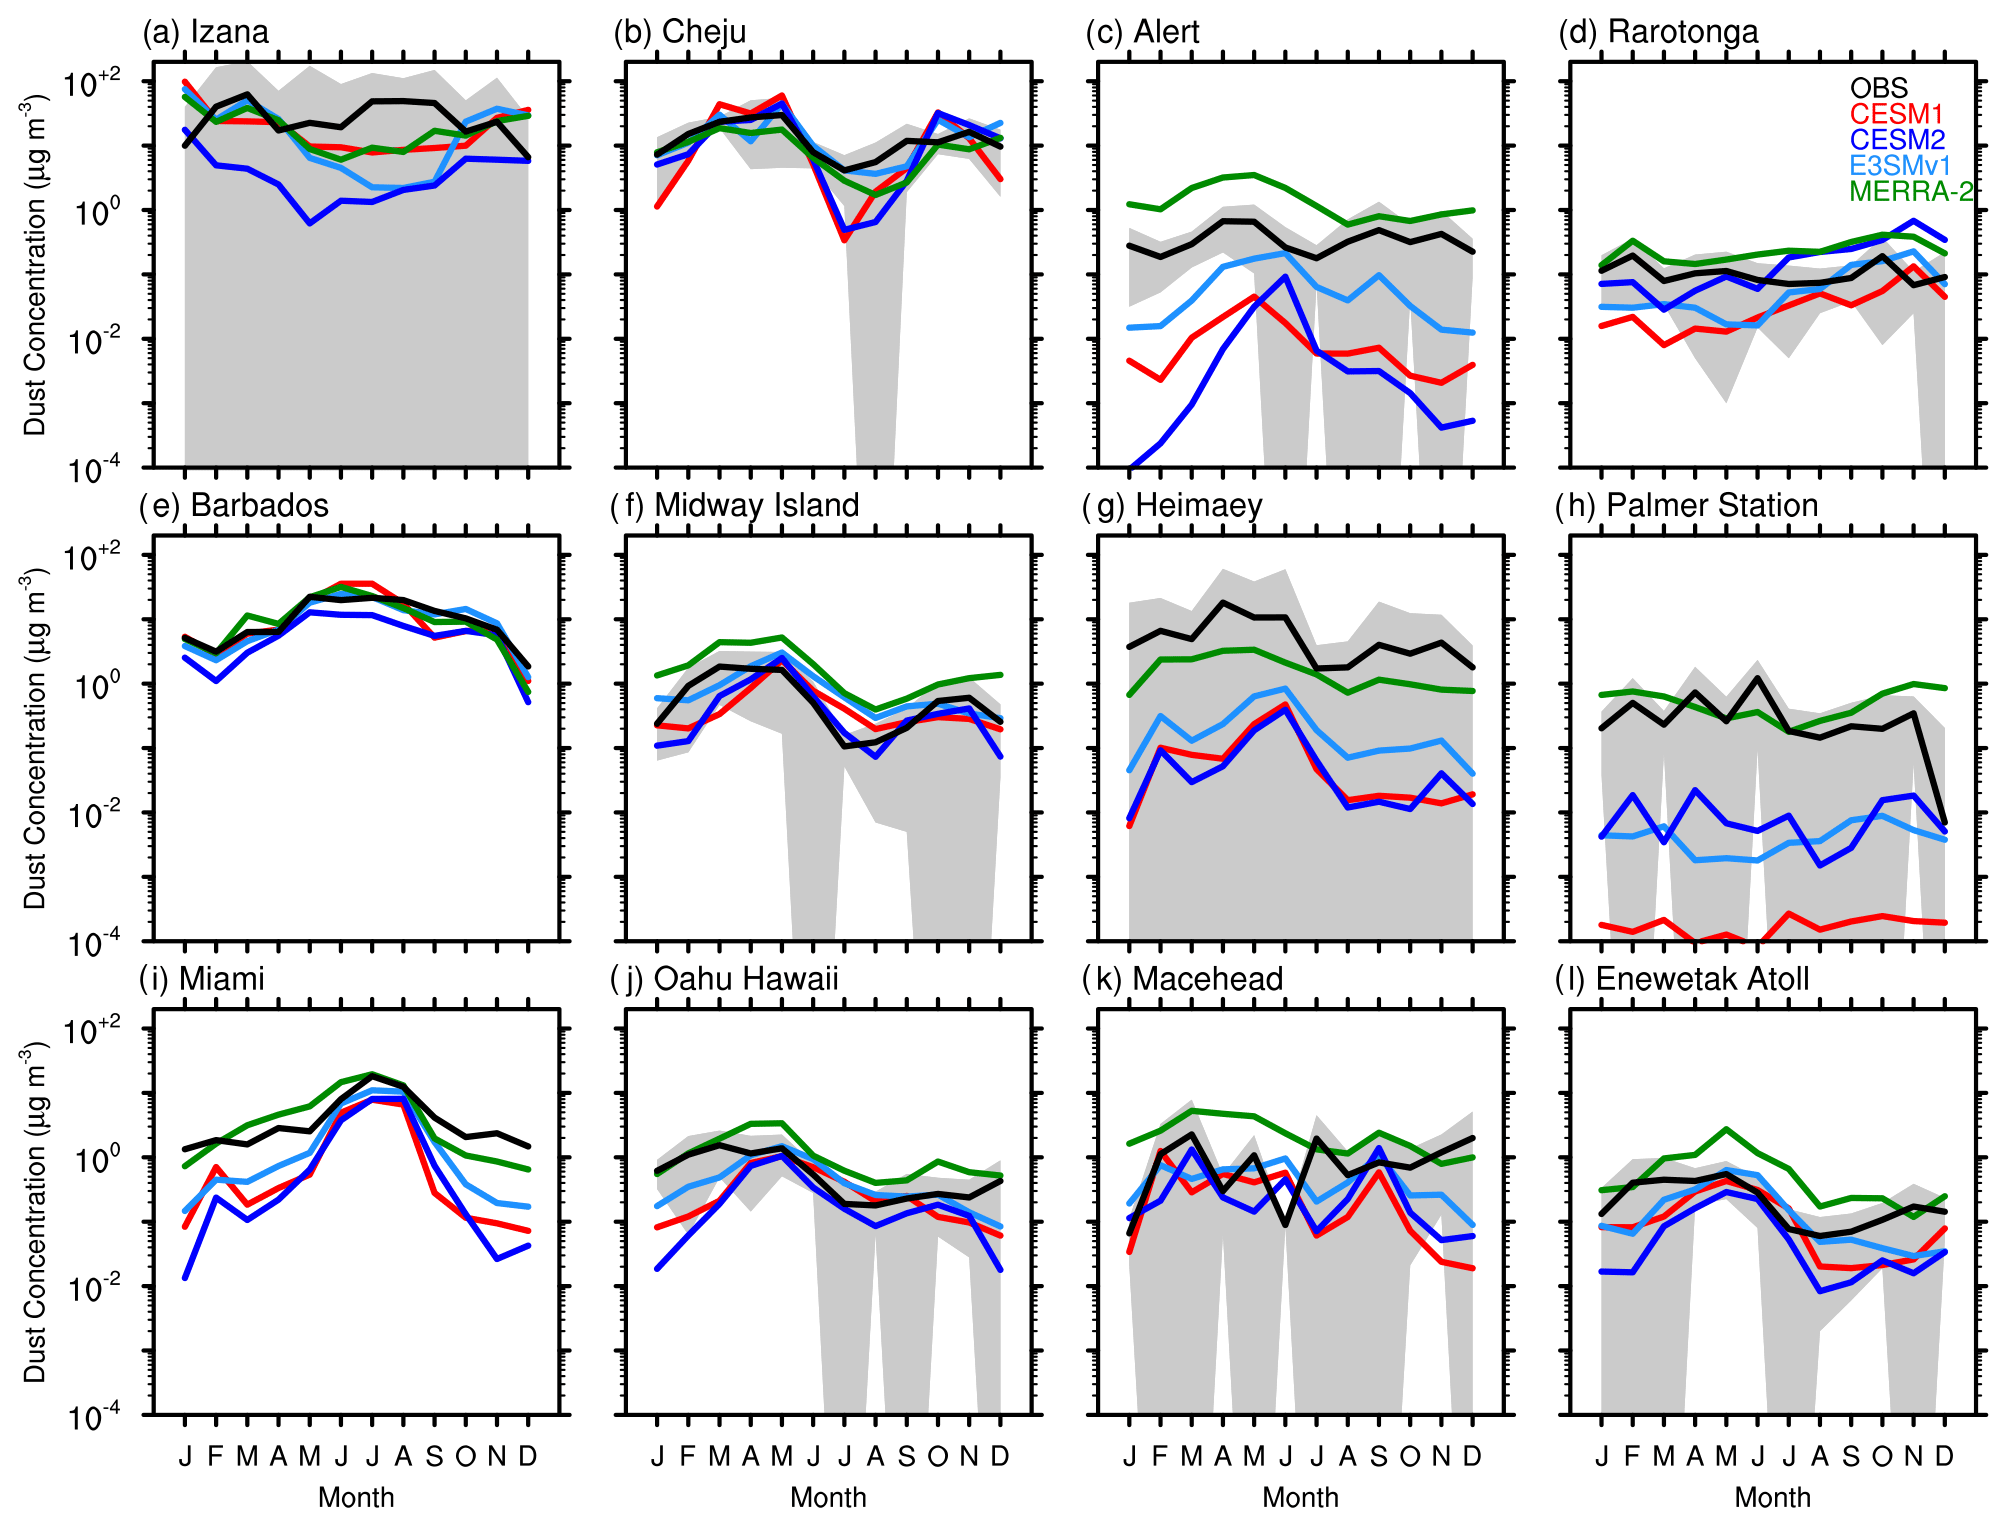
Figure 10Seasonal variations of dust surface concentrations (µg m−3) from model simulations and ground measurements at 12 selected sites. Shaded areas are for ± 1 standard deviation of observations.
Figure 10 shows the seasonal variations of modeled dust surface concentrations in comparison with observations at 12 selected sites. We select the 12 sites based on their geographic locations, which cover the Arctic, Antarctic, trans-Pacific region, and trans-Atlantic region. At Izana (Fig. 10a), which is close to the west coast of North Africa, all models underestimate dust surface concentrations due to low dust emission in Northwest Africa (15∘ W–5∘ E) and fail to capture the seasonality. Although DOD in MERRA-2 agrees well with CALIOP observations over the Atlantic (see Fig. 6a), MERRA-2 still has considerable low biases in dust surface concentrations because of too much dust emitted in the fine mode. Dust surface concentrations in the three models and one reanalysis agree better with observations at Barbados (Fig. 10e) than at Miami (Fig. 10i). CESM1, CESM2, and E3SMv1 underestimate dust surface concentrations at Miami, especially in DJF by more than 1 order of magnitude. E3SMv1 tends to have the best agreement with observations at Cheju (Fig. 10b), while CESM1 and CESM2 have strong low biases in JJA and DJF. MERRA-2 overestimates the concentrations at Midway Island and Oahu Hawaii in all months.
Figure 10c, g, and k show three sites in NH high-latitude regions. E3SMv1 significantly improves the dust surface concentrations compared with CESM1 and CESM2 at Alert, but it still has low biases, especially in SON and DJF by 1 order of magnitude. Ground measurements show high dust surface concentrations in SON due to local dust emission in NH high-latitude regions (Fan et al., 2013; Groot Zwaaftink et al., 2016), but CESM1, CESM2, and E3SMv1 miss the local dust sources there. CESM1 and E3SMv1 tend to have stronger low model biases of dust surface concentrations at Heimaey than at Alert, while CESM2 tend to have weaker low model biases at Heimaey than at Alert, especially in DJF. Figure 10d, h, and l show three sites in the Tropical Pacific and Antarctic. At Palmer Station, CESM1 underestimates dust surface concentrations by 3 orders of magnitude. Dust surface concentrations in CESM2 are higher than CESM1 and E3SMv1 due to higher dust emission in SH and the changes in size parameters in the accumulation and coarse mode. Because E3SMv1 produces a small amount of dust emission in the Antarctic (Fig. 2c), it also has higher concentrations.
In this study, we evaluate the spatiotemporal variations of dust extinction profiles and DOD in CESM1, CESM2, E3SMv1, and MERRA-2 against satellite retrievals from CALIOP (L15 and Y15), MODIS, and MISR. We find that CESM1, CESM2, and E3SMv1 underestimate global annual mean DOD compared with CALIOP and MODIS, which can be mainly attributed to the low model biases of DOD over ocean. This indicates that CESM1, CESM2, and E3SMv1 underestimate dust transport to remote regions. E3SMv1 performs better than CESM1 and CESM2 in NH due to its higher fine-mode mass fraction of dust. CESM2 performs the worst in NH due to its lower dust emission but improves DOD in SH due to its high dust emissions in SH source regions. DOD in MERRA-2 agrees well with CALIOP DOD in remote regions due to the assimilation of AOD and its higher mass fraction of fine-mode dust. All models tend to overestimate dust extinction in the upper troposphere of source regions because of excessive convective transport and/or lack of secondary activation of aerosols entrained into convective updrafts. The latter is considered in E3SMv1 (Wang et al., 2020), which thus shows a reduced bias of dust extinction in the upper troposphere. The high model biases of dust extinction in MERRA-2 in the upper troposphere are persistent around the globe.
CESM1, CESM2, and E3SMv1 produce substantially greater DOD than CALIOP in Northeast Africa and fail to capture the spatial distributions of DOD in North Africa, which can be significantly improved by using the source function of Ginoux et al. (2001) or the dust emission scheme of Kok et al. (2014a, b) (K14). The three models also overestimate DOD over Northwest China due to the overestimation of dust emission in MAM, JJA, and SON. Wu et al. (2019) showed that CESM1 with the K14 dust emission scheme better agrees with CALIOP observations in Northwest China. Since the source functions used in the three models and one reanalysis are all zeros north to 60∘ N, they do not produce any dust emissions in NH high-latitude regions, while ground observations indicate considerable local dust sources.
The low model biases of DOD over the Atlantic in CESM1, CESM2, and E3SMv1 can be greatly improved if the high dust emission in Northeast Africa is captured by models. E3SMv1 has similar decline rate of DOD as CALIOP from Northeast Africa to the Atlantic. CESM1, CESM2, and E3SMv1 underestimate DOD in remote regions resulting from too fast a dust deposition. M. Wu et al. (2018) showed that lower dry deposition velocities for fine particles result in higher dust concentrations in remote regions (see Fig. S1). The current way of releasing dust emission to the atmosphere in the three models is to add it to the bottom layer, while dust storms with strong wind in reality can bring dust to high altitudes. Smith et al. (2017) ran CAM4 with constrained meteorology (i.e., horizontal wind components, temperature, surface pressure, sensible and latent heat fluxes, and wind stress) from three reanalyses (MERRA, ERA-Interim, and NCEP) and found that the global annual mean AOD is 0.026 ± 30 %, indicating an uncertainty due to meteorology of 30 %. Precipitation is another important meteorological factor which not only affects the dust transport by wet deposition but also changes dust emission through soil moisture. A high bias of precipitation over and near the source regions may reduce dust transport to remote regions. Rasch et al. (2019) showed that E3SMv1 and CESM1 tend to rain too early compared with observations, especially over land (∼ 6 h). The bias in the diurnal cycle of precipitation may also influence the dust transport, considering the strong vertical mixing of dust during daytime.
Substantial differences are also found between MODIS and CALIOP DOD, which can greatly affect model evaluation. MODIS DOD (> 0.06) is significantly larger than CALIOP DOD (< 0.03). DOD over ocean from MISR is between MODIS and CALIOP. The differences between MODIS and CALIOP DOD may come from instrument differences, artifacts such as cloud contamination and calibration issues, and different retrieval algorithms. A low bias of the CALIOP aerosol extinction in the lower troposphere (< 2 km) relative to ground-based lidar measurements from the Micro-Pulse Lidar Network (MPLNET) and the European Aerosol Research Lidar Network (EARLINET) at several individual sites has been found in previous studies (e.g., Campbell et al., 2012; Misra et al., 2012; Papagiannopoulos et al., 2016). Further work can be done to evaluate CALIOP dust extinction against measurements from MPLNET and EARLINET.
The CESM1.2 source code is available at https://github.com/mingxuanwupnnl/CESM-code (last access: December 2018; Hurrell et al., 2013; Liu et al., 2016). The CESM2.1 source code is available at https://github.com/ESCOMP/cesm (last access: February 2019; Danabasoglu et al., 2020). The E3SMv1 source code is available at https://github.com/E3SM-Project/E3SM (last access: October 2019; Golaz et al., 2019).
The model output of CESM1 and CESM2 is archived at the NCAR Cheyenne supercomputer. The model output of E3SMv1 is archived at the NERSC Cori supercomputer. The model results of CESM1, CESM2, and E3SMv1 can be made available upon request. MERRA-2 data are available at https://doi.org/10.5067/FH9A0MLJPC7N (Global Modeling and Assimilation Office, 2015a), https://doi.org/10.5067/RZIK2TV7PP38 (Global Modeling and Assimilation Office, 2015b), https://doi.org/10.5067/WWQSXQ8IVFW8 (Global Modeling and Assimilation Office, 2015c), and at https://doi.org/10.5067/LTVB4GPCOTK2 (Global Modeling and Assimilation Office, 2015d). MODIS data can be obtained online at https://ladsweb.modaps.eosdis.nasa.gov/missions-and-measurements/modis/ (last access: February 2019). CALIPSO and MISR data can be obtained online at https://asdc.larc.nasa.gov/data/ (last access: February 2019) via registration.
The supplement related to this article is available online at: https://doi.org/10.5194/acp-20-13835-2020-supplement.
MW and XL conceived the project. MW designed and ran the model simulations with help and input from XL, YS, CW, and ZK. HY, KY, TL, and ZW derived dust extinction profiles from CALIOP. AD derived dust extinction profiles from MERRA-2. HW and YF helped in the analysis of E3SM model results. MW led the analysis and wrote the first draft of the paper. All coauthors commented on the manuscript.
The authors declare that they have no conflict of interest.
This work is supported by NASA CloudSat and CALIPSO Science Program (grant NNX16AO94G/80NSSC20K0952) and the U.S. Department of Energy (DOE), Office of Science, Office of Biological and Environmental Research, Earth and Environmental System Modeling program as part of the Energy Exascale Earth System Model (E3SM) project. The Pacific Northwest National Laboratory (PNNL) is operated for DOE by the Battelle Memorial Institute under contract DE-AC05-76RLO1830. Hongbin Yu was supported by the NASA Radiation Science Program, CALIPSO/CloudSat Science Team, and Atmospheric Composition Modeling and Analysis Program, managed by Hal Maring, David Considine, and Richard Eckman, respectively. We would like to acknowledge the use of computational resources for conducting the model simulations at the National Energy Research Scientific Computing Center (NERSC), a U.S. DOE Office of Science user facility operated under contract DE-AC02-05CH11231, and the NCAR-Wyoming Supercomputing Center provided by the NSF and the State of Wyoming and supported by NCAR's Computational and Information Systems Laboratory. We would like to thank Paul Ginoux for providing MODIS DOD over land; Joseph M. Prospero for providing the measurements of dust surface concentrations at Heimaey, Barbados, and Miami; and Songmiao Fan for providing the measurements of dust surface concentrations at Alert.
This research has been supported by the NASA CloudSat and CALIPSO Science Program (grant no. NNX16AO94G/80NSSC20K0952) and the U.S. Department of Energy (DOE), Office of Science, Office of Biological and Environmental Research, Earth and Environmental System Modeling program as part of the Energy Exascale Earth System Model (E3SM) project.
This paper was edited by Ashu Dastoor and reviewed by two anonymous referees.
Allen, R. J. and Landuyt, W.: The vertical distribution of black carbon in CMIP5 models: Comparison to observations and the importance of convective transport, J. Geophys. Res.-Atmos., 119, 4808–4835, https://doi.org/10.1002/2014JD021595, 2014.
Amiridis, V., Wandinger, U., Marinou, E., Giannakaki, E., Tsekeri, A., Basart, S., Kazadzis, S., Gkikas, A., Taylor, M., Baldasano, J., and Ansmann, A.: Optimizing CALIPSO Saharan dust retrievals, Atmos. Chem. Phys., 13, 12089–12106, https://doi.org/10.5194/acp-13-12089-2013, 2013.
Anderson, T. L., Wu, Y., Chu, D. A., Schmid, B., Redemann, J., and Dubovik, O.: Testing the MODIS satellite retrieval of aerosol fine-mode fraction, J. Geophys. Res., 110, D18204, https://doi.org/10.1029/2005JD005978, 2005.
Arimoto, R., Duce, R. A., Savoie, D. L., Prospero, J. M., Talbot, R., Cullen, J. D., Tomza, U., Lewis, N. F., and Ray, B. J.: Relationships among aerosol constituents from Asia and the North Pacific during PEM-West A, J. Geophys. Res., 101, 2011–2023, https://doi.org/10.1029/95JD01071, 1996.
Baddock, M. C., Ginoux, P., Bullard, J. E., and Gill, T. E.: Do MODIS-defined dust sources have a geomorphological signature?, Geophys. Res. Lett., 43, 2606–2613, https://doi.org/10.1002/2015GL067327, 2016.
Balkanski, Y., Schulz, M., Claquin, T., and Guibert, S.: Reevaluation of Mineral aerosol radiative forcings suggests a better agreement with satellite and AERONET data, Atmos. Chem. Phys., 7, 81–95, https://doi.org/10.5194/acp-7-81-2007, 2007.
Bogenschutz, P. A., Gettelman, A., Morrison, H., Larson, V. E., Craig, C., and Schanen, D. P.: Higher-order turbulence closure and its impact on climate simulations in the Community Atmosphere Model, J. Climate, 26, 9655–9676, https://doi.org/10.1175/JCLI-D-13-00075.1, 2013.
Boucher, O., Randall, D., Artaxo, P., Bretherton, C., Feingold, G., Forster, P., Kerminen, V.-M., Kondo, Y., Liao, H., Lohmann, U., Rasch, P., Satheesh, S. K., Sherwood, S., Stevens, B., and Zhang, X. Y.: Clouds and aerosols, in: Climate change 2013: the physical science basis. Contribution of Working Group I to the Fifth Assessment Report of the Intergovernmental Panel on Climate Change, edited by: Stocker, T. F., Qin, D., Plattner, G.-K., Tignor, M., Allen, S. K., Boschung, J., Nauels, A., Xia, Y., Bex, V., and Midgley, P. M., Cambridge University Press, Cambridge, UK and New York, NY, USA, 2013.
Campbell, J. R., Tackett, J. L., Reid, J. S., Zhang, J., Curtis, C. A., Hyer, E. J., Sessions, W. R., Westphal, D. L., Prospero, J. M., Welton, E. J., Omar, A. H., Vaughan, M. A., and Winker, D. M.: Evaluating nighttime CALIOP 0.532 μm aerosol optical depth and extinction coefficient retrievals, Atmos. Meas. Tech., 5, 2143–2160, https://doi.org/10.5194/amt-5-2143-2012, 2012.
Chin, M., Ginoux, P., Kinne, S., Torres, O., Holben, B. N., Duncan, B. N., Martin, R. V., Logan, J. A., Higurashi, A., and Nakajima, T.: Tropospheric aerosol optical thickness from the GOCART model and comparisons with satellite and sun photometer measurements, J. Atmos. Sci., 59, 461–483, https://doi.org/10.1175/1520-0469(2002)059<0461:TAOTFT>2.0.CO;2, 2002.
Danabasoglu, G., Lamarque, J.-F., Bacmeister, J., Bailey, D. A., DuVivier, A. K., Edwards, J., Emmons, L. K., Fasullo, J., Garcia, R., Gettelman, A., Hannay, C., Holland, M. M., Large, W. G., Lauritzen, P. H., Lawrence, D. M., Lenaerts, J. T. M., Lindsay, K., Lipscomb, W. H., Mills, M. J., Neale, R., Oleson, K. W., Otto-Bliesner, B., Phillips, A. S., Sacks, W., Tilmes, S., van Kampenhout, L., Vertenstein, M., Bertini, A., Dennis, J., Deser, C., Fischer, C., Fox-Kemper, B., Kay, J. E., Kinnison, D., Kushner, P. J., Larson, V. E., Long, M. C., Mickelson, S., Moore, J. K., Nienhouse, E., Polvani, L., Rasch, P. J., and Strand, W. G.: The Community Earth System Model Version 2 (CESM2), J. Adv. Model. Earth Syst., 12, e2019MS001916, https://doi.org/10.1029/2019MS001916, 2020.
DeMott, P. J., Sassen, K., Poellot, M. R., Baumgardner, D., Rogers, D. C., Brooks, S. D., Prenni, A. J., and Kreidenweis, S. M.: African dust aerosols as atmospheric ice nuclei, Geophys. Res. Lett., 30, 1732, https://doi.org/10.1029/2003GL017410, 2013.
Dentener, F. J., Carmichael, G. R., Zhang, Y., Lelieveld, J., and Crutzen, P. J.: Role of mineral aerosol as a reactive surface in the global troposphere, J. Geophys. Res., 101, 22869–22889, https://doi.org/10.1029/96JD01818, 1996.
Evan, A. T., Flamant, C., Fiedler, S., and Doherty, O.: An analysis of aeolian dust in climate models, Geophys. Res. Lett., 41, 5996–6001, https://doi.org/10.1002/2014GL060545, 2014.
Fan, S.-M.: Modeling of observed mineral dust aerosols in the arctic and the impact on winter season low level clouds, J. Geophys. Res.-Atmos., 118, 11161–11174, https://doi.org/10.1002/jgrd.50842, 2013.
Garay, M. J., Witek, M. L., Kahn, R. A., Seidel, F. C., Limbacher, J. A., Bull, M. A., Diner, D. J., Hansen, E. G., Kalashnikova, O. V., Lee, H., Nastan, A. M., and Yu, Y.: Introducing the 4.4 km spatial resolution Multi-Angle Imaging SpectroRadiometer (MISR) aerosol product, Atmos. Meas. Tech., 13, 593–628, https://doi.org/10.5194/amt-13-593-2020, 2020.
Gelaro, R., McCarty, W., Suárez, M. J., Todling, R., Molod, A., Takacs, L., Randles, C. A., Darmenov, A., Bosilovich, M. G., Reichle, R., Wargan, K., Coy, L., Cullather, R., Draper, C., Akella, S., Buchard, V., Conaty, A., da Silva, A. M., Gu, W., Kim, G.-K., Koster, R., Lucchesi, R., Merkova, D., Nielsen, J. E., Partyka, G., Pawson, S., Putman, W., Rienecker, M., Schubert, S. D., Sienkiewicz, M., and Zhao, B.: The Modern-Era Retrospective Analysis for Research and Applications, Version 2 (MERRA-2), J. Climate, 30, 5419–5454, https://doi.org/10.1175/JCLI-D-16-0758.1, 2017.
Gettelman, A. and Morrison, H.: Advanced two-moment bulk microphysics for global models. Part I: Off-line tests and comparison with other schemes, J. Climate, 28, 1268–1287, https://doi.org/10.1175/JCLI-D-14-00102.1, 2015.
Ginoux, P., Chin, M., Tegen, I., Prospero, J. M., Holben, B., Dubovik, O., and Lin, S.-J.: Sources and distributions of dust aerosols simulated with the GOCART model, J. Geophys. Res., 106, 20255–20273, https://doi.org/10.1029/2000JD000053, 2001.
Global Modeling and Assimilation Office: MERRA-2 tavgM_2d_aer_Nx: 2d, Monthly mean, Time-averaged, Single-Level, Assimilation, Aerosol Diagnostics V5.12.4, Greenbelt, MD, USA, Goddard Earth Sciences Data and Information Services Center (GES DISC), https://doi.org/10.5067/FH9A0MLJPC7N, 2015a.
Global Modeling and Assimilation Office: MERRA-2 tavgM_2d_adg_Nx: 2d, Monthly mean, Time-averaged, Single-Level, Assimilation, Aerosol Diagnostics (extended) V5.12.4, Greenbelt, MD, USA, Goddard Earth Sciences Data and Information Services Center (GES DISC), https://doi.org/10.5067/RZIK2TV7PP38, 2015b.
Global Modeling and Assimilation Office: MERRA-2 inst3_3d_asm_Nv: 3d, 3-Hourly, Instantaneous, Model-Level, Assimilation, Assimilated Meteorological Fields V5.12.4, Greenbelt, MD, USA, Goddard Earth Sciences Data and Information Services Center (GES DISC), https://doi.org/10.5067/WWQSXQ8IVFW8, 2015c.
Global Modeling and Assimilation Office: MERRA-2 inst3_3d_aer_Nv: 3d, 3-Hourly, Instantaneous, Model-Level, Assimilation, Aerosol Mixing Ratio V5.12.4, Greenbelt, MD, USA, Goddard Earth Sciences Data and Information Services Center (GES DISC), https://doi.org/10.5067/LTVB4GPCOTK2, 2015d.
Golaz, J. C., Larson, V. E., and Cotton, W. R.: A pdf-based model for boundary layer clouds. Part I: Method and model description, J. Atmos. Sci., 59, 3540–3551, https://doi.org/10.1175/1520-0469(2002)059<3540:APBMFB>2.0.CO;2, 2002.
Golaz, J.-C., Caldwell, P. M., Van Roekel, L. P., Petersen, M. R., Tang, Q., Wolfe, J. D., Abeshu, G., Anantharaj, V., Asay-Davis, X. S., Bader, D. C., Baldwin, S. A., Bisht, G., Bogenschutz, P. A., Branstetter, M., Brunke, M. A., Brus, S. R., Burrows, S. M., Cameron-Smith, P. J., Donahue, A. S., Deakin, M., Easter, R. C., Evans, K. J., Feng, Y., Flanner, M., Foucar, J. G., Fyke, J. G., Griffin, B. M., Hannay, C., Harrop, B. E., Hoffman, M. J., Hunke, E. C., Jacob, R. L., Jacobsen, D. W., Jeffery, N., Jones, P. W., Keen, N. D., Klein, S. A., Larson, V. E., Leung, L. R., Li, H.-Y., Lin, W., Lipscomb, W. H., Ma, P.-L., Mahajan, S., Maltrud, M. E., Mametjanov, A., McClean, J. L., McCoy, R. B., Neale, R. B., Price, S. F., Qian, Y., Rasch, P. J., Reeves Eyre, J. E. J., Riley, W. J., Ringler, T. D., Roberts, A. F., Roesler, E. L., Salinger, A. G., Shaheen, Z., Shi, X., Singh, B., Tang, J., Taylor, M. A., Thornton, P. E., Turner, A. K., Veneziani, M., Wan, H., Wang, H., Wang, S., Williams, D. N., Wolfram, P. J., Worley, P. H., Xie, S., Yang, Y., Yoon, J.-H., Zelinka, M. D., Zender, C. S., Zeng, X., Zhang, C., Zhang, K., Zhang, Y., Zheng, X., Zhou, T., and Zhu, Q.: The DOE E3SM coupled model version 1: Overview and evaluation at standard resolution, J. Adv. Model. Earth Sy., 11, 2089–2129, https://doi.org/10.1029/2018MS001603, 2019.
Groot Zwaaftink, C. D., Grythe, H., Skov, H., and Stohl, A.: Substantial contribution of northern high-latitude sources to mineral dust in the Arctic, J. Geophys. Res.-Atmos., 121, 13678–13697, https://doi.org/10.1002/2016JD025482, 2016.
Haywood, J., Francis, P., Osborne, S., Glew, M., Loeb, N., Highwood, E., Tanré, D., Myhre, G., Formenti, P., and Hirst, E.: Radiative properties and direct radiative effect of Saharan dust measured by the C-130 aircraft during SHADE: 1. Solar spectrum, J. Geophys. Res., 108, 8577–8593, https://doi.org/10.1029/2002JD002687, 2003.
Hsu, N. C., Jeong, M.-J., Bettenhausen, C., Sayer, A. M., Hansell, R., Seftor, C. S., Huang, J., and Tsay, S.-C.: Enhanced Deep Blue aerosol retrieval algorithm: The second generation, J. Geophys. Res.-Atmos., 118, 9296–9315, https://doi.org/10.1002/jgrd.50712, 2013.
Huneeus, N., Schulz, M., Balkanski, Y., Griesfeller, J., Prospero, J., Kinne, S., Bauer, S., Boucher, O., Chin, M., Dentener, F., Diehl, T., Easter, R., Fillmore, D., Ghan, S., Ginoux, P., Grini, A., Horowitz, L., Koch, D., Krol, M. C., Landing, W., Liu, X., Mahowald, N., Miller, R., Morcrette, J.-J., Myhre, G., Penner, J., Perlwitz, J., Stier, P., Takemura, T., and Zender, C. S.: Global dust model intercomparison in AeroCom phase I, Atmos. Chem. Phys., 11, 7781–7816, https://doi.org/10.5194/acp-11-7781-2011, 2011.
Hurrell, J. W., Holland, M. M., Gent, P. R., Ghan, S., Kay, J. E., Kushner, P. J., Lamarque, J.-F., Large, W. G., Lawrence, D., Lindsay, K., Lipscomb, W. H., Long, M. C., Mahowald, N., Marsh, D. R., Neale, R. B., Rasch, P., Vavrus, S., Vertenstein, M., Bader, D., Collins, W. D., Hack, J. J., Kiehl, J., and Marshall, S.: The Community Earth System Model: A framework for collaborative research, B. Am. Meteorol. Soc., 94, 1339–1360, https://doi.org/10.1175/BAMS-D-12-00121.1, 2013.
Jickells, T. D., An, Z. S., Anderson, K. K., Baker, A. R., Bergametti, G., Brooks, N., Cao, J. J., Boyd, P. W., Duce, R. A., Hunter, K. A., Kawahata, H., Kubilay, N., IaRoche, J., Liss, P. S., Mahowald, N., Prospero, J. M., Ridgwell, A. J., Tegen, I., and Torres, R.: Global iron connections between desert dust, ocean biogeochemistry, and climate, Science, 308, 67–71, https://doi.org/10.1126/science.1105959, 2005.
Johnson, M. S., Meskhidze, N., and Praju Kiliyanpilakkil, V.: A global comparison of GEOS-Chem-predicted and remotely-sensed mineral dust aerosol optical depth and extinction profiles, J. Adv. Model. Earth Sy., 4, M07001, https://doi.org/10.1029/2011MS000109, 2012.
Kaufman, Y. J., Koren, I., Remer, L. A., Tanré, D., Ginoux, P., and Fan, S.: Dust transport and deposition observed from the Terra-Moderate Resolution Imaging Spectroradiometer (MODIS) spacecraft over the Atlantic Ocean, J. Geophys. Res., 110, D10S12, https://doi.org/10.1029/2003JD004436, 2005.
Kim, D., Chin, M., Yu, H., Diehl, T., Tan, Q., Kahn, R. A., Tsigaridis, K., Bauer, S. E., Takemura, T., Pozzoli, L., Bellouin, N., Schulz, M., Peyridieu, S., Chédin, A., and Koffi, B.: Sources, sinks, and transatlantic transport of North African dust aerosol: A multimodel analysis and comparison with remote sensing data, J. Geophys. Res.-Atmos., 119, 6259–6277, https://doi.org/10.1002/2013JD021099, 2014.
Kim, D., Chin, M., Yu, H., Pan, X., Bian, H., and Tan, Q.: Asian and trans-pacific dust: A multimodel and multiremote sensing observation analysis, J. Geophys. Res.-Atmos, 124, 13534–13559, https://doi.org/10.1029/2019JD030822, 2019.
Kim, M.-H., Omar, A. H., Tackett, J. L., Vaughan, M. A., Winker, D. M., Trepte, C. R., Hu, Y., Liu, Z., Poole, L. R., Pitts, M. C., Kar, J., and Magill, B. E.: The CALIPSO version 4 automated aerosol classification and lidar ratio selection algorithm, Atmos. Meas. Tech., 11, 6107–6135, https://doi.org/10.5194/amt-11-6107-2018, 2018.
Kok, J. F.: A scaling theory for the size distribution of emitted dust aerosols suggests climate models underestimate the size of the global dust cycle, P. Natl. Acad. Sci. USA, 108, 1016–1021, https://doi.org/10.1073/pnas.1014798108, 2011.
Kok, J. F., Mahowald, N. M., Fratini, G., Gillies, J. A., Ishizuka, M., Leys, J. F., Mikami, M., Park, M.-S., Park, S.-U., Van Pelt, R. S., and Zobeck, T. M.: An improved dust emission model – Part 1: Model description and comparison against measurements, Atmos. Chem. Phys., 14, 13023–13041, https://doi.org/10.5194/acp-14-13023-2014, 2014a.
Kok, J. F., Albani, S., Mahowald, N. M., and Ward, D. S.: An improved dust emission model – Part 2: Evaluation in the Community Earth System Model, with implications for the use of dust source functions, Atmos. Chem. Phys., 14, 13043–13061, https://doi.org/10.5194/acp-14-13043-2014, 2014b.
Kok, J. F., Ridley, D. A., Zhou, Q., Miller, R. L., Zhao, C., Heald, C. L., Ward, D. S., Albani, S., and Haustein, K.: Smaller desert dust cooling effect estimated from analysis of dust size and abundance, Nat. Geosci., 10, 274–278, https://doi.org/10.1038/NGEO2912, 2017.
Lawrence, D., Fisher, R., Koven, C., Oleson, K., Swenson, S., Vertenstein, M., Andre, B., Bonan, G., Ghimire, B., van Kampenhout, L., Kennedy, D., Kluzek, E., Knox, R., Lawrence, P., Li, F., Li, H., Lombardozzi, D., Lu, Y., Perket, J., Riley, W., Sacks, W., Shi, M., Wieder, W., Xu, C., Ali, A., Badger, A., Bisht, G., Broxton, P., Brunke, M., Buzan, J., Clark, M., Craig, T., Dahlin, K., Drewniak, B., Emmons, L., Fisher, J., Flanner, M., Gentine, P., Lenaerts, J., Levis, S., Leung, L. R., Lipscomb, W., Pelletier, J., Ricciuto, D. M., Sanderson, B., Shuman, J., Slater, A., Subin, Z., Tang, J., Tawfik, A., Thomas, Q., Tilmes, S., Vitt, F., and Zeng, X.: Technical description of version 5.0 of the Community Land Model (CLM), available at: http://www.cesm.ucar.edu/models/cesm2/land/CLM50_Tech_Note.pdf, last access: November 2019.
Levy, R. C., Mattoo, S., Sawyer, V., Shi, Y., Colarco, P. R., Lyapustin, A. I., Wang, Y., and Remer, L. A.: Exploring systematic offsets between aerosol products from the two MODIS sensors, Atmos. Meas. Tech., 11, 4073–4092, https://doi.org/10.5194/amt-11-4073-2018, 2018.
Liu, X., Ma, P.-L., Wang, H., Tilmes, S., Singh, B., Easter, R. C., Ghan, S. J., and Rasch, P. J.: Description and evaluation of a new four-mode version of the Modal Aerosol Module (MAM4) within version 5.3 of the Community Atmosphere Model, Geosci. Model Dev., 9, 505–522, https://doi.org/10.5194/gmd-9-505-2016, 2016.
Luo, T., Wang, Z., Ferrare, R. A., Hostetler, C. A., Yuan, R., and Zhang, D.: Vertically resolved separation of dust and other aerosol types by a new lidar depolarization method, Opt. Express, 23, 14095–14107, https://doi.org/10.1364/OE.23.014095, 2015a.
Luo, T., Wang, Z., Zhang, D., Liu, X., Wang, Y., and Yuan, R.: Global dust distribution from improved thin dust layer detection using A-train satellite lidar observations, Geophys. Res. Lett., 42, 620–628, https://doi.org/10.1002/2014GL062111, 2015b.
Ma, X. and Yu, F.: Seasonal and spatial variations of global aerosol optical depth: multi-year modelling with GEOS-Chem-APM and comparisons with multiple-platform observations, Tellus B, 67, 25115, https://doi.org/10.3402/tellusb.v67.25115, 2015.
Ma, X., Bartlett, K., Harmon, K., and Yu, F.: Comparison of AOD between CALIPSO and MODIS: significant differences over major dust and biomass burning regions, Atmos. Meas. Tech., 6, 2391–2401, https://doi.org/10.5194/amt-6-2391-2013, 2013.
Misra, A., Tripathi, S. N., Kaul, D. S., and Welton, E. J.: Study of MPLNET-derived aerosol climatology over Kanpur, India, and validation of CALIPSO level 2 version 3 backscatter and extinction products, J. Atmos. Ocean. Tech., 29, 1285–1294, https://doi.org/10.1175/JTECH-D-11-00162.1, 2012.
Neale, R. B., Chen, C.-C., Gettelman, A., Lauritzen, P. H., Park, S., Williamson, D. L., Conley, A. J., Garcia, R., Kinnison, D., Lamarque, J.-F., Marsh, D., Mills, M., Smith, A. K., Tilmes, S., Vitt, F., Morrison, H., Cameron-Smith, P., Collins, W. D., Iacono, M. J., Easter, R. C., Ghan, S. J., Liu, X., Rasch, P. J., and Taylor, M. A.: Description of the NCAR Community Atmosphere Model (CAM 5.0), NCAR Technical Note NCAR/TN-486+ STR, available at: http://www.cesm.ucar.edu/models/cesm1.2/cam/docs/description/cam5_desc.pdf (last access: November 2019), 2010.
Oleson, K. W., Lawrence, D. W., Bonan, G. B., Flanner, M. G., Kluzek, E., Lawrence, P. J., Levis, S., Swenson, S. C., Thornton, P. E., Dai, A., Decker, M., Dickinson, R., Feddema, J., Heald, C. L., Hoffman, F., Lamarque, J.-F., Mahowald, N., Niu, G.-Y., Qian, T., Randerson, J., Running, S., Sakaguchi, K., Slater, A., Stöckli, R., Wang, A., Yang, Z.-L., Zeng, X., and Zeng, X.: Technical description of version 4.0 of the Community Land Model (CLM), NCAR Technical Note NCAR/TN-478+STR, available at: http://www.cesm.ucar.edu/models/cesm1.2/clm/CLM4_Tech_Note.pdf (last access: November 2019), 2010.
Omar, A. H., Winker, D. M., Tackett, J. L., Giles, D. M., Kar, J., Liu, Z., Vaughan, M. A., Powell, K. A., and Trepte, C. R.: CALIOP and AERONET aerosol optical depth comparisons: One size fits one, J. Geophys. Atmos., 118, 4748–4766, https://doi.org/10.1002/jgrd.50330, 2013.
Papagiannopoulos, N., Mona, L., Alados-Arboledas, L., Amiridis, V., Baars, H., Binietoglou, I., Bortoli, D., D'Amico, G., Giunta, A., Guerrero-Rascado, J. L., Schwarz, A., Pereira, S., Spinelli, N., Wandinger, U., Wang, X., and Pappalardo, G.: CALIPSO climatological products: evaluation and suggestions from EARLINET, Atmos. Chem. Phys., 16, 2341–2357, https://doi.org/10.5194/acp-16-2341-2016, 2016.
Proestakis, E., Amiridis, V., Marinou, E., Georgoulias, A. K., Solomos, S., Kazadzis, S., Chimot, J., Che, H., Alexandri, G., Binietoglou, I., Daskalopoulou, V., Kourtidis, K. A., de Leeuw, G., and van der A, R. J.: Nine-year spatial and temporal evolution of desert dust aerosols over South and East Asia as revealed by CALIOP, Atmos. Chem. Phys., 18, 1337–1362, https://doi.org/10.5194/acp-18-1337-2018, 2018.
Prospero, J. M.: The atmospheric transport of particles to the ocean, in: Particle flux in the ocean, vol. 57, 19–52, John Wiley & Sons Ltd, New York, USA, 1996.
Prospero, J. M., Uematsu, M., and Savoie, D. L.: Mineral aerosol transport to the Pacific Ocean, in: Chemical oceanography, vol. 10, 188–218, Academic Press, New York, USA, 1989.
Prospero, J. M., Bullard, J. E., and Hodgkins, R.: High-latitude dust over the North Atlantic: Inputs from Icelandic proglacial dust storms, Science, 335, 1078–1082, https://doi.org/10.1126/science.1217447, 2012.
Pu, B. and Ginoux, P.: The impact of the Pacific Decadal Oscillation on springtime dust activity in Syria, Atmos. Chem. Phys., 16, 13431–13448, https://doi.org/10.5194/acp-16-13431-2016, 2016.
Pu, B. and Ginoux, P.: How reliable are CMIP5 models in simulating dust optical depth?, Atmos. Chem. Phys., 18, 12491–12510, https://doi.org/10.5194/acp-18-12491-2018, 2018.
Rahimi, S., Liu, X., Wu, C., Lau, W. K., Brown, H., Wu, M., and Qian, Y.: Quantifying snow darkening and atmospheric radiative effects of black carbon and dust on the South Asian monsoon and hydrological cycle: experiments using variable-resolution CESM, Atmos. Chem. Phys., 19, 12025–12049, https://doi.org/10.5194/acp-19-12025-2019, 2019.
Rasch, P. J., Xie, S., Ma, P.-L., Lin, W., Wang, H., Tang, Q., Burrows, S. M., Caldwell, P., Zhang, K., Easter, R. C., Cameron-Smith, P., Singh, B., Wan, H., Golaz, J.-C., Harrop, B. E., Roesler, E., Bacmeister, J., Larson, V. E., Evans, K. J., Qian, Y., Taylor, M., Leung, L. R., Zhang, Y., Brent, L., Branstetter, M., Hannay, C., Mahajan, S., Mametjanov, A., Neale, R., Richter, J. H., Yoon, J.-H., Zender, C. S., Bader, D., Flanner, M., Foucar, J. G., Jacob, R., Keen, N., Klein, S. A., Liu, X., Salinger, A. G., Shrivastava, M., and Yang, Y.: An overview of the atmospheric component of the Energy Exascale Earth System Model, J. Adv. Model. Earth Sy., 11, 2377–2411, https://doi.org/10.1029/2019MS001629, 2019.
Ridley, D. A., Heald, C. L., Kok, J. F., and Zhao, C.: An observationally constrained estimate of global dust aerosol optical depth, Atmos. Chem. Phys., 16, 15097–15117, https://doi.org/10.5194/acp-16-15097-2016, 2016.
Rosenfeld, D., Rudich, Y., and Lahav, R.: Desert dust suppressing precipitation: A possible desertification feedback loop, P. Natl. Acad. Sci. USA, 98, 5975–5980, https://doi.org/10.1073/pnas.101122798, 2001.
Sayer, A. M., Munchak, L. A., Hsu, N. C., Levy, R. C., Bettenhausen, C., and Jeong, M.-J.: MODIS Collection 6 aerosol products: Comparison between Aqua's e-Deep Blue, Dark Target, and “merged” data sets, and usage recommendations, J. Geophys. Res.-Atmos., 119, 13965–13989, https://doi.org/10.1002/2014JD022453, 2014.
Scanza, R. A., Mahowald, N., Ghan, S., Zender, C. S., Kok, J. F., Liu, X., Zhang, Y., and Albani, S.: Modeling dust as component minerals in the Community Atmosphere Model: development of framework and impact on radiative forcing, Atmos. Chem. Phys., 15, 537–561, https://doi.org/10.5194/acp-15-537-2015, 2015.
Schuster, G. L., Vaughan, M., MacDonnell, D., Su, W., Winker, D., Dubovik, O., Lapyonok, T., and Trepte, C.: Comparison of CALIPSO aerosol optical depth retrievals to AERONET measurements, and a climatology for the lidar ratio of dust, Atmos. Chem. Phys., 12, 7431–7452, https://doi.org/10.5194/acp-12-7431-2012, 2012.
Shi, Y. and Liu, X.: Dust radiative effects on climate by glaciating mixed-phase clouds, Geophys. Res. Lett., 46, 6128–6137, https://doi.org/10.1029/2019GL082504, 2019.
Smith, M. B., Mahowald, N. M., Albani, S., Perry, A., Losno, R., Qu, Z., Marticorena, B., Ridley, D. A., and Heald, C. L.: Sensitivity of the interannual variability of mineral aerosol simulations to meteorological forcing dataset, Atmos. Chem. Phys., 17, 3253–3278, https://doi.org/10.5194/acp-17-3253-2017, 2017.
Tegen, I. and Lacis, A. A.: Modeling of particle size distribution and its influence on the radiative properties of mineral dust aerosol, J. Geophys. Res., 101, 19237–19244, https://doi.org/10.1029/95JD03610, 1996.
Tegen, I., Lacis, A. A., and Fung, I.: The influence on climate forcing of mineral aerosols from disturbed soils, Nature, 380, 419–422, https://doi.org/10.1038/380419a0, 1996.
Wandinger, U., Tesche, M., Seifert, P., Ansmann, A., Müller, D., and Althausen, D.: Size matters: Influence of multiple scattering on CALIPSO light-extinction profiling in desert dust, Geophys. Res. Lett., 37, L10801, https://doi.org/10.1029/2010GL042815, 2010.
Wang, H., Easter, R. C., Rasch, P. J., Wang, M., Liu, X., Ghan, S. J., Qian, Y., Yoon, J.-H., Ma, P.-L., and Vinoj, V.: Sensitivity of remote aerosol distributions to representation of cloud–aerosol interactions in a global climate model, Geosci. Model Dev., 6, 765–782, https://doi.org/10.5194/gmd-6-765-2013, 2013.
Wang, H., Easter, R. C., Zhang, R., Ma, P.-L., Singh, B., Zhang, K., Ganguly, D., Rasch, P. J., Burrows, S. M., Ghan, S. J., Lou, S., Qian, Y., Yang, Y., Feng, Y., Flanner, M., Leung, R. L., Liu, X., Shrivastava, M., Sun, J., Tang, Q., Xie, S., and Yoon, J.-H.: Aerosols in the E3SM Version 1: New developments and their impacts on radiative forcing, J. Adv. Model. Earth Sy., 12, e2019MS001851, https://doi.org/10.1029/2019MS001851, 2020.
Witek, M. L., Garay, M. J., Diner, D. J., Bull, M. A., and Seidel, F. C.: New approach to the retrieval of AOD and its uncertainty from MISR observations over dark water, Atmos. Meas. Tech., 11, 429–439, https://doi.org/10.5194/amt-11-429-2018, 2018.
Wu, C., Lin, Z., Liu, X., Li, Y., Lu, Z., and Wu, M.: Can climate models reproduce the decadal change of dust aerosol in East Asia?, Geophys. Res. Lett., 45, 9953–9962, https://doi.org/10.1029/2018GL079376, 2018a.
Wu, C., Liu, X., Lin, Z., Rahimi-Esfarjani, S. R., and Lu, Z.: Impacts of absorbing aerosol deposition on snowpack and hydrologic cycle in the Rocky Mountain region based on variable-resolution CESM (VR-CESM) simulations, Atmos. Chem. Phys., 18, 511–533, https://doi.org/10.5194/acp-18-511-2018, 2018b.
Wu, M., Liu, X., Zhang, L., Wu, C., Lu, Z., Ma, P.-L., Wang, H., Tilmes, S., Mahowald, N., Matsui, H., and Easter, R. C.: Impacts of aerosol dry deposition on black carbon spatial distributions and radiative effects in the Community Atmosphere Model CAM5, J. Adv. Model. Earth Sy., 10, 1150–1171, https://doi.org/10.1029/2017MS001219, 2018.
Wu, M., Liu, X., Yang, K., Luo, T., Wang, Z., Wu, C., Zhang, K., Yu, H., and Darmenov, A.: Modeling dust in East Asia by CESM and sources of biases, J. Geophys. Res.-Atmos., 124, 8043–8064, https://doi.org/10.1029/2019JD030799, 2019.
Yasunari, T. J., Koster, R. D., Lau, W. K. M., and Kim, K.-M.: Impact of snow darkening via dust, black carbon, and organic carbon on boreal spring climate in the Earth system, J. Geophys. Res.-Atmos., 120, 5485–5503, https://doi.org/10.1002/2014JD022977, 2015.
Yu, H., Chin, M., Remer, L. A., Kleidman, R. G., Bellouin, N., Bian, H., and Diehl, T.: Variability of marine aerosol fine-mode fraction and estimates of anthropogenic aerosol component over cloud-free oceans from the Moderate Resolution Imaging Spectroradiometer (MODIS), J. Geophys. Res., 114, D10206, https://doi.org/10.1029/2008JD010648, 2009.
Yu, H., Chin, M., Winker, D. M., Omar, A. H., Liu, Z., Kittaka, C., and Thomas, D.: Global view of aerosol vertical distributions from CALIPSO lidar measurements and GOCART simulations: Regional and seasonal variations, J. Geophys. Res., 115, D00H30, https://doi.org/10.1029/2009JD013364, 2010.
Yu, H., Remer, L. A., Chin, M., Bian, H., Tan, Q., Yuan, T., and Zhang, Y.: Aerosols from overseas rival domestic emissions over North America, Science, 337, 566–569, https://doi.org/10.1126/science.1217576, 2012.
Yu, H., Chin, M., Bian, H., Yuan, T., Prospero, J. M., Omar, A. H., Remer, L. A., Winker, D. M., Yang, Y., Zhang, Y., and Zhang, Z.: Quantification of trans-Atlantic dust transport from seven-year (2007–2013) record of CALIPSO lidar measurements, Remote Sens. Environ., 159, 232–249, https://doi.org/10.1016/j.rse.2014.12.010, 2015.
Yu, H., Tan, Q., Chin, M., Remer, L. A., Kahn, R. A., Bian, H., Kim, D., Zhang, Z., Yuan, T., Omar, A. H., Winker, D. M., Levy, R. C., Kalashnikova, O., Crepeau, L., Capelle, V., and Chédin, A.: Estimates of African dust deposition along the trans-Atlantic transit using the decadelong record of aerosol measurements from CALIOP, MODIS, MISR, and IASI, J. Geophys. Res.-Atmos., 124, 7975–7996, https://doi.org/10.1029/2019JD030574, 2019.
Yu, H., Yang, Y., Wang, H., Tan, Q., Chin, M., Levy, R. C., Remer, L. A., Smith, S. J., Yuan, T., and Shi, Y.: Interannual variability and trends of combustion aerosol and dust in major continental outflows revealed by MODIS retrievals and CAM5 simulations during 2003–2017, Atmos. Chem. Phys., 20, 139–161, https://doi.org/10.5194/acp-20-139-2020, 2020.
Yu, P., Froyd, K. D., Portmann, R. W., Toon, O. B., Freitas, S. R., Bardeen, C. G., Brock, C., Fan, T., Gao, R.-S., Katich, J. M., Kupc, A., Liu, S., Maloney, C., Murphy, D. M., Rosenlof, K. H., Schill, G., Schwarz, J. P., and Williamson, C.: Efficient in-cloud removal of aerosols by deep convection, Geophys. Res. Lett., 46, 1061–1069, https://doi.org/10.1029/2018GL080544, 2019.
Zender, C. S., Bian, H., and Newman, D.: Mineral Dust Entrainment and Deposition (DEAD) model: Description and 1990s dust climatology, J. Geophys. Res., 108, 4416, https://doi.org/10.1029/2002JD002775, 2003a.
Zender, C. S., Newman, D., and Torres, O.: Spatial heterogeneity in aeolian erodibility: Uniform, topographic, geomorphic, and hydrologic hypotheses, J. Geophys. Res., 108, 4543, https://doi.org/10.1029/2002JD003039, 2003b.
Zhang, J., Reid, J. S., and Holben, B. N.: An analysis of potential cloud artifacts in MODIS over ocean aerosol optical thickness products, Geophys. Res. Lett., 32, L15803, https://doi.org/10.1029/2005GL023254, 2005.
Zhang, L., Li, Q. B., Gu, Y., Liou, K. N., and Meland, B.: Dust vertical profile impact on global radiative forcing estimation using a coupled chemical-transport–radiative-transfer model, Atmos. Chem. Phys., 13, 7097–7114, https://doi.org/10.5194/acp-13-7097-2013, 2013.