the Creative Commons Attribution 4.0 License.
the Creative Commons Attribution 4.0 License.
 | 16 Nov 2020
The evolution of cloud and aerosol microphysics at the summit of Mt. Tai, China
Jiarong Li
Chao Zhu
Defeng Zhao
Likun Xue
Xinfeng Wang
Hongyong Li
Pengfei Liu
Junfeng Liu
Chenglong Zhang
Yujing Mu
Wenjin Zhang
Luming Zhang
Hartmut Herrmann
Kai Li
Min Liu
The influence of aerosols, both natural and anthropogenic, remains a major area of uncertainty when predicting the properties and the behaviours of clouds and their influence on climate. In an attempt to better understand the microphysical properties of cloud droplets, the simultaneous variations in aerosol microphysics and their potential interactions during cloud life cycles in the North China Plain, an intensive observation took place from 17 June to 30 July 2018 at the summit of Mt. Tai. Cloud microphysical parameters were monitored simultaneously with number concentrations of cloud condensation nuclei (NCCN) at different supersaturations, PM2.5 mass concentrations, particle size distributions and meteorological parameters. Number concentrations of cloud droplets (NC), liquid water content (LWC) and effective radius of cloud droplets (reff) show large variations among 40 cloud events observed during the campaign. The low values of reff and LWC observed at Mt. Tai are comparable with urban fog. Clouds on clean days are more susceptible to the change in concentrations of particle number (NP), while clouds formed on polluted days might be more sensitive to meteorological parameters, such as updraft velocity and cloud base height. Through studying the size distributions of aerosol particles and cloud droplets, we find that particles larger than 150 nm play important roles in forming cloud droplets with the size of 5–10 µm. In general, LWC consistently varies with reff. As NC increases, reff changes from a trimodal distribution to a unimodal distribution and shifts to smaller size mode. By assuming a constant cloud thickness and ignoring any lifetime effects, increase in NC and decrease in reff would increase cloud albedo, which may induce a cooling effect on the local climate system. Our results contribute valuable information to enhance the understanding of cloud and aerosol properties, along with their potential interactions on the North China plain.
- Article
(8729 KB) - Full-text XML
-
Supplement
(1833 KB) - BibTeX
- EndNote


Clouds are key factors in the atmospheric hydrological cycle, which play an important role in the atmospheric energy budget and significantly influence the global and regional climate (Chang et al., 2019b; Y. Zhang et al., 2004). Clouds can be physically described by their liquid water content (LWC), number concentrations of droplets (NC) and effective radius of droplets (reff). These parameters may show small inter-annual variations for the same monitoring station (Möller et al., 1996), but they vary over a large range for different cloud types (Quante, 2004), for different cloud altitudes (Padmakumari et al., 2017; Zhao et al., 2018) and in different parts of a cloud (Deng et al., 2009).
The interactions between the clouds and the aerosols are complex. Clouds can efficiently remove aerosols by activating cloud condensation nuclei (CCN) to form cloud droplets (Croft et al., 2010; L. M. Zhang et al., 2004). The cloud processes can incorporate large amount of fine particulate mass (Heintzenberg et al., 1989), change their size distributions (Drewnick et al., 2007; Schroder et al., 2015), and alter the CCN compositions through homogeneous and heterogeneous reactions (Roth et al., 2016). In addition, the variation of aerosol number concentrations and aerosol size distributions could alter the cloud microphysics. Through studying microphysical characteristics of cloud droplet residuals at Mt. Åreskutan, Noone et al. (1990) found that larger cloud droplets preferred to form on larger CCN. In addition to this, the aerosol–cloud interaction has been investigated for cloud processes formed under both clean and polluted conditions. Padmakumari et al. (2017) found that convective clouds over land were characterised by lower LWC and higher NC due to the increase in pollution aerosol. Ground-based observations by radiometers during the summers of the US studies in the mid-Atlantic region revealed that cloud events with smaller droplets (< 7 µm) were more frequently observed in the polluted years than in the clean years (S. Li et al., 2017). The influence of aerosols on the cloud microphysics is evident but varies for different regions and for different cloud types.
For a given liquid water content, aerosol particles can act as CCN, lead to higher number concentrations of cloud droplets with smaller sizes and result in higher albedo (Twomey effect or first indirect effect, FIE) (Twomey, 1974). Based on the principle of the Twomey effect, calculations for evaluating the influence of aerosols on the cloud microphysics have been widely studied (Lohmann and Feichter, 2005; McComiskey et al., 2009; Twohy et al., 2005). However, arithmetic terms representing aerosol loading are different, such as using the number concentration of particles, the CCN concentration and the aerosol optical depth (AOD), which makes it difficult to compare the FIE from different studies.
The increase in the aerosol concentrations can result in a longer cloud lifetime, thus producing large cloud fractions (Koren et al., 2005; Albrecht, 1989), increasing cloud top height and increasing the cloud thickness (Fan et al., 2013). It would further influence the regional and global climate (Rosenfeld, 2006; Seinfeld et al., 2016), such as reducing the precipitation or drizzle (Andreae et al., 2004; Heikenfeld et al., 2019) and further delaying the hydrological cycle (Rosenfeld, 2006). Through model experiments with the Coupled Model Intercomparison Project phase 5 (CMIP5), Frey et al. (2017) also found that the addition of anthropogenic aerosols could increase the monthly mean cloud albedo of subtropical marine stratocumulus clouds.
In situ measurements of cloud microphysics by aircraft or on high-altitude monitoring sites have provided some additional information for insight into the cloud processes (Allan et al., 2008; J. Li et al., 2017; Padmakumari et al., 2017; van Pinxteren et al., 2016; Reid et al., 1999). However, lacking knowledge of the size distributions of cloud droplets and aerosol particles makes it difficult to evaluate the cloud microphysics in small-scale regions (Fan et al., 2016; Khain et al., 2015; Sant et al., 2013). Discrepancy still exists between the widths of observed and simulated size distributions of cloud droplets (Grabowski and Wang, 2013). In addition to this, incomplete knowledge of the impact of cloud–aerosol interactions (Rosenfeld et al., 2014b), unresolved processes of cloud formation (Stevens and Bony, 2013) and the lack of research into the variation of cloud microphysical parameters at different cloud stages still hinder modelling studies.
In this study, in situ observations at the summit of Mt. Tai were presented to investigate the evolution of cloud microphysics coupled to simultaneous monitoring of aerosol size distributions, PM2.5 mass and CCN concentrations within non-precipitating clouds. The summit of Mt. Tai is the highest point in the centre of the North China Plain (NCP). Sufficient moisture in summer and dramatic temperature differences between day and night make it ideal for in situ orographic cloud monitoring (J. Li et al., 2017). The summit of Mt. Tai is far away from anthropogenic emission sources on the ground. However, high concentrations of inorganic ions in PM2.5 (Zhou et al., 2009), abundant bacterial communities (Zhu et al., 2018), and NH3 and NOx emissions from biomass burning (Chang et al., 2019a) have been observed at the summit, and thus a strong anthropogenic influence must exist. Previous studies of cloud samples collected at the same position showed high inorganic ion concentrations (J. Li et al., 2017; Wang et al., 2011), which can be attributed to the increase in anthropogenic aerosol. In this study, two typical cloud processes are discussed in detail to elucidate the relationship of NC, reff, and LWC under clean or polluted conditions (indicated by NP and NCCN) and during the cloud life cycle. This paper provides comprehensive information about cloud microphysical properties and their potential links to aerosol concentrations and size distribution. Implications of cloud and aerosol microphysics for cloud albedo and climate are discussed.
2.1 Observation duration and site
From 17 June to 30 July 2018, 40 cloud events in total were monitored at the Shandong Taishan Meteorological Station at summit of Mt. Tai (Tai'an, China; 36∘18′ N, 117∘13′ E; 1545 m a.s.l.; Fig. S1). Mt. Tai is the highest point in the central of North China Plain (NCP) and located within the transportation channel between the NCP and the Yangtze River Delta (Shen et al., 2019). The altitude of Mt. Tai is close to 1.6 km. This height is close to the top of the planetary boundary layer in central eastern China and is suitable for studying the characteristics of particles inputting to clouds (Hudson, 2007). Orographic clouds, which are mainly formed in the boundary layer via air approaching the ridge, being forced to rise up and then being cooled by adiabatic expansion (Choularton et al., 1997), frequently occur at the summit of Mt. Tai, especially in summer. Previous studies concentrated on cloud chemistry found that Mt. Tai is significantly influenced by anthropogenic emissions (J. Li et al., 2017; Wang et al., 2011). In addition, fixed observation location is mainly applied to study the evolution of aerosol properties and cloud processing (Mertes et al., 2005; Roth et al., 2016). Thus, Mt. Tai is a good site for monitoring orographic clouds and simultaneously investigating aerosol and cloud microphysics. The arrangement of instruments is presented in Fig. S1c. As shown in Fig. S2, the prevailing wind direction during this summer campaign was easterly wind (23.3 %), southwesterly wind (22.8 %) and southerly wind (21.9 %), respectively. About 85.6 % of wind speed was less than 8 m s−1. The monitored cloud events in this study were mainly influenced by southerly wind (34.7 %) and southwesterly wind (22 %).
2.2 Cloud microphysical parameters
A Fog Monitor (Model FM-120, Droplet Measurement Technologies Inc., USA), a forward-scattering optical spectrometer with a sampling flow of 1 m3 min−1, was applied in situ for real-time size distributions of cloud droplets and computing NC, LWC, median volume diameter (MVD), and effective diameter (ED) in the size range of 2 to 50 µm (Spiegel et al., 2012). The corresponding equations are
where Ni is the cloud number concentration at the ith bin, ri represents the radius at the ith bin and ρw=1 g cm−3 stands for the density of liquid water. Droplets are categorised into the manufacturer's 30 predefined size bins with a sampling resolution of 1 s. The size bin widths using this configuration were 1 µm for droplets < 15 and 2 µm for droplets >15 µm. The true air speed calibration and size distribution calibration of FM-120 were carried out by the manufacturer using borosilicate glass microspheres of various sizes (5.0, 8.0, 15.0. 30.0, 40.0 and 50.0 µm, Duke Scientific Corporation, USA). The difference in optical properties between the glass beads and water was taken into account during the calibration process. In this study, the sampling inlet nozzle faced the main wind direction and was horizontally set. Cloud events are defined by the universally accepted threshold values in NC and LWC, i.e. NC>10 cm−3 and LWC > 0.001 g m−3 (Demoz et al., 1996). Too short cloud events with a duration < 15 min were excluded.
2.3 Aerosol size distribution
A Scanning Mobility Particle Sizer (SMPS, Model 3938, TSI Inc., USA) consisting of a Differential Mobility Analyser (DMA, Model 3082, TSI Inc., USA) and a Condensation Particle Counter (CPC, Model 3775, TSI Inc., USA) was applied to monitor the size distributions of dehumidified aerosols through a PM10 inlet. The neutralised aerosols were classified by DMA to generate a monodisperse stream of known size according to their electrical mobility. The CPC placed downstream counts the particles and gives the number of particles with different sizes. In this study, each scan was fixed at 5 min for every loop with a flow rate of 1.5 L min−1 sizing particles in the range of 13.6–763.5 nm in 110 size bins.
2.4 CCN number concentration
The NCCN at certain supersaturations (SSs) were quantified by a Cloud Condensation Nuclei Counter (Model CCN-100, DMT Inc., USA). The CCN counter was set at five SS values sequentially for 10 min each at 0.2 %, 0.4 %, 0.6 %, 0.8 % and 1.0 % with a full scan time resolution of 50 min. Data collected during the first 5 min of each SS were excluded since the CCN counter needs time for temperature stabilisation after the change in SS. The ratio of sample flow to sheath flow was set at 1:10 with a total airflow of 500 ccm. The SSs of the CCN counter were calibrated before the campaign and checked at the end of the campaign with monodisperse ammonium sulfate particles of different sizes (Rose et al., 2008).
2.5 PM2.5 concentrations and meteorological parameters
The PM2.5 mass concentration was measured using a beta attenuation and optical analyser (SHARP monitor, model 5030i, Thermo Scientific Inc., USA). Meteorological parameters, including the ambient temperature (Ta, ∘), relative humidity (RH), wind speed (WS, m s−1) and wind direction (WD, ∘), were provided by Shandong Taishan Meteorological Station at the same observation point. The ground-level temperature (Tg), ground-level pressure (Pg), and dew point temperature (Tgd) were supported by National Meteorological Observatory – Tai'an Station (station number: 54 827; 36∘9′ N, 117∘9′ E; 128.6 m a.s.l.) (Fig. S1a), which is located on the southern plain of Mt. Tai.
2.6 Calculation of cloud base height
In this study, the estimated lifting condensation level (LCL) is applied to represent the cloud base height (CBH) due to the lack of corresponding instruments. The calculation of LCL depends on the meteorological parameters measured at Tai'an Station. The ground-level data of temperature, dew point temperature, and pressure were used as input parameters (Georgakakos and Bras, 1984):
where pLCL is the LCL pressure, and TLCL is the LCL temperature.
2.7 Calculation of AIE
Aerosol indirect effect (AIE), which here simply represents approximations of the derivatives of the cloud microphysics (reff and NC) with respect to changes in aerosol concentrations (McComiskey et al., 2009; Feingold et al., 2001), is applied to study the influence of NP on cloud microphysics and calculated as follows:
where NP is applied as an proxy of aerosol amount (Zhao et al., 2012; Zhao et al., 2018).
2.8 Calculation of cloud albedo
Cloud albedos can be calculated using the equations shown below (Seinfeld and Pandis, 2006). Assuming the cloud droplet size distribution can be approximated as monodisperse and the cloud is vertically uniform with respect to droplet size distribution (Stephens, 1978), the cloud optical thickness (τc) could be obtained by
where h is the thickness of the cloud and ρw is the density of cloud water.
For the non-absorbing and horizontally homogeneous cloud, the two-stream approximation for the cloud albedo (Rc) gives the following equation (Lacis and Hansen, 1974):
where g is the asymmetry factor. The radius of cloud droplets was much greater than the wavelength of visible light, and hence g is 0.85. The equation before becomes
3.1 Overview of the cloud microphysics
From 17 June to 30 July 2018, 40 cloud events were captured at the summit of Mt. Tai. Large ranges of cloud microphysics were observed during the campaign. The averaged NC, LWC and reff of the 40 cloud events at the summit of Mt. Tai varied over the ranges of 59–1519 cm−3, 0.01–0.59 g m−3 and 2.6–7.4 µm, respectively (Table S1). The monitored number concentration of cloud droplets at Mt. Tai both in this study and in 2014 can reach 2000–3000 cm−3 (J. Li et al., 2017), which is much higher than those values (with a range of 10–700 cm−3) for city fog and convective and orographic clouds (Allan et al., 2008; Li et al., 2011; Padmakumari et al., 2017) (Table 1). This suggests that clouds at Mt. Tai were characterised with high NC.
Table 1Comparison of clouds monitored at Mt. Tai with city fog, convective clouds monitored by research aircrafts and other orographic clouds. Including sampling information (site, period and altitude); the range of PM2.5 mass concentrations; the range of microphysical parameters, i.e. number concentrations of cloud droplets, NC; liquid water content, LWC; median volume diameter, MVD; and effective radius, reff; and the number of monitored clouds, cloud events, and fog events.
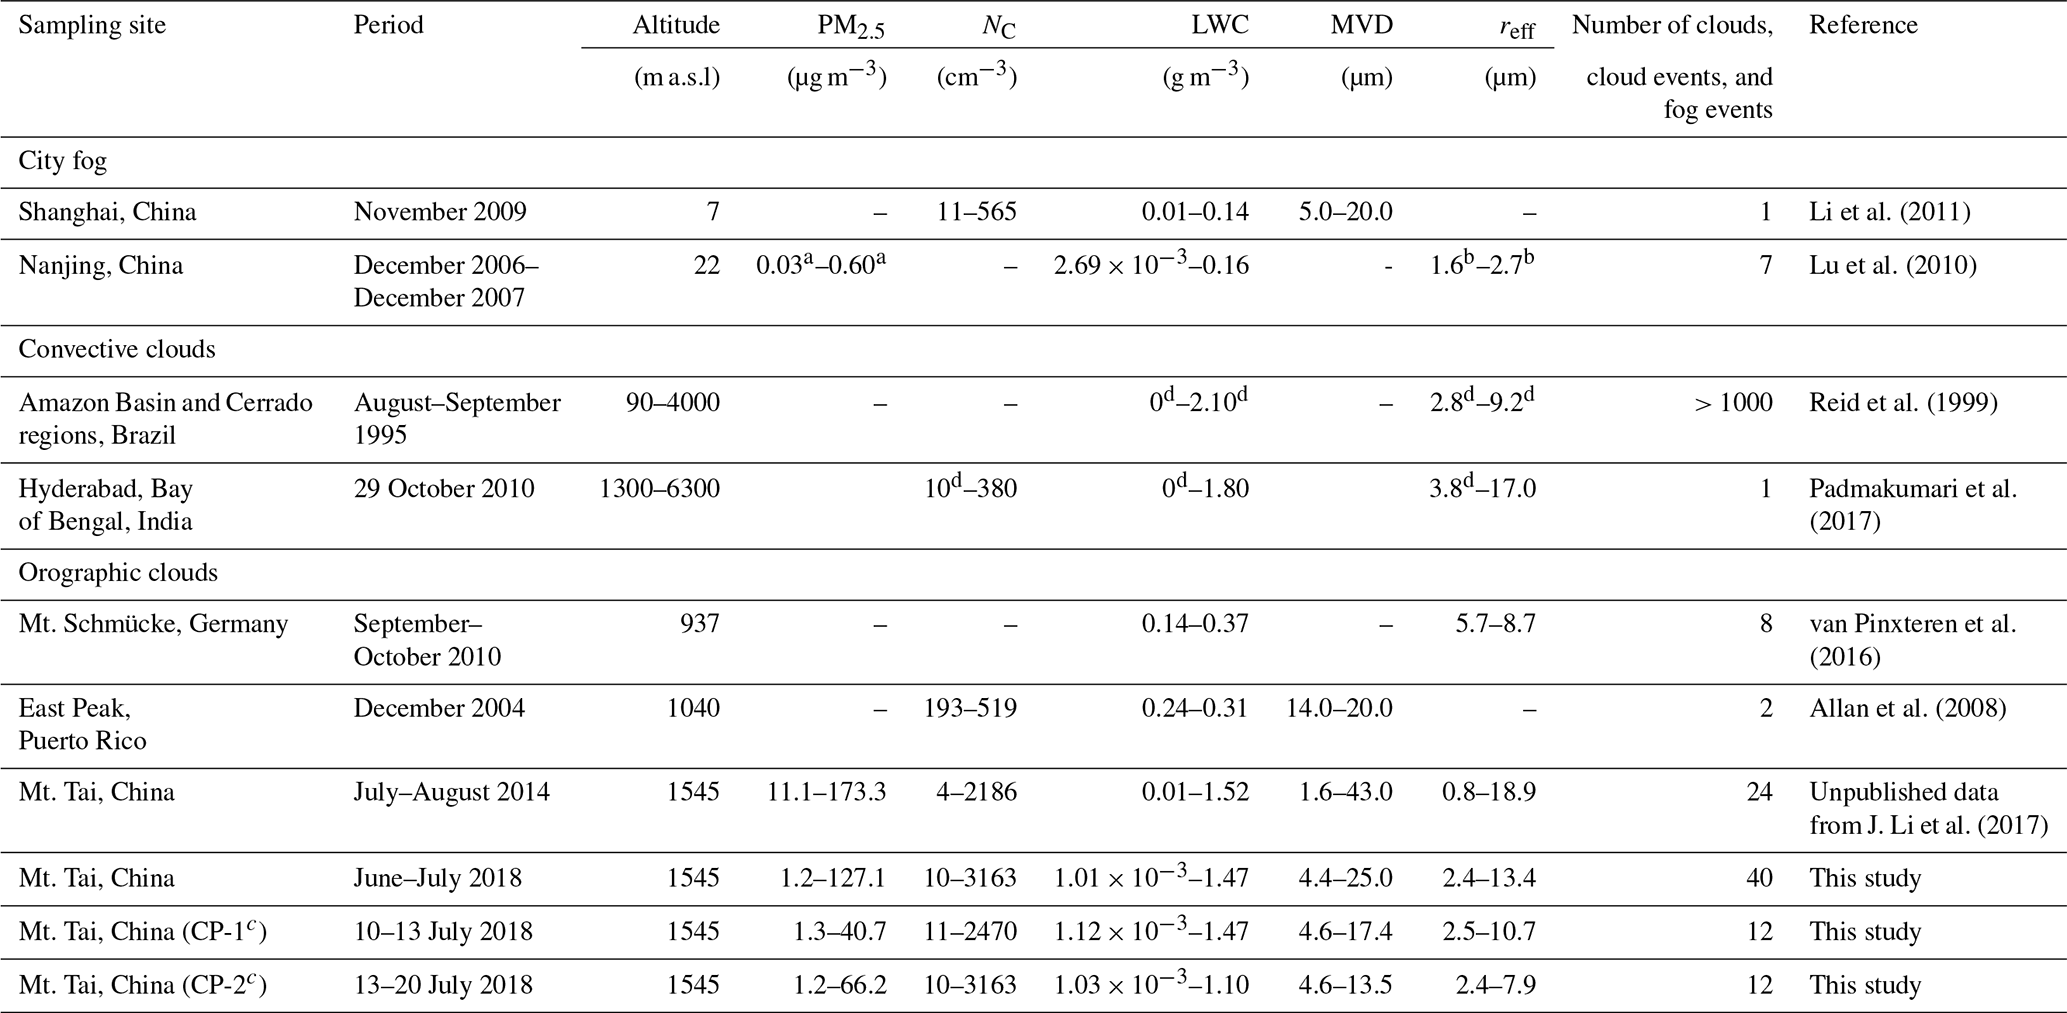
a Represents the mass concentrations of PM10. b Represents the range of averaged radius. c Two cloud processes which are detailedly discussed in this study. d Values were read from the graphs.

Figure 1(a) Plots of effective radius (reff) and (b)medium volume diameter (MVD) against liquid water content (LWC) for clouds and fog from the literature. The dotted, dot-dashed and solid lines represent orographic clouds, convective clouds and city fog, respectively. The areas represent the range of data obtained from the corresponding observations. The blue diamonds with error bars represent the average LWC and reff (or MVD) of 40 cloud events observed at Mt. Tai in this study with corresponding ranges.
The microphysics of different clouds and fog could generally be distinguished in a plot of reff (or MVD) against LWC. As illustrated in Fig. 1, the LWC generally increased on the order of city fog, orographic clouds, and convective clouds, and Mt. Tai generally follows this rule. It was consistent with the study by Penner et al. (2004) that LWC within clouds increases linearly with altitude. For LWC values of clouds at Mt. Tai, both the high values, which were comparable with convective clouds, and the low values, which were similar to city fog (Fig. 1), were monitored. It indicated that clouds at Mt. Tai appeared to show a larger range of LWC values. The increase in LWC at Mt. Tai was determined by the increase in reff and/or NC. However, sometimes only one factor played the dominant role. As illustrated in Table S1, NC, reff and LWC in cloud event 20 (CE-20) were 1519 cm−3, 5.2 µm and 0.54 g m−3, respectively, while the corresponding values in cloud event 16 (CE-16) were 59 cm−3, 9.8 µm and 0.14 g m−3, respectively. Even though reff of CE-20 was smaller when compared to CE-16, the higher NC determined the larger LWC of clouds in CE-20. In the following sections, the evolution of cloud and aerosol microphysical properties are presented. The influence of meteorological parameters (such as updraft velocity and cloud base height) and aerosol particle on cloud microphysics are discussed.
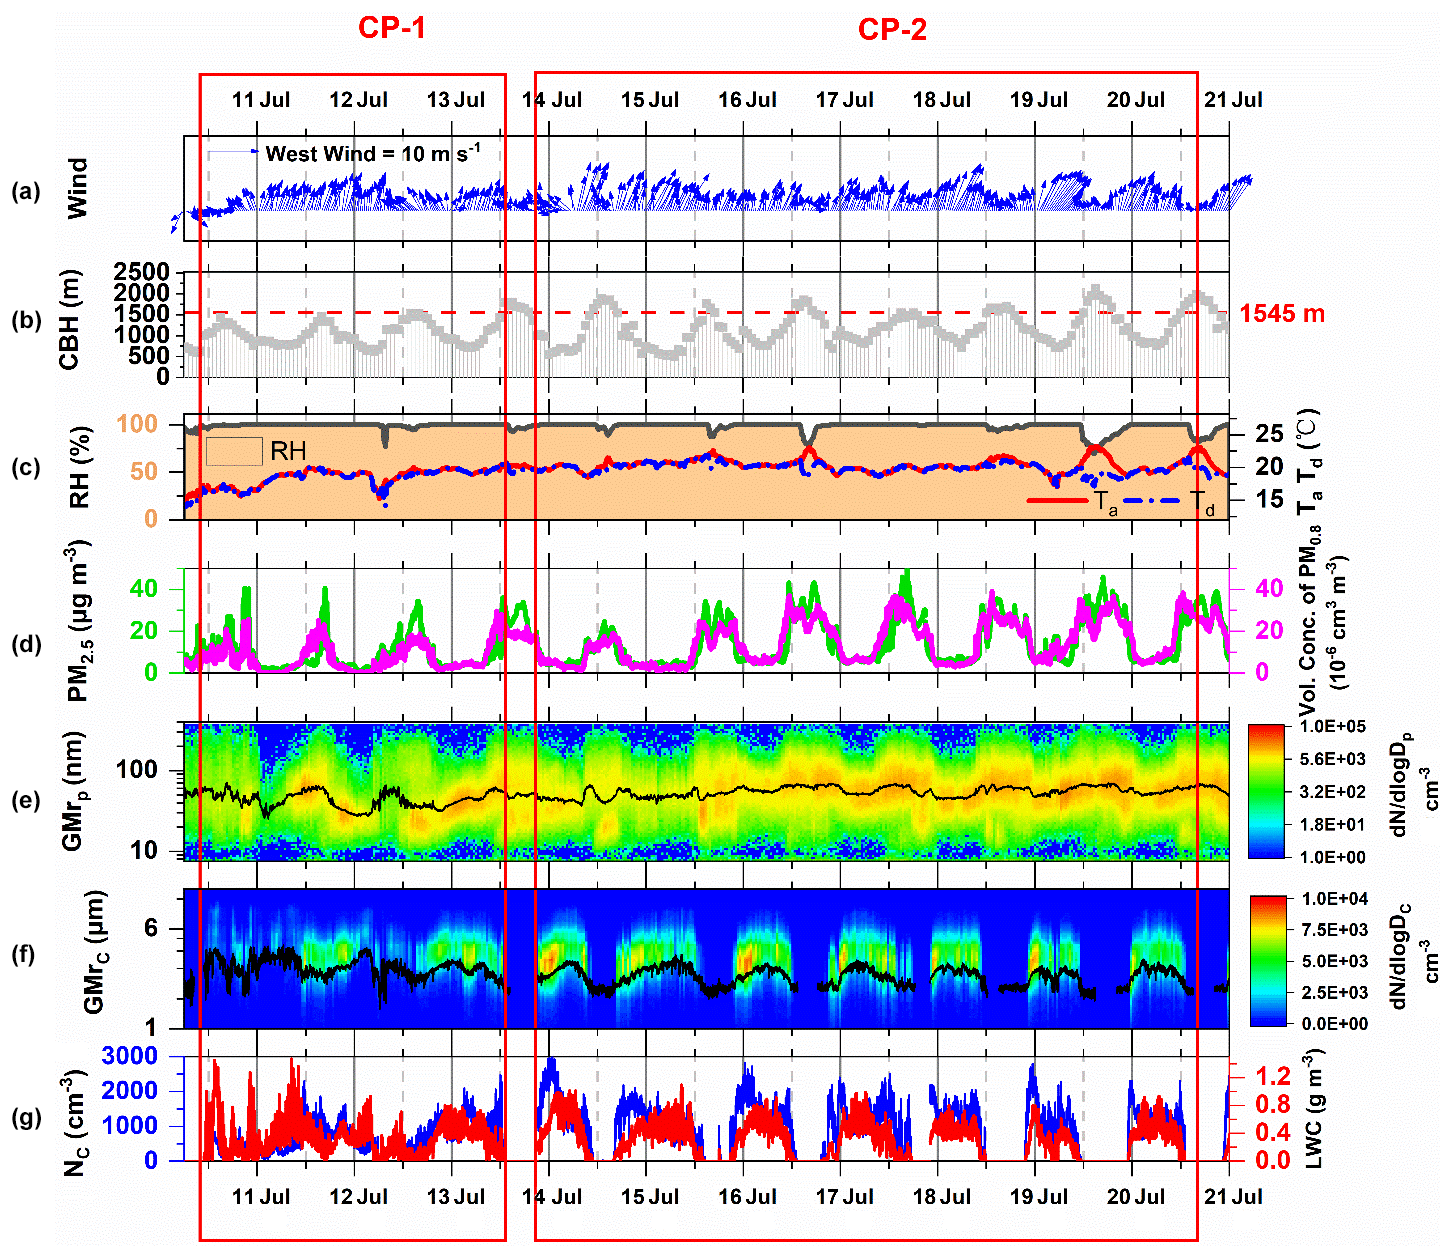
Figure 2The monitoring information of CP-1 and CP-2. Including (a) wind speed (WS, m s−1) and wind direction (WD); (b) cloud base height (CBH, m); (c) relative humidity (RH, %), ambient temperature (Ta, ∘C), and dew point temperature (Td, ∘C); (d) PM2.5 mass concentrations (µg m−3) and volume concentration of PM0.8 (10−6 cm3 cm−3); (e) size distribution of particles (13.6–763.5 nm) and corresponding geometric mean radius (GMrP); (f) size distribution of cloud droplets (2–50 µm) and corresponding geometric mean radius (GMrC); and (g) NC and LWC of cloud droplets.
3.2 Analysis of typical cloud processes
By assuming a density of particles ρ=1.58 g cm−3 (Cross et al., 2007), the mass concentrations of particles, which were calculated from the aerosol number size distribution measured by SMPS and named PM0.8, were highly consistent with PM2.5, especially when PM2.5 was less than 20 µg m−3 (Fig. 2c). Based on the mass concentration (PM2.5) and the number concentration (NP, which represented the total number concentration of aerosol particles measured by SMPS) of aerosols, two typical cloud processes, “cloud process-1” (CP-1) and “cloud process-2” (CP-2), were selected and analysed with respect to their special characteristics. The variations in updraft velocity vup on cloud microphysics during CP-1 and CP-2 were ignored for simplicity (Table S2, Figs. S3 and S4). The sampling angle (θs) and vup for CP-1 and CP-2 were 11.9∘ and 0.82 ± 0.29 m s−1 and 10.6∘ and 0.92 ± 0.36 m s−1, respectively (Table S2). According to the calculations provided by Spiegel et al. (2012), the aspiration efficiency and transmission efficiency of the fog monitor were all close to 1. In CP-1 (which only contained cloud event 19, CE-19), cloud droplets formed under a relatively stable (wind speed < 4 m s−1) and clean (PM2.5≈10.9 µg m−3 and NP≈1425 cm−3) conditions accompanied by a slow increase in Ta (Figs. 2 and 3). During daytime, especially in the afternoon, the PM2.5 mass concentration dramatically increased with few changes in wind speed and wind direction, meanwhile, NP reached to about 5000 cm−3 (Fig. 3). CP-1 persisted for 74 h, making it the longest cloud event during the presented campaign. Quite different from CP-1, CP-2 contained eight cloud events (CE-20 to cloud event 26, CE-26; see Fig. 3) and occurred periodically under high PM2.5 (Fig. 2, 50.7 µg m−3 on average) and high NP (Fig. 3, 1694 cm−3 on average) conditions. Cloud events in CP-2 formed after sunset, with a sharp decrease in PM2.5 and NP, and transitorily dissipated at noon accompanied with the increase in PM2.5, NP, Ta and cloud base height (CBH). For cloud water samples collected during CP-1 and CP-2, the percentage of chemical compositions did not change a lot (Fig. S5). The total measured dominant ions (sulfate, nitrate and ammonia) were 93.39 % in CP-1 and 90.37 % in CP-2. The high concentration of secondary ions in the cloud water samples indicated that clouds at Mt. Tai were dramatically influenced by anthropogenic emissions.
CP-1 was separated into four stages, SL1 (stage: low 1), SH1 (stage: high 1), SL2 (stage: low 2) and SH2 (stage: high 2), based on the aerosol concentrations (Fig. 3). The characteristics of SL1 and SL2 were low NC (383 and 347 cm−3, respectively), large reff (7.26 and 6.36 µm, respectively) and high LWC ∕ NC (which represents the average water each cloud droplet contained: 1.01 and 0.75 ng, respectively). During SH1 and SH2, a dramatic increase in NC (to 949 and 847 cm−3, respectively), decrease in reff (to 4.90 and 4.88 µm, respectively) and decrease in LWC ∕ NC (to 0.35 and 0.36 ng, respectively) were found with the increase in NP (to 4196 and 4665 cm−3, respectively).
Each cloud event of CP-2 was separated into an activation stage (S1), collision–coalescence stage (S2), stable stage (S3) and dissipation stage (S4) according to the regular changes in NC and LWC ∕ NC (Fig. 3a). In S1, NC dramatically increased to its maximum value among the cloud events. In S2, NC declined sharply to a stable value, meanwhile LWC ∕ NC reached the maximum value. In S3, NC was stable or slightly varied and LWC ∕ NC started to decrease. In S4, both NC and LWC ∕ NC decreased sharply and finally arrived at zero. Even though the two stages (S2 and S3) in cloud event 25 (CE-25) did not totally follow the division rules, the other six cloud events followed them closely. This indicated that the division was helpful for the study of the variations of cloud microphysical properties during CP-2. The newly formed cloud droplets during S1 were characterised by small size, high NC and low LWC ∕ NC values (Figs. 2f and 3b). For example, about 2310 cm−3 of cloud droplets can quickly form in the first 2 h of CE-20. The reff of these droplets was smaller than 4.1 µm, and LWC ∕ NC was about 0.2 ng. In going from S2 to S3, the strong collision–coalescence between cloud droplets caused the increase in both reff and LWC ∕ NC. In S4, the increase in PM2.5, through evaporation of cloud droplets or lifting of CBH (Fig. 2), was observed to coincide with the vanishing of cloud events (Mazoyer et al., 2019; J. Li et al., 2017).

Figure 3Variation of (a) NC, Np, and NCCN,0.2 and (b) NCCN,0.2∕NP and LWC ∕ NC during CP-1 and CP-2.
3.3 Relationships among NP, NCCN and NC
In this study, both consistent variation and inverse variation between NP and NC were observed. NP and NC showed consistent variation in CP-1. However, in CP-2, an obviously inverse variation was found between NP and NC in S1 and S4, while a consistent variation was found between NP and NC in S2 and S3 (Figs. 3a, 4b, and c). Some in situ observations (Lu et al., 2007; Mazoyer et al., 2019) and modelling studies (Heikenfeld et al., 2019; Zhang et al., 2014) supported the viewpoint that the increase in NP brings more CCN and further increases NC, which could cause the consistent variation between NP and NC. In contrast, some recent studies of fog also suggested that the increase in NP could decrease the ambient supersaturation and then decrease NC (Boutle et al., 2018; Mazoyer et al., 2019). Besides, Modini et al. (2015) found inverse variation between NC and the number of particles with diameters larger than 100 nm due to the reduction of supersaturation by coarse primary marine aerosol particles. In general, the covariation between Np and NC could be affected by many factors, including competition of water vapour between aerosol particles and/or cloud droplets, the scavenging of particles by cloud droplets, and new particle formation through cloud processes. In this study, consistent variation between NP and NC was characterised with higher LWC ∕ NC, while inverse variation between NP and NC appeared with lower LWC ∕ NC. The average LWC ∕ NC was 0.61 ng in CP-1 and was 0.15, 0.42, 0.39 and 0.16 ng in S1, S2, S3 and S4, respectively, in CP-2. The relatively higher LWC ∕ NC values could indicate conditions where the amount of water vapour was not limiting cloud droplet formation. Once NP increased, part of the cloud water was taken away by the CCN in the particles to form new droplets, and the remaining amount of water was still sufficient to maintain the previous droplets in liquid state. Thus, both NP and NC simultaneously increased. On the other hand, relatively low LWC ∕ NC values could, to some extent, limit the formation of new cloud droplets. The activated particles that grew at the beginning of the cloud cycle would lower the surrounding supersaturation and to some extent limit further aerosol activation (Ekman et al., 2011). The part of the water taken by the CCN in the particles was not enough to change all of them into new droplets, and the remaining amount of water was also insufficient to maintain all of the previous droplets in a liquid state. Following this, the NC would decrease and the higher the NP becomes, the sharper decrease the NC will be. Thus, the inverse variation between NP and NC was observed.
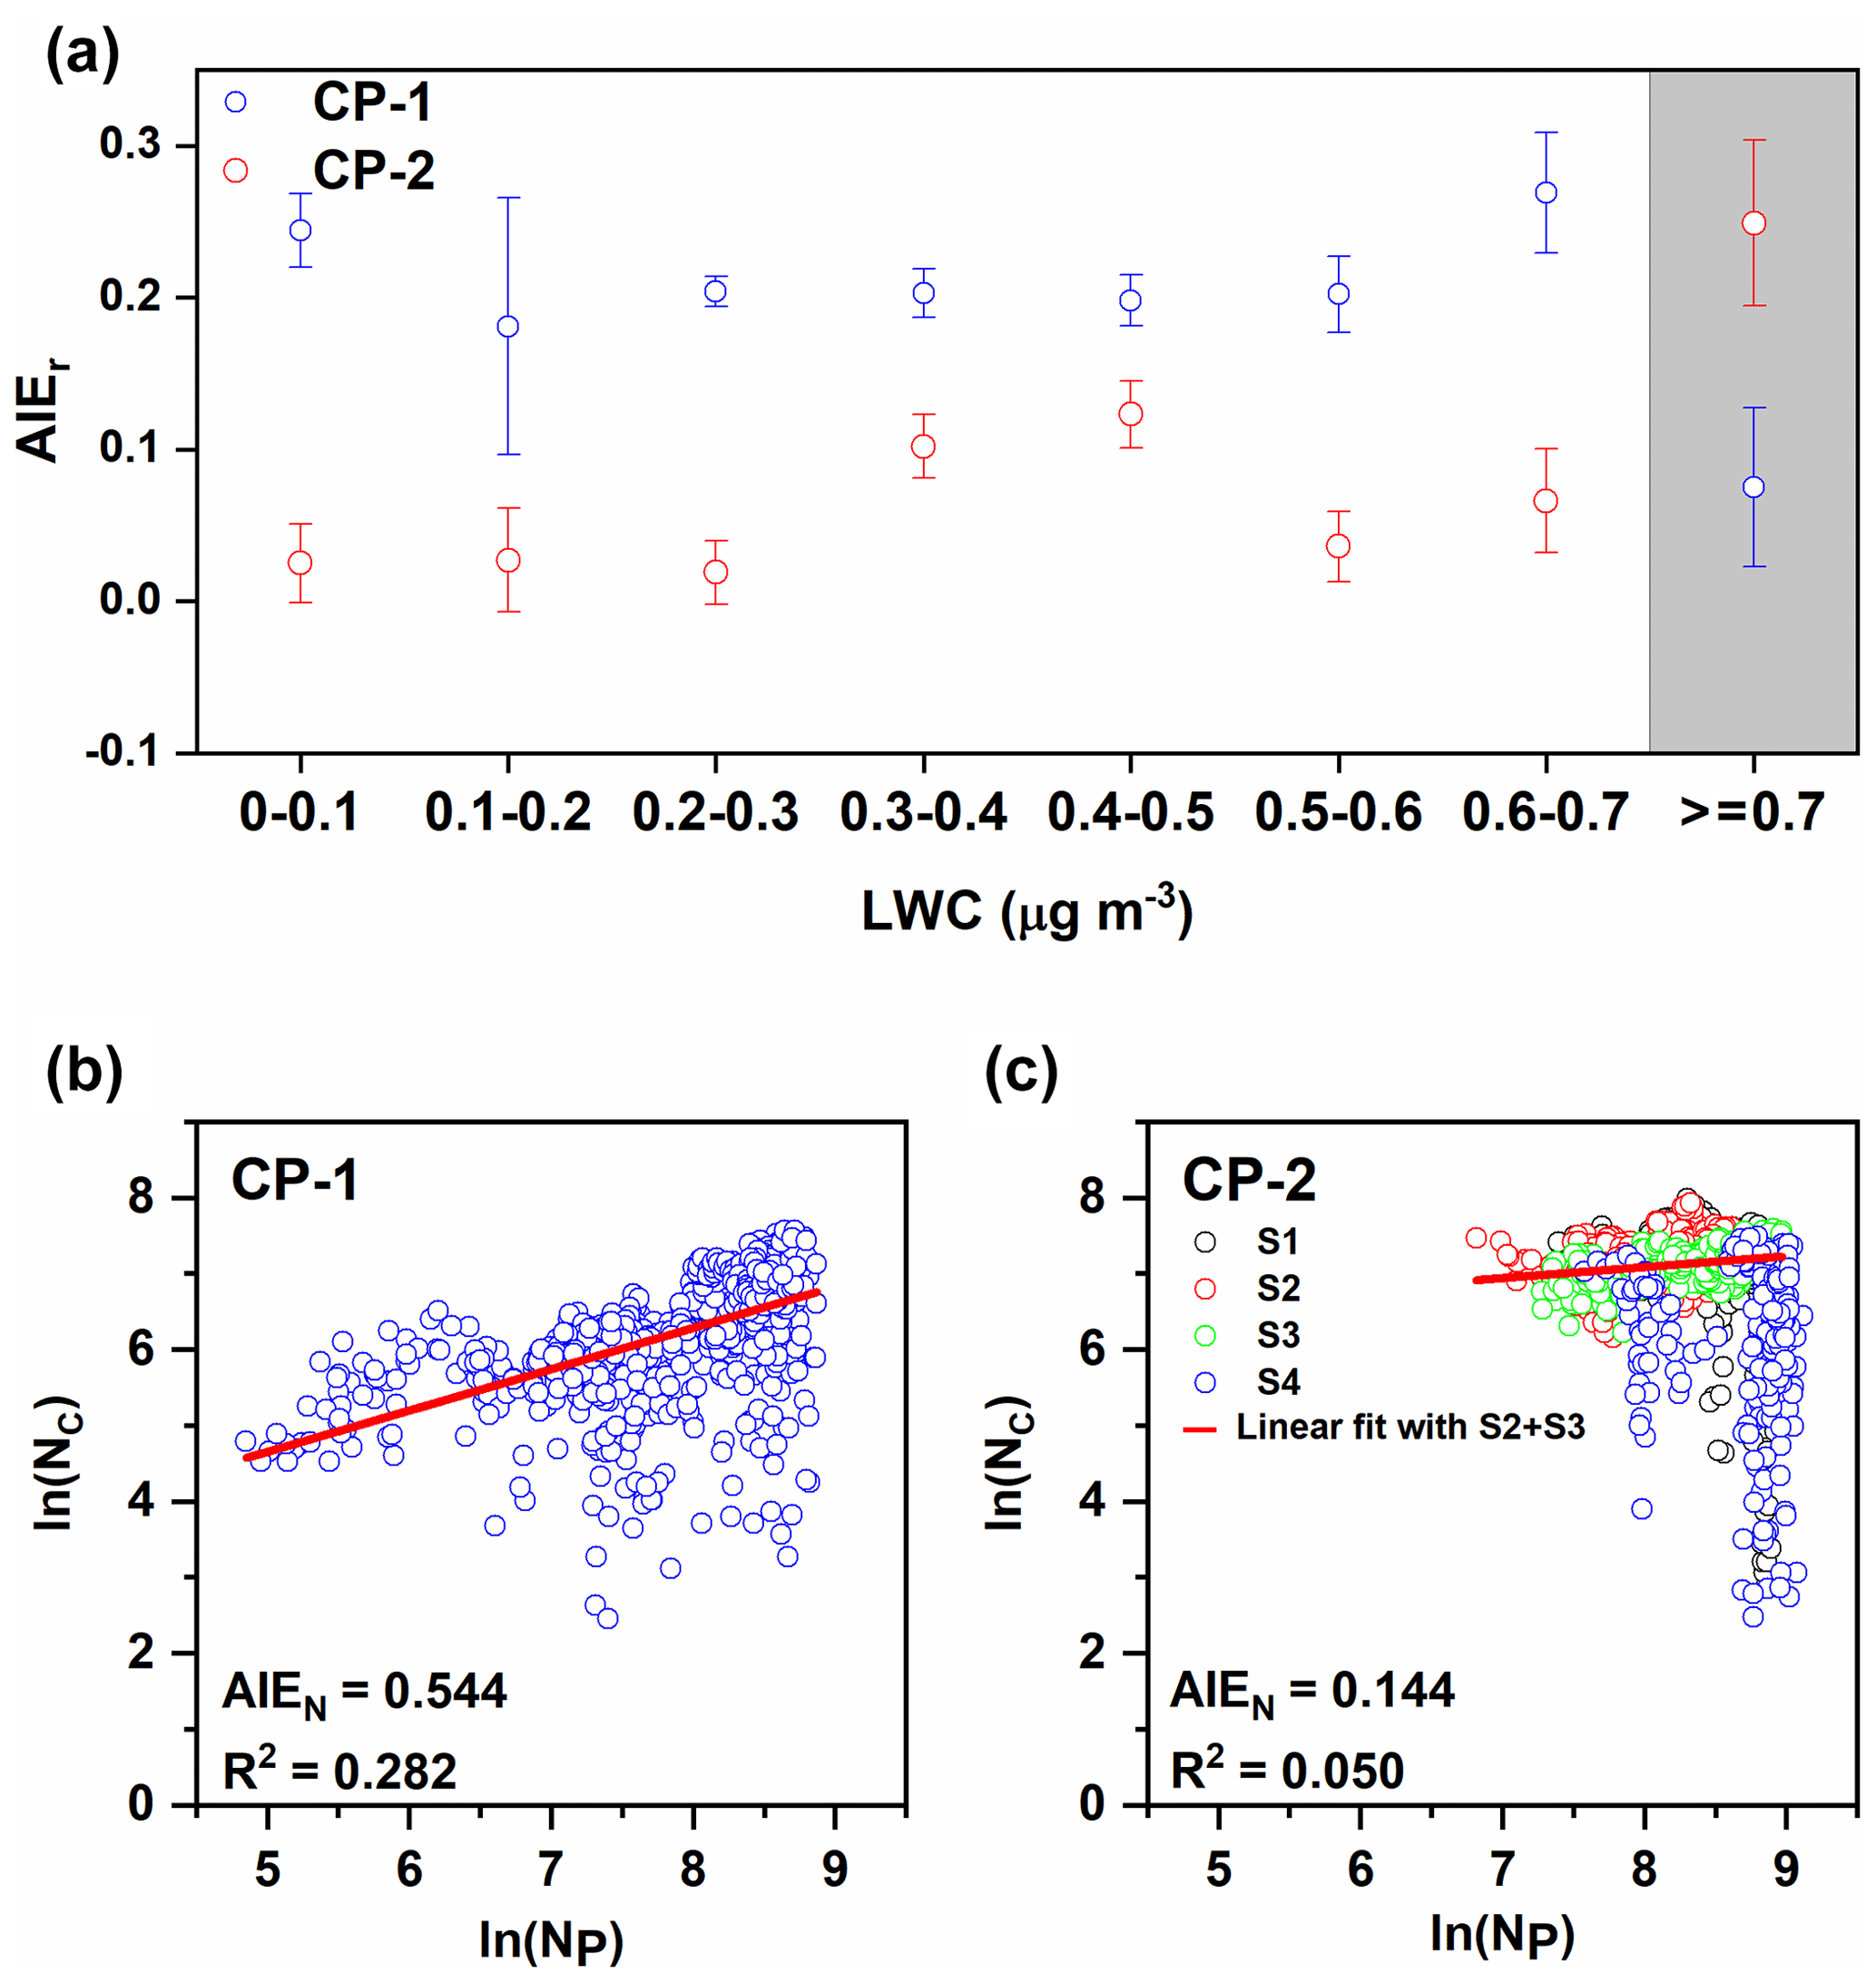
Figure 4(a) The determination of AIEr for each LWC bin with 0.1 g m−3. The determination of AIEN based on NC (b) during CP-1 and (c) during CP-2.
The ratio between NCCN and NP reflects the activation ratio of aerosol particles. As shown in Fig. S6, NCCN increased with the increase in SS. In addition, NCCN of CP-2 was higher than that of CP-1 at the same SS. In order to compare with previous studies as discussed below, SS = 0.2 % was chosen to calculate NCCN / NP, which represented the activation ratio of aerosol particles. As shown in Fig. 3b, NCCN,0.2 ∕ Np (activation ratio at a certain SS = 0.2 %) ranged from 0.06 to 0.69 in CP-1, yet it ranged from 0.22 to 0.66 in CP-2. The average value of 0.30 in CP-1 was smaller than that of 0.38 in CP-2, and values lower than 0.22 did not appear during CP-2. This indicated that the activation of aerosol particles in CP-2 was relatively easy. Both the size distribution and the chemical composition could impact the cloud-nucleating ability of aerosol particles (Dusek et al., 2006; Mazoyer et al., 2019). Figure S7 shows the relation between NCCN,0.2 ∕ NP and GMrP during CP-1 and CP-2. As can be seen in Fig. S7, higher correlation of NCCN,0.2 ∕ NP with GMrP was found during CP-1 than during CP-2, which suggested that the physical properties might have more influence on the activation of aerosols during CP-1. Aside from this, Asmi et al. (2012) found that higher NCCN ∕ NP and a more concentrated plot of NCCN versus NP usually occurred during winter when a higher fraction of aged organics was observed during the observation programme at Puy-de-Dôme, France. In this study, the plot of NCCN,0.2 versus NP was found to be more scattered in CP-1 than in CP-2 (Fig. S8). Even though the chosen SS in this study (SS = 0.2 %) is different from that at Puy-de-Dôme (SS = 0.24 %), most of the data points of CP-1 and CP-2 were distributed between the two recommended dashed lines (the visually defined boundaries within most of the data are centred, Fig. S8) by Asmi et al. (2012). This suggested that the difference in aerosol organic chemical compositions during CP-1 and CP-2 might also explain the different activation ratio of aerosol particles during these two cloud processes.
3.4 The influence of NP, CBH and vup on cloud microphysics
No negative AIEr or AIEN were found in this study (Fig. 4). The positive AIEr and AIEN at Mt. Tai mean that the increase in NP is accompanied by decreased reff and increased NC. However, in the studies of Yuan et al. (2008) and Tang et al. (2014), AOD was applied to represent aerosol loading and negative AIEr (indicating reff increased with the increasing of AOD) near the coastlines of the Gulf of Mexico, the South China Sea and over eastern China. The reason proposed by Yuan et al. (2008) was the increasing slightly soluble organic (SSO) particles, which would increase the critical supersaturation and hinder the activation of the particles. Meanwhile, Tang et al. (2014) showed that the meteorological conditions, which favoured the transportation of pollutants and water vapour, led to simultaneous increases in both AOD and reff. Different from the coastal area, the summit of Mt. Tai is relatively far from the sea (around 230 km from the Bohai Sea and Yellow Sea) (Guo et al., 2012), leading to less moisture in the air. This might hinder the growth of cloud droplets and cause the positive AIEr. In addition, the increase in LWC was found to covary with the decrease in AIE, especially at coastal sites (McComiskey et al., 2009; Zhao et al., 2012). However, non-obvious variation was found between AIEr and LWC at Mt. Tai (Fig. 4a). It might due to the high aerosol loading during cloud processes (Zhao et al., 2012).
Although all positive AIEr and AIEN were found in CP-1 and CP-2, the specific values were different. According to the studies of AIEr and AIEN of CP-1 and CP-2, our results suggested that cloud droplet numbers were more sensitive to NP under conditions with lower aerosol concentrations. The calculation of AIEr was shown in Fig. S9 and summarised in Fig. 4. As shown in Fig. 4a, except for the out-of-bounds AIEr values calculated with insufficient data points when LWC was larger than 0.7 g m−3, AIEr of 0.181–0.269 for CP-1 was always higher than that of 0.025–0.123 for CP-2 in corresponding narrow LWC ranges. When calculating AIEN, the number of cloud droplets may be underestimated during the activation and dissipation stages (Mazoyer et al., 2019), due to the limitations of the fog monitor, which could be a cause of the low R2 of AIEN in CP-1. In CP-2, only the data of S2 and S3 were employed to calculate AIEN for excluding the points in S1 and S4, which may be an underestimation. As shown in Fig. 4b and c, both the slope (0.144) and R2 (0.050) of CP-2 are lower than those (0.544 and 0.282, respectively) of CP-1. It was verified that cloud droplets in CP-2 were influenced little by aerosols. In the previous studies, both observation and modelling studies also found that AIEr was higher under smaller aerosol amount conditions. Twohy et al. (2005) measured the equivalent AIEr of 0.27 on the California coast, while Zhao et al. (2018) used satellite observations to attribute lower values of 0.10–0.19 for convective clouds over Hebei, a polluted region in China. Using an adiabatic cloud parcel model, Feingold (2003) found that AIEr increased from 0.199 to 0.301 when NP decreased to less than 1000 cm−3. By using the Community Atmospheric Model version 5 (CAM5), Zhao et al. (2012) also found high AIEr values in the tropical western Pacific at Darwin (TWP) due to the low NP in December, January and February. Through studying the impact of ship-produced aerosols on the microstructure and albedo of warm marine stratocumulus clouds, Durkee et al. (2000) found that the clean and shallow boundary layers would be more readily perturbed by the addition of ship particle effluent. In this study, the higher values of AIEr and AIEN of CP-1 indicated that if the same amount of aerosol particles entered into the cloud, the microphysical parameters would be influenced more in CP-1 than in CP-2.
In addition, the meteorological conditions and the topography during the monitoring period would also affect the microphysical properties of clouds. During the observation period, CBH ranged from 460.3 to 3639.1 m with an average value of 1382.5 m. The observation station would be totally enveloped in clouds when cloud events occurred, and the corresponding distance between the observation point and CBH is represented in Fig. 2b. The sensitivity analysis of NC to CBH and vup was estimated by applying the equation as S(, where Xi represented CBH and vup. As shown in Table S2, CP-2 was more sensitive to the variation of meteorological parameters if compared with CP-1. This is consistent with the study done by McFiggans et al. (2006). They found that the sensitivity of NC to vup increased, while the sensitivity of NC to NP decreased when NP > 1000 cm−3. The higher values of S(CBH) and S(vup) of CP-2 indicated that CP-2 was more sensitive to the change in CBH and vup. This might cause the periodical variations of cloud microphysical properties during CP-2.
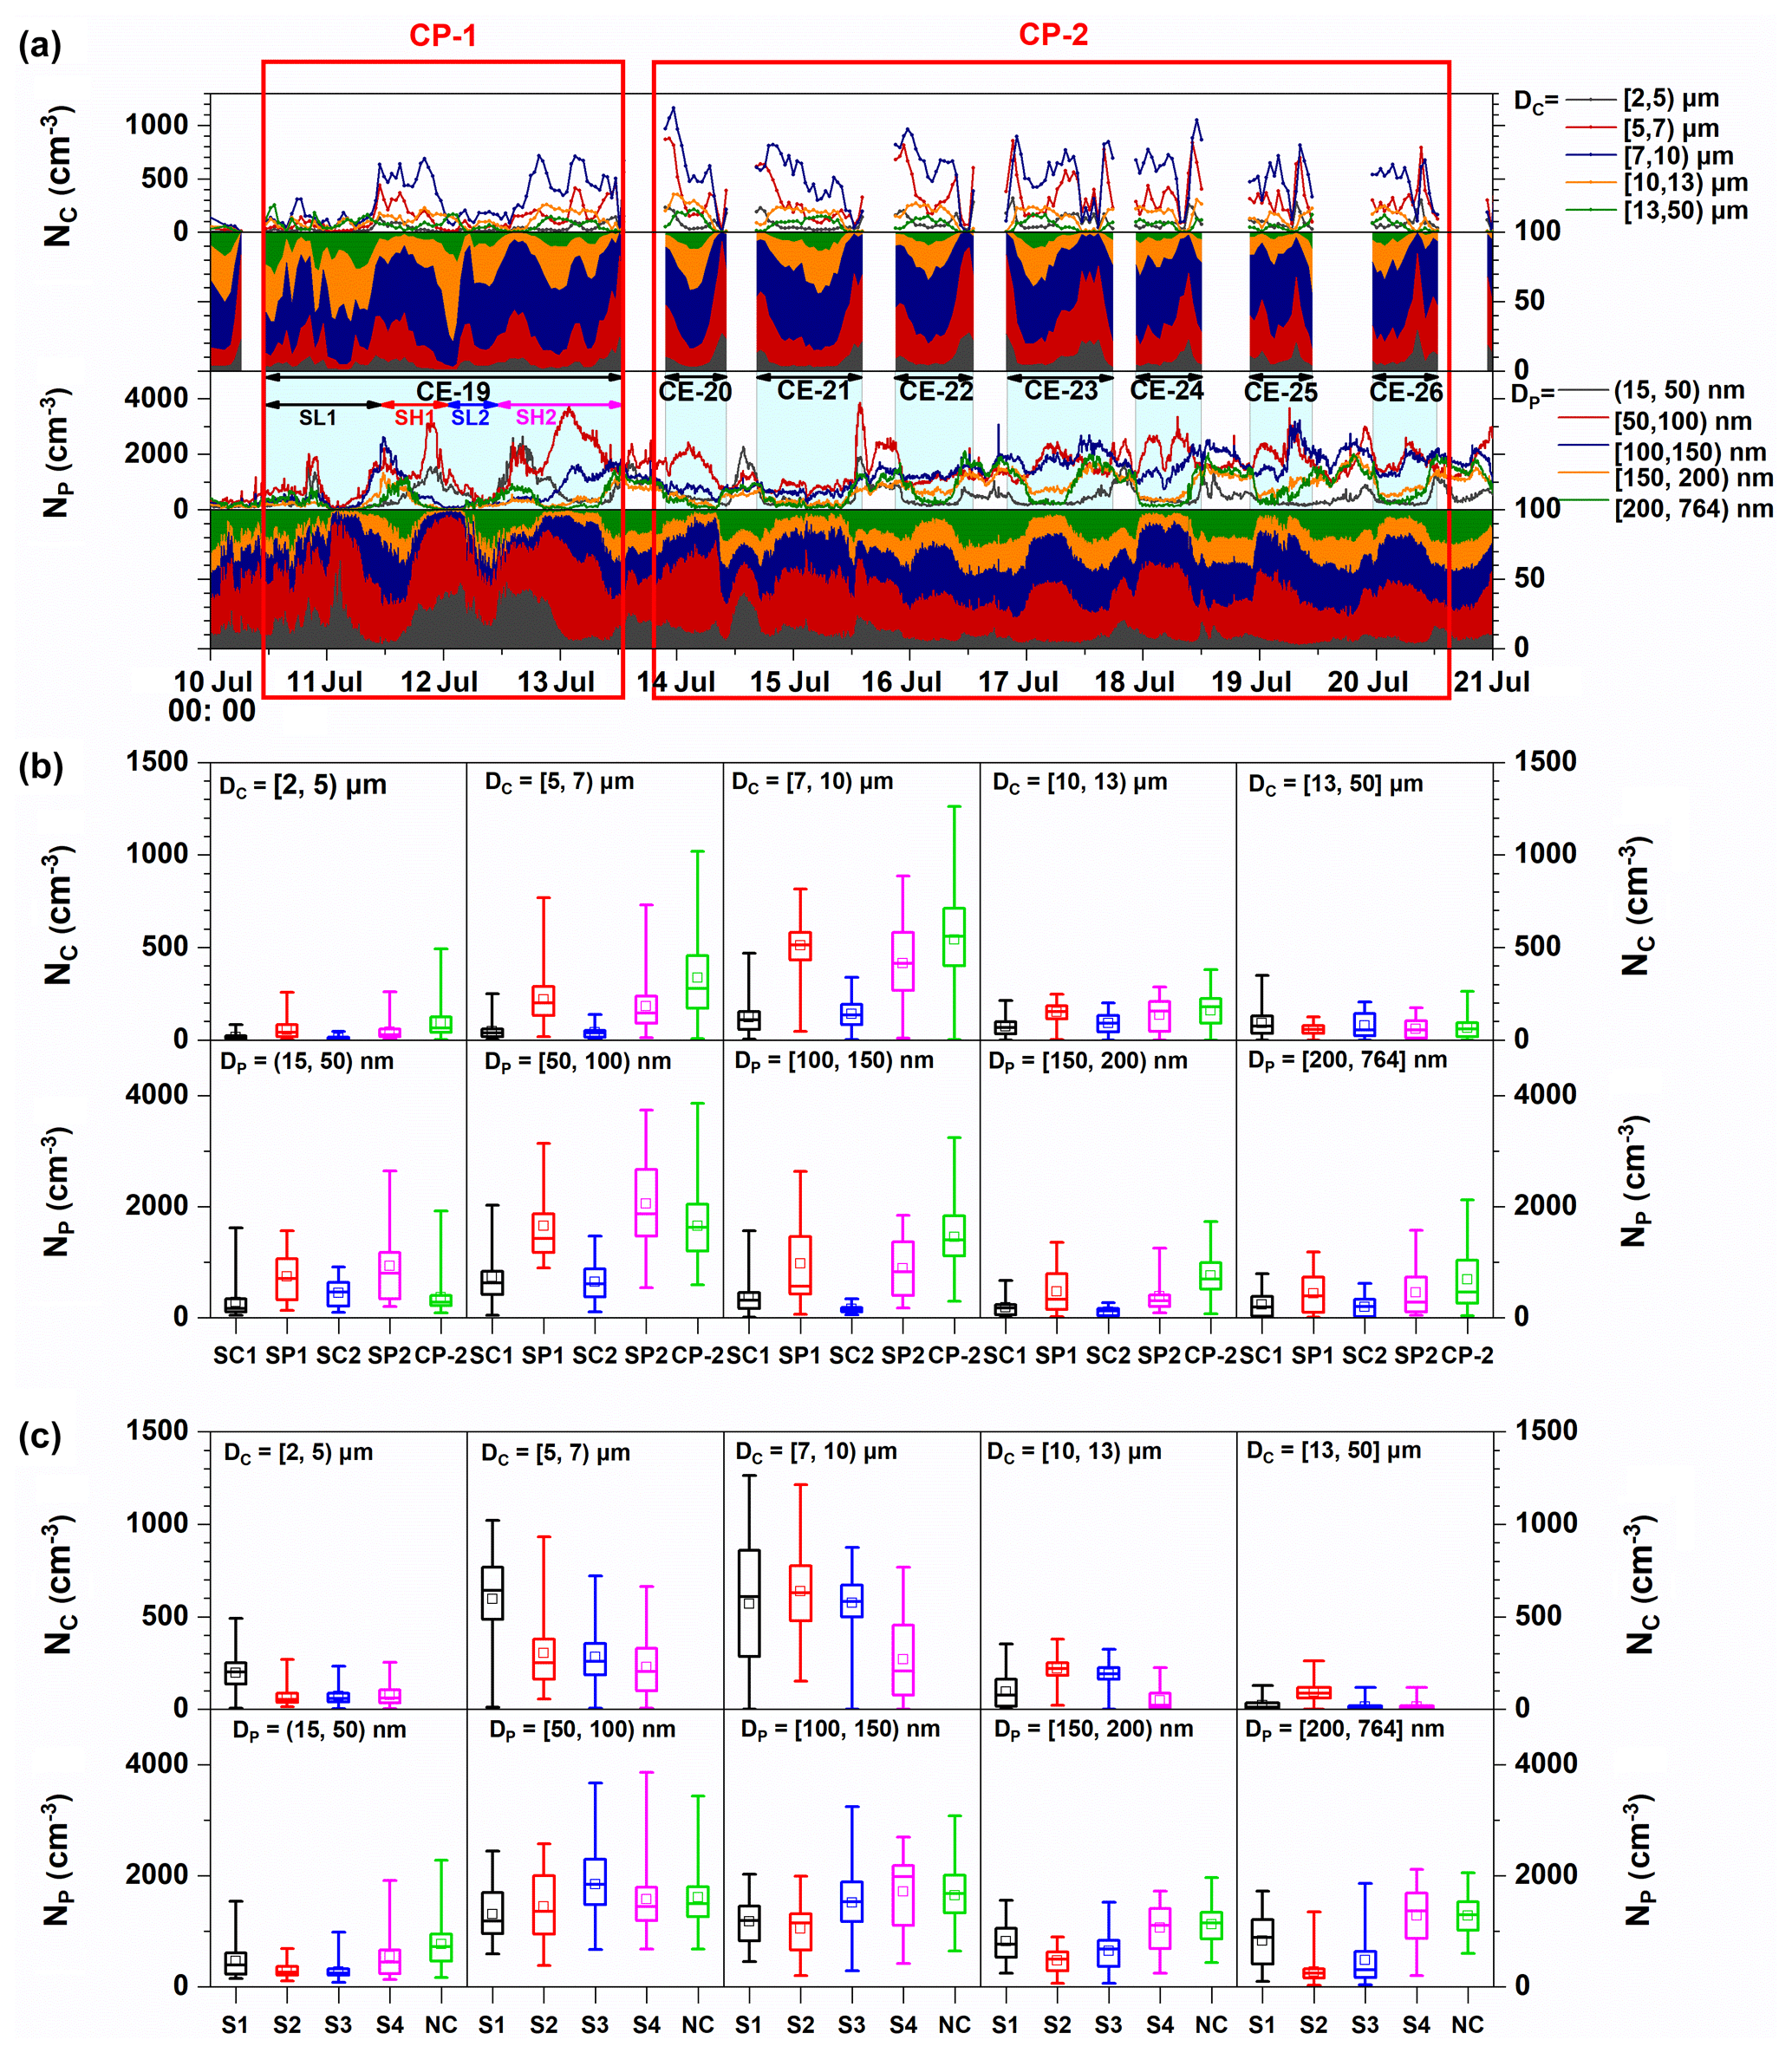
Figure 5Size distribution of particles and cloud droplets during CP-1 and CP-2. (a) Time series plot of NC in five size ranges, [2, 5) µm, [5, 7) µm, [7, 10) µm, [10, 13) µm, and [13, 50) µm, and NP in five size ranges, (15, 50) nm, [50, 100) nm, [100, 150) nm, [150, 200) nm, and [200, 765) nm. (b) Five size ranges of NC and five size ranges of NP in SL1, SH1, SL2, SH2, and CP-2; (c) five size ranges of NC and five size ranges of NP in S1, S2, S3, S4, and NC (“NC” in c represents particle size distributions during the cloudless period).
3.5 Size distribution of cloud droplets and particles
To illustrate the evolution of the aerosol particles and cloud droplets during the cloud processes, the size distributions of NP and NC during different cloud stages are plotted in Fig. 5. For each of the four size bins, ranging from 2 to 13 µm, cloud number concentrations of SL1 and SL2 were lower than those of SH1 and SH2. However, in the size bin of 13–50 µm, NC of SL1 and SL2 were the largest (Fig. 5b). The size distributions of cloud droplets in SL1 and SL2 resulted in the larger reff during the two stages, which was consistent with the result shown in Fig. 3b. During SH1 and SH2 in CP-1, the numbers of aerosol particles in all size bins increased. However, the increase in aerosol particles larger than 150 nm was the smallest, indicating that aerosols larger than 150 nm were more easily activated into cloud droplets. The activation of aerosol particles with sizes larger than 150 nm in this study dramatically increased NC of 5–10 µm and made NC of SH1 and SH2 in different size bins all comparable with those of CP-2 (Fig. 5b).
As shown in Fig. 5c, cloud droplets with DC ranging from 5 to 10 µm had high NC in each stage in CP-2, and cloud droplets with DC ranging from 13 to 50 µm had low NC in each stage if compared to CP-1. This caused the lower reff in CP-2 than in CP-1. During CP-2, aerosol particles with diameters larger than 150 nm quickly decreased by activation when cloud events occurred, while the number of aerosol particles in the size of 50–150 nm were slightly influenced by cloud events (see the left-most graph of Fig. 5a). This was consistent with the study of Targino et al. (2007), who found aerosol size distributions of cloud residuals, which represented aerosol particles activated to cloud droplets, peaked at about 0.15 µm at Mt. Åreskutan. Mertes et al. (2005) also found that particles centred at dp=200 nm could be efficiently activated to droplets, while most Aitken mode particles remained in the interstitial phase. Compared with other stages, S1 had the highest NC in two size bins of (2, 5) and [5, 7) µm. This indicated that large numbers of cloud droplets with small sizes were formed in the beginning of cloud events in CP-2.

Figure 6The plot of LWC versus reff (a) in different cloud stages of CP-1 and CP-2, (b) under different NC ranges, and (c) under different NCCN. The time resolution of the corresponding data was 5 min in (a) and (b) and 50 min in (c). (d) The plot of albedo versus the variation of cloud thickness during CP-1 and CP-2. The averaged values of LWC and NC of CP-1 and CP-2 were applied to calculate albedo according to the equations in Sect. 2.8.
3.6 Relations among LWC, reff and NC
The 5 min averaged LWC for CP-1 and CP-2 is plotted against corresponding reff in Fig. 6a. Large cloud droplets (reff>8 µm) were observed in CP-1, while the reff for CP-2 varied narrowly in the range of 2.5–8 µm.
Cloud droplets with reff>8 µm only occurred in the two relatively clean stages, SL1 and SL2, during CP-1. It was due to the weaker competition among droplets at lower NCCN conditions. This was also observed in the US mid-Atlantic region where cloud droplets with larger sizes are more easily formed with lower NCCN (S. Li et al., 2017). At the same LWC level, the growth of cloud droplets during SH1 and SH2 was obviously limited if compared with SL1 and SL2, which is referred to as the “Twomey effect” (Twomey, 1977). This is consistent with the illustration in Fig. 3 that cloud droplets in SH1 and SH2 were smaller.
The variation reff and/or NC can influence LWC, while the key factor may be different in different stages of the cloud. As shown in the lower row of Fig. 6a, CE-20 was taken as an example to discuss the relation among LWC, reff and NC in different cloud stages. During S1, the existing numerous CCN (Fig. 3a) were quickly activated to form cloud droplets. The newly formed droplets were characterised with small sizes but large numbers. They will suppress the beginning of collision–coalescence processes (Rosenfeld et al., 2014a) and may further significantly delay raindrop formation (Qian et al., 2009). In S1, NC and reff consistently varied. Both the increase in NC (from 1188 to 2940 cm−3) and the growth of reff (from ∼ 3.5 µm to ∼ 4.5 µm) boosted the LWC in this stage. This is different from the results of Mazoyer et al. (2019), who found a clearly inverse relationship between the number and the size of droplets at the beginning of the first hour of fog events during an observation in suburban Paris. When compared with fog, cloud is usually formed under conditions with more condensible water vapour (Fig. 1). The limited growth of droplets in fog will not occur in cloud. This causes the positive relationship with cloud droplet number and droplet size. At the beginning of S2, NC reached the maximum. The high NC yielded a great coalescence rate between cloud droplets. Meanwhile, the coalescence process was self-accelerating (Freud and Rosenfeld, 2012) and thus caused the quick decrease in NC (Fig. 3a). This made cloud droplets in S2 that were characterised by larger sizes and lower number concentrations, whilst LWC simply varied in a relatively narrow range (Fig. 6a). During S3, NC was almost constant due to the formation, coagulation and evaporation of the cloud droplets reaching a balance. As shown in Fig. 6a, the relationship between reff and LWC in this stage could be fitting as , which meant under the increase in LWC, the NC was almost unchanged. The variation of LWC values was mainly due to the changes in droplet sizes. At the dissipation stage of S4, the increase in CBH brought air with low RH and high NP to the summit of Mt. Tai and caused the dissipation of cloud events (Figs. 2c and 3a). The previously activated CCN returned to the interstitial aerosol phase due to the evaporation of the droplets (Verheggen et al., 2007). Both NC and reff declined. It was also illustrated in Fig. 5c that all of the NC in the five size bins of cloud droplets decreased in S4.
In order to investigate the variation of reff upon NC, the distribution of reff was classified with different NC ranges in Fig. 6b. For NC < 1000 cm−3, reff displayed a trimodal distribution and concentrated on 3.25 µm (Peak-1), 4.86 µm (Peak-2) and 7.52 µm (Peak-3). Peak-1 corresponded to cloud droplets with low NC, LWC and reff values, while the NCCN0.2 was very high (Fig. 6c). These points represented cloud droplets in the incipient stage or the dissipation stage of cloud events where large numbers of CCN exist in the atmosphere. Peak-2 and Peak-3 represented the matured stages for cloud events with different environmental conditions. Peak-3 represented cloud droplets formed under a relatively clean atmosphere. In this circumstance, CCN were efficiently activated and had a lower concentration remaining in the atmosphere (Fig. 6c). The sufficient ambient water vapour accelerated the growth of the formed droplets, which were characterised with low NC and LWC but large reff. Peak-2 represented cloud droplets formed under relatively polluted conditions and was the only peak found for NC larger than 1000 cm−3. With the increase in NC, the distribution of this peak narrowed and slightly moved to lower reff mode.
The thickness of orographic cloud can be easily influenced by the specific topography and environmental conditions (Barros and Lettenmaier, 1994; Welch et al., 2008). When assuming the cloud thickness during CP-1 and CP-2 to be equal, albedo would depend on the values of LWC and NC, as described in Sect. 2.8. Cloud albedo during CP-2 was always higher than that during CP-1, especially when the cloud thickness was lower than about 2500 m (Fig. 6d). Note that the increase in NC could enhance the evaporation and further reduce the lifetime of cloud, which was not taken into account when calculating the induced albedo. Through studying marine stratocumulus clouds in the north-eastern Pacific Ocean, Twohy et al. (2005) also found that the increase in NC by a factor of 2.8 would lead to 40 % increase in albedo, going from 0.325 to 0.458. This indicated that the higher NC would increase the cloud albedo when assuming no change to cloud thickness and when disregarding any cloud lifetime effects.
From 17 June to 30 July 2018, in situ observations of number concentrations and size distributions of aerosol particles and cloud droplets were used to study aerosol–cloud interactions at the summit of Mt. Tai. Large variations of the characteristic values in terms of NC, LWC and reff were found during the observation period. Cloud events with small reff and low LWC similar to urban fog were also observed at Mt. Tai.
Two typical cloud processes, CP-1 and CP-2, were applied to study the cloud–aerosol interactions based on the aerosol characteristics (especially NP and NCCN) before cloud onsets. For the CP-1, which corresponded to relatively clean conditions, water content was sufficient, while NCCN was considered the limitation of cloud droplet formation according to the observation results. The newly formed cloud droplets were characterised with low NC, high LWC ∕ NC and large reff. With the increase in aerosol concentration, NC was found to dramatically increase. Large numbers of NCCN competed for the water content with the formed cloud droplets and, as a result, further dramatically decrease the LWC ∕ NC and reff values of cloud droplets. In CP-2, NP before the cloud onset was high and NCCN was sufficient. Water vapour was considered the limitation for cloud formation. Large numbers of small cloud droplets with low LWC ∕ NC were observed in the incipient stage of cloud events. In addition, periodical changes in cloud microphysical properties were found. Both consistent variation and inverse variation between NP and NC were observed in this study, which were characterised with relatively high and low LWC ∕ NC values, respectively.
Both positive AIEr and AIEN values observed at Mt. Tai indicate that the increase in NP will decrease reff and increase NC of cloud droplets. The lower values of AIEr and AIEN with higher NP and NCCN suggest that the increase in NP will more strongly decrease the size and increase the number of cloud droplets under the conditions with smaller aerosol amounts. Through studying the size distributions of aerosol particles and cloud droplets, higher NC in the size bin of 13–50 µm resulted in the larger reff during the two clean stages in CP-1. Particles larger than 150 nm were able to be efficiently activated to cloud droplets and made important contributions to the increase in cloud droplets in the size range of 5–10 µm.
The LWC of cloud depended on the change in reff and NC. However, the decisive factor may differ at different stages of the cloud. In general, the reff of cloud droplets consistently varied with LWC. However, in different NC ranges, the reff of cloud droplets were observed with different distribution shapes. For NC<1000 cm−3, reff displayed a trimodal distribution. Three peaks at 3.25, 4.86 and 7.52 µm were observed. With the increase in NC, a narrowed unimodal distribution of reff appeared, and the peak value slightly moved towards lower reff mode. For a constant cloud thickness and disregarding any cloud lifetime effects, the increased NC and decreased reff dramatically increase the cloud albedo, which may further influence the regional climate in the North China Plain.
The local topography of the surrounding areas at Mt. Tai supplies potential access for aerosol transportation and can affect the measured cloud droplet distributions by increasing turbulence or causing orographic flows. Even though the summit of Mt. Tai is far away from the polluted sources, the transported CCN could change the cloud microphysical properties (e.g. during CP-1). The cloud microphysical parameters derived in our study characterised the cloud features in the North China Plain and provided valuable data for modelling studies of cloud microphysics in the future.
All data used to support the conclusion are presented in this paper. Additional data are available upon request. Please contact the corresponding authors Jianmin Chen (jmchen@fudan.edu.cn) and Hui Chen (hui_chen@fudan.edu.cn).
The supplement related to this article is available online at: https://doi.org/10.5194/acp-20-13735-2020-supplement.
JC and HC conceived the study. JL and CZ performed the field experiments and sampled cloud water. JL analysed the data and wrote the main manuscript text. JC, HC, DZ, CZ and HH revised the initial manuscript. LX, XW and HL supported the meteorological data and PM2.5 mass concentration. PL, JL, CZ, YM and WZ assisted in instrument maintenance. LZ, KL and ML contributed to the organisation and arrangement of the field observations. LZ provided the meteorological parameters of Tai'an City. All of the authors discussed the results and contributed to the final manuscript.
The authors declare that they have no conflict of interest.
This research has been supported by the Ministry of Science and Technology of China (grant no. 2016YFC0202700), the Tai'an Research Project (grant no. SDTASJ2018-0761-00), the National Natural Science Foundation of China (grant nos. 91843301, 91744205, 91743202, 41805091, and 21806020), and the Marie Skłodowska-Curie Actions (grant no. 690958-MARSU-RISE-2015).
This paper was edited by Ilona Riipinen and reviewed by Kevin Noone and three anonymous referees.
Albrecht, B. A.: Aerosols, cloud microphysics, and fractional cloudiness, Science, 245, 1227–1230, https://doi.org/10.1126/science.245.4923.1227, 1989.
Allan, J. D., Baumgardner, D., Raga, G. B., Mayol-Bracero, O. L., Morales-García, F., García-García, F., Montero-Martínez, G., Borrmann, S., Schneider, J., Mertes, S., Walter, S., Gysel, M., Dusek, U., Frank, G. P., and Krämer, M.: Clouds and aerosols in Puerto Rico – a new evaluation, Atmos. Chem. Phys., 8, 1293–1309, https://doi.org/10.5194/acp-8-1293-2008, 2008.
Andreae, M. O., Rosenfeld, D., Artaxo, P., Costa, A. A., Frank, G. P., Longo, K. M., and Silva-Dias, M. A. F.: Smoking rain clouds over the Amazon, Science, 303, 1337–1342, https://doi.org/10.1126/science.1092779, 2004.
Barros, A. P. and Lettenmaier, D. P.: Dynamic modeling of orographically induced precipitation, Rev. Geophys., 32, 265–284, https://doi.org/10.1029/94rg00625, 1994.
Boutle, I., Price, J., Kudzotsa, I., Kokkola, H., and Romakkaniemi, S.: Aerosol–fog interaction and the transition to well-mixed radiation fog, Atmos. Chem. Phys., 18, 7827–7840, https://doi.org/10.5194/acp-18-7827-2018, 2018.
Chang, Y., Zhang, Y.-L., Li, J., Tian, C., Song, L., Zhai, X., Zhang, W., Huang, T., Lin, Y.-C., Zhu, C., Fang, Y., Lehmann, M. F., and Chen, J.: Isotopic constraints on the atmospheric sources and formation of nitrogenous species in clouds influenced by biomass burning, Atmos. Chem. Phys., 19, 12221–12234, https://doi.org/10.5194/acp-19-12221-2019, 2019a.
Chang, Y., Guo, X., Tang, J., and Lu, G.: Aircraft measurement campaign on summer cloud microphysical properties over the Tibetan Plateau, Sci. Rep., 9, 4912, https://doi.org/10.1038/s41598-019-41514-5, 2019b.
Choularton, T. W., Colvile, R. N., Bower, K. N., Gallagher, M. W., Wells, M., Beswick, K. M., Arends, B. G., Mols, J. J., Kos, G. P. A., Fuzzi, S., Lind, J. A., Orsi, G., Facchini, M. C., Laj, P., Gieray, R., Wieser, P., Engelhardt, T., Berner, A., Kruisz, C., Moller, D., Acker, K., Wieprecht, W., Luttke, J., Levsen, K., Bizjak, M., Hansson, H. C., Cederfelt, S. I., Frank, G., Mentes, B., Martinsson, B., Orsini, D., Svenningsson, B., Swietlicki, E., Wiedensohler, A., Noone, K. J., Pahl, S., Winkler, P., Seyffer, E., Helas, G., Jaeschke, W., Georgii, H. W., Wobrock, W., Preiss, M., Maser, R., Schell, D., Dollard, G., Jones, B., Davies, T., Sedlak, D. L., David, M. M., Wendisch, M., Cape, J. N., Hargreaves, K. J., Sutton, M. A., StoretonWest, R. L., Fowler, D., Hallberg, A., Harrison, R. M., and Peak, J. D.: The Great Dun Fell Cloud Experiment 1993: An overview, Atmos. Environ., 31, 2393–2405, https://doi.org/10.1016/s1352-2310(96)00316-0, 1997.
Croft, B., Lohmann, U., Martin, R. V., Stier, P., Wurzler, S., Feichter, J., Hoose, C., Heikkilä, U., van Donkelaar, A., and Ferrachat, S.: Influences of in-cloud aerosol scavenging parameterizations on aerosol concentrations and wet deposition in ECHAM5-HAM, Atmos. Chem. Phys., 10, 1511–1543, https://doi.org/10.5194/acp-10-1511-2010, 2010.
Cross, E. S., Slowik, J. G., Davidovits, P., Allan, J. D., Worsnop, D. R., Jayne, J. T., Lewis †, D. K., Canagaratna, M., and Onasch, T. B.: Laboratory and Ambient Particle Density Determinations using Light Scattering in Conjunction with Aerosol Mass Spectrometry, Aerosol Sci. Technol., 41, 343–359, https://doi.org/10.1080/02786820701199736, 2007.
Demoz, B. B., Collett, J. L., and Daube, B. C.: On the Caltech Active Strand Cloudwater Collectors, Atmos. Res., 41, 47–62, https://doi.org/10.1016/0169-8095(95)00044-5, 1996.
Deng, Z., Zhao, C., Zhang, Q., Huang, M., and Ma, X.: Statistical analysis of microphysical properties and the parameterization of effective radius of warm clouds in Beijing area, Atmos. Res., 93, 888–896, 2009.
Drewnick, F., Schneider, J., Hings, S. S., Hock, N., Noone, K., Targino, A., Weimer, S., and Borrmann, S.: Measurement of ambient, interstitial, and residual aerosol particles on a mountaintop site in central Sweden using an aerosol mass spectrometer and a CVI, J. Atmos. Chem., 56, 1–20, https://doi.org/10.1007/s10874-006-9036-8, 2007.
Durkee, P. A., Noone, K. J., Ferek, R. J., Johnson, D. W., Taylor, J. P., Garrett, T. J., Hobbs, P. V., Hudson, J. G., Bretherton, C. S., Innis, G., Frick, G. M., Hoppel, W. A., O'Dowd, C. D., Russell, L. M., Gasparovic, R., Nielsen, K. E., Tessmer, S. A., Ostrom, E., Osborne, S. R., Flagan, R. C., Seinfeld, J. H., and Rand, H.: The impact of ship-produced aerosols on the microstructure and albedo of warm marine stratocumulus clouds: A test of MAST hypotheses 1i and 1ii, J. Atmos. Sci., 57, 2554–2569, https://doi.org/10.1175/1520-0469(2000)057<2554:Tiospa>2.0.Co;2, 2000.
Dusek, U., Frank, G. P., Hildebrandt, L., Curtius, J., Schneider, J., Walter, S., Chand, D., Drewnick, F., Hings, S., Jung, D., Borrmann, S., and Andreae, M. O.: Size matters more than chemistry for cloud-nucleating ability of aerosol particles, Science, 312, 1375–1378, https://doi.org/10.1126/science.1125261, 2006.
Ekman, A. M. L., Engstrom, A., and Soderberg, A.: Impact of Two-Way Aerosol-Cloud Interaction and Changes in Aerosol Size Distribution on Simulated Aerosol-Induced Deep Convective Cloud Sensitivity, J. Atmos. Sci., 68, 685–698, https://doi.org/10.1175/2010jas3651.1, 2011.
Fan, J., Leung, L. R., Rosenfeld, D., Chen, Q., Li, Z., Zhang, J., and Yan, H.: Microphysical effects determine macrophysical response for aerosol impacts on deep convective clouds, P. Natl. Acad. Sci. USA, 110, 4581–4590, https://doi.org/10.1073/pnas.1316830110, 2013.
Fan, J., Wang, Y., Rosenfeld, D., and Liu, X.: Review of Aerosol-Cloud Interactions: Mechanisms, Significance, and Challenges, J. Atmos. Sci., 73, 4221–4252, https://doi.org/10.1175/jas-d-16-0037.1, 2016.
Feingold, G., Remer, L. A., Ramaprasad, J., and Kaufman, Y. J.: Analysis of smoke impact on clouds in Brazilian biomass burning regions: An extension of Twomey's approach, J. Geophys. Res.-Atmos., 106, 22907–22922, https://doi.org/10.1029/2001jd000732, 2001.
Feingold, G.: Modeling of the first indirect effect: Analysis of measurement requirements, Geophys. Res. Lett., 30, 1997, https://doi.org/10.1029/2003gl017967, 2003.
Freud, E. and Rosenfeld, D.: Linear relation between convective cloud drop number concentration and depth for rain initiation, J. Geophys. Res.-Atmos., 117, 13, https://doi.org/10.1029/2011jd016457, 2012.
Frey, L., Bender, F. A.-M., and Svensson, G.: Cloud albedo changes in response to anthropogenic sulfate and non-sulfate aerosol forcings in CMIP5 models, Atmos. Chem. Phys., 17, 9145–9162, https://doi.org/10.5194/acp-17-9145-2017, 2017.
Georgakakos, K. P. and Bras, R. L.: A hydrologically useful station precipitation model, I. Formulation, Water Resour. Res., 20, 1585–1596, https://doi.org/10.1029/WR020i011p01585, 1984.
Grabowski, W. W. and Wang, L.-P.: Growth of Cloud Droplets in a Turbulent Environment, Annu. Rev. Fluid Mech., 45, 293–324, https://doi.org/10.1146/annurev-fluid-011212-140750, 2013.
Guo, J., Wang, Y., Shen, X. H., Wang, Z., Lee, T., Wang, X. F., Li, P. H., Sun, M. H., Collett, J. L., Wang, W. X., and Wang, T.: Characterization of cloud water chemistry at Mount Tai, China: Seasonal variation, anthropogenic impact, and cloud processing, Atmos. Environ., 60, 467–476, https://doi.org/10.1016/j.atmosenv.2012.07.016, 2012.
Heikenfeld, M., White, B., Labbouz, L., and Stier, P.: Aerosol effects on deep convection: the propagation of aerosol perturbations through convective cloud microphysics, Atmos. Chem. Phys., 19, 2601–2627, https://doi.org/10.5194/acp-19-2601-2019, 2019.
Heintzenberg, J., Ogren, J. A., Noone, K. J., and Gardneus, L.: The Size Distribution of Submicrometer Particles within and about Stratocumulus Cloud Droplets on Mt. Areskutan, Sweden, Atmos. Res., 24, 89–101, https://doi.org/10.1016/0169-8095(89)90039-2, 1989.
Hudson, J. G.: Variability of the relationship between particle size and cloud-nucleating ability, Geophys. Res. Lett., 34, L08801, https://doi.org/10.1029/2006gl028850, 2007.
Khain, A. P., Beheng, K. D., Heymsfield, A., Korolev, A., Krichak, S. O., Levin, Z., Pinsky, M., Phillips, V., Prabhakaran, T., Teller, A., van den Heever, S. C., and Yano, J. I.: Representation of microphysical processes in cloud-resolving models: Spectral (bin) microphysics versus bulk parameterization, Rev. Geophys., 53, 247–322, https://doi.org/10.1002/2014rg000468, 2015.
Koren, I., Kaufman, Y. J., Rosenfeld, D., Remer, L. A., and Rudich, Y.: Aerosol invigoration and restructuring of Atlantic convective clouds, Geophys. Res. Lett., 32, L14828, https://doi.org/10.1029/2005gl023187, 2005.
Lacis, A. A. and Hansen, J. E.: Parameterization for absorption of solar-radiation in earths atmosphere J. Atmos. Sci., 31, 118–133, https://doi.org/10.1175/1520-0469(1974)031<0118:Apftao>2.0.Co;2, 1974.
Li, J., Wang, X., Chen, J., Zhu, C., Li, W., Li, C., Liu, L., Xu, C., Wen, L., Xue, L., Wang, W., Ding, A., and Herrmann, H.: Chemical composition and droplet size distribution of cloud at the summit of Mount Tai, China, Atmos. Chem. Phys., 17, 9885–9896, https://doi.org/10.5194/acp-17-9885-2017, 2017.
Li, P., Li, X., Yang, C., Wang, X., Chen, J., and Jr, J. L. C.: Fog water chemistry in Shanghai, Atmos. Environ., 45, 4034–4041, 2011.
Li, S., Joseph, E., Min, Q., and Yin, B.: Multi-year ground-based observations of aerosol-cloud interactions in the Mid-Atlantic of the United States, J. Quant. Spectrosc. Radiat. Transfer, 188, 192–199, https://doi.org/10.1016/j.jqsrt.2016.02.004, 2017.
Lohmann, U. and Feichter, J.: Global indirect aerosol effects: a review, Atmos. Chem. Phys., 5, 715–737, https://doi.org/10.5194/acp-5-715-2005, 2005.
Lu, C., Niu, S., Tang, L., Lv, J., Zhao, L., and Zhu, B.: Chemical composition of fog water in Nanjing area of China and its related fog microphysics, Atmos. Res., 97, 47–69, 2010.
Lu, M.-L., Conant, W. C., Jonsson, H. H., Varutbangkul, V., Flagan, R. C., and Seinfeld, J. H.: The Marine Stratus/Stratocumulus Experiment (MASE): Aerosol-cloud relationships in marine stratocumulus, J. Geophys. Res.-Atmos., 112, https://doi.org/10.1029/2006jd007985, 2007.
Mazoyer, M., Burnet, F., Denjean, C., Roberts, G. C., Haeffelin, M., Dupont, J.-C., and Elias, T.: Experimental study of the aerosol impact on fog microphysics, Atmos. Chem. Phys., 19, 4323–4344, https://doi.org/10.5194/acp-19-4323-2019, 2019.
McComiskey, A., Feingold, G., Frisch, A. S., Turner, D. D., Miller, M. A., Chiu, J. C., Min, Q., and Ogren, J. A.: An assessment of aerosol-cloud interactions in marine stratus clouds based on surface remote sensing, J. Geophys. Res.-Atmos., 114, D09203, https://doi.org/10.1029/2008JD011006, 2009.
McFiggans, G., Artaxo, P., Baltensperger, U., Coe, H., Facchini, M. C., Feingold, G., Fuzzi, S., Gysel, M., Laaksonen, A., Lohmann, U., Mentel, T. F., Murphy, D. M., O'Dowd, C. D., Snider, J. R., and Weingartner, E.: The effect of physical and chemical aerosol properties on warm cloud droplet activation, Atmos. Chem. Phys., 6, 2593–2649, https://doi.org/10.5194/acp-6-2593-2006, 2006.
Mertes, S., Galgon, D., Schwirn, K., Nowak, A., Lehmann, K., Massling, A., Wiedensohler, A., and Wieprecht, W.: Evolution of particle concentration and size distribution observed upwind, inside and downwind hill cap clouds at connected flow conditions during FEBUKO, Atmos. Environ., 39, 4233–4245, https://doi.org/10.1016/j.atmosenv.2005.02.009, 2005.
Modini, R. L., Frossard, A. A., Ahlm, L., Russell, L. M., Corrigan, C. E., Roberts, G. C., Hawkins, L. N., Schroder, J. C., Bertram, A. K., Zhao, R., Lee, A. K. Y., Abbatt, J. P. D., Lin, J., Nenes, A., Wang, Z., Wonaschuetz, A., Sorooshian, A., Noone, K. J., Jonsson, H., Seinfeld, J. H., Toom-Sauntry, D., Macdonald, A. M., and Leaitch, W. R.: Primary marine aerosol-cloud interactions off the coast of California, J. Geophys. Res.-Atmos., 120, 4282–4303, https://doi.org/10.1002/2014jd022963, 2015.
Möller, D., Acker, K., and Wieprecht, W.: A relationship between liquid water content and chemical composition in clouds, Atmos. Res., 41, 321–335, 1996.
Noone, K. J., Ogren, J. A., and Heintzenberg, J.: An Examination of Clouds at a Mountain-Top Site in Central Sweden: The Distribution of Solute within Cloud Droplets, Atmos. Res., 25, 3–15, https://doi.org/10.1016/0169-8095(90)90002-t, 1990.
Padmakumari, B., Maheskumar, R. S., Anand, V., and Axisa, D.: Microphysical characteristics of convective clouds over ocean and land from aircraft observations, Atmos. Res., 195, 62–71, https://doi.org/10.1016/j.atmosres.2017.05.011, 2017.
Penner, J. E., Dong, X. Q., and Chen, Y.: Observational evidence of a change in radiative forcing due to the indirect aerosol effect, Nature, 427, 231–234, https://doi.org/10.1038/nature02234, 2004.
Qian, Y., Gong, D. Y., Fan, J. W., Leung, L. R., Bennartz, R., Chen, D. L., and Wang, W. G.: Heavy pollution suppresses light rain in China: Observations and modeling, J. Geophys. Res.-Atmos., 114, 16, https://doi.org/10.1029/2008jd011575, 2009.
Quante, M.: The role of clouds in the climate system, J. Phys. IV, 121, 61–86, https://doi.org/10.1051/jp4:2004121003, 2004.
Reid, J. S., Hobbs, P. V., Rangno, A. L., and Hegg, D. A.: Relationships between cloud droplet effective radius, liquid water content, and droplet concentration for warm clouds in Brazil embedded in biomass smoke, J. Geophys. Res.-Atmos., 104, 6145–6153, 1999.
Rose, D., Gunthe, S. S., Mikhailov, E., Frank, G. P., Dusek, U., Andreae, M. O., and Pöschl, U.: Calibration and measurement uncertainties of a continuous-flow cloud condensation nuclei counter (DMT-CCNC): CCN activation of ammonium sulfate and sodium chloride aerosol particles in theory and experiment, Atmos. Chem. Phys., 8, 1153–1179, https://doi.org/10.5194/acp-8-1153-2008, 2008.
Rosenfeld, D.: Aerosol-cloud interactions control of earth radiation and latent heat release budgets, Space Sci. Rev., 125, 149–157, https://doi.org/10.1007/s11214-006-9053-6, 2006.
Rosenfeld, D., Andreae, M. O., Asmi, A., Chin, M., de Leeuw, G., Donovan, D. P., Kahn, R., Kinne, S., Kivekas, N., Kulmala, M., Lau, W., Schmidt, K. S., Suni, T., Wagner, T., Wild, M., and Quaas, J.: Global observations of aerosol-cloud-precipitation-climate interactions, Rev. Geophys., 52, 750–808, https://doi.org/10.1002/2013rg000441, 2014a.
Rosenfeld, D., Sherwood, S., Wood, R., and Donner, L.: Climate Effects of Aerosol-Cloud Interactions, Science, 343, 379–380, https://doi.org/10.1126/science.1247490, 2014b.
Roth, A., Schneider, J., Klimach, T., Mertes, S., van Pinxteren, D., Herrmann, H., and Borrmann, S.: Aerosol properties, source identification, and cloud processing in orographic clouds measured by single particle mass spectrometry on a central European mountain site during HCCT-2010, Atmos. Chem. Phys., 16, 505–524, https://doi.org/10.5194/acp-16-505-2016, 2016.
Sant, V., Lohmann, U., and Seifert, A.: Performance of a Triclass Parameterization for the Collision-Coalescence Process in Shallow Clouds, J. Atmos. Sci., 70, 1744–1767, https://doi.org/10.1175/jas-d-12-0154.1, 2013.
Schroder, J. C., Hanna, S. J., Modini, R. L., Corrigan, A. L., Kreidenwies, S. M., Macdonald, A. M., Noone, K. J., Russell, L. M., Leaitch, W. R., and Bertram, A. K.: Size-resolved observations of refractory black carbon particles in cloud droplets at a marine boundary layer site, Atmos. Chem. Phys., 15, 1367–1383, https://doi.org/10.5194/acp-15-1367-2015, 2015.
Seinfeld, J. H. and Pandis, S. N.: Atmospheric Chemistry and Physics: From Air Pollution to Climate Change, John Wiley & Sons, Inc., Hoboken, New Jersey, 1225, 2006.
Seinfeld, J. H., Bretherton, C., Carslaw, K. S., Coe, H., DeMott, P. J., Dunlea, E. J., Feingold, G., Ghan, S., Guenther, A. B., Kahn, R., Kraucunas, I., Kreidenweis, S. M., Molina, M. J., Nenes, A., Penner, J. E., Prather, K. A., Ramanathan, V., Ramaswamy, V., Rasch, P. J., Ravishankara, A. R., Rosenfeld, D., Stephens, G., and Wood, R.: Improving our fundamental understanding of the role of aerosol-cloud interactions in the climate system, P. Natl. Acad. Sci. USA, 113, 5781–5790, 2016.
Shen, L., Wang, H., Yin, Y., Chen, J., and Chen, K.: Observation of atmospheric new particle growth events at the summit of mountain Tai (1534 m) in Central East China, Atmos. Environ., 201, 148–157, https://doi.org/10.1016/j.atmosenv.2018.12.051, 2019.
Spiegel, J. K., Zieger, P., Bukowiecki, N., Hammer, E., Weingartner, E., and Eugster, W.: Evaluating the capabilities and uncertainties of droplet measurements for the fog droplet spectrometer (FM-100), Atmos. Meas. Tech., 5, 2237–2260, https://doi.org/10.5194/amt-5-2237-2012, 2012.
Stephens, G. L.: Radiation profiles in extended water clouds, II. Parameterization schemes, J. Atmos. Sci., 35, 2123–2132, https://doi.org/10.1175/1520-0469(1978)035<2123:Rpiewc>2.0.Co;2, 1978.
Stevens, B. and Bony, S.: What Are Climate Models Missing?, Science, 340, 1053–1054, https://doi.org/10.1126/science.1237554, 2013.
Tang, J. P., Wang, P. C., Mickley, L. J., Xia, X. G., Liao, H., Yue, X., Sun, L., and Xia, J. R.: Positive relationship between liquid cloud droplet effective radius and aerosol optical depth over Eastern China from satellite data, Atmos. Environ., 84, 244–253, https://doi.org/10.1016/j.atmosenv.2013.08.024, 2014.
Targino, A. C., Noone, K. J., Drewnick, F., Schneider, J., Krejci, R., Olivares, G., Hings, S., and Borrmann, S.: Microphysical and chemical characteristics of cloud droplet residuals and interstitial particles in continental stratocumulus clouds, Atmos. Res., 86, 225–240, https://doi.org/10.1016/j.atmosres.2007.05.001, 2007.
Twohy, C. H., Petters, M. D., Snider, J. R., Stevens, B., Tahnk, W., Wetzel, M., Russell, L., and Burnet, F.: Evaluation of the aerosol indirect effect in marine stratocumulus clouds: Droplet number, size, liquid water path, and radiative impact, J. Geophys. Res.-Atmos., 110, D08203, https://doi.org/10.1029/2004JD005116, 2005.
Twomey, S.: Pollution and planetary albedo, Atmos. Environ., 8, 1251–1256, https://doi.org/10.1016/0004-6981(74)90004-3, 1974.
Twomey, S. A.: The Influence of Pollution on the Shortwave Albedo of Clouds, J. Atmos. Sci., 34, 1149–1154, 1977.
van Pinxteren, D., Fomba, K. W., Mertes, S., Müller, K., Spindler, G., Schneider, J., Lee, T., Collett, J. L., and Herrmann, H.: Cloud water composition during HCCT-2010: Scavenging efficiencies, solute concentrations, and droplet size dependence of inorganic ions and dissolved organic carbon, Atmos. Chem. Phys., 16, 3185–3205, https://doi.org/10.5194/acp-16-3185-2016, 2016.
Verheggen, B., Cozic, J., Weingartner, E., Bower, K., Mertes, S., Connolly, P., Gallagher, M., Flynn, M., Choularton, T., and Baltensperger, U.: Aerosol partitioning between the interstitial and the condensed phase in mixed-phase clouds, J. Geophys. Res.-Atmos., 112, 13, https://doi.org/10.1029/2007jd008714, 2007.
Wang, Y., Guo, J., Wang, T., Ding, A., Gao, J., Zhou, Y., Collett, J. L., and Wang, W.: Influence of regional pollution and sandstorms on the chemical composition of cloud/fog at the summit of Mt. Taishan in northern China, Atmos. Res., 99, 434–442, 2011.
Welch, R. M., Asefi, S., Zeng, J., Nair, U. S., Han, Q., Lawton, R. O., Ray, D. K., and Manoharan, V. S.: Biogeography of tropical montane cloud forests. Part I: Remote sensing of cloud-base heights, J. Appl. Meteorol. Clim., 47, 960–975, https://doi.org/10.1175/2007jamc1668.1, 2008.
Yuan, T., Li, Z., Zhang, R., and Fan, J.: Increase of cloud droplet size with aerosol optical depth: An observation and modeling study, J. Geophys. Res.-Atmos., 113, D04201, https://doi.org/10.1029/2007jd008632, 2008.
Zhang, L. M., Michelangeli, D. V., and Taylor, P. A.: Numerical studies of aerosol scavenging by low-level, warm stratiform clouds and precipitation, Atmos. Environ., 38, 4653–4665, https://doi.org/10.1016/j.atmosenv.2004.05.042, 2004.
Zhang, X., Musson-Genon, L., Dupont, E., Milliez, M., and Carissimo, B.: On the Influence of a Simple Microphysics Parametrization on Radiation Fog Modelling: A Case Study During ParisFog, Bound.-Lay. Meteorol., 151, 293–315, https://doi.org/10.1007/s10546-013-9894-y, 2014.
Zhang, Y., Rossow, W. B., Lacis, A. A., Oinas, V., and Mishchenko, M. I.: Calculation of radiative fluxes from the surface to top of atmosphere based on ISCCP and other global data sets: Refinements of the radiative transfer model and the input data, J. Geophys. Res.-Atmos., 109, https://doi.org/10.1029/2003JD004457, 2004.
Zhao, C., Klein, S. A., Xie, S., Liu, X., Boyle, J. S., and Zhang, Y.: Aerosol First Indirect Effects on Non-Precipitating Low-Level Liquid Cloud Properties as Simulated by CAM5 at ARM Sites, Geophys. Res. Lett., 39, L08806, https://doi.org/10.1029/2012GL051213, 2012.
Zhao, C., Qiu, Y., Dong, X., Wang, Z., Peng, Y., Li, B., Wu, Z., and Wang, Y.: Negative Aerosol-Cloud re Relationship from Aircraft Observations over Hebei, China, Earth Space Sci., 5, 19–29, https://doi.org/10.1002/2017EA000346, 2018.
Zhou, Y., Wang, T., Gao, X., Xue, L., Wang, X., Wang, Z., Gao, J., Zhang, Q., and Wang, W.: Continuous observations of water-soluble ions in PM2.5 at Mount Tai (1534 m a.s.l.) in central-eastern China, J. Atmos. Chem., 64, 107–127, 2009.
Zhu, C., Chen, J., Wang, X., Li, J., Wei, M., Xu, C., Xu, X., Ding, A., and Collett, J. L.: Chemical Composition and Bacterial Community in Size-Resolved Cloud Water at the Summit of Mt. Tai, China, Aerosol Air Qual. Res., 18, 1–14, https://doi.org/10.4209/aaqr.2016.11.0493, 2018.