the Creative Commons Attribution 4.0 License.
the Creative Commons Attribution 4.0 License.
 | 13 Nov 2020
On mineral dust aerosol hygroscopicity
Lanxiadi Chen
Chao Peng
Wenjun Gu
Hanjing Fu
Xing Jian
Huanhuan Zhang
Guohua Zhang
Jianxi Zhu
Xinming Wang
Despite its importance, hygroscopicity of mineral dust aerosol remains highly uncertain. In this work, we investigated water adsorption and hygroscopicity of different mineral dust samples at 25 ∘C, via measurement of sample mass at different relative humidity (RH, up to 90 %) using a vapor sorption analyzer. Mineral dust samples examined (21 in total) included seven authentic mineral dust samples from different regions in the world and 14 major minerals contained in mineral dust aerosol. At 90 % RH, the mass ratios of adsorbed water to the dry mineral ranged from 0.0011 to 0.3080, largely depending on the BET surface areas of mineral dust samples. The fractional surface coverages of adsorbed water were determined to vary between 1.26 and 8.63 at 90 % RH, and it was found that the Frenkel–Halsey–Hill (FHH) adsorption isotherm could describe surface coverages of adsorbed water as a function of RH well, with AFHH and BFHH parameters in the range of 0.15–4.39 and 1.10–1.91, respectively. The comprehensive and robust data obtained would largely improve our knowledge of hygroscopicity of mineral dust aerosol.
- Article
(3991 KB) - Full-text XML
-
Supplement
(229 KB) - BibTeX
- EndNote


Mineral dust aerosol mainly comes from arid and semiarid areas (Ginoux et al., 2012), such as the Sahara, the Taklimakan Desert, etc. Its annual flux and atmospheric loadings are estimated to be ∼ 2000 Tg yr−1 and ∼ 19.2 Tg (Textor et al., 2006; Huneeus et al., 2011), making mineral dust one of the most important aerosols in the troposphere. Mineral dust aerosol has significant impacts on atmospheric chemistry, climate and biogeochemical cycles (Knippertz and Stuut, 2014). It can alter the radiative forcing of the earth both directly (Balkanski et al., 2007; Huang et al., 2014; Di Biagio et al., 2017) and indirectly (Cziczo et al., 2013; Karydis et al., 2017). Mineral dust can also change the abundance of reactive trace gases as well as aerosol compositions via heterogeneous reactions (Usher et al., 2003; Dupart et al., 2012; He et al., 2014; Tang et al., 2017; Yu and Jang, 2019). Furthermore, the deposition of mineral dust will bring substantial amounts of nutrients (e.g., Fe and P) into some marine and terrestrial ecosystems, thereby largely affecting biogeochemistry in these regions (Jickells et al., 2005; Okin et al., 2011; Schulz et al., 2012; Li et al., 2017; Tagliabue et al., 2017; Meskhidze et al., 2019). Hygroscopicity largely determines the impacts of mineral dust aerosol on atmospheric chemistry and climate. For example, many studies found that relative humidity (RH) and thus the amount of water associated with mineral dust have profound effects on the rates, mechanisms and products of heterogeneous reactions (Vlasenko et al., 2009; Rubasinghege and Grassian, 2013; Tang et al., 2014; Tang et al., 2017; Lasne et al., 2018; Wang et al., 2018; Yu and Jang, 2018; Mitroo et al., 2019). In addition, hygroscopicity of mineral dust aerosol plays important role in its optical properties (and thus the direct radiative effect) and its ability to act as cloud condensation nuclei and ice-nucleating particles (and thus the indirect radiative effect) (Sorjamaa and Laaksonen, 2007; Kumar et al., 2009; Garimella et al., 2014; Kreidenweis and Asa-Awuku, 2014; Laaksonen et al., 2016; Tang et al., 2016; Tang et al., 2019a). Therefore, a number of previous studies have investigated water adsorption and hygroscopic properties of mineral dust aerosol at < 100 % RH, as reviewed by Tang et al. (2016). However, different studies displayed considerable discrepancies as large as a few orders of magnitude (Tang et al., 2016), thus precluding a good understanding of the role mineral dust aerosol plays in atmospheric chemistry and climate.
As pointed out by Tang et al. (2016), such discrepancies are largely due to the non-sphericity and low hygroscopicity of mineral dust particles, making it difficult to quantify the amount of water associated with them at elevated RH. Instruments which measure mobility or optical diameters of aerosol particles often found that the diameters of mineral dust particles did not increase significantly (or even showed considerable decrease due to particle restructuring during humidification) with increasing RH (Gustafsson et al., 2005; Vlasenko et al., 2005; Herich et al., 2009; Koehler et al., 2009; Attwood and Greenslade, 2011). Fourier transform infrared (FTIR) spectroscopy is a sensitive method to detect adsorbed water on mineral dust (Goodman et al., 2001; Ma et al., 2010a; Joshi et al., 2017); however, it is not a trivial task to convert the intensity of its infrared absorption to the amount of adsorbed water (Schuttlefield et al., 2007b; Ma et al., 2010b; Tang et al., 2016). Quartz crystal microbalance (QCM) is another sensitive technique to examine water adsorption and absorption (Schuttlefield et al., 2007b; Navea et al., 2010; Yeşilbaş and Boily, 2016); however, it is in doubt that the underlying assumptions required to convert the change in resonance frequency of the quartz crystal to the change in sample mass are always fulfilled (Tang et al., 2016; Tang et al., 2019a).
In our previous work (Gu et al., 2017), we developed a new method to investigate hygroscopic properties of atmospherically relevant particles using a vapor sorption analyzer, which utilized a very sensitive balance to measure the mass of a sample (typically with a dry mass of tenths of a milligram or a few milligrams) as different RH under isotherm conditions. Comprehensive validation carried out confirmed the robustness of this method (Gu et al., 2017), and this instrument has been employed to study hygroscopic properties of various particles, including nonspherical particles such as saline mineral dust and pollen grains (Chen et al., 2019; Tang et al., 2019b; Tang et al., 2019c). This instrument was used in the present work to quantitatively investigate hygroscopic properties of a number of mineral dust particles, including several authentic mineral dust samples from different regions in the world and individual minerals commonly found in mineral dust aerosol. We also attempted to figure out which theoretical models could describe hygroscopic properties of mineral dust particles, and we examined the dependence of mineral dust hygroscopicity on several parameters (such as particle diameter, surface area and the mass fraction of soluble materials).
2.1 Sample information
In total 21 different types of mineral dust were investigated, including 14 major minerals commonly found in mineral dust aerosol (Formenti et al., 2011; Nickovic et al., 2012; Journet et al., 2014; Scanza et al., 2015; Engelbrecht et al., 2016) and seven authentic mineral dust samples, and their information can be found in Table 1. The 14 major minerals examined included four oxides (SiO2, TiO2, magnetite and hematite), one oxyhydroxide (goethite), three feldspars (potassium feldspar, albite and microcline), two carbonates (CaCO3 and dolomite) and four clay minerals (montmorillonite, illite, kaolinite and chlorite). As shown in Table 1, SiO2, montmorillonite and kaolinite were supplied by Sigma Aldrich; TiO2 (P25) was supplied by Degussa; hematite and magnetite were supplied by Strem Chemicals; goethite was provided by Santa Cruz; and microcline, CaCO3 and dolomite were provided by Alfa Aesar. Potassium feldspar and albite were obtained from the National Research Center of Testing Techniques for Building Materials (NRCTTBM, Beijing, China), and illite (IMt-1) was obtained from the Clay Mineral Society at Purdue University, Indiana, USA (Schuttlefield et al., 2007b; Tang et al., 2014). In addition, chlorite was collected by one co-author from Liaoning Province, China.
Table 1Measured BET surface areas (BET), average particle diameters (dp) and sources of mineral dust samples examined in this work.

The seven authentic mineral dust samples were obtained from Africa, Asia and North America. As shown in Fig. 1, three authentic mineral dust samples (M'Bour dust, Bordj dust and Saharan dust) were collected from topsoil in Senegal, Algeria and Cabo Verde (Tang et al., 2012; Joshi et al., 2017). QH dust (which is brown desert soil) and China loess, collected from topsoil in Qinghai and Shaanxi, were supplied by the Chinese Academy of Geological Science as certificated materials (GBW07448 and GBW07454) (Tang et al., 2019c). TLF dust as airborne dust particles collected on 23 April 2010 at an urban site in Turpan (Xinjiang, China) during a major dust storm. In addition, Arizona Test Dust (ATD, nominal 0–3 µm fraction), an authentic mineral dust sample commercially available from Powder Technology Inc. (Minnesota, USA) and widely used in atmospheric aerosol research (Vlasenko et al., 2005; Sullivan et al., 2010a; Tang et al., 2016), was also investigated in our work.
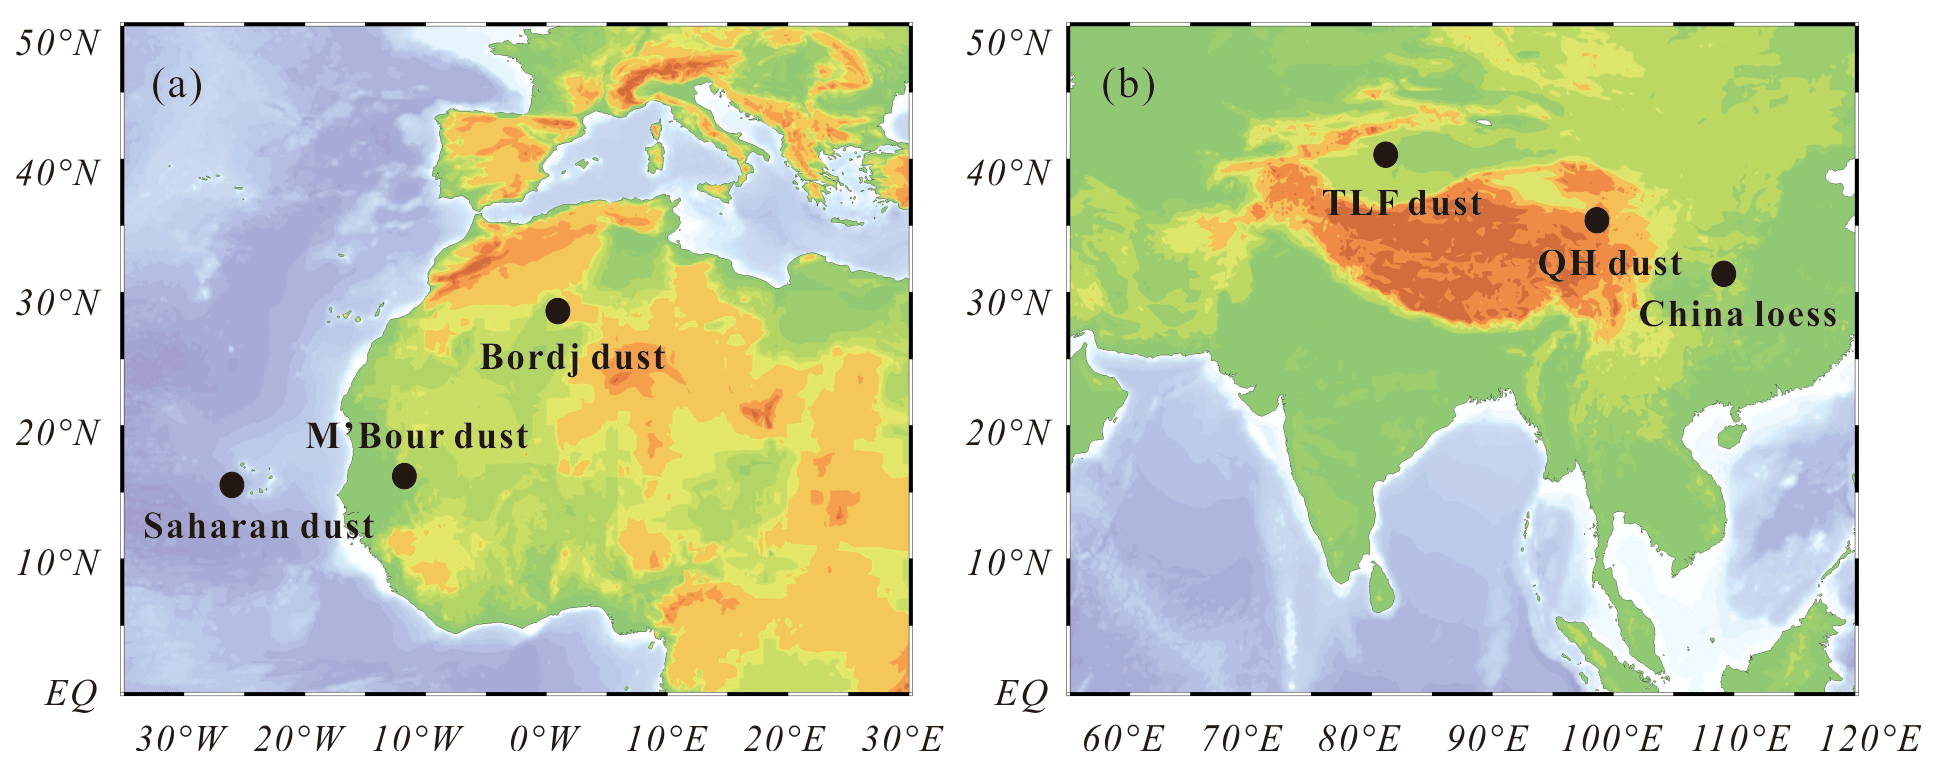
Figure 1Locations where (a) African and (b) Asian authentic mineral dust samples examined in this work were collected.
When received, three feldspars, dolomite, illite, chlorite and TLF dust contained significant amounts of rock chips or giant particles; as a result, they were pretreated using the procedure described in our previous work (Tang et al., 2019c). In brief, these samples were dried at 120 ∘C for 24 h using an oven; after that, they were ground manually and then using a ball mill so that most particles were < 74 µm in diameter; finally, these samples were dried again at 120 ∘C for 24 h and then cooled down. All the samples were stored in plastic bottles which were tightly sealed to prevent contamination by lab air.
2.2 Sample characterization
Dynamic light scattering (JL-1177, Jingxin Powder Technologies Inc., Chengdu, Sichuan, China) was employed to measure size distributions of mineral dust samples examined in our work. In addition, Brunauer–Emmett–Teller (BET) surface areas of these samples were determined using an accelerated surface area and porosimetry analyzer (ASAP 2020 PLUS, Micromeritics, Georgia, USA), and N2 was used as the adsorbate. Details on particle size and BET surface area measurements can be found elsewhere (Li et al., 2020).
To measure their inorganic soluble compositions, each mineral dust sample (∼ 10 mg) was mixed with 10 mL of ultrapure deionized water, and the mixture was stirred for 2 h using an oscillating table. After centrifugalization, the solution was filtered using a 5 mL syringe fitted with a 0.2 µm PTFE membrane syringe and then analyzed using ion chromatography (Metrohm model 761 Compact IC, Metrohm, Herisau, Switzerland). More information on ion chromatography analysis can be found in our previous work (Tang et al., 2019c). We attempted to measure five cations (Na+, K+, NH, Mg2+ and Ca2+) and seven anions (NO, SO, Cl−, NO2-, Br−, F− and PO), and their detection limits were estimated to be around 0.02 mg/L.
2.3 Hygroscopicity measurements
Hygroscopic properties of mineral dust samples were investigated using a vapor sorption analyzer (Q5000SA, TA instruments, Delaware, USA). This instrument, described in our previous work (Gu et al., 2017; Chen et al., 2019; Tang et al., 2019b), measured sample mass as a function of RH under isotherm conditions. Measurements could be conducted in the RH range of 0 %–98 % and in the temperature range of 5–85 ∘C. We routinely measured the deliquescence RH of NaCl, (NH4)2SO4 and KCl at 25 ∘C, and the measured values differed from the actual values by < 1 % RH. The sample mass could be measured with an accuracy of ±0.1 µg, and the uncertainties for temperature and RH were ±0.1 ∘C and ±1 %.
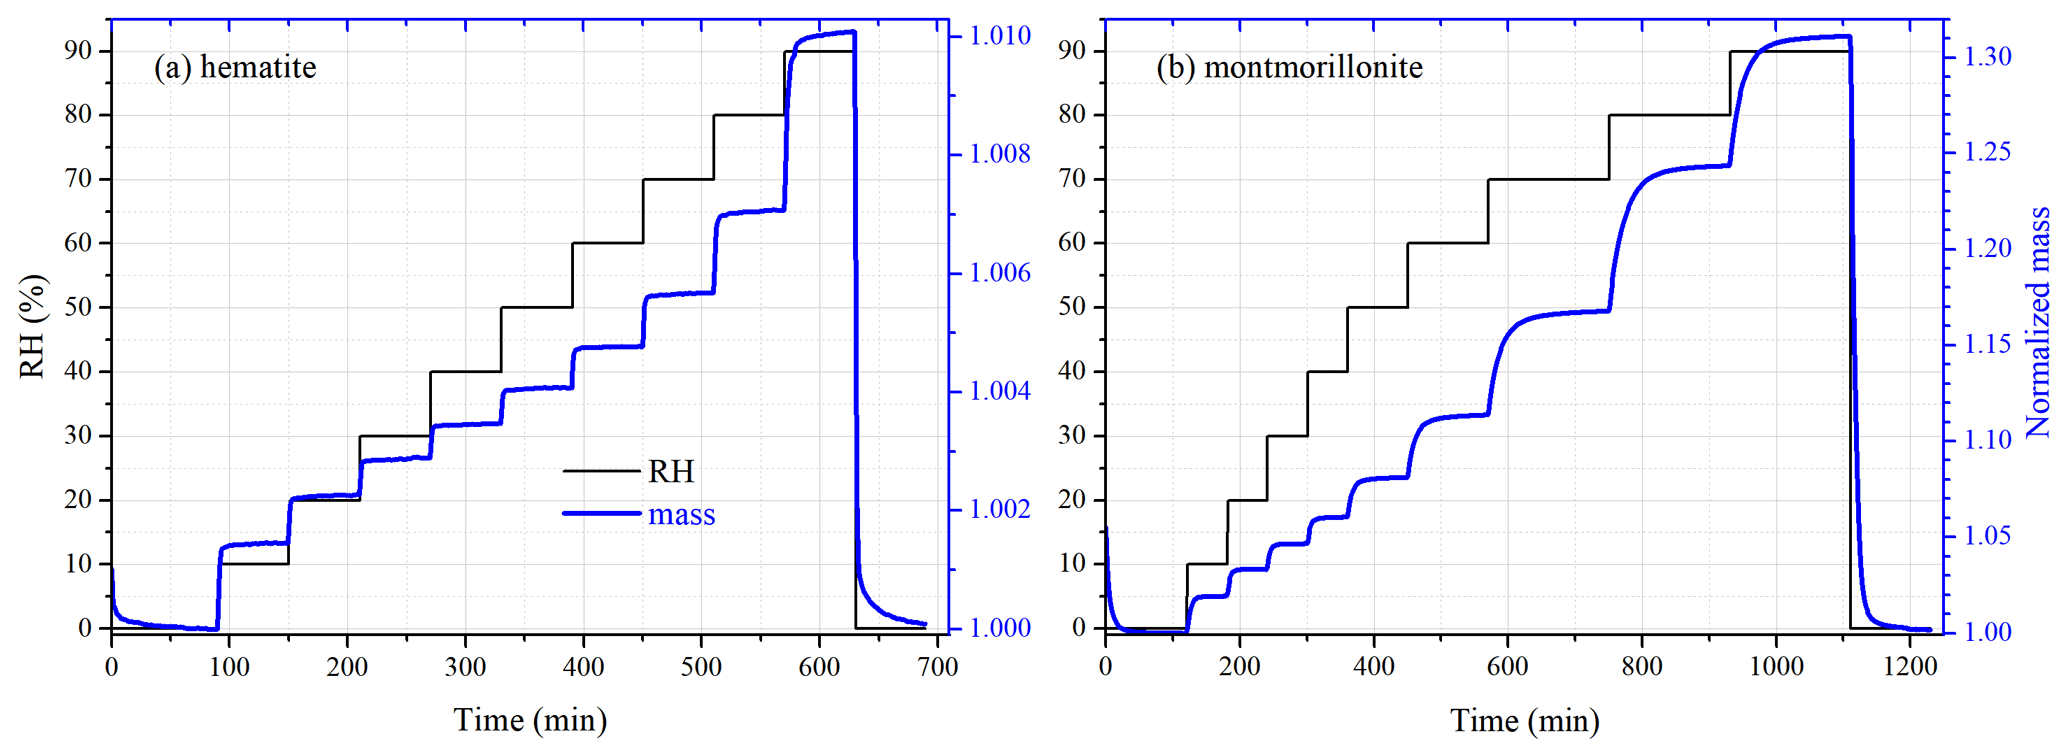
Figure 2RH (black curve, left y axis) and mass of mineral dust (normalized to that at < 1 % RH, blue curve, right y axis) as a function of experimental time: (a) hematite and (b) montmorillonite.
In this work, the initial masses of mineral dust samples used typically ranged from 5 to 15 mg. As displayed in Fig. 2, the sample under investigation was first dried at < 1 % RH; after that, RH was increased in a stepwise manner to 90 %, and at each step RH was increased by 10 %; at last, the sample was dried again at < 1 % RH. At each step we changed the RH only after the samples' mass became stable (in other words, only after an equilibrium was reached between gaseous and particulate water), and the sample mass was considered to be stable when the mass change was < 0.05 % in 30 min. In some experiments the sample was considered to reach the equilibrium only when the mass change was < 0.05 % in 60 min, and no significant difference in results was found for the two equilibrium criterions. All the experiments were carried out in triplicate at 25 ∘C.
3.1 Sample characteristics
As shown in Table 1, the BET surface areas were found to vary between 2.17 ± 0.01 m2/g (microcline) and 249.91 ± 0.42 m2/g (montmorillonite), spanning over 2 orders of magnitude. Except for montmorillonite, the BET surface areas were in the range of a few to tens of square meters per gram. In addition, the average particle diameters (dp) were determined to range from 0.80 µm (hematite) to 54.41 µm (M'Bour dust), and their size distributions can be found in Figs. S1–S7 in the Supplement.
Tables S1–S2 show mass fractions of water-soluble inorganic ions for the 21 mineral dust samples considered in this study. Na+, K+, Ca2+, Mg2+, F−, Cl− and SO were detected in most of the samples, while NH was above its detection limit only for two samples. The total mass fractions of all the soluble inorganic ions were found to be quite low, ranging from 0.16 mg/g for SiO2 to 12.55 mg/g for Bordj dust.
3.2 Water uptake by different mineral dust
As described in Sect. 2.3, sample mass of mineral dust was measured at different RH values in our work; therefore, the mass ratio of adsorbed water to the dry mineral, mw∕m0, could then be determined as a function of RH. Furthermore, mw∕m0 could be converted to fractional surface coverage (abbreviated as surface coverage) of adsorbed water (θ), using Eq. (1) (Tang et al., 2016):
where NA is Avogadro's constant (6.02×10²³ mol−1), Mw is the molar mass of water (18 g mol−1), Aw is the surface area each adsorbed water molecule would occupy (assumed to be 1 × 10⁻¹⁵ cm2) (Schuttlefield et al., 2007a; Hatch et al., 2014; Tang et al., 2016) and ABET is the BET surface (in cm2 g−1) of the mineral dust under consideration. Tables 2–5 summarize mw∕m0 and θ as a function of RH for all the mineral dust examined in our work. Please note that our previous work (Tang et al., 2019c) discussed water uptake by China loess and QH dust, and these results are included here to compare with the other 19 mineral dust samples.
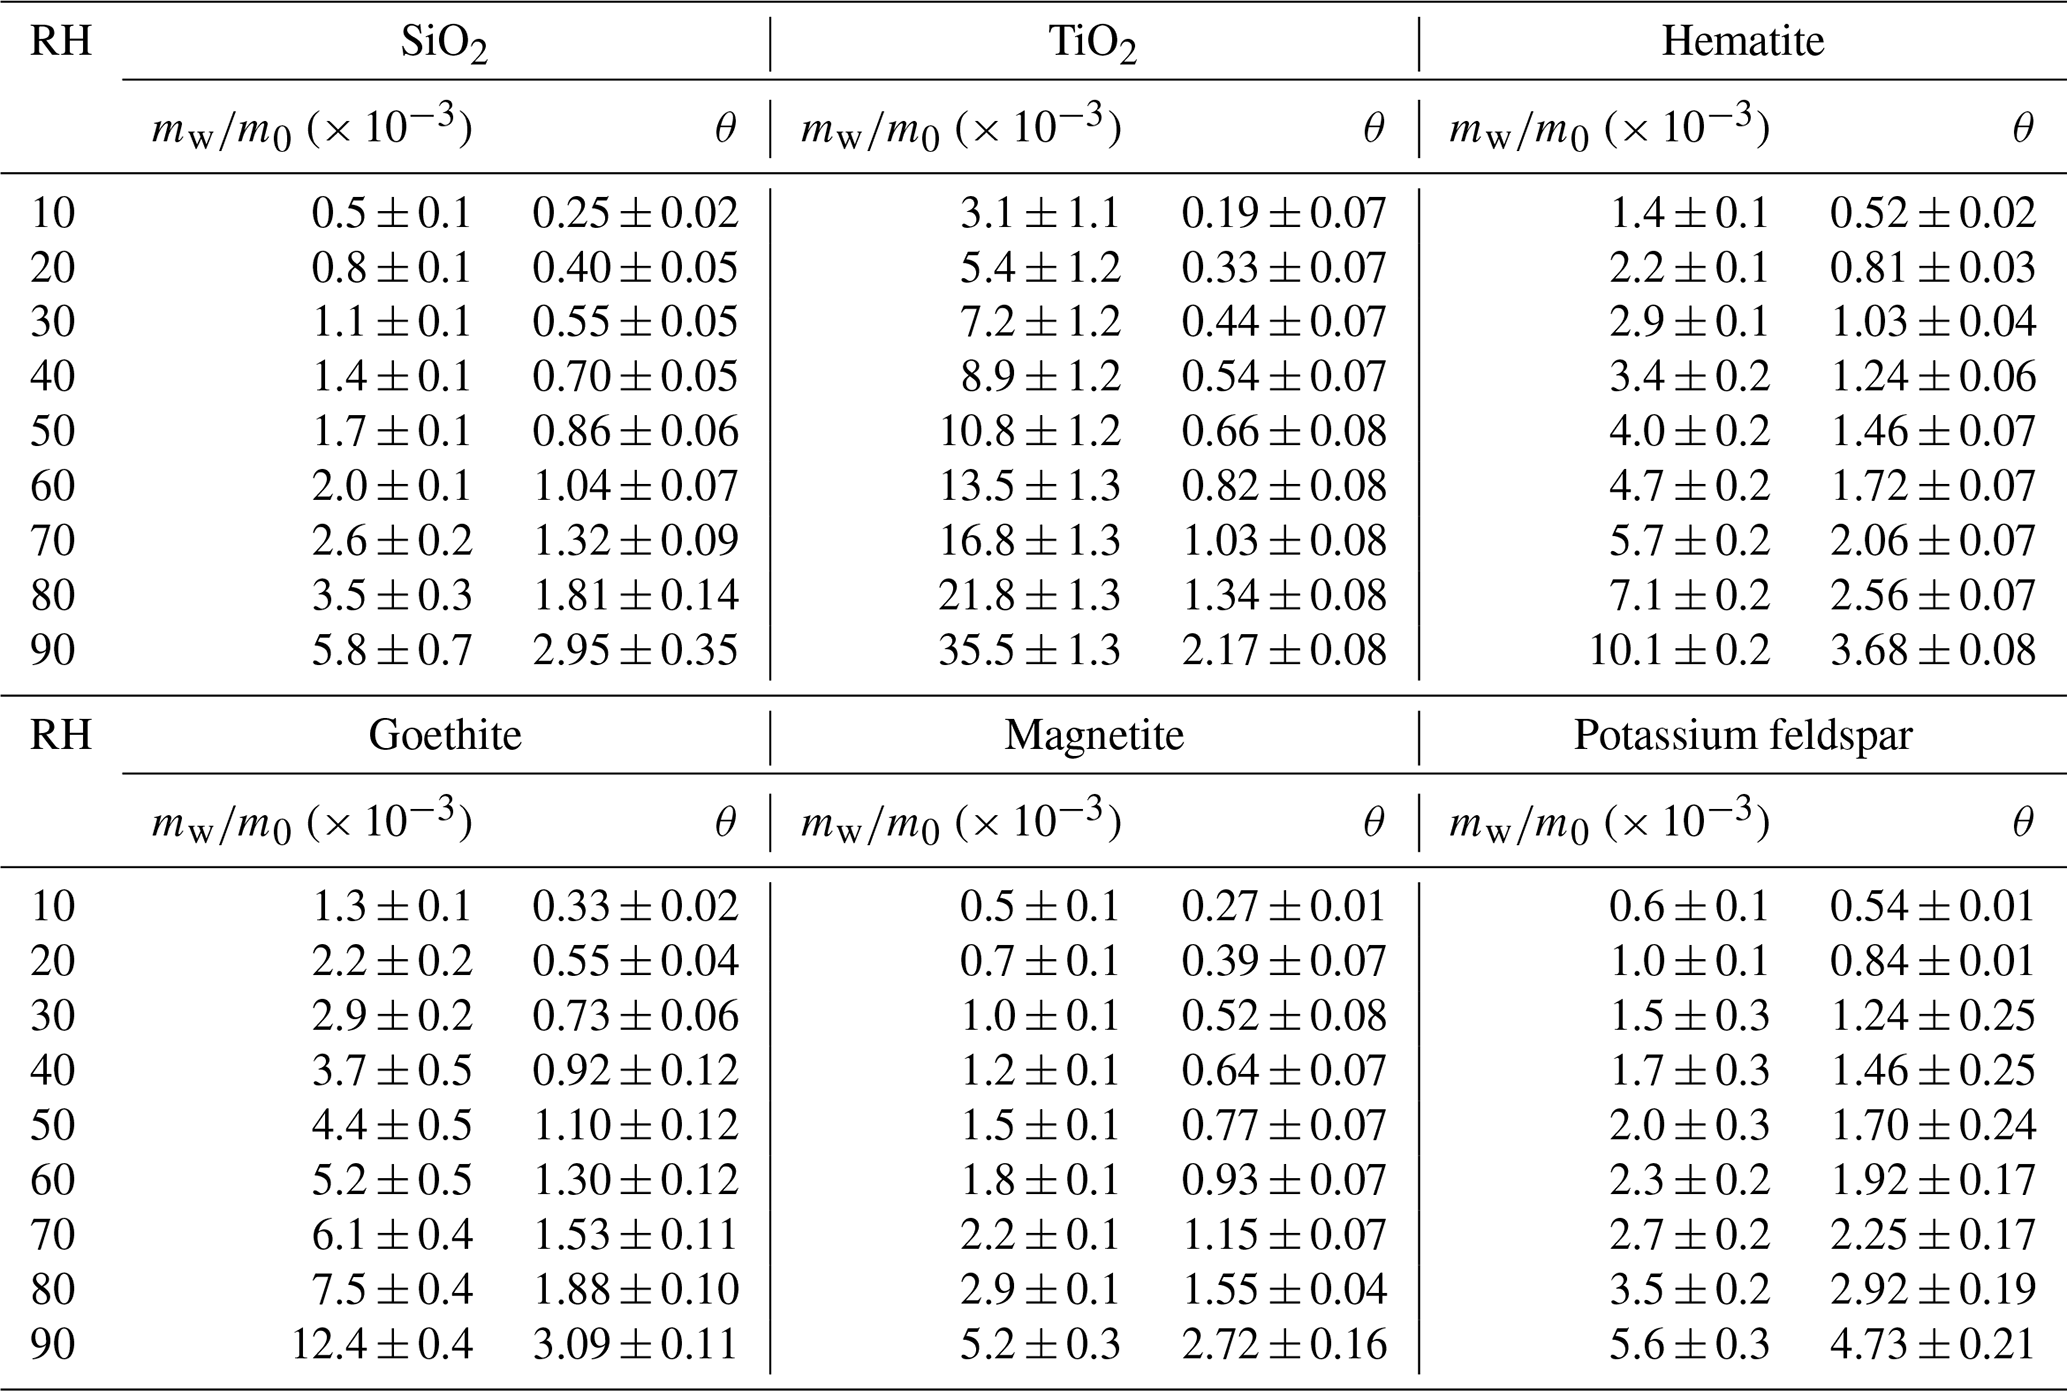
Table 2Mass ratios of adsorbed water to the dry mineral (mw∕m0) and surface coverages of adsorbed water (θ) as a function of RH (%) for SiO2, TiO2, magnetite, hematite, goethite and potassium feldspar.
Below we discuss hygroscopicity of mineral dust investigated, and we compare our measured mw∕m0 and θ with those reported in previous work. As our work directly measured mass change of mineral dust due to water uptake, we prefer to compare mw∕m0 when such values were also reported in previous studies; otherwise, we then choose to compare θ. As aerosol-based measurements are usually not sensitive enough and also need the particle sphericity assumption (Tang et al., 2016), we do not compare our results with those measurements.
3.2.1 SiO2 and TiO2
In our work mw∕m0 was determined to be 0.0011, 0.0020 and 0.0058 for SiO2 at 30 %, 60 % and 90 % RH, corresponding to θ of 0.55, 1.04 and 2.95, respectively. Figure 3a compares our work with previous studies in which FTIR (Goodman et al., 2001; Ma et al., 2010a; Joshi et al., 2017) and QCM (Schuttlefield et al., 2007a; Yeşilbaş and Boily, 2016) were used to measure water uptake by SiO2. At a given RH, θ values reported by the four previous studies (Goodman et al., 2001; Schuttlefield et al., 2007a; Ma et al., 2010a; Joshi et al., 2017) were generally larger when compared to our work, and the difference usually did not exceed a factor of 3. Furthermore, the differences between our work and the four previous studies became smaller at higher RH. For example, at 80 % RH our measured θ was very close to those reported by Ma et al. (2010a) and Joshi et al. (2017), and at 90 % RH our measured θ was 20 %–30 % larger than those reported by the two studies (Ma et al., 2010a; Joshi et al., 2017). Yeşilbaş and Boily (2016) employed a QCM to investigate water adsorption on quartz (0.3–14 µm), and θ was determined to be ∼ 2300 at ∼ 70 % RH, almost 3 orders of magnitude larger than those reported in our work and other previous studies (Goodman et al., 2001; Schuttlefield et al., 2007a; Ma et al., 2010a; Joshi et al., 2017); therefore, the results reported by Yeşilbaş and Boily (2016) are not displayed in Fig. 3a.
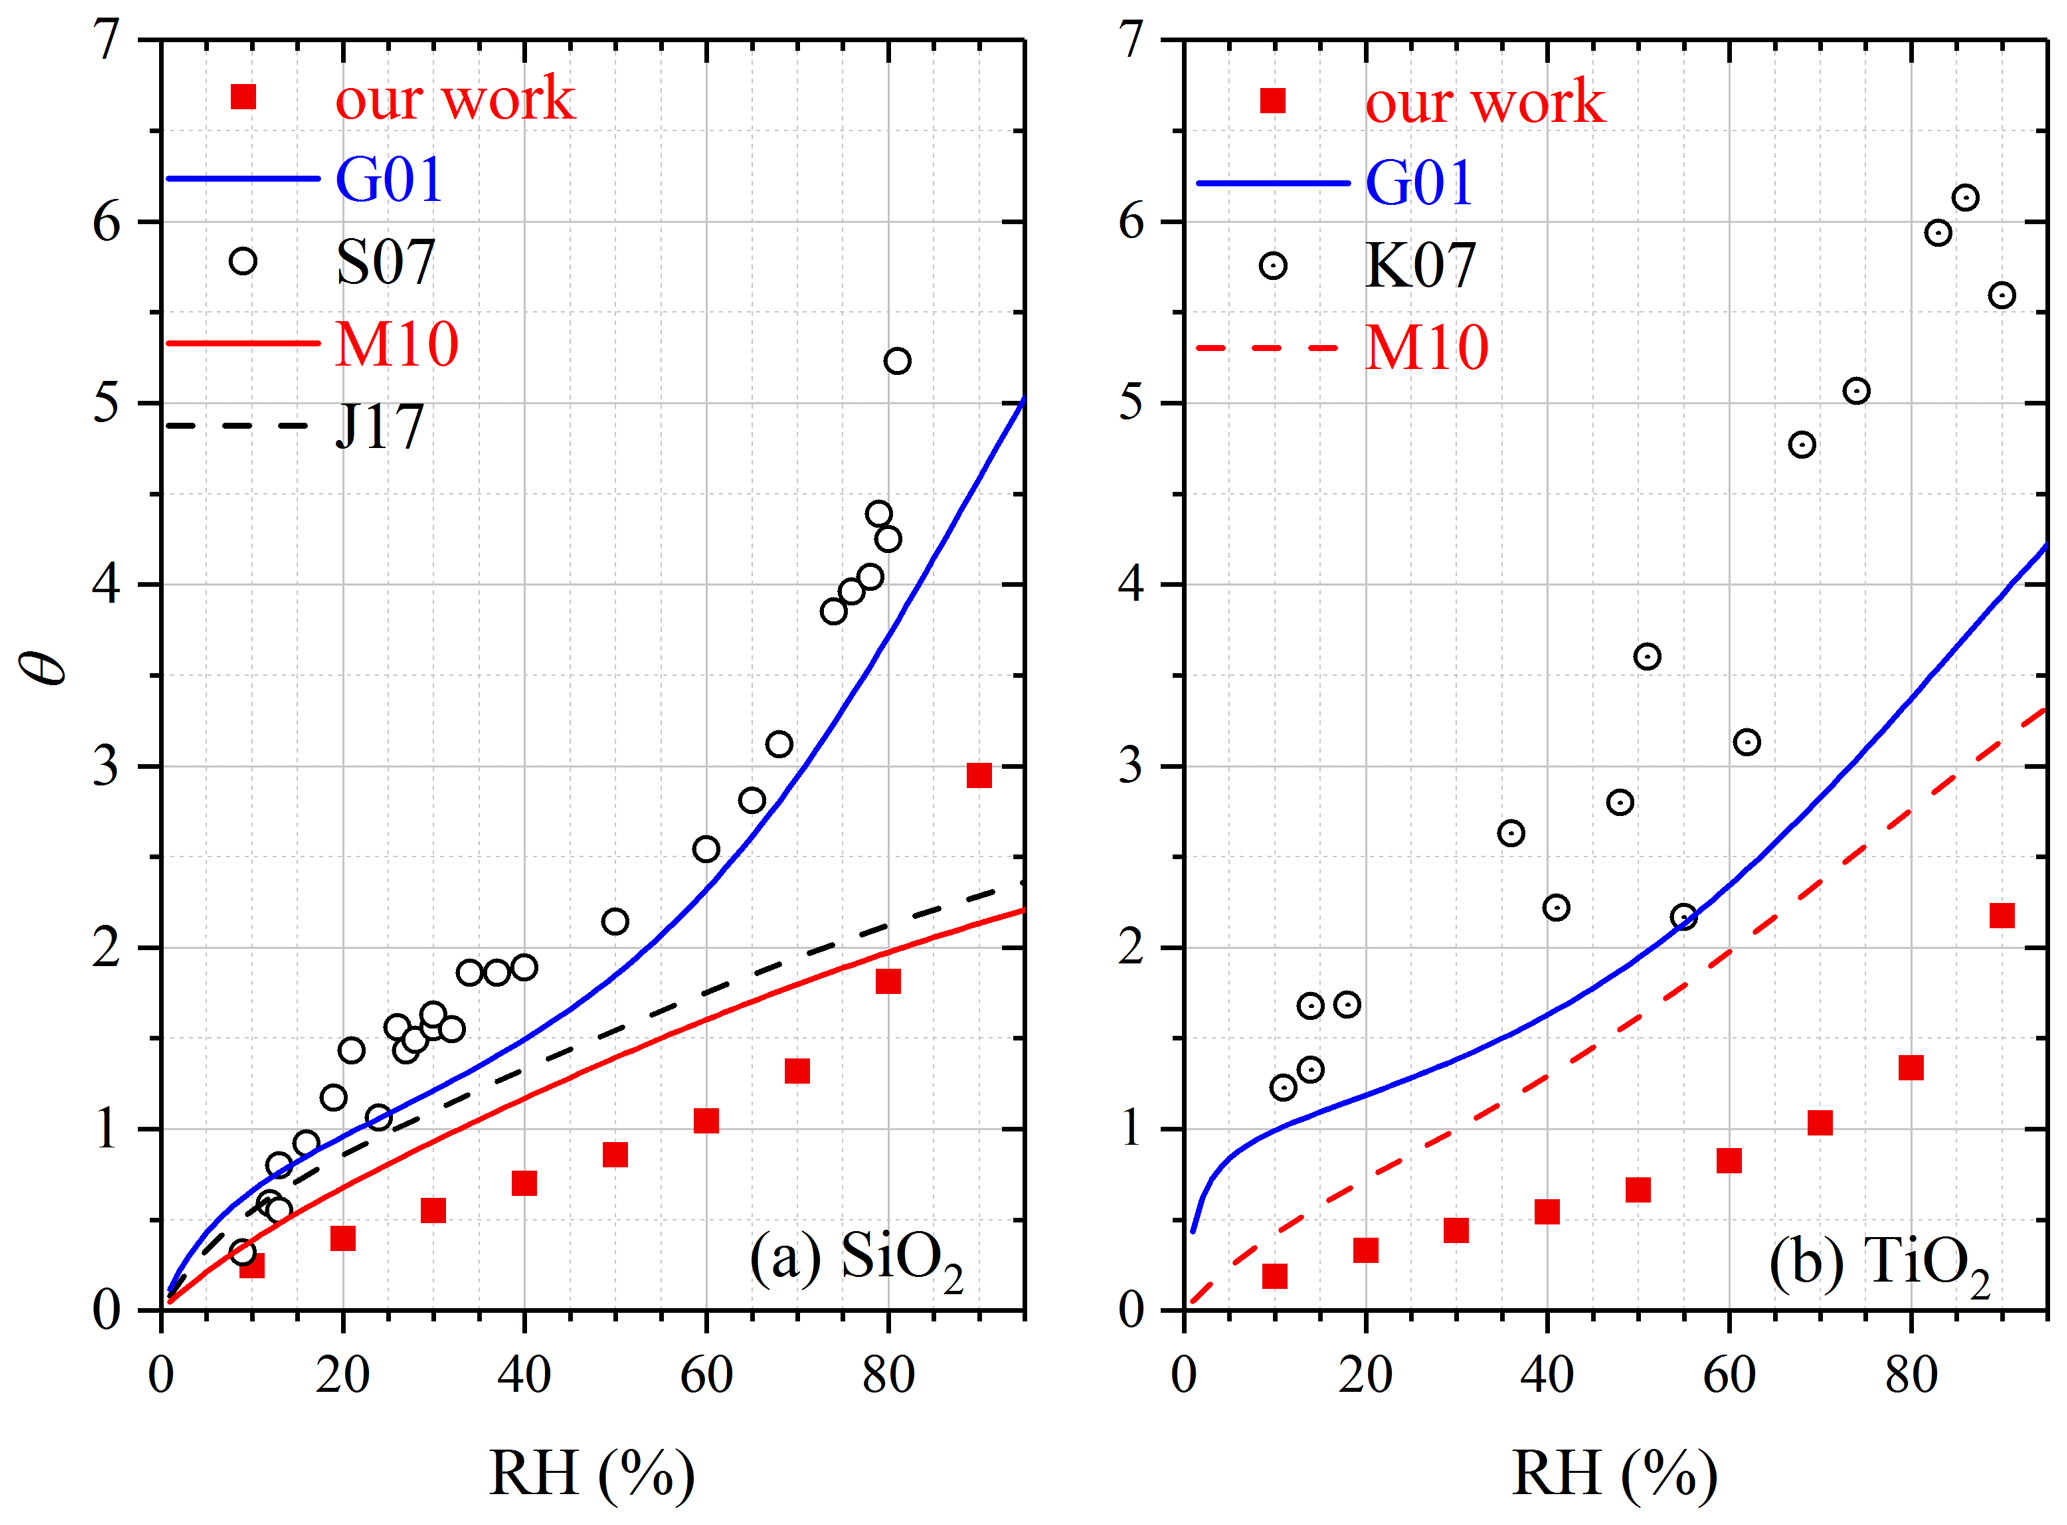
Figure 3Comparison of surface coverages of adsorbed water (θ) measured in our work with those reported in previous studies for (a) SiO2 and (b) TiO2. G01: Goodman et al. (2001); S07: Schuttlefield et al. (2007a); M10: Ma et al. (2010a); J17: Joshi et al. (2017); K07: Ketteler et al. (2007).
For TiO2, mw∕m0 was determined to be 0.0072, 0.0135 and 0.0355 at 30 %, 60 % and 90 % RH, corresponding to θ of 0.44, 0.82 and 2.17, respectively. Water adsorption on P25 TiO2 was studied previously using FTIR (Goodman et al., 2001; Ma et al., 2010a), and another study (Ketteler et al., 2007) employed atmospheric pressure X-ray photoelectron spectroscopy to explore interactions of water vapor with the rutile single crystal surface (110). As shown in Fig. 3b, when compared with our work, θ values reported by Ma et al. (2010a) were higher across the entire RH range, and the relative differences between our work and Ma et al. (2010a) were around a factor of 2 or smaller. The relative differences between our work and the other two studies (Goodman et al., 2001; Ketteler et al., 2007) were larger, being a factor of ∼ 5 at lower RH and becoming smaller at higher RH.
3.2.2 Hematite, goethite and magnetite
At 30 %, 60 % and 90 % RH, mw∕m0 was measured to be 0.0029, 0.0047 and 0.0101 for hematite, corresponding to θ of 1.03, 1.72 and 3.68, respectively. Water adsorption on hematite was studied previously using FTIR (Goodman et al., 2001; Ma et al., 2010a) and QCM (Yeşilbaş and Boily, 2016). Figure 4a reveals that our results agreed reasonably well with those reported by Goodman et al. (2001) and Ma et al. (2010a), and the relative differences were found to be within a factor of 2. In addition, our results agreed fairly well with those reported for 10 nm hematite by Yeşilbaş and Boily (2016) but were significantly smaller than their results for 50 nm hematite. Yeşilbaş and Boily (2016) also studied water adsorption on 4 and 5 µm hematite particles, and θ values were reported to be ∼ 300 at ∼ 70 % RH, almost 2 orders of magnitude larger than our results; therefore, their measured θ values for 4 and 5 µm hematite are not shown in Fig. 4a.
In our work, mw∕m0 was measured to be 0.0029, 0.0052 and 0.0124 at 30 %, 60 % and 90 % RH for goethite, corresponding to θ of 0.73, 1.30 and 3.09. Yeşilbaş and Boily (2016) employed QCM to study water adsorption on goethite, and their measured θ values are plotted in Fig. 4b to compare to ours. When compared to our work, on average θ values measured by Yeşilbaş and Boily (2016) were a factor of ∼ 2 larger. We also investigated water adsorption on magnetite, and the results can be found in Fig. 4b. Compared to goethite, θ values were generally 20 %–30 % smaller for magnetite. As far as we know, water adsorption on magnetite was not quantitatively investigated before.
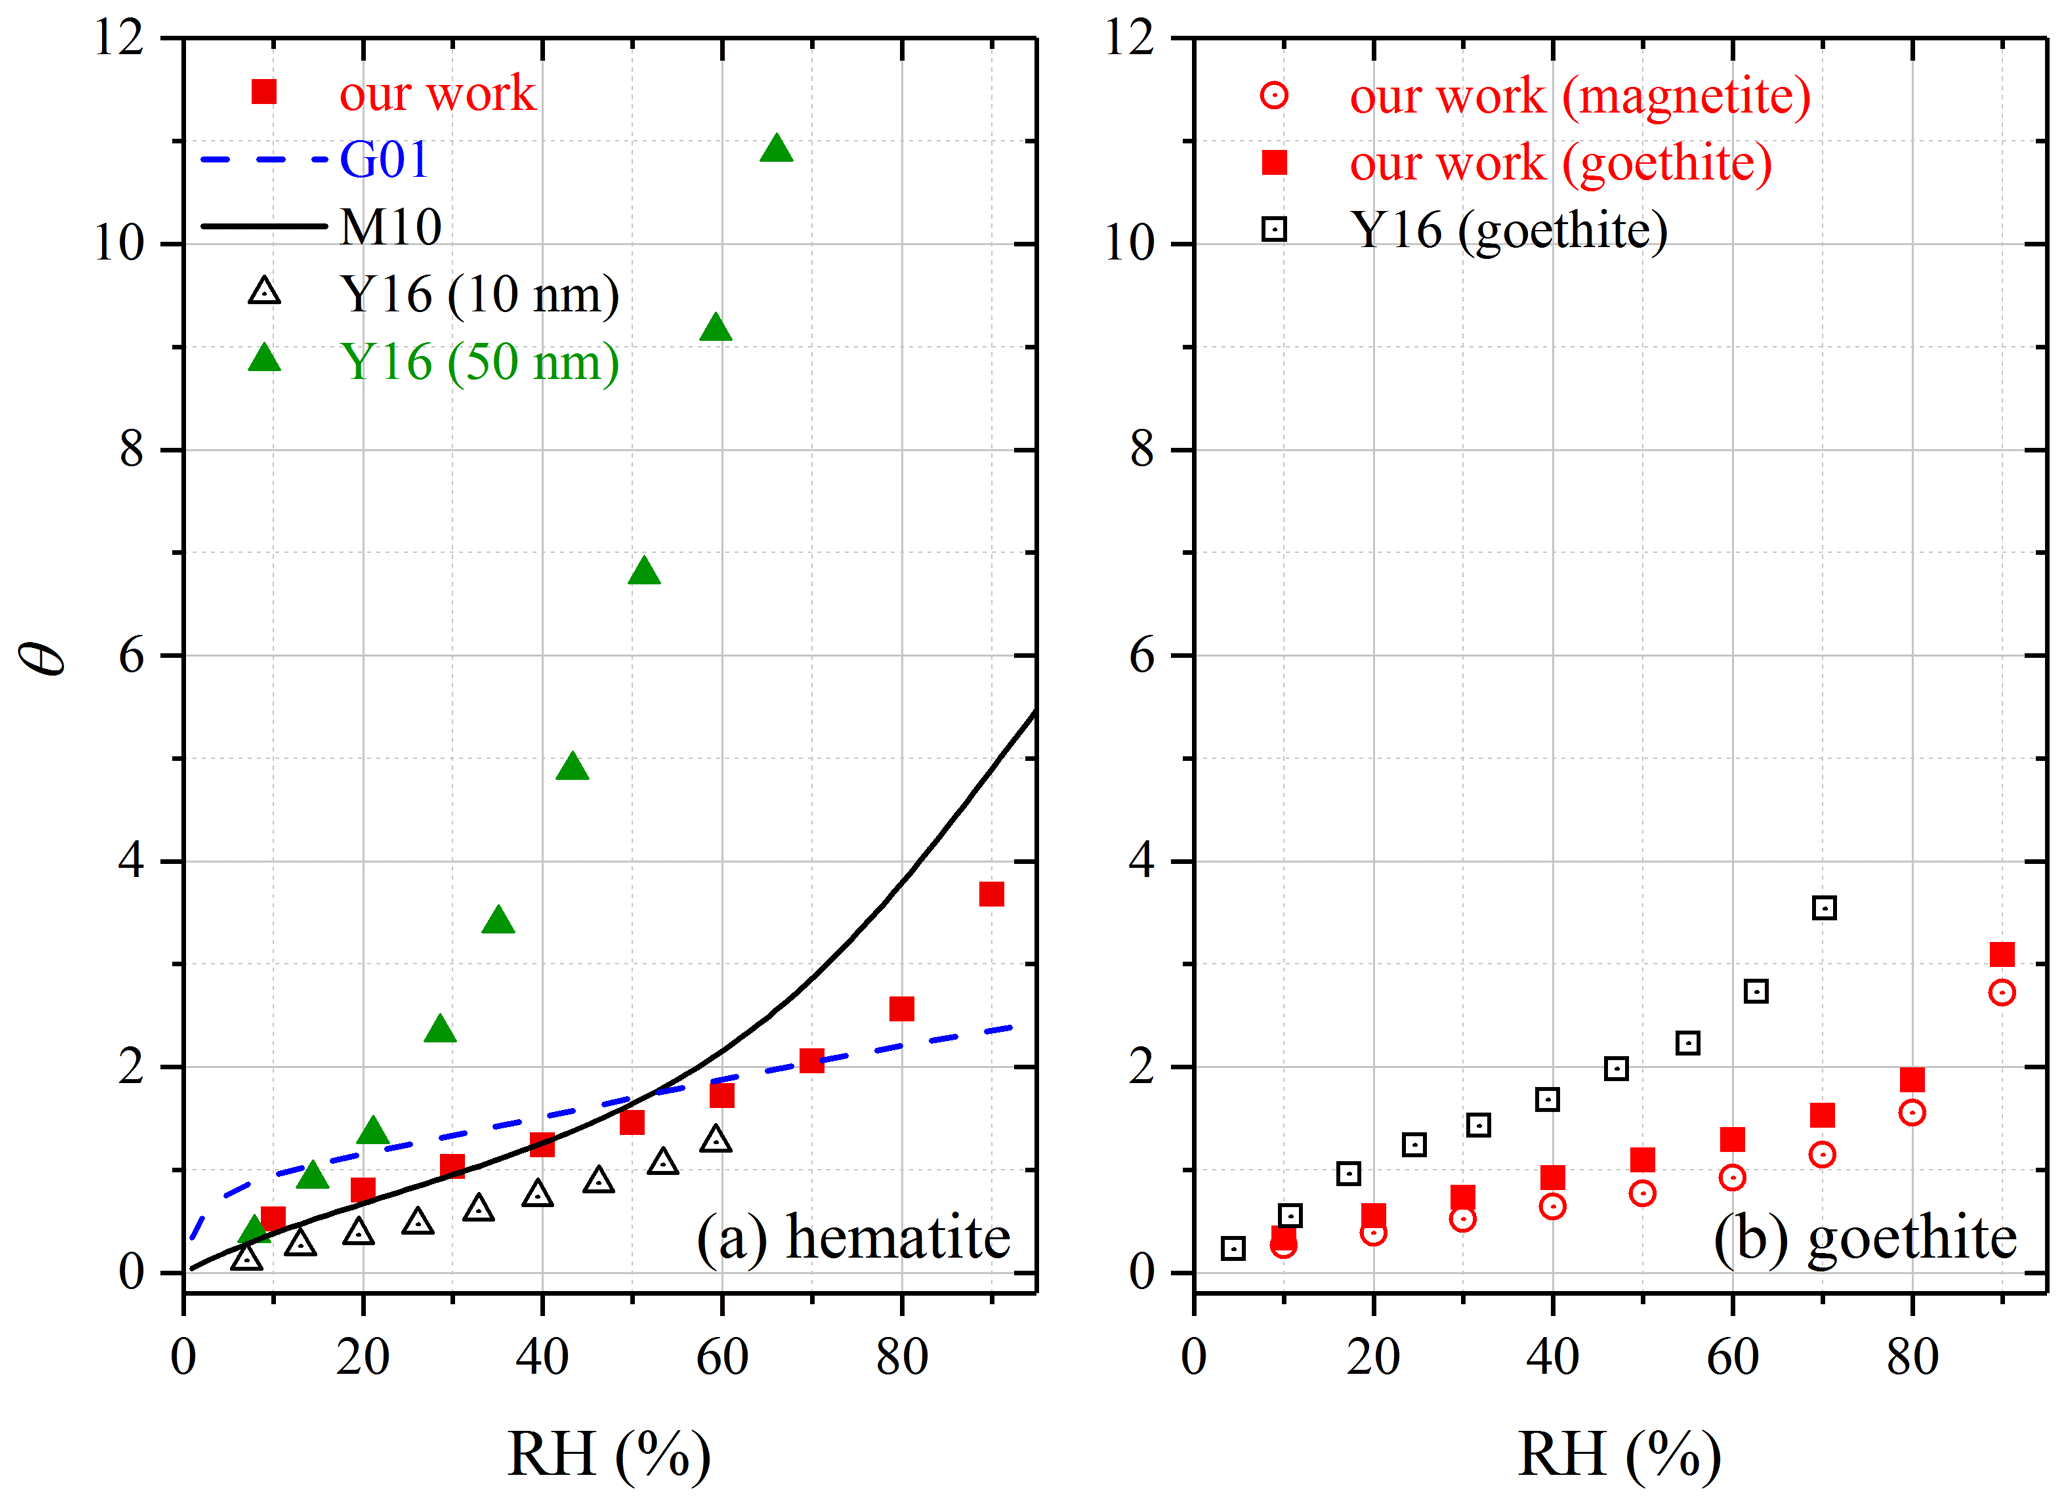
Figure 4Comparison of surface coverages of adsorbed water (θ) measured in our work with those reported in previous studies for (a) hematite and (b) goethite (θ values measured in our work for magnetite are also plotted). G01: Goodman et al. (2001); M10: Ma et al. (2010a); Y16: Yeşilbaş and Boily (2016).
3.2.3 Feldspars
Tables 2–3 show that the mass ratios of adsorbed water to the dry mineral were determined to be 0.0056, 0.0060 and 0.0048 at 90 % RH for potassium feldspar, albite and microcline, respectively; correspondingly, θ values were found to be 4.73, 5.53 and 7.37. QCM was used by Yeşilbaş and Boily (2016) to study water uptake onto microcline, and θ was measured to be ∼ 300 at ∼ 70 % RH, about 2 orders of magnitude larger than our measurement. We are not aware of other previous studies which investigated water adsorption on feldspars in a quantitative manner.
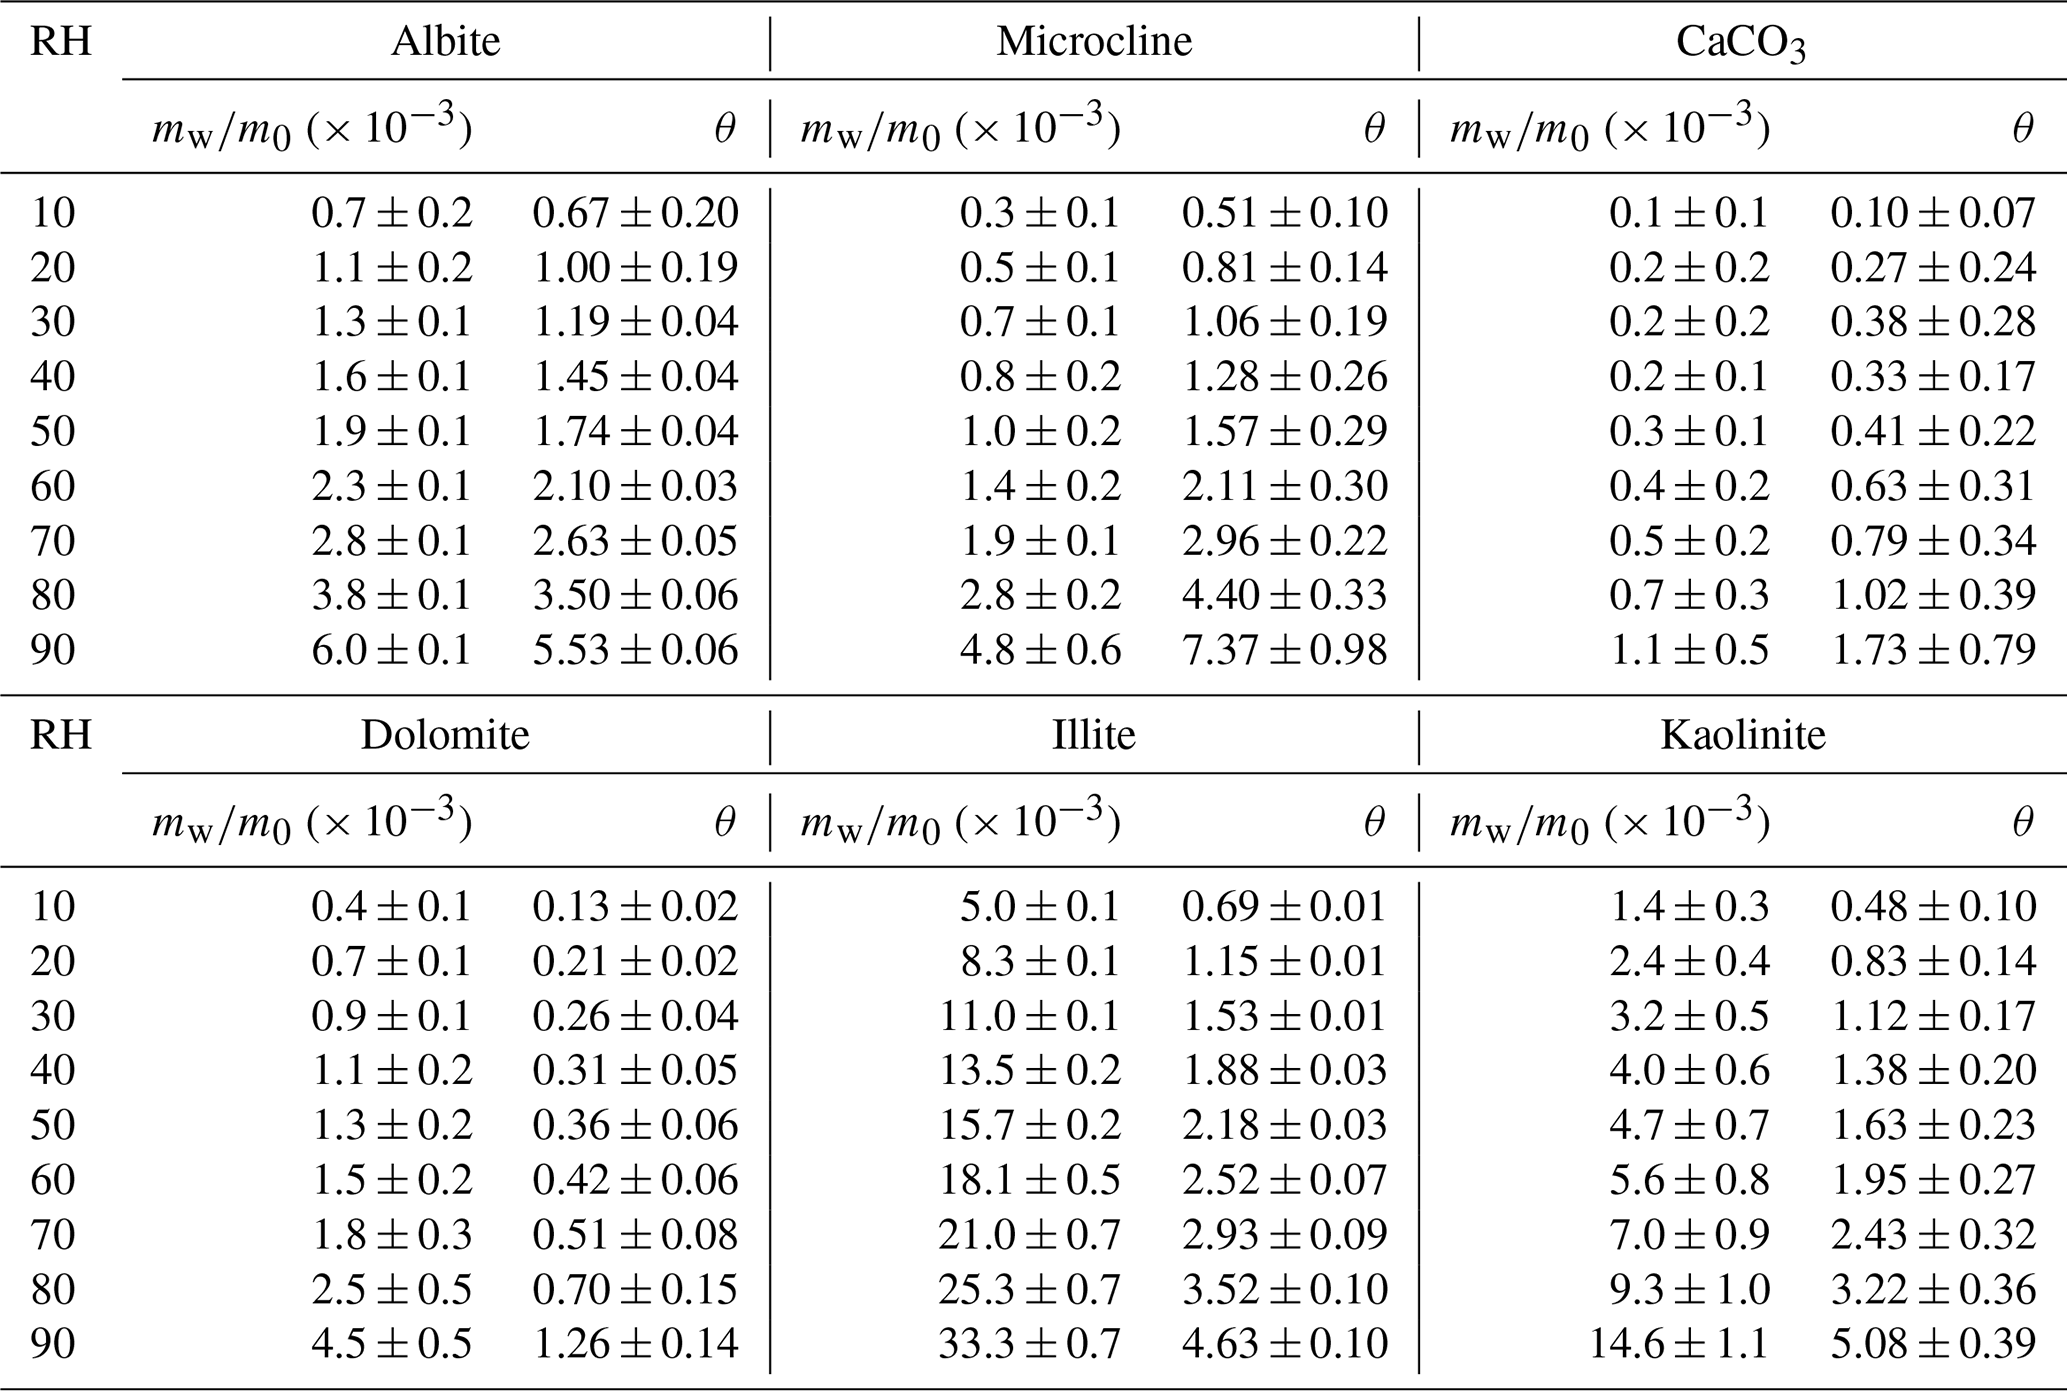
Table 3Mass ratios of adsorbed water to the dry mineral (mw∕m0) and surface coverages of adsorbed water (θ) as a function of RH (%) for albite, microcline, CaCO3, dolomite, illite and kaolinite.
3.2.4 Carbonates
The mass ratio of adsorbed water to the dry mineral, mw∕m0, was measured in our work to be 0.0011 at 90 % RH for CaCO3, giving a θ value of 1.73. Water adsorption on CaCO3 was investigated previously, using thermogravimetric analysis (Gustafsson et al., 2005), physisorption analysis (Ma et al., 2012a) and QCM (Hatch et al., 2008; Schuttlefield, 2008; Yeşilbaş and Boily, 2016). Hatch et al. (2008) and Ma et al. (2012a) reported mw∕m0 as a function of RH. Figure 5a shows that when compared to our work, mw∕m0 values determined by Hatch et al. (2008) were significantly larger (by a factor of 10 or more), whereas the results reported by Ma et al. (2012a) were only smaller by a factor of ∼ 2. We further compare our measured θ values with those reported by another two studies (Gustafsson et al., 2005; Schuttlefield, 2008). As shown in Fig. 5b, the results reported by Gustafsson et al. (2005) and Schuttlefield (2008) were found to be larger than ours, by a factor of 2–3. In addition, θ was measured to be > 100 at ∼ 70 % RH for CaCO3 (Yeşilbaş and Boily, 2016), approximately 2 orders of magnitude larger than our work.
As shown in Table 3, our work suggested that around 1.26 monolayers of adsorbed water were formed on dolomite at 90 % RH, similar to that for CaCO3. To our knowledge, water adsorption on dolomite has not been quantitatively explored by previous work.
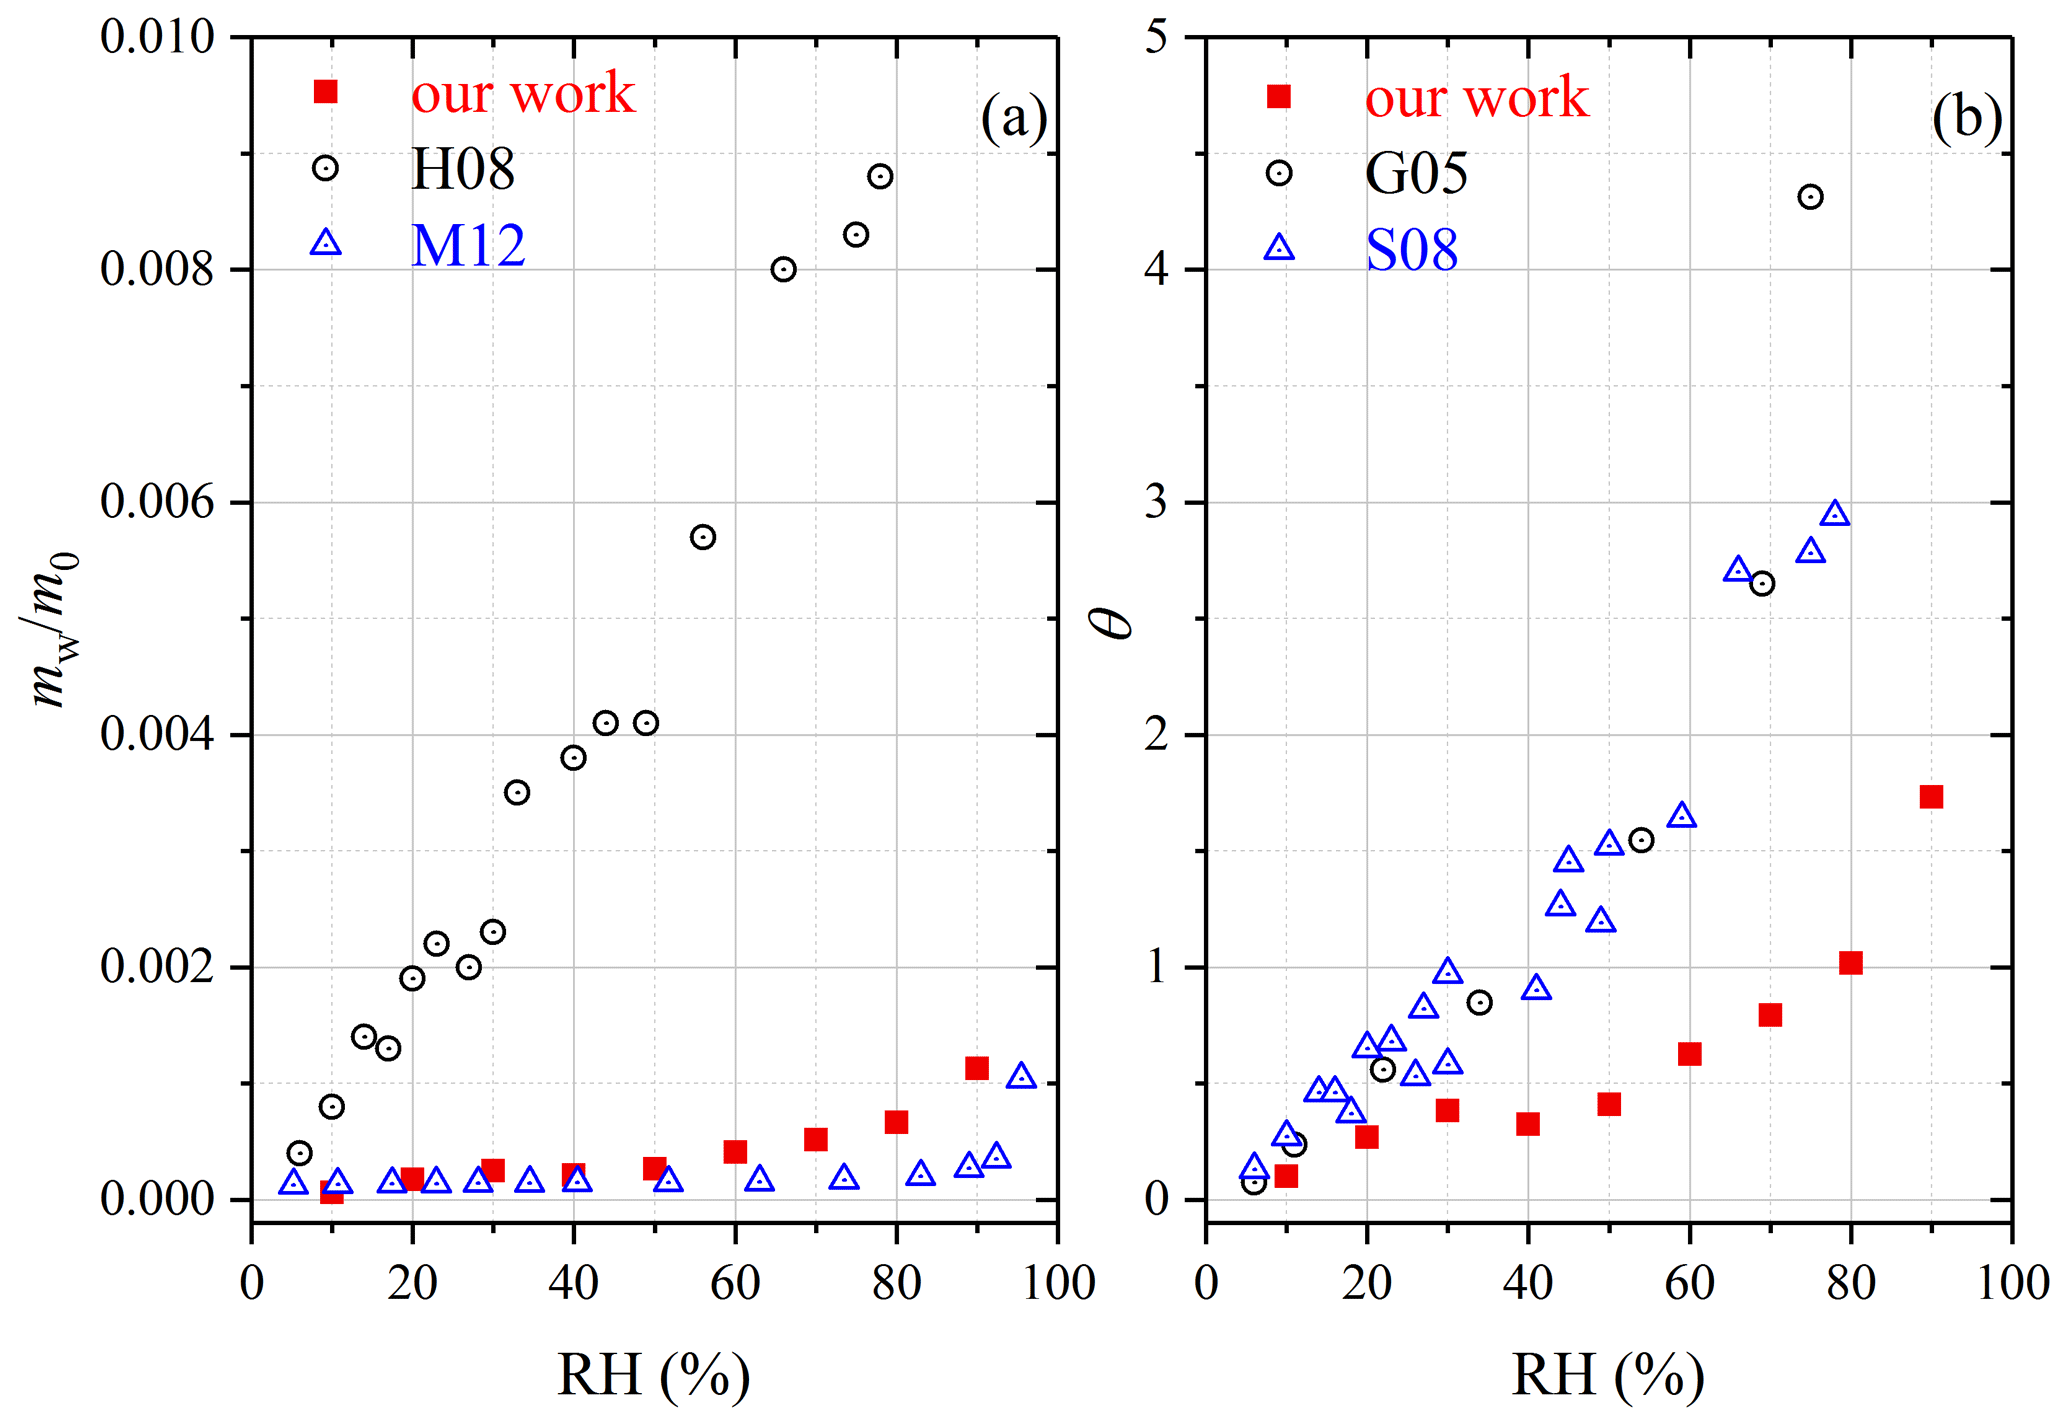
Figure 5Comparison of water adsorption on CaCO3 examined in different studies: (a) mass ratios of adsorbed water to the dry mineral (mw∕m0); (b) surface coverages of adsorbed water (θ). G05, Gustafsson et al. (2005); H08, Hatch et al. (2008); S08, Schuttlefield (2008); M12, Ma et al. (2012a).
3.2.5 Clay minerals
For illite, mw∕m0 and θ were determined to be 0.0333 and 4.63 at 90 % RH in our study (Table 3). QCM was employed to study water adsorption on illite, and mw∕m0 was reported to be 0.28 at ∼ 90 % RH (Hatch et al., 2011) and ∼ 0.27 at 75 % RH (Schuttlefield et al., 2007b), around 1 order of magnitude larger than our results. A recent study (Yeşilbaş and Boily, 2016) also investigated water uptake onto illite using QCM, and their reported θ values are compared with our results in Fig. 6a. The relative differences between our and their (Yeşilbaş and Boily, 2016) work were usually smaller than a factor of 2 and became even smaller at higher RH.
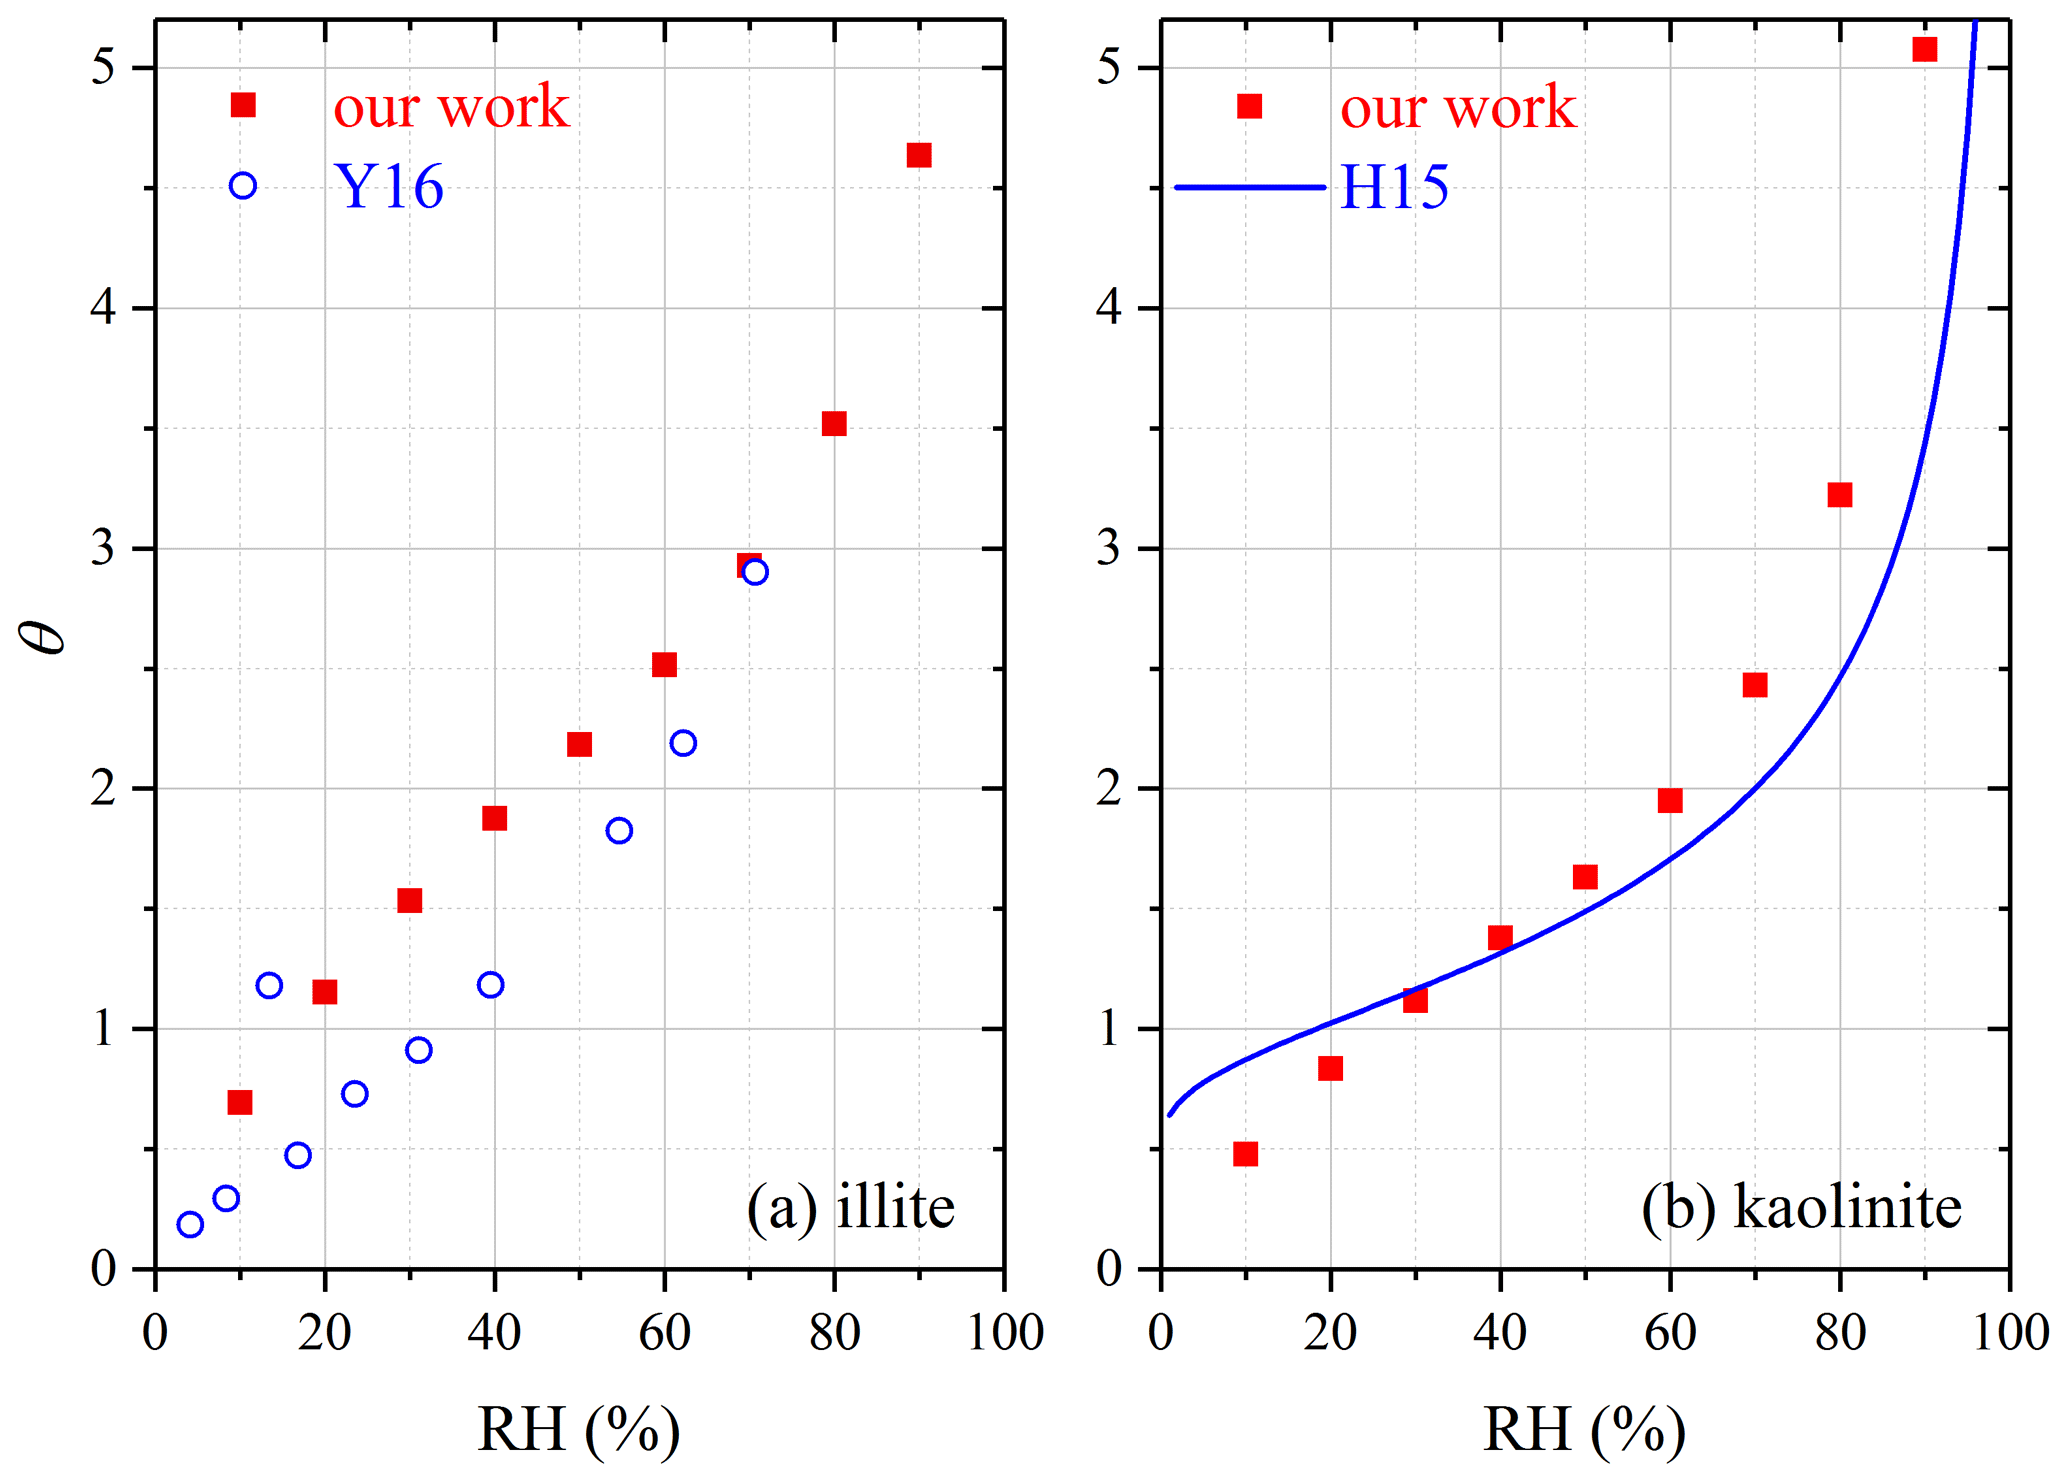
Figure 6Comparison of surface coverages of adsorbed water (θ) measured by different studies for (a) illite and (b) kaolinite. H15, Hung et al. (2015); Y16, Yeşilbaş and Boily (2016).
For kaolinite, mw∕m0 and θ were determined in our work to be 0.0093 and 3.22 at 80 % RH and 0.0146 and 5.08 at 90 % RH, respectively. A few previous studies investigated water adsorption on kaolinite using QCM (Schuttlefield et al., 2007b; Hatch et al., 2011; Yeşilbaş and Boily, 2016) and physisorption analysis (Hung et al., 2015). Comparison of our measured θ values with those reported by Hung et al. (2015) is displayed in Fig. 6b for kaolinite, suggesting that the two studies were in good agreement, and the relative differences were usually within 30 %. At ∼ 80 % RH, mw∕m0 values were determined to be ∼ 0.03 for kaolinite provided by Alfa and ∼ 0.1 for kaolinite (KGa-1b) obtained from the Clay Mineral Society (Schuttlefield et al., 2007b), around 3 and 10 times larger than our work. In the work by Hatch et al. (2011), mw∕m0 was determined to be ∼ 0.1 at ∼ 80 % RH for kaolinite (KGa-1b), about 1 order of magnitude larger than our result. Yeşilbaş and Boily (2016) examined water adsorption on two different kaolinite samples (kaolinite provided by Fluka and KGa-1), and θ values were found to be up to 100 at ∼ 70 % RH, > 30 times larger than our work.
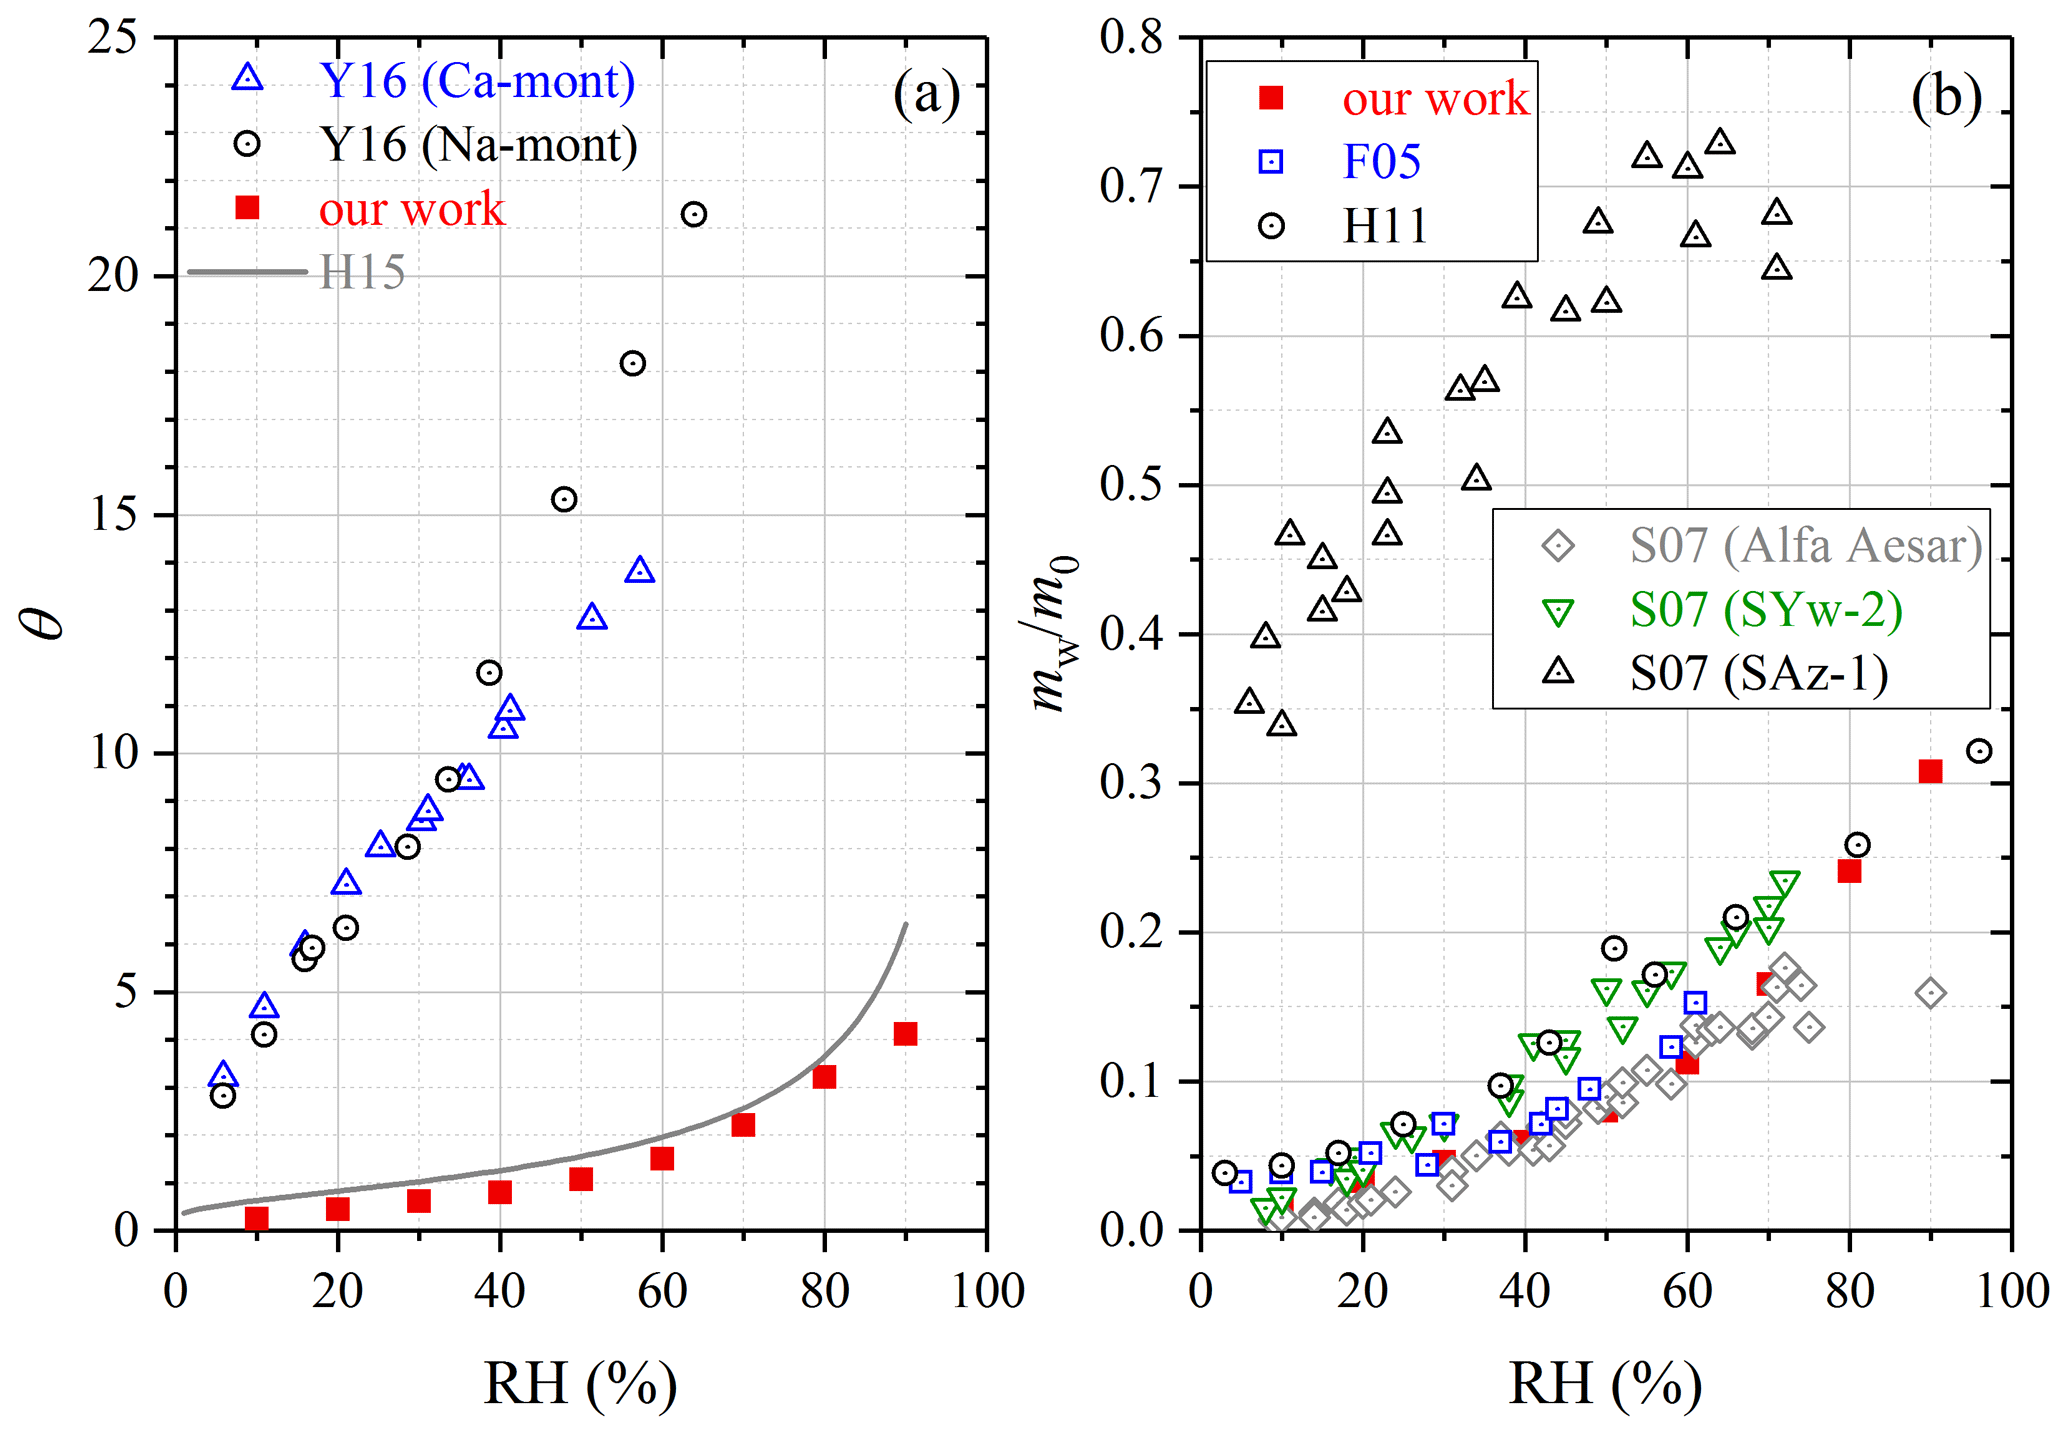
Figure 7Comparison of water adsorption on montmorillonite examined in different studies: (a) surface coverages of adsorbed water (θ); (b) the mass ratio of adsorbed water to the dry mineral (mw∕m0). F05, Frinak et al. (2005); S07, Schuttlefield et al. (2007b); H11, Hatch et al. (2011); H15, Hung et al. (2015); Y16, Yeşilbaş and Boily (2016).
We also studied water adsorption on montmorillonite, and mw∕m0 and θ were measured to be 0.308 and 4.12 at 90 % RH. Physisorption analysis (Hung et al., 2015) and QCM (Yeşilbaş and Boily, 2016) were utilized to investigate water uptake onto montmorillonite. As shown in Fig. 7a, our work agreed well with Hung et al. (2015), and the results obtained by Yeşilbaş and Boily (2016) for Ca and Na montmorillonite were much larger (by a factor of > 10), when compared with our work. Figure 7b compares our measured mw∕m0 values with those reported in previous studies in which FTIR (Frinak et al., 2005) and QCM (Schuttlefield et al., 2007b; Hatch et al., 2011) were used. In general good agreement between our work and the three previous studies was found, except for SAz-1 montmorillonite (Schuttlefield et al., 2007b) obtained from the Clay Mineral Society. One possible explanation for the observed discrepancy is that montmorillonite samples from different sources may have different hygroscopic properties. We note that prior to 2005, a few studies (Hall and Astill, 1989; Cases et al., 1992; Xu et al., 2000; Zent et al., 2001) also investigated water uptake by montmorillonite, and it was found that these studies agreed well with Frinak et al. (2005); therefore, the four studies conducted before 2005 should also be consistent with our work.
In addition, water uptake by chlorite was explored in our work. As shown in Table 4, mw∕m0 and θ were measured to be 0.012 and 4.03 at 90 % RH. To our knowledge, hygroscopic properties of chlorite have not been examined before.
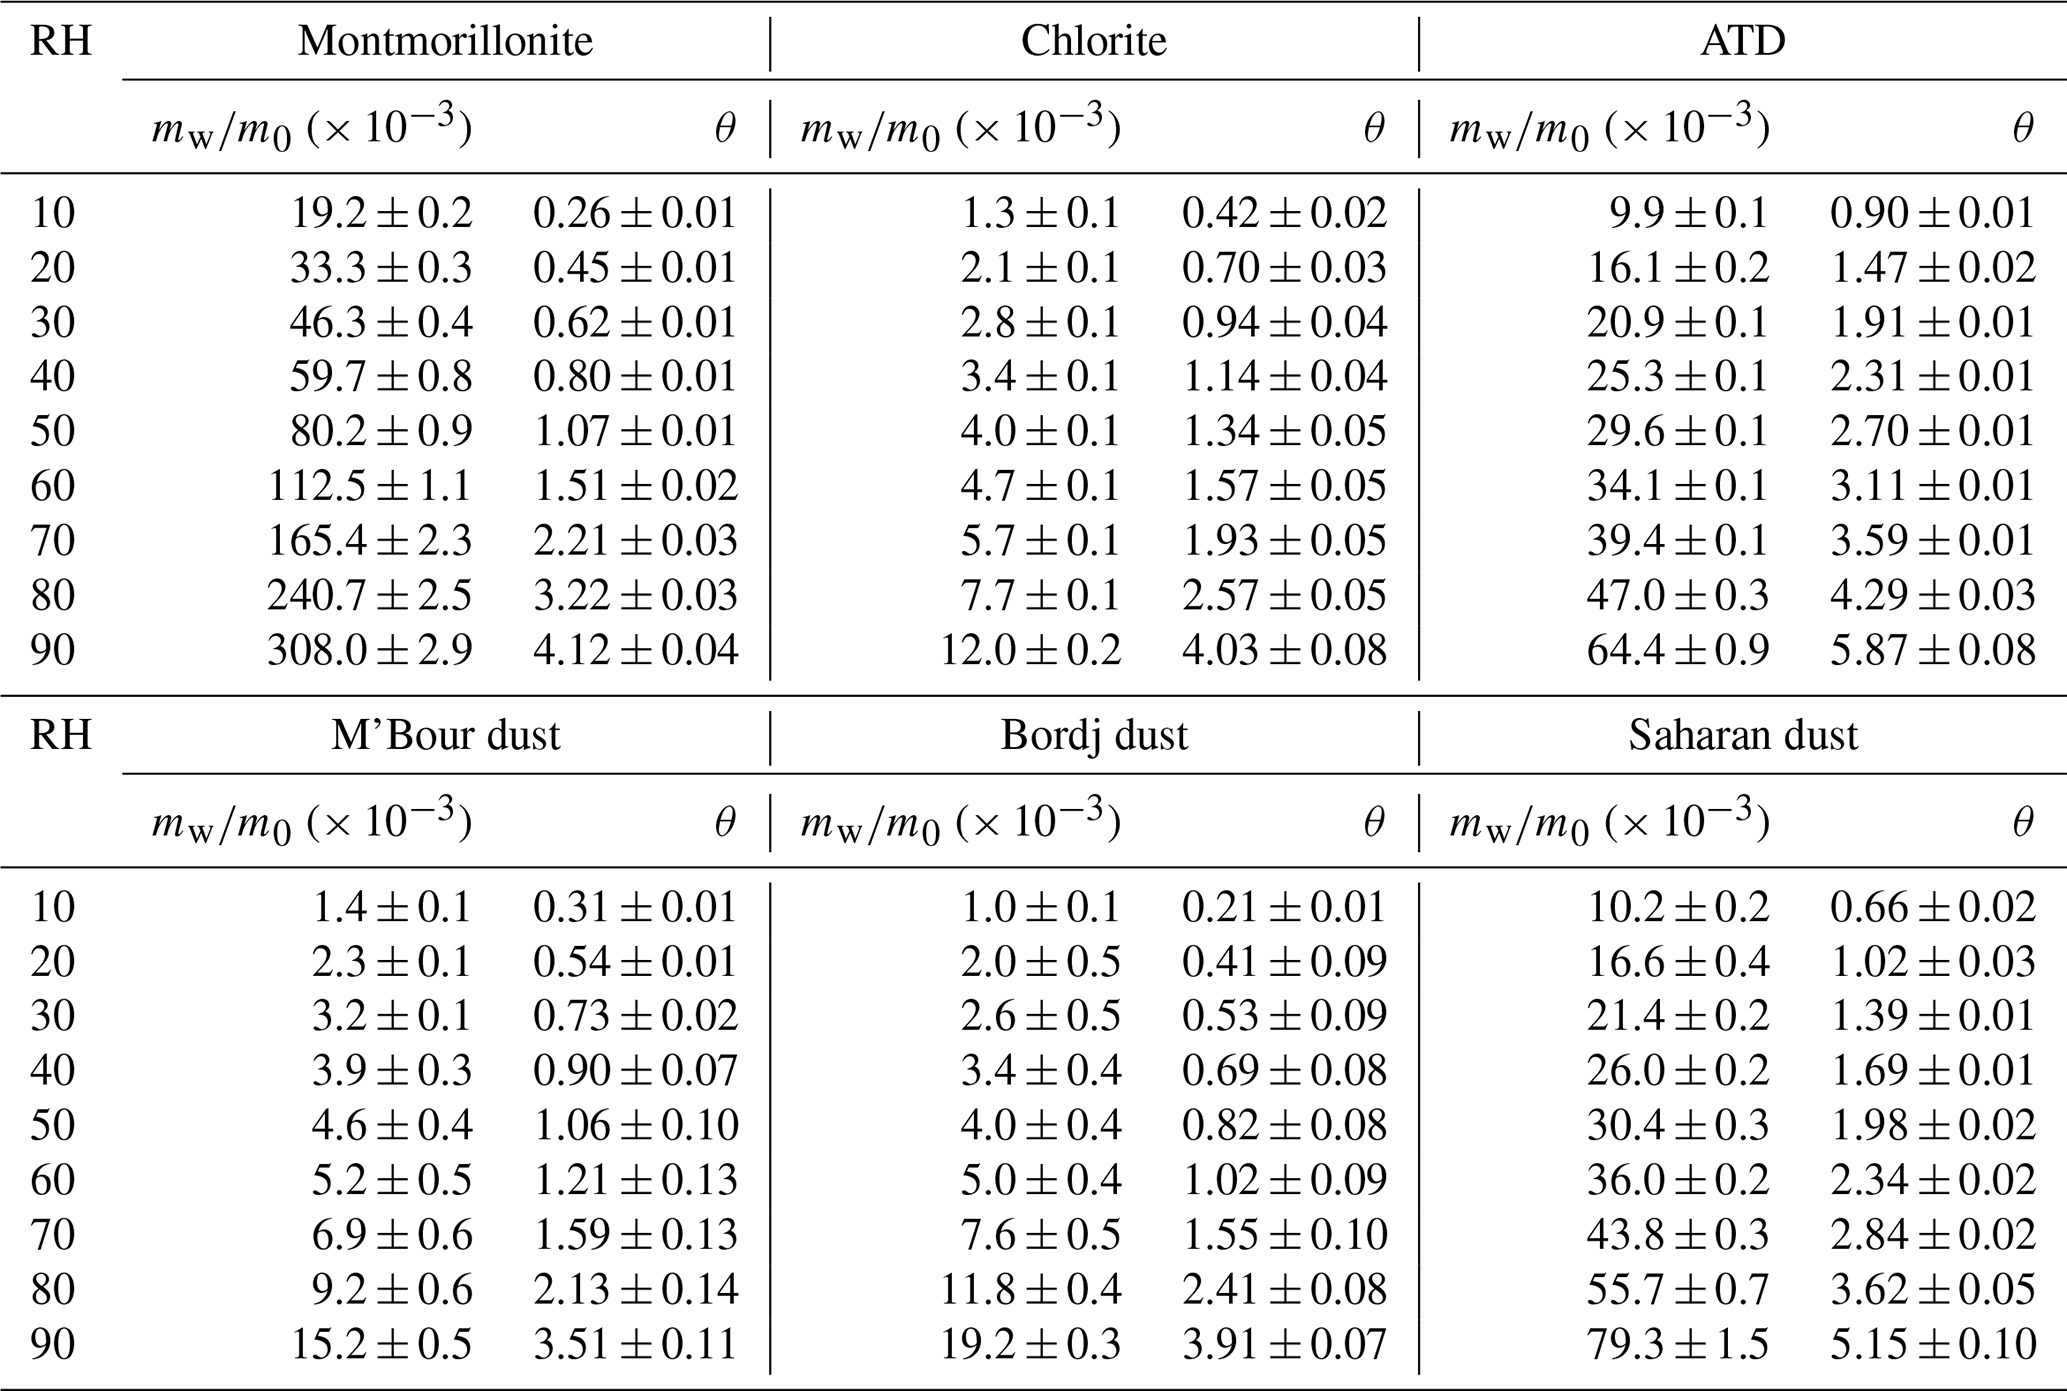
Table 4Mass ratio of adsorbed water to the dry mineral (mw∕m0) and surface coverages of adsorbed water (θ) as a function of RH (%) for montmorillonite, chlorite, ATD, M'Bour dust, Bordj dust and Saharan dust.
3.2.6 Authentic mineral dust
ATD. Table 4 suggests that at 90 % RH, mw∕m0 and θ were measured in our work to be 0.0644 and 5.87 for ATD. Two previous studies (Navea et al., 2010; Yeşilbaş and Boily, 2016) employed QCM to investigate water adsorption on ATD. In the first study (Navea et al., 2010), mw∕m0 was measured to be > 0.1 at 70 % RH, 2–3 times larger than our result (∼ 0.04 at 70 % RH); in the second study (Yeşilbaş and Boily, 2016), θ was measured to be > 200 at ∼ 70 % RH, almost 2 orders of magnitude larger than our work (∼ 3.6 at 70 % RH). Gustafsson et al. (2005) used a thermogravimetric analyzer to study water uptake by ATD, and as shown in Fig. 8a, their results agreed very well with ours. A recent study (Joshi et al., 2017) investigated water adsorption on ATD using FTIR; compared to our work, the values reported by Joshi et al. (2017) were ∼ 30 % lower, suggesting fairly good agreement between the two studies.
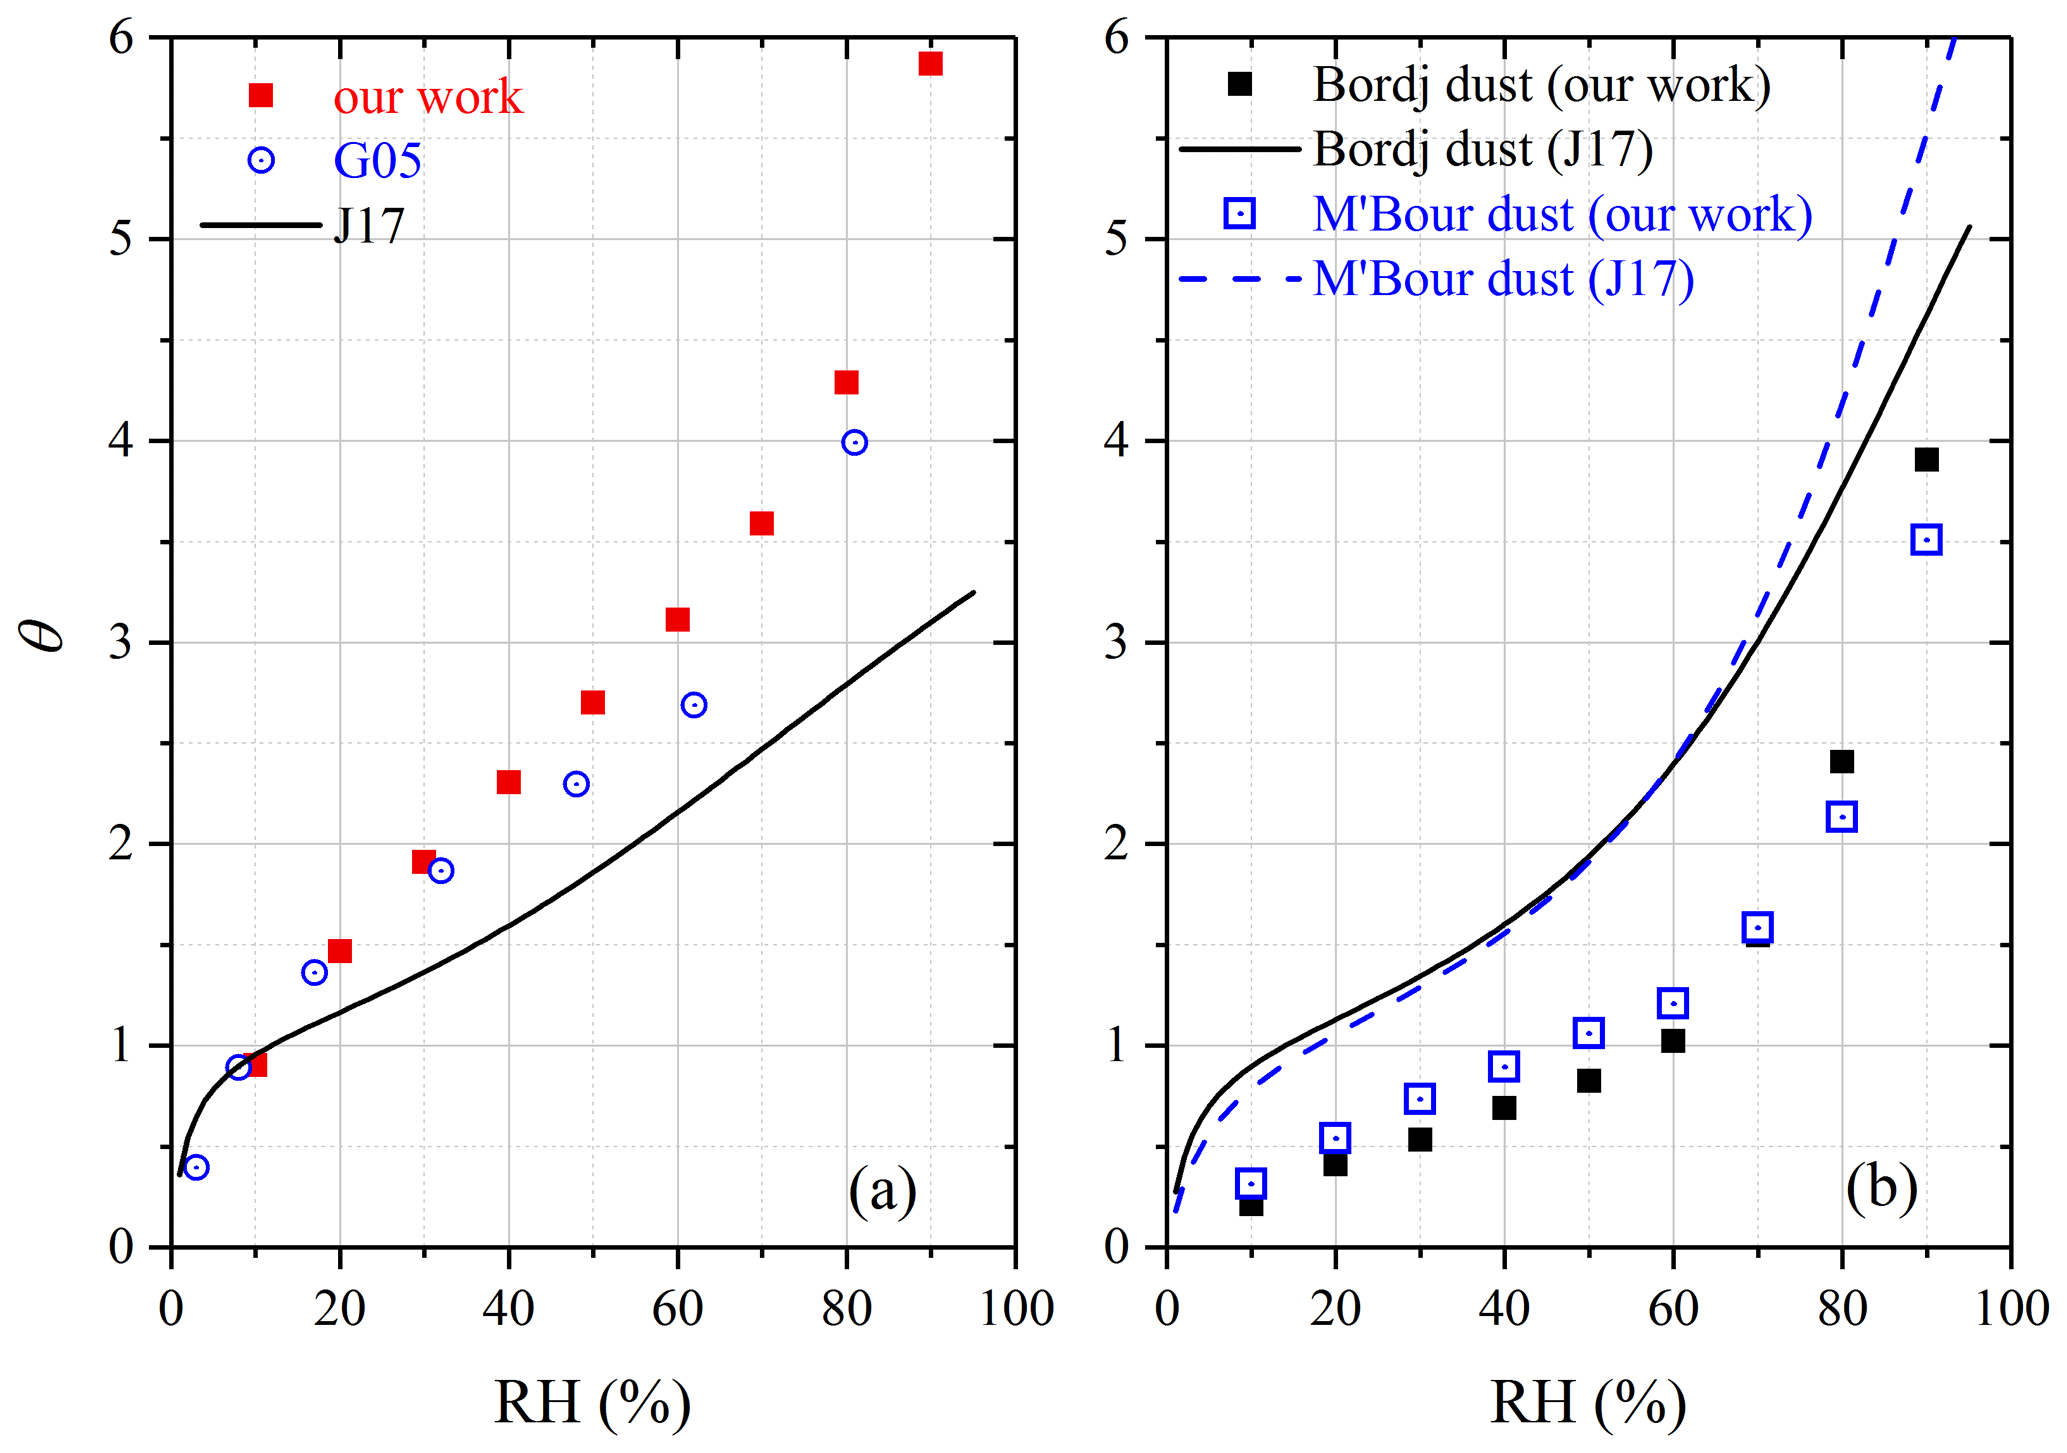
Figure 8Comparison of surface coverages of adsorbed water (θ) reported in different studies for (a) ATD and (b) Bordj dust and M'Bour dust. G05, Gustafsson et al. (2005); J17, Joshi et al. (2017).
African dust. In our study, mw∕m0 and θ were measured to be 0.0192 and 3.91 for Bordj dust and 0.0152 and 3.51 for M'Bour dust at 90 % RH, respectively. Joshi et al. (2017) employed FTIR to investigate interaction of water vapor with Bordj dust and M'Bour dust. As suggested by Fig. 8b, the relative differences between our and their work (Joshi et al., 2017) were usually within a factor of 2 for the two dust samples, and the discrepancy also became smaller at higher RH, suggesting fair consistency between the two studies.
For Saharan dust, mw∕m0 and θ were determined in our study to be 0.0793 and 5.15 at 90 % RH. Water uptake onto Saharan dust was studied using QCM (Navea et al., 2010), and their results, as shown in Fig. 9a, were 2–3 times larger than our work.
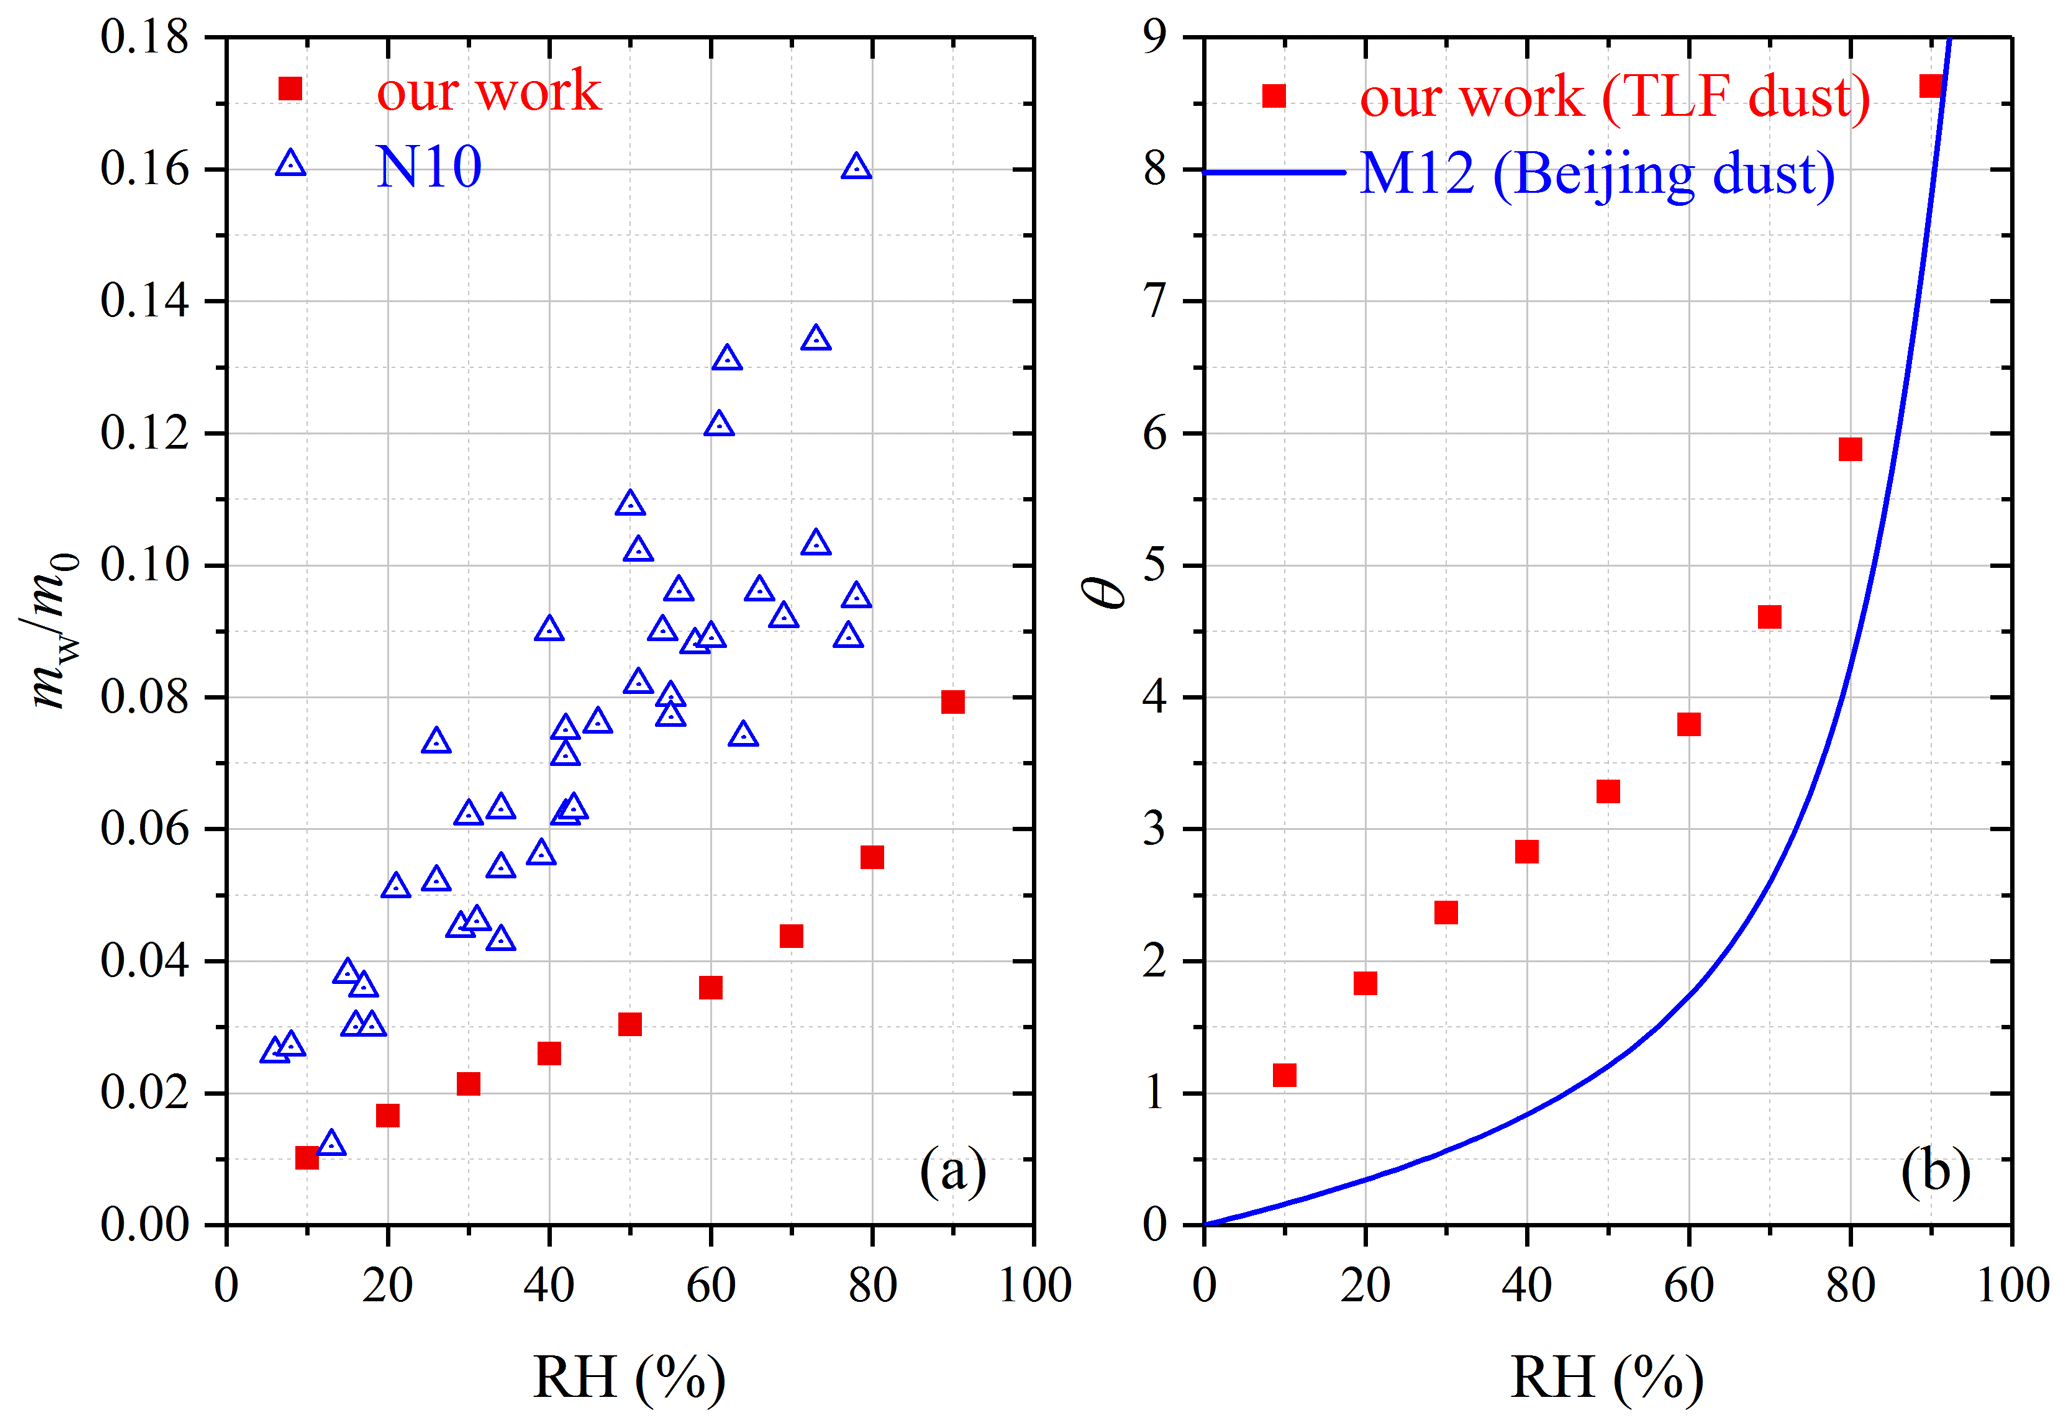
Figure 9(a) Comparison of mass ratios of adsorbed water to the dry mineral (mw∕m0) measured by our work and N10 (Navea et al., 2010) for Saharan dust. (b) Comparison of surface coverages of adsorbed water (θ) for TLF dust measured in our work with Beijing dust measured in M12 (Ma et al., 2012b).
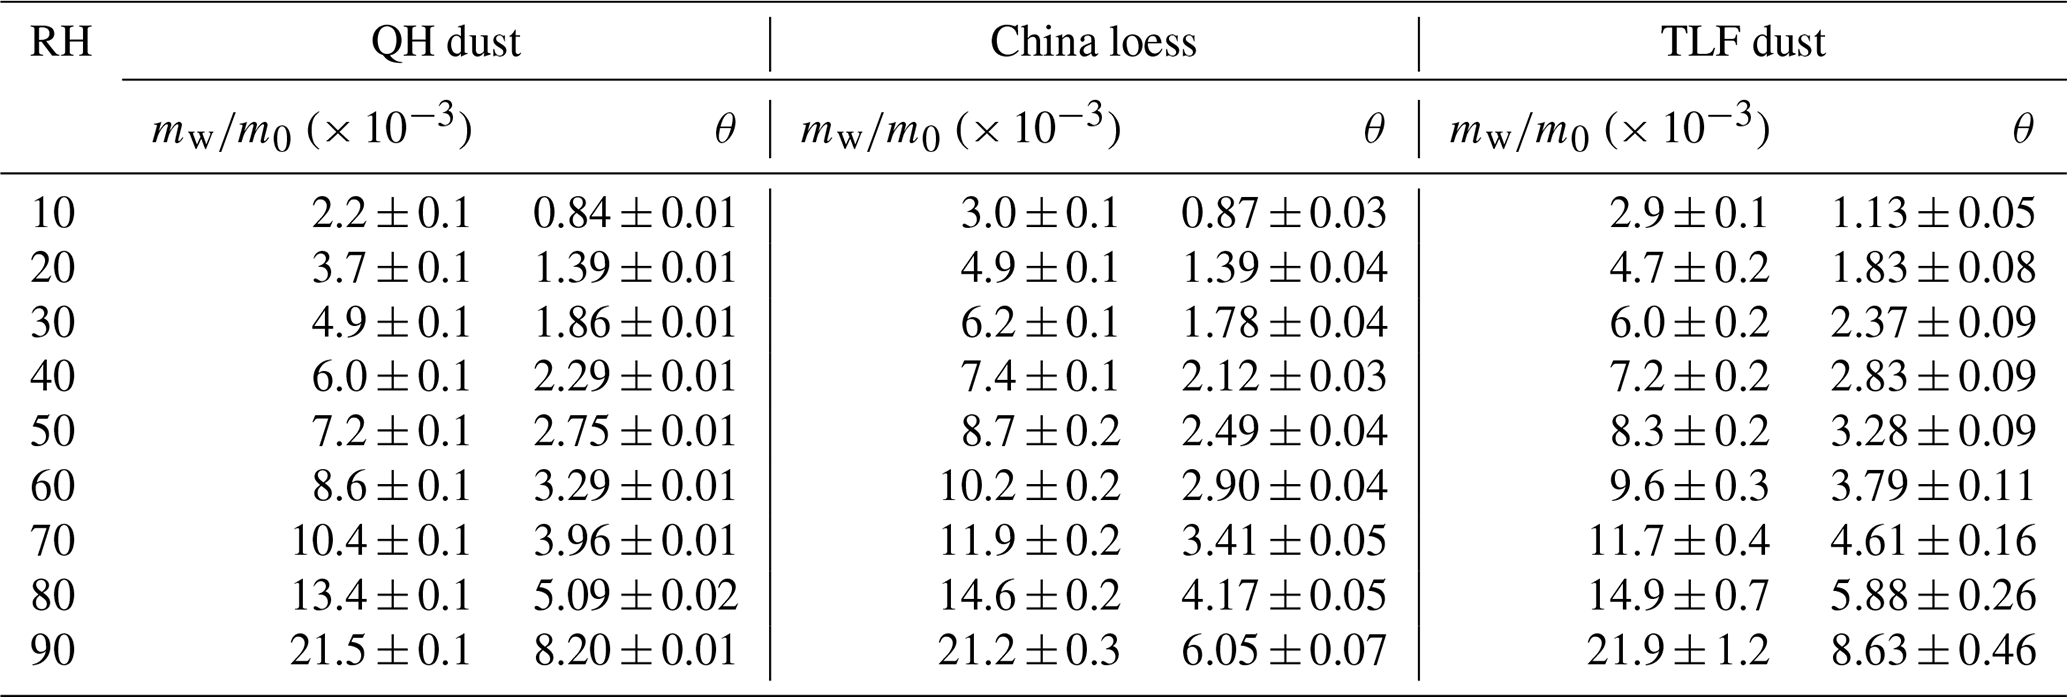
Asian dust. Table 5 summarizes our results obtained for three Asian mineral dust samples, including China loess, QH dust and TLF dust. It should be pointed out that mw∕m0 values have been reported in our previous work (Tang et al., 2019c) for China loess and QH dust, and they are included here for comparison. As shown in Table 5, the three Asian authentic dust samples exhibited very similar water uptake properties, and their mw∕m0 values were determined to be 0.021–0.022 at 90 % RH. Navea et al. (2010) employed QCM to study the interaction of water vapor with China loess, and mw∕m0 was reported to be ∼ 0.17 at 70 % RH, more than 1 order of magnitude larger than our result (∼ 0.012 at 70 % RH).
As mentioned in Sect. 2.1, TLF dust examined in our work was airborne dust particles collected during a dust storm in Turpan (Xinjiang, China) which was very close to the dust source. In a previous study (Ma et al., 2012b), dust particles (termed Beijing dust here) were collected during a dust storm in Beijing (and thus these particles had undergone atmospheric aging to some extent), and their hygroscopic properties were then investigated using a physisorption analyzer. As revealed by Fig. 9b, our work agreed fairly well with Ma et al. (2012b) at high RH (70 %, 80 % and 90 %), though the differences became considerably larger at lower RH.
Table 5Mass ratios of adsorbed water to the dry mineral (mw∕m0) and surface coverages of adsorbed water (θ) as a function of RH (%) for QH dust, China loess and TLF dust.
3.2.7 Discussion
To investigate water adsorption by mineral dust, one previous study (Gustafsson et al., 2005) employed thermogravimetric analysis which measured sample mass as a function of RH (essentially the same to vapor sorption analyzer (VSA) used in our study), and another two groups (Ma et al., 2012a, b; Hung et al., 2015) employed physisorption analysis which measured change in water vapor pressure caused by adsorption onto mineral dust (Ma et al., 2010b). Thermogravimetric analysis, physisorption analysis and the VSA technique used in our work can be considered absolutely quantitative, and as discussed in Sect. 3.2.1–3.2.6, in general our work agreed well with these four previous studies (Gustafsson et al., 2005; Ma et al., 2012a, b; Hung et al., 2015).
FTIR was widely employed in previous work (Goodman et al., 2001; Frinak et al., 2005; Ma et al., 2010a; Joshi et al., 2017; Ibrahim et al., 2018) to study water uptake onto mineral dust, although it is not straightforward to convert IR absorption intensities of adsorbed water to its absolute amounts (Schuttlefield et al., 2007a; Ma et al., 2010b; Tang et al., 2019a). The relative differences between these studies and our work were typically within a factor of 2–3; since even for dust samples with the same name, samples examined in different studies may actually differ substantially in composition and water uptake properties, the agreement between these studies and our work can be considered fairly good.
QCM is another technique widely used to investigate water uptake onto mineral dust (Schuttlefield et al., 2007b; Hatch et al., 2008; Schuttlefield, 2008; Navea et al., 2010; Hatch et al., 2011; Yeşilbaş and Boily, 2016). As shown in Sect. 3.2.1–3.2.6, though good agreement was found for some mineral dust between our work and these QCM studies, large discrepancies (up to 2–3 orders of magnitude) were frequently observed. This implies that the underlying assumptions required to convert the change in resonance frequency of the quartz crystal to the change in sample mass may not be fulfilled, and as a result the QCM results should be used with caution.
For the same dust (at least with the same name), different samples with distinctive hygroscopicity may have been used in our work and previous studies, contributing to the observed discrepancies; in addition, previous work may adopt various pretreatment procedures, and it is difficult to assess the effects of these pretreatments on dust hygroscopicity reported in different studies. To further understand and resolve the discrepancies identified, it will be very useful to distribute the same samples to different groups (in which different techniques would be applied to study their hygroscopic properties) and compare the results obtained; furthermore, these samples should be pretreated with the same or very similar protocols after being received by different groups. Similar strategies have already been adopted before to compare different instruments used for ice nucleation research and shown to be valuable (Hiranuma et al., 2015; DeMott et al., 2018).
3.3 Hygroscopicity parameterizations
It has been suggested that water adsorption and hygroscopicity of insoluble particles can be parameterized as a function of RH by several theoretical models, including (1) the Brunauer–Emmet–Teller (BET) adsorption isotherm (Goodman et al., 2001; Ma et al., 2010a; Joshi et al., 2017; Ibrahim et al., 2018), (2) the Freundlich adsorption isotherm (Hatch et al., 2011), (3) the Frenkel–Halsey–Hill (FHH) adsorption isotherm (Kumar et al., 2011b; Hatch et al., 2014; Hung et al., 2015; Hatch et al., 2019) and (4) the κ-Köhler equation (Chen et al., 2019; Tang et al., 2019b). In this work we attempted to use the aforementioned four models to fit our experimental data. As shown in Fig. 10 (where SiO2, albite, kaolinite and TLF dust are used as examples), our work suggested that the FHH adsorption isotherm could describe the measured hygroscopicity of mineral dust samples as a function of RH well. In addition, we found that the other three parameterization methods could not fit our experimental data.

Figure 10Surface coverages (θ) of adsorbed water on (a) SiO2, (b) albite, (c) kaolinite and (d) TLF dust as a function of RH (0 %–90 %) at 25 ∘C. The experimental data were fitted with Frenkel–Halsey–Hill adsorption isotherm model (solid curves).
The FHH adsorption isotherm, which describes surface coverages of adsorbed water (θ) as a function of RH, is given by Eq. (2) (Sorjamaa and Laaksonen, 2007; Tang et al., 2016):
where AFHH and BFHH are empirical parameters. We found that Eq. (2) can fit θ versus RH well for all the 21 mineral dust samples examined (R2 values were found to be in the range of 0.94–0.99), and the generated AFHH and BFHH values are summarized in Table 6. As shown in Table 6, AFHH values spanned from 0.15 ± 0.01 (dolomite) to 4.39 ± 0.81 (ATD), while the variation in BFHH was much smaller, ranging from 1.10 ± 0.04 (for Bordj dust) to 1.91 ± 0.18 (for ATD). Our results were largely consistent with the theoretical work by Sorjamaa and Laaksonen (2007), who suggested from a theoretical view that typical AFHH and BFHH values should be in the range of 0.1–3.0 and 0.5–3.0.
Table 6Comparison of AFHH and BFHH values determined in our work for mineral dust with those reported in previous studies (a Kumar et al., 2011a; b Hung et al., 2015; c Hatch et al., 2019).
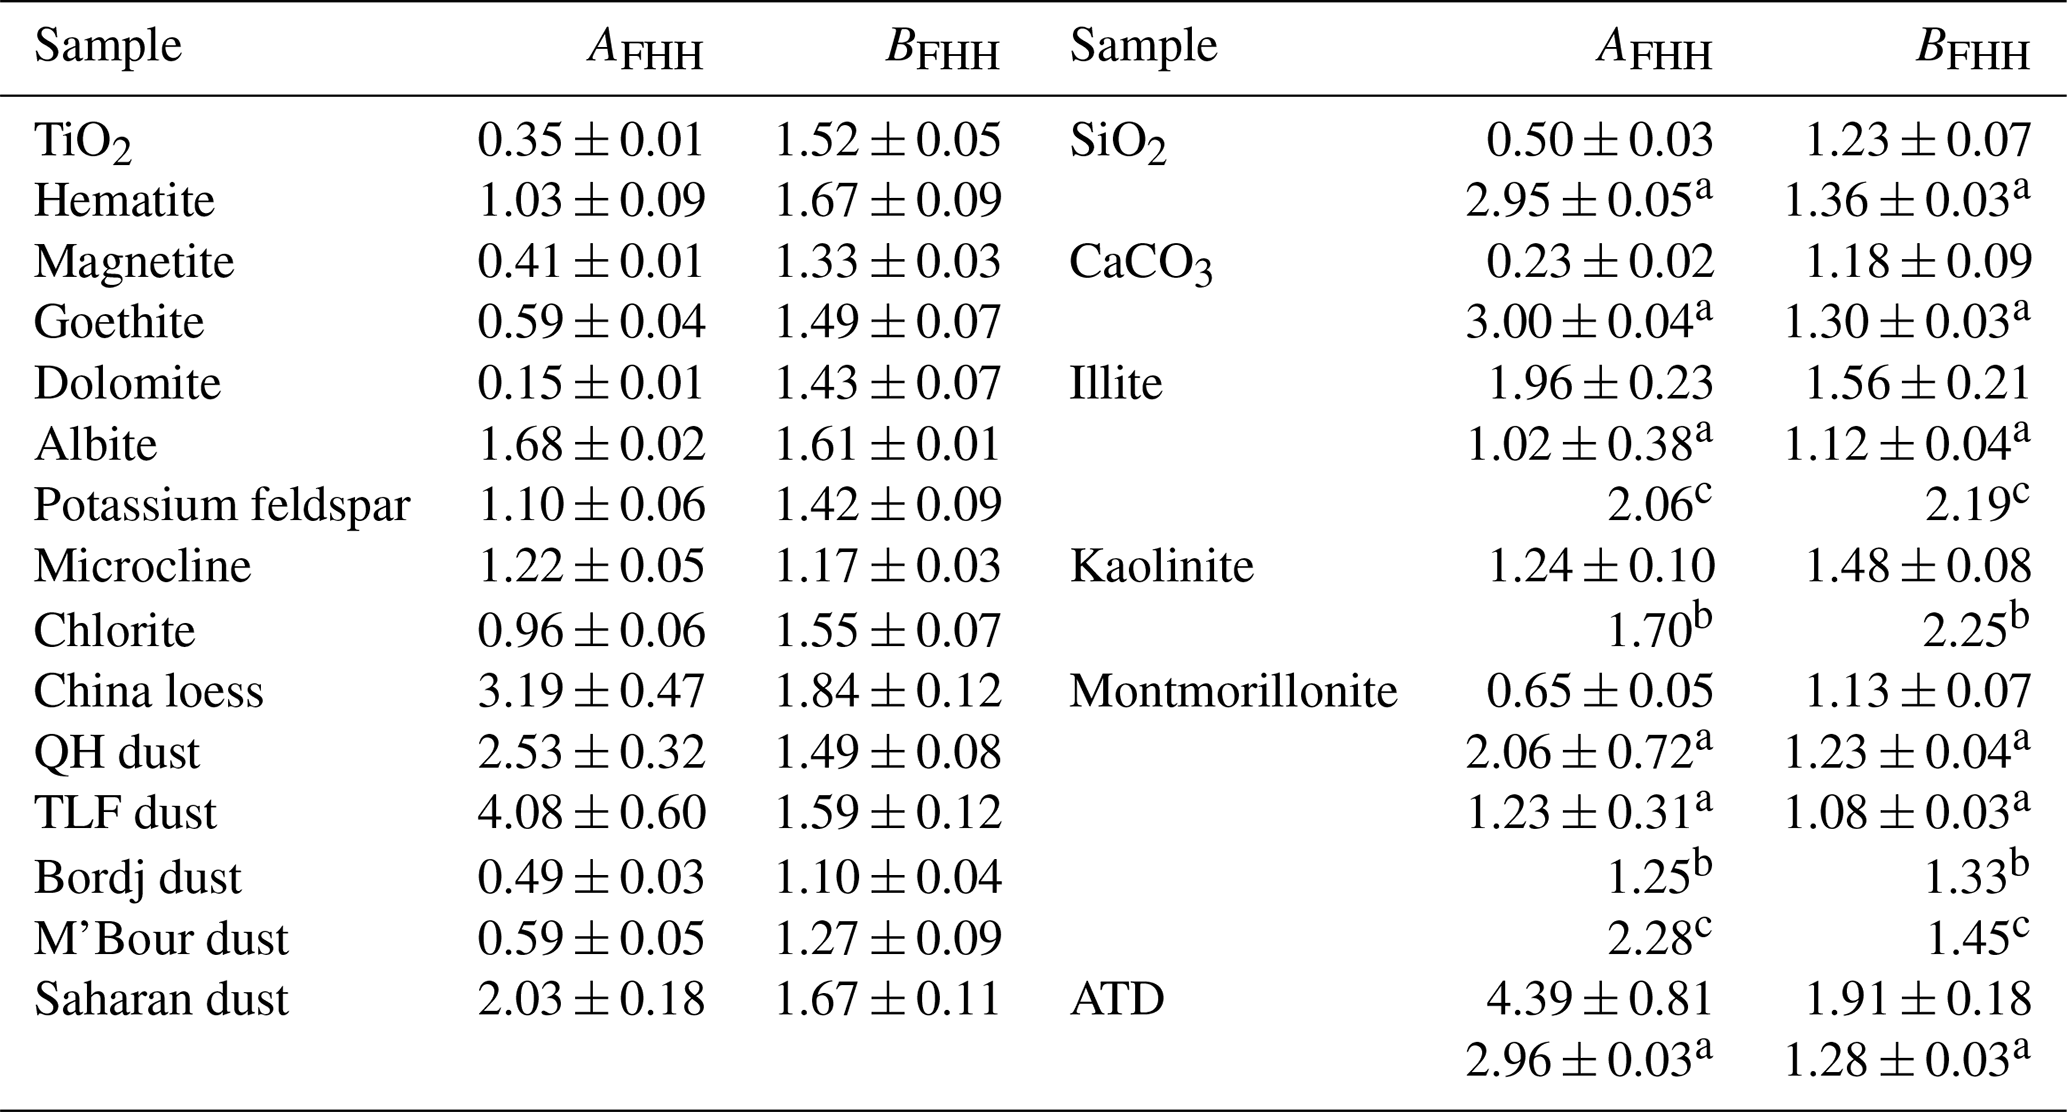
A few previous studies investigated hygroscopic properties (Hung et al., 2015; Hatch et al., 2019) and cloud condensation nuclei (CCN) activities (Kumar et al., 2011b) of mineral dust and reported AFHH and BFHH values for samples they examined. Their results are also compiled in Table 6. As revealed by Table 6, BFHH values reported in our work were reasonably consistent with previous studies, while larger differences were observed for AFHH values, especially between our study and the work by Kumar et al. (2011a) for SiO2 and CaCO3. One reason for such a large difference is that Kumar et al. (2011a) carried out their CCN activity measurements at > 100 % RH whereas our work on hygroscopic growth was conducted at < 100 % RH. Another study (Kumar et al., 2011a) reported AFHH and BFHH values for wet-generated mineral dust aerosols. Since the hygroscopicity of wet-generated mineral dust aerosols could be very different from dry-generated aerosols (Sullivan et al., 2010b; Kumar et al., 2011a), the results reported by Kumar et al. (2011b) for wet-generated aerosols are not further discussed.
As shown in Tables 2–5, among the 21 mineral dust samples examined, mw(90 %)∕m0 (mass ratios of adsorbed water at 90 % RH to the dry sample) was found to range from 0.0011 for CaCO3 to 0.0380 for montmorillonite, and θ(90 %) (surface coverages of adsorbed water at 90 % RH) varied between 1.26 for dolomite and 8.63 for TLF dust. It appears that clay minerals and authentic mineral dust samples usually exhibited larger hygroscopicity on a per mass basis, when compared to other types of mineral dust. TiO2, for which mw(90 %)∕m0 was only lower than ATD, Saharan dust and montmorillonite, was an outstanding exception, probably because of its very large BET surface area (54.6 m2 g−1).
One may expect that on a per mass basis, mineral dust samples with larger surface area would have larger capacities to adsorb water. This was supported by our results shown in Fig. 11a, which suggests that for mineral dust samples considered in our study, overall mw(90 %)∕m0 increased with the BET surface area. Nevertheless, not all the samples obeyed this overall trend, as evident from Fig. 11a, indicating that other factors would also play some roles in determining the ability of mineral dust to adsorb water on a per mass basis. We also explored whether there was any relationship between hygroscopicity of mineral dust samples and the soluble materials they contained. It was found that for the 21 mineral dust samples considered in our work, mw(90 %)∕m0 did not show any general dependence on the number of soluble inorganic ions.

Figure 11(a) The dependence of mw(90 %)∕m0 (mass ratios of adsorbed water to the dry mineral at 90 % RH) on BET surface areas; (b) the dependence of θ(90 %) (surface coverages of adsorbed water at 90 % RH) on average particle diameters.
Ibrahim et al. (2018) studied water adsorption on ATD particles with different particle sizes, and they found that the RH at which one monolayer of adsorbed water was formed increased with particle size; in other words, at the same RH the surface coverages of adsorbed water would be higher for smaller particles (Ibrahim et al., 2018). In contrast, Yeşilbaş and Boily (2016) investigated water adsorption on different mineral samples (21 in total) and suggested that at the same RH more monolayers of adsorbed water would be formed on larger particles. However, as shown in Fig. 11b in which our measured θ values at 90 % RH are plotted versus particle size, our work revealed that surface coverages of adsorbed water at 90 % RH showed no dependence on particle size for the 21 mineral dust samples examined in our work. This conclusion should be used with caution as dust samples used in our work were far from being monodisperse (see Figs. S1–S7).
Hygroscopicity largely determines environmental and climatic effects of mineral dust aerosol, one of the most abundant tropospheric aerosols. However, hygroscopic properties of mineral dust remain highly uncertain, due to relatively low hygroscopicity of mineral dust and its non-sphericity. In our work, a vapor sorption analyzer, which measured sample mass as a function of RH (< 1 % to 90 %), was employed to investigate water adsorption and hygroscopic properties of 21 different mineral dust samples, including seven authentic mineral dust samples (from Africa, China and the United States) and 14 major minerals found in tropospheric mineral dust aerosol.
For all the mineral dust samples (21 in total) examined, mw(90 %)∕m0 was found to range from 0.0011 (CaCO3) to 0.3080 (montmorillonite), and θ(90 %) varied between 1.26 (dolomite) and 8.63 (TLF dust). When compared to other types of mineral dust, clay minerals and authentic mineral dust samples usually exhibited larger hygroscopicity on a per mass basis. Our work suggested that overall mw(90 %)∕m0 increased with the BET surface area, indicating that on a per mass basis, mineral dust samples with larger surface area would have larger capacities to adsorb water in general. Our results revealed no dependence of mw(90 %)∕m0 on the amount of soluble materials contained or no dependence of θ(90 %) on particle size. In addition, it was found in our work that the Frenkel–Halsey–Hill (FHH) adsorption isotherm could describe surface coverages of adsorbed water as a function of RH well for all the mineral dust investigated, and AFHH and BFHH parameters were determined to be in the range of 0.15–4.39 and 1.10–1.91, respectively.
Data used in this paper can be found in the main text or Supplement of this paper.
The supplement related to this article is available online at: https://doi.org/10.5194/acp-20-13611-2020-supplement.
MT conceived this work; LC, CP, WG, HF and HZ carried out experiments under the advice of XJ and MT; LC, CP and MT analyzed the data; LC, CP and MT wrote the manuscript with input from all the coauthors.
The authors declare that they have no conflict of interest.
We would like to thank John Crowley (Max Planck Institute for Chemistry, Germany) for providing Saharan dust, Pingqing Fu (Tianjin University, China) for providing TLF dust, and Manolis Romanias (Universiteì Lille, France) for providing M'Bour dust and Bordj dust.
This work was sponsored by the National Natural Science Foundation of China (42022050 and 91744204), Ministry of Science and Technology of China (2018YFC0213901), Guangdong Foundation for Program of Science and Technology Research (2020B1212060053 and 2019B121205006), Guangdong Province (2017GC010501) and CAS Pioneer Hundred Talents program.
This paper was edited by Markus Ammann and reviewed by two anonymous referees.
Attwood, A. R. and Greenslade, M. E.: Optical Properties and Associated Hygroscopicity of Clay Aerosols, Aerosol Sci. Tech., 45, 1350–1359, 2011.
Balkanski, Y., Schulz, M., Claquin, T., and Guibert, S.: Reevaluation of Mineral aerosol radiative forcings suggests a better agreement with satellite and AERONET data, Atmos. Chem. Phys., 7, 81–95, https://doi.org/10.5194/acp-7-81-2007, 2007.
Cases, J. M., Berend, I., Besson, G., Francois, M., Uriot, J. P., Thomas, F., and Poirier, J. E.: Mechanism of adsorption and desorption of water vapor by homoionic montmorillonite. 1. The sodium-exchanged form, Langmuir, 8, 2730–2739, 1992.
Chen, L. X. D., Chen, Y. Z., Chen, L. L., Gu, W. J., Peng, C., Luo, S. X., Song, W., Wang, Z., and Tang, M. J.: Hygroscopic properties of eleven pollen species in China, ACS Earth Space Chem., 3, 2678–2683, 2019.
Cziczo, D. J., Froyd, K. D., Hoose, C., Jensen, E. J., Diao, M., Zondlo, M. A., Smith, J. B., Twohy, C. H., and Murphy, D. M.: Clarifying the Dominant Sources and Mechanisms of Cirrus Cloud Formation, Science, 340, 1320–1324, 2013.
DeMott, P. J., Möhler, O., Cziczo, D. J., Hiranuma, N., Petters, M. D., Petters, S. S., Belosi, F., Bingemer, H. G., Brooks, S. D., Budke, C., Burkert-Kohn, M., Collier, K. N., Danielczok, A., Eppers, O., Felgitsch, L., Garimella, S., Grothe, H., Herenz, P., Hill, T. C. J., Höhler, K., Kanji, Z. A., Kiselev, A., Koop, T., Kristensen, T. B., Krüger, K., Kulkarni, G., Levin, E. J. T., Murray, B. J., Nicosia, A., O'Sullivan, D., Peckhaus, A., Polen, M. J., Price, H. C., Reicher, N., Rothenberg, D. A., Rudich, Y., Santachiara, G., Schiebel, T., Schrod, J., Seifried, T. M., Stratmann, F., Sullivan, R. C., Suski, K. J., Szakáll, M., Taylor, H. P., Ullrich, R., Vergara-Temprado, J., Wagner, R., Whale, T. F., Weber, D., Welti, A., Wilson, T. W., Wolf, M. J., and Zenker, J.: The Fifth International Workshop on Ice Nucleation phase 2 (FIN-02): laboratory intercomparison of ice nucleation measurements, Atmos. Meas. Tech., 11, 6231–6257, https://doi.org/10.5194/amt-11-6231-2018, 2018.
Di Biagio, C., Formenti, P., Balkanski, Y., Caponi, L., Cazaunau, M., Pangui, E., Journet, E., Nowak, S., Caquineau, S., Andreae, M. O., Kandler, K., Saeed, T., Piketh, S., Seibert, D., Williams, E., and Doussin, J.-F.: Global scale variability of the mineral dust long-wave refractive index: a new dataset of in situ measurements for climate modeling and remote sensing, Atmos. Chem. Phys., 17, 1901–1929, https://doi.org/10.5194/acp-17-1901-2017, 2017.
Dupart, Y., King, S. M., Nekat, B., Nowak, A., Wiedensohler, A., Herrmann, H., David, G., Thomas, B., Miffre, A., Rairoux, P., D'Anna, B., and George, C.: Mineral dust photochemistry induces nucleation events in the presence of SO2, P. Natl. Acad. Sci. USA, 409, 20842–20847, 2012.
Engelbrecht, J. P., Moosmüller, H., Pincock, S., Jayanty, R. K. M., Lersch, T., and Casuccio, G.: Technical note: Mineralogical, chemical, morphological, and optical interrelationships of mineral dust re-suspensions, Atmos. Chem. Phys., 16, 10809–10830, https://doi.org/10.5194/acp-16-10809-2016, 2016.
Formenti, P., Schütz, L., Balkanski, Y., Desboeufs, K., Ebert, M., Kandler, K., Petzold, A., Scheuvens, D., Weinbruch, S., and Zhang, D.: Recent progress in understanding physical and chemical properties of African and Asian mineral dust, Atmos. Chem. Phys., 11, 8231–8256, https://doi.org/10.5194/acp-11-8231-2011, 2011.
Frinak, E. K., Mashburn, C. D., Tolbert, M. A., and Toon, O. B.: Infrared characterization of water uptake by low-temperature Na-montmorillonite: Implications for Earth and Mars, J. Geophys. Res.-Atmos., 110, D09308, https://doi.org/10.1029/2004JD005647, 2005.
Garimella, S., Huang, Y.-W., Seewald, J. S., and Cziczo, D. J.: Cloud condensation nucleus activity comparison of dry- and wet-generated mineral dust aerosol: the significance of soluble material, Atmos. Chem. Phys., 14, 6003–6019, https://doi.org/10.5194/acp-14-6003-2014, 2014.
Ginoux, P., Prospero, J. M., Gill, T. E., Hsu, N. C., and Zhao, M.: Global-scale Attribution of Anthropogenic and Natural Dust Sources and Their Emission Rates Based on MODIS Deep Blue Aerosol Products, Rev. Geophys., 50, RG3005, https://doi.org/10.1029/2012RG000388, 2012.
Goodman, A. L., Bernard, E. T., and Grassian, V. H.: Spectroscopic Study of Nitric Acid and Water Adsorption on Oxide Particles: Enhanced Nitric Acid Uptake Kinetics in the Presence of Adsorbed Water, J. Phys. Chem. A, 105, 6443–6457, 2001.
Gu, W., Li, Y., Zhu, J., Jia, X., Lin, Q., Zhang, G., Ding, X., Song, W., Bi, X., Wang, X., and Tang, M.: Investigation of water adsorption and hygroscopicity of atmospherically relevant particles using a commercial vapor sorption analyzer, Atmos. Meas. Tech., 10, 3821–3832, https://doi.org/10.5194/amt-10-3821-2017, 2017.
Gustafsson, R. J., Orlov, A., Badger, C. L., Griffiths, P. T., Cox, R. A., and Lambert, R. M.: A comprehensive evaluation of water uptake on atmospherically relevant mineral surfaces: DRIFT spectroscopy, thermogravimetric analysis and aerosol growth measurements, Atmos. Chem. Phys., 5, 3415–3421, https://doi.org/10.5194/acp-5-3415-2005, 2005.
Hall, P. L. and Astill, D. M.: Adsorption of water by homoionic exchange forms of Wyoming Montmorillonite (SWy-1), Clay. Clay Miner., 37, 355–363, 1989.
Hatch, C. D., Gierlus, K. M., Schuttlefield, J. D., and Grassian, V. H.: Water adsorption and cloud condensation nuclei activity of calcite and calcite coated with model humic and fulvic acids, Atmos. Environ., 42, 5672–5684, 2008.
Hatch, C. D., Wiese, J. S., Crane, C. C., Harris, K. J., Kloss, H. G., and Baltrusaitis, J.: Water Adsorption on Clay Minerals As a Function of Relative Humidity: Application of BET and Freundlich Adsorption Models, Langmuir, 28, 1790–1803, 2011.
Hatch, C. D., Greenaway, A. L., Christie, M. J., and Baltrusaitis, J.: Water adsorption constrained Frenkel–Halsey–Hill adsorption activation theory: Montmorillonite and illite, Atmos. Environ., 87, 26–33, 2014.
Hatch, C. D., Tumminello, P. R., Cassingham, M. A., Greenaway, A. L., Meredith, R., and Christie, M. J.: Technical note: Frenkel, Halsey and Hill analysis of water on clay minerals: toward closure between cloud condensation nuclei activity and water adsorption, Atmos. Chem. Phys., 19, 13581–13589, https://doi.org/10.5194/acp-19-13581-2019, 2019.
He, H., Wang, Y., Ma, Q., Ma, J., Chu, B., Ji, D., Tang, G., Liu, C., Zhang, H., and Hao, J.: Mineral Dust and NOx Promote the Conversion of SO2 to Sulfate in Heavy Pollution Days, Sci. Rep., 4, 4172, https://doi.org/10.1038/srep06092, 2014.
Herich, H., Tritscher, T., Wiacek, A., Gysel, M., Weingartner, E., Lohmann, U., Baltensperger, U., and Cziczo, D. J.: Water uptake of clay and desert dust aerosol particles at sub- and supersaturated water vapor conditions, Phys. Chem. Chem. Phys., 11, 7804–7809, 2009.
Hiranuma, N., Augustin-Bauditz, S., Bingemer, H., Budke, C., Curtius, J., Danielczok, A., Diehl, K., Dreischmeier, K., Ebert, M., Frank, F., Hoffmann, N., Kandler, K., Kiselev, A., Koop, T., Leisner, T., Möhler, O., Nillius, B., Peckhaus, A., Rose, D., Weinbruch, S., Wex, H., Boose, Y., DeMott, P. J., Hader, J. D., Hill, T. C. J., Kanji, Z. A., Kulkarni, G., Levin, E. J. T., McCluskey, C. S., Murakami, M., Murray, B. J., Niedermeier, D., Petters, M. D., O'Sullivan, D., Saito, A., Schill, G. P., Tajiri, T., Tolbert, M. A., Welti, A., Whale, T. F., Wright, T. P., and Yamashita, K.: A comprehensive laboratory study on the immersion freezing behavior of illite NX particles: a comparison of 17 ice nucleation measurement techniques, Atmos. Chem. Phys., 15, 2489–2518, https://doi.org/10.5194/acp-15-2489-2015, 2015.
Huang, J. P., Wang, T. H., Wang, W. C., Li, Z. Q., and Yan, H. R.: Climate effects of dust aerosols over East Asian arid and semiarid regions, J. Geophys. Res.-Atmos., 119, 11398–11416, 2014.
Huneeus, N., Schulz, M., Balkanski, Y., Griesfeller, J., Prospero, J., Kinne, S., Bauer, S., Boucher, O., Chin, M., Dentener, F., Diehl, T., Easter, R., Fillmore, D., Ghan, S., Ginoux, P., Grini, A., Horowitz, L., Koch, D., Krol, M. C., Landing, W., Liu, X., Mahowald, N., Miller, R., Morcrette, J.-J., Myhre, G., Penner, J., Perlwitz, J., Stier, P., Takemura, T., and Zender, C. S.: Global dust model intercomparison in AeroCom phase I, Atmos. Chem. Phys., 11, 7781–7816, https://doi.org/10.5194/acp-11-7781-2011, 2011.
Hung, H. M., Wang, K. C., and Chen, J. P.: Adsorption of nitrogen and water vapor by insoluble particles and the implication on cloud condensation nuclei activity, J. Aerosol. Sci., 86, 24–31, 2015.
Ibrahim, S., Romanias, M. N., Alleman, L. Y., Zeineddine, M. N., Angeli, G. K., Trikalitis, P. N., and Thevenet, F.: Water Interaction with Mineral Dust Aerosol: Particle Size and Hygroscopic Properties of Dust, ACS Earth Space Chem., 2, 376–386, 2018.
Jickells, T. D., An, Z. S., Andersen, K. K., Baker, A. R., Bergametti, G., Brooks, N., Cao, J. J., Boyd, P. W., Duce, R. A., Hunter, K. A., Kawahata, H., Kubilay, N., laRoche, J., Liss, P. S., Mahowald, N., Prospero, J. M., Ridgwell, A. J., Tegen, I., and Torres, R.: Global Iron Connections between Desert Dust, Ocean Biogeochemistry, and Climate, Science, 308, 67–71, 2005.
Joshi, N., Romanias, M. N., Riffault, V., and Thevenet, F.: Investigating water adsorption onto natural mineral dust particles: Linking DRIFTS experiments and BET theory, Aeolian Res., 27, 35–45, 2017.
Journet, E., Balkanski, Y., and Harrison, S. P.: A new data set of soil mineralogy for dust-cycle modeling, Atmos. Chem. Phys., 14, 3801–3816, https://doi.org/10.5194/acp-14-3801-2014, 2014.
Karydis, V. A., Tsimpidi, A. P., Bacer, S., Pozzer, A., Nenes, A., and Lelieveld, J.: Global impact of mineral dust on cloud droplet number concentration, Atmos. Chem. Phys., 17, 5601–5621, https://doi.org/10.5194/acp-17-5601-2017, 2017.
Ketteler, G., Yamamoto, S., Bluhm, H., Andersson, K., Starr, D. E., Ogletree, D. F., Ogasawara, H., Nilsson, A., and Salmeron, M.: The Nature of Water Nucleation Sites on TiO2(110) Surfaces Revealed by Ambient Pressure X-ray Photoelectron Spectroscopy, J. Phys. Chem. C, 111, 8278–8282, 2007.
Knippertz, P. and Stuut, J. B. W.: Mineral Dust: A Key Player in the Earth System, Springer, Dordrecht, 2014.
Koehler, K. A., Kreidenweis, S. M., DeMott, P. J., Petters, M. D., Prenni, A. J., and Carrico, C. M.: Hygroscopicity and cloud droplet activation of mineral dust aerosol, Geophys. Res. Lett., 36, L08805, https://doi.org/10.01029/02009gl037348, 2009.
Kreidenweis, S. M. and Asa-Awuku, A.: 5.13 - Aerosol Hygroscopicity: Particle Water Content and Its Role in Atmospheric Processes, in: Treatise on Geochemistry (Second Edn.), edited by: Turekian, K. K., Elsevier, Oxford, 331–361, 2014.
Kumar, P., Sokolik, I. N., and Nenes, A.: Parameterization of cloud droplet formation for global and regional models: including adsorption activation from insoluble CCN, Atmos. Chem. Phys., 9, 2517–2532, https://doi.org/10.5194/acp-9-2517-2009, 2009.
Kumar, P., Sokolik, I. N., and Nenes, A.: Cloud condensation nuclei activity and droplet activation kinetics of wet processed regional dust samples and minerals, Atmos. Chem. Phys., 11, 8661–8676, https://doi.org/10.5194/acp-11-8661-2011, 2011a.
Kumar, P., Sokolik, I. N., and Nenes, A.: Measurements of cloud condensation nuclei activity and droplet activation kinetics of fresh unprocessed regional dust samples and minerals, Atmos. Chem. Phys., 11, 3527–3541, https://doi.org/10.5194/acp-11-3527-2011, 2011b.
Laaksonen, A., Malila, J., Nenes, A., Hung, H. M., and Chen, J. P.: Surface fractal dimension, water adsorption efficiency, and cloud nucleation activity of insoluble aerosol, Sci. Rep., 6, 25504, https://doi.org/10.1038/srep25504, 2016.
Lasne, J., Romanias, M. N., and Thevenet, F.: Ozone Uptake by Clay Dusts under Environmental Conditions, ACS Earth Space Chem., 2, 904–914, 2018.
Li, R., Jia, X. H., Wang, F., Ren, Y., Wang, X., Zhang, H. H., Li, G. H., Wang, X. M., and Tang, M. J.: Heterogeneous reaction of NO2 with hematite, goethite and magnetite: Implications for nitrate formation and iron solubility enhancement, Chemosphere, 242, 125273, https://doi.org/10.1016/j.chemosphere.2019.125273, 2020.
Li, W. J., Xu, L., Liu, X. H., Zhang, J. C., Lin, Y. T., Yao, X. H., Gao, H. W., Zhang, D. Z., Chen, J. M., Wang, W. X., Harrison, R. M., Zhang, X. Y., Shao, L. Y., Fu, P. Q., Nenes, A., and Shi, Z. B.: Air pollution–aerosol interactions produce more bioavailable iron for ocean ecosystems, Sci. Adv., 3, e1601749, https://doi.org/10.1126/sciadv.1601749, 2017.
Ma, Q. X., He, H., and Liu, Y. C.: In Situ DRIFTS Study of Hygroscopic Behavior of Mineral Aerosol, J. Environ. Sci., 22, 555–560, 2010a.
Ma, Q. X., Liu, Y. C., and He, H.: The Utilization of Physisorption Analyzer for Studying the Hygroscopic Properties of Atmospheric Relevant Particles, J. Phys. Chem. A, 114, 4232–4237, 2010b.
Ma, Q. X., Liu, Y. C., Liu, C., and He, H.: Heterogeneous Reaction of Acetic Acid on MgO, α-Al2O3, and CaCO3 and the Effect on the Hygroscopic Behavior of These Particles, Phys. Chem. Chem. Phys., 14, 8403–8409, 2012a.
Ma, Q. X., Liu, Y. C., Liu, C., Ma, J. Z., and He, H.: A case study of Asian dust storm particles: Chemical composition, reactivity to SO2 and hygroscopic properties, J. Environ. Sci., 24, 62–71, 2012b.
Meskhidze, N., Volker, C., Al-Abadleh, H. A., Barbeau, K., Bressac, M., Buck, C., Bundy, R. M., Croot, P., Feng, Y., Ito, A., Johansen, A. M., Landing, W. M., Mao, J. Q., Myriokefalitakis, S., Ohnemus, D., Pasquier, B., and Ye, Y.: Perspective on identifying and characterizing the processes controlling iron speciation and residence time at the atmosphere-ocean interface, Mar. Chem., 217, 103704, https://doi.org/10.1016/j.marchem.2019.103704, 2019.
Mitroo, D., Gill, T. E., Haas, S., Pratt, K. A., and Gaston, C. J.: ClNO2 production from N2O5 uptake on saline playa dusts: New insights into potential inland sources of ClNO2, Environ. Sci. Technol., 13, 7442–7452, 2019.
Navea, J. G., Chen, H. H., Huang, M., Carmichael, G. R., and Grassian, V. H.: A comparative evaluation of water uptake on several mineral dust sources, Environ. Chem., 7, 162–170, 2010.
Nickovic, S., Vukovic, A., Vujadinovic, M., Djurdjevic, V., and Pejanovic, G.: Technical Note: High-resolution mineralogical database of dust-productive soils for atmospheric dust modeling, Atmos. Chem. Phys., 12, 845–855, https://doi.org/10.5194/acp-12-845-2012, 2012.
Okin, G. S., Baker, A. R., Tegen, I., Mahowald, N. M., Dentener, F. J., Duce, R. A., Galloway, J. N., Hunter, K., Kanakidou, M., Kubilay, N., Prospero, J. M., Sarin, M., Surapipith, V., Uematsu, M., and Zhu, T.: Impacts of atmospheric nutrient deposition on marine productivity: Roles of nitrogen, phosphorus, and iron, Global Biogeochem. Cy., 25, GB2022, https://doi.org/10.1029/2010GB003858, 2011.
Rubasinghege, G. and Grassian, V. H.: Role(s) of Adsorbed Water in the Surface Chemistry of Environmental Interfaces, Chem. Commun., 49, 3071–3094, 2013.
Scanza, R. A., Mahowald, N., Ghan, S., Zender, C. S., Kok, J. F., Liu, X., Zhang, Y., and Albani, S.: Modeling dust as component minerals in the Community Atmosphere Model: development of framework and impact on radiative forcing, Atmos. Chem. Phys., 15, 537–561, https://doi.org/10.5194/acp-15-537-2015, 2015.
Schulz, M., Prospero, J. M., Baker, A. R., Dentener, F., Ickes, L., Liss, P. S., Mahowald, N. M., Nickovic, S., García-Pando, C. P., Rodríguez, S., Sarin, M., Tegen, I., and Duce, R. A.: Atmospheric Transport and Deposition of Mineral Dust to the Ocean: Implications for Research Needs, Environ. Sci. Technol., 46, 10390–10404, 2012.
Schuttlefield, J. D.: Laboratory Studies of Reactions of Atmospheric Gases with Components of Mineral Dust Aerosol and Research in Chemical Education, PhD, University of Iowa, 2008.
Schuttlefield, J. D., Al-Hosney, H., Zachariah, A., and Grassian, V. H.: Attenuated Total Reflection Fourier Transform Infrared Spectroscopy to Investigate Water Uptake and Phase Transitions in Atmospherically Relevant Particles, Appl. Spectrosc., 61, 283–292, 2007a.
Schuttlefield, J. D., Cox, D., and Grassian, V. H.: An investigation of water uptake on clays minerals using ATR-FTIR spectroscopy coupled with quartz crystal microbalance measurements, J. Geophys. Res.-Atmos., 112, D21303, https://doi.org/10.1029/2007JD008973, 2007b.
Sorjamaa, R. and Laaksonen, A.: The effect of H2O adsorption on cloud drop activation of insoluble particles: a theoretical framework, Atmos. Chem. Phys., 7, 6175–6180, https://doi.org/10.5194/acp-7-6175-2007, 2007.
Sullivan, R. C., Minambres, L., DeMott, P. J., Prenni, A. J., Carrico, C. M., Levin, E. J. T., and Kreidenweis, S. M.: Chemical processing does not always impair heterogeneous ice nucleation of mineral dust particles, Geophys. Res. Lett., 37, L24805, https://doi.org/10.1029/2010GL045540, 2010a.
Sullivan, R. C., Moore, M. J. K., Petters, M. D., Kreidenweis, S. M., Qafoku, O., Laskin, A., Roberts, G. C., and Prather, K. A.: Impact of Particle Generation Method on the Apparent Hygroscopicity of Insoluble Mineral Particles, Aerosol Sci. Tech., 44, 830–846, 2010b.
Tagliabue, A., Bowie, A. R., Boyd, P. W., Buck, K. N., Johnson, K. S., and Saito, M. A.: The integral role of iron in ocean biogeochemistry, Nature, 543, 51–59, 2017.
Tang, M. J., Thieser, J., Schuster, G., and Crowley, J. N.: Kinetics and Mechanism of the Heterogeneous Reaction of N2O5 with Mineral Dust Particles, Phys. Chem. Chem. Phys., 14, 8551–8561, 2012.
Tang, M. J., Schuster, G., and Crowley, J. N.: Heterogeneous reaction of N2O5 with illite and Arizona test dust particles, Atmos. Chem. Phys., 14, 245–254, https://doi.org/10.5194/acp-14-245-2014, 2014.
Tang, M. J., Cziczo, D. J., and Grassian, V. H.: Interactions of Water with Mineral Dust Aerosol: Water Adsorption, Hygroscopicity, Cloud Condensation and Ice Nucleation, Chem. Rev., 116, 4205–4259, 2016.
Tang, M., Huang, X., Lu, K., Ge, M., Li, Y., Cheng, P., Zhu, T., Ding, A., Zhang, Y., Gligorovski, S., Song, W., Ding, X., Bi, X., and Wang, X.: Heterogeneous reactions of mineral dust aerosol: implications for tropospheric oxidation capacity, Atmos. Chem. Phys., 17, 11727–11777, https://doi.org/10.5194/acp-17-11727-2017, 2017.
Tang, M., Chan, C. K., Li, Y. J., Su, H., Ma, Q., Wu, Z., Zhang, G., Wang, Z., Ge, M., Hu, M., He, H., and Wang, X.: A review of experimental techniques for aerosol hygroscopicity studies, Atmos. Chem. Phys., 19, 12631–12686, https://doi.org/10.5194/acp-19-12631-2019, 2019a.
Tang, M., Gu, W., Ma, Q., Li, Y. J., Zhong, C., Li, S., Yin, X., Huang, R.-J., He, H., and Wang, X.: Water adsorption and hygroscopic growth of six anemophilous pollen species: the effect of temperature, Atmos. Chem. Phys., 19, 2247–2258, https://doi.org/10.5194/acp-19-2247-2019, 2019b.
Tang, M., Zhang, H. H., Gu, W. J., Gao, J., Jian, X., Shi, G. L., Zhu, B. Q., Xie, L. H., Guo, L. Y., Gao, X. Y., Wang, Z., Zhang, G. H., and Wang, X. M.: Hygroscopic Properties of Saline Mineral Dust From Different Regions in China: Geographical Variations, Compositional Dependence, and Atmospheric Implications, J. Geophys. Res.-Atmos, 124, 10844–10857, 2019c.
Textor, C., Schulz, M., Guibert, S., Kinne, S., Balkanski, Y., Bauer, S., Berntsen, T., Berglen, T., Boucher, O., Chin, M., Dentener, F., Diehl, T., Easter, R., Feichter, H., Fillmore, D., Ghan, S., Ginoux, P., Gong, S., Grini, A., Hendricks, J., Horowitz, L., Huang, P., Isaksen, I., Iversen, I., Kloster, S., Koch, D., Kirkevåg, A., Kristjansson, J. E., Krol, M., Lauer, A., Lamarque, J. F., Liu, X., Montanaro, V., Myhre, G., Penner, J., Pitari, G., Reddy, S., Seland, Ø., Stier, P., Takemura, T., and Tie, X.: Analysis and quantification of the diversities of aerosol life cycles within AeroCom, Atmos. Chem. Phys., 6, 1777–1813, https://doi.org/10.5194/acp-6-1777-2006, 2006.
Usher, C. R., Michel, A. E., and Grassian, V. H.: Reactions on Mineral Dust, Chem. Rev., 103, 4883–4939, 2003.
Vlasenko, A., Sjogren, S., Weingartner, E., Gaggeler, H. W., and Ammann, M.: Generation of submicron Arizona test dust aerosol: Chemical and hygroscopic properties, Aerosol Sci. Tech., 39, 452–460, 2005.
Vlasenko, A., Huthwelker, T., Gaggeler, H. W., and Ammann, M.: Kinetics of the heterogeneous reaction of nitric acid with mineral dust particles: an aerosol flow tube study, Phys. Chem. Chem. Phys., 11, 7921–7930, 2009.
Wang, T., Liu, Y., Deng, Y., Fu, H., Zhang, L., and Chen, J.: Adsorption of SO2 on mineral dust particles influenced by atmospheric moisture, Atmos. Environ., 191, 153–161, 2018.
Xu, W. Z., Johnston, C. T., Parker, P., and Agnew, S. F.: Infrared study of water sorption on Na-, Li-, Ca-, and Mg-exchanged (SWy-1 and SAz-1) montmorillonite, Clay Clay Miner., 48, 120–131, 2000.
Yeşilbaş, M. and Boily, J.-F.: Particle Size Controls on Water Adsorption and Condensation Regimes at Mineral Surfaces, Sci. Rep., 6, 32136, https://doi.org/10.1038/srep32136, 2016.
Yu, Z. and Jang, M.: Simulation of heterogeneous photooxidation of SO2 and NOx in the presence of Gobi Desert dust particles under ambient sunlight, Atmos. Chem. Phys., 18, 14609–14622, https://doi.org/10.5194/acp-18-14609-2018, 2018.
Yu, Z. and Jang, M.: Atmospheric Processes of Aromatic Hydrocarbons in the Presence of Mineral Dust Particles in an Urban Environment, ACS Earth Space Chem., 3, 2404–2414, 2019.
Zent, A. P., Howard, D. J., and Quinn, R. C.: H2O adsorption on smectites: Application to the diurnal variation of H2O in the Martian atmosphere, J. Geophys. Res.-Planet., 106, 14667–14674, 2001.