the Creative Commons Attribution 4.0 License.
the Creative Commons Attribution 4.0 License.
 | 13 Nov 2020
A complex aerosol transport event over Europe during the 2017 Storm Ophelia in CAMS forecast systems: analysis and evaluation
Eleni Katragkou
Aristeidis K. Georgoulias
Prodromos Zanis
Stergios Kartsios
Johannes Flemming
Antje Inness
John Douros
Henk Eskes
In mid-October 2017 Storm Ophelia crossed over western coastal Europe, inducing the combined transport of Saharan dust and Iberian biomass burning aerosols over several European areas. In this study we assess the performance of the Copernicus Atmosphere Monitoring Service (CAMS) forecast systems during this complex aerosol transport event and the potential benefits that data assimilation and regional models could bring. To this end, CAMS global and regional forecast data are analysed and compared against observations from passive (MODIS: Moderate Resolution Imaging Spectroradiometer aboard Terra and Aqua) and active (CALIOP/CALIPSO: Cloud-Aerosol LIdar with Orthogonal Polarization aboard Cloud-Aerosol Lidar and Infrared Pathfinder Satellite Observations) satellite sensors and ground-based measurements (EMEP: European Monitoring and Evaluation Programme). The analysis of the CAMS global forecast indicates that dust and smoke aerosols, discretely located on the warm and cold fronts of Ophelia, respectively, were affecting the aerosol atmospheric composition over Europe during the passage of the Storm. The observed MODIS aerosol optical depth (AOD) values are satisfactorily reproduced by the CAMS global forecast system, with a correlation coefficient of 0.77 and a fractional gross error (FGE) of 0.4. The comparison with a CAMS global control simulation not including data assimilation indicates a significant improvement in the bias due to data assimilation implementation, as the FGE decreases by 32 %. The qualitative evaluation of the IFS (Integrated Forecast System) dominant-aerosol type and location against the CALIPSO observations overall reveals a good agreement. Regarding the footprint on air quality, both CAMS global and regional forecast systems are generally able to reproduce the observed signal of increase in surface particulate matter concentrations. The regional component performs better in terms of bias and temporal variability, with the correlation deteriorating over forecast time. Yet, both products exhibit inconsistencies on the quantitative and temporal representation of the observed surface particulate matter enhancements, stressing the need for further development of the air quality forecast systems for even more accurate and timely support of citizens and policy-makers.
- Article
(30681 KB) - Full-text XML
-
Supplement
(25912 KB) - BibTeX
- EndNote


Atmospheric aerosols play a prominent role in atmospheric composition, climate and human health (Pöschl, 2005; IPCC, 2013). Given the broad variety of their natural and anthropogenic sources, their relatively short lifetime, and their different formation mechanisms, aerosols exhibit highly variable spatio-temporal distributions around the globe (Putaud et al., 2010; Boucher, 2015). Over Europe, apart from local emissions, particulate matter quantities are also determined by atmospheric transport through mesoscale weather systems (Ansmann et al., 2003; Kallos et al., 2007; Pey et al., 2013), occasionally implying significant implications for air quality and public health (Stafoggia et al., 2016). Consequently, the operational forecast of atmospheric composition is essential in the direction of supporting social and health policy-makers.
Aerosols interact with solar radiation directly through scattering and absorption (Haywood and Boucher, 2000) and indirectly by modifying the micro- and macro-physical properties of clouds (Lohmann and Feichter, 2005), modulating the energy balance in the Earth–atmosphere system and, by extension, the climate. More specifically, they may act as cloud condensation nuclei (CCN) and ice nuclei (IN), increasing the cloud albedo under constant water paths (Twomey, 1974), as well as cloud lifetime and coverage, and suppressing precipitation formation (Albrecht, 1989). In addition, the presence of absorbing aerosols alters the thermodynamic state of the atmosphere (semi-direct effect), affecting clouds and precipitation in various ways (Koch and Del Genio, 2010).
Exposure to particulate matter air pollution is well known to have significant implications for respiratory- and cardiovascular-based mortality (Russell and Brunekreef, 2009; Lelieveld et al., 2015; Burnett et al., 2018). Fine particulate matter with a diameter less than 2.5 µm (PM2.5) has more profound effects on human health compared to coarse particulate matter with a diameter less than 10 µm (PM10), as smaller particles can penetrate more efficiently into the lungs and indoor environments, and they can also be transported over greater distances given their smaller mass and therefore their longer lifetime (Pope and Dockery, 2006). Recently, Lelieveld et al. (2019) based on new hazard ratio functions and ambient air pollution exposure data estimated that air pollution reduces the mean life expectancy by more than 2 years in Europe. Moreover, aerosols can pose significant hazards for aviation, occasionally resulting in flight delays and cancellations, as intense episodic dust and sea salt events can alter visibility (Gertisser, 2010; Tighe, 2015), while the presence of dust and volcanic particles may potentially cause aircraft engine damage (Gertisser, 2010). The impact of aerosols on photovoltaic generation is mainly due to reduction of surface solar radiation through scattering and absorption (Li et al., 2017) and deposition of dust on solar panels, reducing their energy production potential (Beattie et al., 2012).
North African dust is the dominant source of mineral dust in the atmosphere (Ginoux et al., 2012), affecting the air quality of Europe from the Mediterranean (Querol et al., 2009; Georgoulias et al., 2016) up to Scandinavia (Ansmann et al., 2003). The main transport pathways of Saharan dust towards Europe are either passing through the Mediterranean by northward flow associated with the presence of cyclones (anticyclones) westward (eastward) of a Saharan dust source or via the Atlantic route including a westward transport of Saharan dust by trade winds over the Atlantic followed by northward and then eastward flow towards Europe (Israelevich et al., 2012). Over Europe, biomass burning emissions from wildfires are a present air pollution risk, likely to increase in a changing climate (Knorr et al., 2017; Turco et al., 2017). The regional-scale (Amiridis et al., 2009) and intercontinental (Markowicz et al., 2016) transport of smoke over Europe may affect the atmospheric composition and the local air quality (Sciare et al., 2008).
During recent years various global and regional integrated forecast systems incorporating online coupling between meteorology and atmospheric composition have been developed to support research, forecast and policy activities (Baklanov et al., 2014). Copernicus (Copernicus, 2020) is the European system for monitoring Earth coordinated by the European Union. The Copernicus Atmosphere Monitoring Service (CAMS) (CAMS, 2020a) is one of the six services that Copernicus provides, using a comprehensive global assimilation and forecasting system to assess the state and composition of the atmosphere on a daily basis. It incorporates information from models and observations, providing daily 5 d forecasts of atmospheric composition fields, such as chemically reactive gases and aerosols (Flemming et al., 2015; Inness et al., 2015). The CAMS global modelling system is also used to provide the boundary conditions for the CAMS ensemble of regional air quality models, which produce 4 d forecasts of European air quality at higher horizontal resolution. To increase confidence of operational use, unravel limitations and further improve the CAMS forecast systems, analysis and evaluation of its performance during complex and challenging situations is deemed necessary.
On the morning of 16 October 2017 a red sky phenomenon was reported at several sites of the United Kingdom (UK) (Telegraph, 2017), as a result of the high aerosol loadings in the overlying atmosphere (Harrison et al., 2018; Osborne et al., 2019), while similar reports on the morning of 17 October were given for the Netherlands as well (NLTIMES, 2017). These high aerosol loadings were the result of transport of desert dust from northern Africa and smoke from Iberian wildfires. This study aims to analyse and evaluate the performance of CAMS global and regional forecast systems during this challenging combined dust and biomass burning transport event over western Europe induced by the passage of Storm Ophelia in mid-October 2017. To this end, CAMS global and regional day-1 forecast data are used, along with ground-based observations (EMEP: European Monitoring and Evaluation Programme), and observations from passive (MODIS: Moderate Resolution Imaging Spectroradiometer aboard Terra and Aqua) and active (CALIOP/CALIPSO: Cloud-Aerosol LIdar with Orthogonal Polarization/Cloud-Aerosol Lidar and Infrared Pathfinder Satellite Observations) satellite remote sensors. Furthermore, the impact of data assimilation on the CAMS global aerosol burden representation is also explored using a control simulation without the use of data assimilation. Finally, to explore the forecast capability over time, CAMS global and regional day-2 and day-3 forecasts of PM10 and PM2.5 concentrations are also analysed. This paper builds upon the work of Akritidis et al. (2018), assessing the performance of CAMS forecast products, the potential benefits of data assimilation in the CAMS global system and the added value that CAMS regional models could bring during a complex aerosol transport event. The structure of the paper is as follows. Section 2 presents the CAMS forecast systems and the observational data that are used to validate their performance. Section 3 shows the analysis and evaluation results, and Sect. 4 summarizes the key findings.
2.1 CAMS global forecast system
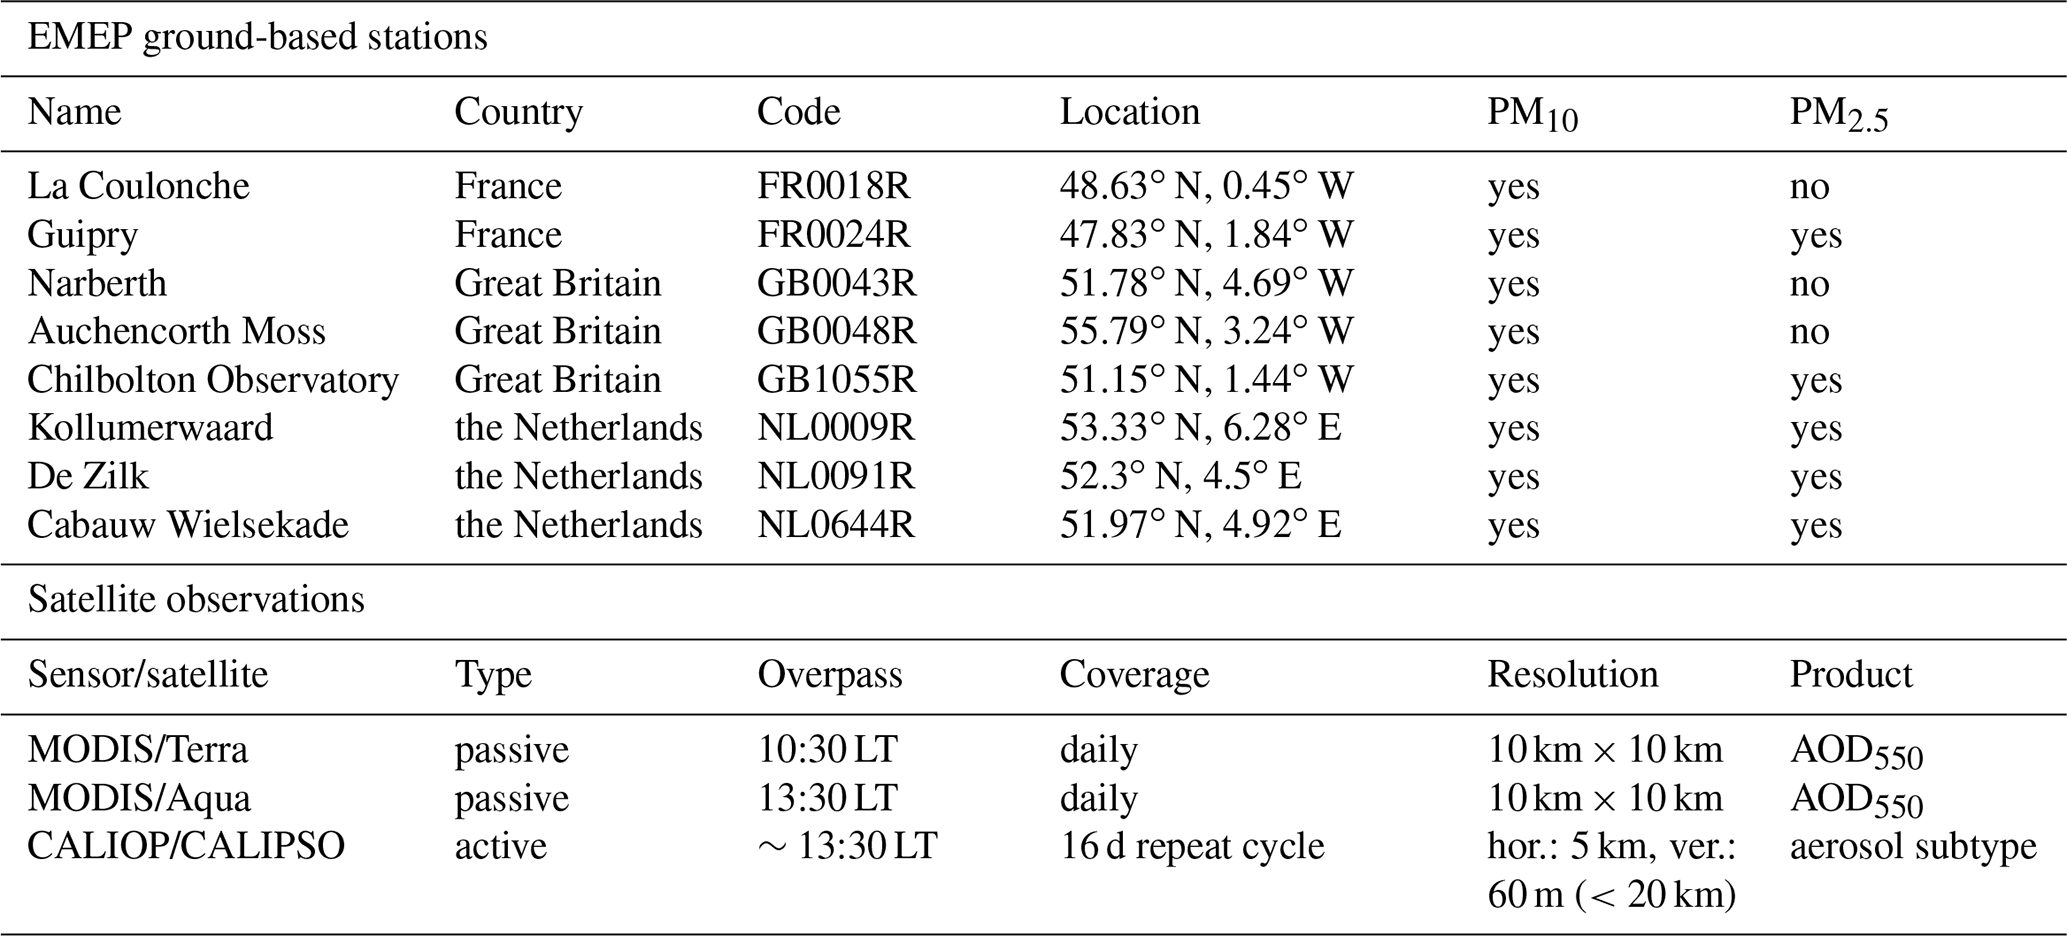
One of the core CAMS products is the 5 d global chemical weather forecast, based on the European Centre for Medium-Range Weather Forecasts (ECMWF) Integrated Forecasting System (IFS). In October 2017, the forecast data were products of the IFS model cycle 43r3, having a horizontal resolution of about 40 km and 60 vertical levels reaching up to 0.1 hPa. The IFS modelling system uses an extended version of the Carbon Bond 2005 (CB05) chemical mechanism (Flemming et al., 2015) and the Morcrette et al. (2009) aerosol parameterization. Several chemical species, including ozone, nitrogen dioxide, carbon monoxide and sulfur dioxide, are assimilated using products of several satellite missions (Inness et al., 2015, 2019b, and references therein). Moreover, the IFS assimilates total aerosol optical depth (AOD) retrievals from the MODIS instrument on NASA's Aqua and Terra satellites, as well as PMAp (Polar Multi-Sensor Aerosol product) aerosol retrievals over sea, a combined GOME-2/AVHRR product produced by EUMETSAT (EUMETSAT, 2020), and subsequently updates the individual aerosol components based on their fractional contribution to the total aerosol mass (Benedetti et al., 2009; Georgoulias et al., 2018). Five types of aerosols are included, namely sea salt, dust, hydrophilic and hydrophobic organic matter and black carbon, and sulfate. The first and second aerosol types are provided in three radius size bins: 0.03–0.5, 0.5–5 and 5–20 µm and 0.03–0.55, 0.55–0.9 and 0.9–20 µm, respectively. The different IFS aerosol types are treated as externally mixed (Inness et al., 2019a).
Here we use IFS day-1 (referred here as IFS) forecasts (initiated at 00:00 Z) of temperature, mean sea level pressure (mslp), omega vertical velocity, divergence, u and v wind components, mass mixing ratio of 11 aerosol variables, total AOD at 550 nm (AOD550 or just AOD), sea salt AOD, dust AOD, organic matter AOD, black carbon AOD, sulfate AOD, and carbon monoxide (CO) mass mixing ratio. Also used are day-1 to day-3 forecast data of PM10 and PM2.5 surface concentrations, which are derived according to the following formula:
where ρ is the air density, SS1 is the sea salt radius size bin 1 (0.03–0.5 µm), SS2 is the sea salt radius size bin 2 (0.5–5 µm), DD1 is the desert dust radius size bin 1 (0.03–0.55 µm), DD2 is the desert dust radius size bin 2 (0.55–0.9 µm), DD3 is the desert dust radius size bin 3 (0.9–20 µm), OM1 is the hydrophobic organic matter, OM2 is the hydrophilic organic matter, BC1 is the hydrophobic black carbon, BC2 is the hydrophilic black carbon and SU1 is the aerosol sulfate (ECMWF, 2020a). A detailed description and evaluation of the aerosol scheme used in IFS can be found in Rémy et al. (2019). To unravel the impact of chemical data assimilation on aerosol burden representation during the examined event, an additional IFS control run without data assimilation (no DA) is also used for intercomparison.
2.2 CAMS regional forecast system
The CAMS regional forecast system provides the ensemble median (RegEns) and members of the European-scale air quality forecasts for every hour up to 4 d in advance. The products have a 0.1∘ horizontal resolution and are based on state-of-the-art numerical air quality models developed in Europe: CHIMERE from INERIS (National Institute for Industrial Environment and Risks) (Menut et al., 2013), DEHM from Aarhus University (Christensen, 1997), EMEP from MET-Norway (Simpson et al., 2012), EURAD-IM from the University of Cologne (Memmesheimer et al., 2004), GEM-AQ from IEP-NRI (Institute of Environmental Protection – National Research Institute, Polish Ministry of Environment) (Kaminski et al., 2008), LOTOS-EUROS from KNMI (Royal Netherlands Meteorological Institute) and TNO (Netherlands Organisation for Applied Scientific Research) (Manders et al., 2017), MATCH from SMHI (Swedish Meteorological and Hydrological Institute) (Robertson et al., 1999), MOCAGE from Météo-France (Guth et al., 2016), and SILAM from FMI (Finnish Meteorological Institute) (Sofiev et al., 2015). More details on the regional air quality systems can be found in CAMS (2020c). The global ECMWF IFS forecasts provide the meteorological and chemical boundary forcing to the regional model suite, and CAMS provides the emissions. Several CAMS regional models assimilate PM10 and PM2.5 surface observations from various stations of the EEA's (European Environment Agency) Air Quality e-Reporting database but not satellite aerosol products. More specifically, during the period of interest (October 2017), CHIMERE and EURAD were assimilating both PM10 and PM2.5, MOCAGE only PM10, and (finally) SILAM and MATCH were assimilating only PM2.5; PM10 and PM2.5 concentrations in the regional models are calculated using simulated aerosol fields specific to each regional model. All models are validated operationally (CAMS, 2020b) and in an posteriori way (CAMS, 2020a), and operational verification results are available daily for six chemical species (ozone, nitrogen dioxide, sulfur dioxide, carbon monoxide, PM10 and PM2.5). It has to be noted that for the examined period (October 2017) the DEHM and GEM-AQ models were not included in RegEns, as they were recently added in the CAMS regional forecast system. RegEns day-1 (referred here as RegEns), day-2 and day-3 forecast data (initiated at 00:00 Z) of PM10 and PM2.5 surface concentrations are used to analyse and evaluate the performance of the CAMS regional forecast system during the examined event.
2.3 Validation data
To evaluate the CAMS forecast systems ability to capture the spatial and temporal distribution of aerosols in the atmosphere, AOD550 data from the two MODIS sensors aboard EOS (Earth Observing System) Terra (Equator crossing time of 10:30 LT, local time) and Aqua (Equator crossing time of 13:30 LT) satellites are used along with aerosol subtype data from CALIOP/CALIPSO (Equator crossing time of ∼ 13:30 LT). MODIS is a 36-band imaging radiometer with a viewing swath of 2330 km, offering almost daily global coverage (Salomonson et al., 1989). In this work, level-2 data with a resolution of 10×10 km2 at nadir from the MODIS Collection 6.1 combined Dark Target algorithm (DT) and Deep Blue algorithm (DB) scientific dataset AOD_550_Dark_Target_Deep_Blue_Combined are processed. There are two different DT algorithms: one for retrievals over land (Kaufman et al., 1997; Remer et al., 2005; Levy et al., 2013) and one for water surfaces (Tanré et al., 1997; Remer et al., 2005; Levy et al., 2013), while DB currently delivers retrievals over all land types (Hsu et al., 2013; Sayer et al., 2013, 2014, 2015) despite the fact that it was originally developed for bright land surfaces only (Hsu et al., 2004). For the quantitative evaluation of the CAMS forecasts, the MODIS Terra and Aqua data were merged and brought to the CAMS native grid.
CALIOP is a spaceborne lidar instrument (Hunt et al., 2009) providing profiles of aerosol and cloud-related properties (Winker et al., 2009) within the first 30 km of the atmosphere by measuring the backscatter signals and the polarization of the backscattered light. The CALIPSO algorithm identifies distinct atmospheric layers (clean air, aerosols, clouds, surface, etc.) (Vaughan et al., 2009; Kim et al., 2018) and attributes a specific aerosol subtype (marine, dust, polluted continental/smoke, clean continental, polluted dust, elevated smoke, dusty marine, polar stratospheric cloud aerosols, volcanic ash, sulfate/other) to each of them (Omar et al., 2009). In this work, data from the CALIOP/CALIPSO version 4.20 level-2 product (Kim et al., 2018) with a horizontal resolution of 5 km and a vertical resolution of 60 m (for heights below ∼20 km) are processed.
To assess the CAMS forecast system's performance in reproducing the impacts on air quality during the Ophelia passage, ground-based observations are used. Measurements of PM10 and PM2.5 surface concentrations from eight rural background stations (see Table 1 for details) are obtained from the EMEP (Tørseth et al., 2012) network through the EBAS database (EBAS, 2020) for the time period from 10 to 20 October 2017. The stations are located over western Europe, are away from the dust and biomass burning sources, and lie across the plumes of high AOD loadings, exhibiting significant increases in PM10 and PM2.5 surface concentrations during the examined event. Data are provided with 1 h temporal resolution, yet a 3 h resolution is used for direct comparison with the IFS data. It has to be noted that from the examined stations only GB0043R and GB0048R for PM10 and GB0048R for PM2.5 are listed as assimilation stations for the CAMS regional models.
2.4 Statistical metrics
To evaluate the performance of CAMS forecast systems with respect to observational data, the following statistical metrics are used.
- a.
The temporal correlation of CAMS models with observations is assessed with the Pearson correlation coefficient (R) that measures the strength of their linear association, ranging between +1 and −1:
where Mi and Oi are the modelled and observed values, respectively, and N is the size of the sample.
- b.
The model error is estimated using the fractional gross error (FGE), which ranges between 0 and 2, and behaves symmetrically with respect to under- and overestimation:
where Mi and Oi are the modelled and observed values, respectively, and N is the size of the sample.
3.1 Storm Ophelia and transport pathways
Hurricane Ophelia occurring in October 2017 was an exceptional low-pressure system, as it had unique characteristics as an Atlantic hurricane; it caused the death of three people and extended damages during its passage over Ireland (BBC, 2017), and it indirectly affected the air quality and the atmospheric composition over several western European areas. Ophelia initiated as a nontropical low-pressure system over the Atlantic at the southwest of the Azores in early October 2017, and it did not have the same fate as that of common Atlantic tropical storms that head to the west (Stewart, 2018). Instead, Ophelia marched northeastwards, initially reaching coastal Portugal, and subsequently lost its tropical characteristics, downgrading to an extratropical cyclone (ex-hurricane); it followed a northern path towards Great Britain, becoming the easternmost major Atlantic hurricane ever recorded (Stewart, 2018). The aforementioned route of Ophelia resulted from the guidance of an upper-level trough located over the Atlantic (Stewart, 2018; Rantanen et al., 2020). Figure 1 presents the prevailing synoptic conditions in the middle troposphere (500 hPa), as seen from IFS, during the period from 12:00 Z on 14 October 2017 to 00:00 Z on 16 October 2017. A mid-latitude trough dominates over the central Atlantic, with the surface low-pressure system located ahead of the trough and to the east of it, being driven from the northeasterly-oriented wind flow (Fig. 1a and b). At 12:00 Z on 15 October and as the trough axis turns negatively tilted the flow becomes mostly southerly (Fig. 1c) dragging Ophelia towards Ireland (Fig. 1d). Although after 12:00 Z on 14 October Ophelia moved over sea surface temperatures (SSTs) of about 25 ∘C, which in general do not support hurricane intensification (Stewart, 2018); the alternative fuel for Ophelia to maintain its strength was found in the enhanced upper-level divergence on the eastern flank of the trough (not shown). This resulted in convection reinforcement, as revealed from the enhanced upward vertical velocity values at 500 hPa exceeding 2 Pa∕s (Fig. 1).
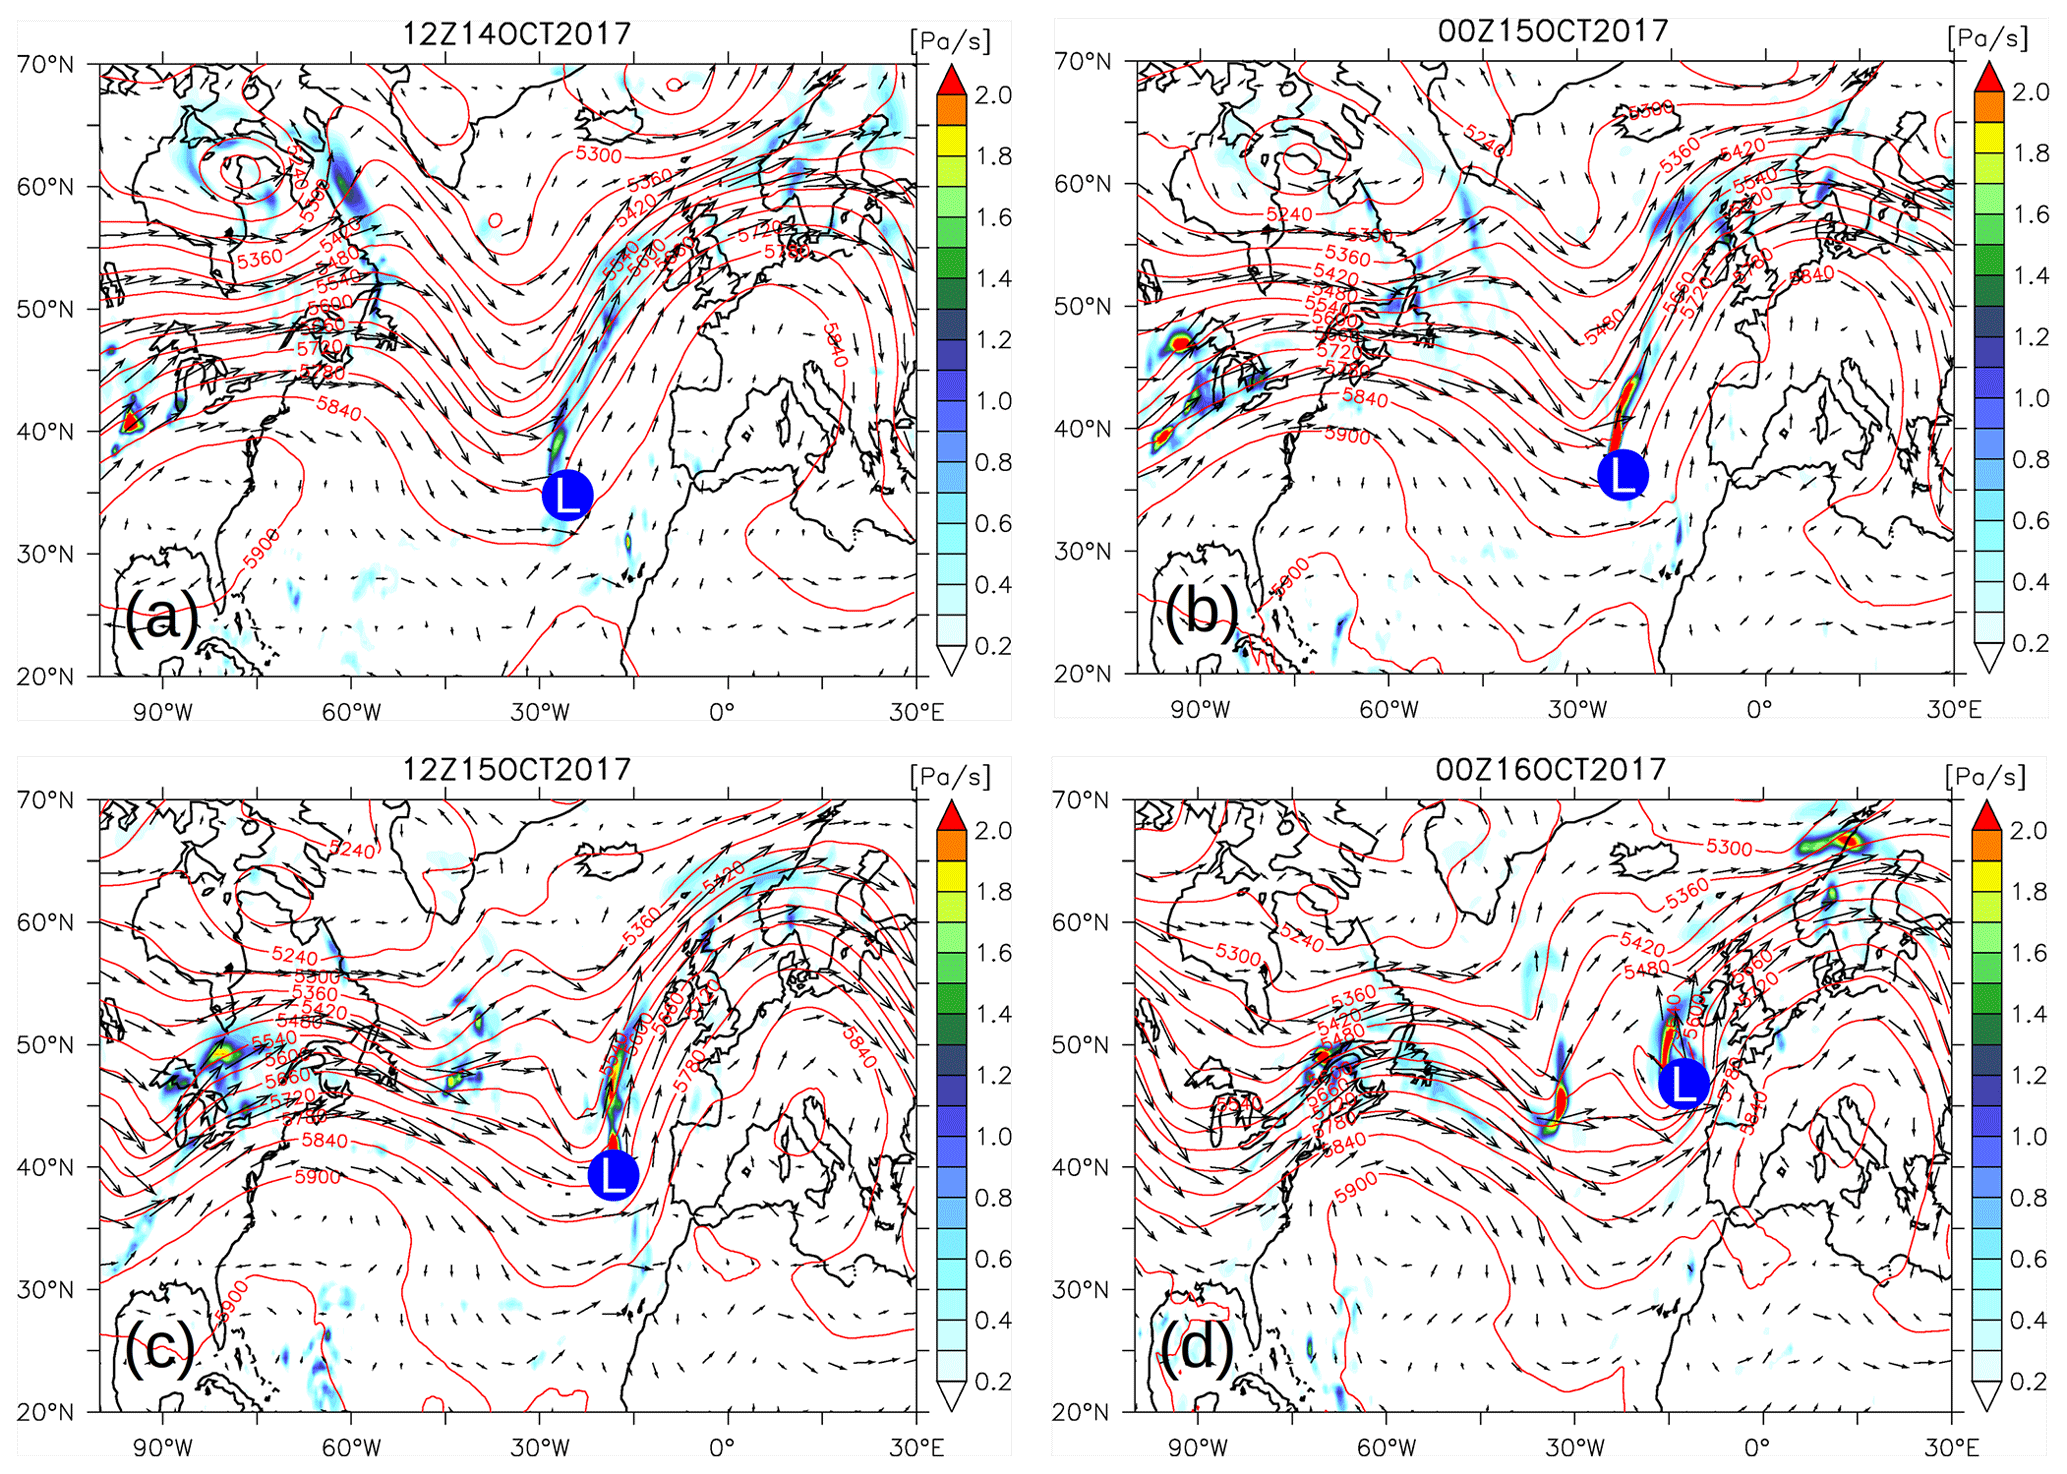
Figure 1IFS geopotential height (in gpm; red contours; 1 gpm is the distance of 1 m in geopotential height), negative of omega vertical velocity () (in Pa∕s, colour shaded) and wind direction (black vectors) at 500 hPa, during the period from 12:00 Z on 14 October 2017 to 00:00 Z on 16 October 2017 (12 h interval) (a, b, c, d). Also shown is the location of the surface low-pressure system denoted with the capital letter L.
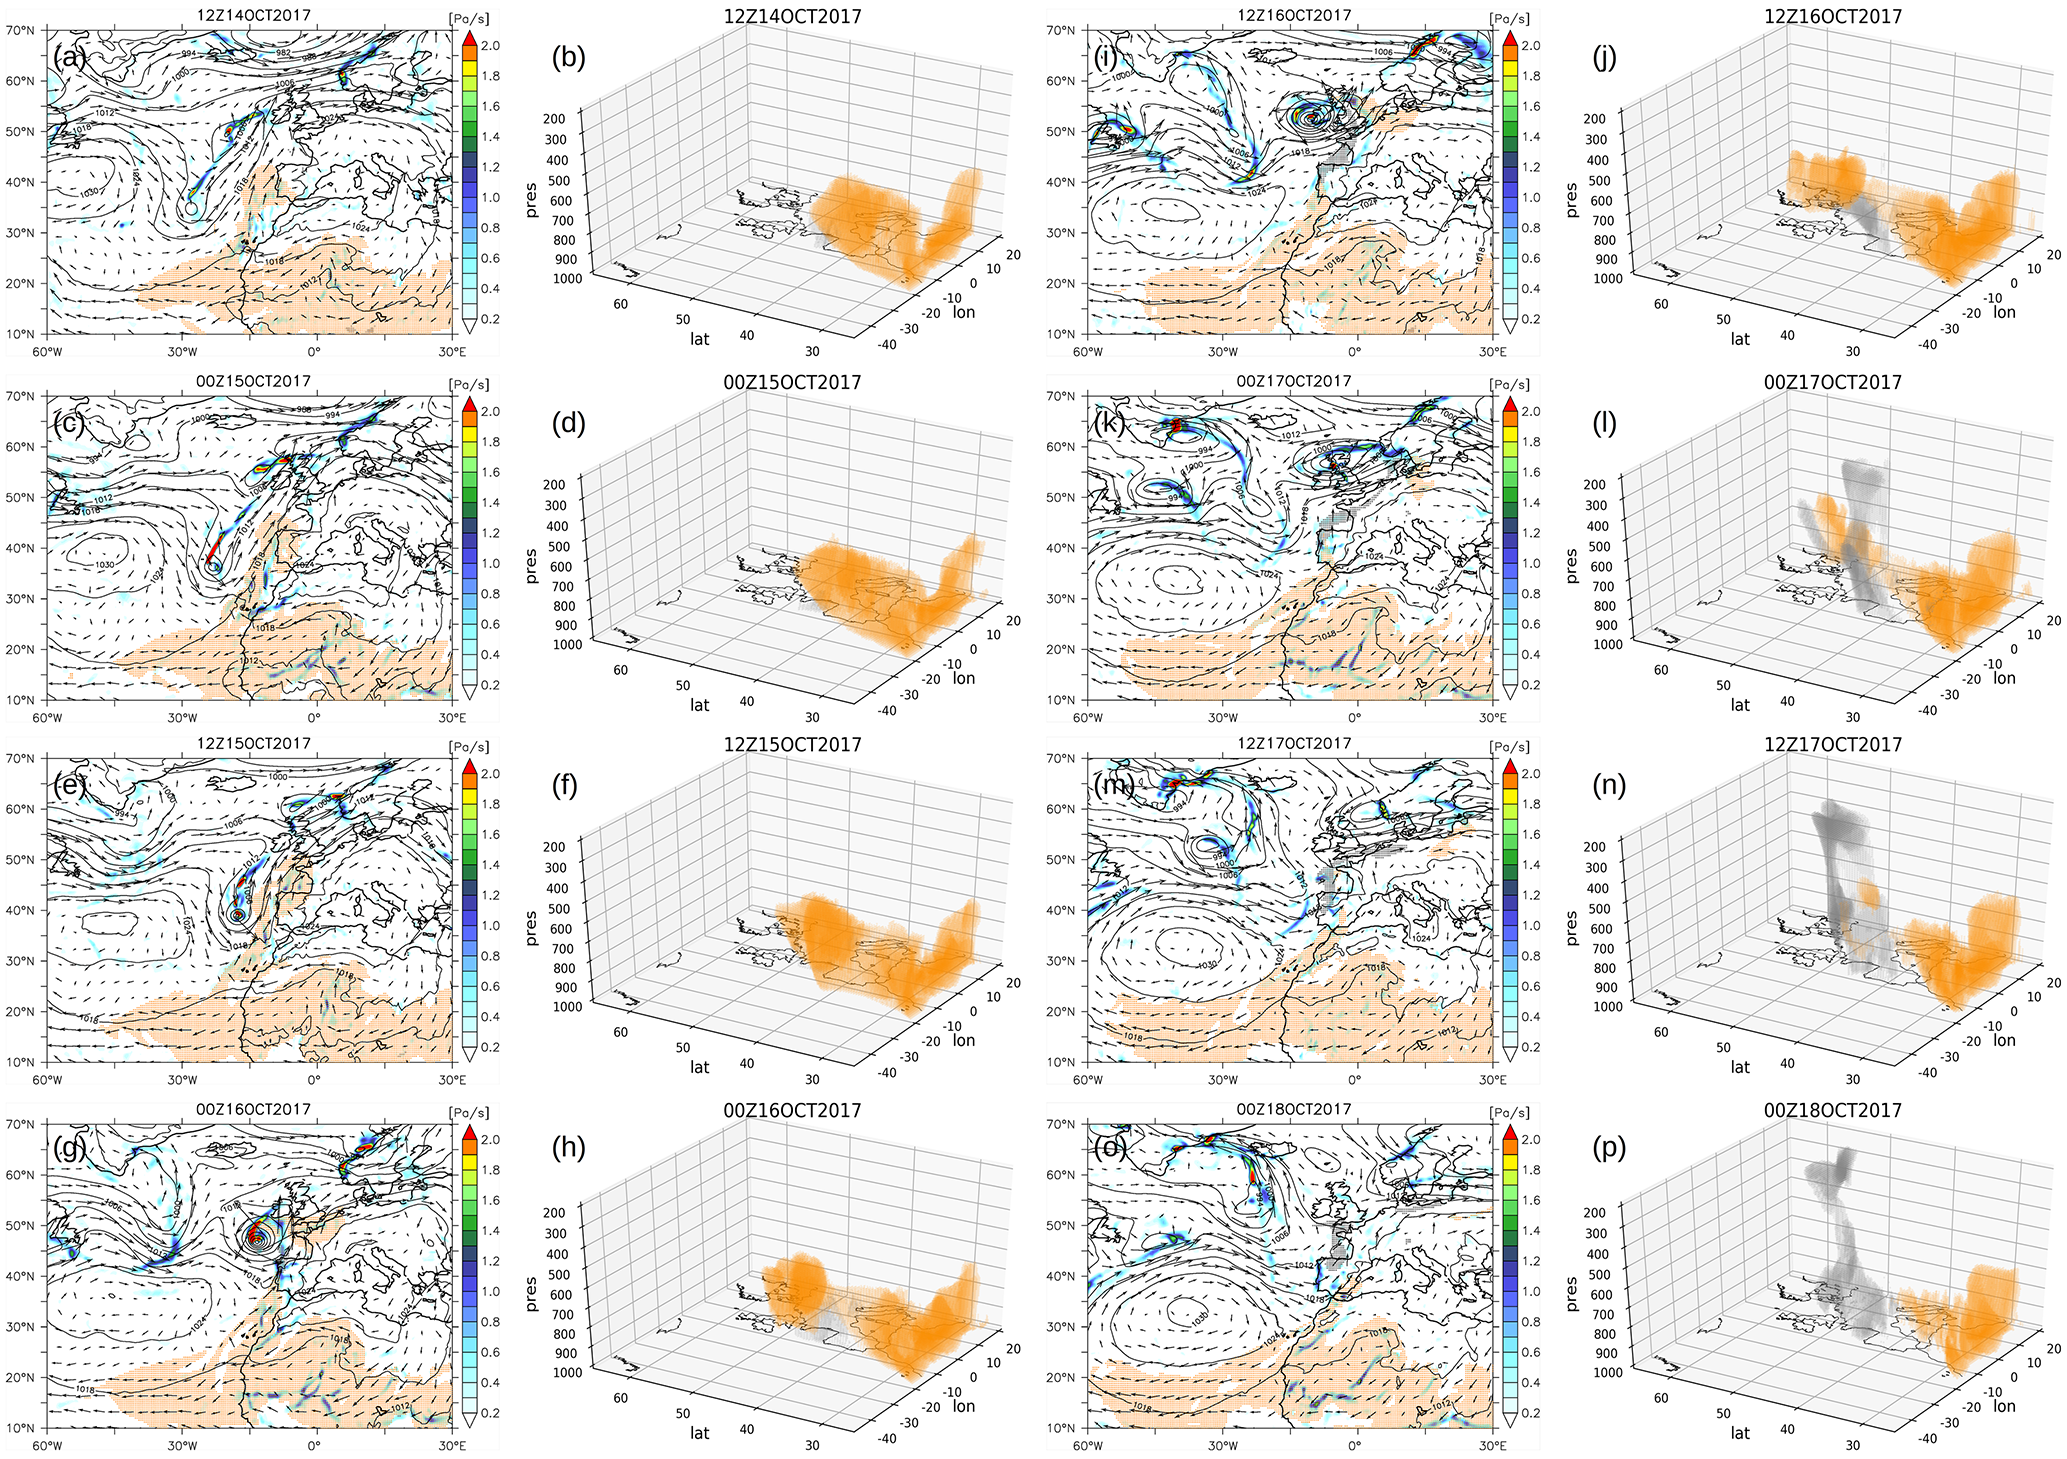
Figure 2IFS mslp (in hPa; black contours), negative of omega vertical velocity () (in Pa∕s, colour shaded), wind direction (black vectors), dust with mass mixing ratio exceeding 80 µg/kg (orange shaded) and CO with volume mixing ratio exceeding 200 ppbv (grey shaded) at 850 hPa during the period from 12:00 Z on 14 October 2017 to 00:00 Z on 18 October 2017 (12 h interval) (a, c, e, g, i, k, m, o). Three-dimensional (longitude, latitude, pressure (hPa)) spatial distribution of IFS dust with mass mixing ratio exceeding 80 µg/kg (orange shaded) and IFS carbon monoxide (CO) with volume mixing ratio exceeding 200 ppbv (grey shaded) during the same period (b, d, f, h, j, l, n, p).
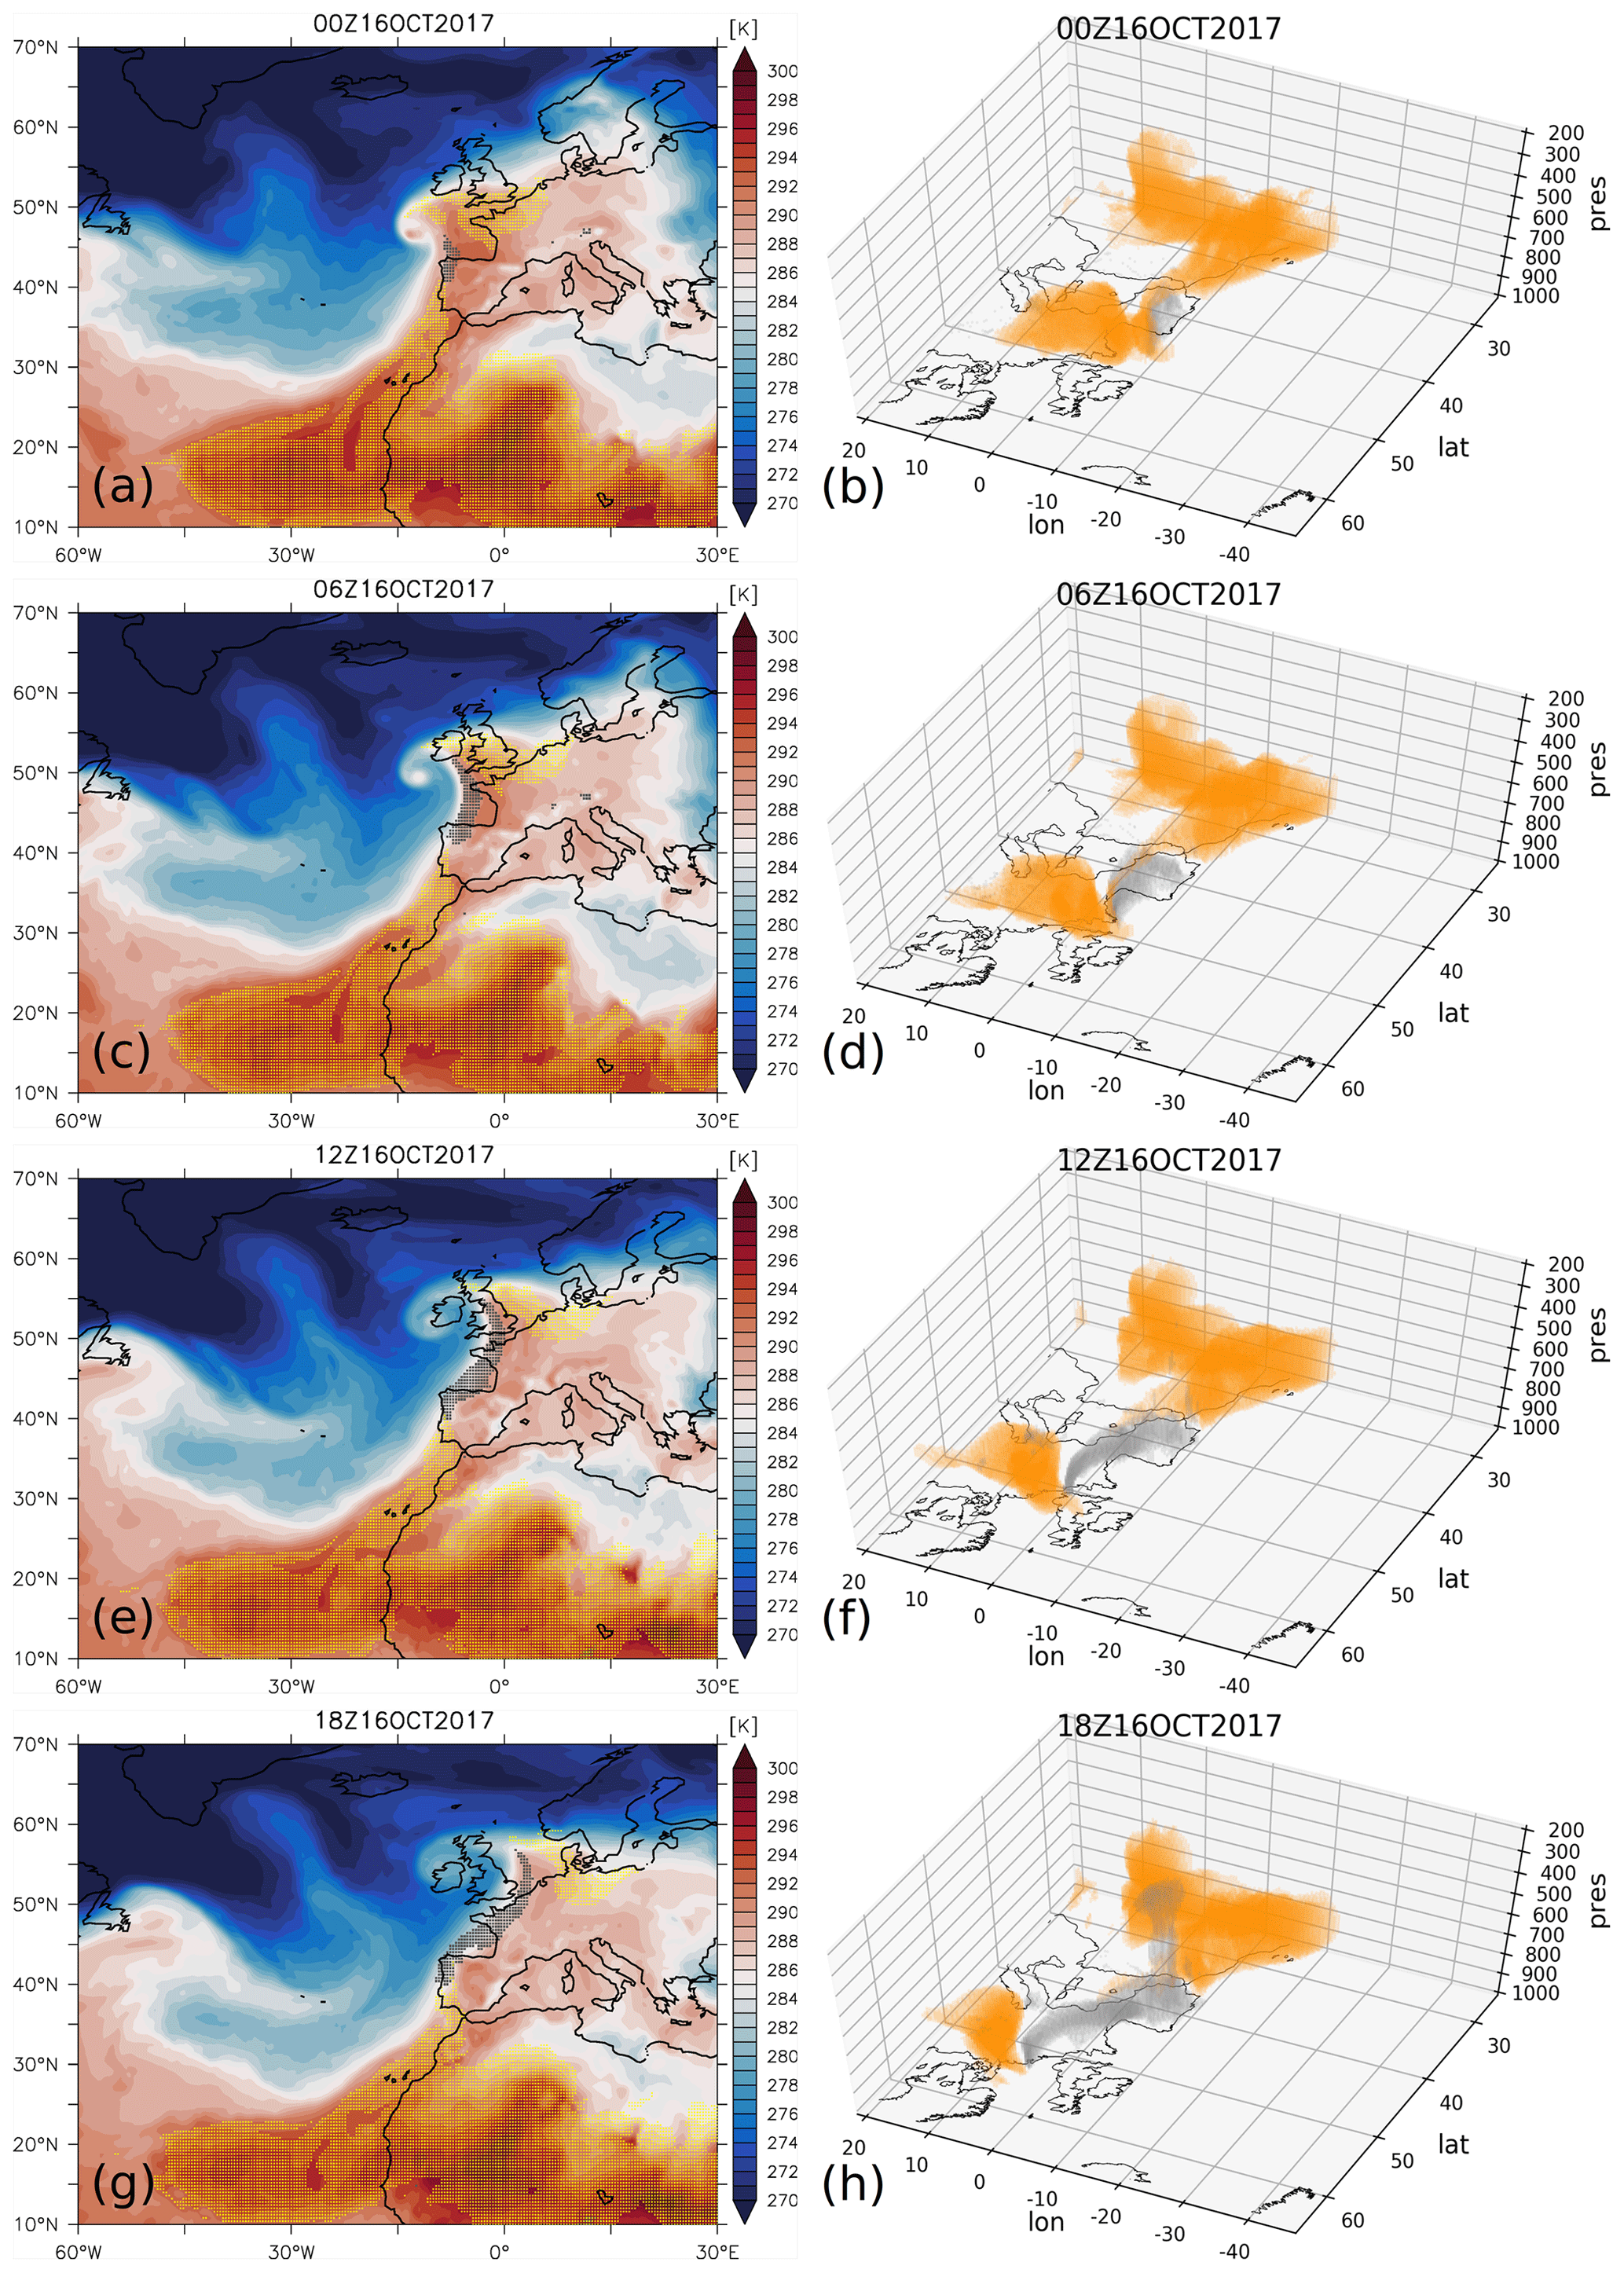
Figure 3IFS temperature (in K; colour shaded), dust with mass mixing ratio exceeding 80 µg/kg (orange shaded) and CO with volume mixing ratio exceeding 200 ppbv (grey shaded) at 850 hPa during the period from 00:00 Z on 16 October 2017 to 18:00 Z on 16 October 2017 (6 h interval) (a, c, e, g). Three-dimensional (longitude, latitude, pressure (hPa)) spatial distribution of IFS dust with mass mixing ratio exceeding 80 µg/kg (orange shaded) and IFS CO with volume mixing ratio exceeding 200 ppbv (grey shaded) during the same period (b, d, f, h).
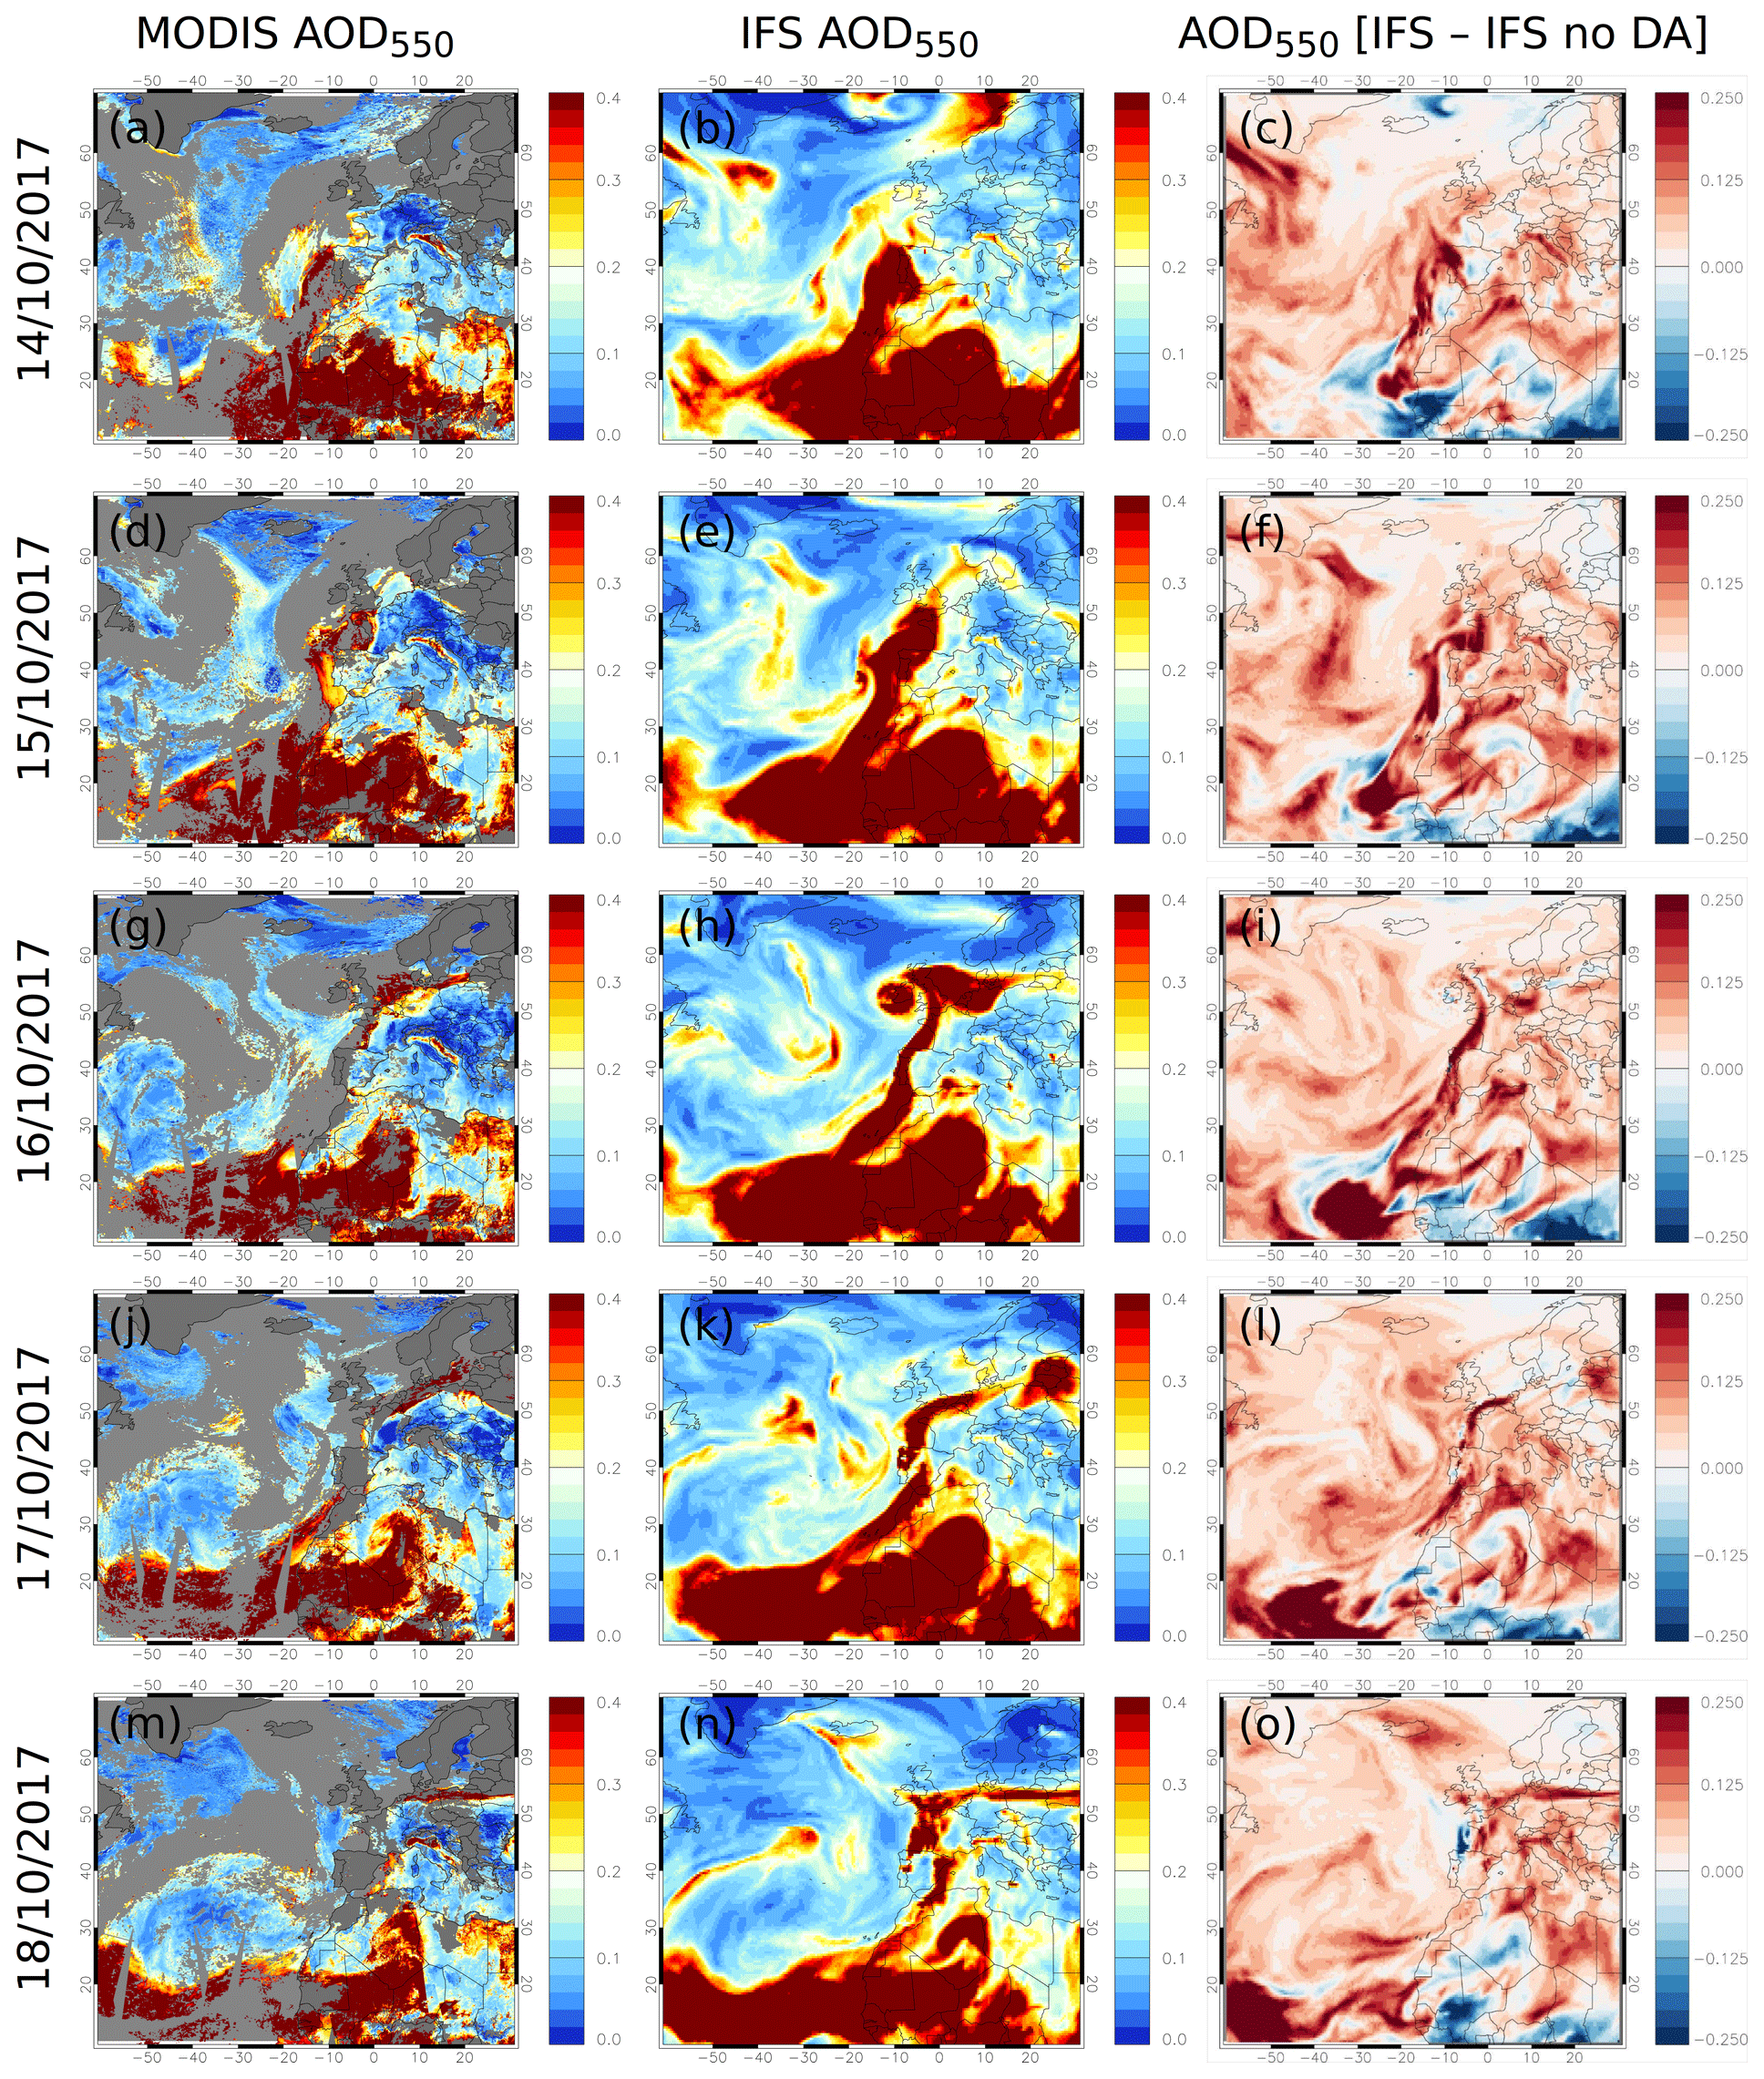
Figure 4MODIS Terra and Aqua Collection 6.1 AOD550 during the period from 14 to 18 October 2017 (a, d, g, j, m). IFS AOD550 (b, e, h, k, n) and differences between IFS and IFS no DA AOD550 (c, f, i, l, o) at 12:00 Z of the respective day.
From 00:00 Z on 13 October and onwards, Saharan dust, being transported through the trade winds over the west coast of Africa, is exposed to the southerlies on the east side of the Ophelia system, setting up a dust outbreak that gradually moves to the north. At 12:00 Z on 14 October a plume of high IFS dust mass mixing ratio exceeding 80 µg/kg is found west of the Iberian Peninsula up to approximately 700 hPa, as depicted in Fig. a and b. During the next 24 h and as the surface low-pressure system is travelling further north (at ∼40∘ N at12:00 Z on 15 October), the dust particles entrained from the meridional flow at the east of Ophelia's periphery form an extended plume of high dust loadings reaching the southeast coast of the UK (Fig. c, d, e and f). Throughout the following 12 h the plume expands to the north and east, passing over northwestern France and southern UK (Fig. g and h). At 00:00 Z on 16 October the Ophelia storm merges with the frontal system as can be seen in Figs. g and a, while smoke from wildfires that have been burning across the Iberian Peninsula is evident at 850 hPa, with high CO volume mixing ratio (>200 ppbv), which was uplifted through the warm conveyor belt (Osborne et al., 2019) on the southeastern part of Ophelia where upward motion dominates (Fig. g and Fig. S1 in the Supplement). From this moment and until 18:00 Z on 16 October, dust and smoke particles gather on the warm and cold fronts of Ophelia's warm sector, respectively, transported over western Europe through the frontal system (Fig. c, e and g). This distinct discretization of dust and biomass burning within the warm sector of Ophelia is well illustrated by the 3-D fields of dust and CO mixing ratio exceeding 80 µg/kg and 200 ppbv, respectively, resembling the shape of the warm and cold fronts (Fig. d, f and h). Noteworthy is the uplift of smoke over the northwest Iberian Peninsula from 18:00 Z on 16 October to 06:00 Z on 17 October (Fig. l), due to the profound upward motions induced by strong lower convergence and upper divergence (Fig. S1 in the Supplement) at the eastern flank of the upper-level trough (not show). This elevated smoke plume is drifted during the next 24 h from the northeasterly flow towards the UK (Fig. n and p). The Ophelia storm starts dissipating from 00:00 Z on 17 October onwards, fading away over Norway at 00:00 Z on 18 October. A graphical representation of the IFS dust and CO transport along with the synoptic evolution during the passage of Ophelia (from 00:00 Z on 12 October 2017 to 21:00 Z on 20 October 2017) is provided as an animation in the Supplement.
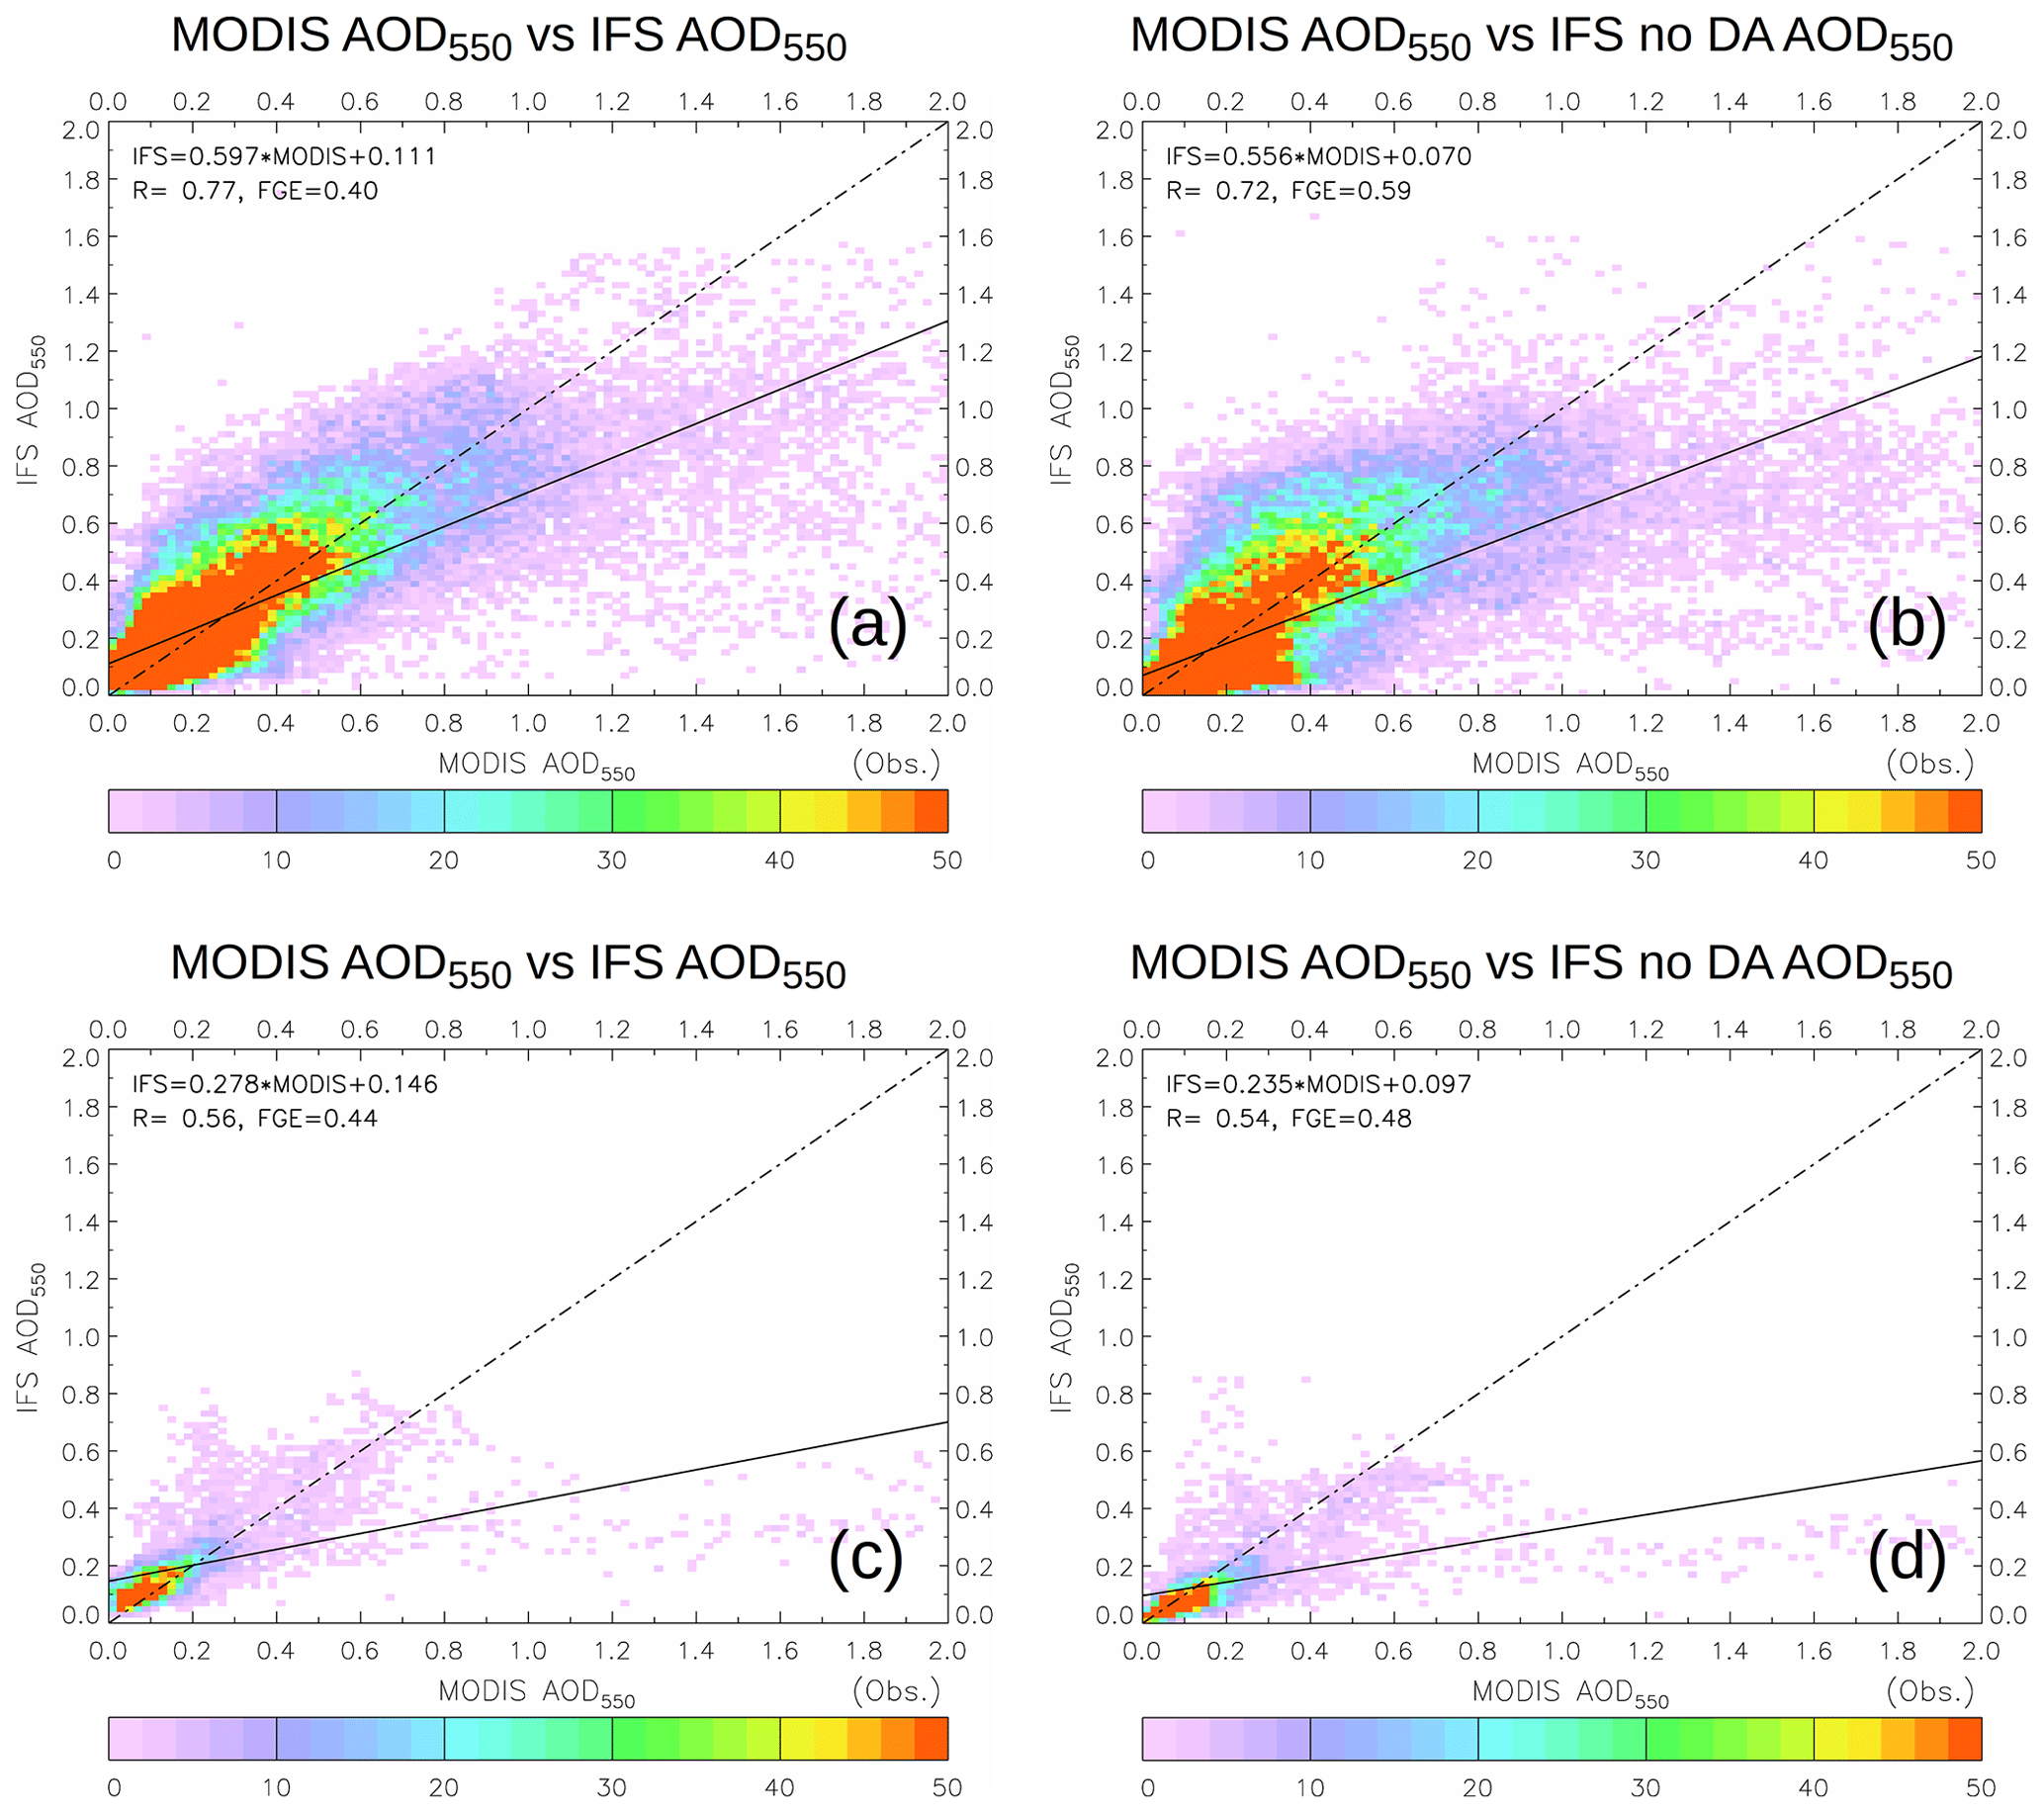
Figure 5Comparison of spatially and temporally co-located IFS and MODIS Terra and Aqua Collection 6.1 AOD550 data for the whole domain of Fig. 3, with IFS including data assimilation (a) and IFS without data assimilation (b), and the box region shown in Fig. 8d, with IFS including data assimilation (c) and IFS without data assimilation (d). The examined dates are those shown in Fig. 3. The colour scale corresponds to the number of IFS-MODIS co-location points that fall within 0.02×0.02 AOD550 bins. The solid line is the regression line of the IFS-MODIS data, and the dashed-dotted line is the 1:1 line. Also shown are the slope and the intercept of the regression line, the correlation coefficient (R) and the fractional gross error (FGE).
3.2 Aerosol atmospheric composition
Here we explore the impact of Ophelia's passage on the aerosol atmospheric composition over the broader European region, using CAMS global forecast data and satellite observations. The MODIS Terra and Aqua AOD550 spatial distribution for the time period from 14 to 18 October 2017 is presented in Fig. 3 (left column). It should be noted that these data do not give an independent validation as they are also assimilated in the IFS. High aerosol loadings (>0.4) are observed to the west of the Iberian Peninsula on 14 October (Fig. 3a), while 1 d later the aerosol plume is extended further north and east over France, the English Channel and the Celtic Sea (Fig. 3d). On 16 and 17 October, high AOD550 values are seen over the North Sea, Baltic Sea, France, Belgium, the Netherlands and Germany (Fig. 3g and j), while on 18 October the plume is found over Germany and Poland (Fig. 3m). The observed buildup of high AOD loadings over Europe is in line with the aforementioned description of the Ophelia storm and the associated transport pathways. To evaluate the CAMS global AOD550 forecast product during this period, the respective AOD550 fields are also shown in Fig. 3 (middle column). Overall, there is a good agreement between the CAMS global forecast product and the satellite observations, at least in qualitative terms, as the forecasted high AOD loadings resemble that of observations. To assess the impact of AOD data assimilation on IFS AOD forecast, the differences of AOD550 with and without the use of data assimilation are also shown in Fig. 3 (right column), revealing that data assimilation boosts AOD values near the examined AOD plumes, while near the dust sources over Africa it mostly suppresses them. In addition, to quantitatively validate the CAMS global AOD forecast, a comparison of spatially and temporally co-located AOD550 data between IFS (with and without the use of data assimilation) and MODIS Terra and Aqua is performed for two box regions: the whole domain shown in Fig. 3 and a smaller domain in northwestern Europe shown in Fig. 8d. As depicted from the scatter plots of Figs. 4a and b for the large domain, the use of data assimilation improves the CAMS global forecast performance, increasing the correlation (from 0.72 to 0.77) and reducing the error (FGE from 0.59 to 0.4) with respect to the control simulation (no DA). For a more “event-based” evaluation of the CAMS global AOD forecast, the respective scatter plots for a small domain in northwestern Europe where the AOD plume is found are shown in Fig. 4c and d, indicating less agreement with the satellite observations and a slight improvement due to data assimilation implementation (correlation increase from 0.54 to 0.56, and FGE decreases from 0.48 to 0.44). Overall, the CAMS global AOD forecast product tends to overestimate for low observed AOD values and vice versa, which is a behaviour that was also observed in a previous version of the ECMWF global atmospheric composition reanalysis dataset (MACC: Monitoring Atmospheric Composition and Climate; see Georgoulias et al. (2018) for details).
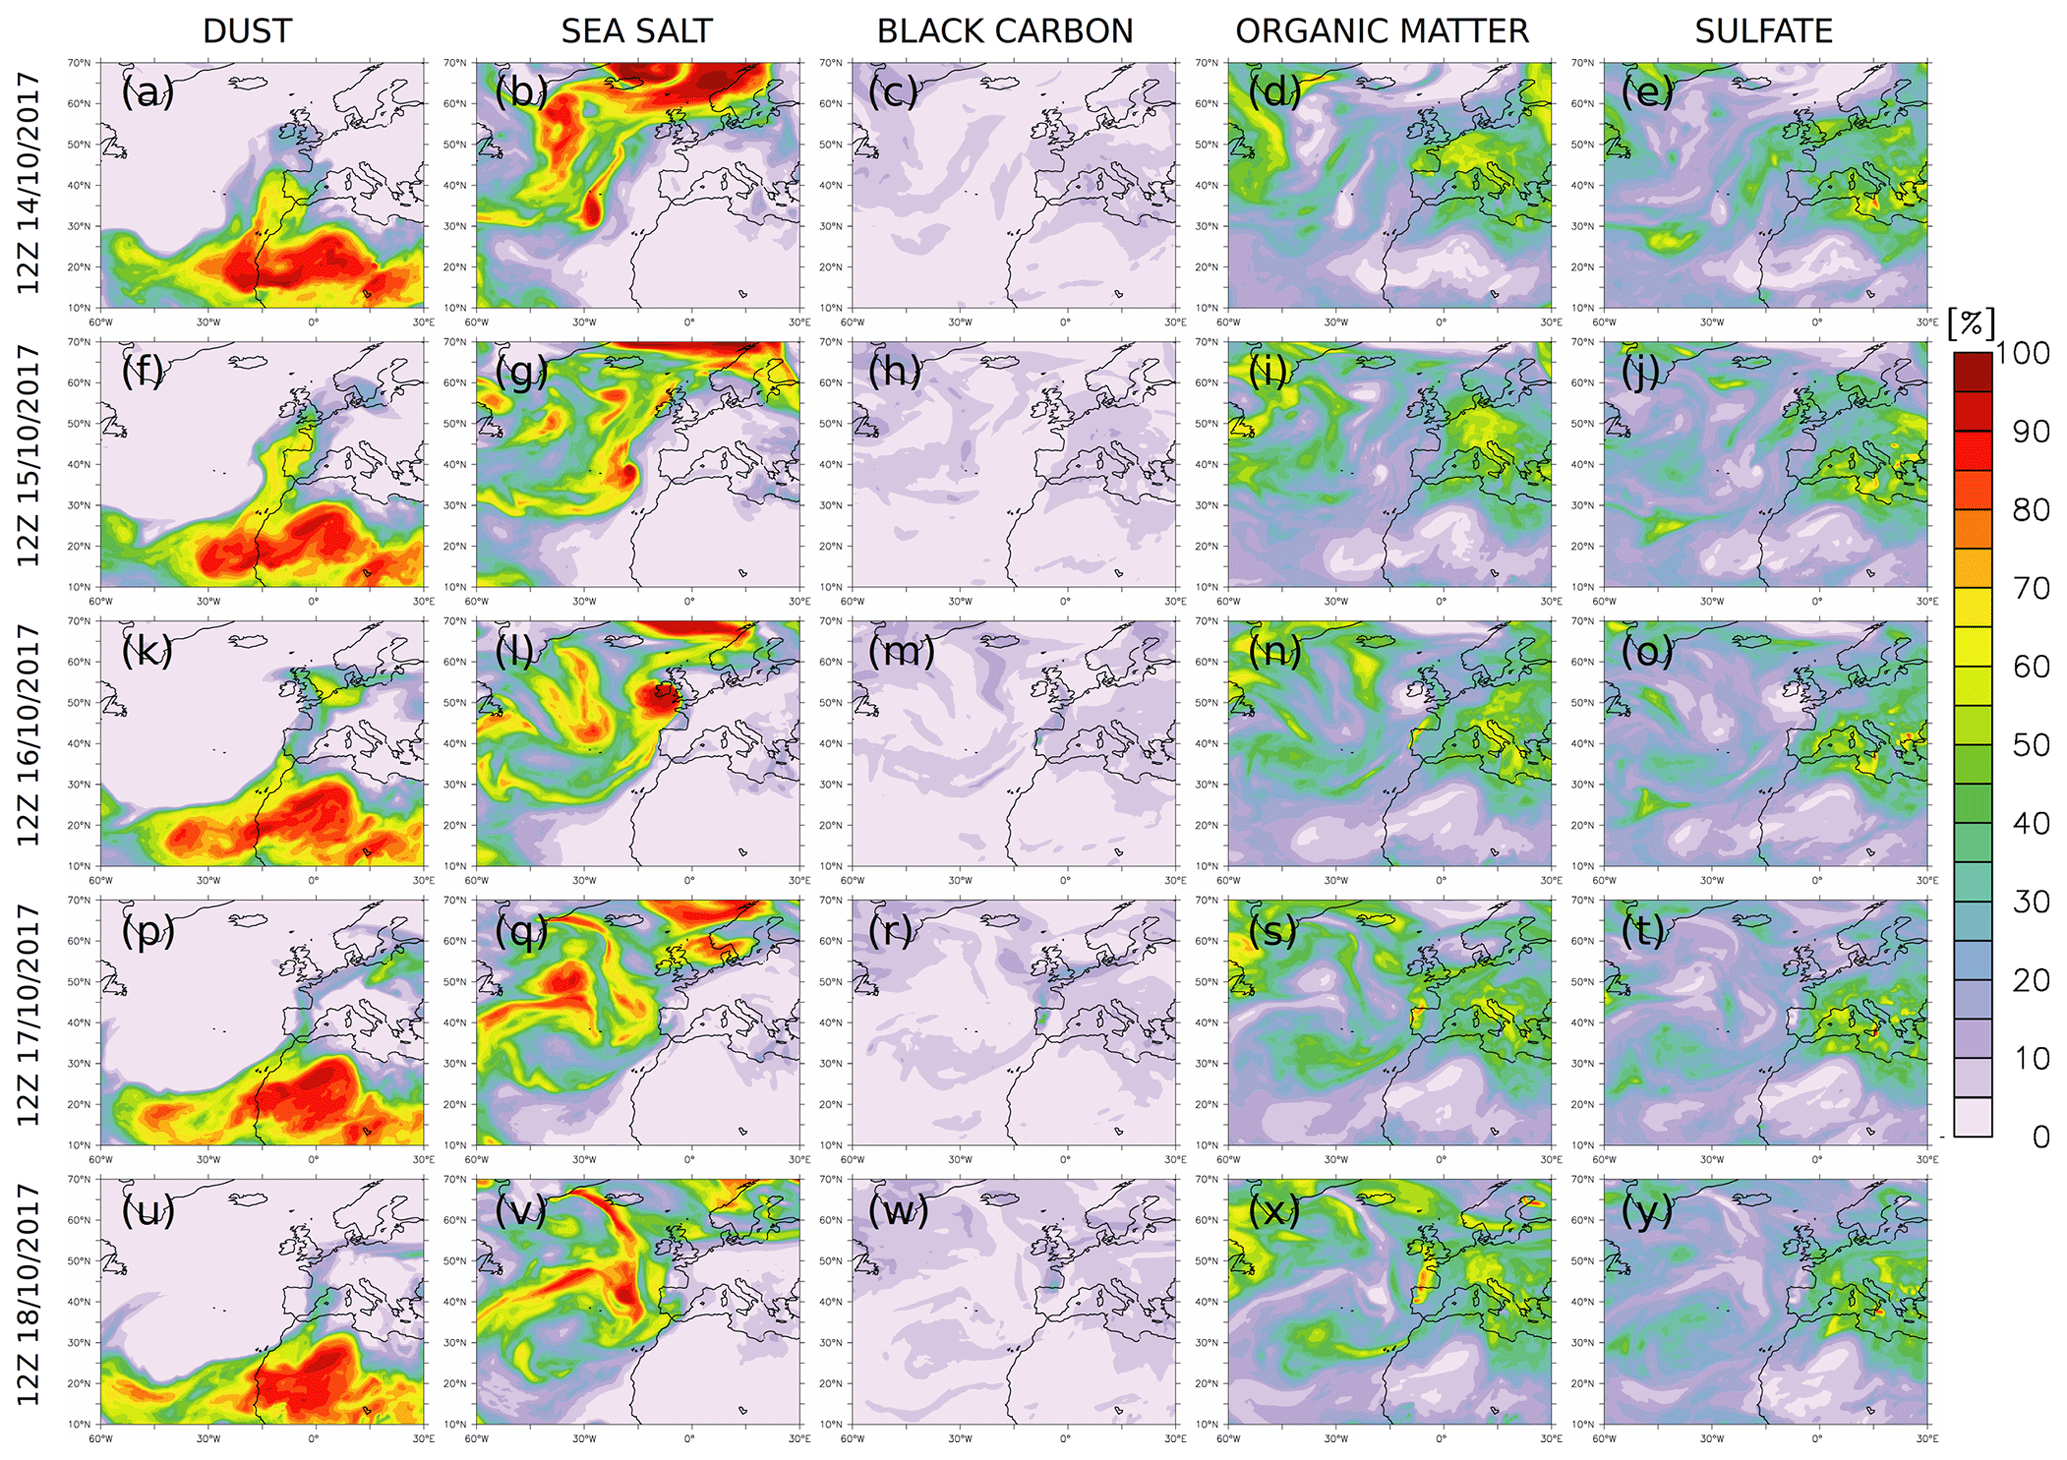
Figure 6Percentage contribution of dust (a, f, k, p, u), sea salt (b, g, l, q, v), black carbon (c, h, m, r, w), organic matter (d, i, n, s, x) and sulfate (e, j, o, t, y) aerosols to the IFS total AOD550 values shown in Fig. 3.
To identify the dominant IFS aerosol types within the high AOD plume, the modelled percentage (%) contribution of each aerosol type to the total AOD, as shown in Fig. 3, is presented in Fig. 5 for the same period. At 12:00 Z on 14 October, the dominant source of the AOD loading found to the west of the Iberian Peninsula is mineral dust by 60 %–70 %, while the dust contribution over the UK is up to 20 %, as depicted in Fig. 5a. A day later and as the AOD plume moves to the north and east, dust continues to dominate with percentage contribution of up to 45 % over the UK (Fig. 5f). At 12:00 Z on 16 October, the dust AOD contribution over the UK ranges with a percentage between 20 % and 35 %, while over the North Sea and the Netherlands it reaches values up to 65 % (Fig. 5k). The biomass burning emission trails originating from the northwest Iberian Peninsula are also a significant input for AOD, with black carbon and organic matter aerosols contributing up to 20 % and 40 % over the UK, respectively (Fig. 5m and n). Such black carbon contributions are considered high, being similar to climatological contributions over global fire hot spots (e.g. summertime central southern Africa; Penning de Vries et al., 2015). The elongated plume of high AOD values at 12:00 Z on 17 October as seen from both the satellite observations and the CAMS global forecast (Fig. 3j and k) consists of up to ∼50 % of organic matter aerosols (Fig. 5s), up to ∼25 % of black carbon aerosols (Fig. 5r) and up to ∼20 % of dust aerosols (Fig. 5p), while over the Baltic states the major contributor is mineral dust with ∼50 %. This is consistent with the transport pathways of dust and biomass burning aerosols shown in Fig. , indicating that fire-originated aerosols dominate over northern coastal Europe, while dust aerosol remnants from Ophelia's warm-front passage prevail over the Baltic states. A similar situation also occurs a day later as depicted in Fig. 5u, w and x. It is worth noting that during the examined period sea salt aerosols are dominating over the Atlantic Ocean, following the evolution of Storm Ophelia, as they are produced and transported due to the intense winds near Ophelia (Fig. 5b, g, l, q and v).

Figure 7Vertical cross sections of CALIOP/CALIPSO aerosol subtypes and IFS dominant-aerosol type at 12:00 Z on 15 October 2017 (a, b) and at 12:00 Z on 17 October 2017 (c, d). The embedded maps in (a) and (c) depict the respective CALIOP/CALIPSO tracks.
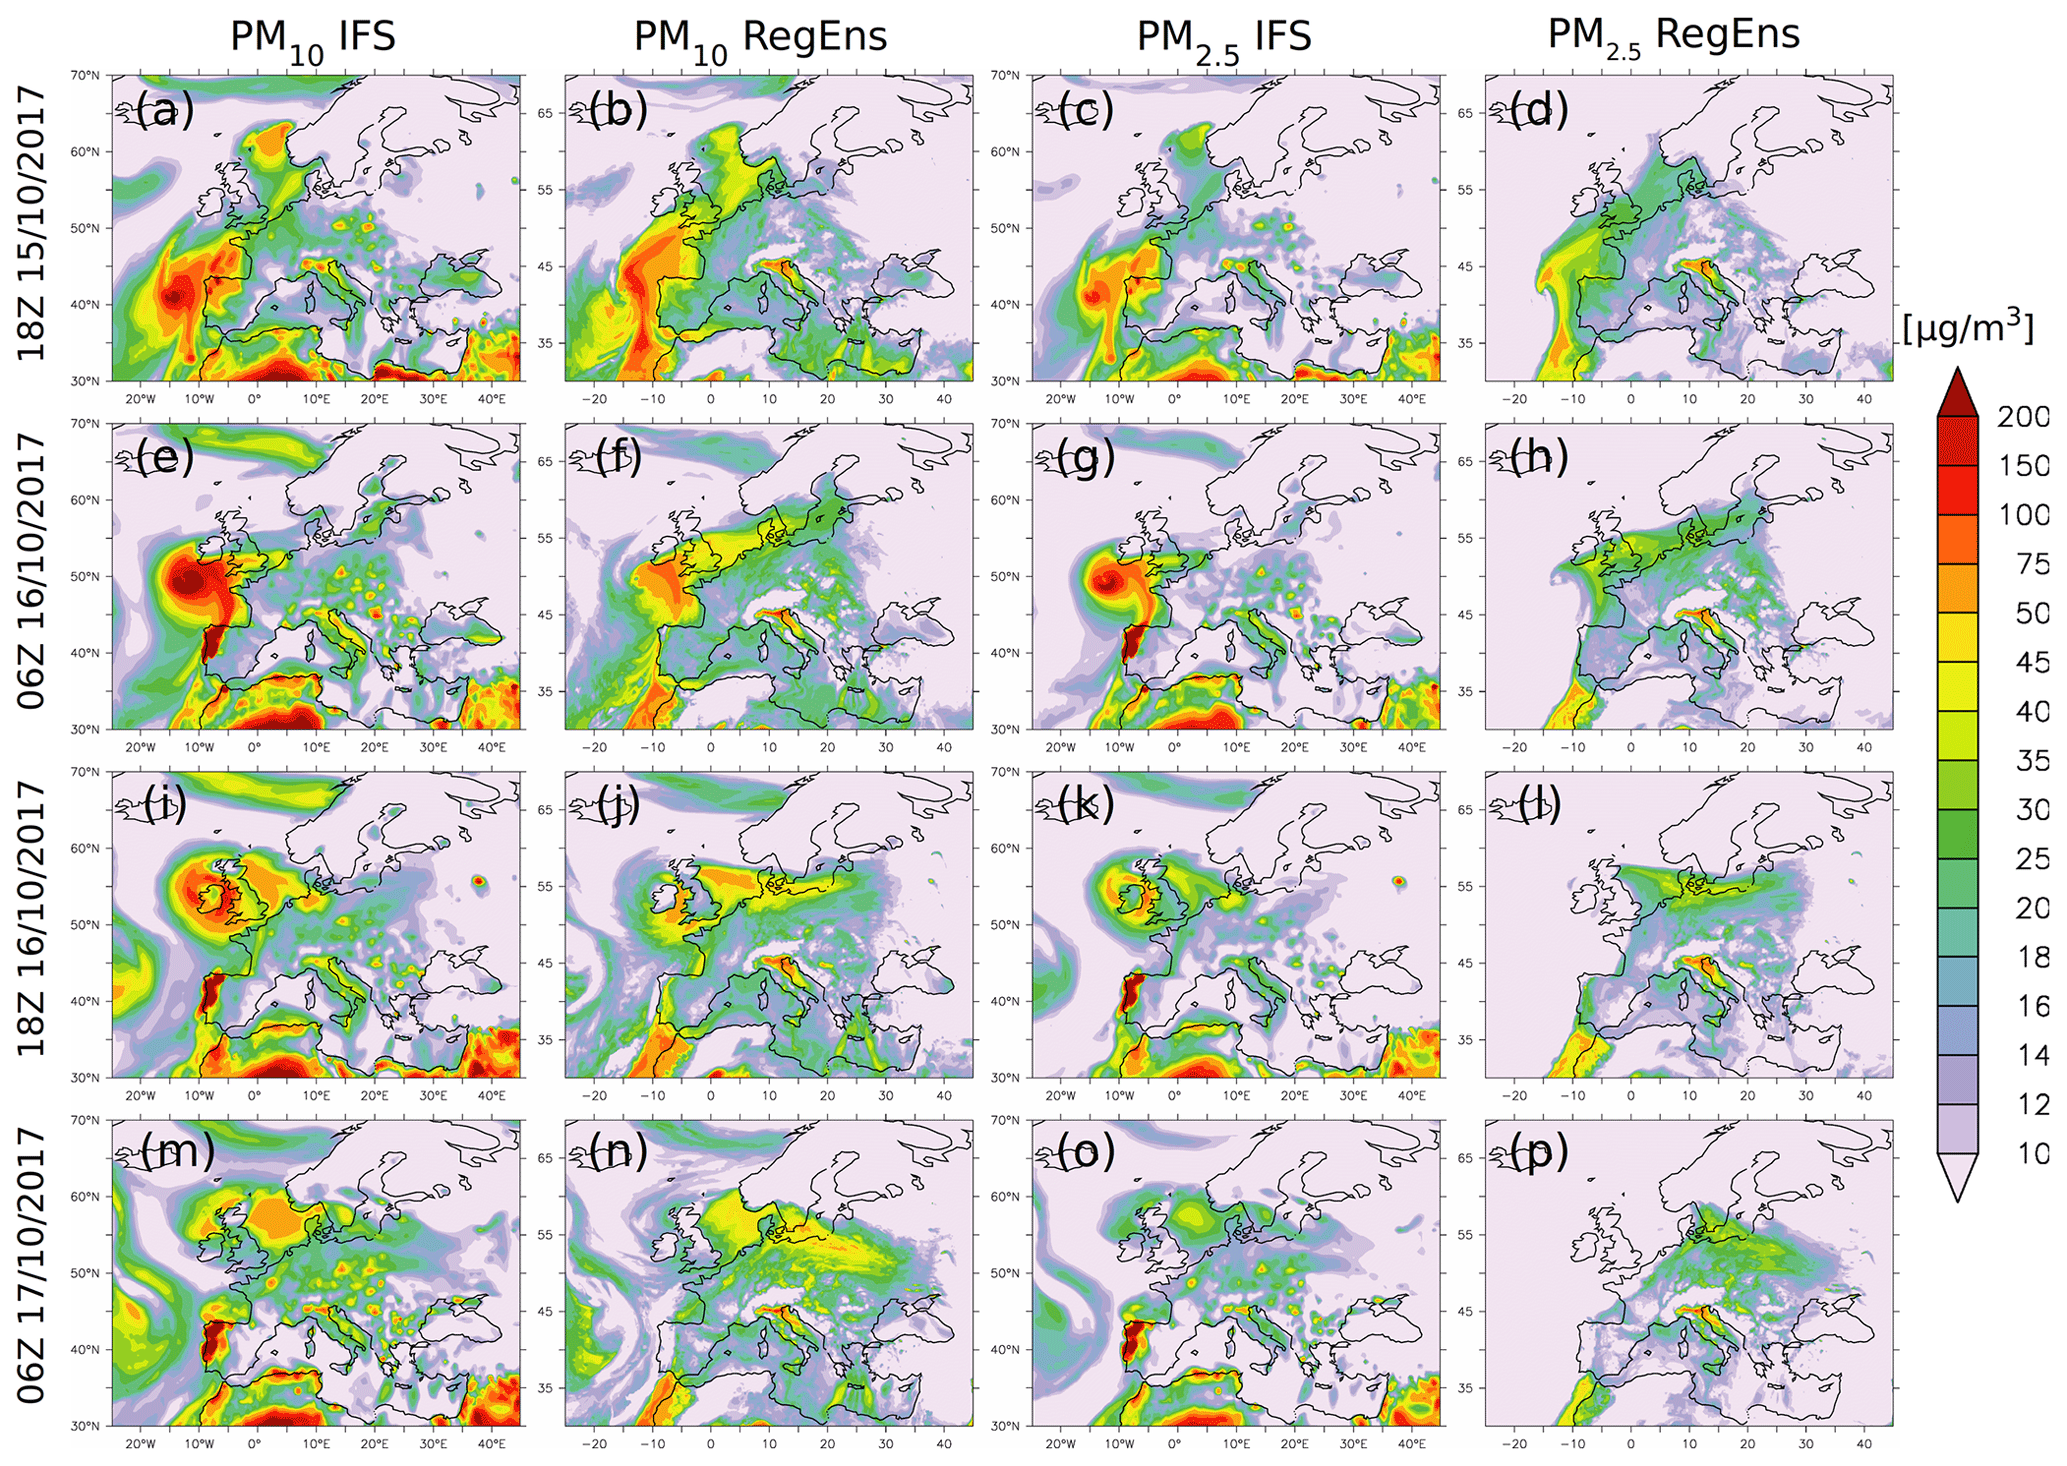
Figure 8PM10 surface concentrations (µg/m3) for IFS (a, e, i, m) and RegEns (b, f, j, n) for the period from 18:00 Z on 15 October 2017 to 06:00 Z on 17 October 2017; PM2.5 surface concentrations (µg/m3) for IFS (c, g, k, o) and RegEns (d, h, l, p) for the same period.
To assess the performance of the CAMS global forecast in representing the vertical distribution of aerosol types during the passage of Ophelia, CALIPSO aerosol subtype satellite data were also utilized. Two CALIPSO tracks that crossed the aerosol plume during the examined period were selected for 15 and 17 October 2017 with an overpass time around 13:00 and 12:45 Z, respectively (tracks are shown on the top left of Fig. 6a and c). For the selected CALIPSO tracks, spatially (horizontally and vertically) and temporally (at 12:00 Z) co-located IFS aerosol mass mixing ratio data were extracted. Subsequently, the dominant (in terms of mass mixing ratio) aerosol type was identified, namely sea salt, dust, carbonaceous aerosols (organic matter and black carbon) and sulfates, following Georgoulias et al. (2020). A dominant aerosol type was set only when the highest mass mixing ratio from the four subtypes exceeded 1 µg/kg. Figure 6 presents the vertical cross sections of CALIOP/CALIPSO aerosol subtypes and IFS dominant-aerosol type along the two selected CALIPSO tracks. At 12:00 Z on 15 October, a distinct presence of dust and polluted dust aerosols is observed between 44 and 57∘ N, with polluted dust being confined within the first ∼2 km. Moreover, polluted continental/smoke aerosols are also detected over the UK (>50∘ N) up to approximately 1 km. Further south and over the Mediterranean Sea (36–43∘ N), sea salt and dusty marine aerosols are mostly dominating indicating dust crossing over the Mediterranean, while further south of 36∘ N over northern Africa, polluted dust is observed (Fig. 6a). The respective vertical cross section of the IFS dominant-aerosol type indicates the dominance of dust over the latitudinal bands of 40–55 and 30–35∘ N and of carbonaceous aerosols near the surface between 43 and 55∘ N, while primarily carbonaceous aerosols and secondarily sea salt aerosols are identified over the Mediterranean Sea (Fig. 6b), being in a satisfactory agreement with the CALIOP/CALIPSO observations. For the second selected CALIPSO track at 12:00 Z on 17 October, dust and polluted dust are detected at 45–52∘ N and 30–35∘ N up to 3 km, with dust also observed in the upper troposphere (∼10 km) over France, while elevated smoke is identified over the North Sea at ∼4 km (Fig. 6c). The latitudinal bands of IFS dust dominance is consistent with CALIPSO, as well as the fire-originated aerosols (carbonaceous aerosols) which are found over the North Sea above 2 km (Fig. 6d). Yet, over the Mediterranean, carbonaceous aerosols prevail in IFS, while marine and dusty marine aerosols prevail in CALIOP/CALIPSO.
3.3 Air quality
The implications of dust and biomass burning transport during Ophelia's passage for European air quality are hereafter discussed. Figure 7 illustrates the CAMS global and regional PM10 and PM2.5 surface concentrations over Europe for the time period from 18:00 Z on 15 October 2017 to 06:00 Z on 17 October 2017. Overall, the spatial patterns of particulate matter concentrations in the CAMS products agree well, reproducing the plume of high aerosol loadings. Yet, there are some differences between the global and regional forecasts, which are as follows: (a) RegEns exhibits lower concentrations compared to IFS for both coarse and fine particulate matter; (b) IFS has higher concentrations near the centre of Ophelia, probably due to higher sea salt contribution; (c) the enhanced PM10 and PM2.5 concentrations over Portugal in IFS due to assimilated fire emissions (GFAS: Global Fire Assimilation System) are not seen in RegEns; and (d) RegEns exhibits higher concentrations in both PM10 and PM2.5 over the Black Sea and the Baltic states compared to IFS. The aforementioned inconsistencies are likely due to the different definition of PM10 and PM2.5 in IFS and each CAMS regional air quality model, the different aerosol schemes and horizontal resolution used in CAMS global and regional models, and the different assimilation approaches in the CAMS regional air quality models relative to IFS.
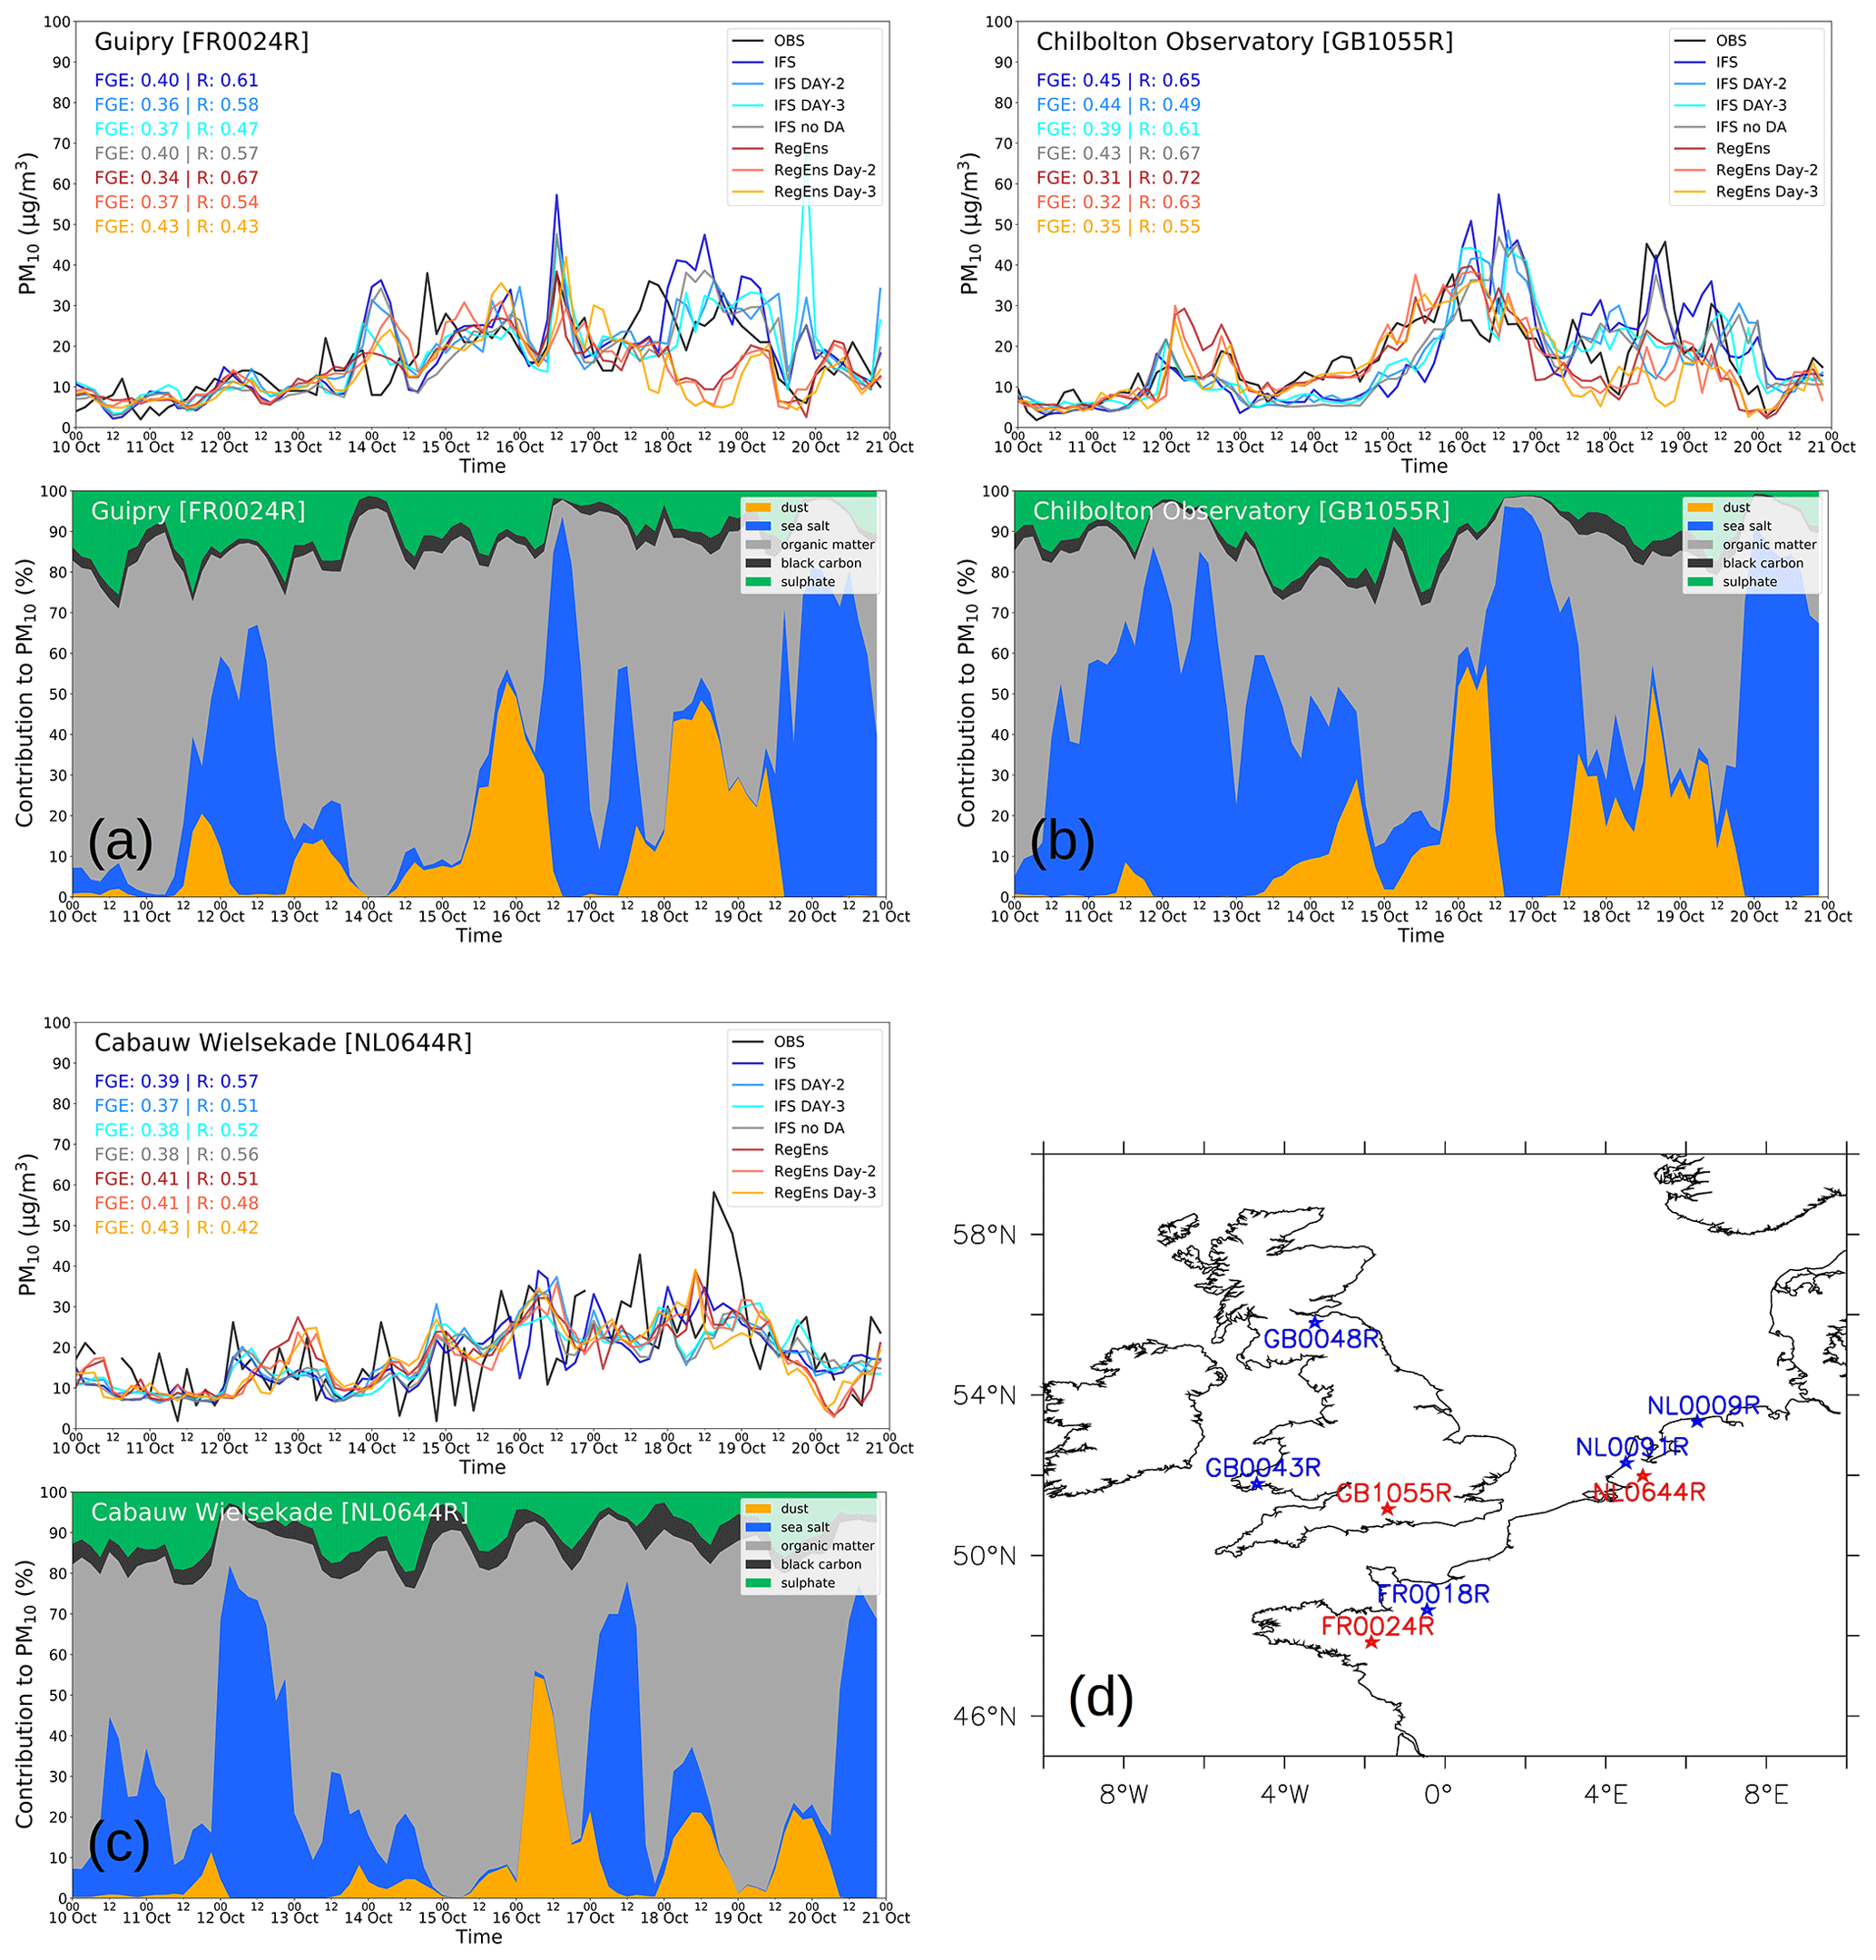
Figure 9Observed (black), IFS (blue), IFS day-2 (light blue), IFS day-3 (aqua), IFS no DA (grey), RegEns (red), RegEns day-2 (light red) and RegEns day-3 (orange) 3-hourly time series of PM10 surface concentrations (µg/m3) (top) and percentage (%) contribution of aerosol type to IFS PM10 surface concentrations (bottom) for Guipry (FR0024R), France (a); Chilbolton Observatory (GB1055R), Great Britain (b); and Cabauw Wielsekade (NL0644R), the Netherlands (c). The locations of the presented EMEP stations in the article (red) and the Supplement (blue) are also shown (d).
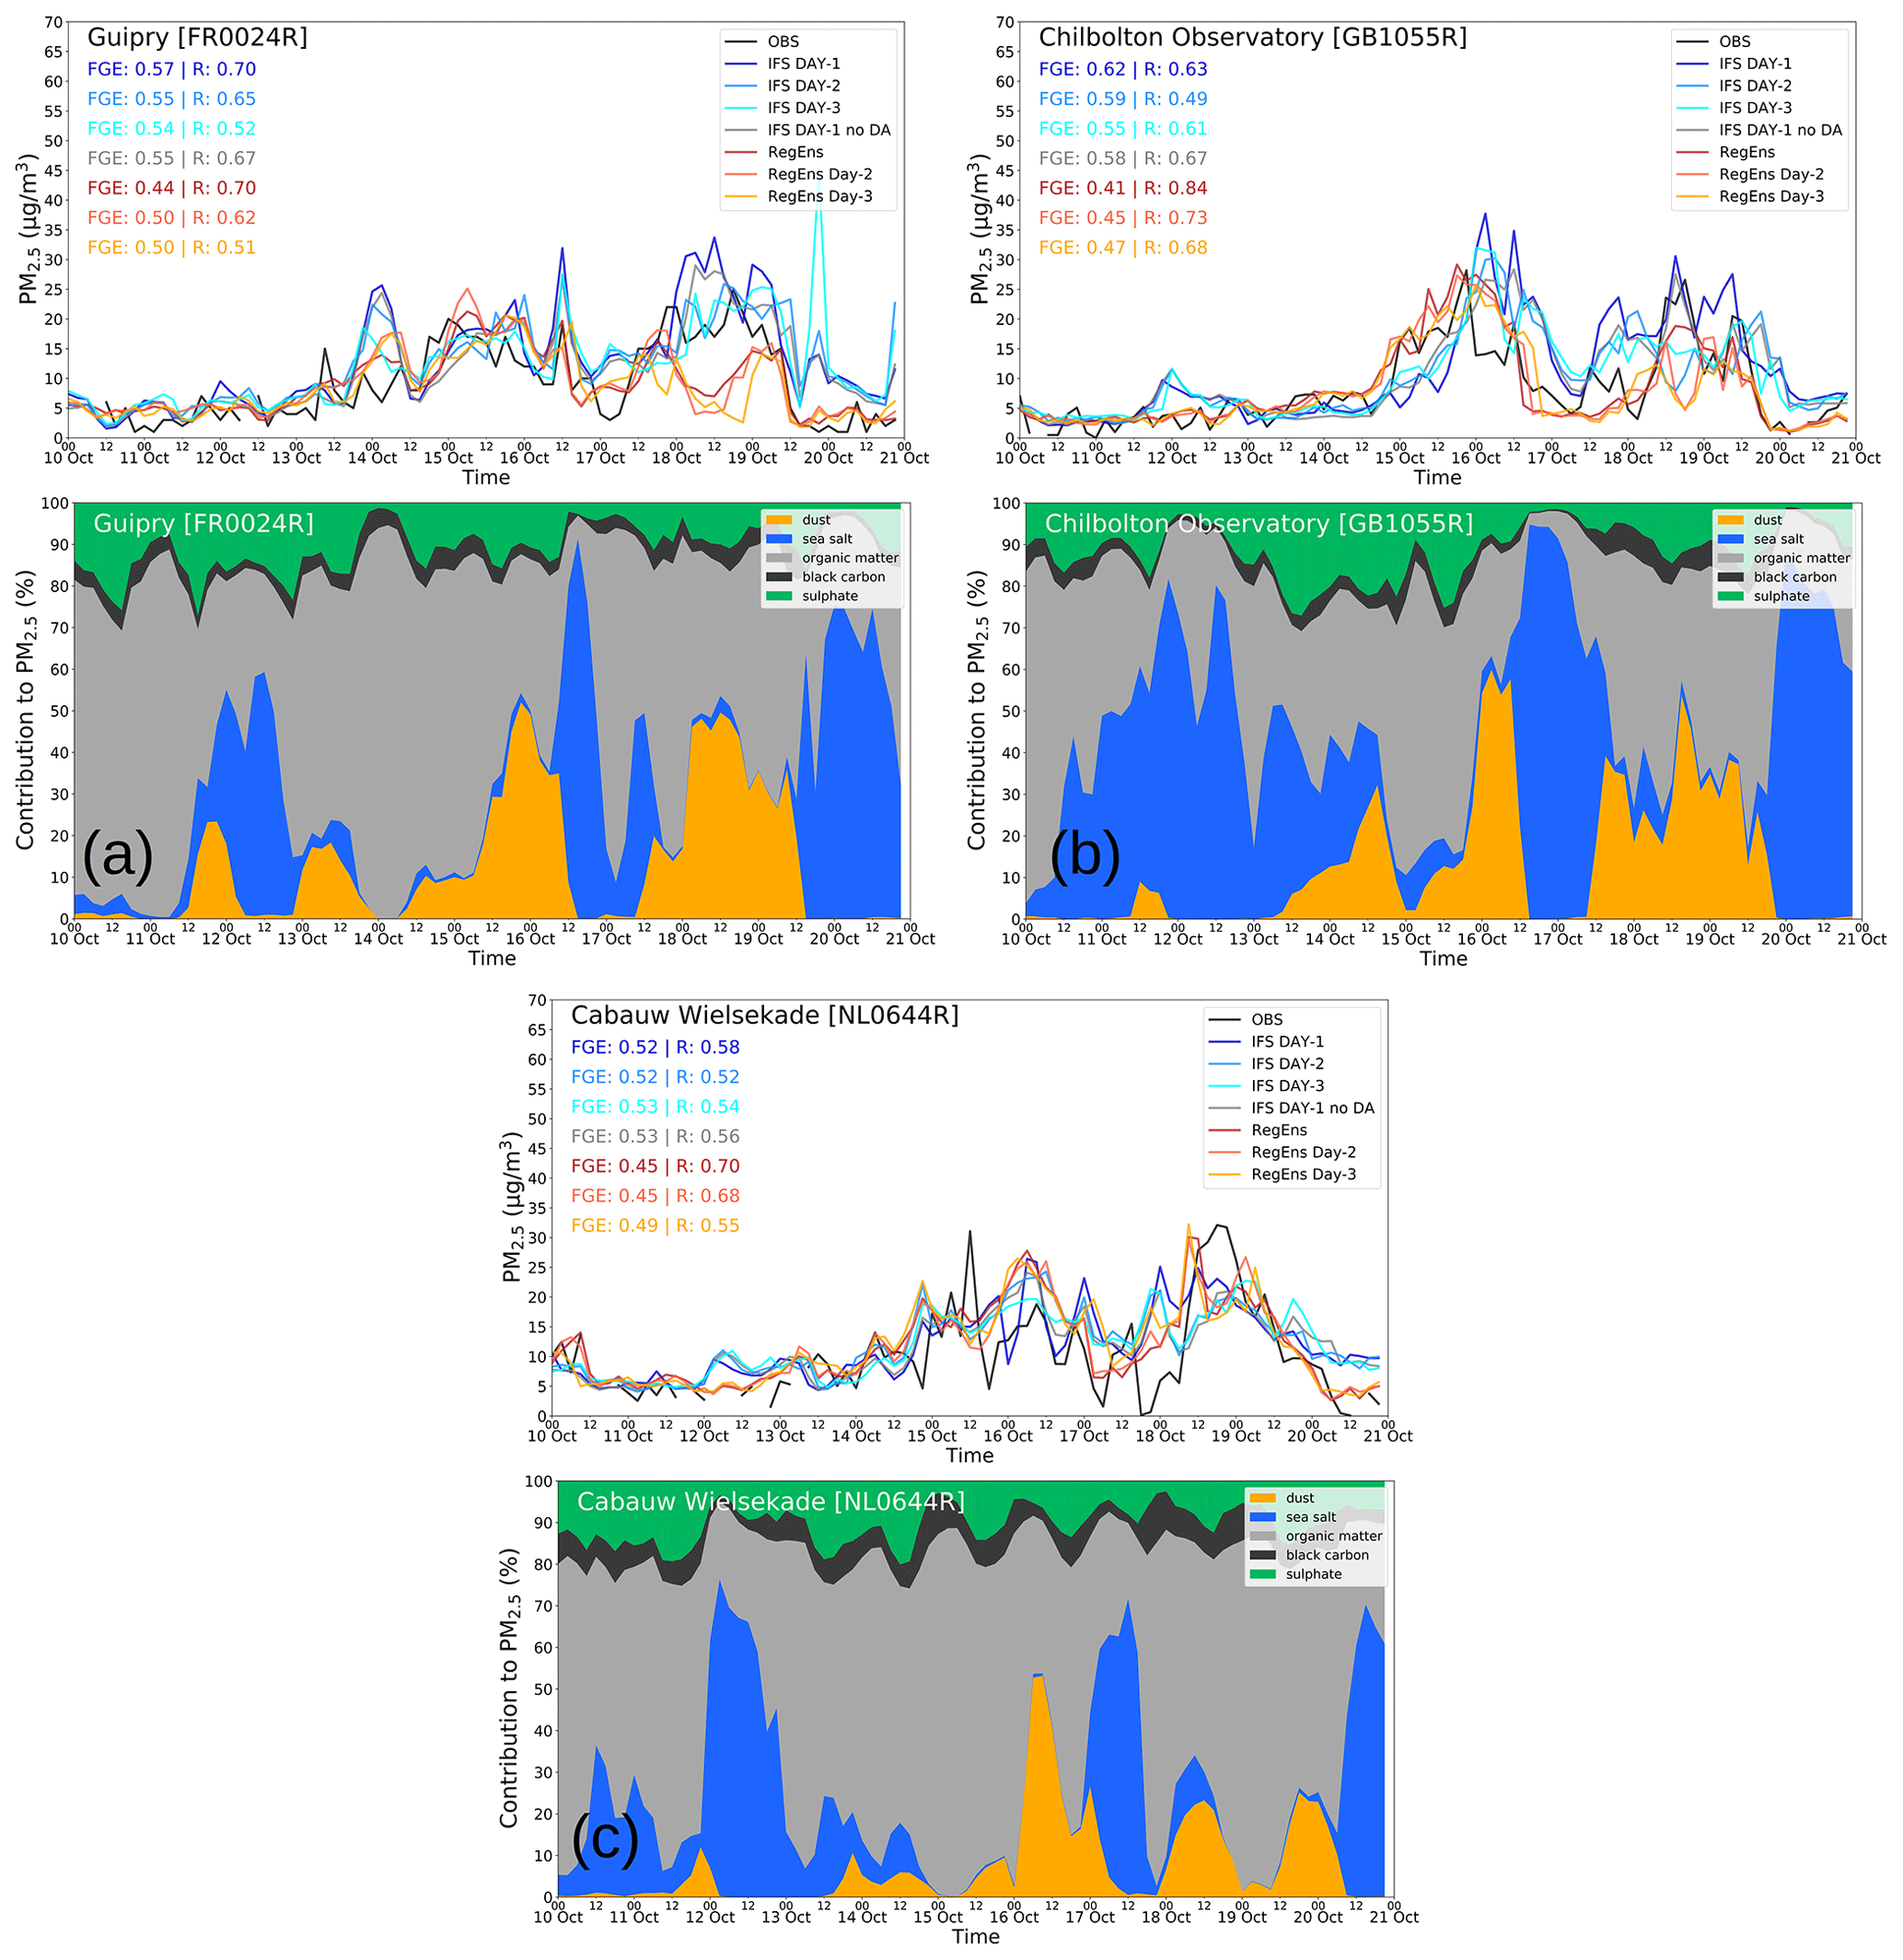
Figure 10Observed (black), IFS (blue), IFS day-2 (light blue), IFS day-3 (aqua), IFS no DA (grey), RegEns (red), RegEns day-2 (light red) and RegEns day-3 (orange) 3-hourly time series of PM2.5 surface concentrations (µg/m3) (top) and percentage (%) contribution of aerosol type to IFS PM2.5 surface concentrations (bottom) for Guipry (FR0024R), France (a); Chilbolton Observatory (GB1055R), Great Britain (b); and Cabauw Wielsekade (NL0644R), the Netherlands (c).
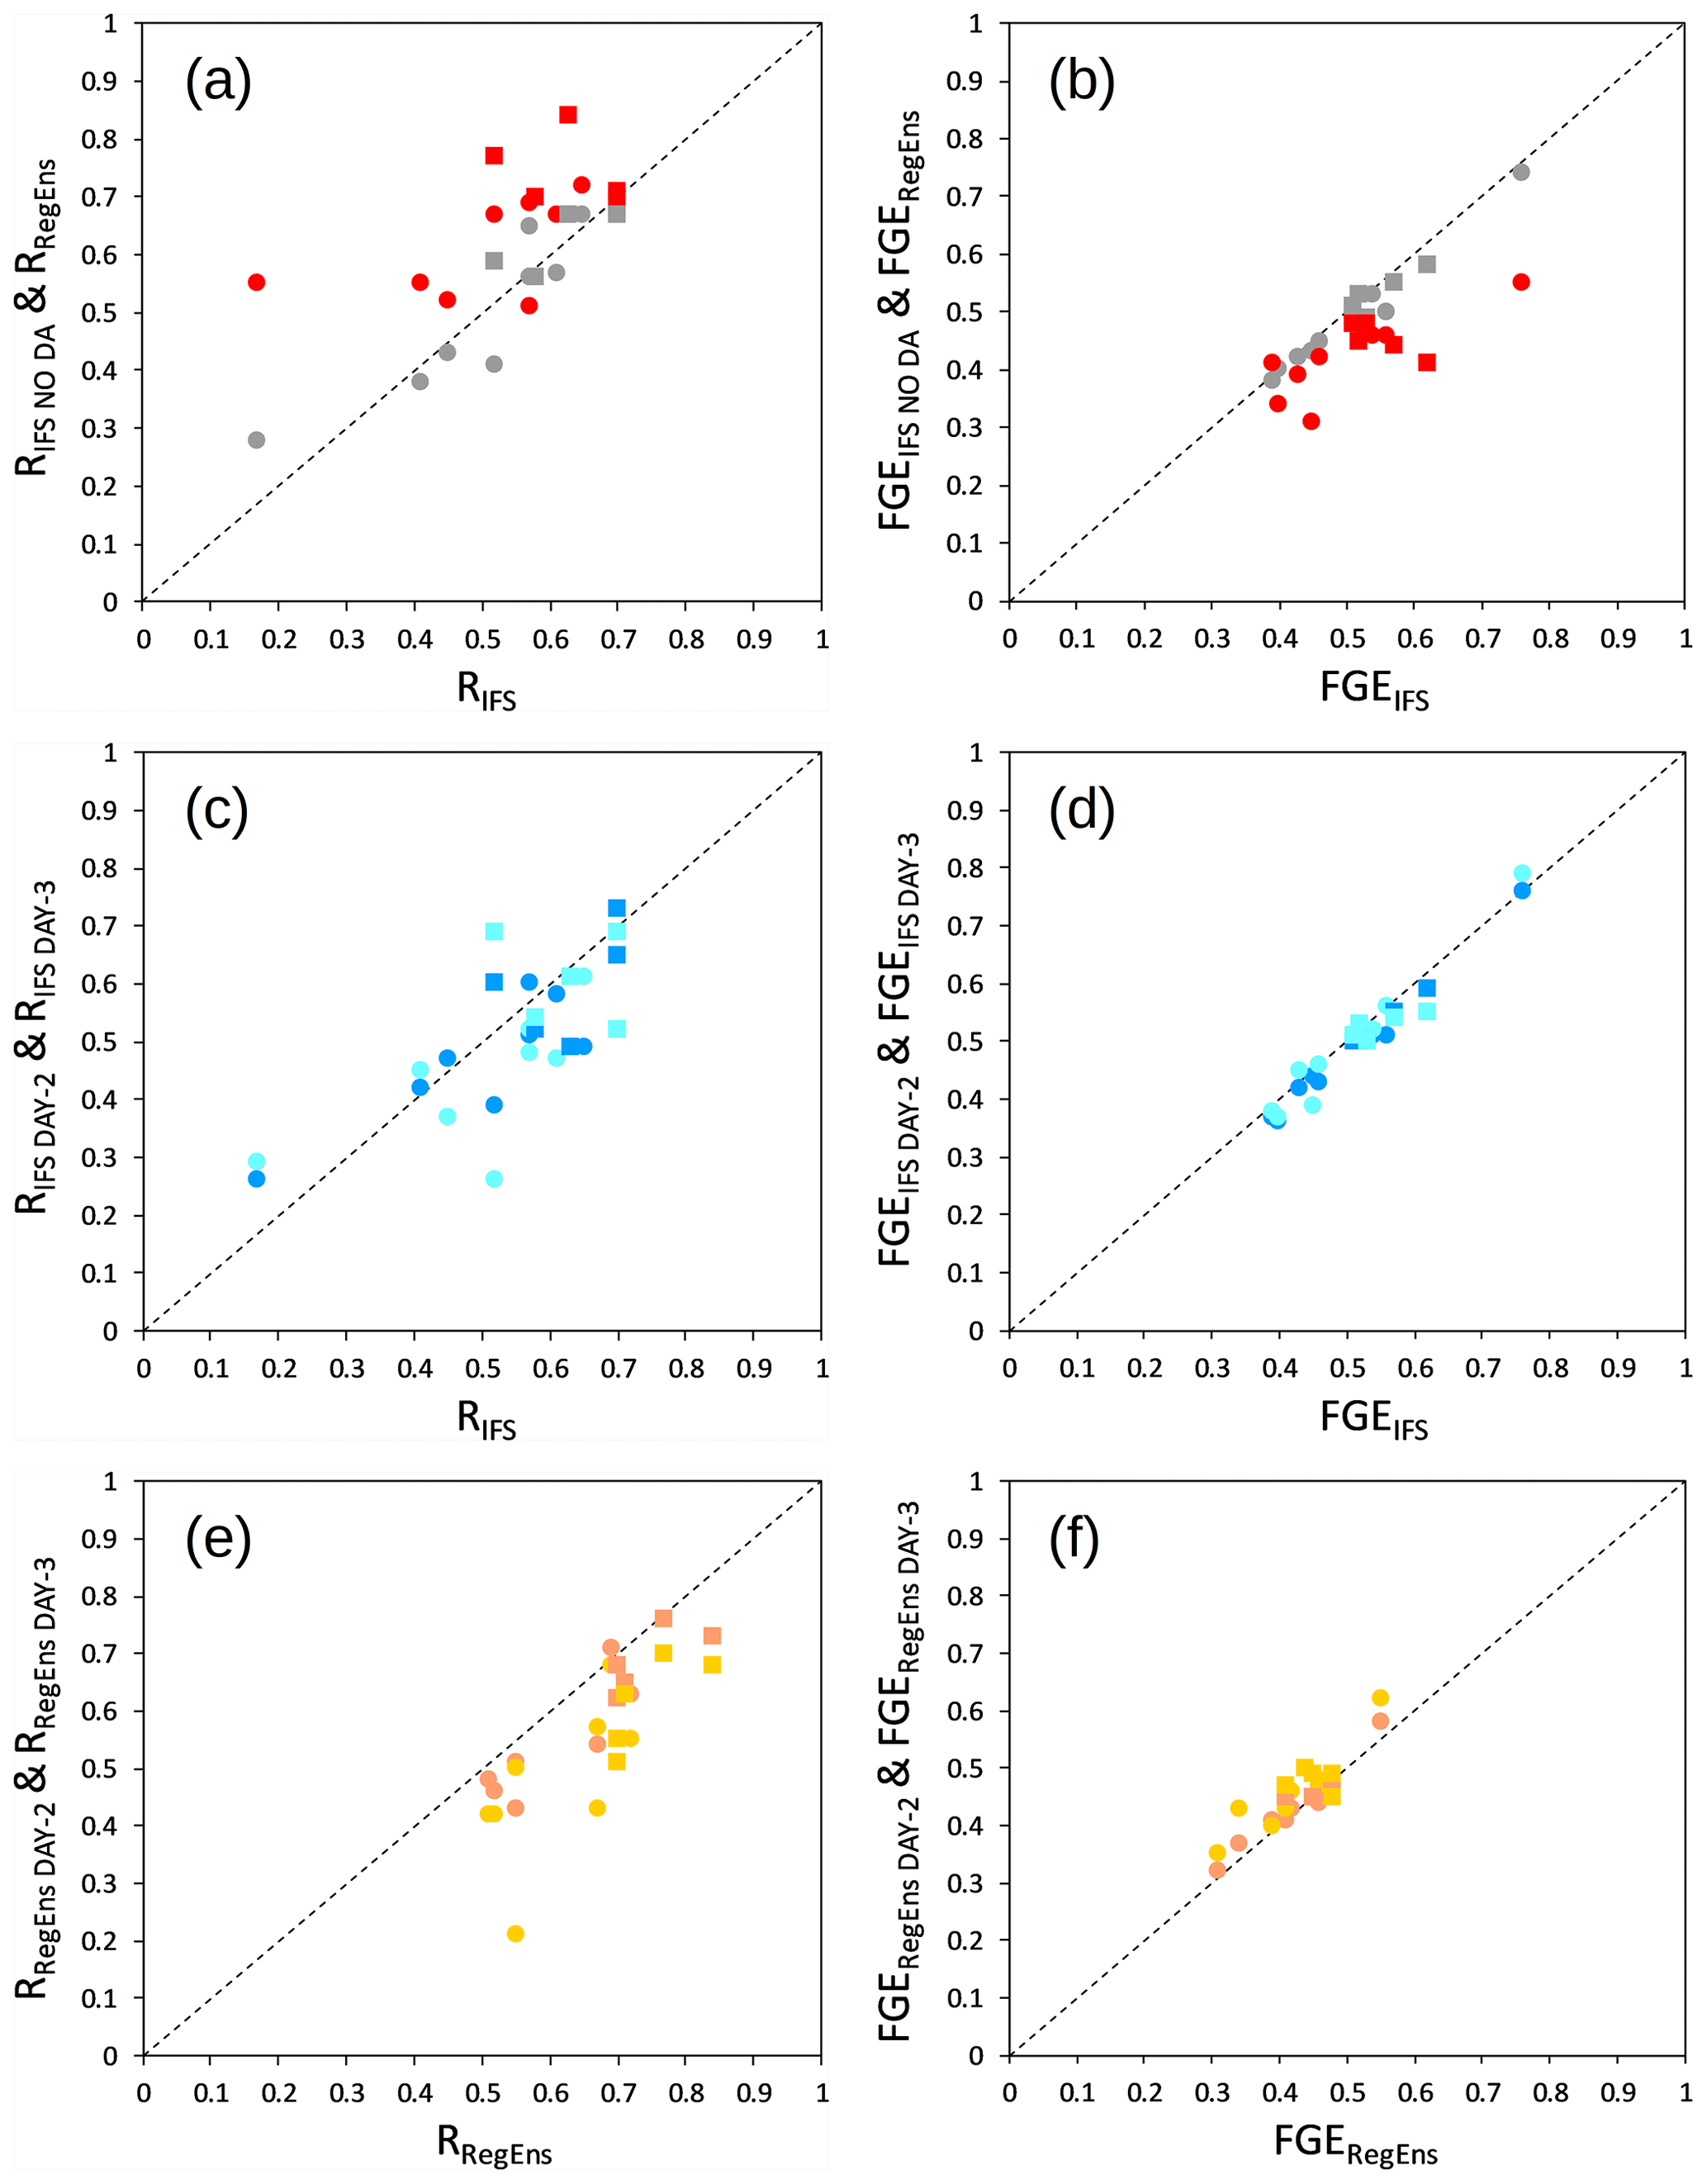
Figure 11(a) Comparison between the correlation coefficients IFS vs. OBS (observations) (RIFS) and IFS no DA vs. OBS (RIFS NO DA) (grey symbols), as well as between IFS vs. OBS (RIFS) and RegEns vs. OBS (RRegEns) (red symbols) for PM10 (circles) and PM2.5 (squares). (b) Same as (a) but for FGE. (c) Comparison between the correlation coefficients IFS vs. OBS (RIFS) and IFS DAY-2 vs. OBS (RIFS DAY-2) (light blue symbols), as well as between IFS vs. OBS (RIFS) and IFS DAY-3 vs. OBS (RIFS DAY-3) (aqua symbols) for PM10 (circles) and PM2.5 (squares). (d) Same as (c) but for FGE. (e) Comparison between the correlation coefficients RegEns vs. OBS (RRegEns) and RegEns DAY-2 vs. OBS (RRegEns DAY-2) (light red symbols), as well as between RegEns vs. OBS (RRegEns) and RegEns DAY-3 vs. OBS (RRegEns DAY-3) (orange symbols) for PM10 (circles) and PM2.5 (squares). (f) Same as (e) but for FGE. The results for PM10 (PM2.5) are obtained from the eight (five) EMEP stations described in Table 1.
To evaluate the CAMS forecast systems and the role of data assimilation in reproducing the enhancements in surface PM10 and PM2.5 concentrations, we employ ground-based measurements from the EMEP network from eight rural stations (see Table 1 for further info and Fig. 8d for station locations) for intercomparison. For brevity, only the results from three EMEP stations are presented (Guipry FR0024R, France; Chilbolton Observatory GB1055R, Great Britain; and Cabauw Wielsekade NL0644R, the Netherlands), while results for the rest of the stations are provided in the Supplement. Figure 8 presents the PM10 surface concentrations from observations, IFS (day-1 to day-3 forecasts), IFS without data assimilation and RegEns (day-1 to day-3 forecasts), along with the percentage (%) contribution of each aerosol type to IFS PM10 surface concentrations, during the time period from 10 October 2017 to 20 October 2017. At Guipry (France), after 12:00 Z on 14 October and up to 16 October, an increase in PM10 surface concentrations is observed, which is also seen in IFS and RegEns; however, the early peak in observations is not captured by the CAMS forecast systems (Fig. 8a, top). The percentage contribution of each IFS aerosol type to IFS PM10 concentrations indicates that the enhancement in PM10 surface levels is initially (00:00 Z on 15 October) due to organic matter aerosols (∼75 %), probably related to transported smoke from fires burning over the Iberian Peninsula (visual inspection of MODIS Fires and Thermal Anomalies product; source: NASA, 2020), while afterwards (21:00 Z on 15 October) the transport of dust induces a significant contribution from dust aerosols (∼53 %) as well (Fig. 8a, bottom). At 12:00 Z on 16 October a sharp peak is depicted in observed PM10 concentrations reproduced from both IFS and RegEns (yet overestimated from IFS) which seems to result from sea salt transport from the west and south of Ophelia (see flow at 850 hPa in Fig. i). IFS exhibits an increase in PM10 levels at 12:00 Z on 18 October due to dust and organic matter aerosols which are not seen in RegEns or observations. Similar performance for CAMS forecast systems is obtained for PM2.5 over Guipry, except that the peak on 18 October in IFS is also confirmed from observations but to a lesser extent (Fig. 9a). Further north and over Chilbolton Observatory (Great Britain), after 15:00 Z on 15 October, the observed PM10 surface concentrations increase up to 38 µg/m3, with IFS peaking with a 6 h delay (Fig. 8b, top) mostly due to dust and organic matter aerosols (Fig. 8b, bottom). The secondary peak seen in observations at 12:00 Z on 16 October is synchronously captured by RegEns and IFS, with IFS clearly overestimating it. A second wave of dust and biomass burning aerosols is affecting PM10 surface concentrations over the site at 15:00 Z on 18 October as revealed from IFS, which is in agreement with observations but not seen in RegEns. Regarding PM2.5, there is a similar level of agreement with that of PM10 between the CAMS forecast systems and the observations (Fig. 9b). Finally, over Cabauw Wielsekade (the Netherlands), the observed PM10 surface concentrations exhibit a more noisy structure, with CAMS forecast systems reproducing only the general pattern of variability, missing the observed peaks at 15:00 Z on 17 and 18 October (Fig. 8c). Similarly for PM2.5, where the observed peaks are more clear, IFS and RegEns capture the big picture of PM2.5 increases (Fig. 9c). Results for the remaining five EMEP stations are provided in Figs. S2 and S3 in the Supplement. Overall, RegEns exhibits a better performance in terms of temporal variability and bias compared to IFS. As depicted from the scatter plot in Fig. 10a, the correlation coefficient of RegEns with observations is higher compared to that of IFS with observations (red points mostly lie above the dashed line of Fig. 10a), while the FGE values for RegEns are lower with respect to that of IFS (red points lie below the dashed line of Fig. 10b). Concerning the impact of data assimilation on IFS forecast of near-surface particulate matter, as it is depicted in Fig. 10, there is no clear improvement in bias nor in the representation of the temporal variability. It is likely that the assimilation of total-column AOD does not have a strong impact on surface-layer concentrations, especially in regions with significant surface fluxes.
The capability of IFS and RegEns systems to forecast the observed PM10 and PM2.5 surface concentrations 2 and 3 d in advance is finally discussed. As depicted in Fig. 8, IFS day-2 and day-3 forecasts reproduce the distinct increases in observed PM10 surface concentrations exhibiting similar FGE values but lower correlation scores (in most of the stations) compared to day-1 forecast (Fig. 10c and d). The same applies in the case of PM2.5 (Fig. 9), except that the correlation scores for IFS day-2 and day-3 forecasts are not systematically lower than that of the day-1 forecast (Fig. 10c and d). For RegEns, although it predicts the observed peaks in PM10 and PM2.5 fairly well up to 3 d in advance (Fig. 8 and 9), there is a systematic deterioration of its performance in terms of temporal variability over forecast time. More specifically, the correlation coefficient decreases from day-1 to day-2 forecast and from day-2 to day-3 forecast for almost all examined stations (Fig. 10e).
The main objectives of this work were to analyse a complex case study of aerosol transport over Europe driven by Storm Ophelia in mid-October 2017 in CAMS forecast systems and to assess their performance with respect to aerosol atmospheric composition and air quality. To this end, CAMS forecast data were used along with satellite and ground-based observations. The most notable findings of this work can be summarized as follows:
-
African dust aerosols were transported towards northwestern Europe on the east side of Storm Ophelia, forming an extended dust plume reaching the Baltic states. On its passage, Ophelia lifted and drifted smoke aerosols from fires burning over the Iberian Peninsula, carrying them over several European areas such as France, Great Britain and the Netherlands. After 00:00 Z on 16 October, dust/smoke aerosols are found on the warm/cold fronts of Ophelia, being transported within its warm sector.
-
The dependent evaluation against MODIS satellite observations reveals a satisfactory agreement with the CAMS global AOD550 (R=0.77 and FGE=0.4), while the comparison against the IFS-no-DA simulation indicates an improvement of IFS performance in forecasting AOD550 (R increases from 0.72 to 0.77, and FGE decreases from 0.59 to 0.4), due to the application of data assimilation.
-
The speciation of IFS AOD550 fields indicates that African dust, organic matter from Iberian biomass burning and sea salt sprayed in the vicinity of Ophelia are the major aerosol contributors to the plume of high AOD550.
-
The CALIOP/CALIPSO and the spatially and temporally co-located IFS cross sections of dominant aerosol types reveal a good qualitative performance of IFS, as it generally manages to reproduce the type and location of aerosols during the passage of Ophelia.
-
In terms of air quality, comparison with ground-based measurements from EMEP stations reveals that both IFS and RegEns are able to reproduce the observed signal of increase in PM10 and PM2.5 surface concentrations yet exhibiting several inconsistencies on the quantitative and temporal representation of the observed peaks.
-
For the examined event, the CAMS regional system seems to better predict the 3 h PM10 and PM2.5 surface concentrations compared to the CAMS global system, with an increase (decrease) of the correlation coefficient (FGE) values in all examined stations for PM10 (except Cabauw Wielsekade) and PM2.5, respectively.
-
In regards to the role of data assimilation, even though it improves the CAMS global forecast performance for AOD, there is no such indication for particulate matter near the surface.
-
A deterioration of the RegEns forecast performance is found over forecast time for both PM10 and PM2.5, characterized by a decrease in the correlation coefficient for the vast majority of the examined stations, which is partially seen in IFS for the case of PM10.
To summarize, the current analysis and evaluation study highlights that the CAMS global forecast system is able to forecast the observed aerosol loadings over Europe induced by the transport of dust, biomass burning and sea salt aerosols by the passage of Storm Ophelia in mid-October 2017. Forecasting coarse and fine particulate matter surface concentrations during Ophelia turns out to be more challenging, yet the CAMS global and regional systems exhibit a reasonable performance, which are clearly open to further improvement and development in the direction of supporting social, economic and health policies.
CAMS global (IFS) forecast: the data can be obtained from ECMWF's web repository https://apps.ecmwf.int/datasets/data/cams-nrealtime/levtype=sfc/ (ECMWF, 2020b) and through the corresponding WebAPI. CAMS global (IFS) forecast without data assimilation: the data can be requested from the Copernicus user support (copernicus-support@ecmwf.int). CAMS regional forecast: the data are available from Dimitris Akritidis upon request (dakritid@geo.auth.gr). EMEP observations: the data are available from the EBAS database http://ebas.nilu.no (EBAS, 2020). Level-2 MODIS Terra and Aqua Collection 6.1: the data are publicly available through NASA's Goddard Space Flight Center (GSFC) Level-1 and Atmosphere Archive and Distribution System (LAADS; https://ladsweb.modaps.eosdis.nasa.gov/, LAADS, 2020). Level-2 CALIPSO 5 km profile product version 4.20: the data are publicly available from NASA's Langley Research Center Atmospheric Science Data Center via https://search.earthdata.nasa.gov/search (EARTHDATA, 2020).
The supplement related to this article is available online at: https://doi.org/10.5194/acp-20-13557-2020-supplement.
DA designed the study, performed the analysis and wrote the paper. AKG provided the MODIS Terra and Aqua satellite data, and the CALIOP/CALIPSO satellite data and contributed to the analysis and writing of the paper. All authors contributed to reviewing and editing of the article and interpretation of the results. JF provided the IFS control simulation without the use of data assimilation. HE is coordinating CAMS84 (global and regional a posteriori evaluation and quality assurance). EK is the principal investigator and coordinates the contribution of Aristotle University of Thessaloniki in CAMS84.
The authors declare that they have no conflict of interest.
This work is performed within the framework of the service element “CAMS84: Global and regional a posteriori evaluation and quality assurance” of the Copernicus Atmosphere Monitoring Service (CAMS). ECMWF is the operator of CAMS on behalf of the European Union. The CAMS84 work is financially supported by ECMWF via its main contractor, Royal Netherlands Meteorological Institute (KNMI). NASA Goddard Space Flight Center (GSFC) Level-1 and Atmosphere Archive and Distribution System (LAADS) (LAADS, 2020) is acknowledged for making available the level-2 MODIS Terra and Aqua Collection 6.1 aerosol datasets. In addition, the Atmospheric Science Data Center (ASDC) at NASA Langley Research Center (LaRC) is acknowledged for the data processing and distribution of the CALIPSO data used here (EARTHDATA, 2020). Also acknowledged is the European Monitoring and Evaluation Programme (EMEP) (EMEP, 2020) for distributing the near-surface PM10 and PM2.5 concentration data. We acknowledge the use of imagery from the NASA Worldview application (NASA, 2020), which is part of the NASA Earth Observing System Data and Information System (EOSDIS). AUTH (Aristotle University of Thessaloniki) authors acknowledge the support of the scientific computing services of the AUTH IT Center (AUTHIT, 2020). Finally, Dimitris Akritidis would like to acknowledge the free use of Python (Python, 2020) and Ferret (Ferret, 2020) software for the analysis and graphics of the paper.
This research has been supported by the Royal Netherlands Meteorological Institute (KNMI).
This paper was edited by Stelios Kazadzis and reviewed by three anonymous referees.
Akritidis, D., Katragkou, E., Zanis, P., Pytharoulis, I., Melas, D., Flemming, J., Inness, A., Clark, H., Plu, M., and Eskes, H.: A deep stratosphere-to-troposphere ozone transport event over Europe simulated in CAMS global and regional forecast systems: analysis and evaluation, Atmos. Chem. Phys., 18, 15515–15534, https://doi.org/10.5194/acp-18-15515-2018, 2018. a
Albrecht, B. A.: Aerosols, Cloud Microphysics, and Fractional Cloudiness, Science, 245, 1227–1230, https://doi.org/10.1126/science.245.4923.1227, 1989. a
Amiridis, V., Balis, D. S., Giannakaki, E., Stohl, A., Kazadzis, S., Koukouli, M. E., and Zanis, P.: Optical characteristics of biomass burning aerosols over Southeastern Europe determined from UV-Raman lidar measurements, Atmos. Chem. Phys., 9, 2431–2440, https://doi.org/10.5194/acp-9-2431-2009, 2009. a
Ansmann, A., Bösenberg, J., Chaikovsky, A., Comerón, A., Eckhardt, S., Eixmann, R., Freudenthaler, V., Ginoux, P., Komguem, P., Linné, H., Ángel López Márquez, M., Matthias, V., Mattis, I., Mitev, V., Müller, D., Music, S., Nickovic, S., Pelon, J., Sauvage, L., Sobolewsky, P., Srivastava, M. K., Stohl, A., Torres, O., Vaughan, G., Wandinger, U., and Wiegner, M.: Long-range transport of Saharan dust to northern Europe: the 11–16 October 2001 outbreak with EARLINET, J. Geophys. Res., 108, 4783, https://doi.org/10.1029/2003JD003757, 2003. a, b
AUTHIT: IT Center of AUTh, available at: http://it.auth.gr, last access: 9 September 2020. a
Baklanov, A., Schlünzen, K., Suppan, P., Baldasano, J., Brunner, D., Aksoyoglu, S., Carmichael, G., Douros, J., Flemming, J., Forkel, R., Galmarini, S., Gauss, M., Grell, G., Hirtl, M., Joffre, S., Jorba, O., Kaas, E., Kaasik, M., Kallos, G., Kong, X., Korsholm, U., Kurganskiy, A., Kushta, J., Lohmann, U., Mahura, A., Manders-Groot, A., Maurizi, A., Moussiopoulos, N., Rao, S. T., Savage, N., Seigneur, C., Sokhi, R. S., Solazzo, E., Solomos, S., Sørensen, B., Tsegas, G., Vignati, E., Vogel, B., and Zhang, Y.: Online coupled regional meteorology chemistry models in Europe: current status and prospects, Atmos. Chem. Phys., 14, 317–398, https://doi.org/10.5194/acp-14-317-2014, 2014. a
BBC: Hurricane Ophelia: Three people die as storm hits Ireland, available at: https://www.bbc.com/news/uk-41627442 (last access: 9 September 2020), 2017. a
Beattie, N. S., Moir, R. S., Chacko, C., Buffoni, G., Roberts, S. H., and Pearsall, N. M.: Understanding the effects of sand and dust accumulation on photovoltaic modules, Renew. Energ., 48, 448–452, https://doi.org/10.1016/j.renene.2012.06.007, 2012. a
Benedetti, A., Morcrette, J.-J., Boucher, O., Dethof, A., Engelen, R. J., Fisher, M., Flentje, H., Huneeus, N., Jones, L., Kaiser, J. W., Kinne, S., Mangold, A., Razinger, M., Simmons, A. J., Suttie, M., and the GEMS-AER team: Aerosol analysis and forecast in the European Centre for Medium-Range Weather Forecasts Integrated Forecast System: 2. Data Assimilation, J. Geophys. Res., 114, D13205, https://doi.org/10.1029/2008JD011115, 2009. a
Boucher, O.: Atmospheric Aerosols, pp. 9–24, Springer Netherlands, Dordrecht, https://doi.org/10.1007/978-94-017-9649-1_2, 2015. a
Burnett, R., Chen, H., Szyszkowicz, M., Fann, N., Hubbell, B., Pope, C. A., Apte, J. S., Brauer, M., Cohen, A., Weichenthal, S., Coggins, J., Di, Q., Brunekreef, B., Frostad, J., Lim, S. S., Kan, H., Walker, K. D., Thurston, G. D., Hayes, R. B., Lim, C. C., Turner, M. C., Jerrett, M., Krewski, D., Gapstur, S. M., Diver, W. R., Ostro, B., Goldberg, D., Crouse, D. L., Martin, R. V., Peters, P., Pinault, L., Tjepkema, M., van Donkelaar, A., Villeneuve, P. J., Miller, A. B., Yin, P., Zhou, M., Wang, L., Janssen, N. A. H., Marra, M., Atkinson, R. W., Tsang, H., Quoc Thach, T., Cannon, J. B., Allen, R. T., Hart, J. E., Laden, F., Cesaroni, G., Forastiere, F., Weinmayr, G., Jaensch, A., Nagel, G., Concin, H., and Spadaro, J. V.: Global estimates of mortality associated with long-term exposure to outdoor fine particulate matter, P. Natl. Acad. Sci., 115, 9592–9597, https://doi.org/10.1073/pnas.1803222115, 2018. a
CAMS: Copernicus Atmosphere Monitoring Service Homepage, available at: https://atmosphere.copernicus.eu (last access: 9 September 2020), 2020a. a, b
CAMS: European air quality, available at: http://macc-raq-op.meteo.fr (last access: 9 September 2020), 2020b. a
CAMS: Regional air quality production systems, available at: https://atmosphere.copernicus.eu/documentation-regional-systems (last access: 9 September 2020), 2020c. a
Christensen, J.: The Danish Eulerian Hemispheric Model – a Three-Dimensional Air Pollution Model Used for the Arctic, Atmos. Environ., 31, 4169–4191, 1997. a
Copernicus: Copernicus Homepage, available at: https://www.copernicus.eu, last access: 9 September 2020. a
EARTHDATA: Earthdata Search, available at: https://search.earthdata.nasa.gov/search, last access: 9 September 2020. a, b
EBAS: EBAS database, available at: http://ebas.nilu.no, last access: 9 September 2020. a, b
ECMWF: PM10 and PM25 global products, available at: https://confluence.ecmwf.int/pages/viewpage.action?pageId=153393481 (last access: 9 September 2020), 2020a. a
ECMWF: ECMWF | CAMS Near-real-time, available at: https://apps.ecmwf.int/datasets/data/cams-nrealtime/levtype=sfc/, last access: 10 November 2020b. a
EMEP: European Monitoring and Evaluation Programme, available at: https://www.emep.int/, last access: 9 September 2020. a
EUMETSAT: Validation of the Polar Multi-Sensor Aerosol product (PMAp) Study, available at: https://www.eumetsat.int/website/home/Data/ScienceActivities/ScienceStudies/ValidationofthePolarMultiSensorAerosolproductPMApStudy/index.html, last access: 9 September 2020. a
Ferret: Data Visualization and Analysis, available at: https://ferret.pmel.noaa.gov/Ferret/, last access: 9 September 2020. a
Flemming, J., Huijnen, V., Arteta, J., Bechtold, P., Beljaars, A., Blechschmidt, A.-M., Diamantakis, M., Engelen, R. J., Gaudel, A., Inness, A., Jones, L., Josse, B., Katragkou, E., Marecal, V., Peuch, V.-H., Richter, A., Schultz, M. G., Stein, O., and Tsikerdekis, A.: Tropospheric chemistry in the Integrated Forecasting System of ECMWF, Geosci. Model Dev., 8, 975–1003, https://doi.org/10.5194/gmd-8-975-2015, 2015. a, b
Georgoulias, A. K., Alexandri, G., Kourtidis, K. A., Lelieveld, J., Zanis, P., Pöschl, U., Levy, R., Amiridis, V., Marinou, E., and Tsikerdekis, A.: Spatiotemporal variability and contribution of different aerosol types to the aerosol optical depth over the Eastern Mediterranean, Atmos. Chem. Phys., 16, 13853–13884, https://doi.org/10.5194/acp-16-13853-2016, 2016. a
Georgoulias, A. K., Tsikerdekis, A., Amiridis, V., Marinou, E., Benedetti, A., Zanis, P., Alexandri, G., Mona, L., Kourtidis, K. A., and Lelieveld, J.: A 3-D evaluation of the MACC reanalysis dust product over Europe, northern Africa and Middle East using CALIOP/CALIPSO dust satellite observations, Atmos. Chem. Phys., 18, 8601–8620, https://doi.org/10.5194/acp-18-8601-2018, 2018. a, b
Georgoulias, A. K., Marinou, E., Tsekeri, A., Proestakis, E., Akritidis, D., Alexandri, G., Zanis, P., Balis, D., Marenco, F., Tesche, M., and Amiridis, V.: A First Case Study of CCN Concentrations from Spaceborne Lidar Observations, Remote Sensing, 12, 1557, https://doi.org/10.3390/rs12101557, 2020. a
Gertisser, R.: Eyjafjallajökull volcano causes widespread disruption to European air traffic, Geol. Today, 26, 94–95, https://doi.org/10.1111/j.1365-2451.2010.00757.x, 2010. a, b
Ginoux, P., Prospero, J. M., Gill, T. E., Hsu, N. C., and Zhao, M.: Global-scale attribution of anthropogenic and natural dust sources and their emission rates based on MODIS Deep Blue aerosol products, Rev. Geophys., 50, RG3005, https://doi.org/10.1029/2012RG000388, 2012. a
Guth, J., Josse, B., Marécal, V., Joly, M., and Hamer, P.: First implementation of secondary inorganic aerosols in the MOCAGE version R2.15.0 chemistry transport model, Geosci. Model Dev., 9, 137–160, https://doi.org/10.5194/gmd-9-137-2016, 2016. a
Harrison, R. G., Nicoll, K. A., Marlton, G. J., Ryder, C. L., and Bennett, A. J.: Saharan dust plume charging observed over the UK, Environ. Res. Lett., 13, 054018, https://doi.org/10.1088/1748-9326/aabcd9, 2018. a
Haywood, J. and Boucher, O.: Estimates of the direct and indirect radiative forcing due to tropospheric aerosols: A review, Rev. Geophys., 38, 513–543, https://doi.org/10.1029/1999RG000078, 2000. a
Hsu, N. C., Si-Chee Tsay, King, M. D., and Herman, J. R.: Aerosol properties over bright-reflecting source regions, IEEE T. Geosci. Remote, 42, 557–569, 2004. a
Hsu, N. C., Jeong, M.-J., Bettenhausen, C., Sayer, A. M., Hansell, R., Seftor, C. S., Huang, J., and Tsay, S.-C.: Enhanced Deep Blue aerosol retrieval algorithm: The second generation, J. Geophys. Res.-Atmos., 118, 9296–9315, https://doi.org/10.1002/jgrd.50712, 2013. a
Hunt, W. H., Winker, D. M., Vaughan, M. A., Powell, K. A., Lucker, P. L., and Weimer, C.: CALIPSO Lidar Description and Performance Assessment, J. Atmos. Ocean. Tech., 26, 1214–1228, https://doi.org/10.1175/2009JTECHA1223.1, 2009. a
Inness, A., Blechschmidt, A.-M., Bouarar, I., Chabrillat, S., Crepulja, M., Engelen, R. J., Eskes, H., Flemming, J., Gaudel, A., Hendrick, F., Huijnen, V., Jones, L., Kapsomenakis, J., Katragkou, E., Keppens, A., Langerock, B., de Mazière, M., Melas, D., Parrington, M., Peuch, V. H., Razinger, M., Richter, A., Schultz, M. G., Suttie, M., Thouret, V., Vrekoussis, M., Wagner, A., and Zerefos, C.: Data assimilation of satellite-retrieved ozone, carbon monoxide and nitrogen dioxide with ECMWF's Composition-IFS, Atmos. Chem. Phys., 15, 5275–5303, https://doi.org/10.5194/acp-15-5275-2015, 2015. a, b
Inness, A., Ades, M., Agustí-Panareda, A., Barré, J., Benedictow, A., Blechschmidt, A.-M., Dominguez, J. J., Engelen, R., Eskes, H., Flemming, J., Huijnen, V., Jones, L., Kipling, Z., Massart, S., Parrington, M., Peuch, V.-H., Razinger, M., Remy, S., Schulz, M., and Suttie, M.: The CAMS reanalysis of atmospheric composition, Atmos. Chem. Phys., 19, 3515–3556, https://doi.org/10.5194/acp-19-3515-2019, 2019a. a
Inness, A., Flemming, J., Heue, K.-P., Lerot, C., Loyola, D., Ribas, R., Valks, P., van Roozendael, M., Xu, J., and Zimmer, W.: Monitoring and assimilation tests with TROPOMI data in the CAMS system: near-real-time total column ozone, Atmos. Chem. Phys., 19, 3939–3962, https://doi.org/10.5194/acp-19-3939-2019, 2019b. a
IPCC: Climate Change 2013: The Physical Science Basis, Contribution of Working Group I to the Fifth Assessment Report of the Intergovernmental Panel on Climate Change, Cambridge University Press, Cambridge, United Kingdom and New York, NY, USA, https://doi.org/10.1017/CBO9781107415324, 2013. a
Israelevich, P., Ganor, E., Alpert, P., Kishcha, P., and Stupp, A.: Predominant transport paths of Saharan dust over the Mediterranean Sea to Europe, J. Geophys. Res.-Atmos., 117, D02205, https://doi.org/10.1029/2011JD016482, 2012. a
Kallos, G., Astitha, M., Katsafados, P., and Spyrou, C.: Long-Range Transport of Anthropogenically and Naturally Produced Particulate Matter in the Mediterranean and North Atlantic: Current State of Knowledge, J. Appl. Meteorol. Climatol., 46, 1230–1251, https://doi.org/10.1175/JAM2530.1, 2007. a
Kaminski, J. W., Neary, L., Struzewska, J., McConnell, J. C., Lupu, A., Jarosz, J., Toyota, K., Gong, S. L., Côté, J., Liu, X., Chance, K., and Richter, A.: GEM-AQ, an on-line global multiscale chemical weather modelling system: model description and evaluation of gas phase chemistry processes, Atmos. Chem. Phys., 8, 3255–3281, https://doi.org/10.5194/acp-8-3255-2008, 2008. a
Kaufman, Y. J., Tanré, D., Remer, L. A., Vermote, E. F., Chu, A., and Holben, B. N.: Operational remote sensing of tropospheric aerosol over land from EOS moderate resolution imaging spectroradiometer, J. Geophys. Res.-Atmos., 102, 17051–17067, https://doi.org/10.1029/96JD03988, 1997. a
Kim, M.-H., Omar, A. H., Tackett, J. L., Vaughan, M. A., Winker, D. M., Trepte, C. R., Hu, Y., Liu, Z., Poole, L. R., Pitts, M. C., Kar, J., and Magill, B. E.: The CALIPSO version 4 automated aerosol classification and lidar ratio selection algorithm, Atmos. Meas. Tech., 11, 6107–6135, https://doi.org/10.5194/amt-11-6107-2018, 2018. a, b
Knorr, W., Dentener, F., Lamarque, J.-F., Jiang, L., and Arneth, A.: Wildfire air pollution hazard during the 21st century, Atmos. Chem. Phys., 17, 9223–9236, https://doi.org/10.5194/acp-17-9223-2017, 2017. a
Koch, D. and Del Genio, A. D.: Black carbon semi-direct effects on cloud cover: review and synthesis, Atmos. Chem. Phys., 10, 7685–7696, https://doi.org/10.5194/acp-10-7685-2010, 2010. a
LAADS: LAADS DAAC, available at: https://ladsweb.modaps.eosdis.nasa.gov/, last access: 9 September 2020. a, b
Lelieveld, J., Evans, J. S., Fnais, M., Giannadaki, D., and Pozzer, A.: The contribution of outdoor air pollution sources to premature mortality on a global scale, Nature, 525, 367–371, https://doi.org/10.1038/nature15371, 2015. a
Lelieveld, J., Klingmüller, K., Pozzer, A., Pöschl, U., Fnais, M., Daiber, A., and Münzel, T.: Cardiovascular disease burden from ambient air pollution in Europe reassessed using novel hazard ratio functions, European Heart Journal, 40, 1590–1596, https://doi.org/10.1093/eurheartj/ehz135, 2019. a
Levy, R. C., Mattoo, S., Munchak, L. A., Remer, L. A., Sayer, A. M., Patadia, F., and Hsu, N. C.: The Collection 6 MODIS aerosol products over land and ocean, Atmos. Meas. Tech., 6, 2989–3034, https://doi.org/10.5194/amt-6-2989-2013, 2013. a, b
Li, X., Wagner, F., Peng, W., Yang, J., and Mauzerall, D. L.: Reduction of solar photovoltaic resources due to air pollution in China, P. Natl. Acad. Sci., 114, 11867–11872, https://doi.org/10.1073/pnas.1711462114, 2017. a
Lohmann, U. and Feichter, J.: Global indirect aerosol effects: a review, Atmos. Chem. Phys., 5, 715–737, https://doi.org/10.5194/acp-5-715-2005, 2005. a
Manders, A. M. M., Builtjes, P. J. H., Curier, L., Denier van der Gon, H. A. C., Hendriks, C., Jonkers, S., Kranenburg, R., Kuenen, J. J. P., Segers, A. J., Timmermans, R. M. A., Visschedijk, A. J. H., Wichink Kruit, R. J., van Pul, W. A. J., Sauter, F. J., van der Swaluw, E., Swart, D. P. J., Douros, J., Eskes, H., van Meijgaard, E., van Ulft, B., van Velthoven, P., Banzhaf, S., Mues, A. C., Stern, R., Fu, G., Lu, S., Heemink, A., van Velzen, N., and Schaap, M.: Curriculum vitae of the LOTOS–EUROS (v2.0) chemistry transport model, Geosci. Model Dev., 10, 4145–4173, https://doi.org/10.5194/gmd-10-4145-2017, 2017. a
Markowicz, K., Chilinski, M., Lisok, J., Zawadzka, O., Stachlewska, I., Janicka, L., Rozwadowska, A., Makuch, P., Pakszys, P., Zielinski, T., Petelski, T., Posyniak, M., Pietruczuk, A., Szkop, A., and Westphal, D.: Study of aerosol optical properties during long-range transport of biomass burning from Canada to Central Europe in July 2013, J. Aerosol Sci., 101, 156–173, https://doi.org/10.1016/j.jaerosci.2016.08.006, 2016. a
Memmesheimer, M., Friese, E., Ebel, A., Jakobs, H., Feldmann, H., Kessler, C., and Piekorz, G.: Long-term simulations of particulate matter in Europe on different scales using sequential nesting of a regional model, International J. Environ. Pollut., 22, 108–132, 2004. a
Menut, L., Bessagnet, B., Khvorostyanov, D., Beekmann, M., Blond, N., Colette, A., Coll, I., Curci, G., Foret, G., Hodzic, A., Mailler, S., Meleux, F., Monge, J.-L., Pison, I., Siour, G., Turquety, S., Valari, M., Vautard, R., and Vivanco, M. G.: CHIMERE 2013: a model for regional atmospheric composition modelling, Geosci. Model Dev., 6, 981–1028, https://doi.org/10.5194/gmd-6-981-2013, 2013. a
Morcrette, J.-J., Boucher, O., Jones, L., Salmond, D., Bechtold, P., Beljaars, A., Benedetti, A., Bonet, A., Kaiser, J. W., Razinger, M., Schulz, M., Serrar, S., Simmons, A. J., Sofiev, M., Suttie, M., Tompkins, A. M., and Untch, A.: Aerosol analysis and forecast in the European Centre for Medium-Range Weather Forecasts Integrated Forecast System: forward modeling, J. Geophys. Res., 114, D06206, https://doi.org/10.1029/2008JD011235, 2009. a
NASA: EOSDIS Worldview, available at: https://worldview.earthdata.nasa.gov, last access: 9 September 2020. a, b
NLTIMES: Hurricane Ophelia, Spain forest fires turns sun fireball orange in Netherlands skies, available at: https://nltimes.nl/2017/10/17/hurricane-ophelia-spain-forest-fires-turns-sun-fireball-orange-netherlands-skies (last access: 9 September 2020), 2017. a
Omar, A. H., Winker, D. M., Vaughan, M. A., Hu, Y., Trepte, C. R., Ferrare, R. A., Lee, K.-P., Hostetler, C. A., Kittaka, C., Rogers, R. R., Kuehn, R. E., and Liu, Z.: The CALIPSO Automated Aerosol Classification and Lidar Ratio Selection Algorithm, J. Atmos. Ocean. Tech., 26, 1994–2014, https://doi.org/10.1175/2009JTECHA1231.1, 2009. a
Osborne, M., Malavelle, F. F., Adam, M., Buxmann, J., Sugier, J., Marenco, F., and Haywood, J.: Saharan dust and biomass burning aerosols during ex-hurricane Ophelia: observations from the new UK lidar and sun-photometer network, Atmos. Chem. Phys., 19, 3557–3578, https://doi.org/10.5194/acp-19-3557-2019, 2019. a, b
Penning de Vries, M. J. M., Beirle, S., Hörmann, C., Kaiser, J. W., Stammes, P., Tilstra, L. G., Tuinder, O. N. E., and Wagner, T.: A global aerosol classification algorithm incorporating multiple satellite data sets of aerosol and trace gas abundances, Atmos. Chem. Phys., 15, 10597–10618, https://doi.org/10.5194/acp-15-10597-2015, 2015. a
Pey, J., Querol, X., Alastuey, A., Forastiere, F., and Stafoggia, M.: African dust outbreaks over the Mediterranean Basin during 2001–2011: PM10 concentrations, phenomenology and trends, and its relation with synoptic and mesoscale meteorology, Atmos. Chem. Phys., 13, 1395–1410, https://doi.org/10.5194/acp-13-1395-2013, 2013. a
Pope, C. A. and Dockery, D. W.: Health Effects of Fine Particulate Air Pollution: Lines that Connect, J. Air Waste Manage. Assoc., 56, 709–742, https://doi.org/10.1080/10473289.2006.10464485, 2006. a
Putaud, J.-P., Dingenen, R. V., Alastuey, A., Bauer, H., Birmili, W., Cyrys, J., Flentje, H., Fuzzi, S., Gehrig, R., Hansson, H., Harrison, R., Herrmann, H., Hitzenberger, R., Hüglin, C., Jones, A., Kasper-Giebl, A., Kiss, G., Kousa, A., Kuhlbusch, T., Löschau, G., Maenhaut, W., Molnar, A., Moreno, T., Pekkanen, J., Perrino, C., Pitz, M., Puxbaum, H., Querol, X., Rodriguez, S., Salma, I., Schwarz, J., Smolik, J., Schneider, J., Spindler, G., ten Brink, H., Tursic, J., Viana, M., Wiedensohler, A., and Raes, F.: A European aerosol phenomenology – 3: Physical and chemical characteristics of particulate matter from 60 rural, urban, and kerbside sites across Europe, Atmos. Environ., 44, 1308–1320, https://doi.org/10.1016/j.atmosenv.2009.12.011, 2010. a
Python: Welcome to Python, available at: https://www.python.org, last access: 9 September 2020. a
Pöschl, U.: Atmospheric Aerosols: Composition, Transformation, Climate and Health Effects, Angewandte Chemie International Edition, 44, 7520–7540, https://doi.org/10.1002/anie.200501122, 2005. a
Querol, X., Pey, J., Pandolfi, M., Alastuey, A., Cusack, M., Pérez, N., Moreno, T., Viana, M., Mihalopoulos, N., Kallos, G., and Kleanthous, S.: African dust contributions to mean ambient PM10 mass-levels across the Mediterranean Basin, Atmos. Environ., 43, 4266–4277, https://doi.org/10.1016/j.atmosenv.2009.06.013, 2009. a
Rantanen, M., Räisänen, J., Sinclair, V. A., Lento, J., and Järvinen, H.: The extratropical transition of Hurricane Ophelia (2017) as diagnosed with a generalized omega equation and vorticity equation, Tellus A, 72, 1–26, https://doi.org/10.1080/16000870.2020.1721215, 2020. a
Remer, L. A., Kaufman, Y. J., Tanré, D., Mattoo, S., Chu, D. A., Martins, J. V., Li, R.-R., Ichoku, C., Levy, R. C., Kleidman, R. G., Eck, T. F., Vermote, E., and Holben, B. N.: The MODIS Aerosol Algorithm, Products, and Validation, J. Atmos. Sci., 62, 947–973, https://doi.org/10.1175/JAS3385.1, 2005. a, b
Rémy, S., Kipling, Z., Flemming, J., Boucher, O., Nabat, P., Michou, M., Bozzo, A., Ades, M., Huijnen, V., Benedetti, A., Engelen, R., Peuch, V.-H., and Morcrette, J.-J.: Description and evaluation of the tropospheric aerosol scheme in the European Centre for Medium-Range Weather Forecasts (ECMWF) Integrated Forecasting System (IFS-AER, cycle 45R1), Geosci. Model Dev., 12, 4627–4659, https://doi.org/10.5194/gmd-12-4627-2019, 2019. a
Robertson, L., Langner, J., and Engardt, M.: An Eulerian limited-area atmospheric transport model, J. Appl. Meteorol., 38, 190–210, 1999. a
Russell, A. G. and Brunekreef, B.: A focus on particulate matter and health, Environ. Sci. Technol., 43, 4620–4625, https://doi.org/10.1021/es9005459, 2009. a
Salomonson, V. V., Barnes, W. L., Maymon, P. W., Montgomery, H. E., and Ostrow, H.: MODIS: advanced facility instrument for studies of the Earth as a system, IEEE T. Geosci. Remote, 27, 145–153, https://doi.org/10.1109/36.20292, 1989. a
Sayer, A. M., Hsu, N. C., Bettenhausen, C., and Jeong, M.-J.: Validation and uncertainty estimates for MODIS Collection 6 “Deep Blue” aerosol data, J. Geophys. Res.-Atmos., 118, 7864–7872, https://doi.org/10.1002/jgrd.50600, 2013. a
Sayer, A. M., Munchak, L. A., Hsu, N. C., Levy, R. C., Bettenhausen, C., and Jeong, M.-J.: MODIS Collection 6 aerosol products: Comparison between Aqua's e-Deep Blue, Dark Target, and “merged” data sets, and usage recommendations, J. Geophys. Res.-Atmos., 119, 13965–13989, https://doi.org/10.1002/2014JD022453, 2014. a
Sayer, A. M., Hsu, N. C., Bettenhausen, C., Jeong, M.-J., and Meister, G.: Effect of MODIS Terra radiometric calibration improvements on Collection 6 Deep Blue aerosol products: Validation and Terra/Aqua consistency, J. Geophys. Res.-Atmos., 120, 12157–12174, https://doi.org/10.1002/2015JD023878, 2015. a
Sciare, J., Oikonomou, K., Favez, O., Liakakou, E., Markaki, Z., Cachier, H., and Mihalopoulos, N.: Long-term measurements of carbonaceous aerosols in the Eastern Mediterranean: evidence of long-range transport of biomass burning, Atmos. Chem. Phys., 8, 5551–5563, https://doi.org/10.5194/acp-8-5551-2008, 2008. a
Simpson, D., Benedictow, A., Berge, H., Bergström, R., Emberson, L. D., Fagerli, H., Flechard, C. R., Hayman, G. D., Gauss, M., Jonson, J. E., Jenkin, M. E., Nyíri, A., Richter, C., Semeena, V. S., Tsyro, S., Tuovinen, J.-P., Valdebenito, Á., and Wind, P.: The EMEP MSC-W chemical transport model – technical description, Atmos. Chem. Phys., 12, 7825–7865, https://doi.org/10.5194/acp-12-7825-2012, 2012. a
Sofiev, M., Vira, J., Kouznetsov, R., Prank, M., Soares, J., and Genikhovich, E.: Construction of the SILAM Eulerian atmospheric dispersion model based on the advection algorithm of Michael Galperin, Geosci. Model Dev., 8, 3497–3522, https://doi.org/10.5194/gmd-8-3497-2015, 2015. a
Stafoggia, M., Zauli-Sajani, S., Pey, J., Samoli, E., Alessandrini, E., Basagaña, X., Cernigliaro, A., Chiusolo, M., Demaria, M., Díaz, J., Faustini, A., Katsouyanni, K., Kelessis, A. G., Linares, C., Marchesi, S., Medina, S., Pandolfi, P., Pérez, N., Querol, X., Randi, G., Ranzi, A., Tobias, A., Forastiere, F., and MED-PARTICLES Study Group: Desert dust outbreaks in Southern Europe: contribution to daily PM10 concentrations and short-term associations with mortality and hospital admissions, Environ. Health Persp., 124, 413–419, https://doi.org/10.1289/ehp.1409164, 2016. a
Stewart, S. R.: National Hurricane Center tropical cyclone report: Hurricane Ophelia, National Oceanic and Atmospheric Administration: 2017 Atlantic Hurricane Season, available at: https://www.nhc.noaa.gov/data/tcr/index.php?season=2017&basin=atl (last access: 9 November 2020), 2018. a, b, c, d
Tanré, D., Kaufman, Y. J., Herman, M., and Mattoo, S.: Remote sensing of aerosol properties over oceans using the MODIS/EOS spectral radiances, J. Geophys. Res.-Atmos., 102, 16971–16988, https://doi.org/10.1029/96JD03437, 1997. a
Telegraph: The day the sky turned red – but what caused rare phenomenon?, available at: https://www.telegraph.co.uk/news/2017/10/16/strange-red-sun-phenomenon-seen-across-england-caused-hurricane (last access: 9 September 2020), 2017. a
Tighe, T.: A case study of high sea salt aerosol (SSA) concentrations as a hazard to aviation, Meteorol. Appl., 22, 806–810, https://doi.org/10.1002/met.1529, 2015. a
Tørseth, K., Aas, W., Breivik, K., Fjæraa, A. M., Fiebig, M., Hjellbrekke, A. G., Lund Myhre, C., Solberg, S., and Yttri, K. E.: Introduction to the European Monitoring and Evaluation Programme (EMEP) and observed atmospheric composition change during 1972–2009, Atmos. Chem. Phys., 12, 5447–5481, https://doi.org/10.5194/acp-12-5447-2012, 2012. a
Turco, M., von Hardenberg, J., AghaKouchak, A., Llasat, M. C., Provenzale, A., and Trigo, R. M.: On the key role of droughts in the dynamics of summer fires in Mediterranean Europe, Sci. Rep., 7, 1–10, https://doi.org/10.1038/s41598-017-00116-9, 2017. a
Twomey, S.: Pollution and the planetary albedo, Atmos. Environ. (1967), 8, 1251–1256, https://doi.org/10.1016/0004-6981(74)90004-3, 1974. a
Vaughan, M. A., Powell, K. A., Winker, D. M., Hostetler, C. A., Kuehn, R. E., Hunt, W. H., Getzewich, B. J., Young, S. A., Liu, Z., and McGill, M. J.: Fully Automated Detection of Cloud and Aerosol Layers in the CALIPSO Lidar Measurements, J. Atmos. Ocean. Tech., 26, 2034–2050, https://doi.org/10.1175/2009JTECHA1228.1, 2009. a
Winker, D. M., Vaughan, M. A., Omar, A., Hu, Y., Powell, K. A., Liu, Z., Hunt, W. H., and Young, S. A.: Overview of the CALIPSO Mission and CALIOP Data Processing Algorithms, J. Atmos. Ocean. Tech., 26, 2310–2323, https://doi.org/10.1175/2009JTECHA1281.1, 2009. a