the Creative Commons Attribution 4.0 License.
the Creative Commons Attribution 4.0 License.
 | 13 Nov 2020
Reaction between CH3C(O)OOH (peracetic acid) and OH in the gas phase: a combined experimental and theoretical study of the kinetics and mechanism
Matias Berasategui
Damien Amedro
Luc Vereecken
Jos Lelieveld
Peracetic acid (CH3C(O)OOH) is one of the most abundant organic peroxides in the atmosphere; yet the kinetics of its reaction with OH, believed to be the major sink, have only been studied once experimentally. In this work we combine a pulsed-laser photolysis kinetic study of the title reaction with theoretical calculations of the rate coefficient and mechanism. We demonstrate that the rate coefficient is orders of magnitude lower than previously determined, with an experimentally derived upper limit of cm3 molec.−1 s−1. The relatively low rate coefficient is in good agreement with the theoretical result of cm3 molec.−1 s−1 at 298 K, increasing to cm3 molec.−1 s−1 in the cold upper troposphere but with associated uncertainty of a factor of 2. The reaction proceeds mainly via abstraction of the peroxidic hydrogen via a relatively weakly bonded and short-lived prereaction complex, in which H abstraction occurs only slowly due to a high barrier and low tunnelling probabilities. Our results imply that the lifetime of CH3C(O)OOH with respect to OH-initiated degradation in the atmosphere is of the order of 1 year (not days as previously believed) and that its major sink in the free and upper troposphere is likely to be photolysis, with deposition important in the boundary layer.
- Article
(2752 KB) - Full-text XML
-
Supplement
(405 KB) - BibTeX
- EndNote


The processes leading to the formation and loss of two classes of atmospheric trace gases, organic acids and organic peroxides, have been the subject of numerous field, laboratory and model-based investigations (Atkinson et al., 2006; Calvert et al., 2011; Gunz and Hoffmann, 1990; Jackson and Hewitt, 1999; Lee et al., 2000; Paulot et al., 2011; Reeves and Penkett, 2003). By comparison, ambient measurements of the acidic peroxide, peracetic acid (CH3C(O)OOH), in the gas phase are still relatively scarce. Measurements in the boundary layer (Crowley et al., 2018; Fels and Junkermann, 1994; He et al., 2010; Liang et al., 2013; Phillips et al., 2013; Walker et al., 2006; Zhang et al., 2010) and from aircraft (Crounse et al., 2006; Wang et al., 2019) indicate that it is present throughout the troposphere, where it is observed to be the second most abundant organic peroxide (after CH3OOH). Like other organic peroxides, CH3C(O)OOH can contribute to the formation and ageing of secondary organic aerosol (Docherty et al., 2005), which enhances its removal through wet deposition.
Unlike its non-peroxidic analogue, CH3C(O)OH (acetic acid), the direct emission of CH3C(O)OOH by the biosphere has not been documented, and its formation during biomass burning has not been reported (Andreae, 2019), although elevated CH3C(O)OOH mixing ratios have been observed in air masses impacted by biomass burning (Crowley et al., 2018; Phillips et al., 2013). Apart from leakage during industrial production and application as an indoor disinfectant (Henneken et al., 2006; Pacenti et al., 2010), the only significant source of CH3C(O)OOH in the atmosphere is the radical terminating channel (Reaction R1a) in the reaction between the acetylperoxy and hydroperoxyl radicals.
The CH3C(O)O2 radical is formed in the degradation of acetaldehyde (mainly via reaction with OH), acetone and methylglyoxal (both via photolysis), all of which are common secondary products of the degradation of biogenic and anthropogenic volatile organic compounds (VOCs) including isoprene, monoterpenes, alkenes and alkanes. Globally, biogenic emissions account for >60 % of CH3C(O)O2 formation (Fischer et al., 2014).
The highest production rates of CH3C(O)OOH are thus expected in regions which are impacted by biogenic emissions in which HO2 levels are high enough to compete with NO2 (Reaction R2) and NO (Reaction R3) for reaction with CH3C(O)O2:
As CH3C(O)OONO2 (peroxyacetyl nitric anhydride, PAN) is thermally unstable with respect to re-dissociation to reactants, high temperatures also favour CH3C(O)OOH formation.
Laboratory studies, summarized by IUPAC, indicate that the overall rate coefficient (k1) for Reactions (R1a)–(R1c) (at 298 K) is cm3 molec.−1 s−1 and that CH3C(O)OOH is formed with a branching ratio (k1a∕k1) of 0.37±0.09 at this temperature. At lower temperatures, such as those found in the upper troposphere, the rate coefficient increases ( cm3 molec.−1 s−1) while the branching ratio to CH3C(O)OOH decreases: (IUPAC Task Group, 2020).
As for other soluble organic acids and peroxides, deposition will be an important sink for CH3C(O)OOH in the boundary layer, where (in the absence of measurements) an exchange velocity comparable to that of H2O2 (which has a similar solubility; Crowley et al., 2018) may be assumed and which results in a local lifetime of several hours. Further, wet deposition, either by direct dissolution or through particle formation and subsequent scavenging by clouds and rain, additionally reduces its lifetime. In analogy to other peroxides, reaction with OH is believed to be the dominant gas-phase loss process for CH3C(O)OOH.
The Master Chemical Mechanism (MCM v3.3.1: http://mcm.york.ac.uk/, last access: July 2020) presently uses an overall rate coefficient of cm3 molec.−1 s−1, which is based on reactions of OH with other organic trace gases containing the –OOH group (Orlando and Tyndall, 2003) whereby abstraction of the peroxidic H atom (Reaction R4a), is expected to dominate. A single study of the rate coefficient has been published to date (Wu et al., 2017), in which the authors, deriving a rate coefficient of cm3 molec.−1 s−1 in a relative rate study, confirm the dominance of the OH sink. There are no experimental studies of the branching ratio for the reaction between OH and CH3C(O)OOH, though a theoretical study indicates that k4a and k4b are comparable (Rypkema and Francisco, 2013). Absorption cross-sections of CH3C(O)OOH in the actinic region (λ>320 nm) are lower than those of, for example, CH3OOH and H2O2 (Burkholder et al., 2015; IUPAC Task Group, 2020; Orlando and Tyndall, 2003), and noontime, mid-latitude photolysis rate coefficients are ≈ 5–7 × 10⁻⁷ s−1. Assuming noontime OH radical densities of 2×10⁶ molec. cm−3 and cm3 molec.−1 s−1 results in a first-order loss rate coefficient of s−1, which implies that the photolysis of CH3C(O)OOH is not a significant atmospheric sink compared to the reaction with OH. The relative importance of the various atmospheric loss processes for CH3C(O)OOH in the light of the present results is discussed in more detail in Sect. 4.6.
Measurements of ambient CH3C(O)OOH mixing ratios have been used to gain insight into peroxy radical chemistry in the boreal forest during summer (Crowley et al., 2018; Phillips et al., 2013) and also to constrain the atmospheric budget of acetaldehyde, which is an important precursor of CH3C(O)OOH (Travis et al., 2020; Wang et al., 2019). Such studies require accurate estimates of the lifetime of atmospheric CH3C(O)OOH and thus the rate coefficient for its reaction with OH. The conclusions reached by Wang et al. (2019) based on aircraft data taken from remote sources of CH3CHO are valid if CH3C(O)OOH is much shorter lived than PAN and has a comparable lifetime to CH3CHO. Likewise, the concentrations of CH3C(O)OOH modelled by Crowley et al. (2018) are partially dependent on the OH rate coefficient for the title reaction. In addition, the degree to which the formation of CH3C(O)OOH from the reaction between HO2 and CH3C(O)O2 represents a permanent sink of peroxy radicals (and thus loss of oxidation capacity) depends on whether the photochemical degradation of CH3C(O)OOH to reform organic radicals can compete with deposition processes.
In the following, we describe the results of laboratory experiments and theoretical calculations that show that CH3C(O)OOH is much less reactive towards OH than presently believed. We also report rate coefficients (k5) for the reaction of OD + CH3C(O)OOH (Reaction R5), which was required to examine the potential role of OH reformation, and rate coefficients (k6, k7) for the reaction between both OH and OD with CH3C(O)OH (Reactions R6, R7), which were required to apply corrections for the presence of CH3C(O)OH in the CH3C(O)OOH samples:
Finally, we examine the site specificity of the H abstraction reaction (Reactions R4a versus R4b).
The laboratory kinetic studies of the title reactions used the method of pulsed laser photolytic (PLP) generation of OH combined with real time detection based on pulsed laser induced fluorescence (LIF). The concentrations of CH3C(O)OOH and CH3C(O)OH were measured online using infrared absorption spectroscopy. The set-up is illustrated in Fig. 1.

Figure 1PLP-LIF experimental set-up. PMT is the photomultiplier, JM the joule meter and FC the flow controller. The IR and UV absorption cells are at room temperature. The photolysis laser is an excimer laser (Compex 205 F, 248 nm) and the probe laser a YAG-pumped dye laser (Quantel Brilliant B and Lambda Physik Scanmate, 281.99 and 287.68 nm). The arrows indicate the direction of gas flow.
2.1 PLP-LIF
The details of the experimental set-up have been described in detail previously (Wollenhaupt et al., 2000), and only a brief description of the central features and modifications is given here. The experiments were carried out in a double-jacketed quartz reactor of volume ∼500 cm3, which was held at the desired temperature by circulating a 60 : 40 mixture of ethylene glycol ∕ water through the outer jacket. The pressure in the reactor, generally between ∼50 and 100 Torr N2, was monitored with 100 and 1000 Torr capacitance manometers (1 Torr = 1.333 HPa). For all experiments, the axial flow velocity in the reactor was kept roughly constant at ∼10 cm s−1 by adjusting the flow rate. As the ∼ 8 mm wide laser beam propagated orthogonally to the direction of flow, this ensured that a fresh gas sample was available for photolysis at each laser pulse. Pulses of 248 nm laser light (∼20 ns) for OH generation from H2O2 and CH3C(O)OOH or OD generation from DONO2 were provided at 10 Hz by an excimer laser (Compex 205 F, Coherent) operated with KrF.
The laser fluence (typically ∼15 mJ cm−2 per pulse) was measured using a calibrated joule meter located behind the exit window of the reactor. Concentrations of the OH precursors, H2O2, DONO2 and CH3C(O)OOH, were in the range ∼ 2–20 × 1013, 4–8 × 10¹⁴ molec. cm−3 and ∼ 6–60 × 1014 molec. cm−3, respectively (see Tables S1 and S2 in the Supplement). The initial OH concentrations were calculated using 248 nm cross-sections (units of cm2 molec.−1) from Vaghjiani and Ravishankara (1989a) (σ248 nm(H2O2) = ), Burkholder et al. (1993) (σ248 nm(HNO3) = ) and Orlando and Tyndall (2003) (σ248 nm(CH3C(O)OOH) = , and were ∼ 2–20 × 1011 molec. cm−3.
Radiation for excitation of the OH transition (Q11(1)) at 281.99 nm and OD transition at 287.68 nm was generated by a tuneable (YAG-pumped) dye laser (Quantel Brilliant B and Lambda Physik Scanmate). The fluorescence of OH and OD was detected using a photomultiplier tube screened by a 309 nm interference filter and a BG 26 glass cut-off filter. The fluorescence signal of OH was accumulated using a boxcar integrator triggered at different delay times prior to and after the 248 nm laser to build up a time-dependent concentration profile.
2.2 Online optical absorption measurements
The experiments to determine the rate coefficient of the title reaction were performed under pseudo-first-order conditions (i.e. [acid]0 ≫ [OH]0), and the overall uncertainty in the rate coefficients was determined largely by the accuracy with which the concentration of the excess reagent was measured. The concentrations of CH3C(O)OH and CH3C(O)OOH were therefore continuously measured upstream of the reactor by flowing the sample through an absorption cell (l=45 cm) made of glass, which was equipped with silicon windows for transmission of infrared (IR) light and a port for pressure measurement (using the same pressure gauges mentioned in Sect. 2.1). With this set-up, absorption features in the range 600–4000 cm−1 were constantly monitored (2 cm−1 resolution, 16 co-added interferograms with 128 scans for the background) using a Fourier-transform infrared (FTIR) spectrometer (Bruker Vector 22) with an external, liquid N2 cooled HgCdTe detector. A low spectral resolution was chosen to reduce scan times (∼20 s) and enable rapid changes in concentration to be followed. OPUS software was used to analyse and manipulate the IR spectra. Interferograms were phase-corrected (Mertz) and boxcar-apodized with a zero-filling factor of 4. The concentrations of CH3C(O)OH and CH3C(O)OOH were calculated using reference spectra obtained in this work (see Sect. 2.2).
A further, in-line optical absorption system was located downstream of the reactor. An absorption cell operated at 184.95 nm (l=43.8 cm, low-pressure Hg lamp screened by a 185 nm interference filter) served to detect H2O. The VUV absorption optical system is dual-beam so that drifts in light intensity could be accounted for and low optical densities could be measured over extended periods.
2.3 Offline IR spectrum measurements
Reference spectra for CH3C(O)OOH and CH3C(O)OH were obtained with the Bruker Vector 22 coupled to two further IR absorption cells. These were a 44.39 L cylindrical quartz chamber equipped with a White-type, multiple-reflection mirror system with an 86.3 m optical path and external (HgCdTe) detector at liquid N2 temperature (Berasategui et al., 2020; Bunkan et al., 2018) and a 570 mL glass cell with a 15 cm optical path, located in the internal optical path of the FTIR using an internal DTGS detector. The pressure in both absorption cells was monitored using 1000 or 100 Torr capacitance manometers.
2.4 Chemicals
N2 (Westfalen 99.999 %) was used without further purification. H2O2 (AppliChem, 50 wt %) was concentrated to >90 wt % by vacuum distillation. Anhydrous DONO2 was prepared by partial vacuum distillation of deuterated nitric acid formed by the addition of D2SO4 to KNO3. Liquid CH3C(O)OH and CH3C(O)OOH solutions (32 wt % in acetic acid) were used following purification by partial vacuum distillation.
The potential energy surface of the title reaction was characterized first at the M06-2X/cc-pVDZ level of theory (Dunning, 1989; Zhao and Truhlar, 2008). An exhaustive search for all conformers of reactants, transition states (TSs) and products was performed by systematic variations of the dihedral angles for the degrees of freedom for internal rotation. Likewise, we attempted to find all conformers of the prereaction and post-reaction complexes by positioning the two complexing compounds at a wide variety of relative orientations and optimizing the geometry from each of these starting positions. All geometries were subsequently re-optimized at the M06-2X-D3/aug-cc-pVTZ level of theory (Dunning, 1989; Goerigk et al., 2017; Grimme et al., 2011), improving the description of the long-distance interactions by including diffuse orbitals and dispersion corrections. The energy of the transition state for the abstraction of the peracidic H atom proved to be more dependent on the basis set than expected, changing by ∼4.3 kcal mol−1 as opposed to ∼2 kcal mol−1 for the methyl H abstraction, so to ensure full convergence with respect to the basis set, we re-optimized all structures again at the M06-2X-D3/aug-cc-pVQZ level of theory, confirming basis set convergence at the DFT (density functional theory) level within a few tenths of a kilocalorie per mole (kcal mol−1) and no significant change in the geometries. Zero-point energy (ZPE) corrections are done at this level, with vibrational wavenumbers scaled by 0.971 (Alecu et al., 2010; Bao et al., 2018). Finally, the relative energies were refined using CCSD(T) single-point calculations (Purvis and Bartlett, 1982), extrapolated to the complete basis set using the aug-Schwartz6(DTQ) method by Martin (1996), based on calculations using the aug-cc-pVxZ () basis sets. The T1 diagnostics do not suggest multi-reference character in any of the structures. The strong dependence on the basis set size is assumed to be the main reason for the difference between our barrier heights and those predicted by Rypkema and Francisco (2013) who found submerged transition states incompatible with the experimental data.
The temperature-dependent rate coefficient of the reaction was calculated using multi-conformer canonical transition state theory (Truhlar et al., 1996; Vereecken and Peeters, 2003), including all conformers of reactants and transition states characterized at our highest level of theory. The spin-orbit splitting for OH of 27.95 cm−1 was taken into account (Huber and Herzberg, 1979). Tunnelling was accounted for by asymmetric Eckart barrier corrections based on the reactant, the TS and product energy and the TS imaginary frequency (Eckart, 1930; Johnston and Heicklen, 1962). The rate coefficient is calculated in the high-pressure limit; i.e. the prereaction complex is assumed to be in thermal equilibrium with the reactants. The main impact of the prereaction complex on the kinetics is then to allow additional tunnelling through a wider energy range of the TS barrier for H abstraction. This is discussed in more detail below.
4.1 Infrared absorption cross-sections
Accurate IR absorption cross-sections of CH3C(O)OH, its dimer and CH3C(O)OOH are required to derive accurate concentrations of reactants during kinetic experiments on OH + CH3C(O)OOH in which both acids are unavoidably present because the commercially available sample of CH3C(O)OOH is a ∼ 32 % solution in CH3C(O)OH. Note that all IR cross-sections we quote are “base e”.
4.1.1 CH3C(O)OH and CH3C(O)OH dimer
In order to obtain the cross-sections of the CH3C(O)OH monomer, the long-path cell was used in conjunction with low pressures of CH3C(O)OH to avoid the formation of the dimer. A known pressure of the CH3C(O)OH sample (in total typically 3–18 Torr) was first measured in a section of the vacuum line (volume 126.6 cm3) and then flushed into the long-path cell in a flow of N2 until 700 Torr of total pressure was reached. The pressure of CH3C(O)OH in the long-path cell (volume 44 390 cm3) was calculated from the sum of monomer pressure plus twice the dimer pressure in the vacuum line (both calculated from the total pressure using the 298 K equilibrium coefficient Torr−1; Crawford et al., 1999) and the dilution factor, which is related to the relative volumes of the mixing line and the long-path cell. The concentration of CH3C(O)OH in the long-path cell was (1–10) × 1014 molec. cm−3, where the equilibrium dimer concentration can be considered negligible. The CH3C(O)OH dimer spectrum was measured in the small optical absorption cell (l=15 cm) using up to 1.36 Torr (dosed directly into the cell) of the CH3C(O)OH ∕ CH3C(O)OH dimer mixture to favour dimer formation. At the highest total pressure, the ratio of dimer to monomer (calculated using the equilibrium constant listed above) was 1.4.
The CH3C(O)OH spectrum (Fig. 2) reveals features at 991, 1185, 1279, 1385, 1790 and 3583 cm−1, with only the band at 3583 cm−1 free of overlap with any of the CH3C(O)OOH or CH3C(O)OH dimer bands. The spectra obtained for the CH3C(O)OH and CH3C(O)OH dimer are in excellent agreement with those available in the literature: at 1117 cm−1 we derive σ(CH3C(O)OH = cm2 molec.−1, which can be compared to σ(CH3C(O)OH = cm2 molec.−1 reported by Crawford et al. (1999). Our value of σ(CH3C(O)OH dimer) = cm2 molec.−1 at 1295 cm−1 is identical to that reported by Crawford et al. (1999).

Figure 2IR absorption cross-sections (base e) obtained in the long-path absorption cell. A comparison of the CH3C(O)OOH spectrum with the literature is given in Fig. S2.
Beer–Lambert plots for the 3583 cm−1 band of CH3C(O)OH and the 1734 cm−1 band of CH3C(O)OH dimer were constructed by expanding different pressures of CH3C(O)OH into the long-path cell at room temperature and 700 Torr of total pressure. The results, displayed in Fig. S1 in the Supplement, indicate a strictly linear relationship between band intensity and concentration over the range of concentrations investigated.
4.1.2 CH3C(O)OOH
The liquid sample (32 % (wt) CH3C(O)OOH in CH3C(O)OH) is prepared commercially by the oxidation of CH3C(O)OH using H2O2 and is a four-component equilibrium mixture:
In order to obtain a quantitative IR spectrum of CH3C(O)OOH, headspace mixtures were dosed into the mixing line, where the total pressure () was recorded before the mixture was flushed into the long-path cell. At the low concentrations of CH3C(O)OH in the long-path cell, there is no evidence for the CH3C(O)OH dimer. In the absence of any absorption features of H2O2, the IR absorption due to CH3C(O)OH and H2O was converted to a vacuum-line pressure of CH3C(O)OH + CH3C(O)OH dimer + H2O and the residual pressure assigned to CH3C(O)OOH, enabling quantification of the CH3C(O)OOH spectrum (Fig. 2). As noted by Crawford et al. (1999), there was no evidence for dimerization of CH3C(O)OOH. These experiments were repeated using the 45 cm path-length absorption cell, which has the disadvantage that significantly higher concentrations of CH3C(O)OOH are needed to obtain good quality spectra, and the CH3C(O)OH dimer is therefore also present. However, it provides the advantage of eliminating uncertainty related to the optical path length. Additionally, using this set-up we obtained an accurate IR absorption spectra of H2O relative to its VUV absorption 185 nm using a cross-section of cm2 molec.−1 (Cantrell et al., 1997).
Using both set-ups, we derived a CH3C(O)OOH cross-section at 1251 cm−1 of cm2 molec.−1, with an uncertainty of 15 %. This analysis neglects the contribution of H2O2 to the total headspace pressure. In offline experiments, whereby the headspace was sampled into an enzyme/fluorescence-based instrument for determination of H2O2 and organic peroxides (Fischer et al., 2015), we found that H2O2 was present at about 1 % of the CH3C(O)OOH concentration, consistent with the low vapour pressure of H2O2 compared to CH3C(O)OOH.
Our CH3C(O)OOH absorption cross-sections are much larger (factor 2.1) than those reported by Crawford et al. (1999) whose spectrum has σ(CH3C(O)OOH) = cm2 molec.−1 at 1251.5 cm−1. The only other published IR cross-sections of CH3C(O)OOH of which we are aware were reported by Orlando et al. (2000b) in which a value of cm2 molec.−1 at 1251 cm−1 is reported (∼40 % larger than our value), which was subsequently confirmed by the same group by comparison with high-performance liquid chromatography (HPLC) measurements (Hasson et al., 2004). Note that both Orlando et al. (2000b) and Hasson et al. (2004) mistakenly listed this cross-section as being at 1295 cm−1 instead of 1251 cm−1, which was confirmed in private communication with the authors (John Orlando and Geoff Tyndall, personal communication, 2020), who kindly provided their spectrum. Our spectrum, that of Orlando et al. (2000b) and one obtained by digitizing Fig. 2 of Crawford et al. (1999) are displayed in Fig. S3.
We do not have an explanation for the divergent values of the IR absorption spectrum of CH3C(O)OOH but note that this will, in part, be related to working with a multi-component mixture that requires accurate determination of the contributions of the H2O, CH3C(O)OH and CH3C(O)OH dimer. As our experimental result could be reproduced in a series of experiments in two different experimental set-ups, we use our own cross-sections to calculate CH3C(O)OOH concentrations and consider the use of the larger value when estimating potential uncertainty in our rate coefficients. A Beer–Lambert plot for the 3306 cm−1 band of CH3C(O)OH (which we used to determine its concentration in kinetic experiments) is displayed in Fig. S1. As for the CH3C(O)OH and CH3C(O)OH dimer, the integrated band intensity was strictly proportional to concentration.
4.2 OH/OD + CH3C(O)OH: determination of k6 and k7 at 298 K
We show later (Sect. 4.3) that the reaction of OH with CH3C(O)OH (Reaction R6) contributes to OH losses in the experiments designed to derive the rate coefficient for the title reaction, and accurate rate coefficients under our experimental conditions are necessary to account for this. We therefore carried out a set of experiments to measure the rate coefficients for the reactions of OH and OD with CH3C(O)OH. k6 was determined at a total pressure (N2) of 57 and 102 Torr; k7 was examined at 66 Torr (N2).
In these experiments, OH was generated by the photolysis of H2O2 ((0.3–1.8) × 1014 molec. cm−3), and OD was generated by the photolysis of DONO2 (5×10¹⁴ molec. cm−3), both at 248 nm. Initial hydroxyl radical concentrations were [OH]0 ≈ (1–6) × 1011 and [OD]0 ≈ 2×10¹¹ molec. cm−3. The PLP-LIF studies were thus carried out under pseudo-first-order conditions with [CH3C(O)OH] ≫ [OH], so that the OH profiles are described by
where [OH]t is the concentration (molec. cm−3) at time t after the laser pulse, and k′ is the pseudo-first-order rate coefficient and is defined as
where k6 is the bimolecular rate coefficient (cm3 molec.−1 s−1) for the reaction between OH and CH3C(O)OH. kd (s−1) accounts for OH loss due to transport out of the reaction zone and reaction with H2O2 or DONO2. Similar expressions (switch OD for OH and k7 for k6) apply to the OD experiments.
Figure 3 displays representative data obtained at 295 K in N2 bath gas for reaction of OH and OD with CH3C(O)OH. The OH (OD) decays are strictly exponential, and the plots of k′ versus [CH3C(O)OH] (Fig. 4) are straight lines as expected from Eq. (2). This analysis assumes that reaction of OH or OD with the CH3C(O)OH dimer does not contribute significantly to its loss. In our experiments, the CH3C(O)OH dimer ∕ CH3C(O)OH ratio in the reactor varied between 0.04 and 0.32. The strict linearity observed when plotting the first-order loss constant of OH or OD versus [CH3C(O)OH] is consistent with an insignificant contribution of the CH3C(O)OH dimer to loss of OH, as also concluded by Singleton et al. (1989).
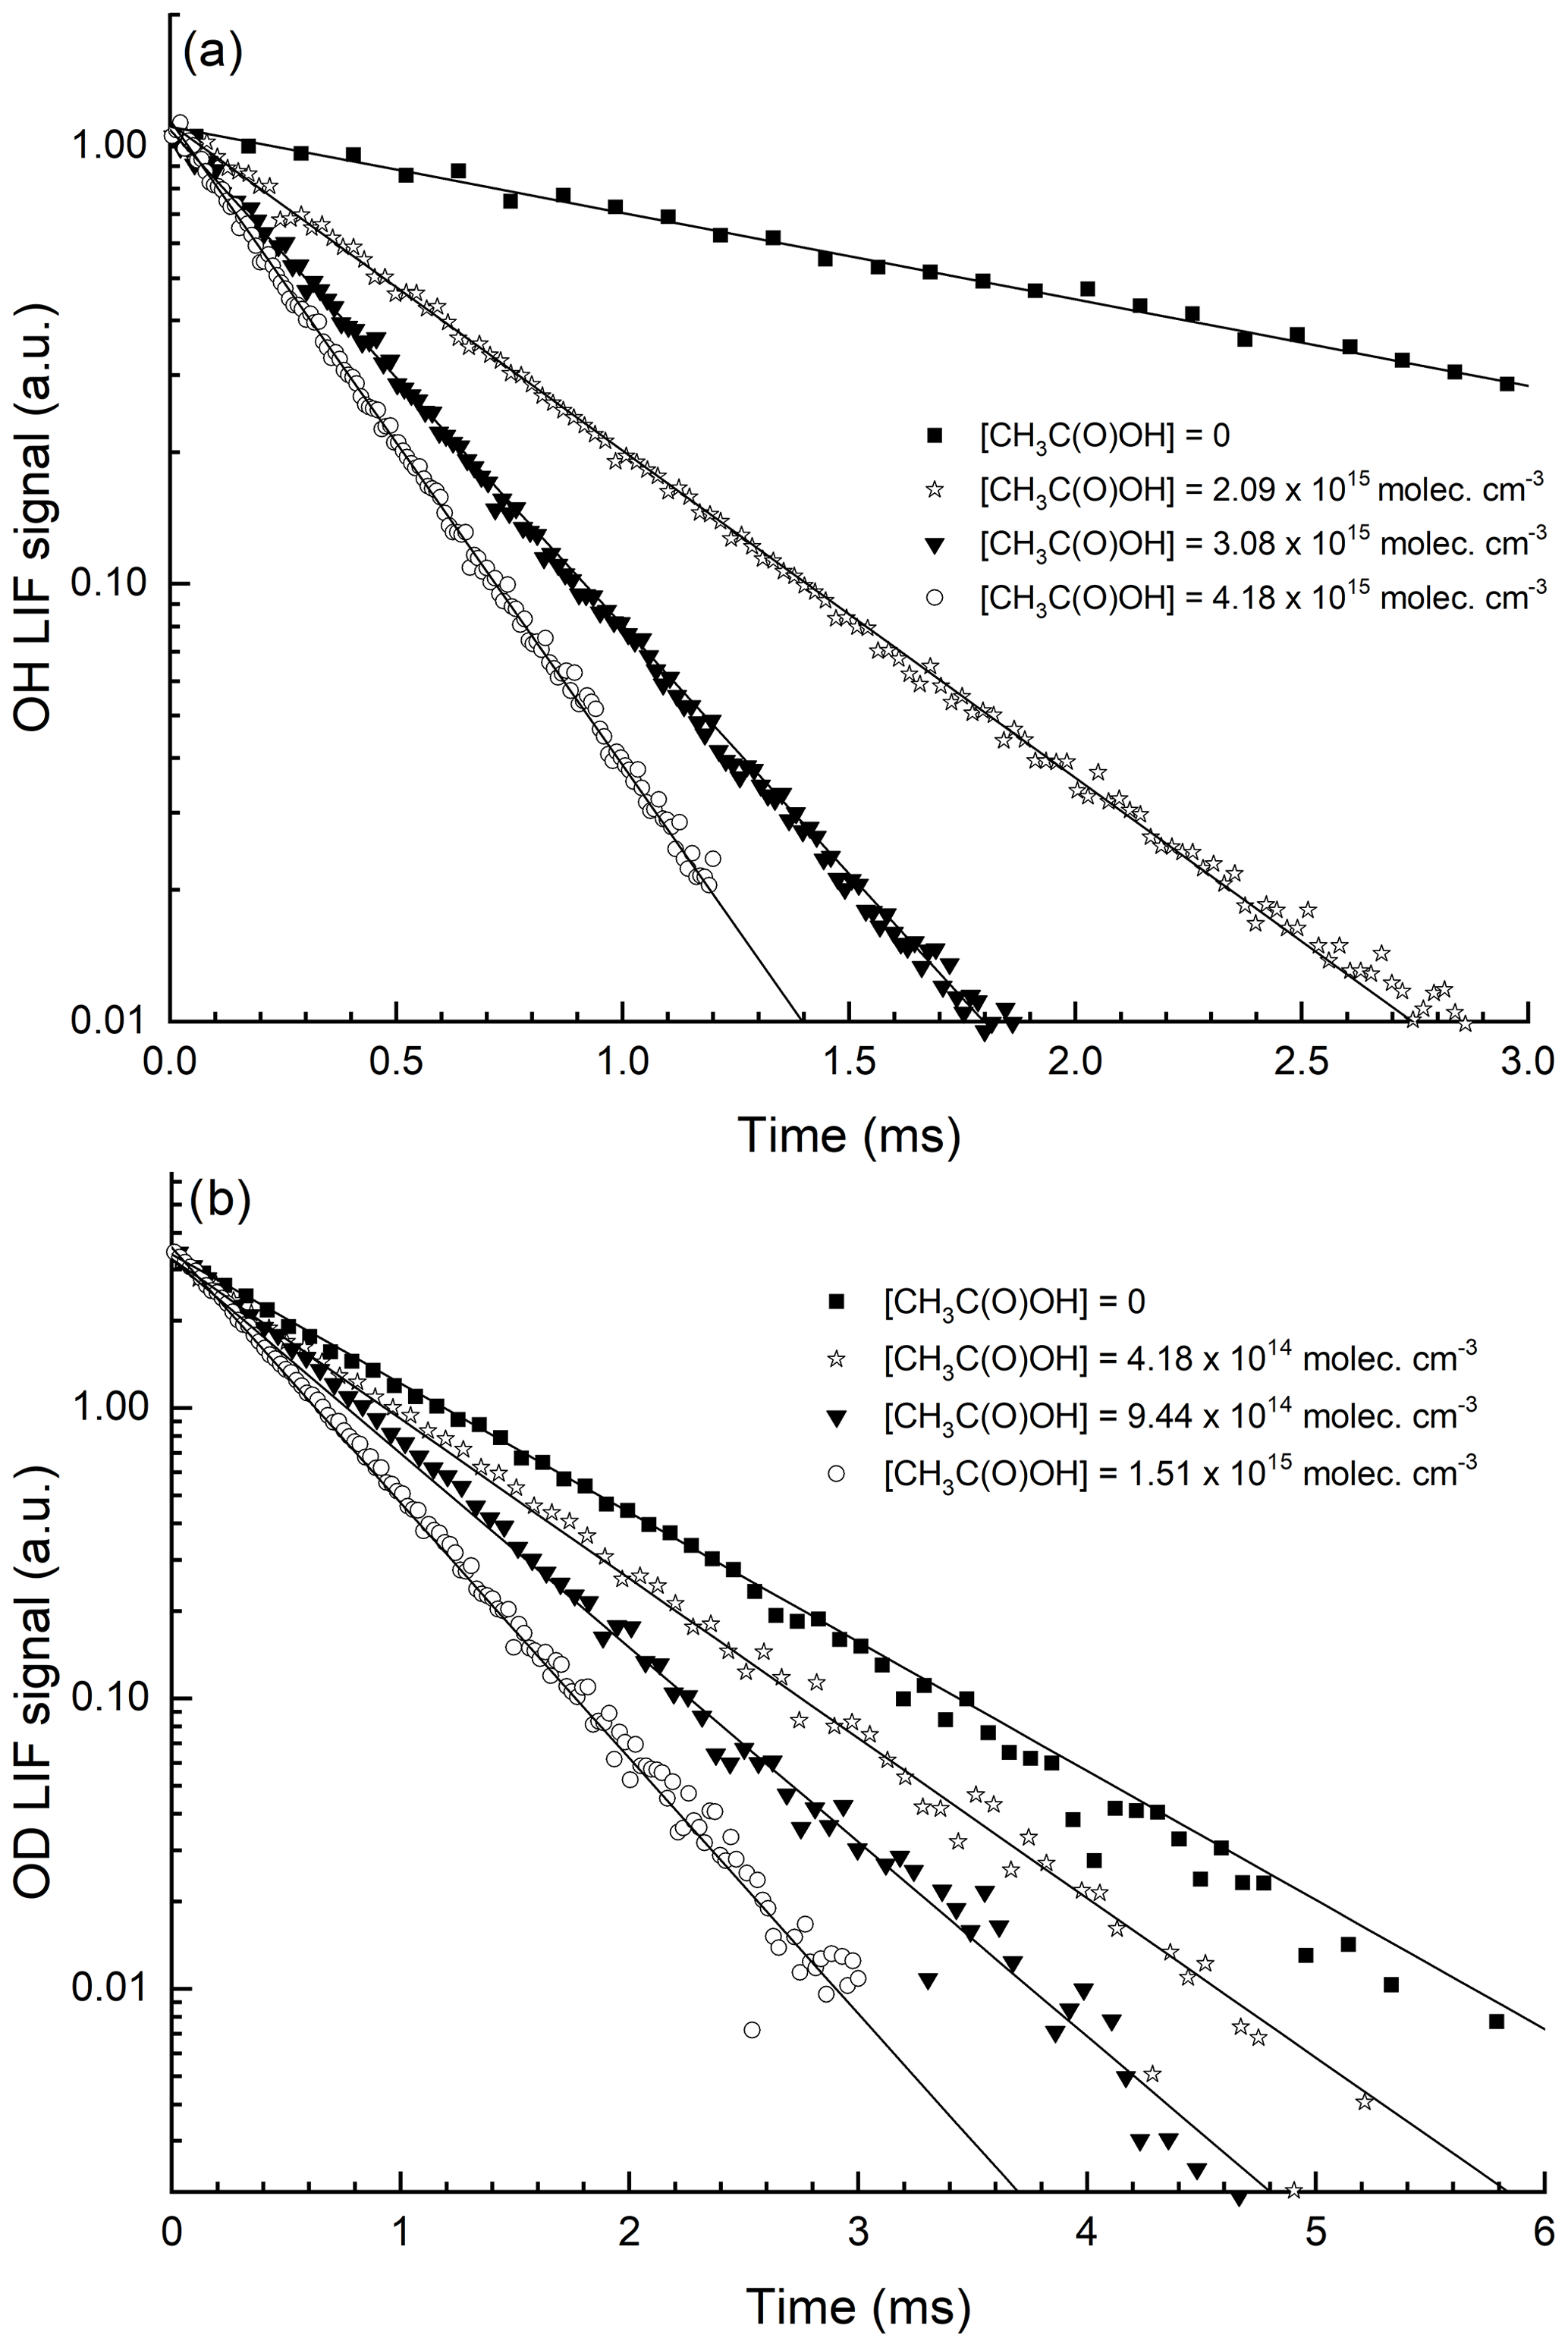
Figure 3Exponential decay of the OH (a) and OD (b) LIF signals in 150 Torr N2, at 293 K and at four different CH3C(O)OH concentrations. OH was generated by the photolysis of H2O2, and OD was generated by the photolysis of DNO3, both at 248 nm. The lines are fits to the datasets using Eq. (1).

Figure 4Plots of k′ versus [CH3C(O)OH] from the decays of OH and OD at different pressures of N2 and 295 K. The lines are least-squares fits to the data using Eq. (2). Error bars represent 2σ statistical uncertainty. The different intercepts are due to use of different concentrations of H2O2 (OH source) or DONO2 (OD source).
The values of k6 and k7 derived from these datasets typically have a statistical uncertainty (2σ) of less than 5 %, so that the overall uncertainty is dominated by a potential systematic error in the determination of CH3C(O)OH concentration, i.e. in the in situ measurement of IR absorption by CH3C(O)OH and its absorption cross-sections. During measurement of OH ∕ OD decay, the CH3C(O)OH concentration was measured between five and eight times using the 45 cm IR cell located upstream of the reactor and a small correction (∼3 %) for pressure differences between the IR absorption cell and the reactor applied. Typically, [CH3C(O)OH] varied by <3 % during the time required to measure the OH or OD decay and therefore did not contribute significantly to overall uncertainty.
Experimental details (e.g. identity and concentration of OH precursor and pressure) as well as the values of the rate coefficients k6 and k7 at 298 K are presented in Table S1. We obtained values of cm3 molec.−1 s−1 at 100 Torr total pressure and cm3 molec.−1 s−1 at 250 Torr. The result for OH is thus in excellent agreement (2 %) with the 298 K value of cm3 molec.−1 s−1 presently recommended by the IUPAC panel (IUPAC Task Group, 2020). The IUPAC panel recommendation carries an uncertainty of ±25 % (Δlog k=0.1) at 298 K. The very close agreement with our data may indicate that an uncertainty of ±12 % (Δlog k=0.05) is more reasonable, and in the calculations below, we use the IUPAC-recommended expression cm3 molec.−1 s−1.
For the reaction between OD and CH3C(O)OH, we obtain cm3 molec.−1 s−1 at 298 K and a pressure of 125 Torr N2, i.e. within 5 % of the values obtained for OH. We are unaware of other measurements of this parameter with which to compare our value.
4.3 OH + CH3C(O)OOH: determination of k4 (298–353 K)
The experiments to measure k4 were performed as described in Sect. 4.2 for CH3C(O)OH with the difference that it was not necessary to add H2O2 as an OH precursor, as the photolysis of CH3C(O)OOH itself provided sufficient OH. The experiments were conducted at a total pressure of ∼100 Torr (N2).
Taking a 248 nm laser fluence of ∼12 mJ cm−2 per pulse and a 248 nm cross-section of σ(CH3C(O)OOH) = cm2 molec.−1 (Orlando and Tyndall, 2003), and assuming unity quantum yield, we calculate that [OH]0 varied in the range ∼ (3–20) × 1011 molec. cm−3 when the CH3C(O)OOH concentration was varied within the range (6.17–38.5) × 1014 molec. cm−3.
IR absorption due to the CH3C(O)OOH, CH3C(O)OH and CH3C(O)OH dimer was monitored online in the 45 cm absorption cell (at 298 K). The concentrations of the CH3C(O)OOH, CH3C(O)OH and CH3C(O)OH dimer were quantified by the scaling reference spectrum (Sect. 4.1.1 and 4.1.2) of each component to the measured composite spectrum as illustrated in Fig. S3. Typically, the concentrations of CH3C(O)OH vary between 3×10¹⁴ and 2×10¹⁵ molec. cm−3 and those for CH3C(O)OOH between 6×10¹⁴ and 6×10¹⁵ molec. cm−3. When the reactor was operated at high temperatures, some of the CH3C(O)OH dimer present in the IR absorption cell was converted to CH3C(O)OH in the reactor, and correction was done to account for this using the temperature-dependent equilibrium constant.
The pseudo-first-order conditions for both [CH3C(O)OOH] ≫ [OH] and [CH3C(O)OH] ≫ [OH] are thus guaranteed, and the decay of OH is described by
where and are the pseudo-first-order rate coefficients for loss of OH via Reactions (R6) and (R4), respectively.
Typical OH decays (at 298 and 353 K) in the presence of CH3C(O)OH and CH3C(O)OOH are displayed in Fig. 5a. As expected, the initial OH concentration varies with [CH3C(O)OOH], and OH decays are strictly exponential. The contribution of CH3C(O)OH to the decay of OH can be calculated as k6[CH3C(O)OH]. For this purpose, we use the IUPAC-recommended parameterization of k6, the accuracy of which we have validated at 298 K as described above.

Figure 5(a) Exponential decay of the OH LIF signal in the presence of CH3C(O)OOH and CH3C(O)OH in ≈150 Torr N2 at 353 K. OH was generated by the photolysis of CH3C(O)OOH at 248 nm. (b) Exponential decay of the OD LIF signal in the presence of CH3C(O)OOH and CH3C(O)OH in N2 at 298 K. OD was generated from the 248 nm photolysis of DONO2.
When k6[CH3C(O)OH] is subtracted from the total first-order loss rate coefficient, we obtain k4[CH3C(O)OOH] + kd. The rate coefficient k4 can thus be derived from the slope of plots of k4[CH3C(O)OOH] + kd versus [CH3C(O)OOH] as illustrated in Fig. 6, which contains the data obtained at all temperatures. A least-squares fit to the entire dataset yields cm3 molec.−1 s−1, independent of temperature. The complete dataset, listing the experimental conditions and the contribution of CH3C(O)OH to the total OH decay constant, is found in Table S2. The uncertainty associated with the rate coefficient k4 (listed in Table S2 and plotted in Fig. 6) considers the statistical error in deriving and as well as the uncertainty in the concentration of CH3C(O)OH (10 %–15 %) (which is larger at high [CH3C(O)OH] owing to uncertainty in the dimer : monomer ratio, i.e. in Keq) and in the rate coefficient k6 (12 %; see above). It does not consider systematic error [CH3C(O)OOH], which is discussed below in deriving the final value for k4 and its total uncertainty.
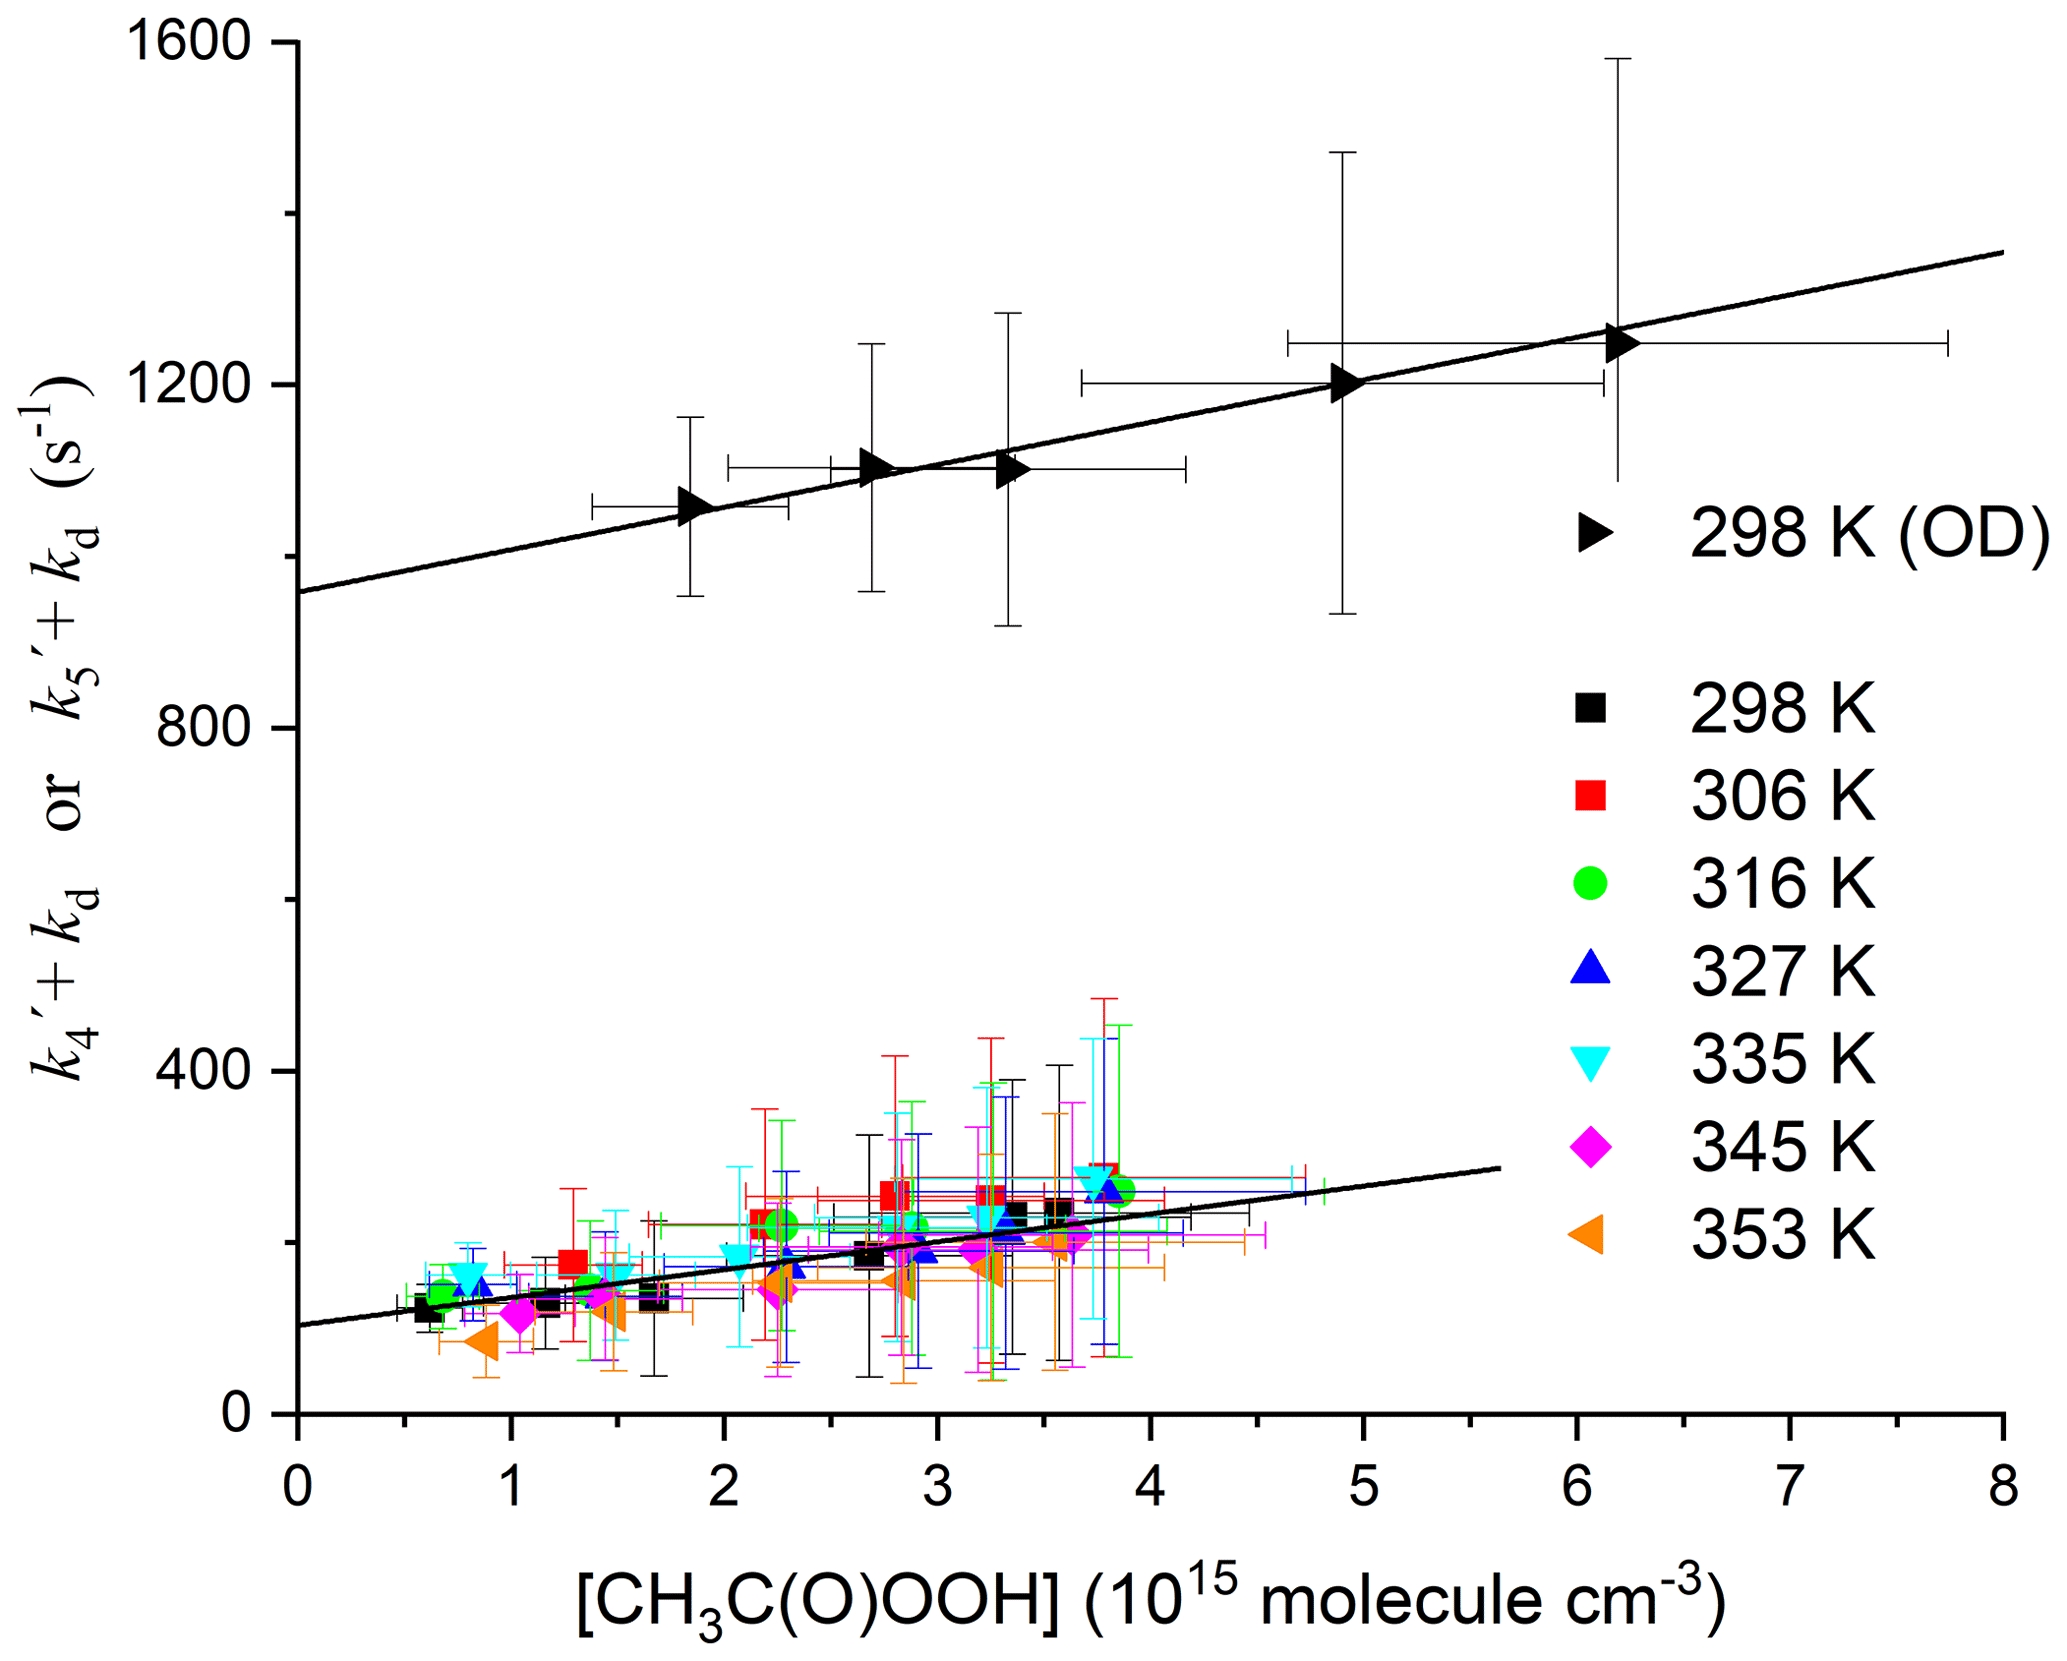
Figure 6Pseudo-first-order rate coefficient for the loss of OH () or OD () (after subtraction of the contribution of CH3C(O)OH) versus [CH3C(O)OOH]. The slopes of the solid black lines are k4 (lower dataset, with intercept ∼100 s−1) and k5 (uppermost dataset with intercept ∼900 s−1). The larger intercept for the OD reaction is due to the reaction with DONO2.
4.4 Potential for systematic error in determining k4 (298–353 K)
The values we obtain for k4 are clearly much lower than the one previous relative rate determination of Wu et al. (2017), who report a room temperature rate coefficient of cm3 molec.−1 s−1. Below, we examine potential sources of systematic bias in our experiments and analysis.
4.4.1 Uncertainty in the IR cross-sections of CH3C(O)OOH
The accuracy of rate coefficients measured using the PLP-LIF method under pseudo-first-order conditions depends predominantly on the accuracy of the measurement of the excess reagent, in this case CH3C(O)OOH. Any systematic error in the IR cross-sections used to calculate [CH3C(O)OOH] propagates directly into a systematic error in k4. Although our measurements of the IR cross-sections of CH3C(O)OOH were in good agreement, irrespective of the absorption cell used, we noted divergence between our value and the values published previously (see Sect. 4.1.2). For this reason, we expand the uncertainty on our cross-sections to ±25 % so that the results agree (within combined experimental uncertainty) with those reported by Orlando et al. (2000a). This implies an additional uncertainty of 25 % for k4.
4.4.2 Reformation of OH
A possible cause of the low rate coefficient measured in our direct study is the reformation of OH via decomposition of a reaction product, as has been observed (Vaghjiani and Ravishankara, 1989b) in the reaction of OH with another organic peroxide, CH3OOH (Reactions R12a, R13):
In analogy, if the decomposition to OH of any reaction product of CH3C(O)OOH + OH were sufficiently rapid, our experiment would underestimate the rate coefficient. In order to rule this out, we conducted experiments in which OH was replaced with OD. In this case, the reformation of OH via dissociation of the O–OH bond would not impact the kinetic measurement.
The results of experiments (at ∼57 Torr N2) in which the 248 nm photolysis of DONO2 was used to generate OD and measure the rate coefficient (k5) are displayed in Fig. 5. Following the same procedure as outlined above to subtract the contribution of CH3C(O)OH from the OH decay constant (but using our value of k7 for reaction between OD and CH3C(O)OH), we derive values of k5[CH3C(O)OOH] + kd versus [CH3C(O)OOH]. These are plotted in Fig. 6. From Table S2 we see that, within experimental scatter, the rate coefficients for reaction of OH and OD with CH3C(O)OOH are identical, and we conclude that OH reformation is not responsible for the divergence between our low rate coefficient and the literature value. Theoretical calculations (Sect. 4.5) also indicate that the reformation of OH in this system is energetically disfavoured.
4.4.3 Secondary reactions of OH
As the contribution of CH3C(O)OOH to the overall loss rate of OH is small, there is potential for overestimation of the rate coefficient if OH can react with products. In this case, we consider the reaction of OH with CH3, which is formed in the photolysis of CH3C(O)OOH (Reactions R10, R15) and in the dominant loss process for OH, reaction with CH3C(O)OH (Reactions R14, R15), respectively. OH may also react with the CH3C(O)O2 radical (Reaction R17), formed in the title reaction:
The rate coefficient for reaction of OH with CH3 is at the high-pressure limit, with a value close to cm3 molec.−1 s−1 (Pereira et al., 1997; Sangwan et al., 2012) under our experimental conditions. There appear not to be any kinetic studies of the reaction between OH and CH3C(O)O2, but, by analogy to OH + CH3O2 and OH + C2H5O2 (Assaf et al., 2018; IUPAC Task Group, 2020), Reactions (R17a) and (R17b) will also have a rate coefficient close to cm3 molec.−1 s−1. In order to assess the role of Reactions (R16) and (R17a), we performed numerical simulations of the chemistry subsequent to the generation of OH (and thus CH3) in the photolysis of CH3C(O)OOH ∕ CH3C(O)OH mixtures. The simulations were initiated with the concentrations of CH3C(O)OOH, CH3C(O)OH and OH listed in Table S2. As the decomposition of CH3C(O)O to CH3 + CO2 is rapid, we set the initial CH3 concentration equal to that of OH. Along with Reactions (R16), (R17a) and (R17b), we considered inter-radical reactions (e.g. self- and cross-reactions of CH3, HO2 and CH3C(O)O2) as listed in Table S3.
For each set of experimental conditions, simulations were carried out in which k4 was varied between zero and cm3 molec.−1 s−1. The simulated decays of OH thus obtained were fitted to an exponential function to obtain the total decay constant, from which the contribution of CH3C(O)OH was subtracted (k6[CH3C(O)OH]), as in the experimental data. The results of the simulations are displayed in Fig. 7 along with one set of experimental data obtained at 298 K. Immediately apparent from the simulations is that values of cm3 molec.−1 s−1 overpredict the measured slope. Indeed, setting k4 to zero gives the closest agreement between the simulation and measurement. A better match between the observation and simulation could be obtained by either reducing the initial OH concentration (and thus the concentrations of CH3 and CH3C(O)O2) or lowering the rate coefficients for Reactions (R16), (R17a) and (R17b). The simulated loss of OH was mainly (>90 %) via reaction with CH3, which reflects the fact that only a small fraction of OH generated reacts with CH3C(O)OOH to form CH3C(O)O2.
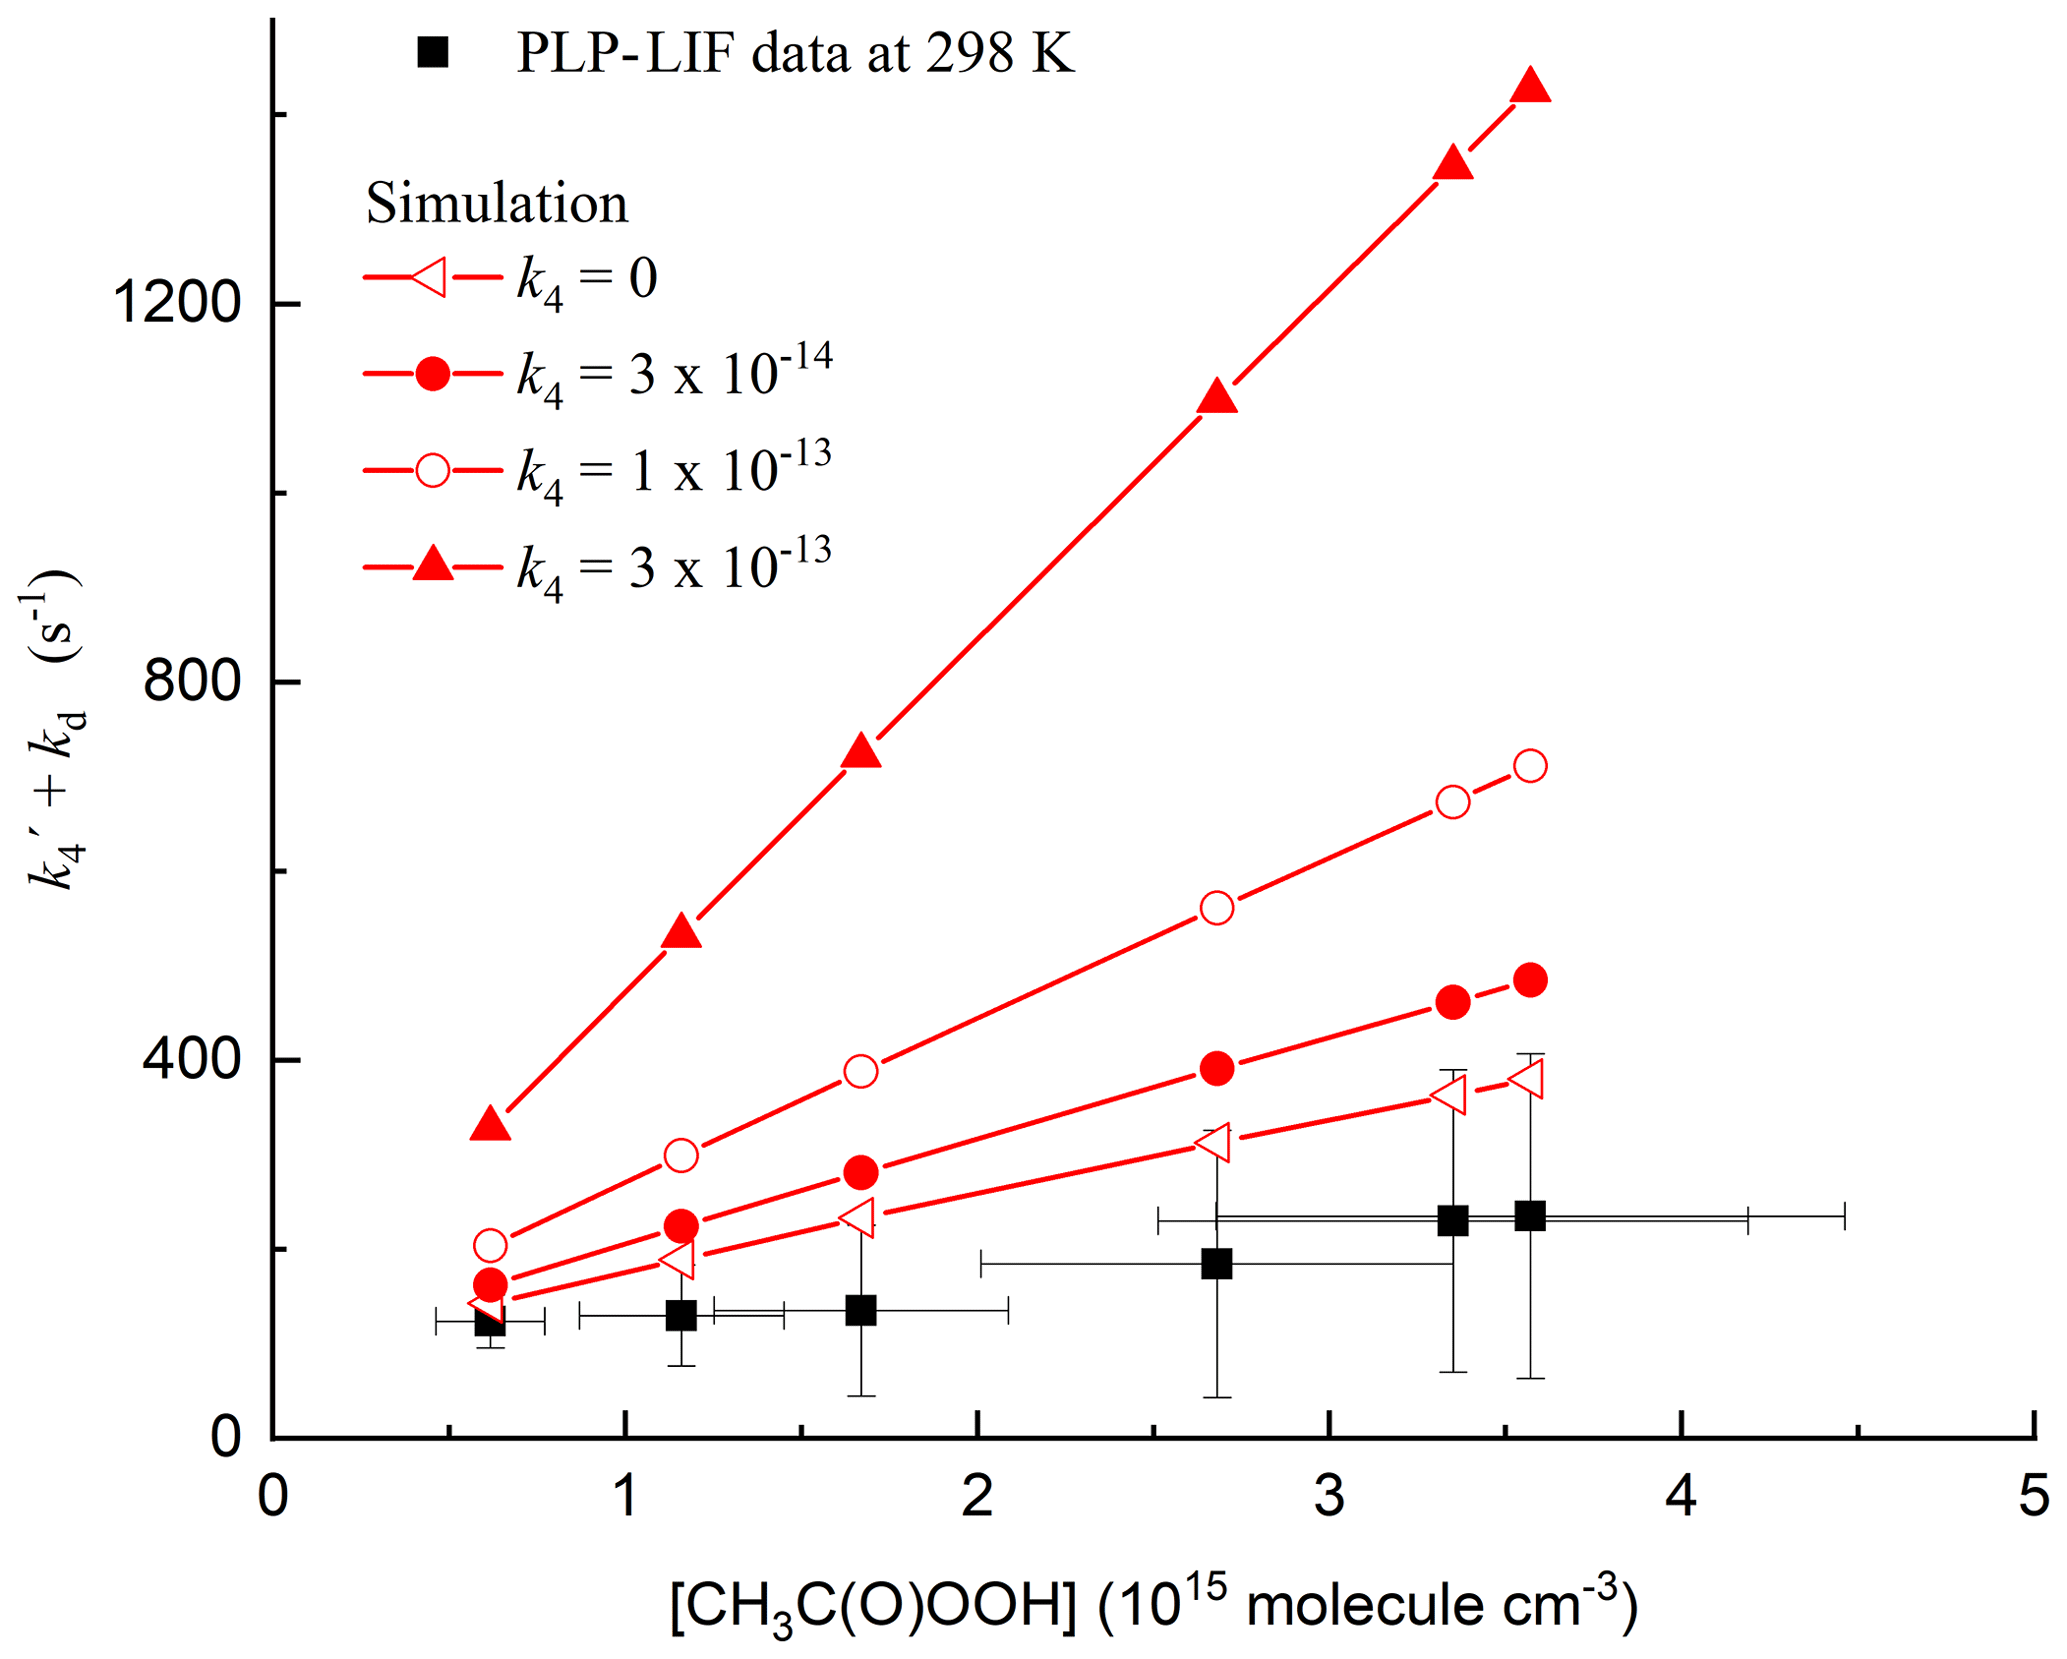
Figure 7Results of 24 simulations (in red) of the chemistry initiated by the photolysis of CH3C(O)OOH in the presence of CH3C(O)OH including reactions of OH with CH3 and CH3C(O)O2 radicals. As in the experimental data (only those obtained at 298 K are plotted), the contribution of CH3C(O)OH to the OH decay constant has been subtracted from each data point. In addition, a diffusion term of 100 s−1 has been added to the simulations so that the same intercept (at zero CH3C(O)OOH) is obtained.
Given the uncertainty associated with the determination of the initial radical concentration (based on laser fluence), and with the rate coefficients of the inter-radical reactions involved, it is not possible to use the simulations to correct the experimental data. Instead, recognizing that a large fraction of the OH decay constant may be due to unwanted secondary processes, we prefer to quote the value of k4 obtained experimentally as an upper limit.
4.4.4 Presence of H2O2 impurity
As indicated in Sect. 4.1.2, the CH3C(O)OOH ∕ CH3C(O)OH mixture is actually an equilibrium mixture containing H2O2 and H2O (Reaction R11). Analysis of headspace samples of CH3C(O)OOH and H2O2 indicates that H2O2 is present at ≈1 % the concentration of CH3C(O)OOH (see Sect. 4.1.2). The IR absorption cross-sections of H2O2 are generally too weak to detect low-level impurities, so we were unable to unambiguously detect and quantify H2O2 during our kinetic measurements. However, unlike CH3C(O)OOH, H2O2 reacts rapidly with OH, with a rate coefficient of cm3 molec.−1 s−1 at 298 K. Initially assuming that cm3 molec.−1 s−1 as derived above from the PLP-LIF experiments would imply that a 1 % H2O2 “impurity” in our CH3C(O)OOH sample would result in an overestimation of k4 by ∼50 %. Together with the considerations of secondary, radical chemistry discussed in Sect. 4.4.2, this leads us to interpret our measurement of k4 as an upper limit, and we prefer to quote a value of cm3 molec.−1 s−1.
4.5 Comparison with the previous determination of k4
Our experimental upper limit of cm3 molec.−1 s−1 is a factor ∼300 lower than the single, previous experimental determination (Wu et al., 2017). Wu et al. (2017) used a relative rate technique, which, in principle, offers the advantage that absolute concentrations of CH3C(O)OOH need not be known as long as CH3C(O)OOH and the reference reactant are removed solely via reaction with OH, and neither are reformed. However, the relative rate method does not lend itself readily to the study of this reaction, especially when the 254 nm photolysis of H2O2 is used as OH source, which results both in the photolysis of CH3C(O)OOH and in formation of HO2, which via reactions with CH3C(O)O2 can result in reformation of CH3C(O)OOH. These issues were recognized by Wu et al. (2017), and corrections were applied to take both into account, which resulted in a slight increase in the rate coefficient. In some initial relative rate experiments in our laboratory, we were unable to derive consistent results as the large affinity of CH3C(O)OOH for surfaces combined with its desorption from the walls during photolysis was too variable to allow analysis of the data.
In our theoretical study (Sect.4.6), we examine the reaction in detail and show that the low rate coefficient we measured with the PLP-LIF technique is in good agreement with the predictions.
4.6 Theoretical prediction of k4 and the reaction mechanism
The potential energy surface for the CH3C(O)OOH + OH reaction is shown in Fig. 8. The addition of OH radicals on a carbonyl double bond is known to have a high barrier and a negligible contribution and is ignored in this work (Anglada, 2004; De Smedt et al., 2005; Rypkema and Francisco, 2013; Vandenberk et al., 2002). The H abstraction reactions proceed through a prereaction complex and feature two protruding barriers for H abstraction at energies of 2.99 and 3.91 kcal mol−1 above the free reactants, corresponding to the abstraction of the peracetic H atom and the methyl H atoms, respectively. The products are formed in a post-reaction complex that quickly dissociates to the free products. The rate coefficients calculated are found to be low, with a value of cm3 molec.−1 s−1 at 298 K. At 298 K, the branching ratio k4a∕k4 is predicted to be 0.78, and abstraction of the peracetic H atom dominates across the temperature range 200–450 K. Abstraction of the methyl H atoms ranges from 10 % at 200 K to 38 % at 450 K. The temperature dependence of the overall rate coefficient is given by T10.90exp (3447 K∕T) cm3 molec.−1 s−1, with cm3 molec.−1 s−1 and k4b cm3 molec.−1 s−1. At the level of theory used, the expected uncertainty is a factor of 2 to 3. Given the slow product formation rate, the protruding reaction barriers and the fast formation and decomposition of the complex, k4 is not expected to show a pressure dependence and should be at the high-pressure limit under the experimental conditions (50–100 Torr N2).
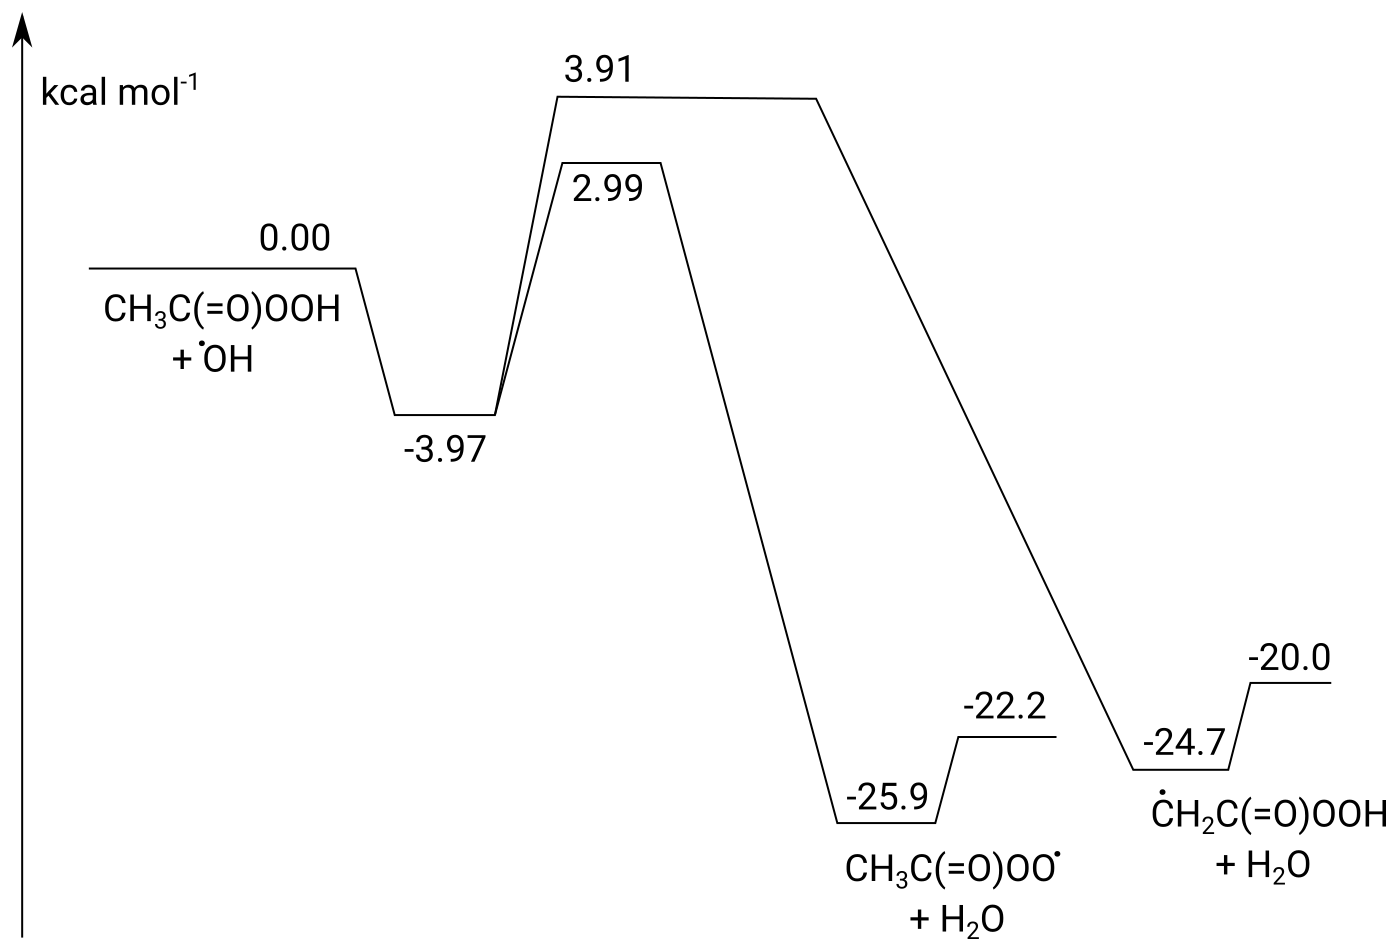
Figure 8ZPE-corrected potential energy surface of the CH3C(O)OOH + OH reaction calculated at the CCSD(T)/CBS(DTQ)//M06-2X-D3/aug-cc-pVQZ level of theory.
The theoretical predictions of k4, k4a and k4b are plotted along with the experimental data from this work and the data of Wu et al. (2017) in Fig. 9. We also indicate the value of k4 (based on comparison with CH3OOH) that is presently used in the Master Chemical Mechanism. Our theoretical work shows that the Arrhenius plot for this reaction is curved, with a positive temperature dependence above room temperature and a negative T dependence below 280 K. At lower temperatures, abstraction of the peracetic H atom is dominant, but at higher temperatures the abstraction of methyl H atoms through the higher energy transition state rises in importance and is expected to become dominant at even higher temperatures. Similar to the reaction between OH and acetic acid (De Smedt et al., 2005; Khamaganov et al., 2006), the curvature in the Arrhenius plot is due to the formation of the prereaction complex and subsequent tunnelling to the products. With decreasing temperatures, the complex is increasingly populated with a longer lifetime, capturing ever more (per-)acetic acid + OH complexes and allowing them to tunnel through the barriers at energies below the reactant energies, leading to a negative T dependence of the rate coefficient. At high temperatures, the lifetime of the prereaction complex is too short for effective tunnelling, and the reaction proceeds predominantly over the protruding barriers, leading to a traditional positive T dependence.
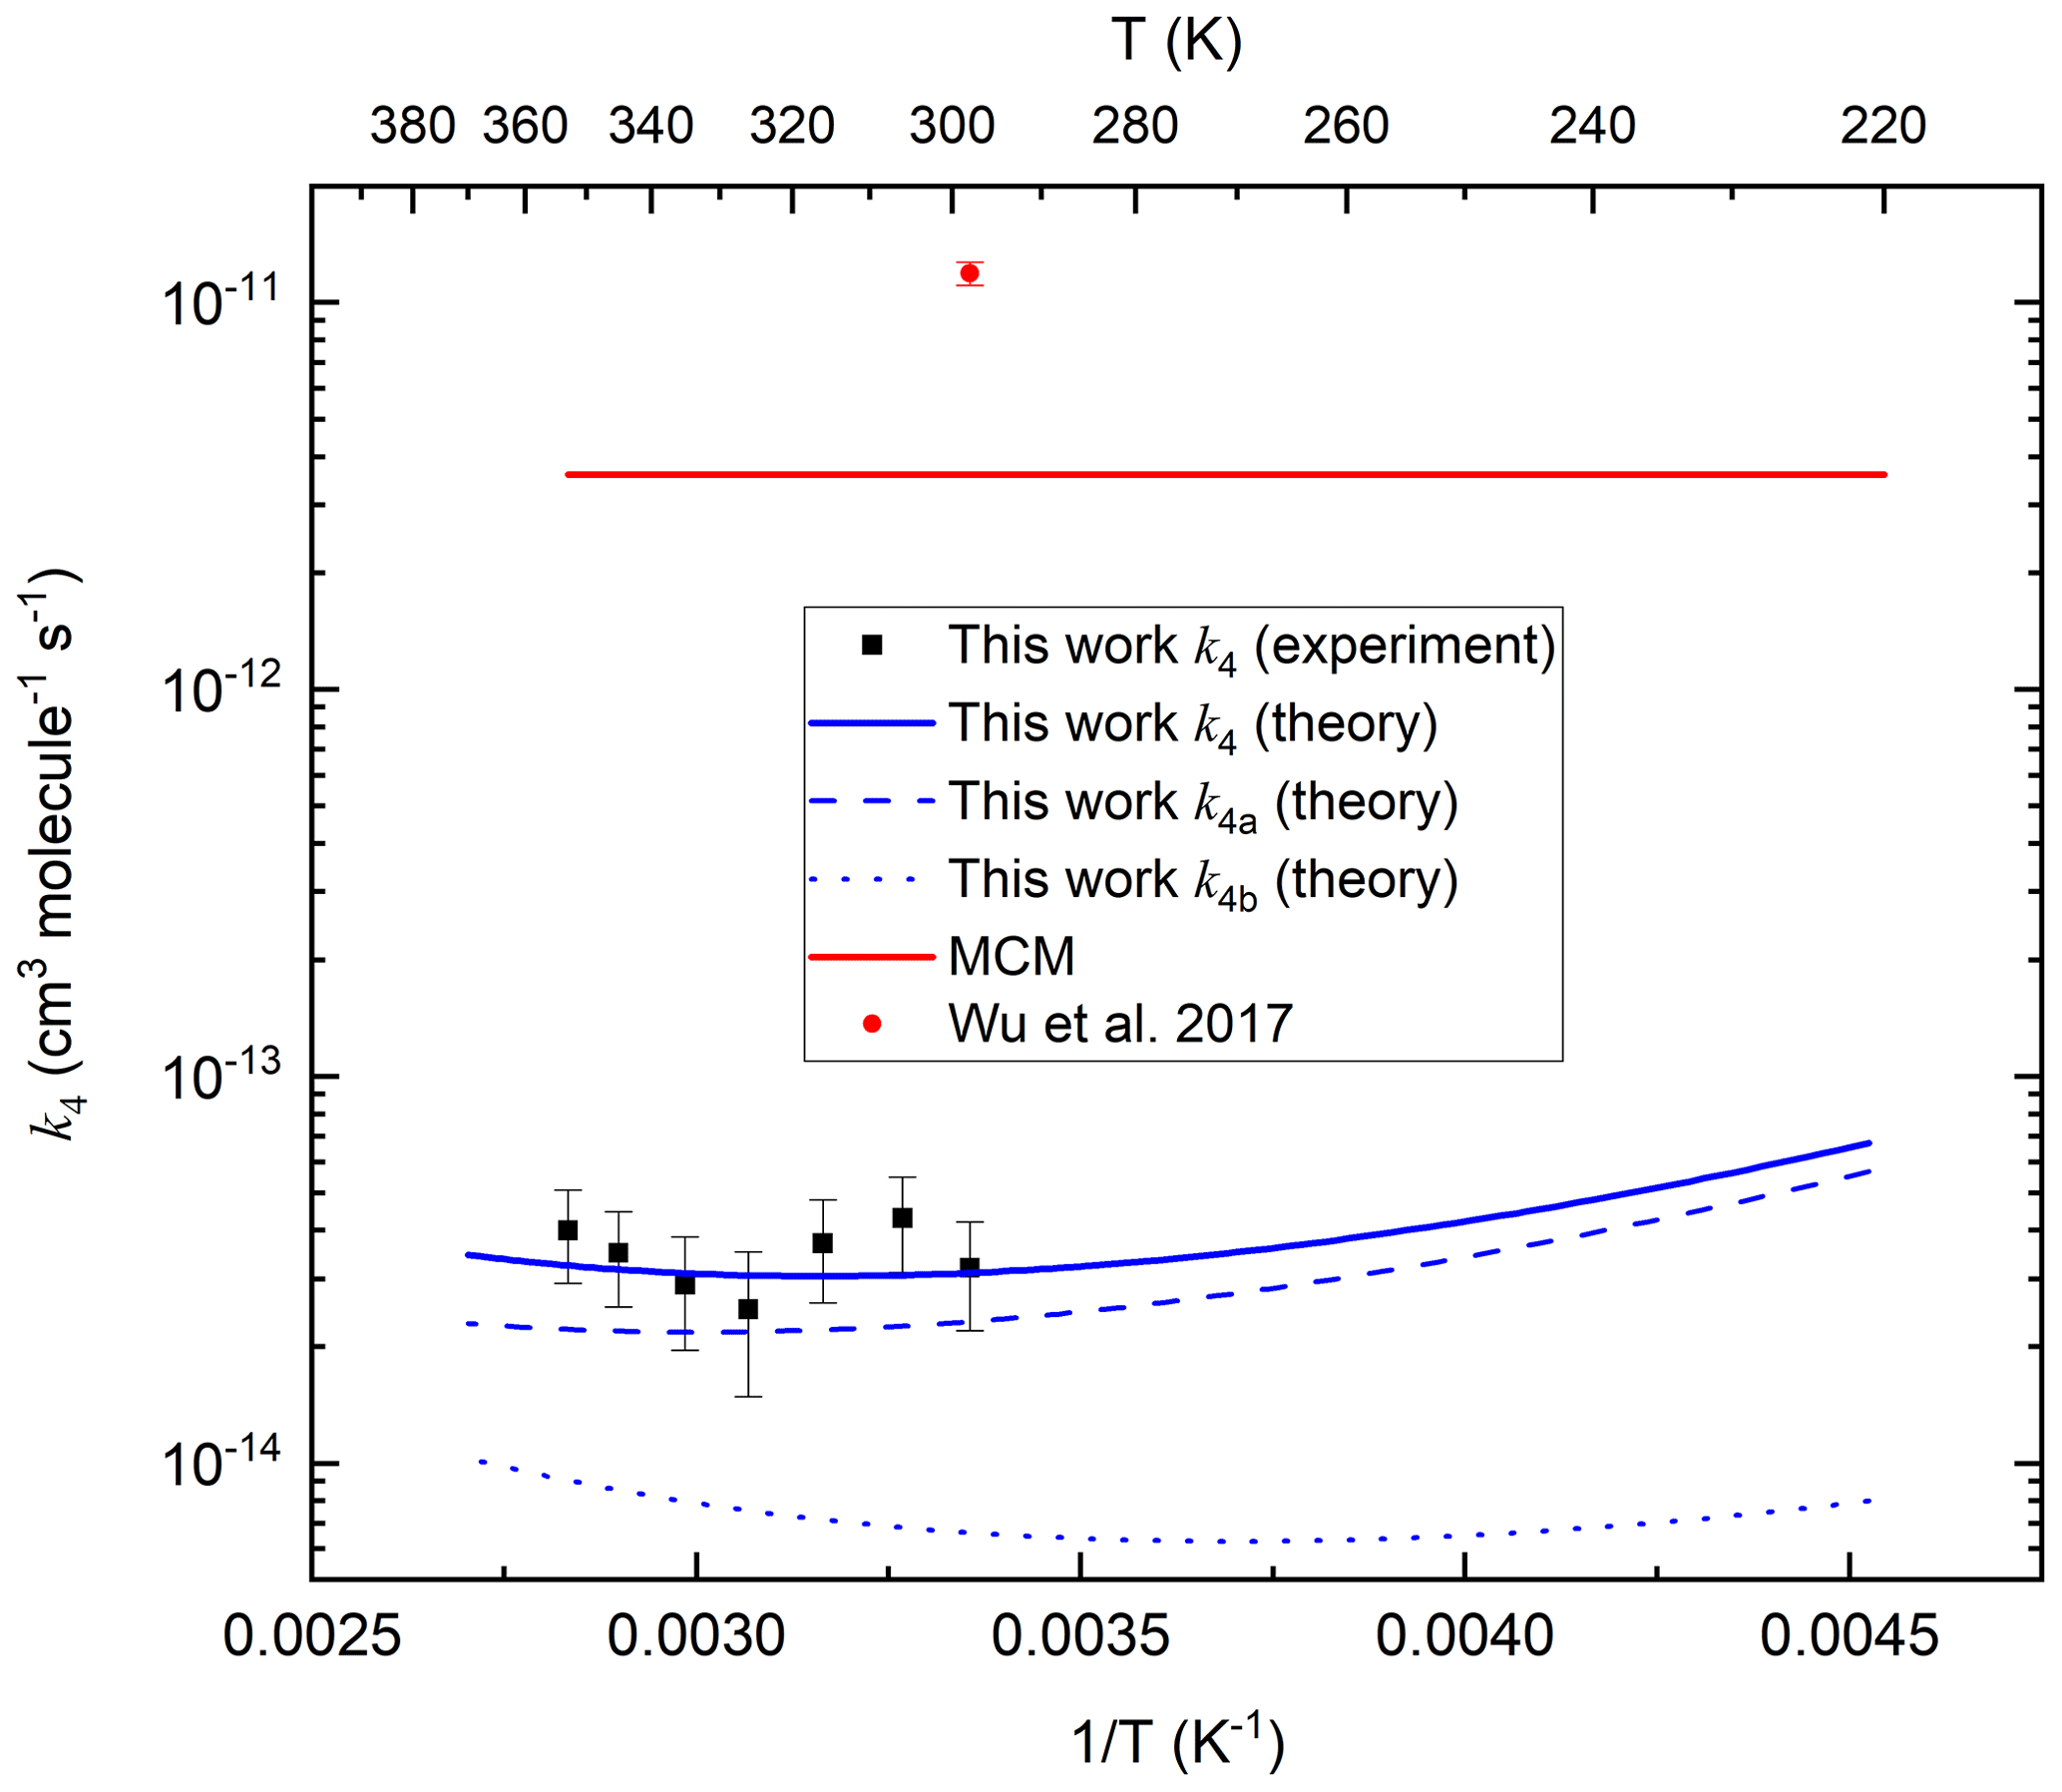
Figure 9Rate coefficients (k4, k4a and k4b) for the OH + CH3C(O)OOH reaction. MCM is the value used in the Master Chemical Mechanism. The error bars in the present dataset include uncertainty in the value of and IR absorption cross-sections of CH3C(O)OOH. As described in the text, there are several reasons why the experimental rate coefficients should be regarded as upper limits.
With acetic and peracetic acids having similar mechanisms, this does not yet explain why the reaction with peracetic acid + OH is so much slower than the reaction of acetic acid + OH, despite the fact that the acidic H abstraction barrier height for CH3C(O)OH, 3.3 kcal mol−1 (De Smedt et al., 2005) is comparable within ∼ 0.3 kcal mol−1 to that for CH3C(O)OOH, 2.99 kcal mol−1 (this work). The critical difference lies in the H bonding in the reactant and prereaction complex. In CH3C(O)OH, the H bond between the acidic H atom and the carbonyl oxygen is very long, ∼2.25 Å, and thus weak. In CH3C(O)OOH acid in contrast, this H bond is very short, 1.88 Å, and strong. Acetic acid can thus act without a penalty as a bidentate ligand for OH, forming two strong H bonds, leading to a planar complex with 7.3 kcal mol−1 stability (De Smedt et al., 2005). CH3C(O)OOH, in contrast, can either form a complex with only a single H bond on OH or needs to break the strong peracidic bond to form a geometrically unfavourable, non-planar complex with two OH hydrogen bonds. The peracidic complex is thus significantly less stable, by ≈4.0 kcal mol−1, where the energy of the doubly H-bonded OH radical complex is 0.5 kcal mol−1 higher than that of the most stable single-H-bonded complex, retaining the peracidic H bond. At room temperature, this weaker bonding decreases the lifetime of the prereactive complex by over 2 orders of magnitude compared to acetic acid, significantly reducing its equilibrium concentration and its ability to tunnel slowly through the barrier. This leads to a slower product formation rate compared to acetic acid, with a larger fraction of the prereaction complexes simply re-dissociating to the free reactants. Concomitantly, the deeper complex well for acetic acid + OH allows this latter reaction to show a negative T-dependent rate coefficient by sustained tunnelling even at higher temperatures, up to ∼500 K (Khamaganov et al., 2006), well beyond our predictions of a minimum of around 270 K for peracetic acid. Furthermore, we calculate a slightly wider energy barrier for peracetic acid, with a 1700 cm−1 imaginary frequency, compared to that reported for acetic acid, 2000 cm−1 (De Smedt et al., 2005), which further limits tunnelling for peracetic acid compared to acetic acid.
The strong H bond in peracetic acid also make its H abstraction reactions slower than in alkyl hydroperoxides such as CH3OOH. These ROOH compounds can easily form complexes with OH radicals, and the H abstraction transition states are thus submerged by up to 1 kcal mol−1 below the free reactants (Anglada et al., 2017), and even the somewhat less favourable H2O2 + OH reaction has energy barriers only ∼1 kcal mol−1 above the reactants (Buszek et al., 2012). This enables the ROOH + OH reactions to proceed substantially faster than CH3C(O)OOH + OH.
The dominant products of the OH-initiated degradation of CH3C(O)OOH in air are the acetylperoxy radical, CH3C(O)OO, the fate of which is described in Sect. 1, and includes formation of PAN or reformation of CH3C(O)OOH. In air, the minor CH2C(O)OOH product of Reaction (R4b) is expected to add O2, forming a peracetic acid peroxy radical, OOCH2C(O)OOH, which will also undergo reactions with NO, RO2 and HO2.
OCH2C(O)OOH will quickly decompose to HCHO, CO2 and OH (Vereecken and Peeters, 2009).
Given that the slow abstraction of the peracetic H atom is a feature of the –C(O)OOH moiety and that the abstraction reaction is not influenced unduly by other functionalities in the molecules, we propose that the site-specific abstraction rate coefficient can be generalized to all peracids and used in group-additive structure–activity relationships. Only for long-chain oxygenated molecules, where an oxygenated group can reach the –C(O)OOH group and influence the H bonding with OH, can one expect a non-negligible deviation in the site-specific rate.
4.7 Atmospheric implications
Our experimental and theoretical results indicate that the reaction of CH3C(O)OOH with OH has a rate coefficient of cm3 molec.−1 s−1 at temperatures prevalent in the lowermost atmosphere (i.e. in the boundary layer at mid-latitudes), doubling to cm3 molec.−1 s−1 at temperatures close to 230 K, as found in, for example, the upper troposphere. Assuming a global averaged OH abundance of 1×10⁶ molec. cm−3, these rate coefficients imply a lifetime of CH3C(O)OOH with respect to degradation by OH of between about 6 months and 1 year. Given the low rate coefficient for reaction of CH3C(O)OOH with OH, other loss processes are likely to dominate its atmospheric fate; these are wet and dry deposition, uptake to aerosols and photolysis so that its lifetime will be given by
where J is the first-order rate coefficient for photolysis by actinic radiation, kdep is the effective loss rate coefficient for removal by deposition and khet is the loss rate coefficient for heterogeneous uptake to aerosol particles. The rate at which CH3C(O)OOH will deposit on surfaces in the boundary layer is given by its deposition velocity and the boundary-layer height. Crowley et al. (2018) have assessed the terms kdep (for dry deposition) and khet for a summertime, mid-latitude, forested environment. Based on observations of CH3C(O)OOH and H2O2, solubilities of CH3C(O)OOH and H2O2 (Sander, 1999) actinic flux measurements, the UV absorption spectrum of CH3C(O)OOH (Orlando and Tyndall, 2003) aerosol surface areas and an experimental uptake coefficient (Wu et al., 2015), they derived values of kdep ∼ 3–5 × 10⁻⁵ s−1, s−1 and J s−1 at local noon and concluded that, in the absence of rain, dry deposition is the dominant loss process in the boundary layer.
Above the boundary layer the loss of CH3C(O)OOH via deposition and heterogeneous uptake to aerosol is less significant so that reaction with OH and photolysis will define its lifetime. A photolysis rate coefficient (J value) of s−1 for CH3C(O)OOH in the free and upper troposphere results in a lifetime of ∼ 3–4 weeks (Orlando and Tyndall, 2003). We note, however, that estimates of the photolysis rate coefficient are based on a single absorption spectrum measured to date (Orlando and Tyndall, 2003) and the assumption of a unity photodissociation quantum yield throughout the UV absorption spectrum, which remains unconfirmed by experiment or theory.
Both experimental and theoretical studies of the reaction between OH and CH3C(O)OOH firmly establish that this is a slow process. The experimental work shows the rate coefficient is cm3 molec.−1 s−1 at 298 K, consistent with the theory-derived, temperature-dependent rate coefficients between 3 and cm3 molec.−1 s−1 for the entire troposphere. The low rate coefficient is rationalized in terms of a weakly bound (short-lived) prereaction complex combined with a sufficiently broad reaction barrier to reduce product formation by tunnelling. The site-specific rate coefficient for H abstraction from the –C(O)OOH moiety can be generalized to most reactions of OH with peracids, which will thus also be slow. The rate coefficient for the OH reaction is thus at least 2 orders of magnitude lower than previously reported and implies that the lifetime of CH3C(O)OOH is dominated by deposition processes (notably dry deposition) in the boundary layer and photolysis in the free and upper troposphere, with OH-initiated degradation playing a minor role. The boundary-layer lifetime is expected to be of the order of 1 d, increasing to weeks in the free and upper troposphere. The longer than previously assumed chemical lifetime of CH3C(O)OOH and probably of other peracids increases their potential to contribute to secondary organic aerosol formation.
The rate coefficients measured in the experimental study are listed in Table S1.
The supplement related to this article is available online at: https://doi.org/10.5194/acp-20-13541-2020-supplement.
The experiments were carried out by MB and DA, and the quantum chemical calculations were done by LV. The experimental data analysis was performed by MB, DA and JC. The paper was written by MB and JC with assistance from LV and JL.
The authors declare that they have no conflict of interest.
We thank Dirk Dienhart for measurement of H2O2 and CH3C(O)OOH in the headspace of our CH3C(O)OOH sample. We thank Geoff Tyndall, John Orlando and Tim Wallington for helpful discussions about the IR spectrum of CH3C(O)OOH and for providing the NCAR spectrum reported by Orlando et al. (2000).
The article processing charges for this open-access publication were covered by the Max Planck Society.
This paper was edited by Dwayne Heard and reviewed by two anonymous referees.
Alecu, I. M., Zheng, J. J., Zhao, Y., and Truhlar, D. G.: Computational thermochemistry: scale factor databases and scale factors for vibrational frequencies obtained from electronic model chemistries, J. Chem. Theor. Comput., 6, 2872–2887, 2010.
Andreae, M. O.: Emission of trace gases and aerosols from biomass burning – an updated assessment, Atmos. Chem. Phys., 19, 8523–8546, https://doi.org/10.5194/acp-19-8523-2019, 2019.
Anglada, J. M.: Complex mechanism of the gas phase reaction between formic acid and hydroxyl radical. Proton coupled electron transfer versus radical hydrogen abstraction mechanisms, J. Am. Chem. Soc., 126, 9809–9820, 2004.
Anglada, J. M., Crehuet, R., Martins-Costa, M., Francisco, J. S., and Ruiz-López, M.: The atmospheric oxidation of CH3OOH by the OH radical: the effect of water vapor, Phys. Chem. Chem. Phys., 19, 12331–12342, 2017.
Assaf, E., Schoemaecker, C., Vereecken, L., and Fittschen, C.: Experimental and theoretical investigation of the reaction of RO2 radicals with OH radicals: Dependence of the HO2 yield on the size of the alkyl group, Int. J. Chem. Kinet., 50, 670–680, 2018.
Atkinson, R., Baulch, D. L., Cox, R. A., Crowley, J. N., Hampson, R. F., Hynes, R. G., Jenkin, M. E., Rossi, M. J., Troe, J., and IUPAC Subcommittee: Evaluated kinetic and photochemical data for atmospheric chemistry: Volume II – gas phase reactions of organic species, Atmos. Chem. Phys., 6, 3625–4055, https://doi.org/10.5194/acp-6-3625-2006, 2006.
Bao, J. L., Zheng, J., Alecu, I. M., Lynch, B. J., Zhao, Y., and Truhlar, D. G.: Database of Frequency Scale Factors for Electronic Model Chemistries (Version 4), available at: http://comp.chem.umn.edu/freqscale/index.html (last access: July 2020), 2018.
Berasategui, M., Amedro, D., Edtbauer, A., Williams, J., Lelieveld, J., and Crowley, J. N.: Kinetic and mechanistic study of the reaction between methane sulfonamide (CH3S(O)2NH2) and OH, Atmos. Chem. Phys., 20, 2695–2707, https://doi.org/10.5194/acp-20-2695-2020, 2020.
Bunkan, A. J. C., Srinivasulu, G., Amedro, D., Vereecken, L., Wallington, T. J., and Crowley, J. N.: Products and Mechanism of the OH initiated photo oxidation of perfluoro ethyl vinyl ether, C2F5OCF=CF2, Phys. Chem. Chem. Phys., 20, 11306–11316, 2018.
Burkholder, J. B., Talukdar, R. K., Ravishankara, A. R., and Solomon, S.: Temperature dependence of the HNO3 UV absorption cross-sections, J. Geophys. Res.-Atmos., 98, 22937–22948, 1993.
Burkholder, J. B., Sander, S. P., Abbatt, J., Barker, J. R., Huie, R. E., Kolb, C. E., Kurylo, M. J., Orkin, V. L., Wilmouth, D. M., and Wine, P. H.: Chemical Kinetics and Photochemical Data for Use in Atmospheric Studies, Evaluation No. 18, JPL Publication 15-10, Jet Propulsion Laboratory, Pasadena, available at: http://jpldataeval.jpl.nasa.gov (last access: July 2020), 2015.
Buszek, R. J., Torrent-Sucarrat, M., Anglada, J. M., and Francisco, J. S.: Effects of a single water molecule on the OH + H2O2 reaction, J. Phys. Chem. A, 116, 5821–5829, 2012.
Calvert, J. G., Mellouki, A., Pilling, M. J., and Wallington, T. J.: The Mechanisms of Atmospheric Oxidation of the Oxygenates, Oxford Univ. Press, New York, 2011.
Cantrell, C. A., Zimmer, A., and Tyndall, G. S.: Absorption cross sections for water vapor from 183 to 193 nm, Geophys. Res. Lett., 24, 2195–2198, 1997.
Crawford, M. A., Wallington, T. J., Szente, J. J., Maricq, M. M., and Francisco, J. S.: Kinetics and mechanism of the acetylperoxy plus HO2 reaction, J. Phys. Chem. A, 103, 365–378, 1999.
Crounse, J. D., McKinney, K. A., Kwan, A. J., and Wennberg, P. O.: Measurement of gas-phase hydroperoxides by chemical ionization mass spectrometry, Anal. Chem., 78, 6726–6732, 2006.
Crowley, J. N., Pouvesle, N., Phillips, G. J., Axinte, R., Fischer, H., Petäjä, T., Nölscher, A., Williams, J., Hens, K., Harder, H., Martinez-Harder, M., Novelli, A., Kubistin, D., Bohn, B., and Lelieveld, J.: Insights into HOx and ROx chemistry in the boreal forest via measurement of peroxyacetic acid, peroxyacetic nitric anhydride (PAN) and hydrogen peroxide, Atmos. Chem. Phys., 18, 13457-13479, 2018.
De Smedt, F., Bui, X. V., Nguyen, T. L., Peeters, J., and Vereecken, L.: Theoretical and experimental study of the product branching in the reaction of acetic acid with OH radicals, J. Phys. Chem. A, 109, 2401–2409, 2005.
Docherty, K. S., Wu, W., Lim, Y. B., and Ziemann, P. J.: Contributions of organic peroxides to secondary aerosol formed from reactions of monoterpenes with O3, Environ. Sci. Technol., 39, 4049–4059, 2005.
Dunning, T. H.: Gaussian-basis sets for use in correlated molecular calculations .1. the atoms boron through neon and hydrogen, J. Chem. Phys., 90, 1007–1023, 1989.
Eckart, C.: The penetration of a potential barrier by electrons, Phys. Rev., 35, 1303–1309, 1930.
Fels, M. and Junkermann, W.: The occurrence of organic peroxides in air at a mountain site, Geophys. Res. Lett., 21, 341–344, 1994.
Fischer, E. V., Jacob, D. J., Yantosca, R. M., Sulprizio, M. P., Millet, D. B., Mao, J., Paulot, F., Singh, H. B., Roiger, A., Ries, L., Talbot, R. W., Dzepina, K., and Pandey Deolal, S.: Atmospheric peroxyacetyl nitrate (PAN): a global budget and source attribution, Atmos. Chem. Phys., 14, 2679–2698, https://doi.org/10.5194/acp-14-2679-2014, 2014.
Fischer, H., Pozzer, A., Schmitt, T., Jöckel, P., Klippel, T., Taraborrelli, D., and Lelieveld, J.: Hydrogen peroxide in the marine boundary layer over the South Atlantic during the OOMPH cruise in March 2007, Atmos. Chem. Phys., 15, 6971–6980, https://doi.org/10.5194/acp-15-6971-2015, 2015.
Goerigk, L., Hansen, A., Bauer, C., Ehrlich, S., Najibi, A., and Grimme, S.: A look at the density functional theory zoo with the advanced GMTKN55 database for general main group thermochemistry, kinetics and noncovalent interactions, Phys. Chem. Chem. Phys., 19, 32184–32215, 2017.
Grimme, S., Ehrlich, S., and Goerigk, L.: Effect of the Damping Function in Dispersion Corrected Density Functional Theory, J. Comput. Chem., 32, 1456–1465, 2011.
Gunz, D. W. and Hoffmann, M. R.: Atmospheric chemistry of peroxides – a review, Atmos. Environ. A-Gen., 24, 1601–1633, 1990.
Hasson, A. S., Tyndall, G. S., and Orlando, J. J.: A product yield study of the reaction of HO2 radicals with ethyl peroxy (C2H5O2), acetyl peroxy (CH3C(O)O2), and acetonyl peroxy (CH3C(O)CH2O2) radicals, J. Phys. Chem. A, 108, 5979–5989, 2004.
He, S. Z., Chen, Z. M., Zhang, X., Zhao, Y., Huang, D. M., Zhao, J. N., Zhu, T., Hu, M., and Zeng, L. M.: Measurement of atmospheric hydrogen peroxide and organic peroxides in Beijing before and during the 2008 Olympic Games: Chemical and physical factors influencing their concentrations, J. Geophys. Res.-Atmos., 115, D17307, https://doi.org/10.1029/2009JD013544, 2010.
Henneken, H., Assink, L., de Wit, J., Vogel, M., and Karst, U.: Passive sampling of airborne peroxyacetic acid, Anal. Chem., 78, 6547–6555, 2006.
Huber, K. P. and Herzberg, G.: Molecular spectra and molecular structure IV. Constants of diatomic molecules, Van Nostrand Reinhold Company Inc., New York, 1979.
IUPAC Task Group (Ammann, M., Cox, R. A., Crowley, J. N., Herrmann, H., Jenkin, M. E., McNeill, V. F., Mellouki, A., Rossi, M. J., Troe, J., and Wallington, T. J.): Atmospheric Chemical Kinetic Data Evaluation, available at: http://iupac.pole-ether.fr/index.html, last access: June 2020.
Jackson, A. V. and Hewitt, C. N.: Atmosphere hydrogen peroxide and organic hydroperoxides: a review, Crit. Rev. Env. Sci. Tec., 29, 175–228, 1999.
Johnston, H. S. and Heicklen, J.: Tunnelling corrections for unsymmetrical eckart potential energy barriers, J. Phys. Chem., 66, 532–533, 1962.
Khamaganov, V. G., Bui, V. X., Carl, S. A., and Peeters, J.: Absolute rate coefficient of the OH + CH3C(O)OH reaction at T = 287–802 K. The two faces of pre-reactive H-bonding, J. Phys. Chem. A, 110, 12852–12859, 2006.
Lee, M. H., Heikes, B. G., and O'Sullivan, D. W.: Hydrogen peroxide and organic hydroperoxide in the troposphere: A review, Atmos. Environ., 34, 3475–3494, 2000.
Liang, H., Chen, Z. M., Huang, D., Zhao, Y., and Li, Z. Y.: Impacts of aerosols on the chemistry of atmospheric trace gases: a case study of peroxides and HO2 radicals, Atmos. Chem. Phys., 13, 11259–11276, https://doi.org/10.5194/acp-13-11259-2013, 2013.
Martin, J. M. L.: Ab initio total atomization energies of small molecules – Towards the basis set limit, Chem. Phys. Lett., 259, 669–678, 1996.
Orlando, J. J. and Tyndall, G. S.: Gas phase UV absorption spectra for peracetic acid, and for acetic acid monomers and dimers, J. Photochem. Photobio. A, 157, 161–166, 2003.
Orlando, J. J., Tyndall, G. S., Vereecken, L., and Peeters, J.: The atmospheric chemistry of the acetonoxy radical, J. Phys. Chem., 104, 11578–11588, 2000a.
Orlando, J. J., Tyndall, G. S., Vereecken, L., and Peeters, J.: The atmospheric chemistry of the acetonoxy radical, J. Phys. Chem. A, 104, 11578–11588, 2000b.
Pacenti, M., Dugheri, S., Boccalon, P., Arcangeli, G., Dolara, P., and Cupelli, V.: Air Monitoring and Assessment of Occupational Exposure to Peracetic Acid in a Hospital Environment, Ind. Health, 48, 217–221, 2010.
Paulot, F., Wunch, D., Crounse, J. D., Toon, G. C., Millet, D. B., DeCarlo, P. F., Vigouroux, C., Deutscher, N. M., González Abad, G., Notholt, J., Warneke, T., Hannigan, J. W., Warneke, C., de Gouw, J. A., Dunlea, E. J., De Mazière, M., Griffith, D. W. T., Bernath, P., Jimenez, J. L., and Wennberg, P. O.: Importance of secondary sources in the atmospheric budgets of formic and acetic acids, Atmos. Chem. Phys., 11, 1989–2013, https://doi.org/10.5194/acp-11-1989-2011, 2011.
Pereira, R. D., Baulch, D. L., Pilling, M. J., Robertson, S. H., and Zeng, G.: Temperature and pressure dependence of the multichannel rate coefficients for the CH3 + OH system, J. Phys. Chem. A, 101, 9681–9693, 1997.
Phillips, G. J., Pouvesle, N., Thieser, J., Schuster, G., Axinte, R., Fischer, H., Williams, J., Lelieveld, J., and Crowley, J. N.: Peroxyacetyl nitrate (PAN) and peroxyacetic acid (PAA) measurements by iodide chemical ionisation mass spectrometry: first analysis of results in the boreal forest and implications for the measurement of PAN fluxes, Atmos. Chem. Phys., 13, 1129–1139, https://doi.org/10.5194/acp-13-1129-2013, 2013.
Purvis, G. D. and Bartlett, R. J.: A full coupled-cluster singles and doubles model – the inclusion of disconnected triples, J. Chem. Phys., 76, 1910–1918, 1982.
Reeves, C. E. and Penkett, S. A.: Measurements of peroxides and what they tell us, Chem. Rev., 103, 5199–5218, 2003.
Rypkema, H. A. and Francisco, J. S.: Atmospheric Oxidation of Peroxyacetic Acid, J. Phys. Chem. A, 117, 14151–14162, 2013.
Sander, R.: Compilation of Henry's law constants for inorganic and organic species of potential importance in environmental chemistry, available at: http://www.mpch-mainz.mpg.de/~sander/res/henry.html (last access: June 2020), 1999.
Sangwan, M., Chesnokov, E. N., and Krasnoperov, L. N.: Reaction CH3 + OH Studied over the 294–714 K Temperature and 1–100 bar Pressure Ranges, J. Phys. Chem. A, 116, 8661–8670, 2012.
Singleton, D. L., Paraskevopoulos, G., and Irwin, R. S.: Rates of OH radical reactions 18. Rates and mechanism of the reactions of hydroxyl radicals with acetic, deuterated acetic, and propionic acids in the gas-phase, J. Am. Chem. Soc., 111, 5248–5251, 1989.
Travis, K. R., Heald, C. L., Allen, H. M., Apel, E. C., Arnold, S. R., Blake, D. R., Brune, W. H., Chen, X., Commane, R., Crounse, J. D., Daube, B. C., Diskin, G. S., Elkins, J. W., Evans, M. J., Hall, S. R., Hintsa, E. J., Hornbrook, R. S., Kasibhatla, P. S., Kim, M. J., Luo, G., McKain, K., Millet, D. B., Moore, F. L., Peischl, J., Ryerson, T. B., Sherwen, T., Thames, A. B., Ullmann, K., Wang, X., Wennberg, P. O., Wolfe, G. M., and Yu, F.: Constraining remote oxidation capacity with ATom observations, Atmos. Chem. Phys., 20, 7753–7781, https://doi.org/10.5194/acp-20-7753-2020, 2020.
Truhlar, D. G., Garrett, B. C., and Klippenstein, S. J.: Current status of transition-state theory, J. Phys. Chem., 100, 12771–12800, 1996.
Vaghjiani, G. L. and Ravishankara, A. R.: Absorption cross-Sections of CH3OOH, H2O2, and D2O2 vapors between 210 nm and 365 nm at 297 K, J. Geophys. Res.-Atmos., 94, 3487–3492, 1989a.
Vaghjiani, G. L. and Ravishankara, A. R.: Kinetics and mechanism of OH reaction with CH3OOH, J. Phys. Chem., 93, 1948–1959, 1989b.
Vandenberk, S., Vereecken, L., and Peeters, J.: The acetic acid forming channel in the acetone plus OH reaction: A combined experimental and theoretical investigation, Phys. Chem. Chem. Phys., 4, 461–466, 2002.
Vereecken, L. and Peeters, J.: The 1,5-H-shift in 1-butoxy: A case study in the rigorous implementation of transition state theory for a multirotamer system, J. Chem. Phys., 119, 5159–5170, 2003.
Vereecken, L. and Peeters, J.: Decomposition of substituted alkoxy radicals-part I: a generalized structure-activity relationship for reaction barrier heights, Phys. Chem. Chem. Phys., 11, 9062–9074, 2009.
Walker, S. J., Evans, M. J., Jackson, A. V., Steinbacher, M., Zellweger, C., and McQuaid, J. B.: Processes controlling the concentration of hydroperoxides at Jungfraujoch Observatory, Switzerland, Atmos. Chem. Phys., 6, 5525–5536, https://doi.org/10.5194/acp-6-5525-2006, 2006.
Wang, S. Y., Hornbrook, R. S., Hills, A., Emmons, L. K., Tilmes, S., Lamarque, J. F., Jimenez, J. L., Campuzano-Jost, P., Nault, E. A., Crounse, J. D., Wennberg, P. O., Kim, M., Allen, H., Ryerson, T. B., Thompson, C. R., Peischl, J., Moore, F., Nance, D., Hall, B., Elkins, J., Tanner, D., Huey, L. G., Hall, S. R., Ullmann, K., Orlando, J. J., Tyndall, G. S., Flocke, F. M., Ray, E., Hanisco, T. F., Wolfe, G. M., St Clair, J., Commane, R., Daube, B., Barletta, B., Blake, D. R., Weinzierl, B., Dollner, M., Conley, A., Vitt, F., Wofsy, S. C., Riemer, D. D., and Apel, E. C.: Atmospheric acetaldehyde: importance of air-sea exchange and a missing source in the remote troposphere, Geophys. Res. Lett., 46, 5601–5613, 2019.
Wollenhaupt, M., Carl, S. A., Horowitz, A., and Crowley, J. N.: Rate coefficients for reaction of OH with acetone between 202 and 395 K, J. Phys. Chem., 104, 2695–2705, 2000.
Wu, H., Wang, Y., Li, H., Huang, L., Huang, D., Shen, H., Xing, Y., and Chen, Z.: The OH-initiated oxidation of atmospheric peroxyacetic acid: Experimental and model studies, Atmos. Environ., 164, 61–70, 2017.
Wu, Q. Q., Huang, L. B., Liang, H., Zhao, Y., Huang, D., and Chen, Z. M.: Heterogeneous reaction of peroxyacetic acid and hydrogen peroxide on ambient aerosol particles under dry and humid conditions: kinetics, mechanism and implications, Atmos. Chem. Phys., 15, 6851–6866, https://doi.org/10.5194/acp-15-6851-2015, 2015.
Zhang, X., Chen, Z. M., He, S. Z., Hua, W., Zhao, Y., and Li, J. L.: Peroxyacetic acid in urban and rural atmosphere: concentration, feedback on PAN-NOx cycle and implication on radical chemistry, Atmos. Chem. Phys., 10, 737–748, https://doi.org/10.5194/acp-10-737-2010, 2010.
Zhao, Y. and Truhlar, D. G.: The M06 suite of density functionals for main group thermochemistry, thermochemical kinetics, noncovalent interactions, excited states, and transition elements: two new functionals and systematic testing of four M06-class functionals and 12 other functionals, Theor. Chem. Acc., 120, 215–241, 2008.