the Creative Commons Attribution 4.0 License.
the Creative Commons Attribution 4.0 License.
 | 12 Nov 2020
How aerosols and greenhouse gases influence the diurnal temperature range
Camilla W. Stjern
Bjørn H. Samset
Olivier Boucher
Trond Iversen
Jean-François Lamarque
Gunnar Myhre
Drew Shindell
Toshihiko Takemura
The diurnal temperature range (DTR) (or difference between the maximum and minimum temperature within a day) is one of many climate parameters that affects health, agriculture and society. Understanding how DTR evolves under global warming is therefore crucial. Physically different drivers of climate change, such as greenhouse gases and aerosols, have distinct influences on global and regional climate. Therefore, predicting the future evolution of DTR requires knowledge of the effects of individual climate forcers, as well as of the future emissions mix, in particular in high-emission regions. Using global climate model simulations from the Precipitation Driver and Response Model Intercomparison Project (PDRMIP), we investigate how idealized changes in the atmospheric levels of a greenhouse gas (CO2) and aerosols (black carbon and sulfate) influence DTR (globally and in selected regions). We find broad geographical patterns of annual mean change that are similar between climate drivers, pointing to a generalized response to global warming which is not defined by the individual forcing agents. Seasonal and regional differences, however, are substantial, which highlights the potential importance of local background conditions and feedbacks. While differences in DTR responses among drivers are minor in Europe and North America, there are distinctly different DTR responses to aerosols and greenhouse gas perturbations over India and China, where present aerosol emissions are particularly high. BC induces substantial reductions in DTR, which we attribute to strong modeled BC-induced cloud responses in these regions.
- Article
(7016 KB) - Full-text XML
-
Supplement
(3179 KB) - BibTeX
- EndNote


As the global climate warms (Hartmann et al., 2013), changes are not only observed in the daily mean temperature but also in a variety of parameters relevant to society. One such parameter is the diurnal temperature range (DTR), which is a measure of the difference between the maximum and the minimum temperature over a 24 h period. Variations in the magnitude of the DTR have been found to influence mortality and morbidity (Cheng et al., 2014; Kim et al., 2016; Lim et al., 2012), parasite infection and transmission (Paaijmans et al., 2010), and crop failure (Hernandez-Barrera et al., 2017; Lobell, 2007). Future changes in DTR are therefore a potential driver of climate impacts, especially in vulnerable regions, affecting risk assessments associated with health and agriculture.
A range of geophysical processes contribute to the land surface DTR of a given region. Ultimately, DTR changes are driven by differential changes to daily maximum and minimum temperatures. Maximum temperatures (Tmax) are reached during daytime, due to the excess of incoming shortwave (SW or solar) radiation. Minimum temperatures (Tmin) occur at night, primarily due to cooling by longwave (LW or heat) radiation. As LW cooling is active during both daytime and nighttime, factors affecting primarily LW radiation will have an effect on both Tmin and Tmax, reducing the potential influence on DTR. Thus, greenhouse gases such as CO2 or water vapor, which have a particularly strong effect on LW radiation fluxes throughout the day (e.g., Lagouarde and Brunet, 1993), are not initially expected to have the strongest direct radiative influence on DTR. Dai et al. (1999) showed that changes in water vapor had a relatively small effect on DTR. Aerosols, on the other hand, primarily have climate interactions affecting the shortwave (SW) spectrum. They tend to lower the amount of downwelling SW radiation at the surface through scattering and absorption, initially reducing the daytime Tmax and thus reducing DTR.
In addition to the direct interactions with SW and, to a lesser extent, LW radiation, greenhouse gases and aerosols alike have a range of indirect (radiative and nonradiative) influences on climate. These effects can cause further changes to Tmin and Tmax. For instance, sulfate aerosols can interact microphysically with clouds to make them more reflective (Twomey, 1974) or increase the general cloud cover by increasing cloud lifetime (Albrecht, 1989). Cloud changes have been shown to have a strong influence on DTR, mainly by blocking SW radiation and hence reducing Tmax (e.g., Dai et al., 1999). Increased cloud thickness or cloud cover will also affect the surface energy budget by increasing downwelling LW radiation. This effect operates during both day and night.
The strong atmospheric absorption by BC and CO2 can cause rapid adjustments in both cloudiness and precipitation through their influence on atmospheric stability (Hansen et al., 1997; Richardson et al., 2018; Stjern et al., 2017). An increase in precipitation, for instance, may induce changes in soil moisture, which could in turn influence DTR through a reduced Tmin due to enhanced evaporation (Zhou et al., 2007). On a longer timescale, feedback responses following a warming climate can cause changes to DTR via associated changes in cloud cover (Dai et al., 1999), atmospheric circulation, precipitation (Karl et al., 1993), soil moisture (Zhou et al., 2007), surface heat storage capacity (Kleidon and Renner, 2017), land use (Mohan and Kandya, 2015), and the turbulent fluxes of sensible and latent heat in the atmospheric boundary layer (Davy et al., 2017). Finally, each process and its effect on DTR may be modified by nonlinear effects such as, for example, local hydrological conditions or atmospheric stratification.
Observations show a general reduction in DTR over the twentieth century, typically mediated by a stronger increase in the daily minimum temperature than in the daily maximum temperature (Dai et al., 1999; Karl et al., 1993; Vose et al., 2005). This trend in DTR has been linked to anthropogenic emissions, but whether greenhouse gases or aerosols are the dominating influence, as well as what roles these respective climate drivers will play in future DTR changes, is not clear. For instance, Vose et al. (2005) showed that while the overall trend in DTR was negative for western US and central Europe for the period of 1950–2005, it reverses to a positive trend in these regions when considering the later 1979–2005 period which saw reductions in aerosol emissions. China, however, saw a DTR reduction also for this later period – but it is also located at lower latitudes.
Over the coming decades, we can expect continued emissions of both greenhouse gases and aerosols but with amounts and a relative balance that are determined by future socioeconomic and political developments. The global backdrop of increased greenhouse-gas-induced forcing will be combined with an aerosol influence that has regionally heterogeneous patterns and potentially strong trends. As an example, the global burden of aerosol loading has recently shifted from Europe to Asia (Myhre et al., 2017b). These aerosol trends have been designated as potential causes of the ongoing drying of the Mediterranean region (Tang et al., 2017) and of changes to the Southeast Asian Monsoon circulations (Wilcox et al., 2020). However, the future balance between the different climate forcers is highly uncertain, and it differs markedly between the various Shared Socioeconomic Pathways currently in use by the projection and climate impact communities (Lund et al., 2019; Rao et al., 2017). In particular, they include a wide range of possible emission combinations of BC and SO4 from India and China, some of which lead to a strong dipole pattern in regional aerosol-induced radiative forcing over the coming decades (Samset et al., 2019).
Given the uncertainty in future emission trends, disentangling the individual responses of DTR to these two aerosol species and understanding how their influence differs from that of CO2, when taking into account both direct and indirect effects and their climate feedbacks, are of high relevance. Such understanding is an important prerequisite for understanding how regional DTR will evolve over the coming decades. The purpose of this work is to contribute to such an understanding, based on a sample of common, idealized experiments performed by nine coupled climate models. Model studies investigating effects of greenhouse gases and aerosols on DTR have typically used historical simulations (Lewis and Karoly, 2013; Liu et al., 2016). However, such simulations include trends in greenhouse gases as well as trends in both scattering and absorbing aerosols, with opposite effects on global mean temperature and, possibly, on DTR. To disentangle the role of different climate drivers in the DTR changes, model responses to idealized experiments where individual drivers are perturbed separately provide a separate line of evidence.
In the present study we compare idealized instantaneous perturbations of CO2, BC and SO4 in nine global climate models from the Precipitation Driver Response Model Intercomparison Project (PDRMIP) (Myhre et al., 2017a). This unique data set allows us to investigate whether differing changes to DTR can be expected from trends in greenhouse gases, sulfate or black carbon, and it can shed light on results from more comprehensive multi-forcer simulations, such as those in the Coupled Model Intercomparison Project Phase 6 (CMIP6) (Eyring et al., 2016). While the size of the data set precludes detailed process-level investigations of the output from each model, any significant changes found based on the median response of the model sample should represent physically robust expectations based on the geophysical understanding underlying the generation of climate models participating here (which are mostly similar to their CMIP5 configurations; Myhre et al., 2017a).
In the next section, we give a brief overview of data and methods used in this paper. Section 3 describes the main results of this study, starting with a comparison between the PDRMIP baseline DTR values and observations to show how the specific PDRMIP models capture regional DTR. The results are summarized in Sect. 4.
In the Precipitation Driver and Response Multimodel Intercomparison Project (PDRMIP), nine global climate models have performed idealized simulations of instantaneous perturbations in different climate drivers. Here, we analyze experiments involving a doubling of CO2 (denoted CO2 × 2), a 10-fold increase in black carbon (denoted BC × 10) and a fivefold increase in sulfate (denoted SO4 × 5) relative to a climatology consistent with year 2000 conditions. See Table 1 and (Myhre et al., 2017a; Samset et al., 2016; Stjern et al., 2017) for details and a list of models. The geographical distribution of the baseline BC and SO4 aerosol burden fields can be found in Fig. 1, which shows that India and eastern China are regions of particularly high current aerosol loading.
Table 1Overview of models and experiments. See Myhre et al. (2017a), Samset et al. (2016) and Stjern et al. (2017) for details and a list of models.
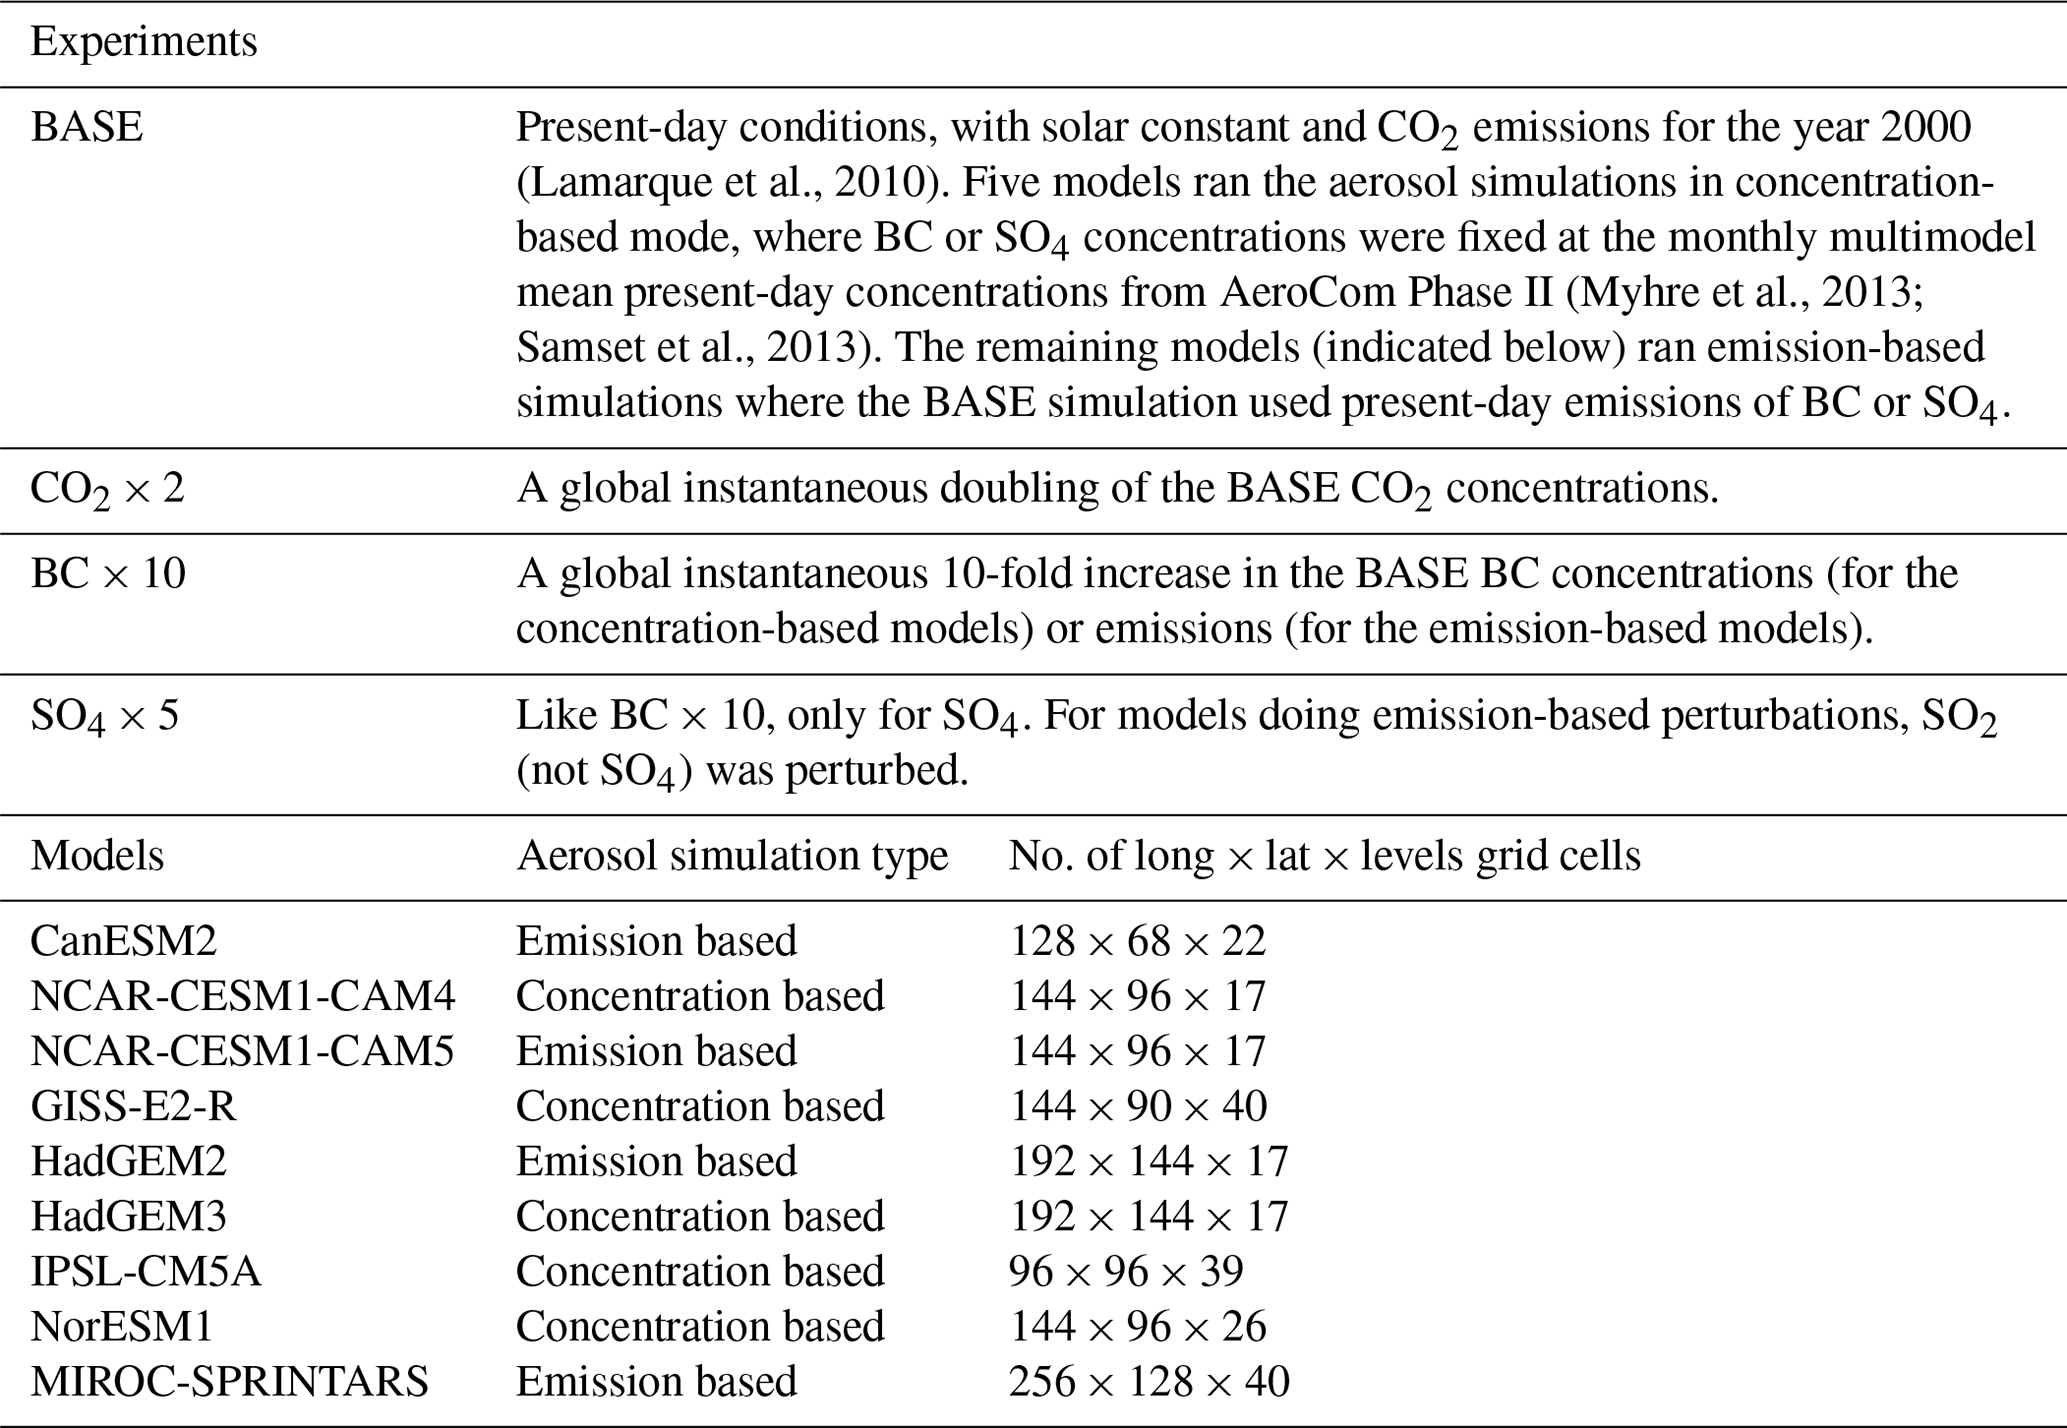
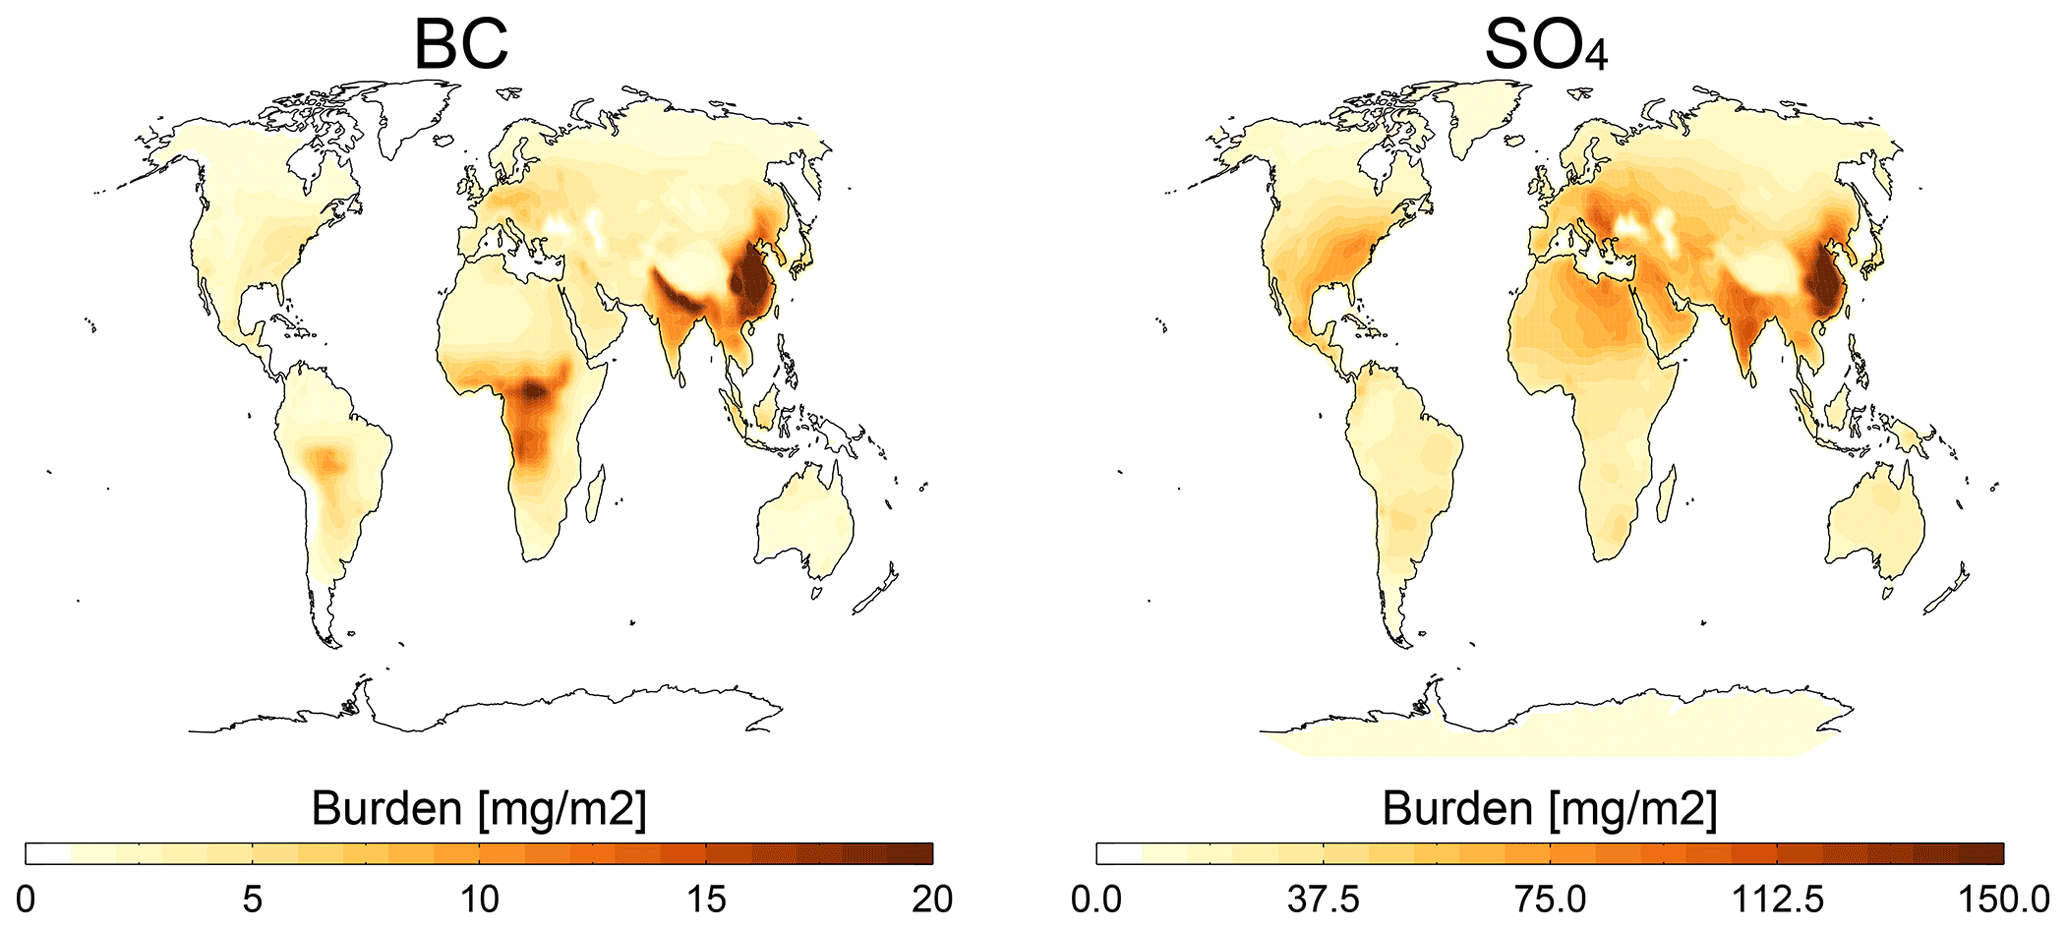
Figure 1Geographical distribution of the baseline burden of BC and SO4, as used in the BASE simulations, and as multiplied by 10 and 5 in the BC × 10 and SO4 × 5 simulations, respectively.
Using step perturbations rather than transient simulations means that climate responses will be different to those seen in the real world. The advantage is that signals more rapidly emerge from the noise of internal variability, provided that the forcing applied is of sufficient strength. In PDRMIP, the experiments were designed to produce such clear and robust climate signals. The experiments are, however, not identical in effective radiative forcing, which necessitates some normalization if the results are to be fully comparable. Here, we have chosen to divide climate responses (e.g., the DTR change) by the global annual mean temperature change for each driver and model. Our comparisons therefore show the response expected for a 1 ∘C surface warming due to perturbations in the given climate driver.
Model median global temperature change and model spread (given in the first parentheses) for the three drivers are 2.6 K (1.5 to 3.7 K) (CO2 × 2), 0.7 K (0.2 to 1.7 K) (BC × 10) and −1.65 K (−0.9 to −6.6 K) (SO4 × 5) (see Samset et al., 2016, for core analysis of all PDRMIP experiments and models). For SO4, which cools the climate, normalization by a negative global mean temperature change switches the sign of the change and shows in principle the result of a reduced SO4 level as opposed to the other drivers. Note that even a 10-fold increase in BC yielded a weak impact on global temperatures (Stjern et al., 2017). This has the implication that normalization leads to particularly large normalized changes for the BC × 10 experiment. However, as seen by comparing absolute DTR changes for BC × 10 in Fig. S2 to those of CO2 × 2 and SO4 × 5 (Figs. S1 and S3), the absolute DTR change for BC × 10 is also large in itself: an annual mean model median DTR change of −0.03 K (compared to −0.05 K for CO2 × 2) is substantial given than the doubling of CO2 causes a 4 times stronger response in the global mean temperature.
CO2 concentrations were prescribed in all models. For the aerosol perturbations, 4 of the 10 models perturbed concentrations, while the rest changed their emissions. This leads to some additional intermodel differences in forcing and response patterns. For instance, in concentration-driven simulations, climate dynamics (e.g., a change in precipitation and thus wet deposition) will not influence BC concentrations, while feedbacks between BC and other climate processes can operate in emission-driven simulations. However, a previous PDRMIP study found the difference between climate responses in emission-driven versus concentration-driven experiments to be highly model dependent (Stjern et al., 2017). At least for the BC × 10 simulations, two of the emission-driven models (CESM-CAM5 and MIROC-SPRINTARS) showed responses very similar to the concentration-driven models, while the two others (HadGEM2-ES and CanESM2) had slightly stronger responses that might be related to the nature of the experiment setup.
All the simulations were 100 years long. Data for the simulation year nos. 51–100 were used in the analyses, and changes were defined as the average of these years for a perturbed simulation minus the corresponding average for the baseline simulation. In a comparison between PDRMIP data and gridded observational data from the Climate Research Unit (CRU) TS v. 4.03 (Harris et al., 2014), we compare baseline PDRMIP values (averaged over simulation years nos. 51–100) to observational data averaged over years 1991–2010.
DTR was calculated based on daily minimum and maximum temperature values and averaged into monthly and seasonal means. To determine whether a given DTR change is significantly different from zero, regional mean monthly-mean DTR values over a 50-year period, for perturbed versus baseline climates, were tested for each model and experiment using a Student's t test (p < 0.05). As the multimodel but single-realization simulations performed here will be sensitive to the timing of internal variability among model simulations, this will likely cause some of the intermodel differences. However, the model spread is not sensitive to the exact time period used. As a sensitivity test, we picked out 20-year periods from the 50 years of the baseline simulations, moving 5 years at a time (giving seven 20-year periods within the 50 years of data), and we found that intermodel standard deviations of DTR for these periods ranged between 2.555 and 2.564 K. While this indicates that model differences are more likely related to actual differences in model formulations and parameterizations, we note that internal variations in regional clouds and precipitation – which strongly influence DTR – can affect trends over periods up to 60 years (Deser et al., 2012), making it difficult to compare changes in DTR among both models and between models and observations.
We present results for all land regions aggregated (LND) as well as the populated high-aerosol-emission regions (present or previous) of the continental United States (USA), central Europe (EUR), India (IND) and eastern China (CHI). In addition, we study changes in the Arctic (ARC), which is a region known to be sensitive to remote emissions but where the mediating processes are not fully explored. As an example, potential drivers of regional impacts such as melt ponds and sea ice loss may depend on summertime Arctic DTR, which may in turn depend on diurnal variations in, for example, photochemical particle production or transport into the region (Deshpande and Kamra, 2014). Our main focus is, however, on the major aerosol emission regions.
This section presents the global, annual overland mean modeled DTR changes in response to the PDRMIP perturbations, as well as regionally and seasonally resolved results. As earlier work has demonstrated a tendency in CMIP5-generated models to underestimate DTR relative to observations, with a bias that differs strongly between models and regions (Lindvall and Svensson, 2015), we also compare the PDRMIP baseline DTR values to surface temperature observations.
3.1 Comparison to observations
Figure 2a shows the annual mean DTR (average of 1991–2010) calculated from CRU TS.4, as well as the underlying Tmin and Tmax values. The DTR in these observations averages 11.2 ∘C globally. Typically, the DTR is relatively narrow ( < 10 ∘C) at northern high latitudes, as well as around the tropics, and broader in the subtropics and midlatitudes. The world's highest overland DTR (> 20 ∘C) can be found in northern and southern parts of Africa, along the western parts of North America, in Australia, and in the region around the Arabian Peninsula.
Figure 2b compares PDRMIP DTR, Tmin and Tmax to CRU, showing differences between the two. To ensure that only grid cells with values for both PDRMIP and CRU are compared, we regrid all data sets to ∘ resolution prior to the comparison. We find that PDRMIP models underestimate the DTR over much of the global land area. This is generally linked to minimum temperatures being on the warm side and often (see, e.g., western USA) enhanced by a tendency for maximum temperatures that are too cold. Notable exceptions to the low DTR bias are northern Africa and the Arabian Peninsula, which were among the regions with the world's highest DTR (Fig. 2a). Figure 2b shows that models simulate minimum temperatures that are too cold here – conceivably linked to insufficiencies in model estimates of soil moisture or clouds.
Figure 2c shows regionally averaged model–observation biases for the PDRMIP model median as well as for the individual models. While the multimodel median overland annual mean DTR has a negative bias of 1.9 ∘C compared to CRU values, individual model–observation differences have a standard deviation of 2.6 ∘C and range from −3.3 to 4.4 ∘C. HadGEM3, NCAR-CESM-CAM4 and CanESM2 have consistently high DTR values and thus positive biases, while GISS-E2-R, NorESM1-M and NCAR-CESM-CAM5 have the lowest values. HadGEM2 has been omitted here since it used a preindustrial baseline. The models that stand out with a positive bias in DTR tend to instead strongly overestimate the maximum temperatures.
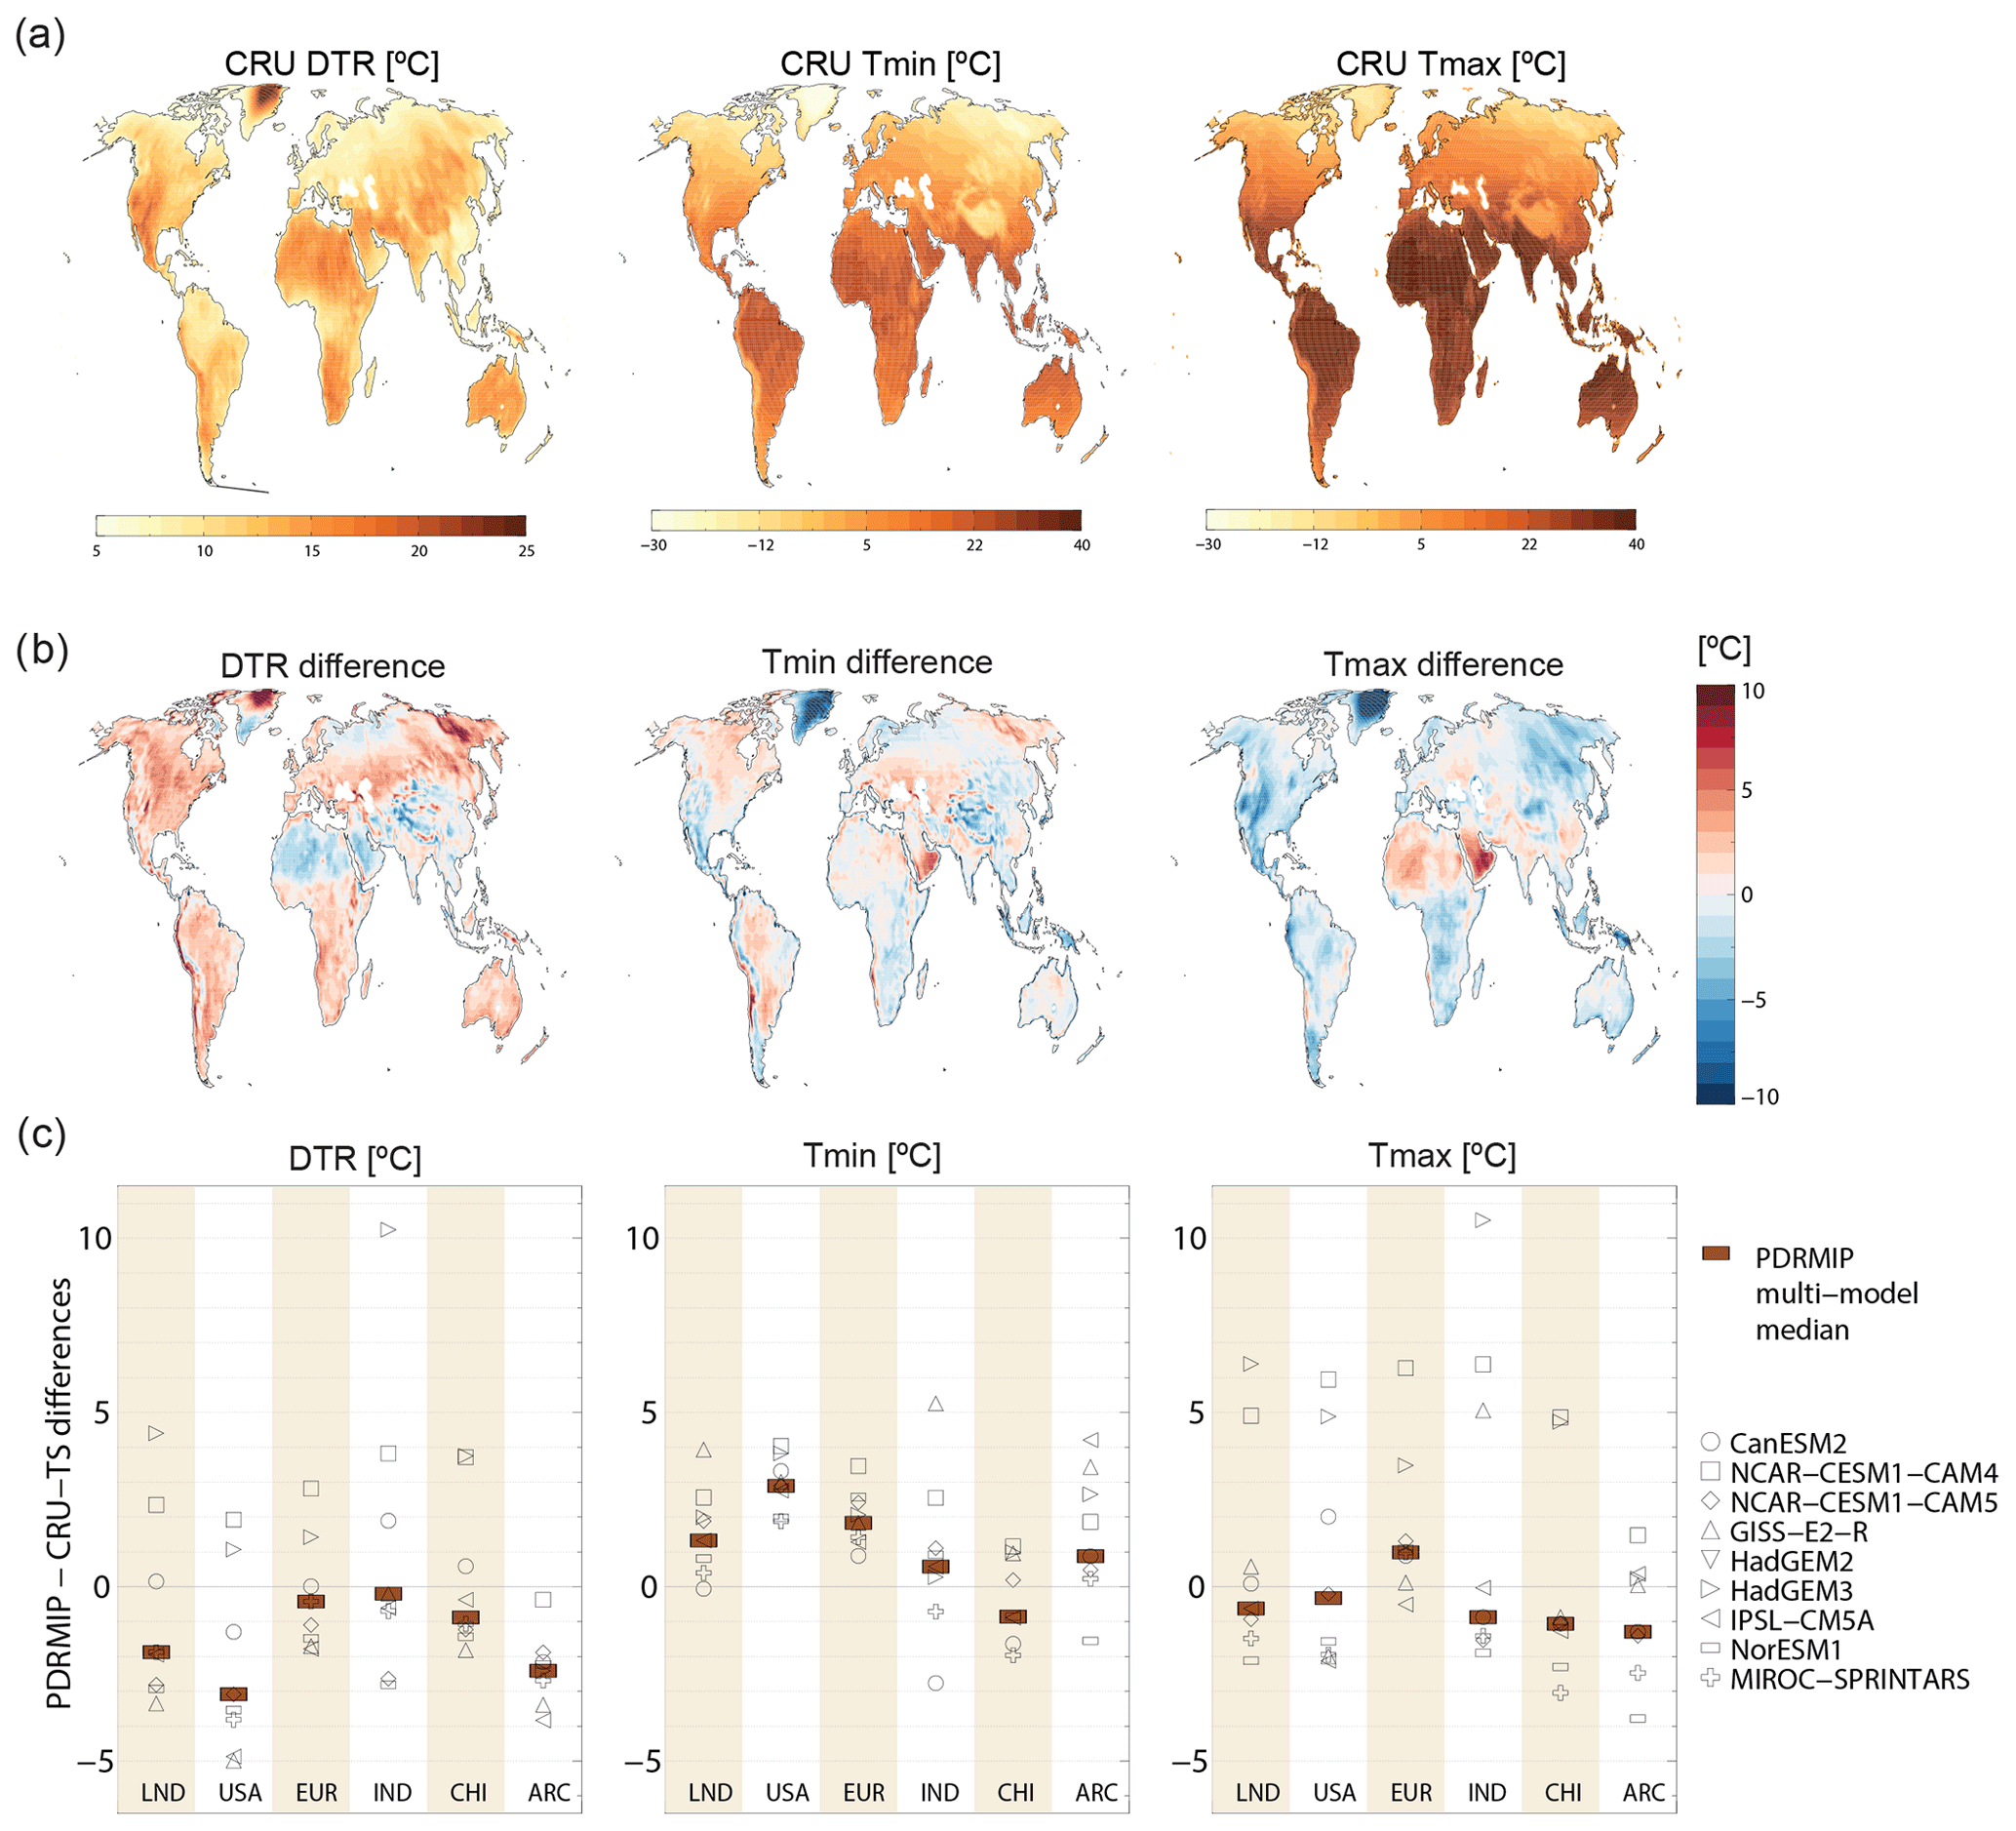
Figure 2For DTR, Tmin and Tmax, the figure shows (a) geographical distribution of CRU TS values, averaged over the years 1991–2010; (b) geographical distribution of differences between the PDRMIP model-median baseline (mean of year nos. 51–100 of 100-year fully coupled simulations) and CRU TS; and (c) regionally averaged differences for the model median and for individual models. Note that as HadGEM2 has a preindustrial baseline in the PDRMIP simulations (Samset et al., 2016), we have omitted this model here.
Minimum temperatures that are too warm are particularly prominent in high-latitude regions, where all models have a positive Tmin bias in USA, EUR and ARC. One known issue in atmospheric models is the representation of the atmospheric boundary layer at high latitudes (e.g., Steeneveld, 2014), where wintertime minimum temperatures are often determined by a very thin and stable boundary layer.
Intermodel spread is in all regions larger for Tmax than Tmin. Note, however, that this is mainly due to the very strong positive Tmax bias, particularly for HadGEM3 and NCAR-CESM-CAM4, which for all regions contrast the negative Tmax bias of the majority of the other models.
Overall, the PDRMIP models perform similarly to CMIP5 models (Sillmann et al., 2013), with a general underestimation of DTR but with large differences between models as well as between regions. Although no direct comparison between historical DTR changes and the idealized simulations in this study will be made, the caveats noted above should be kept in mind in interpretations of the analyses below.
3.2 DTR change in response to different forcing mechanisms
Figure 3 shows how the three drivers, CO2, BC and SO4, influence annual mean (larger upper panels) and seasonal (smaller lower panels) DTR. Recall that results are normalized by the global mean temperature change for each given model and experiment. All the drivers cause a reduction in annual mean DTR at high latitudes, increased DTR in the midlatitudes (see, e.g., USA and central/southern Europe), increased DTR over the Amazon and southern Africa, and reduced DTR over northern and central Africa. As mentioned above, however, these three drivers influence DTR through different processes that may be seasonally dependent. The smaller panels in Fig. 3 indicate that for each individual driver, the largest seasonal differences in DTR responses are found between summer (JJA) and winter (DJF). Spring (MAM) and fall (SON) in the Northern Hemisphere show patterns of change that reflect transitions between the typical summertime and wintertime responses. In the next sections we will therefore take a closer look at how DTR is influenced during summer and winter – first for the northern high- and midlatitude regions USA, EUR and ARC and finally for the Asian regions IND and CHI.
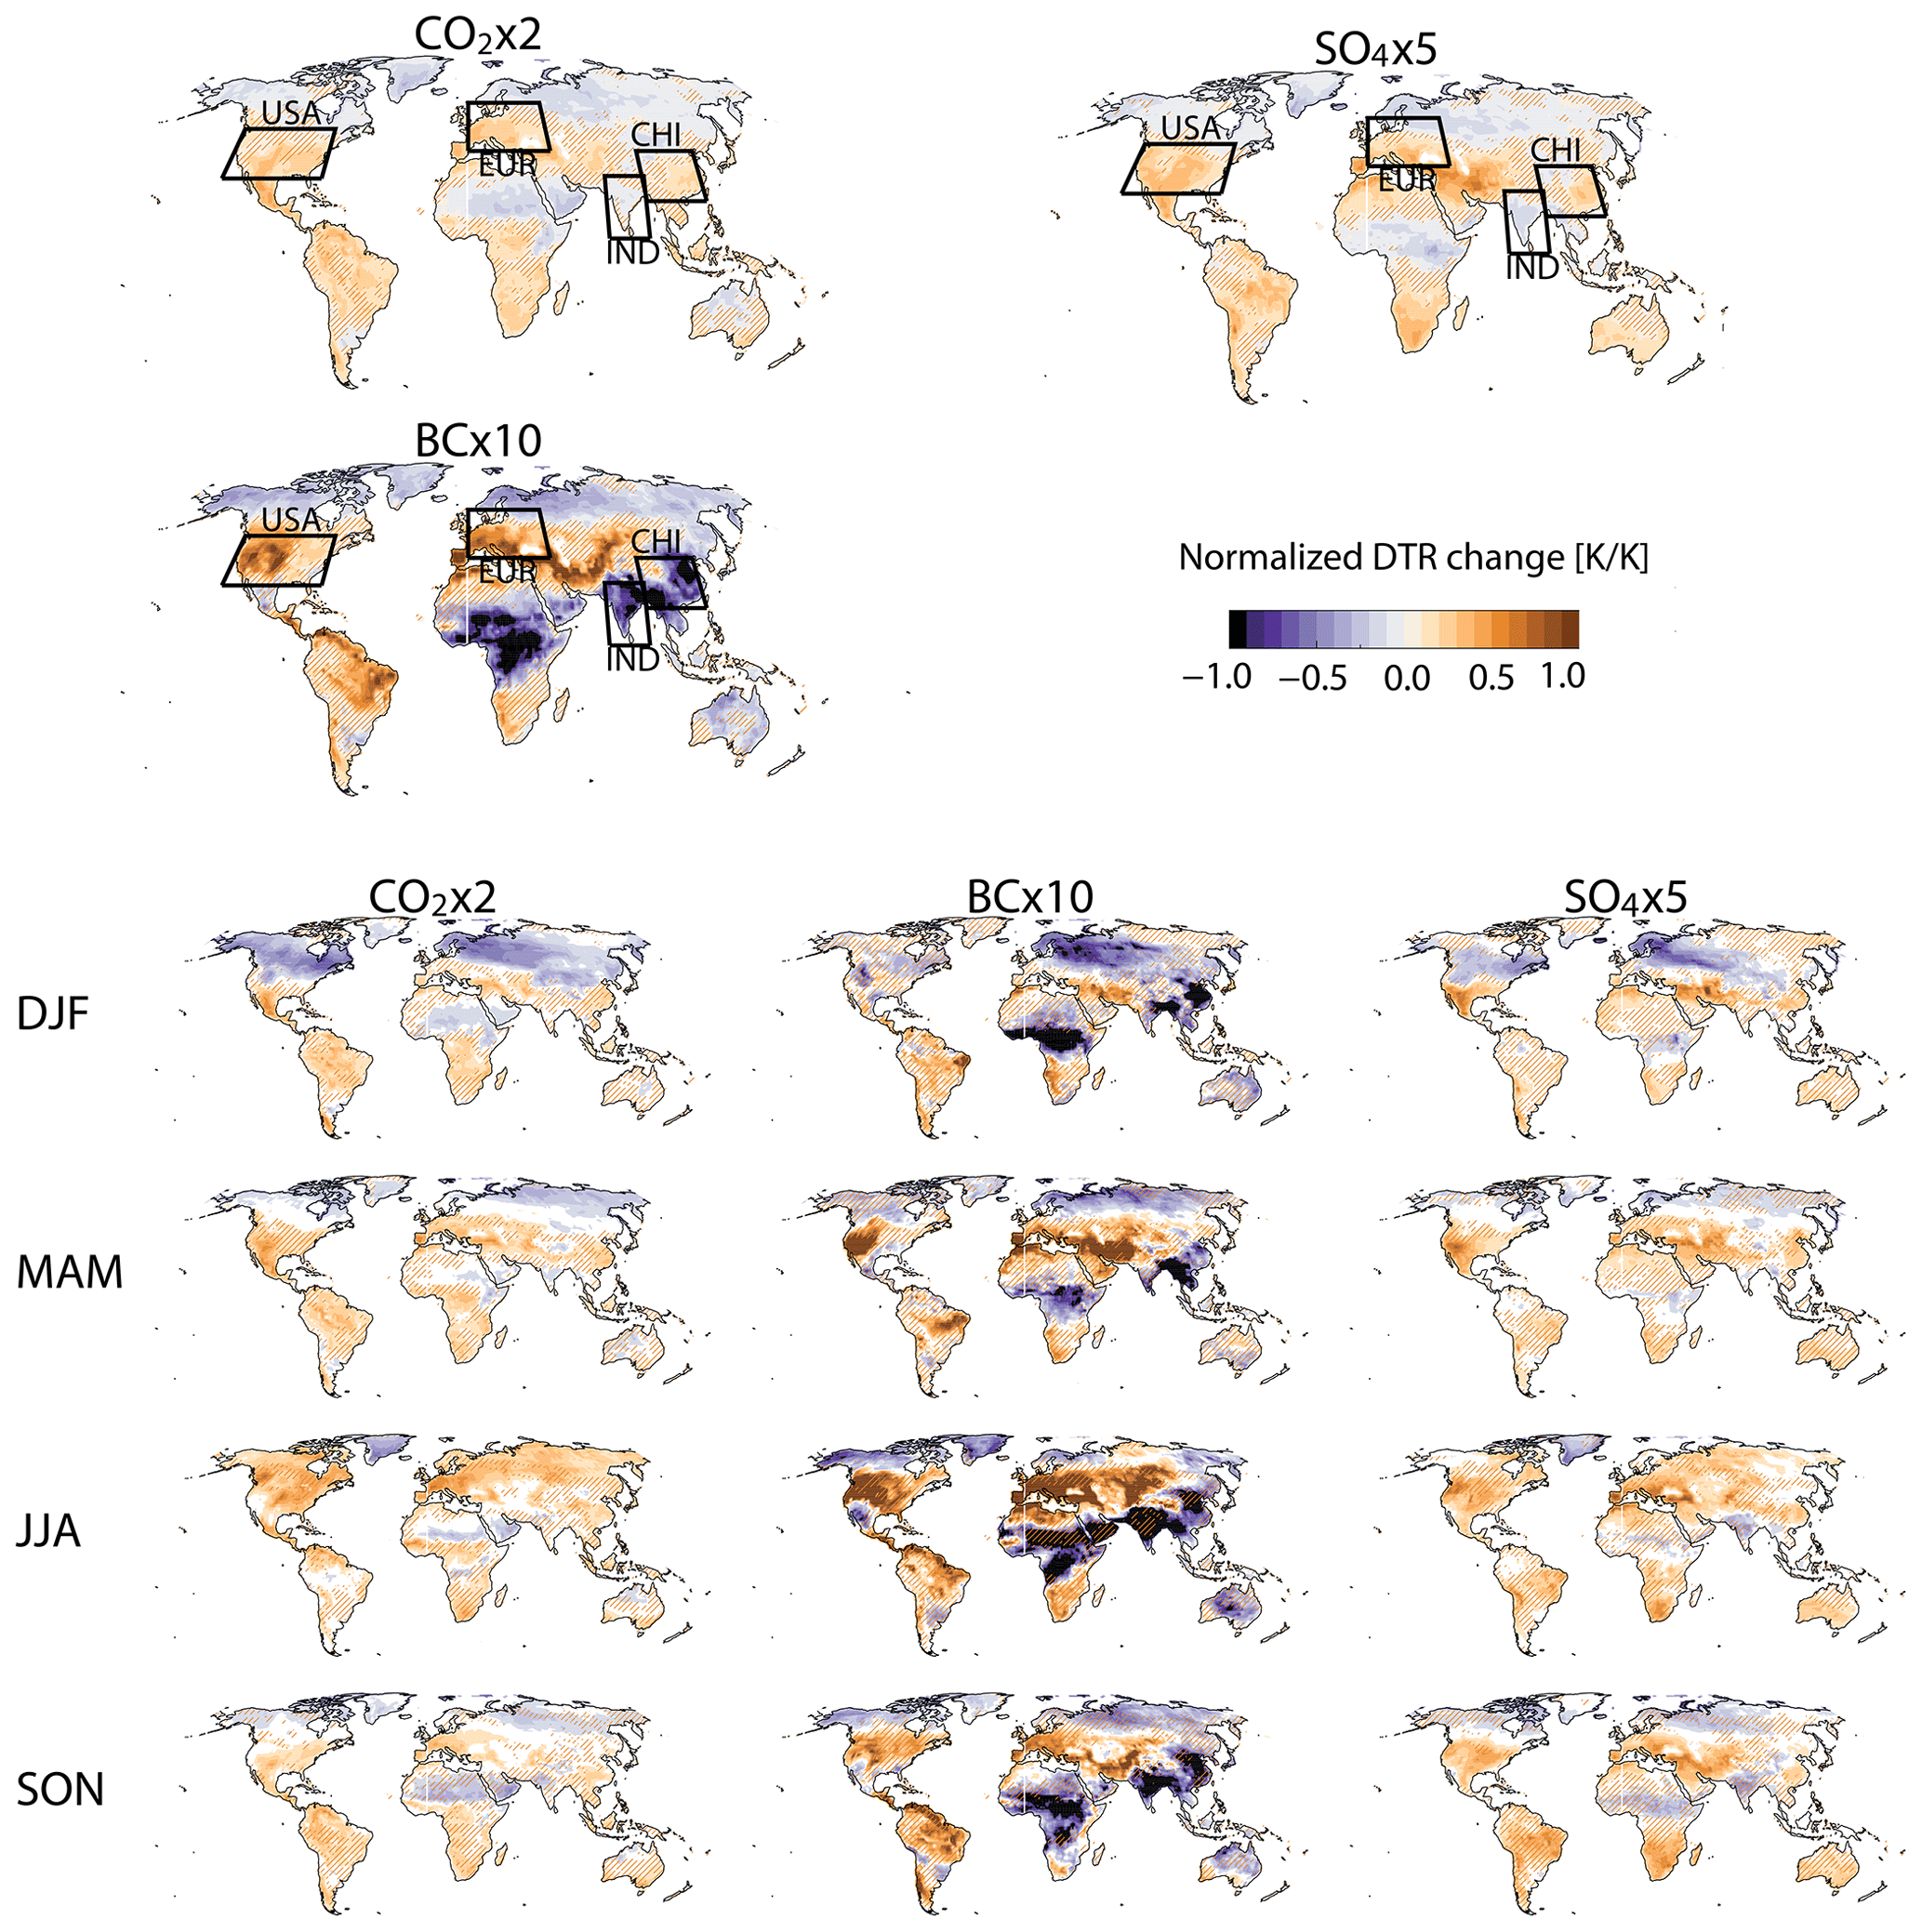
Figure 3Multimodel median change in DTR, normalized by the global mean temperature change [K K−1] for the three experiments. Larger upper maps show annual mean changes, while smaller lower maps show seasonal changes. Hatching indicates areas where less than 75 % of the models agree on the sign of the change. Annual maps include indications of the focus regions of this study.
3.2.1 Wintertime DTR responses in USA, EUR and ARC
As visible in Fig. 3, all three climate drivers induce a strong reduction in DTR over northern high latitudes and midlatitudes in winter. In Fig. 4 we quantify these changes by taking a closer look at regional averages. Colored bars indicate high intermodel consistency, defined as cases where 80 % of models with data have changes of the same sign. In winter the DTR reduction is particularly robust (colored bars for all drivers) over Europe and the Arctic (Fig. 4a). Numbers below the bars indicate how many of the nine models these changes are statistically significant, and the number is high for both these regions. A similar reduction is seen over USA, but here there is lower model agreement on the BC-induced DTR reduction. The hatching on the DJF BC × 10 map in Fig. 3, indicating low model agreement, shows that this is true for the entirety of the USA region.
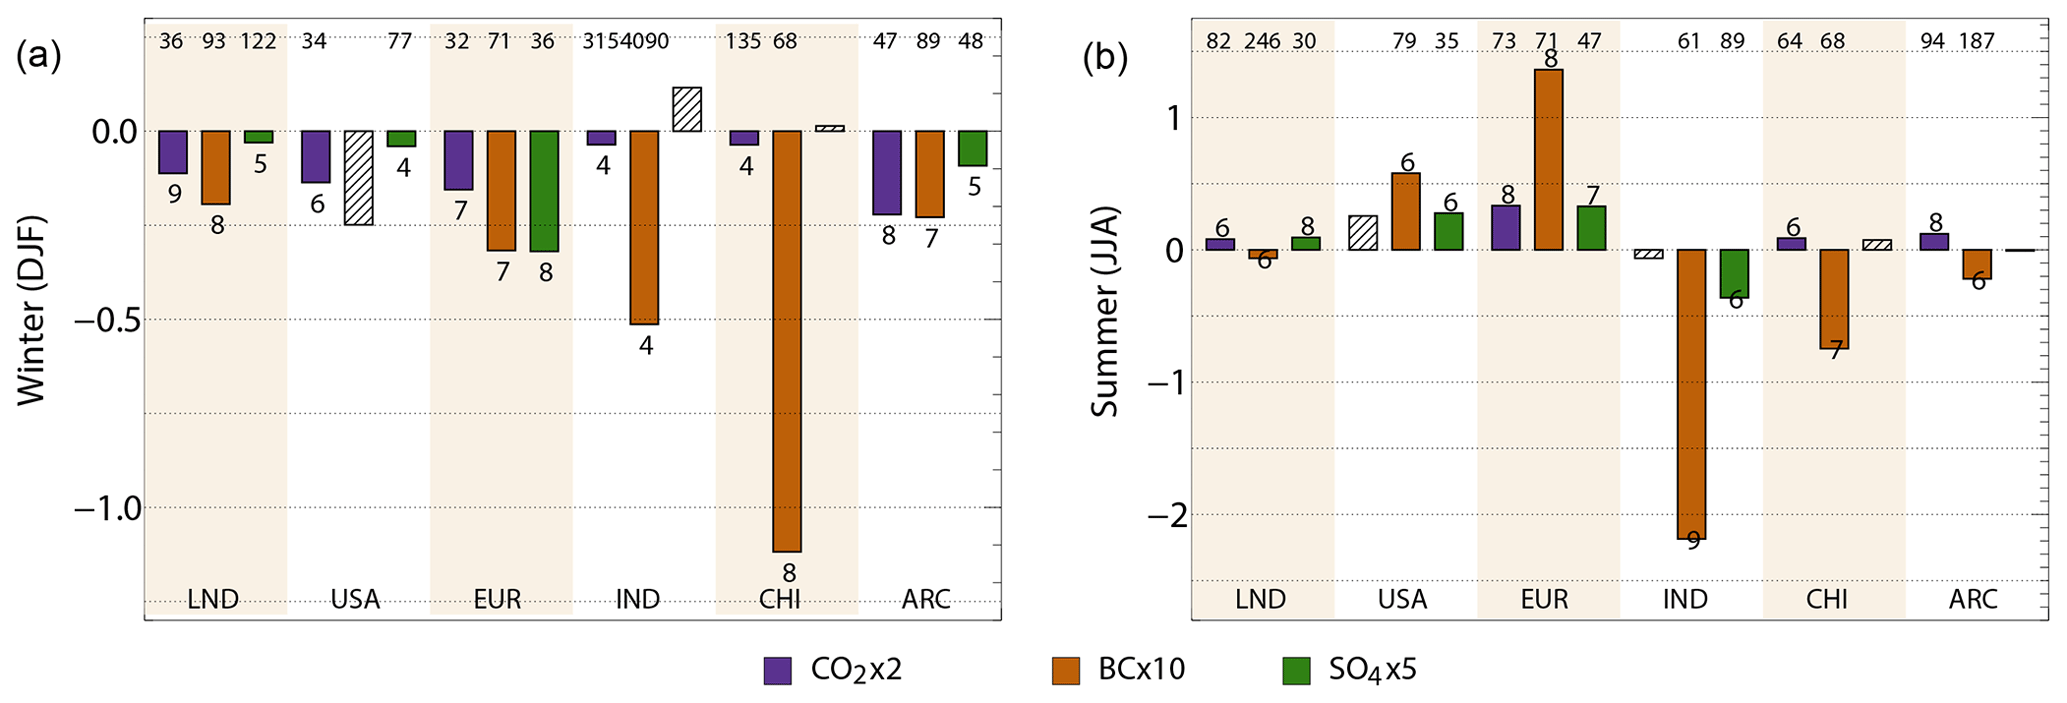
Figure 4Multimodel median change in DTR for the different drivers and seasons, normalized by the global mean temperature change [K K−1]. Cases for which 80 % of models with data have DTR changes of the same sign are marked with colors, whereas hatched bars indicate larger model disagreement. The numbers below with the colored bars show the number of models for which the change is statistically significant (Student's t test p value of less than 0.05). The coefficients of variation (standard deviation divided by mean) [%] are shown as numbers on the top.
For all drivers (but most strongly so for BC and SO4), the wintertime DTR reductions in these northern high latitudes and midlatitudes are driven by an increase in Tmin that is stronger than the increase in Tmax (Fig. S4). Previous studies have shown that while a general global warming of the climate can be expected to increase both Tmin and Tmax, an increase in cloud cover can substantially dampen the increase in Tmax (e.g., Dai et al., 1999), resulting in a DTR reduction. We therefore take a closer look at how greenhouse gases and aerosols influence the cloud cover in these regions.
In Europe, we do find a slight wintertime increase in cloud cover for both CO2 × 2 and SO4 × 5 (Fig. 6 and Table S1). Combined with statistically significant negative correlations between cloud cover changes and DTR changes (Table S2), there are indications that these climate drivers reduce DTR through their influence on cloud cover. For BC × 10, however, we find a reduction in clouds over Europe. We find statistically significant correlations between DTR change and the change in clear-sky downwelling radiation for these two experiments (Table S2); for BC × 10 the reduction in this variable is particularly strong (Table S3) – almost 11 W m−2 K−1. This is likely enough to dampen Tmax despite the slight reduction in cloud cover.
In the Arctic region (recall that our regional simulations average only land areas in this study), the lack of incoming solar radiation in winter means that the increase in Tmax will be dampened to a lesser degree, and the difference between the changes in Tmin and Tmax will be smaller. This can be seen in Fig. S4, where the wintertime slopes between Tmin and Tmax are much weaker for the ARC region than, for example, for EUR, manifesting in a weaker DTR change (Fig. 4). The absence of shortwave radiation during the polar night make potential driver differences as the one seen over Europe less prominent. As we will see in the next section, drivers influence DTR differently in the Arctic summer.
All in all, a prominent wintertime feature in the EUR, USA and ARC regions is a consistency between drivers in terms of changes in Tmin and Tmax, which are ultimately all causing a reduction in DTR. We see, however, that although greenhouse gases and aerosols influence DTR in the same manner, the underlying processes differ between drivers.
3.2.2 Summertime DTR responses in USA, EUR and ARC
The reduced wintertime DTR in the midlatitudes is contrasted by a strong summertime increase, as seen by the orange colors on the JJA maps in Fig. 3. Europe stands out as the region with the best intermodel agreement (Fig. 4; all bars are colored), with a clear summertime DTR increase for all three drivers. This is caused by a much stronger increase in Tmax than in Tmin (Fig. S4). The same can be seen for USA, albeit with less agreement between models for the CO2 response. In both these regions, all three drivers induce substantial reductions in summertime cloud cover (Fig. 6), inducing the strong increase in Tmax. The link between DTR and cloud changes is supported by strong and statistically significant correlations between the two (Tables S2 and S4). There are also corresponding correlations to sensible heat flux and the amount of downwelling SW radiation, which we expect to increase as the cloud cover diminishes. A reduction in summertime precipitation in this region (not shown) contributes to the Tmax enhancement as a drier climate tends to involve less clouds and a drier surface with less evaporation. These are conditions that lower the nighttime temperatures and increase daytime temperatures, thus contributing to increased DTR. It is well known from observations that the last decades have seen a marked drying in Europe in the summer (Manabe and Wetherald, 1987; Rowell and Jones, 2006; Vautard et al., 2014; Leduc et al., 2019), potentially as a result of an expanding Hadley cell (Lau and Kim, 2015) or due to weaker lapse-rate changes over the Mediterranean region than over northern Europe (Brogli et al., 2019).
Based on observations, Makowski et al. (2008) found a strong increase in European DTR in the period of strong SO2 mitigation in the region, and suggested a causal relationship. Although natural variability and other forcing mechanisms have likely contributed to these trends, the increase in DTR over Europe seen in the SO4 × 5 experiment (recall the normalization by temperature change, meaning that this experiment corresponds to a SO4 reduction) is consistent with the findings by Makowski et al. (2008). However, our SO4 perturbation experiment causes DTR increases that are comparable with what is caused by perturbations of BC and CO2. Therefore, it seems that the DTR change in Europe is not a driver-specific response but rather linked to the surface temperature change resulting from the aerosol-induced forcing and the resulting large-scale circulation changes.
During the Arctic summer, processes dependent on shortwave radiation may operate during both day and night, and the potential for driver-specific responses is more present than during the polar night. CO2 causes a stronger Arctic increase in Tmax than in Tmin and thus an increased DTR for all models, while BC for most models causes a stronger increase in Tmin and thus DTR reduction (Fig. S4). The reason is that CO2 induces a reduction in the summertime Arctic cloud cover, consistent with the increase in Tmax, while BC enhances the cloud cover, thus hindering the strong Tmax increase. As a further step, we calculate SW and LW cloud radiative effects (CREs, Fig. 7) as the difference between clear-sky and all-sky top-of-atmosphere radiative fluxes (see, e.g., Dessler and Zelinka, 2015). As expected, we see a strong summertime SW cloud radiative cooling over Arctic land masses for BC × 10 (−7.0 W m−2 K−1), contrasting a small positive CRE (+0.2 W m−2 K−1) for CO2 × 2. The BC × 10 SW CRE effect is much stronger than the LW CRE effect and thus indicates that the change is primarily due to low clouds.
3.2.3 Driver-specific DTR changes over India and China
A visual comparison of the IND and CHI regions in the maps of Fig. 4 hints at interesting differences between drivers and between the two regions. Regionally averaged CO2 causes reduced DTR in winter and increased DTR in summer (except for IND), as we saw for EUR, USA and ARC (Fig. 4). While the DTR response to the SO4 perturbation is associated with large model spread in both seasons, it does produce a significant reduction in DTR over India in summer. What really stands out, however, is the strong response to BC. There is a high level of agreement between models on the sign of the DTR changes (Fig. 4; bars representing BC changes are mostly colored, indicating model agreement). This is striking, as BC-induced climate changes have been shown repeatedly to be associated with higher levels of model disagreement than changes driven by CO2 and SO4 (Richardson et al., 2018; Samset et al., 2016). While we found that BC caused reduced DTR in winter and increased DTR in summer over Europe, India and China experienced severe DTR reductions in both seasons. In these regions, where baseline aerosol concentrations (Fig. 1) and thus the absolute magnitude of the aerosol perturbations are so high, the distribution of which processes dominate the response may be different.
Changes in aerosol concentrations have been suggested as a cause of the DTR changes in China (Dai et al., 1999; Liu et al., 2004). Here, we find weak correlations between the DTR changes and changes in the BC burden (Pearson's correlation coefficients of 0.26 and 0.38 in India and 0.12 and 0.29 in China during DJF and JJA, respectively). While correlations between both BC × 10 and SO4 × 5 DTR changes and changes in downwelling clear-sky SW radiation (Tables S5 and S6) are strong and significant, at least in India, we find significant correlations also in the CO2 × 2 case.
Interestingly, for both BC × 10 and SO4 × 5, the aerosol perturbations are stronger in China than in India (see baseline concentrations in Fig. 1). Table S3 shows that the magnitude of the change in downwelling clear-sky SW radiation in summer is also strongest in China. Still, the link between these changes and DTR are strongest in India. We find that in the BASE simulations, India tends towards a slightly drier climate with less precipitation, less surface evaporation, less cloud cover and a stronger sensible heat flux compared to China (not shown) – properties typically associated with warmer maximum and colder minimum temperatures. India therefore has a higher DTR to begin with (Fig. 2a) and thus a larger potential for change in the DTR.
In winter, the strongest DTR changes can be seen for BC × 10 in the China region, for which the increase in Tmax is weak (Fig. 5), likely due to a simulated increase in clouds for this experiment (Fig. 6). In summer BC also causes DTR to go down and cloud levels to go up. Correlations between the two are strong and significant in both seasons: −0.73 and −0.78 in DJF and JJA, respectively (Table S6).
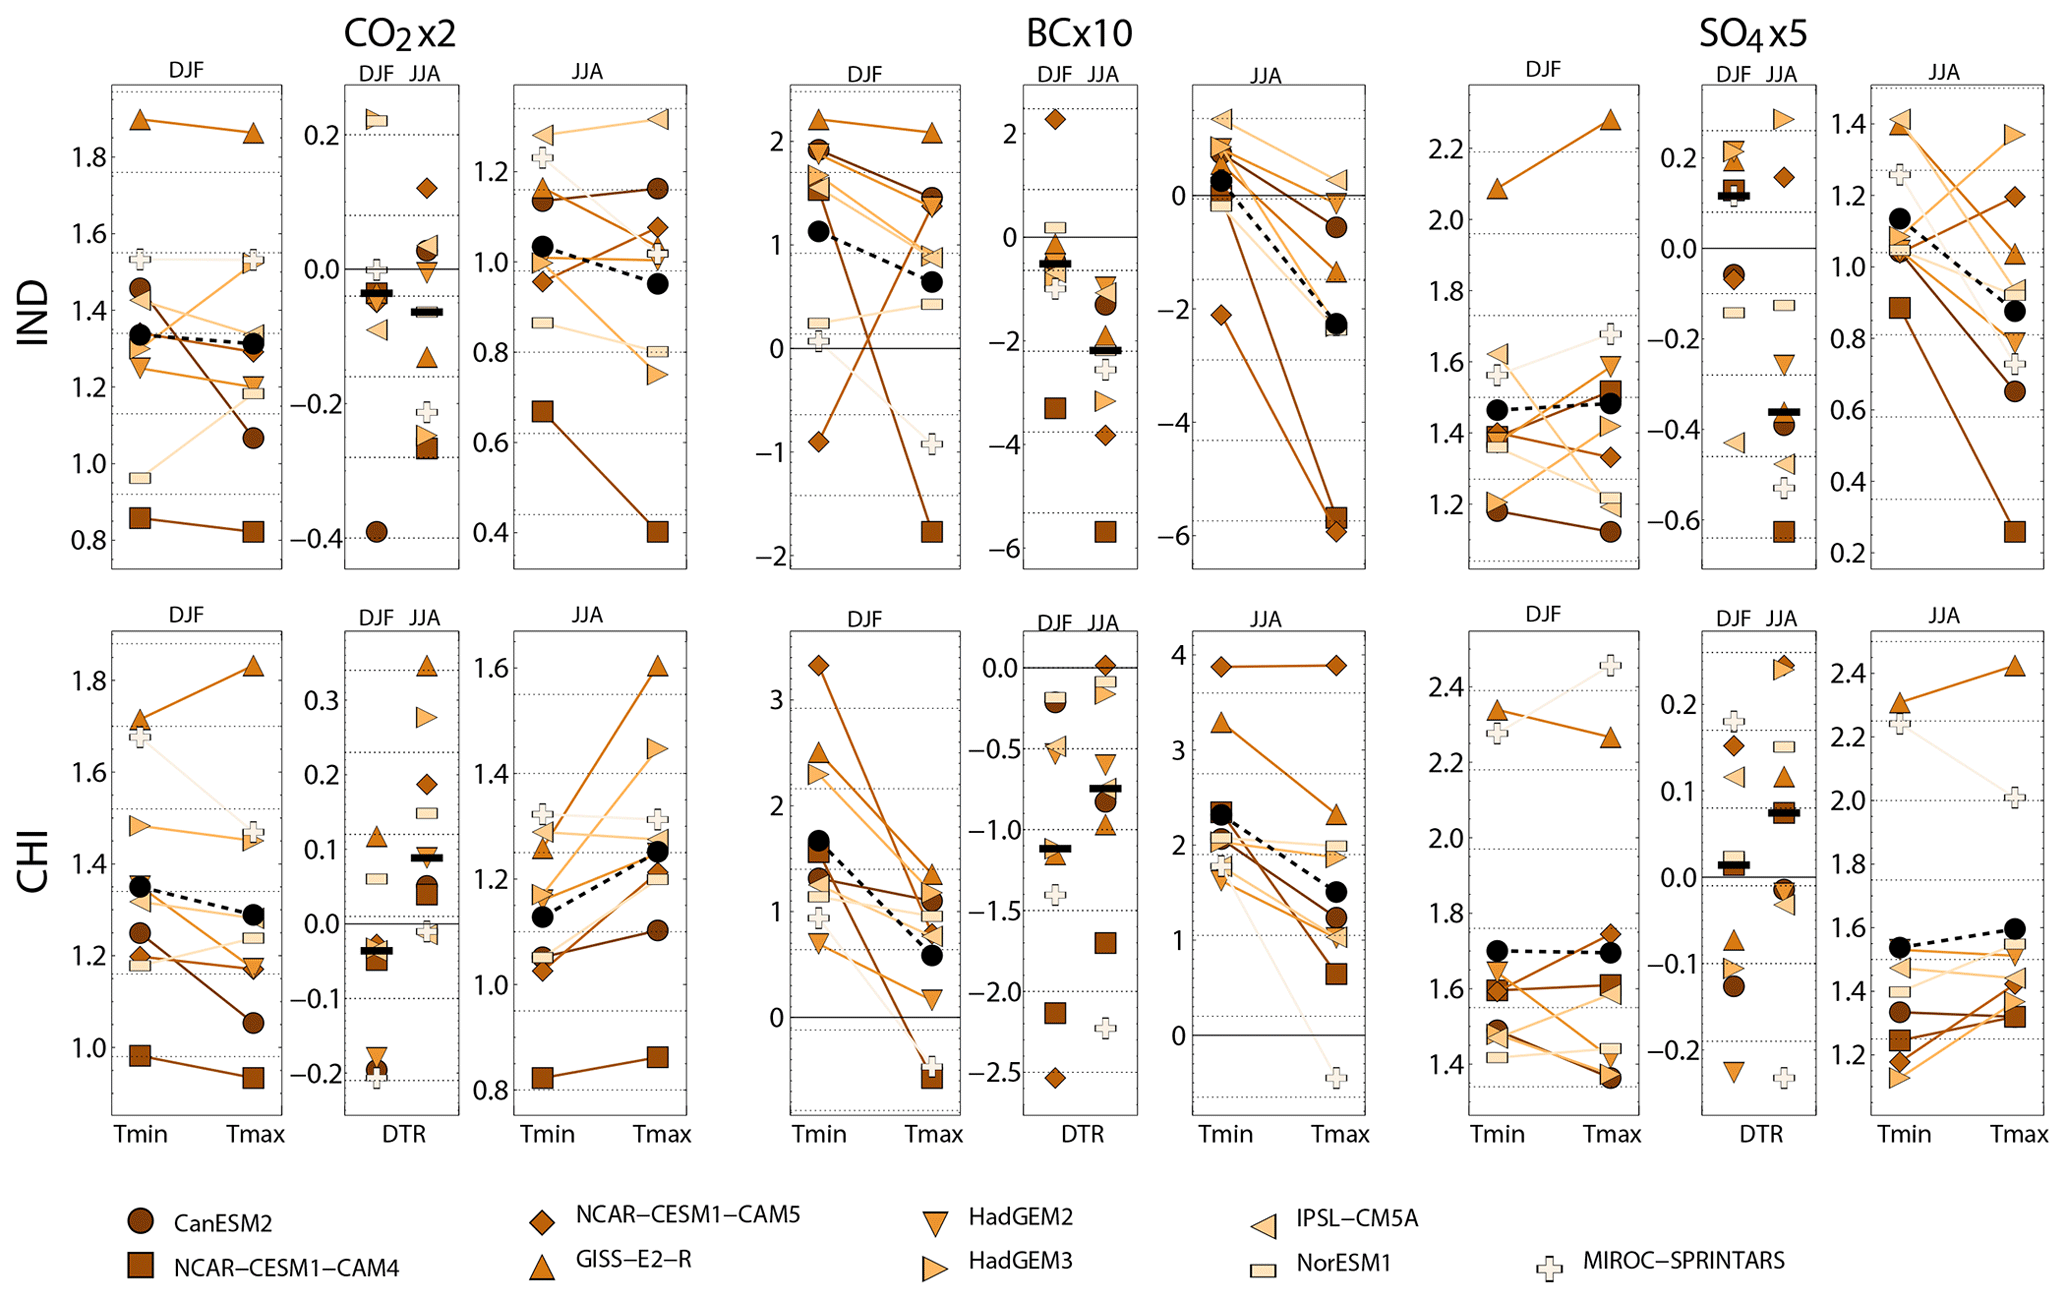
Figure 5Northern Hemisphere regional changes in DTR, Tmin and Tmax for the three drivers (columns) in the two Asian regions IND and CHI (rows). For each driver and region, subpanels show wintertime changes in Tmin and Tmax, wintertime and summertime changes in DTR, and summertime changes in Tmin and Tmax. The black horizontal bars and circles show the multimodel median changes.
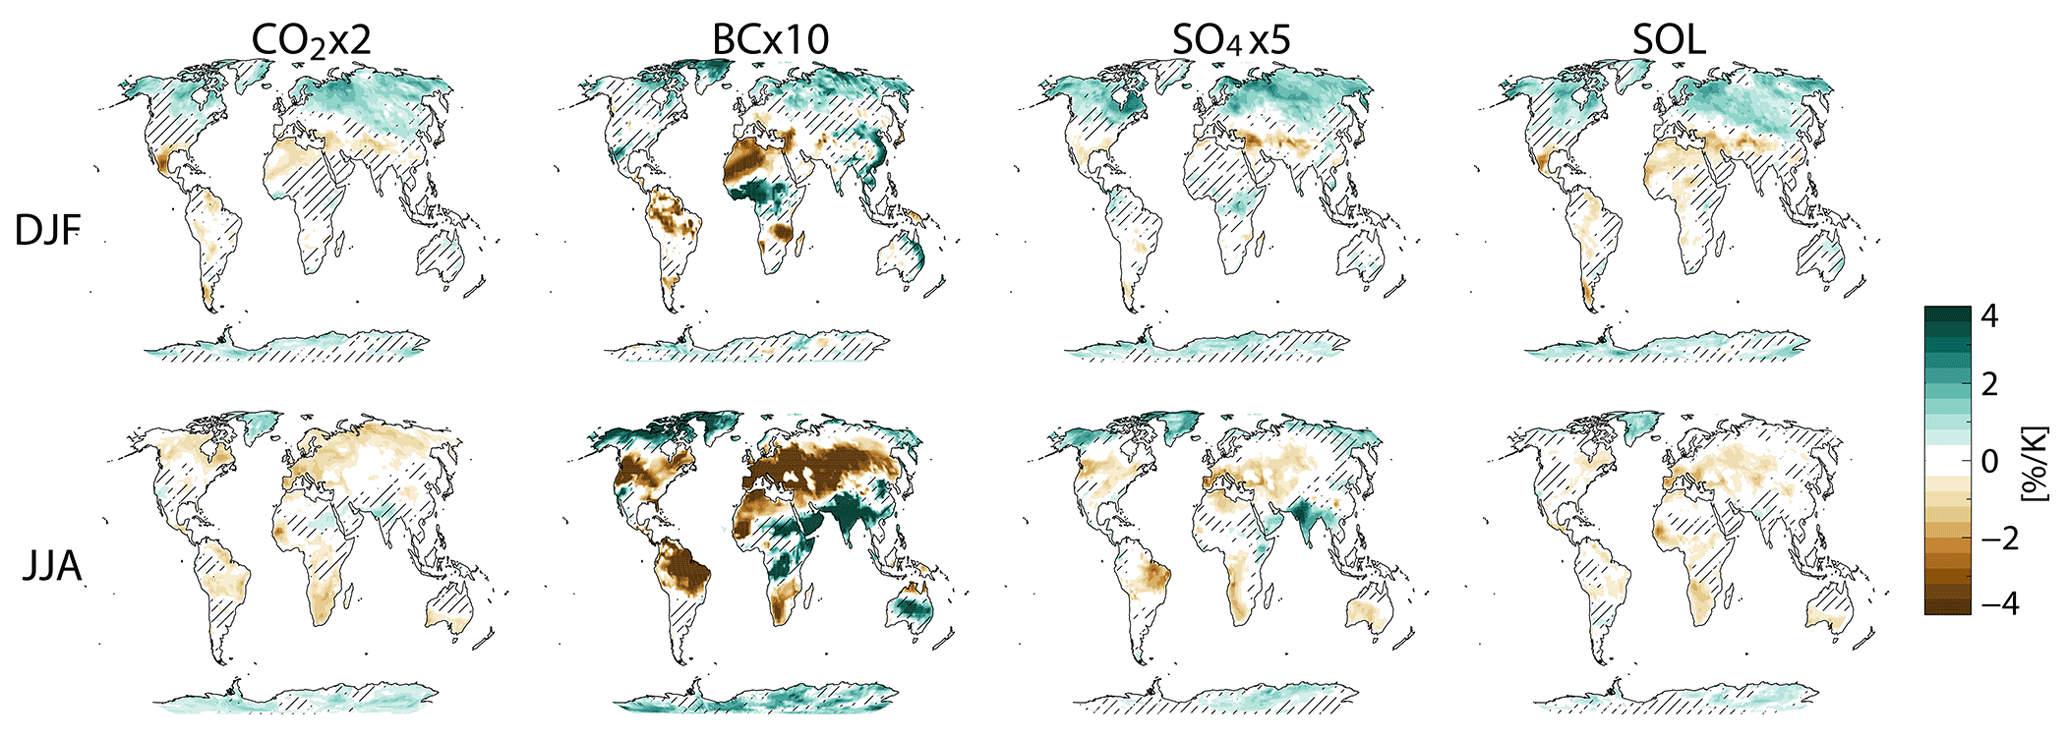
Figure 6Multimodel median seasonal cloud cover change for the three drivers, which are normalized by the global annual mean temperature change. Hatching indicates that less than 75 % of the models agree on the sign of the change.
In India, models disagree strongly on the relative responses of Tmin and Tmax (and thus DTR) in general; see Fig. 5. In winter, we find a slight DTR reduction for CO2 × 2 as mentioned above and a stronger reduction for BC × 10. In summer, the majority of the models simulate reduced DTR for the SO4 × 5 experiment, due to a strong increase in Tmin and a lesser increase in Tmax. In the same season DTR is reduced by more than 2 K for BC × 10. Figure 5 shows that this extremely strong DTR reduction occurs because Tmin is slightly enhanced, while Tmax is actually reduced. The reduction in Tmax is seen for all models but IPSL-CM5A, which is the only model for which cloud cover decreases over India in this season. For the other models, the increase in summertime cloud cover in the BC × 10 experiment is substantial over India (Fig. 6). In particular, there is a strong reduction in the SW CRE in this region (Fig. 7), likely responsible for the reduction in summertime Tmax. Oppositely, the increase in summertime Tmin (nighttime temperatures are influenced only by the LW spectrum) is enhanced by the positive change in LW CRE over India. In fact, regions which have both a negative change in the SW CRE and a positive change in the LW CRE can be recognized as the regions with the strongest reductions in DTR in the BC × 10 JJA map of Fig. 3 (most importantly India and central Africa).
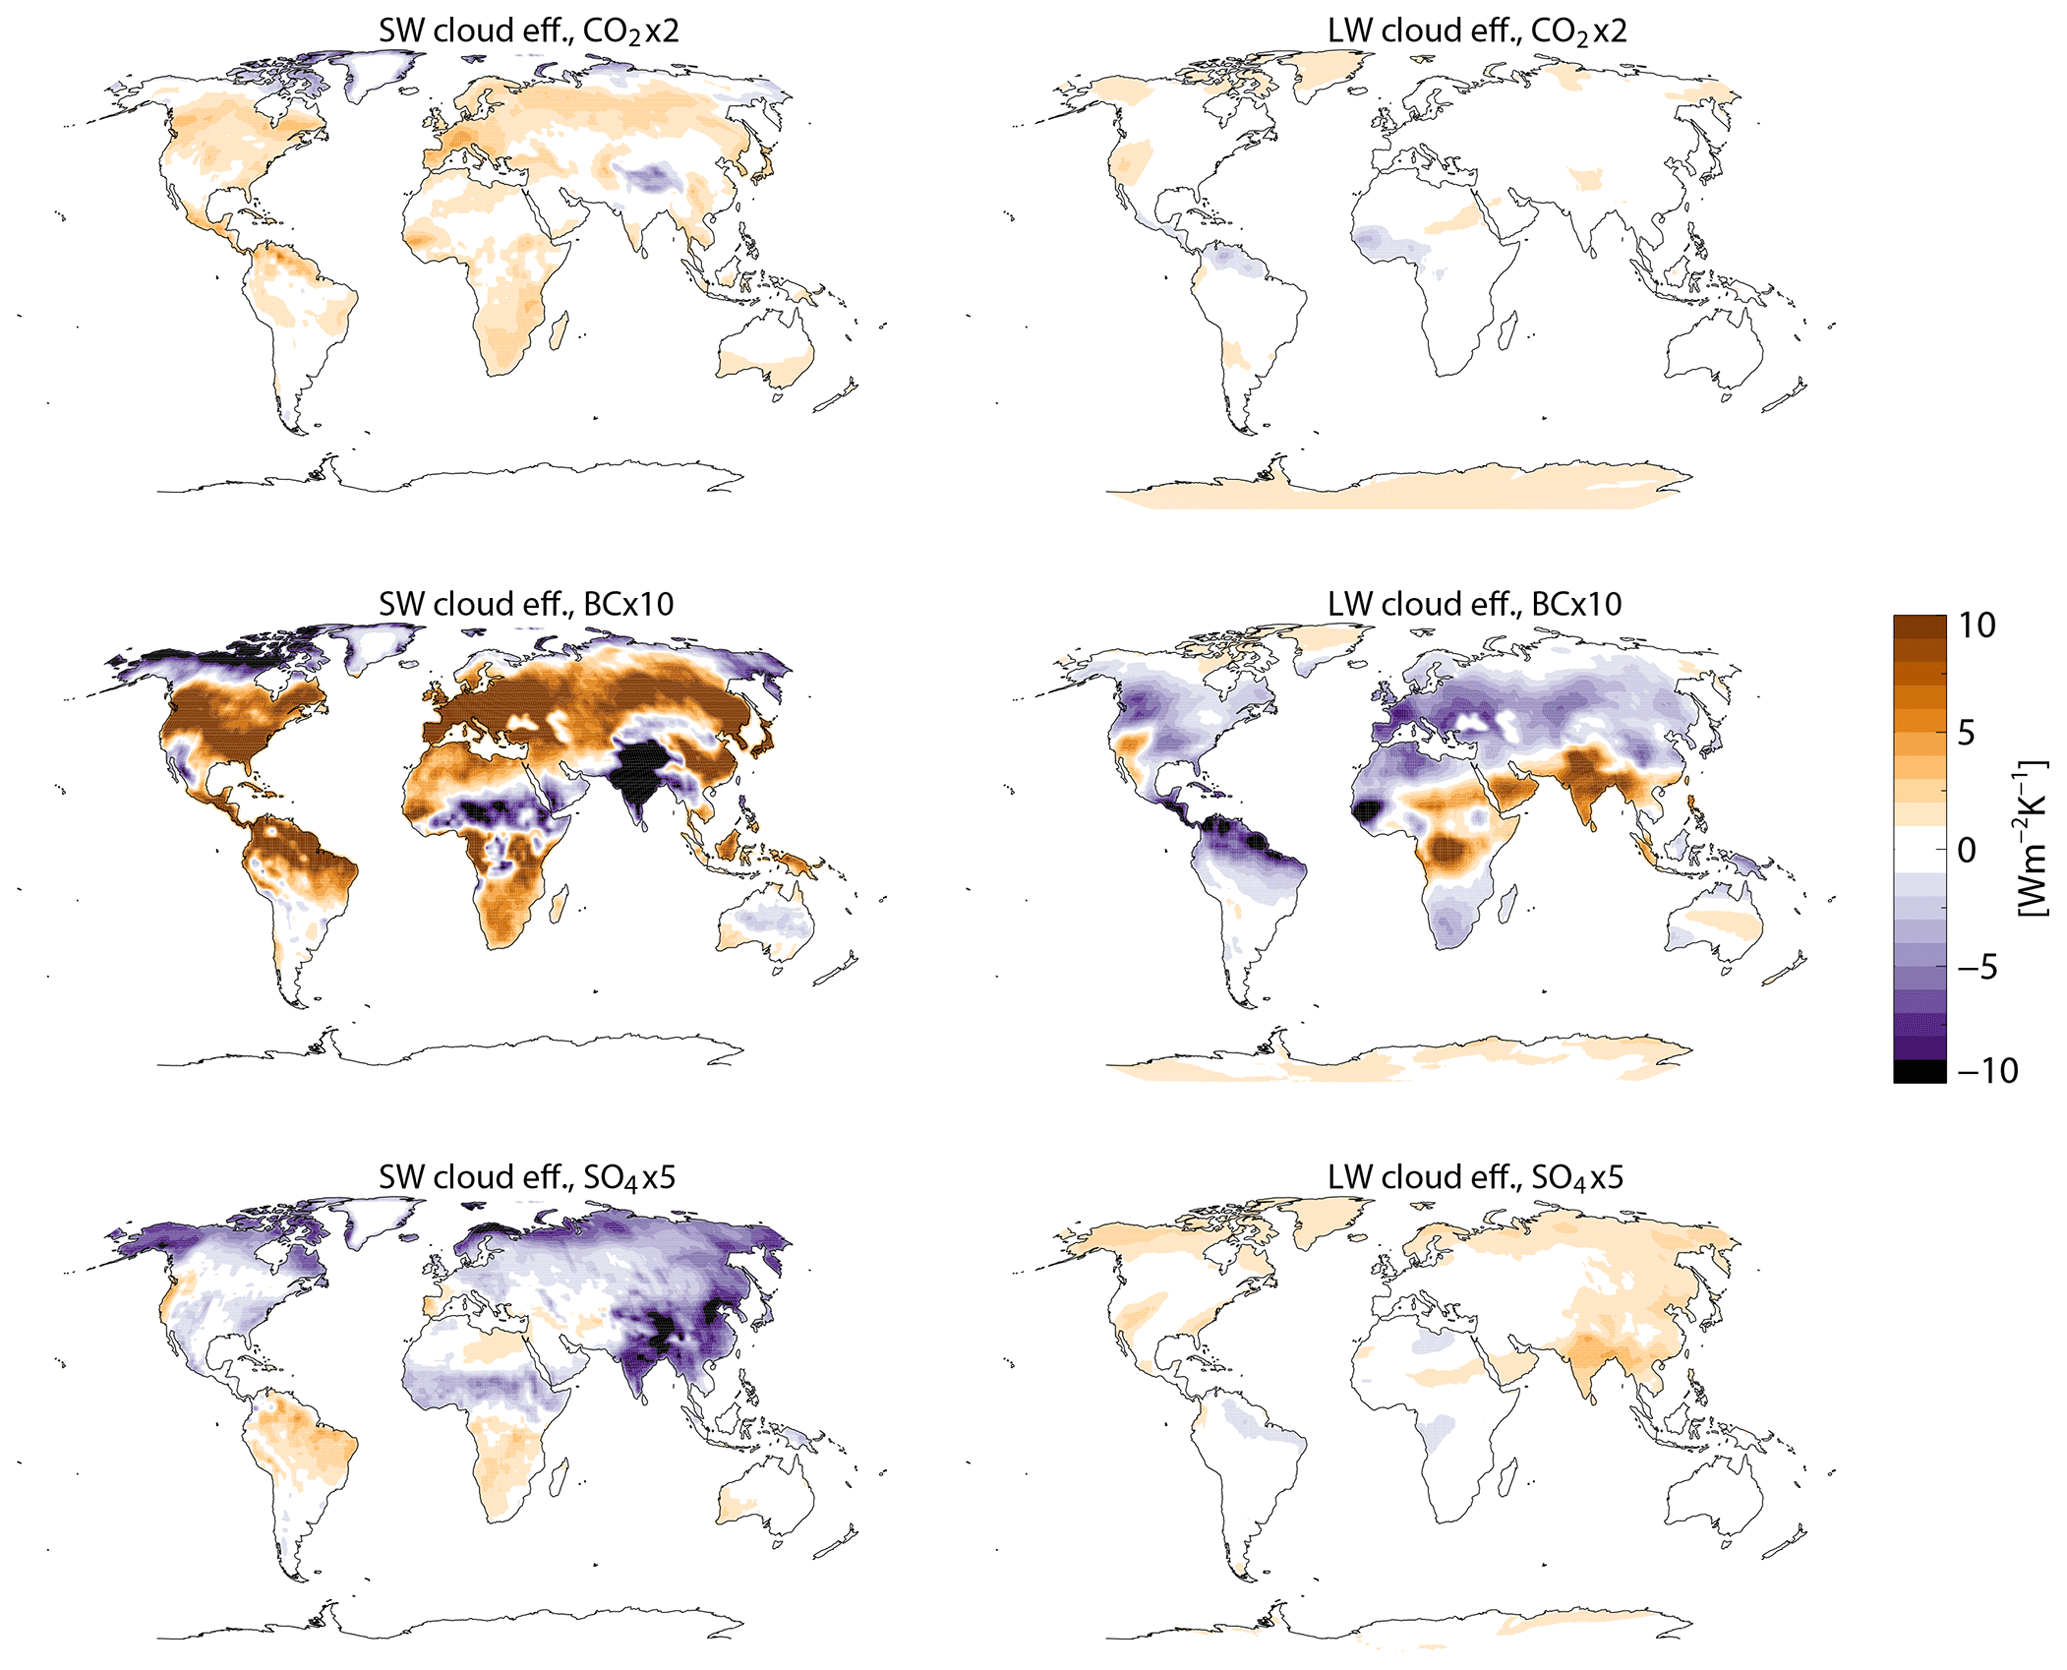
Figure 7Multimodel median change in shortwave (SW) and longwave (LW) cloud radiative effects [W m−2 K−1] for the JJA months for the BC × 10 experiment, based on top-of-atmosphere fluxes. See figures in the Supplement for maps of all seasons and experiments.
A previous analysis of the PDRMIP BC × 10 experiment by Stjern et al. (2017) found that the BC-induced cloud cover increases in these regions were mainly driven by rapid cloud adjustments (including the so-called semidirect effect) but were also a part of the longer-term response to increased global surface temperatures. They found cloud cover increases to be stronger in India than in China, particularly for low clouds which have the strongest influence on Tmax.
All in all, while we do see that aerosol–radiation interactions have likely contributed to the regions' DTR changes through reduction in downwelling SW radiation and thus surface heating, the strongest driver of DTR changes seems to be clouds. Greenhouse gases and aerosols cause distinctly different responses in DTR in the regions – not primarily through their direct radiative effect but via their specific influence on cloud cover. As the magnitude of the BC-induced cloud response is particularly strong over India, this is where we see the most substantial DTR reduction.
Given the strong role of clouds in the DTR response, estimates of DTR change will be sensitive to the way that specific climate forcers influence clouds in different climate models and to their baseline cloud representations. Model responses to CO2 perturbations have been shown to vary greatly between individual models, and responses to aerosols have even larger uncertainties, partly due to additional variations in parameterizations of indirect and semidirect effects. For instance, both a previous PDRMIP analysis of the BC × 10 experiment (Stjern et al., 2017) and an idealized single-model study (Samset and Myhre, 2015) suggest that increased BC concentrations lead to rapid adjustments in the form of increased fractions of low clouds and reduced fractions of high clouds. These cloud changes occurred over large areas of the globe, with a global mean cooling effect. In a recent study, however, Allen et al. (2019) find indications that the heating rate induced by BC is less “top heavy” than what is calculated in many climate models (i.e., the vertical profile of shortwave heating rates is too uniform). They claim that if the overestimated upper-level cloud response is corrected for, it could instead produce rapid adjustments that warm the climate, on average. These nuances are relevant to the accuracy of DTR simulations as a BC-induced reduction in high clouds will cause LW cooling and likely lower Tmin, while increased low clouds will cause SW cooling and also lower Tmax, with effects on the DTR depending on which is influenced the most. If, on the other hand, BC causes strong reductions in low clouds (increases Tmax) and also weak reductions in high clouds (reduces Tmin slightly), this will contribute to an increase in DTR. More research is needed on modeled cloud responses and the vertical distribution on BC, but we note that both Stjern et al. (2017) and Allen et al. (2019) find that in the high-emission regions of India, China, and northern and/or central Africa, the rapid adjustments produce an increase throughout all cloud layers with a total cooling effect (compare to Fig. 7, where the SW CRE is stronger than the LW CRE in these regions) and likely with similar effects on the DTR.
We have analyzed a multimodel set of idealized simulations to investigate how changes to the atmospheric levels of CO2, BC and SO4 influence the diurnal temperature range, through alterations of global mean surface temperature, cloud cover and other climate parameters. For northern mid- and high-latitude regions, we find DTR changes that are broadly similar between drivers. The cause of the DTR change, as apparent from patterns of Tmin and Tmax changes, is not always the same for all drivers. However, the resulting change is consistently an increase in DTR in summer, in EUR, USA and ARC, and a decrease in winter. This similarity may partly be the result of general atmospheric response to changes in surface temperature rather than the distinct processes through which the drivers operate. Thus, while the strong DTR reductions over Europe have been linked to the massive mitigation effort of SO4 over the past decades, our similar responses of SO4 perturbations to perturbations of CO2 and BC indicate that this is not necessarily an aerosol-specific response.
Over India and China there is less agreement between drivers, with BC causing a strong DTR reduction in both regions in all seasons. The intermodel spread is large, but all models agree on the sign of this change. Although the strong shortwave atmospheric absorption induced by BC particles is predominantly active in daytime, thus impacting the maximum (daytime) temperature more than the minimum (nighttime) temperature, we find that the direct aerosol effect is likely not the leading cause of the DTR response. Rather, it is the strong cloud response to BC in these regions, shown in previous studies (Stjern et al., 2017) to result from aerosol-induced changes to atmospheric stability and relative humidity, that drive the response in DTR. All models have stronger correlations to cloud-related variables than to clear-sky radiative fluxes or changes in BC burden. Hence, the very high BC concentrations in this region have a strong influence on clouds and thus on DTR.
Although these high-emission regions seem to have driver-specific responses in the DTR, in some seasons, e.g., during autumn over India, CO2 and SO4 produce DTR changes of the same sign as BC, again indicating the existence of an underlying driver-independent DTR response tied to the general warming of the climate. This supports the work of Vinnarasi et al. (2017), who stressed that observed DTR changes over India are a result of both local and global factors working in tandem.
Disentangling the role of aerosols and greenhouse gases to DTR changes is a crucial step towards prediction of future changes in regional DTR. This is particularly true in regions such as India and East Asia (Vinnarasi et al., 2017), in which risk factors are aggravated by agriculture-dependent economies and dense populations and where future trends in aerosol emissions are highly uncertain but likely to be strong. Understanding how greenhouse gases, absorbing aerosols and scattering aerosols individually influence the DTR may help these regions prepare for future changes.
The PDRMIP model output is publicly available; for data access, visit http://https://cicero.oslo.no/en/PDRMIP/PDRMIP-data-access (Samset et al., 2020).
The supplement related to this article is available online at: https://doi.org/10.5194/acp-20-13467-2020-supplement.
CWS, BHS and GM designed the analyses, and CWS carried them out. BHS, OB, JFL and TT performed model simulations. CWS prepared the article with contributions from all co-authors.
The authors declare that they have no conflict of interest.
PDRMIP is partly funded through the Norwegian Research Council project NAPEX (project number 229778). Camilla W. Stjern and Bjørn H. Samset were funded through the Norwegian Research Council project NetBC (project number 244141). Trond Iversen was supported by JSPS KAKENHI (grant no. JP19H05669). Olivier Boucher acknowledges HPC resources from TGCC under the gencmip6 allocation provided by GENCI (Grand Equipement National de Calcul Intensif). The computations and/or simulations were performed using the NN9188K project account, and data were stored and shared on project accounts NS9042K on resources provided by UNINETT Sigma2 – the national infrastructure for high-performance computing and data storage in Norway.
This research has been funded by the Norwegian Research Council (grant no. 229778 and 244141).
This paper was edited by Michael Schulz and reviewed by two anonymous referees.
Albrecht, B. A.: Aerosols, Cloud Microphysics and Fractional Cloudiness, Science, 245, 1227–1230, https://doi.org/10.1126/science.245.4923.1227, 1989.
Allen, R. J., Amiri-Farahani, A., Lamarque, J.-F., Smith, C., Shindell, D., Hassan, T., and Chung, C. E.: Observationally constrained aerosol-cloud semi-direct effects, npj Climate and Atmospheric Science, 2, 16, https://doi.org/10.1038/s41612-019-0073-9, 2019.
Brogli, R., Kröner, N., Sørland, S. L., Lüthi, D., and Schär, C.: The Role of Hadley Circulation and Lapse-Rate Changes for the Future European Summer Climate, J. Climate, 32, 385–404, https://doi.org/10.1175/jcli-d-18-0431.1, 2019.
Cheng, J., Xu, Z., Zhu, R., Wang, X., Jin, L., Song, J., and Su, H.: Impact of diurnal temperature range on human health: a systematic review, Int. J. Biometeorol., 58, 2011–2024, https://doi.org/10.1007/s00484-014-0797-5, 2014.
Dai, A., Trenberth, K. E., and Karl, T. R.: Effects of Clouds, Soil Moisture, Precipitation, and Water Vapor on Diurnal Temperature Range, J. Climate, 12, 2451–2473, https://doi.org/10.1175/1520-0442(1999)012<2451:Eocsmp>2.0.Co;2, 1999.
Davy, R., Esau, I., Chernokulsky, A., Outten, S., and Zilitinkevich, S.: Diurnal asymmetry to the observed global warming, Int. J. Climatol., 37, 79–93, https://doi.org/10.1002/joc.4688, 2017.
Deser, C., Knutti, R., Solomon, S., and Phillips, A. S.: Communication of the role of natural variability in future North American climate, Nat. Clim. Change, 2, 775–779, https://doi.org/10.1038/nclimate1562, 2012.
Deshpande, C. G. and Kamra, A. K.: Physical properties of the arctic summer aerosol particles in relation to sources at Ny-Alesund, Svalbard, J. Earth Syst. Sci., 123, 201–212, https://doi.org/10.1007/s12040-013-0373-0, 2014.
Dessler, A. E. and Zelinka, M. D.: Climate and Climate Change, Climate Feedbacks, in: Encyclopedia of Atmospheric Sciences (Second Edition), edited by: North, G. R., Pyle, J., and Zhang, F., Academic Press, Oxford, 18–25, ISBN 9780123822253, 2015.
Eyring, V., Bony, S., Meehl, G. A., Senior, C. A., Stevens, B., Stouffer, R. J., and Taylor, K. E.: Overview of the Coupled Model Intercomparison Project Phase 6 (CMIP6) experimental design and organization, Geosci. Model Dev., 9, 1937–1958, https://doi.org/10.5194/gmd-9-1937-2016, 2016.
Hansen, J., Sato, M., and Ruedy, R.: Radiative forcing and climate response, J. Geophys. Res.-Atmos., 102, 6831–6864, https://doi.org/10.1029/96jd03436, 1997.
Harris, I., Jones, P. D., Osborn, T. J., and Lister, D. H.: Updated high-resolution grids of monthly climatic observations – the CRU TS3.10 Dataset, Int. J. Climatol., 34, 623–642, https://doi.org/10.1002/joc.3711, 2014.
Hartmann, D. L., Klein-Tank, A. M. G., Rusticucci, M., Alexander, L. V., Brönnimann, S., Charabi, Y., Dentener, F. J., Dlugokencky, E. J., Easterling, D. R., Kaplan, A., Soden, B. J., Thorne, P. W., Wild, M., and Zhai, P. M.: Observations: Atmosphere and Surface, in: Climate Change 2013: The Physical Science Basis. Contribution of Working Group I to the Fifth Assessment Report of the Intergovernmental Panel on Climate Change, edited by: Stocker, T. F., Qin, D., Plattner, G.-K., Tignor, M., Allen, S. K., Boschung, J., Nauels, A., Xia, Y., Bex, V., and Midgley, P. M., Cambridge University Press, Cambridge, United Kingdom and New York, NY, USA, 159–254, ISBN 978-1-107-66182-0, 2013.
Hernandez-Barrera, S., Rodriguez-Puebla, C., and Challinor, A. J.: Effects of diurnal temperature range and drought on wheat yield in Spain, Theor. Appl. Climatol., 129, 503–519, https://doi.org/10.1007/s00704-016-1779-9, 2017.
Karl, T. R., Jones, P. D., Knight, R. W., Kukla, G., Plummer, N., Razuvayev, V., Gallo, K. P., Lindseay, J., Charlson, R. J., and Peterson, T. C.: A New Perspective on Recent Global Warming: Asymmetric Trends of Daily Maximum and Minimum Temperature, B. Am. Meteorol. Soc., 74, 1007–1024, https://doi.org/10.1175/1520-0477(1993)074<1007:Anporg>2.0.Co;2, 1993.
Kim, J., Shin, J., Lim, Y.-H., Honda, Y., Hashizume, M., Guo, Y. L., Kan, H., Yi, S., and Kim, H.: Comprehensive approach to understand the association between diurnal temperature range and mortality in East Asia, Sci. Total Environ., 539, 313–321, https://doi.org/10.1016/j.scitotenv.2015.08.134, 2016.
Kleidon, A. and Renner, M.: An explanation for the different climate sensitivities of land and ocean surfaces based on the diurnal cycle, Earth Syst. Dynam., 8, 849–864, https://doi.org/10.5194/esd-8-849-2017, 2017.
Lagouarde, J. P. and Brunet, Y.: A simple model for estimating the daily upward longwave surface radiation flux from NOAA-AVHRR data, Int. J. Remote Sens., 14, 907–925, https://doi.org/10.1080/01431169308904386, 1993.
Lamarque, J.-F., Bond, T. C., Eyring, V., Granier, C., Heil, A., Klimont, Z., Lee, D., Liousse, C., Mieville, A., Owen, B., Schultz, M. G., Shindell, D., Smith, S. J., Stehfest, E., Van Aardenne, J., Cooper, O. R., Kainuma, M., Mahowald, N., McConnell, J. R., Naik, V., Riahi, K., and van Vuuren, D. P.: Historical (1850–2000) gridded anthropogenic and biomass burning emissions of reactive gases and aerosols: methodology and application, Atmos. Chem. Phys., 10, 7017–7039, https://doi.org/10.5194/acp-10-7017-2010, 2010.
Lau, W. K. M. and Kim, K.-M.: Robust Hadley Circulation changes and increasing global dryness due to CO2 warming from CMIP5 model projections, P. Natl. Acad. Sci., 112, 3630–3635, https://doi.org/10.1073/pnas.1418682112, 2015.
Leduc, M., Mailhot, A., Frigon, A., Martel, J.-L., Ludwig, R., Brietzke, G. B., Giguère, M., Brissette, F., Turcotte, R., Braun, M., and Scinocca, J.: The ClimEx Project: A 50-Member Ensemble of Climate Change Projections at 12 km Resolution over Europe and Northeastern North America with the Canadian Regional Climate Model (CRCM5), J. Appl. Meteorol. Clim., 58, 663–693, https://doi.org/10.1175/jamc-d-18-0021.1, 2019.
Lewis, S. C. and Karoly, D. J.: Evaluation of Historical Diurnal Temperature Range Trends in CMIP5 Models, J. Climate, 26, 9077–9089, https://doi.org/10.1175/jcli-d-13-00032.1, 2013.
Lim, Y.-H., Hong, Y.-C., and Kim, H.: Effects of diurnal temperature range on cardiovascular and respiratory hospital admissions in Korea, Sci. Total Environ., 417–418, 55–60, https://doi.org/10.1016/j.scitotenv.2011.12.048, 2012.
Lindvall, J. and Svensson, G.: The diurnal temperature range in the CMIP5 models, Clim Dynam., 44, 405–421, https://doi.org/10.1007/s00382-014-2144-2, 2015.
Liu, B., Xu, M., Henderson, M., Qi, Y., and Li, Y.: Taking China's Temperature: Daily Range, Warming Trends, and Regional Variations, 1955–2000, J. Climate, 17, 4453–4462, https://doi.org/10.1175/3230.1, 2004.
Liu, L., Li, Z., Yang, X., Gong, H., Li, C., and Xiong, A.: The long-term trend in the diurnal temperature range over Asia and its natural and anthropogenic causes, J. Geophys. Res.-Atmos., 121, 3519–3533, https://doi.org/10.1002/2015jd024549, 2016.
Lobell, D. B.: Changes in diurnal temperature range and national cereal yields, Agr. Forest Meteorol., 145, 229–238, https://doi.org/10.1016/j.agrformet.2007.05.002, 2007.
Lund, M. T., Myhre, G., and Samset, B. H.: Anthropogenic aerosol forcing under the Shared Socioeconomic Pathways, Atmos. Chem. Phys., 19, 13827–13839, https://doi.org/10.5194/acp-19-13827-2019, 2019.
Makowski, K., Wild, M., and Ohmura, A.: Diurnal temperature range over Europe between 1950 and 2005, Atmos. Chem. Phys., 8, 6483–6498, https://doi.org/10.5194/acp-8-6483-2008, 2008.
Manabe, S. and Wetherald, R. T.: Large-Scale Changes of Soil Wetness Induced by an Increase in Atmospheric Carbon Dioxide, J. Atmos. Sci., 44, 1211–1236, https://doi.org/10.1175/1520-0469(1987)044<1211:lscosw>2.0.co;2, 1987.
Mohan, M. and Kandya, A.: Impact of urbanization and land-use/land-cover change on diurnal temperature range: A case study of tropical urban airshed of India using remote sensing data, Sci. Total Environ., 506–507, 453–465, https://doi.org/10.1016/j.scitotenv.2014.11.006, 2015.
Myhre, G., Samset, B. H., Schulz, M., Balkanski, Y., Bauer, S., Berntsen, T. K., Bian, H., Bellouin, N., Chin, M., Diehl, T., Easter, R. C., Feichter, J., Ghan, S. J., Hauglustaine, D., Iversen, T., Kinne, S., Kirkevåg, A., Lamarque, J.-F., Lin, G., Liu, X., Lund, M. T., Luo, G., Ma, X., van Noije, T., Penner, J. E., Rasch, P. J., Ruiz, A., Seland, Ø., Skeie, R. B., Stier, P., Takemura, T., Tsigaridis, K., Wang, P., Wang, Z., Xu, L., Yu, H., Yu, F., Yoon, J.-H., Zhang, K., Zhang, H., and Zhou, C.: Radiative forcing of the direct aerosol effect from AeroCom Phase II simulations, Atmos. Chem. Phys., 13, 1853–1877, https://doi.org/10.5194/acp-13-1853-2013, 2013.
Myhre, G., Forster, P. M., Samset, B. H., Hodnebrog, Ø., Sillmann, J., Aalbergsjø, S. G., Andrews, T., Boucher, O., Faluvegi, G., Fläschner, D., Kasoar, M., Kharin, V., Kirkevåg, A., Lamarque, J.-F., Olivié, D., Richardson, T., Shindell, D., Shine, K. P., Stjern, C. W., Takemura, T., Voulgarakis, A., and Zwiers, F.: PDRMIP: A Precipitation Driver and Response Model Intercomparison Project, Protocol and preliminary results, B. Am. Meteorol. Soc., 98, 1185–1198, https://doi.org/10.1175/BAMS-D-16-0019.1, 2017a.
Myhre, G., Aas, W., Cherian, R., Collins, W., Faluvegi, G., Flanner, M., Forster, P., Hodnebrog, Ø., Klimont, Z., Lund, M. T., Mülmenstädt, J., Lund Myhre, C., Olivié, D., Prather, M., Quaas, J., Samset, B. H., Schnell, J. L., Schulz, M., Shindell, D., Skeie, R. B., Takemura, T., and Tsyro, S.: Multi-model simulations of aerosol and ozone radiative forcing due to anthropogenic emission changes during the period 1990–2015, Atmos. Chem. Phys., 17, 2709–2720, https://doi.org/10.5194/acp-17-2709-2017, 2017b.
Paaijmans, K. P., Blanford, S., Bell, A. S., Blanford, J. I., Read, A. F., and Thomas, M. B.: Influence of climate on malaria transmission depends on daily temperature variation, P. Natl. Acad. Sci., 107, 15135–15139, https://doi.org/10.1073/pnas.1006422107, 2010.
Rao, S., Klimont, Z., Smith, S. J., Van Dingenen, R., Dentener, F., Bouwman, L., Riahi, K., Amann, M., Bodirsky, B. L., van Vuuren, D. P., Aleluia Reis, L., Calvin, K., Drouet, L., Fricko, O., Fujimori, S., Gernaat, D., Havlik, P., Harmsen, M., Hasegawa, T., Heyes, C., Hilaire, J., Luderer, G., Masui, T., Stehfest, E., Strefler, J., van der Sluis, S., and Tavoni, M.: Future air pollution in the Shared Socio-economic Pathways, Global Environ. Change, 42, 346–358, https://doi.org/10.1016/j.gloenvcha.2016.05.012, 2017.
Richardson, T. B., Forster, P. M., Andrews, T., Boucher, O., Faluvegi, G., Fläschner, D., Hodnebrog, Ø., Kasoar, M., Kirkevåg, A., Lamarque, J.-F., Myhre, G., Olivié, D., Samset, B. H., Shawki, D., Shindell, D., Takemura, T., and Voulgarakis, A.: Drivers of Precipitation Change: An Energetic Understanding, J. Climate, 31, 9641–9657, https://doi.org/10.1175/jcli-d-17-0240.1, 2018.
Rowell, D. P. and Jones, R. G.: Causes and uncertainty of future summer drying over Europe, Clim. Dynam., 27, 281–299, https://doi.org/10.1007/s00382-006-0125-9, 2006.
Samset, B. H., Myhre, G., Schulz, M., Balkanski, Y., Bauer, S., Berntsen, T. K., Bian, H., Bellouin, N., Diehl, T., Easter, R. C., Ghan, S. J., Iversen, T., Kinne, S., Kirkevåg, A., Lamarque, J.-F., Lin, G., Liu, X., Penner, J. E., Seland, Ø., Skeie, R. B., Stier, P., Takemura, T., Tsigaridis, K., and Zhang, K.: Black carbon vertical profiles strongly affect its radiative forcing uncertainty, Atmos. Chem. Phys., 13, 2423–2434, https://doi.org/10.5194/acp-13-2423-2013, 2013.
Samset, B. H. and Myhre, G.: Climate response to externally mixed black carbon as a function of altitude. J. Geophys. Res.-Atmos., 120, 2913–2927, https://doi.org/10.1002/2014JD022849, 2015.
Samset, B. H., Myhre, G., Forster, P. M., Hodnebrog, Ø., Andrews, T., Faluvegi, G., Fläschner, D., Kasoar, M., Kharin, V., Kirkevåg, A., Lamarque, J. F., Olivié, D., Richardson, T., Shindell, D., Shine, K. P., Takemura, T., and Voulgarakis, A.: Fast and slow precipitation responses to individual climate forcers: A PDRMIP multimodel study, Geophys. Res. Lett., 43, 2782–2791, https://doi.org/10.1002/2016GL068064, 2016.
Samset, B. H., Lund, M. T., Bollasina, M., Myhre, G., and Wilcox, L.: Emerging Asian aerosol patterns, Nat. Geosci., 12, 582–584, https://doi.org/10.1038/s41561-019-0424-5, 2019.
Samset, B. H., Myhre, G., and Hodnebrog, Ø.: PDRMIP Data Access, 2017, CICERO Web site, http://https://cicero.oslo.no/en/PDRMIP/PDRMIP-data-access, last access: 30 October 2020.
Sillmann, J., Kharin, V. V., Zhang, X., Zwiers, F. W., and Bronaugh, D.: Climate extremes indices in the CMIP5 multimodel ensemble: Part 1: Model evaluation in the present climate, J. Geophys. Res.-Atmos., 118, 1716–1733, https://doi.org/10.1002/jgrd.50203, 2013.
Steeneveld, G.-J.: Current challenges in understanding and forecasting stable boundary layers over land and ice, Frontiers in Environmental Science, 2, 41, 1–6, https://doi.org/10.3389/fenvs.2014.00041, 2014.
Stjern, C. W., Samset, B. H., Myhre, G., Forster, P. M., Hodnebrog, Ø., Andrews, T., Boucher, O., Faluvegi, G., Iversen, T., Kasoar, M., Kharin, V., Kirkevåg, A., Lamarque, J. F., Olivié, D., Richardson, T., Shawki, D., Shindell, D., Smith, C. J., Takemura, T., and Voulgarakis, A.: Rapid Adjustments Cause Weak Surface Temperature Response to Increased Black Carbon Concentrations, J. Geophys. Res.-Atmos., 122, 11462–11481, https://doi.org/10.1002/2017JD027326, 2017.
Tang, T., Shindell, D., Samset, B. H., Boucher, O., Forster, P. M., Hodnebrog, Ø., Myhre, G., Sillmann, J., Voulgarakis, A., Andrews, T., Faluvegi, G., Fläschner, D., Iversen, T., Kasoar, M., Kharin, V., Kirkevåg, A., Lamarque, J.-F., Olivié, D., Richardson, T., Stjern, C. W., and Takemura, T.: Dynamical response of Mediterranean precipitation to greenhouse gases and aerosols, Atmos. Chem. Phys., 18, 8439–8452, https://doi.org/10.5194/acp-18-8439-2018, 2018.
Twomey, S.: Pollution and the planetary albedo, Atmos. Environ., 8, 1251–1256, https://doi.org/10.1016/0004-6981(74)90004-3, 1974.
Vautard, R., Gobiet, A., Sobolowski, S., Kjellström, E., Stegehuis, A., Watkiss, P., Mendlik, T., Landgren, O., Nikulin, G., Teichmann, C., and Jacob, D.: The European climate under a 2 ∘C global warming, Environ. Res. Lett., 9, 034006, https://doi.org/10.1088/1748-9326/9/3/034006, 2014.
Vinnarasi, R., Dhanya, C. T., Chakravorty, A., and AghaKouchak, A.: Unravelling Diurnal Asymmetry of Surface Temperature in Different Climate Zones, Sci. Rep.-UK, 7, 7350, https://doi.org/10.1038/s41598-017-07627-5, 2017.
Vose, R. S., Easterling, D. R., and Gleason, B.: Maximum and minimum temperature trends for the globe: An update through 2004, Geophys. Res. Lett., 32, L23822, https://doi.org/10.1029/2005gl024379, 2005.
Wilcox, L. J., Liu, Z., Samset, B. H., Hawkins, E., Lund, M. T., Nordling, K., Undorf, S., Bollasina, M., Ekman, A. M. L., Krishnan, S., Merikanto, J., and Turner, A. G.: Accelerated increases in global and Asian summer monsoon precipitation from future aerosol reductions, Atmos. Chem. Phys., 20, 11955–11977, https://doi.org/10.5194/acp-20-11955-2020, 2020.
Zhou, L., Dickinson, R. E., Tian, Y., Vose, R. S., and Dai, Y.: Impact of vegetation removal and soil aridation on diurnal temperature range in a semiarid region: Application to the Sahel, P. Natl. Acad. Sci., 104, 17937–17942, https://doi.org/10.1073/pnas.0700290104, 2007.