the Creative Commons Attribution 4.0 License.
the Creative Commons Attribution 4.0 License.
 | 12 Nov 2020
Atmospheric new particle formation characteristics in the Arctic as measured at Mount Zeppelin, Svalbard, from 2016 to 2018
Haebum Lee
Kwangyul Lee
Chris Rene Lunder
Radovan Krejci
Wenche Aas
Jiyeon Park
Ki-Tae Park
Bang Yong Lee
Young Jun Yoon
Kihong Park
We conducted continuous measurements of nanoparticles down to 3 nm size in the Arctic at Mount Zeppelin, Ny Ålesund, Svalbard, from October 2016 to December 2018, providing a size distribution of nanoparticles (3–60 nm). A significant number of nanoparticles as small as 3 nm were often observed during new particle formation (NPF), particularly in summer, suggesting that these were likely produced near the site rather than being transported from other regions after growth. The average NPF frequency per year was 23 %, having the highest percentage in August (63 %). The average formation rate (J) and growth rate (GR) for 3–7 nm particles were 0.04 cm−3 s−1 and 2.07 nm h−1, respectively. Although NPF frequency in the Arctic was comparable to that in continental areas, the J and GR were much lower. The number of nanoparticles increased more frequently when air mass originated over the south and southwest ocean regions; this pattern overlapped with regions having strong chlorophyll a concentration and dimethyl sulfide (DMS) production capacity (southwest ocean) and was also associated with increased NH3 and H2SO4 concentration, suggesting that marine biogenic sources were responsible for gaseous precursors to NPF. Our results show that previously developed NPF occurrence criteria (low loss rate and high cluster growth rate favor NPF) are also applicable to NPF in the Arctic.
- Article
(5197 KB) - Full-text XML
-
Supplement
(1041 KB) - BibTeX
- EndNote


The Arctic climate system is affected by the region's snow-covered land, sea ice, and ocean, making the region vulnerable to global climate change (Jeffries and Richter-Menge, 2012). Greenhouse gases and aerosols are significant factors affecting the regional climate (Quinn et al., 2007; IPCC, 2014). In particular, aerosols in the ambient atmosphere affect the radiation balance by scattering or absorbing incoming solar light (direct effect) (Toon and Pollack, 1980; Satheesh and Moorthy, 2005) and forming clouds by acting as cloud condensation nuclei (CCN) (indirect effect) (Merikanto et al., 2009).
New particle formation (NPF), which significantly enhances the number of particles in the ambient atmosphere, has been observed in various locations and at various times (Kulmala et al., 2004; Wang et al., 2017; Yu et al., 2017). In favorable conditions, newly formed nanoparticles can, through condensation and coagulation, grow to sizes that allow the formation of CCN. NPF is observed regardless of pollution level, from very clean (e.g., background sites) to heavily polluted (e.g., urban sites), suggesting that various pathways are involved depending on the location and time (Kulmala et al., 2004; Wang et al., 2017). Nucleation can occur almost anywhere in diverse environments, but NPF is observed only when freshly nucleated clusters grow to a detectable size (1–3 nm) (McMurry et al., 2005). Previously developed criteria for NPF occurrence suggest that a low loss (or scavenging) rate and high growth rate (GR) of clusters increase fresh nuclei survival probability and thus favor NPF, while a high loss rate and low cluster GR suppress it (Kuang et al., 2012).
In the Arctic, a specific phenomenon called “Arctic haze” related to long-range transport of polluted air masses typically occurs in the late winter and early spring (Iziomon et al., 2006; O'Neill et al., 2008, Hirdman et al., 2010). The Arctic haze is associated with elevated concentrations of accumulation-mode particles (Radke et al., 1984; Shaw, 1995; Law and Stohl, 2007; Quinn et al., 2007). A high concentration of accumulation-mode particles results in a high condensational sink (CS) for precursor vapors, which could suppress NPF. The NPF in the Arctic was often reported in summer, when the CS was smaller (Wiedensohler et al., 1996; Covert et al., 1996; Sharma et al., 2013; Willis et al., 2016; Croft et al., 2016). In addition, strong biogenic production from marine and coastal environments in the Arctic region (e.g., Alaska, Alert, and Svalbard) was reported to be linked to NPF due to an increased amount of biogenic sulfur compounds such as dimethyl sulfide and its oxidative products (methane sulfonate and biogenic sulfate) (Leaitch et al., 2013; Park et al., 2017). Like in sulfuric-acid-rich regions, organic-based new particles were observed in pristine environments (Quinn et al., 2002; Karl et al., 2013; Leaitch et al., 2013; Heintzenberg et al., 2015). Asmi et al. (2016) reported that NPF was more common in air masses of oceanic origin compared to continental ones in the Arctic (Tiksi station, Russia). Dall'Osto et al. (2018) suggested that NPF at Station Nord in North Greenland was related to seasonal sea ice cycles (i.e., the NPF was associated with air masses coming from open water and melting sea ice regions).
There are several past studies of NPF at the Zeppelin Observatory at Mount Zeppelin in Svalbard, Norway (Tunved et al., 2013; Dall'Osto et al., 2017; Heintzenberg et al., 2017). The location of the station is 474 m above sea level and ∼ 2 km from a small scientific community, with minimal effects from anthropogenic sources. Its unique geographical location is ideal for investigating NPF in the Arctic environment. Tunved et al. (2013) studied seasonal variations in particle size distribution and NPF based on aerosol size distribution data (10–790 nm) from 2000 to 2010. Heintzenberg et al. (2017) developed a new NPF search algorithm using size distribution data (5–630 nm) from 2006 to 2015. Dall'Osto et al. (2017) determined the relationship between NPF and the extent of Arctic sea ice melt using size distribution data (10–500 nm) from 2000 to 2010 and used hourly data to classify the size distributions and NPF types. It was reported that NPF at the Mount Zeppelin site mostly occurs during summer, which was attributed to the low CS and high biological activity in summer (Leaitch et al., 2013; Heintzenberg et al., 2015; Park et al., 2017). NPF occurrence was low during the Arctic haze (with high CS) period (Tunved et al., 2013; Croft et al., 2016). Heintzenberg et al. (2017) suggested that NPF at the Mount Zeppelin site was related to solar flux and sea surface temperature, affecting marine biological processes and photochemical reactions with less CS. They reported the potential source regions for NPF to be the marginal-ice and open-water areas between northeastern Greenland and eastern Svalbard. Although particle size distribution data from the Mount Zeppelin site are available (Ström et al., 2003; Tunved et al., 2013; Dall'Osto et al., 2017; Heintzenberg et al., 2017), no data regarding the size distribution of nanoparticles smaller than 5 nm are available, though these could provide greater insight into NPF characteristics. Currently, the initial formation and growth of nanoparticles below 10 nm cannot be resolved, and weak NPF events with no substantial particle growth up to 10 nm cannot be detected.
In this study, we measured number size distribution of nanoparticles down to 3 nm for the first time at Zeppelin station, and we obtained continuous size distributions of 3–60 nm particles every 3 min from October 2016 to December 2018. This allowed the size distribution of nanoparticles to be determined with a lower size limit than before, enabling better identification of whether freshly nucleated particles formed on site or were transported from other regions after substantial growth. We were also able to detect NPF events when particle growth was terminated below 10 nm. The particle size distributions were classified into several clusters, and the seasonal (monthly), daily, and diurnal variations in the nanoparticle concentrations were examined. We also applied the NPF criteria to Arctic data to determine whether or not NPF should occur and investigated the characteristics of NPF events related to formation rate, GR, CS, and meteorological parameters. Finally, potential source regions for NPF were explored using air mass backward trajectory and satellite-derived chlorophyll a concentration data. The chlorophyll a, which is involved in oxygenic photosynthesis in the ocean, has been considered a proxy for phytoplankton biomass only. Recent studies showed that there was a strong correlation between sea surface chlorophyll a concentration (estimated by MODIS Aqua) and atmospheric DMS levels at Zeppelin station (Park et al., 2013, 2018).
The measurement site was located at the Zeppelin Observatory at Mount Zeppelin, Svalbard (78∘54′ N, 11∘53′ E), which is 474 m above sea level and ∼ 2 km from the small scientific community in Ny-Ålesund, Norway (78∘55′ N, 11∘56′ E) (Fig. 1). Ny-Ålesund lies within the west Spitsbergen current at the northernmost point of the warm Atlantic influx; this location provides an ideal location for observing climate parameters and investigating the long-range transport route by which contamination is often carried via southerly air masses (Neuber et al., 2011). The dominant wind patterns (east and southeast from the Kongsvegen glacier (40 %) and northwest from the Kongsfjorden channels (14 %) during the measurement period from October 2016 to December 2018) and elevation suggest that the effects of local sources on the Zeppelin Observatory are small (Beine et al., 2001).
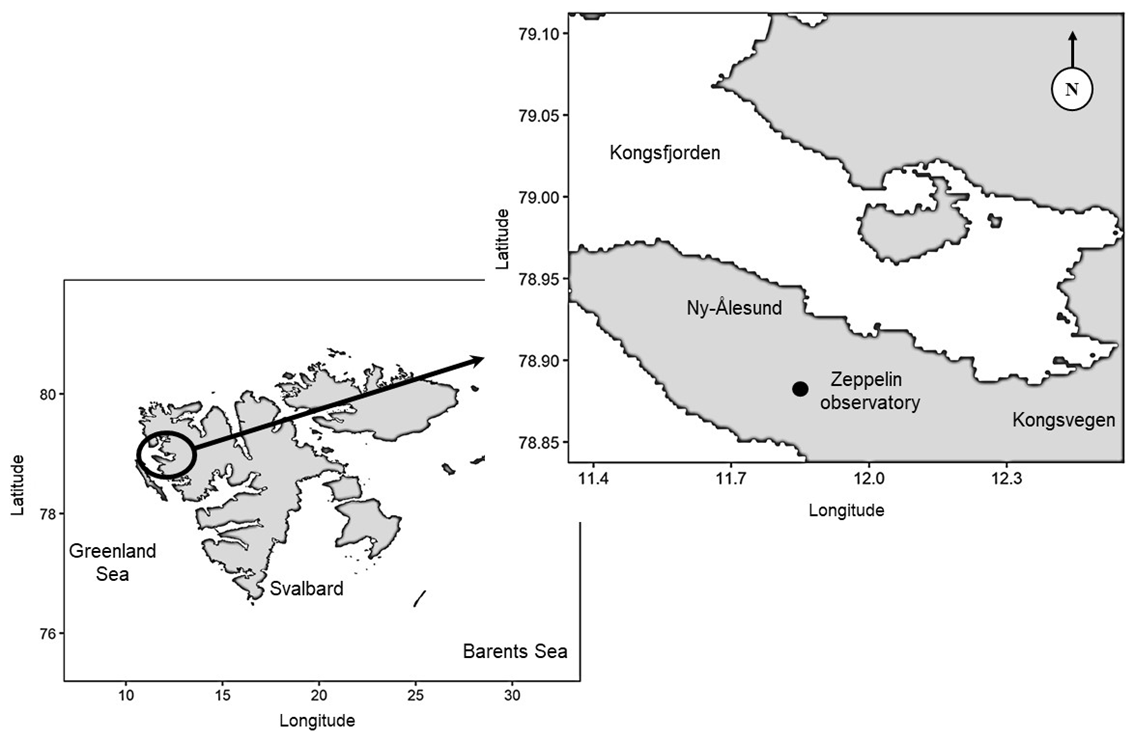
Figure 1Measurement site (Zeppelin Observatory) in the Svalbard Archipelago, Ny-Ålesund, Norway.
An air inlet with a flow rate of 100 L min−1 was used to introduce ambient aerosols into the instruments. The flow temperature was maintained above 0∘ to prevent ice and frost formation in the tube. The observatory was kept warm and dry, with an indoor temperature and relative humidity (RH) of ∼ 20∘ and < 30 %, respectively (Tunved et al., 2013; Heintzenberg et al., 2017). A nano-SMPS (scanning mobility particle sizer) consisting of a nano-differential mobility analyzer (nano-DMA) (model 3085, TSI, USA) and an ultrafine condensation particle counter (model 3776, TSI, USA) was used to measure the size distribution of nanoparticles (3–60 nm) every 3 min; the aerosol flow rate was 1.5 L min−1 and the sheath flow rate was 15 L min−1. The size distribution data were processed using the method described by Kulmala et al. (2012).
Daily ionic species (Na+, Mg2+, K+, NH, NO, SO, and Cl−) in particulate matter and gas data (NH3 and SO2) at Zeppelin Observatory, along with meteorological parameters (temperature, RH, wind, and pressure), were obtained from the Norwegian national monitoring program (Aas et al., 2019) via the EBAS database (http://ebas.nilu.no/, last access: 2 November 2020). Daily ionic species and gas data are daily measurements collected with a three-stage filter pack sampler (NILU prototype) with no pre-impactor. The size cutoff of the inlet section is approximately 10 µm. Field blanks were prepared the same as the other samples. It should be noted that for the nitrogen compounds the separation of gas and aerosol might be biased due to the volatile nature of NH4NO3. The detection limits were 0.05 µg N m−3 and 0.01 µg S m−3 for NH3 and SO2, respectively; 0.01 µg m−3 for Na+, Mg2+, K+, and Cl−; 0.01 µg N m−3 for NO; 0.05 µg N m−3 for NH; and 0.01 µg S m−3 for SO. The data quality management and system are accredited in accordance to NS-EN ISO/IEC 1702 standards. The detailed information of sampling method and analysis can be found elsewhere (EMEP, 2014; Aas et al., 2019). Solar radiation (SRAD) at the AWIPEV (the Alfred Wegener Institute Helmholtz Centre for Polar and Marine Research and the French Polar Institute Paul Emile Victor) observatory in Ny-Ålesund was obtained from the Baseline Surface Radiation Network (BSRN) (Maturilli, 2019). Hourly data for number size distributions of particles from 5–810 and 10–790 nm, measured with differential mobility particle sizers (DMPSs), were obtained from Stockholm University and the Norwegian Institute for Air Research (NILU), respectively. The data from the DMPS and filter pack measurements are reported to several international monitoring programs (EMEP, European Monitoring and Evaluation Programme; ACTRIS, Aerosols, Clouds and Trace gases Research InfraStructure Network; and GAW-WDCA, Global Atmosphere Watch-the World Data Centre for Aerosols), and they are openly available from the database infrastructure EBAS. In addition, the hourly black carbon (BC) data at Zeppelin were used to examine the effect of primary combustion sources on the NPF.
Satellite-derived chlorophyll a concentration data in the Svalbard region (70–85∘ N, 25∘ W–50∘ E) were obtained from the level-3 product of the Aqua Moderate Resolution Imaging Spectroradiometer (MODIS) at a 4 km resolution. Air mass backward trajectories arriving at the Zeppelin Observatory were calculated for up to 5 d using the National Oceanic and Atmospheric Administration (NOAA) Hybrid Single Particle Lagrangian Integrated Trajectory (HYSPLIT) model based on Global Data Assimilation System (GDAS) 1∘ data. A potential source contribution function (PSCF) method (Pekney et al., 2006; Wang et al., 2009; Fleming et al., 2012) was also used to relate the air mass to NPF occurrence by analyzing the residence time of the air mass relative to the concentration of nanoparticles at the receptor site (Wang et al., 2009). In addition, the k-means clustering method, an unsupervised data classification and partitioning approach, was used to classify potential air mass origin along with the size distributions (Beddows et al., 2009; Dall'Osto et al., 2017).
The particle GR was calculated as the change rates of representative particle diameters (d1 and d2) with the highest concentrations at particular times (t1 and t2) (Hussein et al., 2005; Kulmala et al., 2012). The CS, which determines how rapidly condensable vapor molecules will condense on the existing aerosols (Kulmala et al., 2012), was calculated from the size distribution data (3–810 nm) with an assumed H2SO4 diffusion coefficient of 0.117 cm−2 s−1 (Gong et al., 2010; Cai et al., 2017). The number concentration in the size range di to dj (Ni–j) was derived from the measured size distribution data. Considering the particle loss and production processes allowed the following balance equation for Ni–j to be derived:
where Ji–j is the particle formation rate in the size range of di to dj, Fcoag is the particle loss rate related to coagulation scavenging in the size range of di to dj, and Fgrowh is the condensational GR of the nucleation-mode particles. Based on methods suggested by Kulmala et al. (2012), the particle formation rate (Ji–j) was calculated as
where CoagSi–j represents the mean of the coagulation sink (CoagS) in the size range of di to dj.
The dimensionless criterion (LΓ), which can be used to predict the occurrence of NPF events (McMurry et al., 2005; Cai et al., 2017), was calculated as
where is the mean thermal velocity of vapor (H2SO4), AFuchs is the Fuchs surface area (a coagulation scavenging parameter), β11 is the free-molecule collision frequency function for monomer collisions, N1 is the H2SO4 molecular concentration during the nucleation event, and Γ is the growth enhancement factor obtained by dividing the measured GR by the growth determined based on the condensation of only H2SO4. The H2SO4 molecular concentration was predicted from the measured daily SO2, hourly CS, hourly solar radiation, and hourly meteorological data (RH and temperature) using the method proposed by Mikkonen et al. (2011). The empirical proxy model of H2SO4 is given by
where [SO2] is the SO2 molecular concentration (molecules cm−3), SRAD is the solar radiation (W m−2), CS is the condensation sink (s−1), RH is the relative humidity (%), and k is the reaction rate constant depending on ambient temperature (see detailed definition for k in Eq. 3 of Mikkonen et al., 2011) with coefficients of , b=0.62, c=1, and . The H2SO4 concentration at Zeppelin was 5.98 ×10⁴–3.19 ×10⁶ molecules cm−3 during the summer in 2008 (Giamarelou et al., 2016), which is in a similar range to ours (2.69 ×10⁴–7.68 ×10⁶ molecules cm−3).
The data coverage for the size distribution data collected by nano-SMPS was about 89 % during the 27-month sampling period (October 2016 to December 2018). The monthly variations in the number concentrations of the 3–25 nm nanoparticles (N3–25) and 25–60 nm nanoparticles (N25–60) (averaged from hourly data) are shown in Fig. 2. We compared our nano-SMPS data with DMPS data at the same station as shown in Fig. S1 in the Supplement, suggesting that they were in a good agreement. Both N3–25 and N25–60 were highest in summer and lowest in winter, indicating that NPF occurred frequently in summer. The higher SRAD and lower CS (calculated from the 3–810 nm size distribution data) in summer also favored nanoparticle production. The highest monthly SRAD (199 W m−2) was observed in June. Due to the higher latitude of the site, the SRAD was lower than values reported at other continental sites (449 W m−2 during NPF in Lanzhou, China, Gao et al., 2011; 422–445 W m−2 during NPF in Pallas, Finland, Asmi et al., 2011; and > 750 W m−2 during NPF in Atlanta, USA, Woo et al., 2010). The wind speed in summer was lower than in other seasons, as expected from local climatology (Maturilli et al., 2013). In addition, marine biogenic sources, which provide gaseous precursors (e.g., DMS, H2SO4, and NH3) for nanoparticle formation, were known to be abundant in summer. It was observed that the percentage of air masses passing over high-chlorophyll-a (MODIS data) regions and H2SO4 and NH3 concentrations measured at the site increased in summer (Fig. S2 and Table S1 in the Supplement). For example, chlorophyll a concentration (a proxy for marine phytoplankton biomass; Siegel et al., 2013) in the Arctic Ocean surrounding the observation site during the measurement period began to increase in April and reached a maximum in May to June (Fig. S2 in the Supplement). During the Arctic haze period, the number of accumulation-mode particles (> 100 nm) increased considerably. A significant CS increase occurred in March (Fig. 2). The high number of accumulation-mode particles in spring and the high number of nucleation-mode particles in summer are consistent with previous findings (Tunved et al., 2013; Dall'Osto et al., 2017; Heinzenberg et al., 2017).
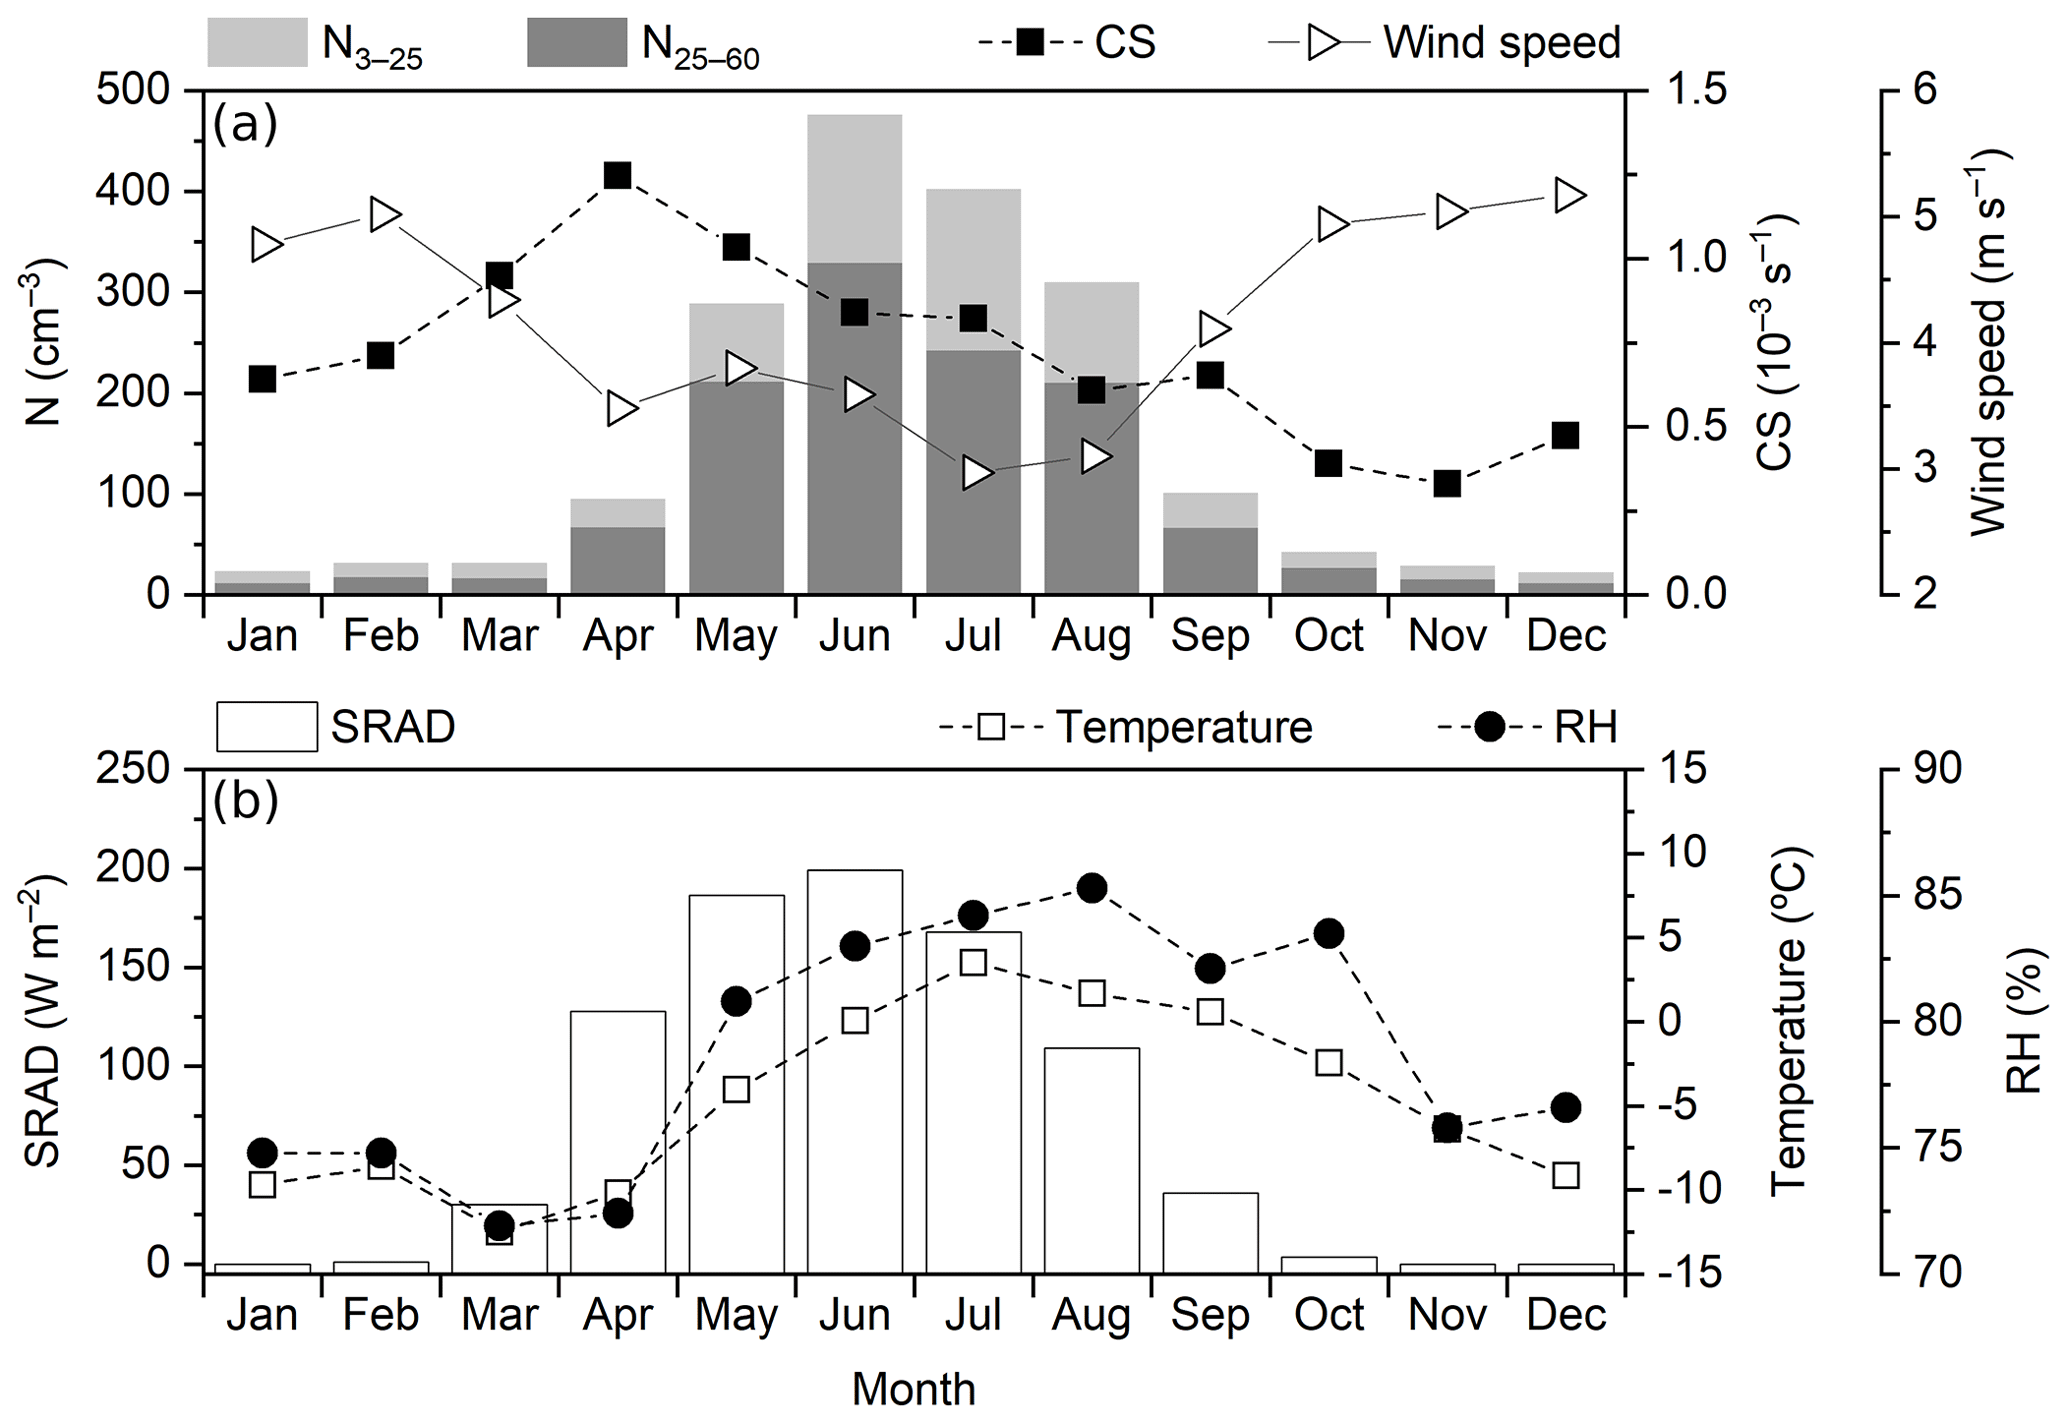
Figure 2Monthly variations in N3–25, N25–60, CS, and wind speed (a), temperature, RH, and SRAD (b) during the measurement period.
The size distributions of the 3–60 nm particles during the measurement period (hourly data) were classified into several major groups using the k-means clustering method. Four distinct clusters were found (Fig. 3a), with mode diameters of around 10 nm (cluster 1), 20 nm (cluster 2), 30 nm (cluster 3), and 50 nm (cluster 4). Cluster 1 included newly formed particles with high population. Cluster 4 had the lowest ultrafine-particle concentration, representing the background condition. The frequencies of each cluster by month are shown in Fig. 3b. The annual average percentages of each cluster were 7 % (cluster 1), 15 % (cluster 2), 23 % (cluster 3), and 55 % (cluster 4). The frequencies of clusters 1 and 2 increased significantly, and cluster 2 often appeared after cluster 1 in the late spring and summer months (May, June, July, and August), suggesting that strong particle growth (i.e., increases in mode diameter) after NPF occurred during those months.
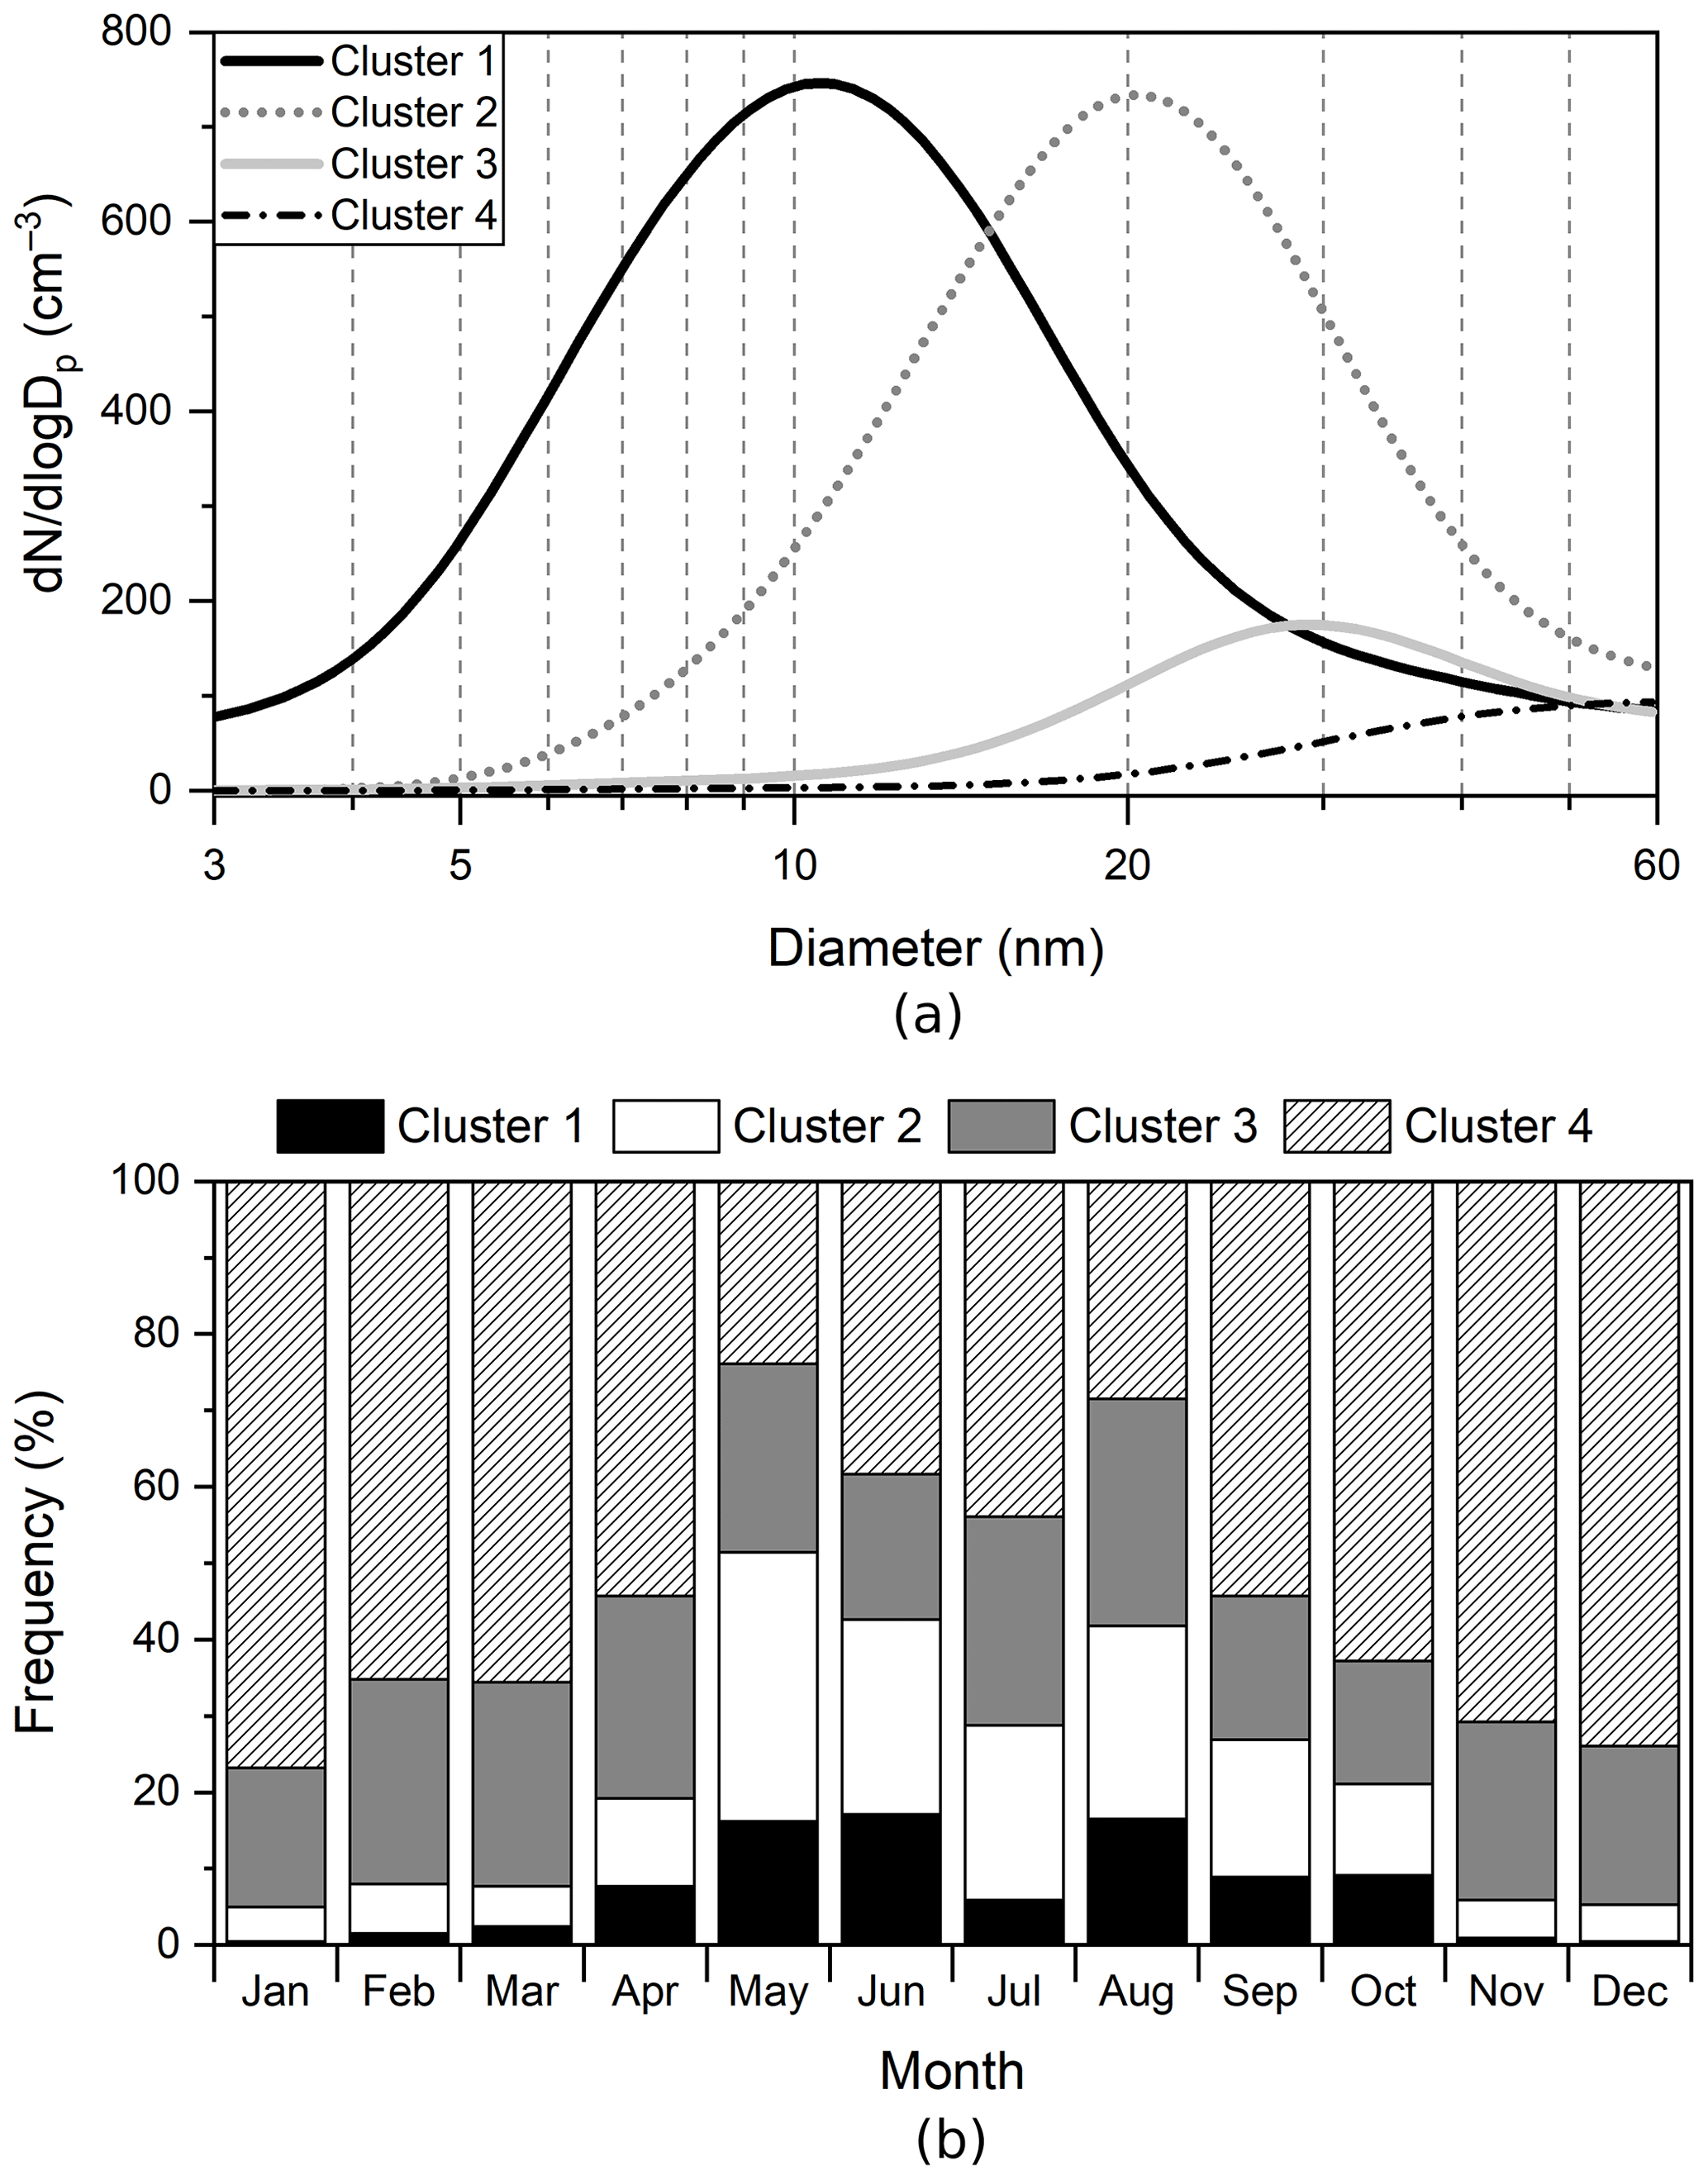
Figure 3Major particle clusters by (a) size distribution and (b) monthly frequency of clusters during the measurement period.
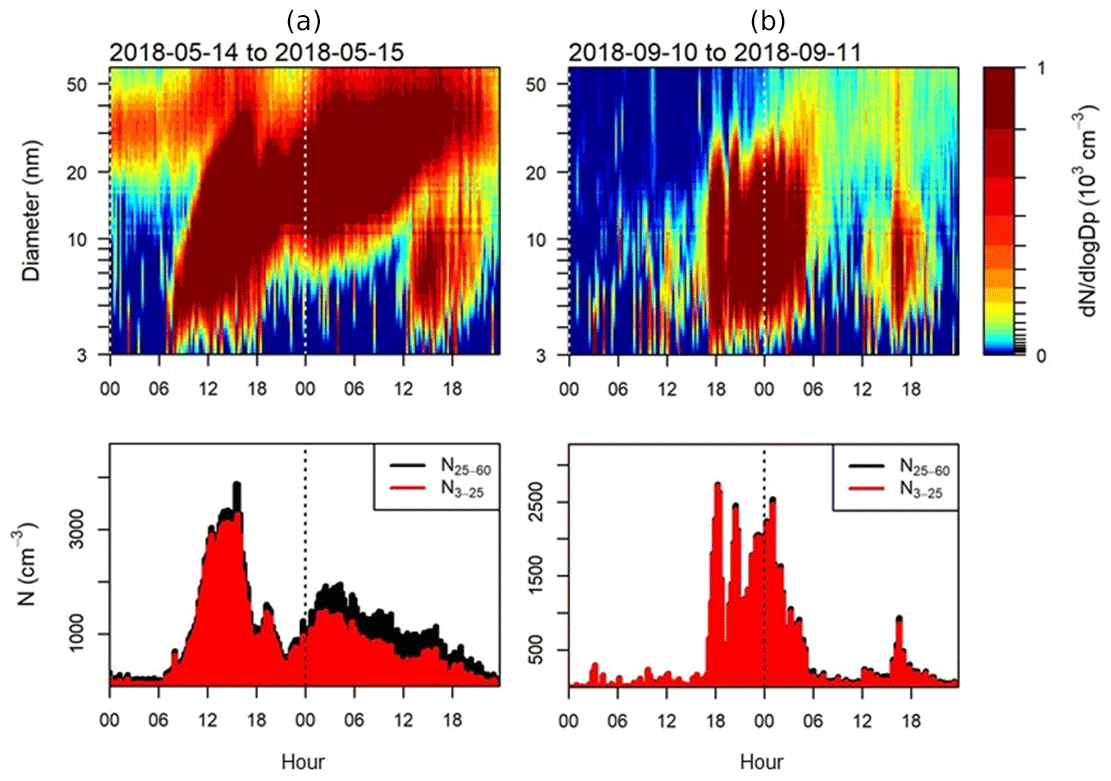
Figure 4Examples of distinct NPF types identified in this study. In type 1 (a), N3–25 increases significantly with continuous particle growth, while in type 2 (b) it increases significantly without significant particle growth. The x axis is the local time (hour).
We identified two distinct types of NPF (Fig. 4). In type 1, N3–25 increased significantly with subsequent particle growth (the freshly formed particles experienced gradual growth), a typical banana-shaped nucleation event, which is regularly observed at many locations worldwide. In type 2, N3–25 increased significantly without clear subsequent particle growth (almost no increase in the mode diameter with time, or not clear for growth); this type of event lasted more than 2 h. Therefore, the GR could be calculated only for type 1. The cases not matching either of these were classified as “undefined” NPF, for which N3–25 increased for a short period of time (less than 2 h). This NPF classification approach was similar to methods employed previously (Dal Maso et al., 2005; Kulmala et al., 2012; Nguyen et al., 2016). The mean occurrence percentage of NPF days (all types) per year from the measurement period was 23 %. Dall'Osto et al. (2017) found that the average of yearly NPF occurrence from 2000 to 2010 was 18 %, lower than our value, and that this increased over time as the coverage of sea ice melt increased. Based on the Heintzenberg et al. (2017) study, the mean occurrence percentage of NPF days per year from 2006 to 2015 was estimated to be around 20 %. In addition, DMS originating from marine sources can be a key precursor contributing to NPF in the remote marine atmosphere (Leaitch et al., 2013; Park et al., 2017; Jang et al., 2019). In the Arctic region, the DMS concentration increased by 33 % per decade from 1998 to 2016 (Galí et al., 2019), potentially leading to the increase in the annual NPF occurrence in this area.
It was shown that the concentration of fine particles could be affected by local combustion sources such as local port and cruise ships (Eckhardt et al., 2013). The effects of anthropogenic sources (e.g., downtown, local port, and cruise ship) on the NPF were examined by using local wind and air mass trajectory data to find whether air mass or wind passed over the Ny-Ålesund downtown and local port during NPF events. Also, the concentration of black carbon (BC) at Zeppelin, typically emitted from primary combustion sources, was used to examine the effect of primary combustion sources on the NPF. We found that the air mass and wind passed over the downtown including the local port during only two NPF events out of all NPF events (170 events). During these two NPF events, the BC concentration increased little. Thus, we believe the effect of anthropogenic sources on the NPF should be small. Also, in our NPF data analysis we filtered out two NPF events with increased BC concentration and wind direction coming from the Ny-Ålesund downtown or port.
The highest percentage of NPF occurrence for all types was observed in August (63 %) and June (61 %), followed by May (47 %) and July (42 %) as shown in Fig. 5. NPF was observed only occasionally in winter during the Arctic night from November to February, consistent with previous observations (Ström et al., 2009; Heintzenberg et al., 2017). Although NPF occurrence could be expected to be lowest in April due to the highest CS (Fig. 2), that was not the case. Our results showed that NPF occurrence increased significantly in April, was maintained at a high level from May to August, and then decreased in September and October. The average values of CS during NPF event and non-event days were 0.57 and 0.69 s−1, respectively. The higher biological and photochemical activity, lower transport of pollutants from midlatitudes, and increased wet scavenging of particles (low CS) in summer likely favored NPF (Ström et al., 2009). In addition, the melting of sea ice in summer can increase the availability of marine biogenic sources, promoting NPF (Quinn et al., 2008; Tovar-Sánchez et al., 2010; Dall'Osto et al., 2018). Overall, NPF occurrence is mainly affected by the availability of solar radiation (photochemistry) and gaseous precursors in addition to the survival probability of clusters or particles (Kulmala et al., 2017). In addition, it was suggested that fragmentation of primary marine polymer gels, which are derived from phytoplankton along the marginal ice zone, could be a source for atmospheric nanoparticles (NPF events below 10 nm) in the high Arctic boundary layer (Heintzenberg et al., 2017; Karl et al., 2019; Mashayekhy Rad et al., 2019).
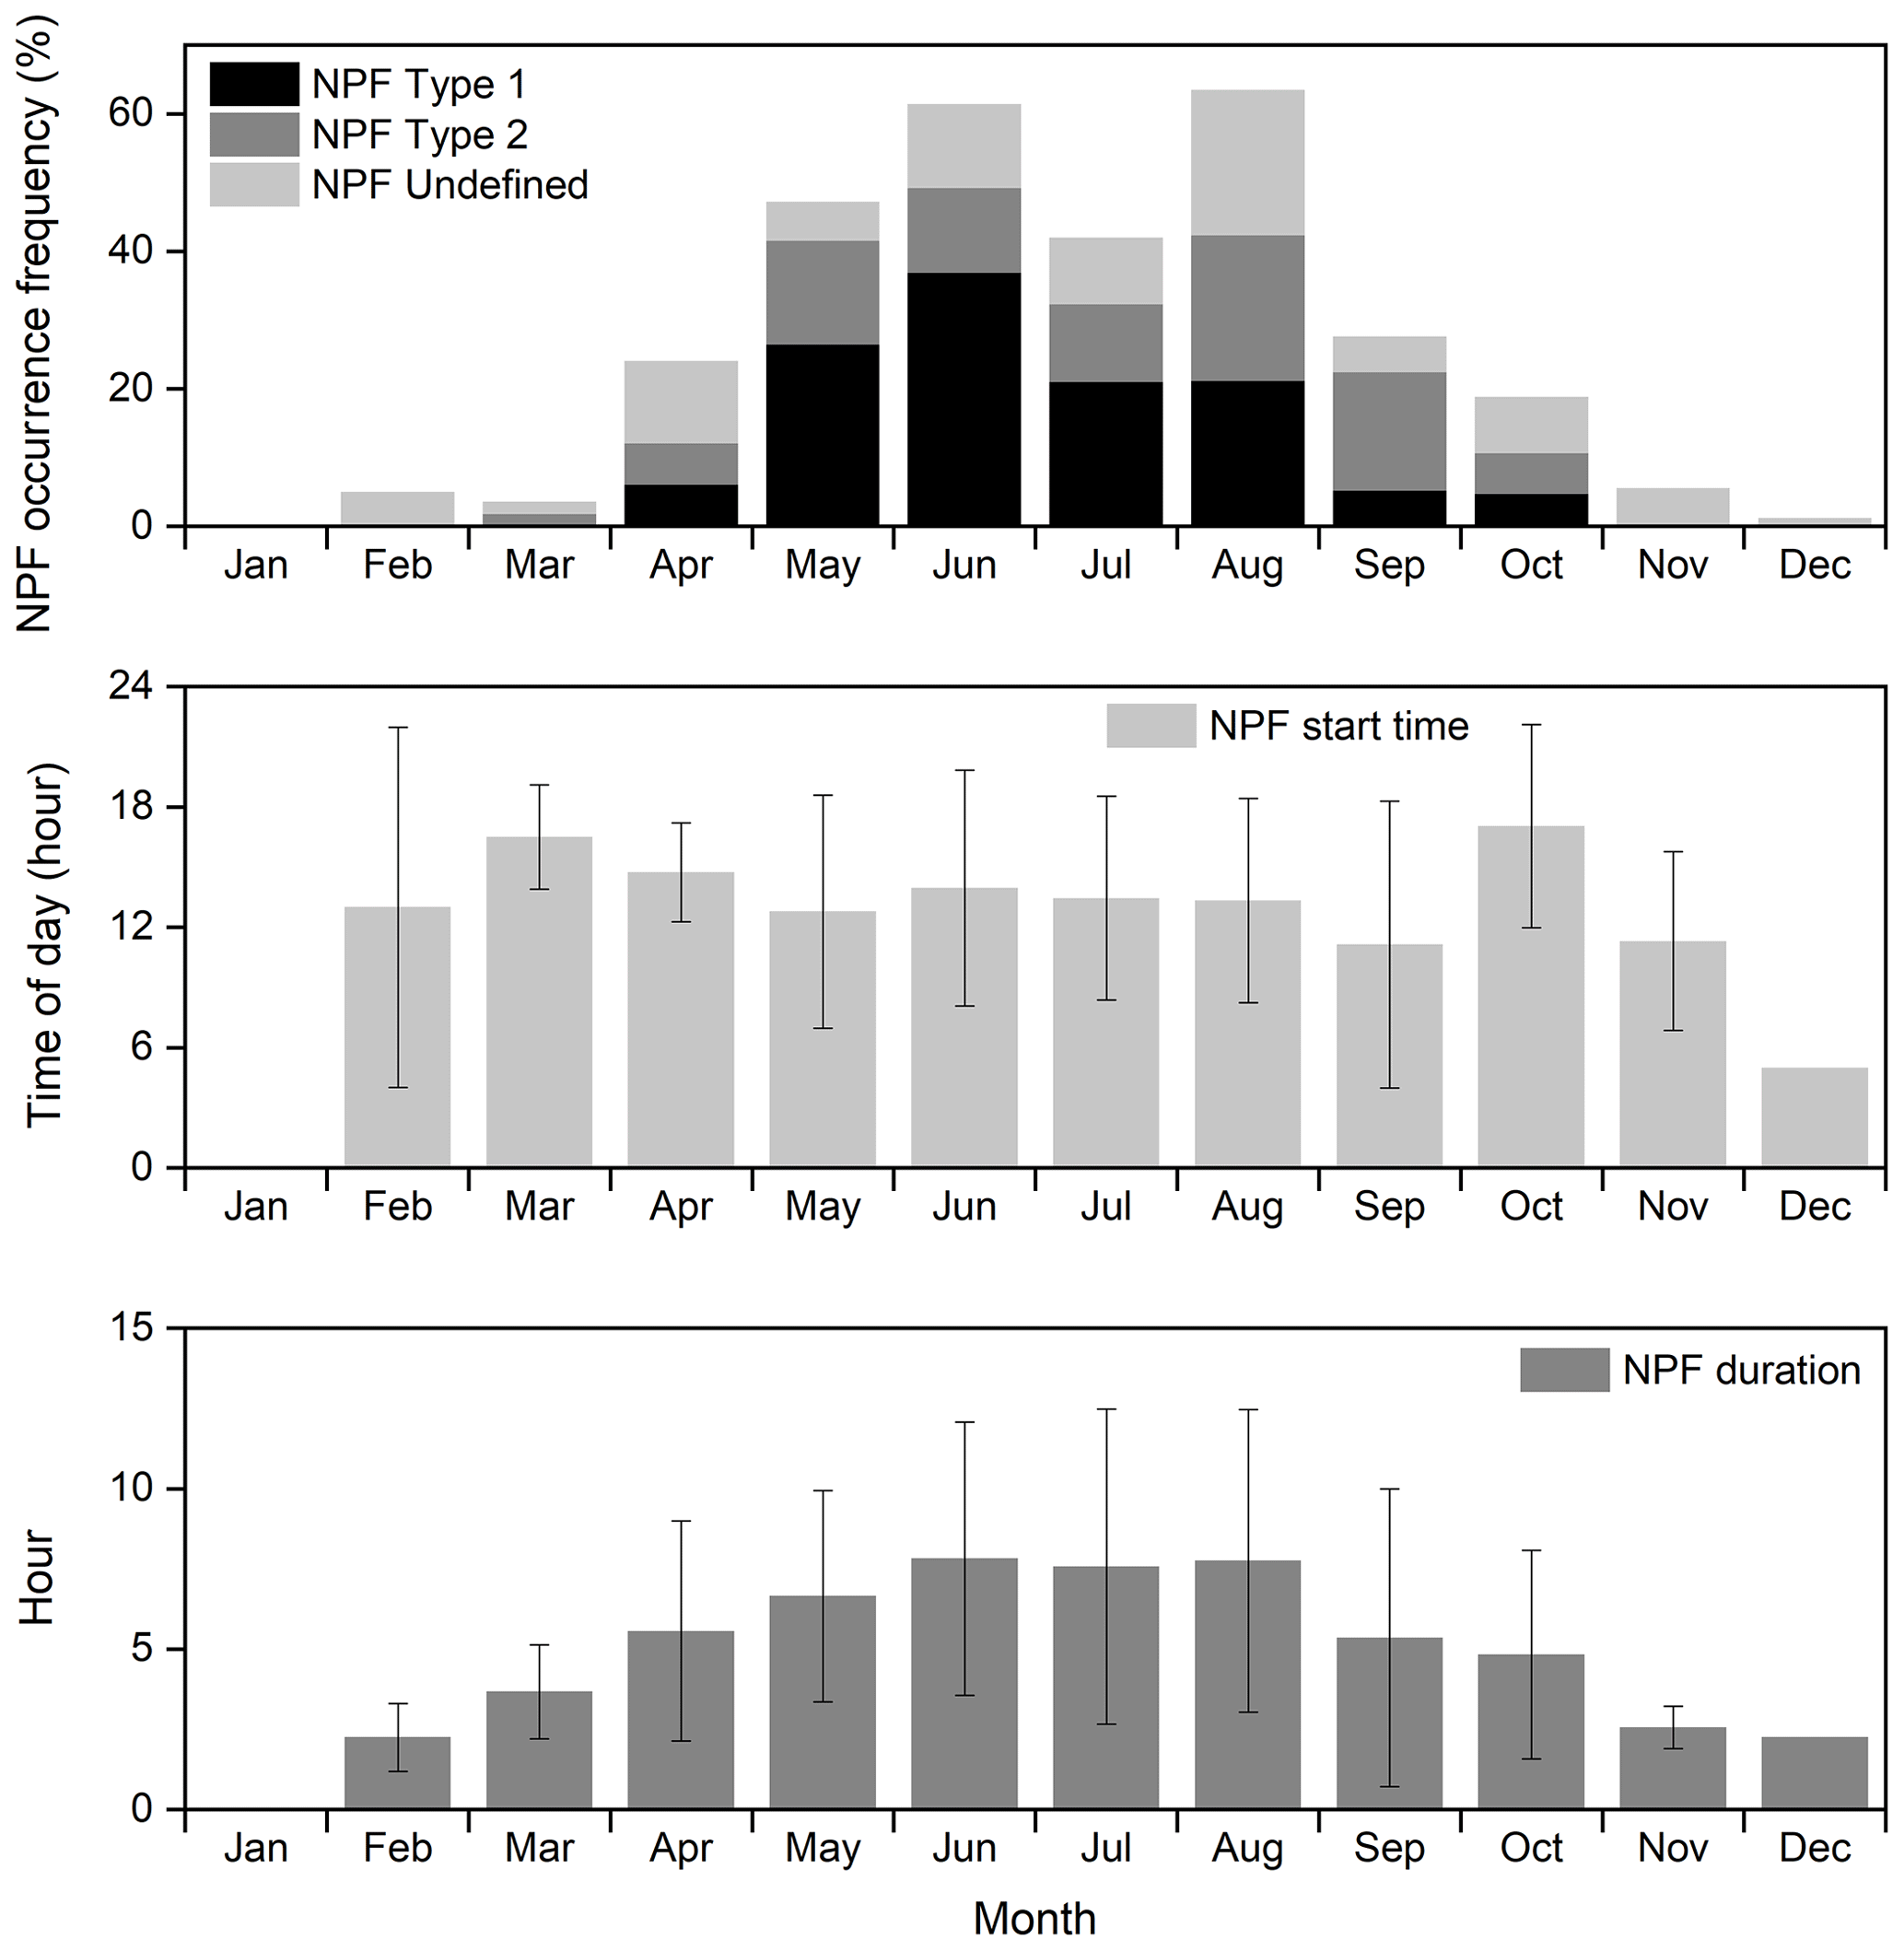
Figure 5Monthly variations in NPF occurrence, start time (local time), and duration; the error bar represents standard deviation.
A so-called “weak NPF” event, in which initial formation and growth were completed to < 10 nm without further growth, was observed. The weak NPF events documented here could not be detected in previous studies where the minimum detectable size was ∼ 10 nm. The fraction of weak NPF occurrences (out of all NPF occurrences each month) was highest in April (58 %) and October (50 %), compared to values in May (20 %), June (14 %), July (8 %), August (15 %), and September (25 %). In April, this was likely caused by the combination of strong solar radiation (i.e., strong photochemistry for production of condensing vapors responsible for particle growth) and high CS; in contrast, October's combination of the low solar radiation (i.e., weak photochemistry) and low CS led to a similar result.
NPF lasted for several hours with similar start times (Fig. 5). NPF duration was around 6–7 h on average and was longest in summer. Typically, NPF started between 13:00 and 14:00 (local time), suggesting that photochemical activity with strong solar radiation played an important role in NPF initiation. The variations in start time from month to month (March to November) were smaller than the monthly variations in NPF occurrence or duration. The nighttime NPF also occurred in late fall to winter (20 % out of total NPF events). The exact mechanism for this NPF was unclear. Nanoparticles formed at earlier times (daytime) in other places may be transported to the site during nighttime (Vehkamäki et al., 2004; Park et al., 2020).
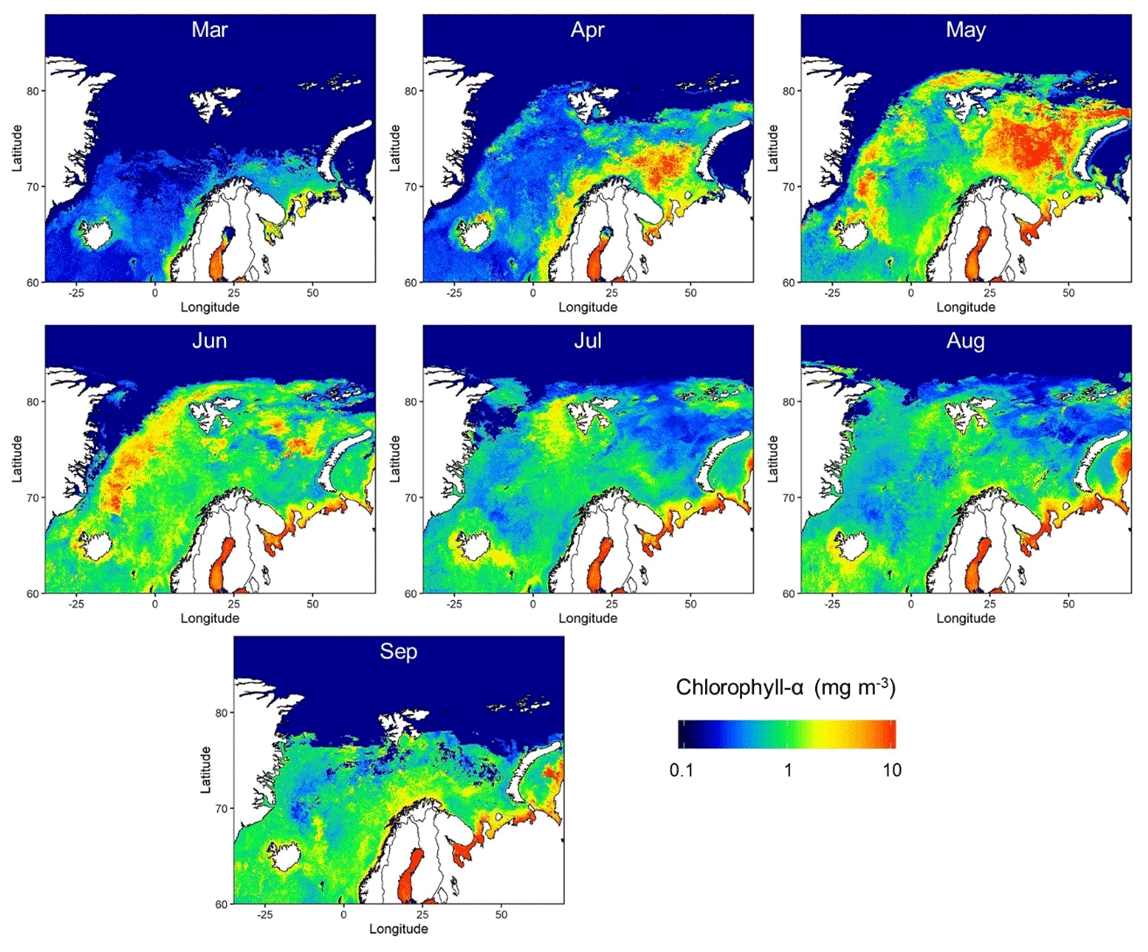
Figure 6MODIS-derived monthly chlorophyll a concentration during the measurement period at 4 km resolution.
Figure 6 shows the MODIS monthly chlorophyll a concentrations around Svalbard, which increased from April and decreased after August. The chlorophyll a concentration was intense in the ocean regions southwest and southeast of Svalbard. A recent study revealed that the DMS production capacity of the Greenland Sea (to the southwest) was 3 times greater than that of the Barents Sea (to the southeast) (Park et al., 2018); this is further discussed in the context of air mass trajectory data in a later section. Full monthly values of average chlorophyll a concentration over the area (70–85∘ N, 25∘ W–50∘ E) and “air mass exposure to chlorophyll a” (Echl), which explains the DMS mixing ratio of the air mass arriving at Zeppelin (Park et al., 2018), are summarized in Fig. S2 in the Supplement. The Echl provides the measure of potential DMS production capacity of the ocean air mass passed over (Park et al., 2018). It was found that “air mass exposure to chlorophyll a” (Echl) was correlated well (r = 0.69 and p value < 0.05; not shown) with the NPF occurrence frequency, compared to the average chlorophyll a concentration over the area (70–85∘ N, 25∘ W–50∘ E).
Table 1Summary of NPF frequency, J, and GR at various sampling sites, including the present study. NA means not available.
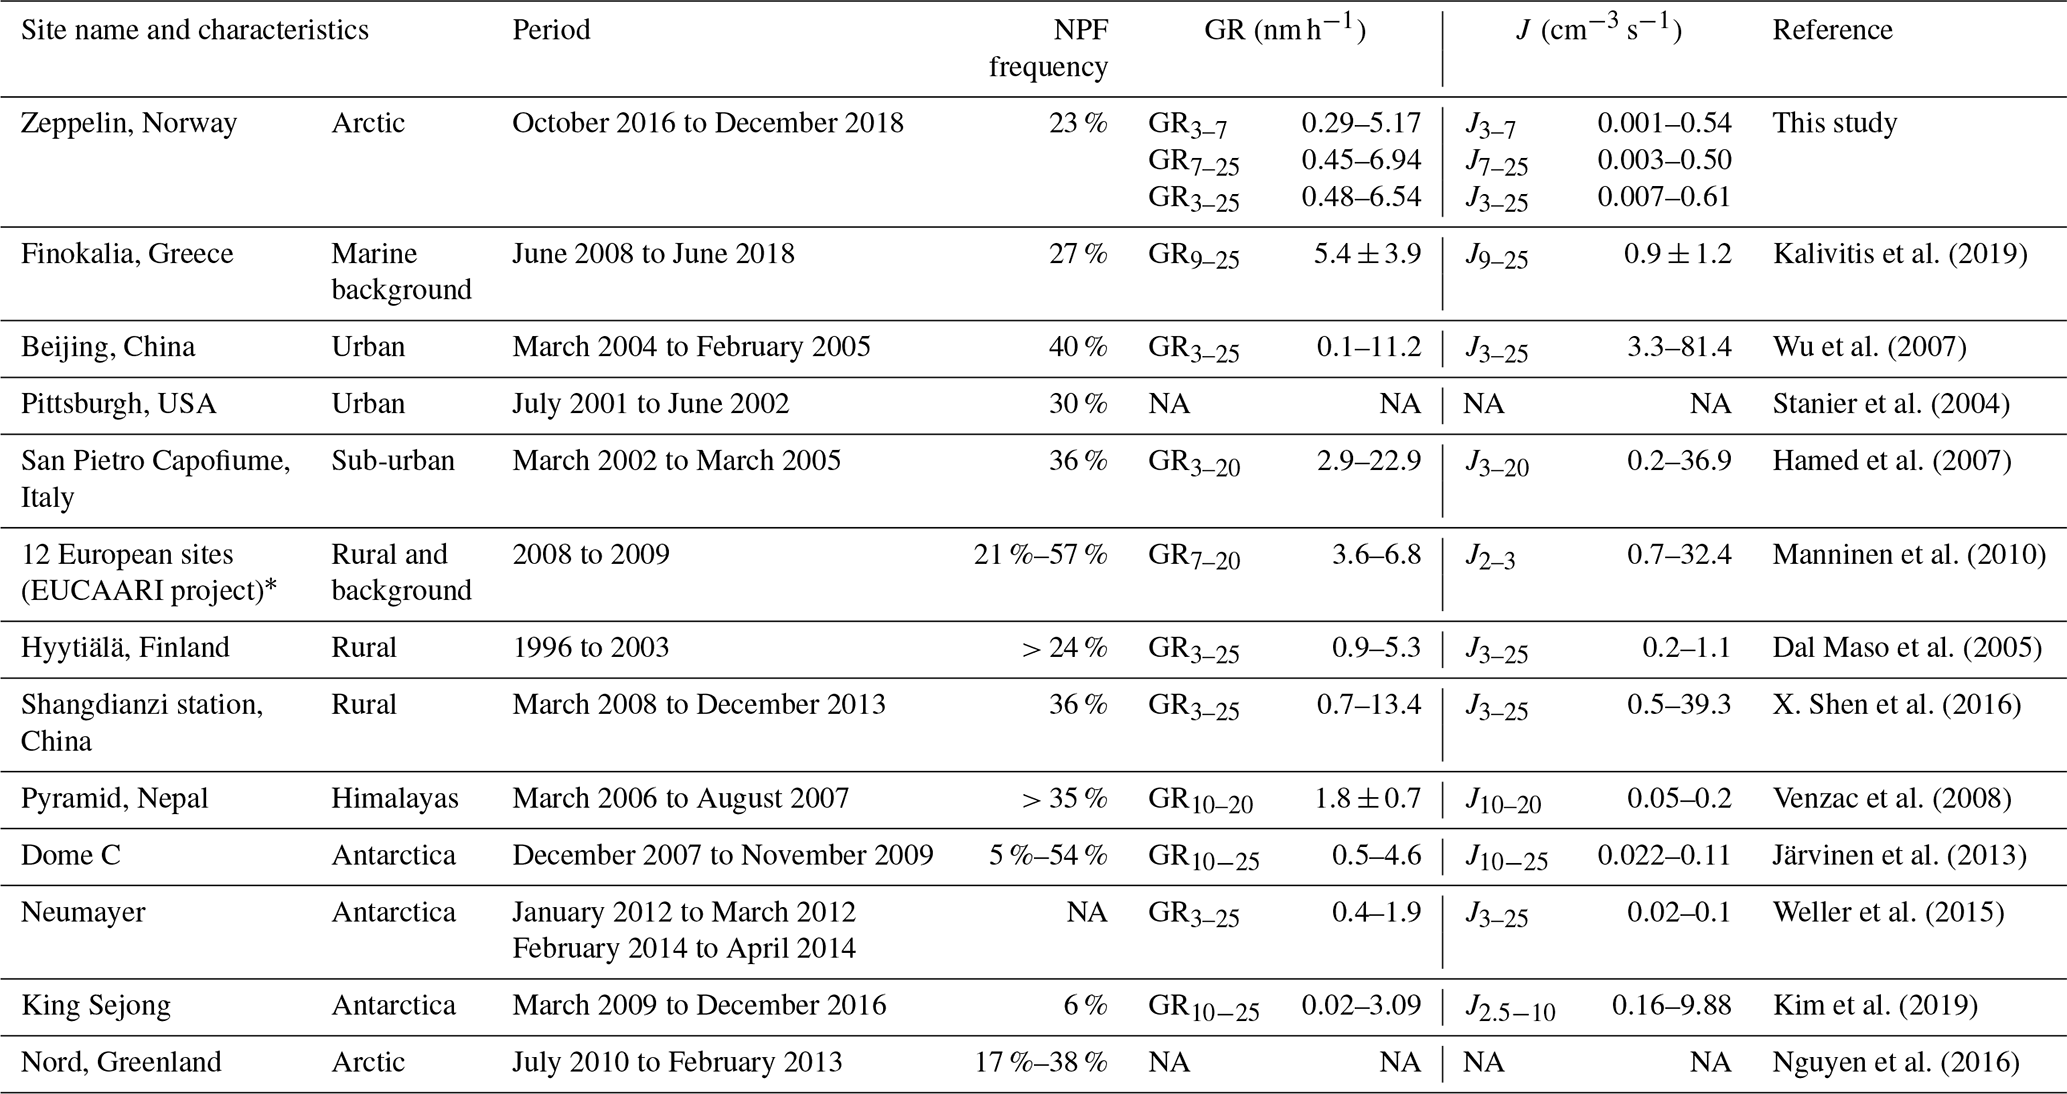
∗ Pallas and Hyytiälä (Finland), Vavihill (Sweden), Mace Head (Ireland), Cabauw (Netherlands), Melpitz and Hohenpeissenberg (Germany), K-Puszta (Hungary), Jungfraujoch (Switzerland), Puy de Dome (France), San Pietro Capofiume (Italy), and Finokalia (Greece).
To determine the characteristics of particle growth, we calculated the GR in the 3–7, 7–25, and 3–25 nm size ranges (i.e., GR3–7, GR7–25, and GR3–25) for NPF events (Fig. 7). The average GR3–25 for all months was 2.66 nm h−1, comparable to previously reported GR data (0.2–4.1 nm h−1) in the Arctic region (Kerminen et al., 2018). The highest monthly average GR3–25 was observed in July (3.03 nm h−1) and the maximum individual value (6.54 nm h−1) occurred in June. The averages of GR3–7 and GR7–25 were 2.07 and 2.85 nm h−1, respectively. However, the GR was much lower than the values observed in typical urban areas (Table 1), suggesting a lower availability of condensing vapors contributing to particle growth in the Arctic atmosphere. The formation rates of particles in the same size range as calculated GR were also derived. The averages of J3–7, J7–25, and J3–25 during NPF events were 0.04, 0.09 and 0.12 cm−3 s−1, respectively. The highest monthly average and maximum for J3–7 were both found in June but for J7–25 and J3–25 were found in July. The formation rates (relative standard deviation (RSD) = 39 %–44 %) varied by month more significantly than for GR (RSD = 27 %–33 %). The formation rates in this study were much lower than those reported in continental areas (Stanier et al., 2004; Hamed et al., 2007; Wu et al., 2007; Manninen et al., 2010; Xiao et al., 2015; L. Shen et al., 2016; Cai et al., 2017). A good linear relationship was found between J3–7 and N3–7 (r = 0.97 and p value < 0.001) as shown in Fig. S3 in the Supplement, indicating that 3–7 nm particles were produced by gas-to-particle conversion rather than direct emissions in the particle phase (i.e., not primary) (Kalivitis et al., 2019). No significant correlation was found between J3–7 and GR3–7, suggesting that the vapors participating in the early stage of NPF could be at least partly different from the vapors contributing to subsequent particle growth (Nieminen et al., 2014). However, detailed chemical data for nanoparticles during formation and growth should be obtained to achieve complete understanding of the participating chemical species. Our data indicate that, although NPF occurrence frequency in the Arctic was comparable to continental areas, the J and GR were much lower. Time series of daily GR and J in different modes (GR3–7 and J3–7 and GR7–25 and J7–25), weekly N3–7 and N7–25, and weekly NH3 and H2SO4 are shown in Fig. S4 in the Supplement.
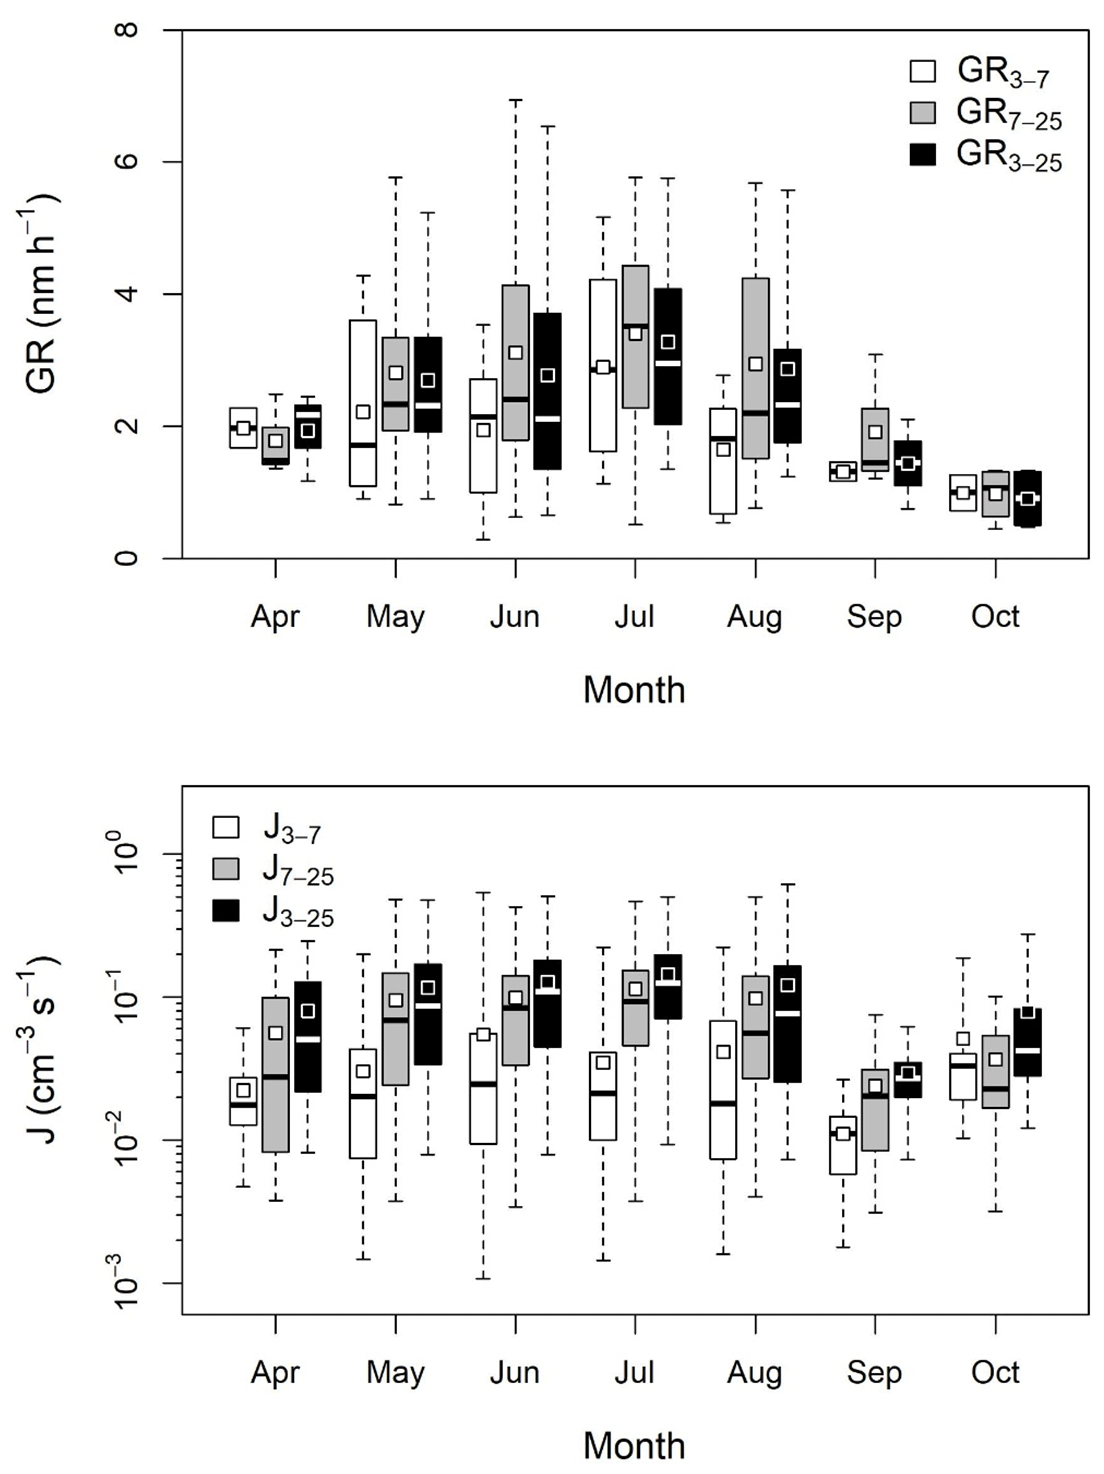
Figure 7Monthly variations in GR3–7, GR7–25, GR3–25, J3–7, J7–25, and J3–25 for NPF in the Arctic. Boxes and whiskers represent the 25th–75th percentiles and minimum–maximum, respectively; squares indicate means and horizontal lines within boxes indicate medians.
The existence of significant amounts of nanoparticles as small as 3 nm during NPF events at the study site suggests that NPF occurred there, rather than the particles being transported from other regions after growth. In other words, if NPF occurred at other locations far from the study site, the nanoparticles would have grown during transport to the site and few 3 nm particles would have been detected there. The lifetime of the 3 nm particles in this study (growth to particles larger than 7 nm) was estimated to be 2–3 h on average. It was reported that nanoparticles (< 5 nm) in the troposphere could survive for several hours or less (Anastasio and Martin, 2001).
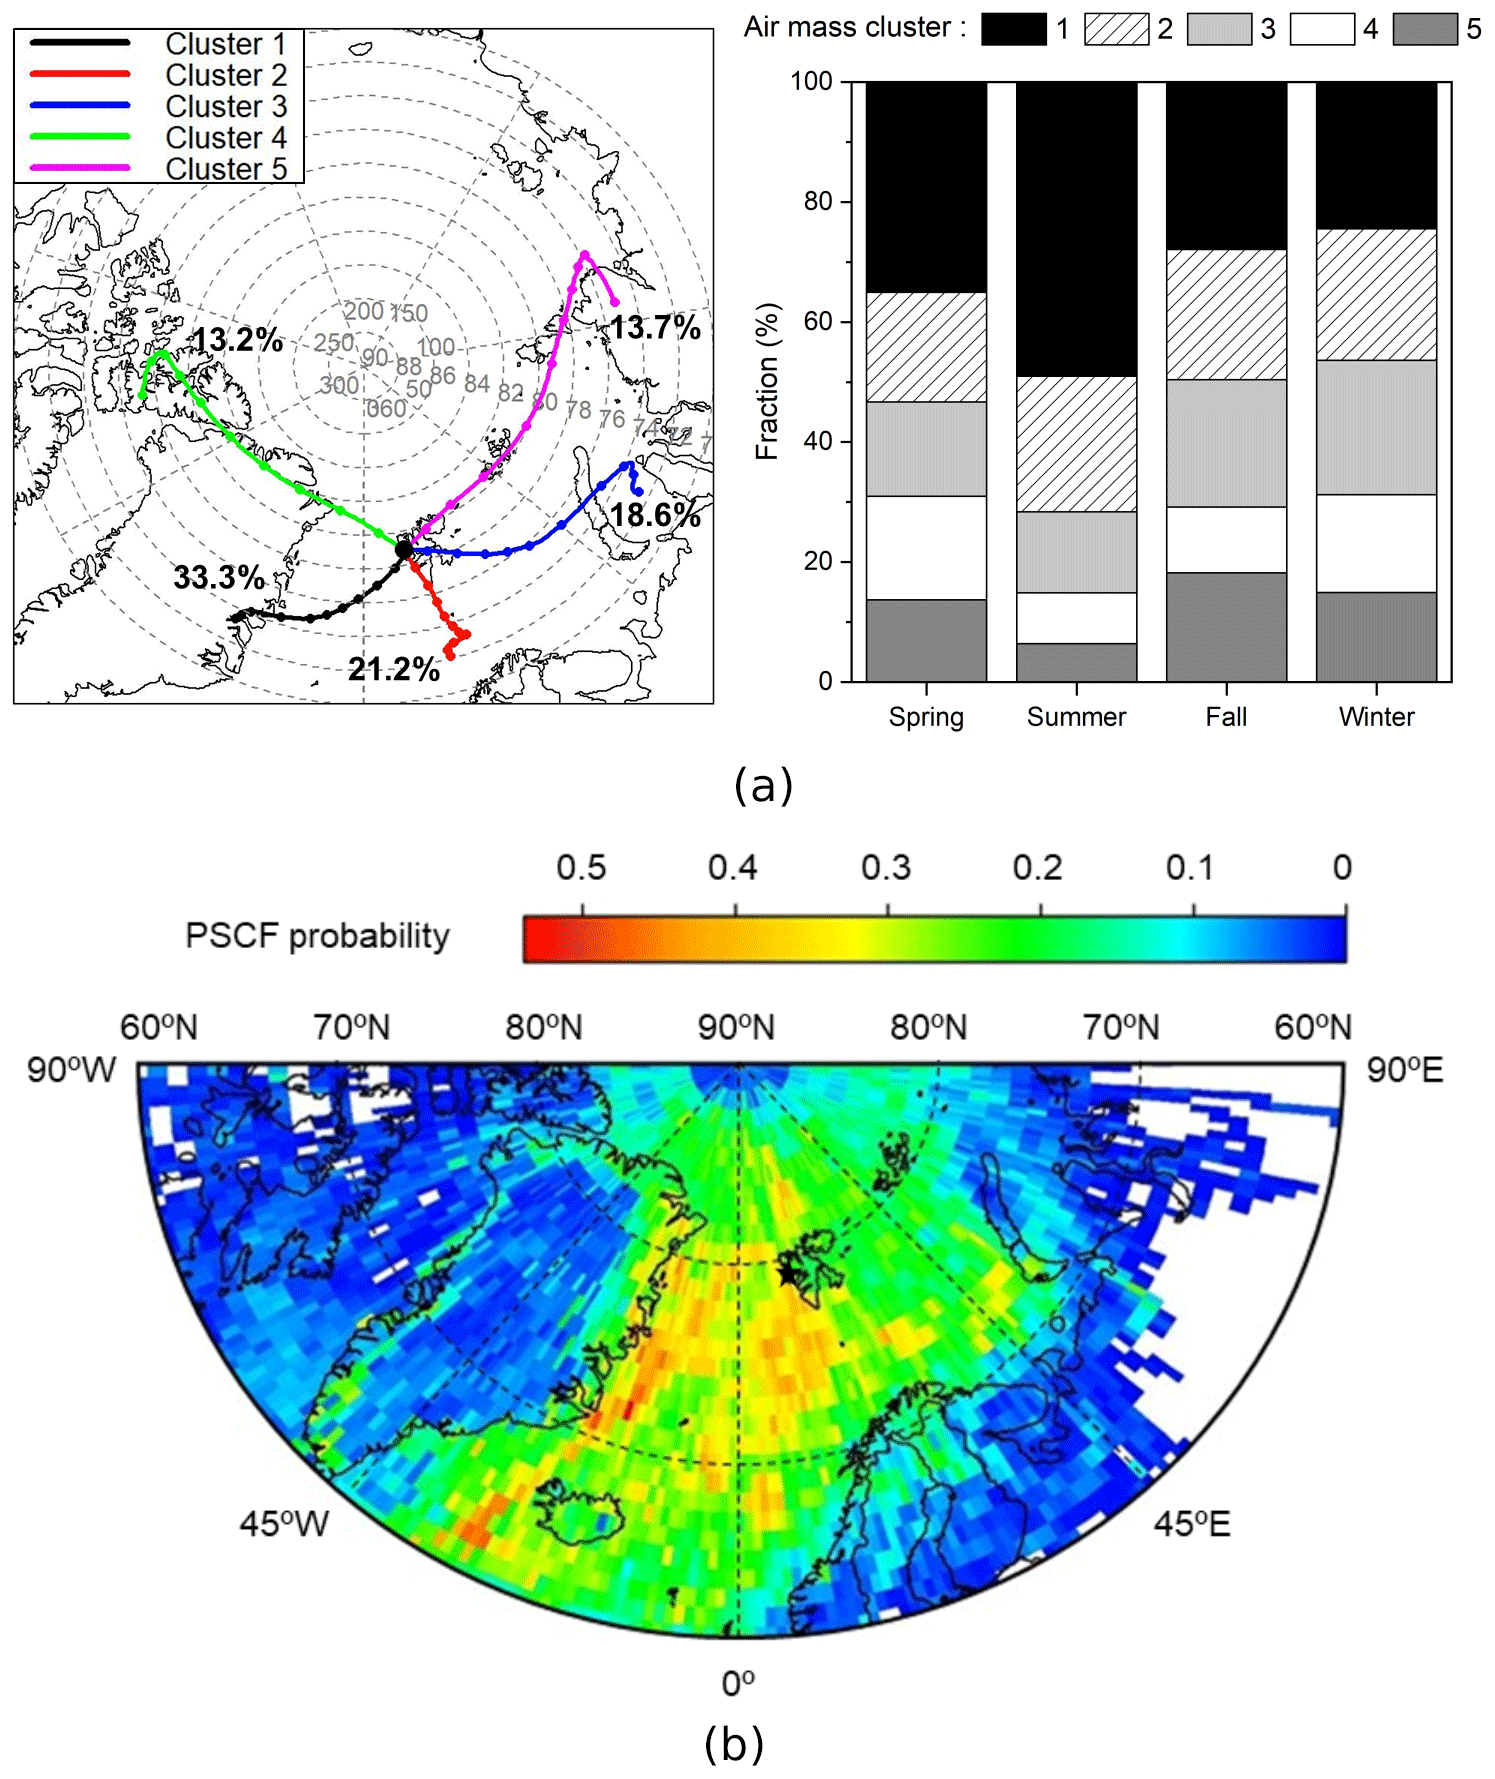
Figure 8(a) Five major clusters for air mass back trajectories during the measurement period and the fraction of each cluster by seasons. (b) PSCF back-trajectory analysis for air mass origins affecting NPF at the 75th percentile of N3–25.
Five air mass clusters were found (Fig. 8a), representing the contributions of different air masses in different seasons: clusters 1, 2, 3, 4, and 5 represented southwest (slow), south (slow), southeast (fast), northwest (fast), and northeast (fast) air masses, respectively. The air mass speed (travel distance divided by time) was used to determine whether the air mass was slower or faster compared to the average air mass speed during the measurement period. Cluster 1 dominated in summer, when NPF occurrence was highest; it had the lowest air mass speed, the lowest fraction of land influence (15 %), and the highest fraction of time spent over the sea (50 %) compared to other air mass clusters. Time spent over sea ice was 35 %. The CS values were 0.54 , 0.74 , 0.77 , 0.64 , and 0.80 s−1 for cluster 1, cluster 2, cluster 3, cluster 4, and cluster 5, respectively, suggesting that cluster 1 had the lowest CS. Our data suggest that a slowly moving air mass, which spent most of the time over the ocean and sea ice, is the most favorable for NPF.
We further explored the potential source regions of the air masses in relation to NPF using air mass backward trajectory data and the 75th percentile of N3–25 (Fig. 8b). Increases in the amount of nanoparticles (i.e., NPF events) occurred more frequently when the air mass passed over the oceanic regions to the southwest and south of Svalbard (overall, 49 % of the air mass during NPF was southwest, i.e., cluster 1). As shown earlier (Fig. 6), the chlorophyll a concentration was strong in the southwest and southeast ocean regions, and the DMS production capacity of the southwest ocean was 3 times greater than that of the southeast ocean. The DMS production capacity was defined as the potential amount of DMS produced from the phytoplankton biomass (Park et al., 2018). Several previous studies also support the strong DMS production capacity in the southwest ocean (Degerlund and Eilertsen, 2010; Galí and Simó, 2010). These results suggest that marine biogenic sources from the southwest ocean (Greenland Sea) region play an important role in NPF in the Arctic.
The DMS in the ocean is produced by complicated microbial food-web processes (Stefels et al., 2007). In general, sea surface DMS maximum occurs following local phytoplankton biomass maxima, thereby leading to lag periods on the order of several weeks to months (so-called DMS summer paradox) (Galí and Simó, 2015). This phenomenon could be explained by several key processes: a succession in phytoplankton composition, grazing by zooplankton on dimethylsulfoniopropionate-containing (DMSP-containing) phytoplankton and the bacterial degradation of DMSP into DMS (Polimene et al., 2012). However, a clear temporal correlation between atmospheric (and/or seawater) DMS level and phytoplankton biomass (i.e., chlorophyll a concentration) has been observed for the ocean domains where strong DMS producers (both containing high intra-cellular DMSP content and DMSP cleavage enzyme) such as haptophytes and dinoflagellates predominate (e.g., Arnold et al., 2010; Park et al., 2013, 2018; Uhlig et al., 2019; Zhang et al., 2020). Only a limited number of phytoplankton classes including dinoflagellates and haptophytes possess the enzyme that can convert DMSP into DMS during their growth (Alcolombri et al., 2015). In particular, Emiliania huxleyi and Phaeocystis sp., which are highly abundant haptophytes in high-latitude oceans, play key roles in controlling global DMS emission because the DMS production capacity of these species is much higher than other globally abundant phytoplankton species (Liss et al., 1994; McParland and Levine, 2019). For example, multi-year measurements of atmospheric DMS mixing ratios at Zeppelin station showed a strong correlation between sea surface chlorophyll a concentration (estimated by MODIS Aqua) and atmospheric DMS levels (Park et al., 2013, 2018). Furthermore, relationships between the atmospheric DMS and phytoplankton biomass were regionally and temporally varied with the relative abundance of strong DMS(P) producers (Park et al., 2018). This is because the oceanic DMS production in the vicinity of the observation site (i.e., Greenland and Barents seas) was largely governed by direct DMS exudation of phytoplankton that have both high cellular DMSP content and the DMSP-cleavage enzyme during the phytoplankton bloom period. A recent study conducted at a remote Antarctic site also revealed that the number concentration of nano-size particles (3–10 nm in diameter) was positively correlated with the chlorophyll a concentration during the period when strong DMS producers predominate (dominance of Phaeocystis > 50 %; estimated by PHYSAT algorithm) (Jang et al., 2019).
We then examined the chemical characteristics of particulate matter (PM) and daily concentration of gaseous NH3. The seasonal characteristics of ionic species (Na+, Mg2+, K+, NH, NO, SO, and Cl−) in PM during the measurement period (Table S1 in the Supplement) revealed that the contributions of primary sea salt particles (Na+, Mg2+, and Cl−) increased in winter with high wind speeds, while the contributions of NH, NO, and SO (secondary species) increased in spring and summer. The slope of the cation equivalents (Na+, Mg2+, K+, and NH) versus the anion equivalents (NO, SO, and Cl−) (= 0.98; not shown) suggested that the measured cations were mostly neutralized by the anions (Zhang et al., 2015). These ionic species can exist in large particles and do not necessarily represent the chemical composition of the nanoparticles, but they can provide information about the overall chemical properties of the particles in different seasons. The non-sea-salt sulfate (nss-SO) could have had a secondary origin from the DMS from the sea (Park et al., 2017; Kecorius et al., 2019). The SO could also come from sea salt particles (primary production of SO) (Karl et al., 2019). Thus, the concentration of nss-SO was derived from nss-SO (µg m−3) = total SO (µg m−3) – 0.252 × Na+ (µg m−3) by using the measured SO and Na+ concentrations (Zhan et al., 2017). The nss-SO ratio (nss-SO ∕ total SO) was significantly higher on NPF event days than on non-event days (p value < 0.01; Fig. 9). The NH3 concentration was higher on NPF event days than on non-event days as shown in Fig. 9 (p value < 0.001), similar to results shown in Dall'Osto et al. (2017), although daily NH3 concentration was not significantly correlated with the N3–25 as shown in Fig. S5 in the Supplement. The NH3 in the Arctic can originate from biological and animal sources (e.g., seabird colonies) (Tovar-Sánchez et al., 2010; Croft et al., 2016; Dall'Osto et al., 2017). The SO2 was not significantly higher on NPF event days than on non-event days (Fig. 9) and not significantly correlated with the N3–25 (Fig. S5 in the Supplement). On the other hand, the H2SO4 was found to be higher on the NPF event days (Fig. 9) and was correlated with the N3–25 (Fig. S5 in the Supplement), suggesting that the H2SO4 should play an important role in nucleation and growth. Our data were limited to fully explain the nucleation mechanism. Further studies should be required to elucidate the nucleation mechanism by directly measuring chemical composition of nanoparticles and various precursor vapors.
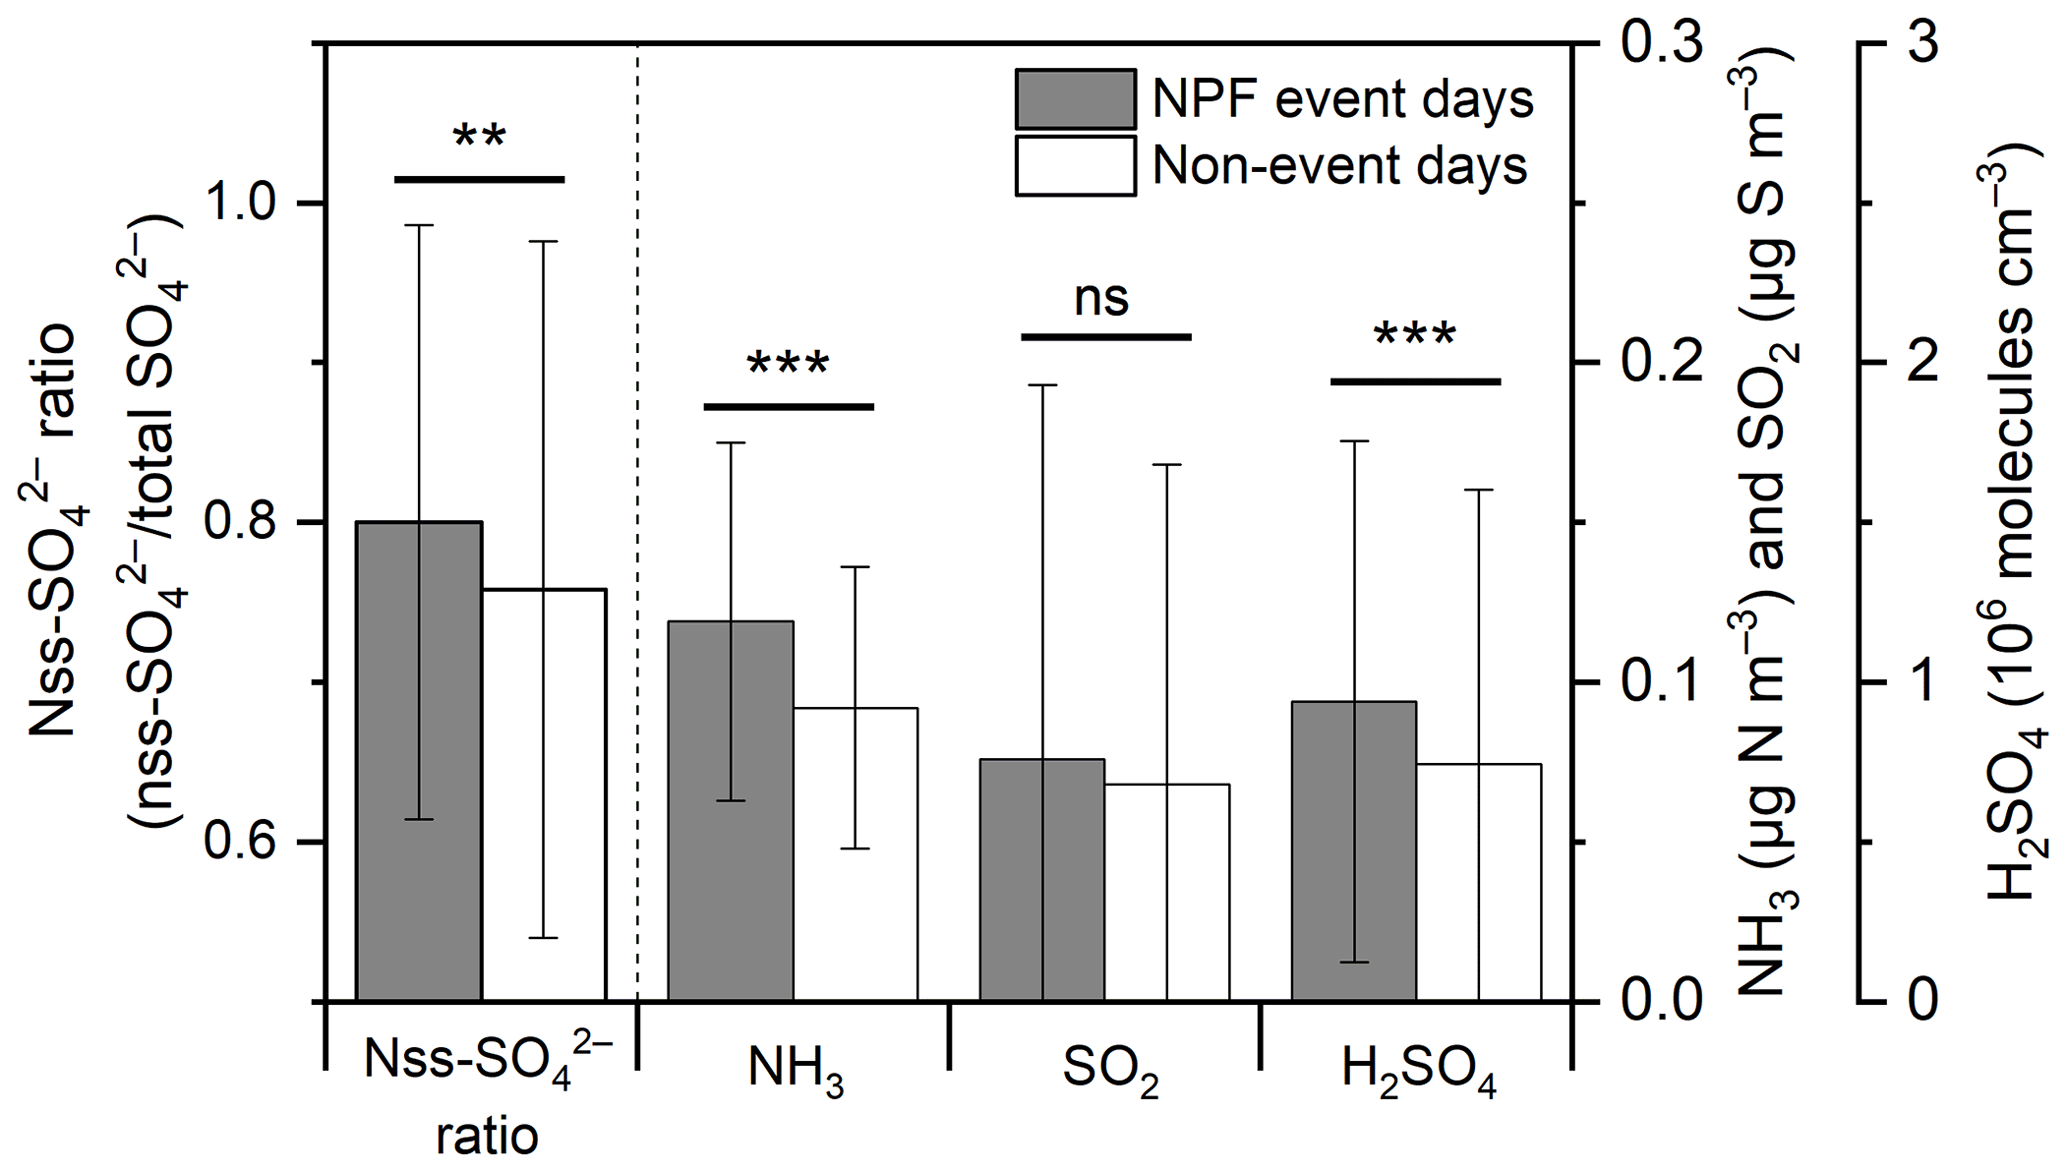
Figure 9Comparison of average nss-SO ratio (nss-SO ∕ total SO), NH3, SO2, and H2SO4 concentrations between NPF events and non-event days: error bar and stars represent the standard deviation and p values of a t test (ns: > 0.05, ∗: ≤ 0.05, : ≤ 0.01, : ≤ 0.001), respectively.
The NPF event probability distribution with daily CS and temperature was included in Fig. S6 in the Supplement. The NPF event probability was calculated by the ratio of the NPF event days per total days for the given CS and temperature. The NPF event probability increased at moderate temperatures when the CS was low, while when the CS was high, the probability increased at relatively high temperatures as shown in Fig. S6 in the Supplement.
We calculated the NPF criterion (LΓ) values for NPF event and non-event days (Fig. 10). The 7 non-event days when GR could be obtained from pre-existing aerosols were selected for the calculation of the LΓ (Kuang et al., 2010). The NPF duration time was determined using the proposed method (Kulmala et al., 2012), with the time range of non-event days set as daytime (06:00–18:00 LT). When NPF occurred, the LΓ ranged from 0.003 to 0.27 with a mean and median of 0.044 and 0.041, respectively; all values were less than 1. The LΓ values of non-event days ranged from 0.34 to 2.59 with a mean and a median of 1.49 and 1.61, respectively; 5 d were larger than 1. These observations were consistent with previous studies of NPF events in clean or moderately polluted areas (Tecámac, Atlanta, Boulder, and Hyytiälä), ranging from 0.0075 to 0.66 (Kuang et al., 2010), and in a highly polluted area (Beijing), ranging from 0.22 to 1.75 (Cai et al., 2017). Our data suggest that LΓ can also be useful for determining the occurrence of NPF in the Arctic, but not at 100 % certainty. Uncertainties in H2SO4 concentration inferred from daily SO2 data (as discussed in the experimental section) and other parameters such as the measured GR and averaging time for LΓ (i.e., NPF duration time) could contribute to unclear separation of NPF event and non-event days (Fig. 10).
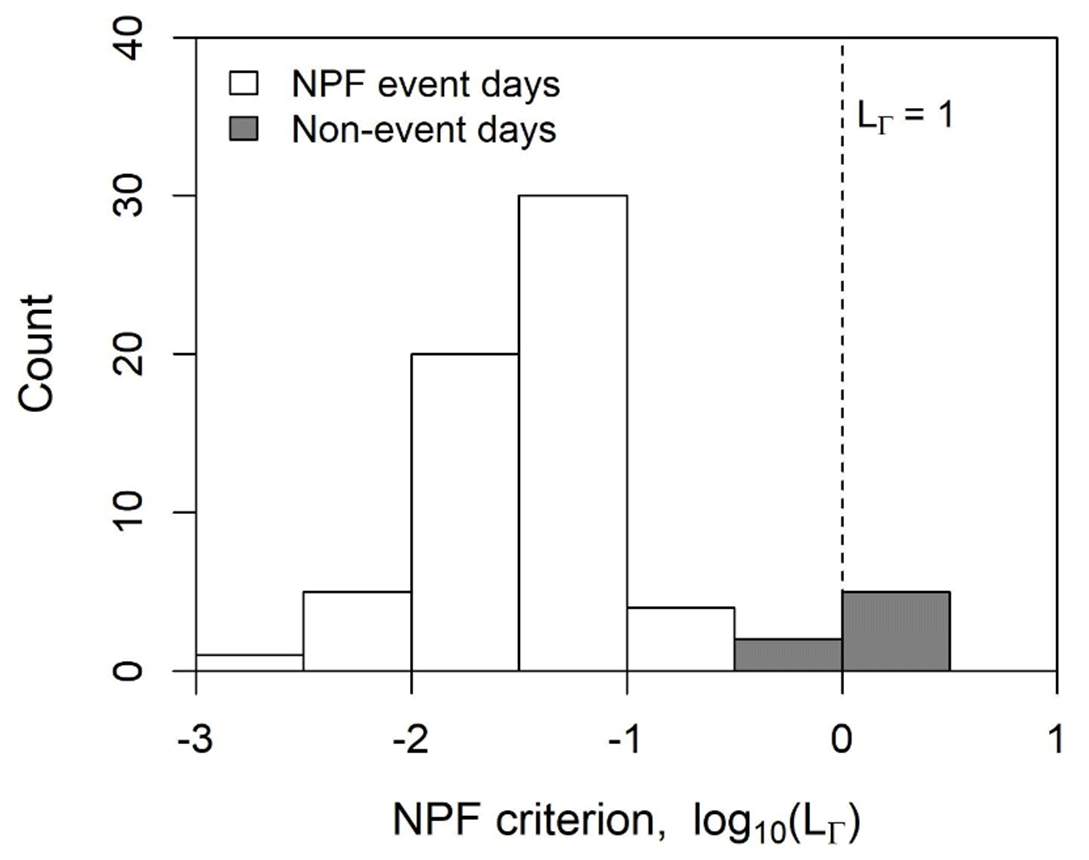
Figure 10Distribution of NPF criterion (LΓ) values for NPF event days (white) and non-event days (grey) in the Arctic.
We examined the characteristics of Arctic NPF at the Mount Zeppelin site by conducting continuous measurements of nanoparticles down to 3 nm in size from October 2016 to December 2018. The size distributions of 3–60 nm particles were classified into distinct clusters with strong seasonal variability and mode diameters of 10 nm (cluster 1), 20 nm (cluster 2), 30 nm (cluster 3), and 50 nm (cluster 4). A significant number of nanoparticles as small as 3 nm often appeared during NPF, particularly in summer, suggesting that there is a good chance that these were produced near the site rather than being transported from other regions after growth. The average NPF occurrence frequency per year was 23 %. J3–7 averaged 0.04 cm−3 s−1, ranging from 0.001 to 0.54 cm−3 s−1, and GR3–7 averaged 2.07 nm h−1, ranging from 0.29 to 5.17 nm h−1. These data suggest that the NPF occurrence frequency in the Arctic is comparable to that in continental areas, although the J and GR were lower in the Arctic. We next identified five major air mass clusters using backward-trajectory analysis; PSCF results indicated that air masses from the south and southwest ocean regions were related to the elevated concentrations of nanoparticles at the site. This region was consistent with elevated chlorophyll a and DMS production capacity, suggesting that marine biogenic sources should play an important role in Arctic NPF. The concentrations of NH3 and H2SO4 were higher on NPF event days than on non-event days. Previously developed NPF criteria (a low ratio of loss rate to growth rate of clusters favors NPF) were applicable to Arctic NPF occurrence.
The nano-SMPS data (3–60 nm) in 2016 to 2018 are available on the Korea Polar Data Center (KPDC) web site (https://doi.org/10.22663/KOPRI-KPDC-00001127.2, Lee et al., 2020a; https://doi.org/10.22663/KOPRI-KPDC-00001125.3, Lee et al., 2020b; https://doi.org/10.22663/KOPRI-KPDC-00001126.4, Lee et al., 2020c), and the raw data can be distributed upon request to the corresponding author (kpark@gist.ac.kr). The DMPS (5–810 and 10–790 nm) data are available from the Stockholm University and Norwegian Institute for Air Research (NILU) and also via the EBAS database (http://ebas.nilu.no, EBAS, 2020). The meteorological data for solar radiation (SRAD) were provided by the Alfred Wegener Institute (Maturilli, 2019).
The supplement related to this article is available online at: https://doi.org/10.5194/acp-20-13425-2020-supplement.
HL and KL applied the statistical methodology and generated results. HL, CRL, RK, WA, and KTP analyzed the results. HL, KL, CRL, WA, RK, JP, and KTP participated in the field measurements and collected the data. KP, YJY, and BYL designed the study. HL and KP prepared the manuscript with contributions from all co-authors.
The authors declare that they have no conflict of interest.
This research was supported by a National Research Foundation of Korea grant from the Korean Government (Ministry of Science and ICT) (NRF-2016M1A5A1901779) (KOPRI-PN20081) (Title: Circum Arctic Permafrost Environment Change Monitoring, Future Prediction and Development Techniques of Useful Biomaterials, CAPEC project), and a National Leading Research Laboratory program (NRF-2019R1A2C3007202). Samsung Advanced Institute of Technology (SAIT) is acknowledged for supporting data analysis. We also would like to thank research engineers Tabea Henning, Ondrej Tesar, and Birgitta Noone from ACES and the staff from the Norwegian Polar Institute (NPI) for their on-site support. NPI is also acknowledged for substantial long-term support in maintaining the measurements at Zeppelin Observatory. We also would like to acknowledge the support by the Samsung Advanced Institute of Technology (SAIT), the long-term support of the Swedish EPA's (Naturvårdsverket) Environmental Monitoring Program (Miljöövervakning), the Knut and Alice Wallenberg Foundation within the ACAS project (Arctic Climate Across Scales, project no. 2016.0024), and FORMAS (project no. 2016-01427).
This research has been supported by National Research Foundation of Korea grants from the Korean Government (grant nos. NRF-2016M1A5A1901779 and NRF-2019R1A2C3007202), the Knut and Alice Wallenberg Foundation within the ACAS project (Arctic Climate Across Scales, project no. 2016.0024), and FORMAS (project no. 2016-01427).
This paper was edited by Veli-Matti Kerminen and reviewed by three anonymous referees.
Aas, W., Fiebig, M., Solberg, S., and Yttri, K. E.: Monitoring of long-range transported air pollutants in Norway, Annual report 2018, NILU rapport, Norwegian Institute for Air Research (NILU), Kjeller, Norway, 2019.
Alcolombri, U., Ben-Dor, S., Feldmesser, E., Levin, Y., Tawfik, D. S., and Vardi, A.: Identification of the algal dimethyl sulfide-releasing enzyme: a missing link in the marine sulfur cycle, Science, 348, 1466–1469, https://doi.org/10.1126/science.aab1586, 2015.
Anastasio, C. and Martin, S. T.: Atmospheric Nanoparticles, Rev. Mineral. Geochem., 44, 293–349, https://doi.org/10.2138/rmg.2001.44.08, 2001.
Arnold, S. R., Spracklen, D. V., Gebhardt, S., Custer, T., Williams, J., Peeken, I., and Alvain, S.: Relationships between atmospheric organic compounds and air-mass exposure to marine biology, Environ. Chem., 7, 232–241, https://doi.org/10.1071/EN09144, 2010
Asmi, E., Kivekäs, N., Kerminen, V.-M., Komppula, M., Hyvärinen, A.-P., Hatakka, J., Viisanen, Y., and Lihavainen, H.: Secondary new particle formation in Northern Finland Pallas site between the years 2000 and 2010, Atmos. Chem. Phys., 11, 12959–12972, https://doi.org/10.5194/acp-11-12959-2011, 2011.
Asmi, E., Kondratyev, V., Brus, D., Laurila, T., Lihavainen, H., Backman, J., Vakkari, V., Aurela, M., Hatakka, J., Viisanen, Y., Uttal, T., Ivakhov, V., and Makshtas, A.: Aerosol size distribution seasonal characteristics measured in Tiksi, Russian Arctic, Atmos. Chem. Phys., 16, 1271–1287, https://doi.org/10.5194/acp-16-1271-2016, 2016.
Beddows, D. C., Dall'Osto, M., and Harrison, R. M.: Cluster analysis of rural, urban, and curbside atmospheric particle size data, Environ. Sci. Technol., 43, 4694–4700, https://doi.org/10.1021/es803121t, 2009.
Beine, H., Argentini, S., Maurizi, A., Mastrantonio, G., and Viola, A.: The local wind field at Ny-Ålesund and the Zeppelin mountain at Svalbard, Meteorol. Atmos. Phys., 78, 107–113, https://doi.org/10.1007/s007030170009, 2001.
Cai, R., Yang, D., Fu, Y., Wang, X., Li, X., Ma, Y., Hao, J., Zheng, J., and Jiang, J.: Aerosol surface area concentration: a governing factor in new particle formation in Beijing, Atmos. Chem. Phys., 17, 12327–12340, https://doi.org/10.5194/acp-17-12327-2017, 2017.
Covert, D. S., Wiedensohler, A., Aalto, P., Heintzenberg, J., Mcmurry, P. H., and Leck, C.: Aerosol number size distributions from 3 to 500 nm diameter in the arctic marine boundary layer during summer and autumn, Tellus B, 48, 197–212, https://doi.org/10.3402/tellusb.v48i2.15886, 1996.
Croft, B., Martin, R. V., Leaitch, W. R., Tunved, P., Breider, T. J., D'Andrea, S. D., and Pierce, J. R.: Processes controlling the annual cycle of Arctic aerosol number and size distributions, Atmos. Chem. Phys., 16, 3665–3682, https://doi.org/10.5194/acp-16-3665-2016, 2016.
Dall'Osto, M., Beddows, D. C. S., Tunved, P., Krejci, R., Strom, J., Hansson, H. C., Yoon, Y. J., Park, K. T., Becagli, S., Udisti, R., Onasch, T., CD, O. D., Simo, R., and Harrison, R. M.: Arctic sea ice melt leads to atmospheric new particle formation, Sci. Rep., 7, 3318, https://doi.org/10.1038/s41598-017-03328-1, 2017.
Dall'Osto, M., Geels, C., Beddows, D. C. S., Boertmann, D., Lange, R., Nojgaard, J. K., Harrison, R. M., Simo, R., Skov, H., and Massling, A.: Regions of open water and melting sea ice drive new particle formation in North East Greenland, Sci. Rep., 8, 6109, https://doi.org/10.1038/s41598-018-24426-8, 2018.
Dal Maso, M., Kulmala, M., Riipinen, I., Wagner, R., Hussein, T., Aalto, P. P., and Lehtinen, K. E.: Formation and growth of fresh atmospheric aerosols: eight years of aerosol size distribution data from SMEAR II, Hyytiälä, Finland, Boreal Environ. Res., 10, 323–336, 2005.
Degerlund, H. and Eilertsen, H. C.: Main Species Characteristics of Phytoplankton Spring Blooms in NE Atlantic and Arctic Waters (68–80∘ N), Estuaries Coasts, 33, 242–269, https://doi.org/10.1007/s12237-009-9167-7, 2010.
EBAS: European Monitoring and Evaluation Programme, World Data Centre for Aerosols database, available at: http://ebas.nilu.no, last access: 2 November 2020.
Eckhardt, S., Hermansen, O., Grythe, H., Fiebig, M., Stebel, K., Cassiani, M., Baecklund, A., and Stohl, A.: The influence of cruise ship emissions on air pollution in Svalbard – a harbinger of a more polluted Arctic?, Atmos. Chem. Phys., 13, 8401–8409, https://doi.org/10.5194/acp-13-8401-2013, 2013.
EMEP: Manual for sampling and chemistry analysis, Norwegian Institute for Air Research, Kjeller, EMEP/CCC report 1/95, last updated: November 2014, available at: https://projects.nilu.no/ccc/manual/index.html (last access: 2 November 2020), 2014.
Fleming, Z. L., Monks, P. S., and Manning, A. J.: Untangling the influence of air-mass history in interpreting observed atmospheric composition, Atmos. Res., 104, 1–39, https://doi.org/10.1016/j.atmosres.2011.09.009, 2012.
Galí, M. and Simó R.: Occurrence and cycling of dimethylated sulfur compounds in the Arctic during summer receding of the ice edge, March. Chem., 122, 105–117, https://doi.org/10.1016/j.marchem.2010.07.003, 2010.
Galí, M. and Simó R.: A metaanalysis of oceanic DMS and DMSP cycling processes: Disentangling the summer paradox, Global Biogeochem. Cy., 29, 496–515, https://doi.org/10.1002/2014GB004940, 2015.
Galí, M., Devred, E., Babin, M., and Levasseur, M.: Decadal increase in Arctic dimethylsulfide emission, P. Natl. Acad. Sci. USA, 116, 19311–19317, https://doi.org/10.1073/pnas.1904378116, 2019.
Gao, J., Chai, F., Wang, T., and Wang, W.: Particle number size distribution and new particle formation (NPF) in Lanzhou, Western China, Particuology, 9, 611–618, https://doi.org/10.1016/j.partic.2011.06.008, 2011.
Giamarelou, M., Eleftheriadis, K., Nyeki, S., Tunved, P., Torseth, K., and Biskos, G.: Indirect evidence of the composition of nucleation mode atmospheric particles in the high Arctic, J. Geophys. Res.-Atmos., 121, 965–975, https://doi.org/10.1002/2015JD023646, 2016.
Gong, Y., Hu, M., Cheng, Y., Su, H., Yue, D., Liu, F., Wiedensohler, A., Wang, Z., Kalesse, H., Liu, S., Wu, Z., Xiao, Z., Mi, P., and Zhang, Y.: Competition of coagulation sink and source rate: New particle formation in the Pearl River Delta of China, Atmos. Environ., 44, 3278–3285, https://doi.org/10.1016/j.atmosenv.2010.05.049, 2010.
Hamed, A., Joutsensaari, J., Mikkonen, S., Sogacheva, L., Dal Maso, M., Kulmala, M., Cavalli, F., Fuzzi, S., Facchini, M. C., Decesari, S., Mircea, M., Lehtinen, K. E. J., and Laaksonen, A.: Nucleation and growth of new particles in Po Valley, Italy, Atmos. Chem. Phys., 7, 355–376, https://doi.org/10.5194/acp-7-355-2007, 2007.
Heintzenberg, J., Leck, C., and Tunved, P.: Potential source regions and processes of aerosol in the summer Arctic, Atmos. Chem. Phys., 15, 6487–6502, https://doi.org/10.5194/acp-15-6487-2015, 2015.
Heintzenberg, J., Tunved, P., Galí, M., and Leck, C.: New particle formation in the Svalbard region 2006–2015, Atmos. Chem. Phys., 17, 6153–6175, https://doi.org/10.5194/acp-17-6153-2017, 2017.
Hirdman, D., Burkhart, J. F., Sodemann, H., Eckhardt, S., Jefferson, A., Quinn, P. K., Sharma, S., Ström, J., and Stohl, A.: Long-term trends of black carbon and sulphate aerosol in the Arctic: changes in atmospheric transport and source region emissions, Atmos. Chem. Phys., 10, 9351–9368, https://doi.org/10.5194/acp-10-9351-2010, 2010.
Hussein, T., Dal Maso, M., Petaja, T., Koponen, I. K., Paatero, P., Aalto, P. P., Hameri, K., and Kulmala, M.: Evaluation of an automatic algorithm for fitting the particle number size distributions, Boreal Environ. Res., 10, 337–355, 2005.
IPCC: Climate Change 2014: Synthesis Report. Contribution of Working Groups I, II and III to the Fifth Assessment Report of the Intergovernmental Panel on Climate Change, edited by: Core Writing Team, Pachauri, R. K., and Meyer, L. A., IPCC, Geneva, Switzerland, 151 pp., 2014.
Iziomon, M., Lohmann, U., and Quinn, P.: Summertime pollution events in the Arctic and potential implications, J. Geophys. Res.-Atmos., 111, D12206, https://doi.org/10.1029/2005JD006223, 2006.
Jang, E., Park, K.-T., Yoon, Y. J., Kim, T.-W., Hong, S.-B., Becagli, S., Traversi, R., Kim, J., and Gim, Y.: New particle formation events observed at the King Sejong Station, Antarctic Peninsula – Part 2: Link with the oceanic biological activities, Atmos. Chem. Phys., 19, 7595–7608, https://doi.org/10.5194/acp-19-7595-2019, 2019.
Järvinen, E., Virkkula, A., Nieminen, T., Aalto, P. P., Asmi, E., Lanconelli, C., Busetto, M., Lupi, A., Schioppo, R., Vitale, V., Mazzola, M., Petäjä, T., Kerminen, V.-M., and Kulmala, M.: Seasonal cycle and modal structure of particle number size distribution at Dome C, Antarctica, Atmos. Chem. Phys., 13, 7473–7487, https://doi.org/10.5194/acp-13-7473-2013, 2013.
Jeffries, M. and Richter-Menge, J.: State of the climate in 2011: The Arctic, B. Am. Meteorol. Soc., 93, S127–S148, https://doi.org/10.1175/2012BAMSStateoftheClimate.1, 2012.
Kalivitis, N., Kerminen, V.-M., Kouvarakis, G., Stavroulas, I., Tzitzikalaki, E., Kalkavouras, P., Daskalakis, N., Myriokefalitakis, S., Bougiatioti, A., Manninen, H. E., Roldin, P., Petäjä, T., Boy, M., Kulmala, M., Kanakidou, M., and Mihalopoulos, N.: Formation and growth of atmospheric nanoparticles in the eastern Mediterranean: results from long-term measurements and process simulations, Atmos. Chem. Phys., 19, 2671–2686, https://doi.org/10.5194/acp-19-2671-2019, 2019.
Karl, M., Leck, C., Coz, E., and Heintzenberg, J.: Marine nanogels as a source atmospheric nanoparticles in the high Arctic, Geophys. Res. Lett., 40, 3738–374, https://doi.org/10.1002/grl.50661, 2013.
Karl, M., Leck, C., Mashayekhy Rad, F., Bäcklund, A., Lopez-Aparicio, S., and Heintzenberg, J.: New insights in sources of the sub-micrometre aerosol at Mt. Zeppelin observatory (Spitsbergen) in the year 2015, Tellus B, 71, 1613143, https://doi.org/10.1080/16000889.2019.1613143, 2019.
Kecorius, S., Vogl, T., Paasonen, P., Lampilahti, J., Rothenberg, D., Wex, H., Zeppenfeld, S., van Pinxteren, M., Hartmann, M., Henning, S., Gong, X., Welti, A., Kulmala, M., Stratmann, F., Herrmann, H., and Wiedensohler, A.: New particle formation and its effect on cloud condensation nuclei abundance in the summer Arctic: a case study in the Fram Strait and Barents Sea, Atmos. Chem. Phys., 19, 14339–14364, https://doi.org/10.5194/acp-19-14339-2019, 2019.
Kerminen, V.-M., Chen, X., Vakkari, V., Petäjä, T., Kulmala, M., and Bianchi, F.: Atmospheric new particle formation and growth: review of field observations, Environ. Res. Lett., 13, 103003, https://doi.org/10.1088/1748-9326/aadf3c, 2018.
Kim, J., Yoon, Y. J., Gim, Y., Choi, J. H., Kang, H. J., Park, K.-T., Park, J., and Lee, B. Y.: New particle formation events observed at King Sejong Station, Antarctic Peninsula – Part 1: Physical characteristics and contribution to cloud condensation nuclei, Atmos. Chem. Phys., 19, 7583–7594, https://doi.org/10.5194/acp-19-7583-2019, 2019.
Kuang, C., Riipinen, I., Sihto, S.-L., Kulmala, M., McCormick, A. V., and McMurry, P. H.: An improved criterion for new particle formation in diverse atmospheric environments, Atmos. Chem. Phys., 10, 8469–8480, https://doi.org/10.5194/acp-10-8469-2010, 2010.
Kuang, C., Chen, M., Zhao, J., Smith, J., McMurry, P. H., and Wang, J.: Size and time-resolved growth rate measurements of 1 to 5 nm freshly formed atmospheric nuclei, Atmos. Chem. Phys., 12, 3573–3589, https://doi.org/10.5194/acp-12-3573-2012, 2012.
Kulmala, M., Vehkamäki, H., Petäjä, T., Dal Maso, M., Lauri, A., Kerminen, V. M., Birmili, W., and McMurry, P. H.: Formation and growth rates of ultrafine atmospheric particles: a review of observations, J. Aerosol Sci., 35, 143–176, https://doi.org/10.1016/j.jaerosci.2003.10.003, 2004.
Kulmala, M., Petaja, T., Nieminen, T., Sipila, M., Manninen, H. E., Lehtipalo, K., Dal Maso, M., Aalto, P. P., Junninen, H., Paasonen, P., Riipinen, I., Lehtinen, K. E., Laaksonen, A., and Kerminen, V. M.: Measurement of the nucleation of atmospheric aerosol particles, Nat. Protoc., 7, 1651–1667, https://doi.org/10.1038/nprot.2012.091, 2012.
Kulmala, M., Kerminen, V. M., Petaja, T., Ding, A. J., and Wang, L.: Atmospheric gas-to-particle conversion: why NPF events are observed in megacities?, Faraday Discuss., 200, 271–288, https://doi.org/10.1039/C6FD00257A, 2017.
Law, K. S. and Stohl, A.: Arctic air pollution: Origins and impacts, Science, 315, 1537–1540, https://doi.org/10.1126/science.1137695, 2007.
Leaitch, W. R., Sharma, S., Huang, L., Toom-Sauntry, D., Chivulescu, A., Macdonald, A. M., von Salzen, K., Pierce, J. R., Bertram, A. K., and Schroder, J. C.: Dimethyl sulfide control of the clean summertime Arctic aerosol and cloud, Elem. Sci. Anth., 1, 000017, https://doi.org/10.12952/journal.elementa.000017, 2013.
Lee, H., Lee, B. Y., and Park, K.: NanoSMPS particle number concentration in 2016, Korea Polar Data Center, https://doi.org/10.22663/KOPRI-KPDC-00001127.2, 2020a.
Lee, H., Lee, B. Y., and Park, K.: NanoSMPS particle number concentration in 2017, Korea Polar Data Center, https://doi.org/10.22663/KOPRI-KPDC-00001125.3, 2020b.
Lee, H., Lee, B. Y., and Park, K.: NanoSMPS particle number concentration in 2018, Korea Polar Data Center, https://doi.org/10.22663/KOPRI-KPDC-00001126.4, 2020c.
Liss, P. S., Malin, G., Turner, S. M., and Holligan, P. M., Dimethyl sulphide and Phaeocystis: a review, J. March. Syst., 5, 41–53, https://doi.org/10.1016/0924-7963(94)90015-9, 1994.
Manninen, H. E., Nieminen, T., Asmi, E., Gagné, S., Häkkinen, S., Lehtipalo, K., Aalto, P., Vana, M., Mirme, A., Mirme, S., Hõrrak, U., Plass-Dülmer, C., Stange, G., Kiss, G., Hoffer, A., Törő, N., Moerman, M., Henzing, B., de Leeuw, G., Brinkenberg, M., Kouvarakis, G. N., Bougiatioti, A., Mihalopoulos, N., O'Dowd, C., Ceburnis, D., Arneth, A., Svenningsson, B., Swietlicki, E., Tarozzi, L., Decesari, S., Facchini, M. C., Birmili, W., Sonntag, A., Wiedensohler, A., Boulon, J., Sellegri, K., Laj, P., Gysel, M., Bukowiecki, N., Weingartner, E., Wehrle, G., Laaksonen, A., Hamed, A., Joutsensaari, J., Petäjä, T., Kerminen, V.-M., and Kulmala, M.: EUCAARI ion spectrometer measurements at 12 European sites – analysis of new particle formation events, Atmos. Chem. Phys., 10, 7907–7927, https://doi.org/10.5194/acp-10-7907-2010, 2010.
Mashayekhy Rad, F., Zurita, J., Gilles, P., Rutgeerts, L. A. J., Nilsson, U., Ilag, L. L., and Leck, C.: Measurements of Atmospheric Proteinaceous Aerosol in the Arctic Using a Seletive UHPLC/ESI-MS/MS Strategy, J. Am. Soc. Mass Spectrom., 30, 161–173, https://doi.org/10.1007/s13361-019-02137-2, 2019.
Maturilli, M.: Basic and other measurements of radiation and continuous meteorological observations at station Ny-Ålesund (2016–2018), reference list of 72 datasets, Alfred Wegener Institute – Research Unit Potsdam, PANGAEA, https://doi.org/10.1594/PANGAEA.908444, 2019.
Maturilli, M., Herber, A., and König-Langlo, G.: Climatology and time series of surface meteorology in Ny-Ålesund, Svalbard, Earth Syst. Sci. Data, 5, 155–163, https://doi.org/10.5194/essd-5-155-2013, 2013.
McMurry, P. H., Fink, M., Sakurai, H., Stolzenburg, M. R., Mauldin, R. L., Smith, J., Eisele, F., Moore, K., Sjostedt, S., Tanner, D., Huey, L. G., Nowak, J. B., Edgerton, E., and Voisin, D.: A criterion for new particle formation in the sulfur-rich Atlanta atmosphere, J. Geophys. Res., 110, D22S02, https://doi.org/10.1029/2005JD005901, 2005.
McParland, E. L. and Levine, N. M.: The role of differential DMSP production and community composition in predicting variability of global surface DMSP concentrations, Limnol. Oceanogr., 64, 757–773, https://doi.org/10.1002/lno.11076, 2019.
Merikanto, J., Spracklen, D. V., Mann, G. W., Pickering, S. J., and Carslaw, K. S.: Impact of nucleation on global CCN, Atmos. Chem. Phys., 9, 8601–8616, https://doi.org/10.5194/acp-9-8601-2009, 2009.
Mikkonen, S., Romakkaniemi, S., Smith, J. N., Korhonen, H., Petäjä, T., Plass-Duelmer, C., Boy, M., McMurry, P. H., Lehtinen, K. E. J., Joutsensaari, J., Hamed, A., Mauldin III, R. L., Birmili, W., Spindler, G., Arnold, F., Kulmala, M., and Laaksonen, A.: A statistical proxy for sulphuric acid concentration, Atmos. Chem. Phys., 11, 11319–11334, https://doi.org/10.5194/acp-11-11319-2011, 2011.
Neuber, R., Ström, J., Hübner, C., Hermansen, O., Arya, B. C., Beichen, Z., Kallenborn, R., Karasinki, G., Ivanov, B., and Moen, J.: Atmospheric research in Ny-Ålesund-a flagship programme, Norsk Polarinstitutt, Norwegian Institute for Air Research (NILU), Kjeller, Norway, 2011.
Nguyen, Q. T., Glasius, M., Sørensen, L. L., Jensen, B., Skov, H., Birmili, W., Wiedensohler, A., Kristensson, A., Nøjgaard, J. K., and Massling, A.: Seasonal variation of atmospheric particle number concentrations, new particle formation and atmospheric oxidation capacity at the high Arctic site Villum Research Station, Station Nord, Atmos. Chem. Phys., 16, 11319–11336, https://doi.org/10.5194/acp-16-11319-2016, 2016.
Nieminen, T., Asmi, A., Dal Maso, M., Aalto, P. P., Keronen, P., Petäjä, T., Kulmala, M., and Kerminen, V.-M.: Trends in atmospheric new-particle formation: 16 years of observations, Boreal Environ. Res., 19, 191–214, 2014.
O'Neill, N., Pancrati, O., Baibakov, K., Eloranta, E., Batchelor, R., Freemantle, J., McArthur, L., Strong, K., and Lindenmaier, R.: Occurrence of weak, sub-micron, tropospheric aerosol events at high Arctic latitudes, Geophys. Res. Lett., 35, L14814, https://doi.org/10.1029/2008GL033733, 2008.
Park, J., Dall'Osto, M., Park, K., Gim, Y., Kang, H. J., Jang, E., Park, K.-T., Park, M., Yum, S. S., Jung, J., Lee, B. Y., and Yoon, Y. J.: Shipborne observations reveal contrasting Arctic marine, Arctic terrestrial and Pacific marine aerosol properties, Atmos. Chem. Phys., 20, 5573–5590, https://doi.org/10.5194/acp-20-5573-2020, 2020.
Park, K.-T., Lee, K., Yoon, Y.-J., Lee, H.-W., Kim, H.-C., Lee, B.-Y., Hermansen, O., Kim, T.-W., and Holmén, K.: Linking atmospheric dimethyl sulphide and the Arctic Ocean spring bloom, Geophys. Res. Lett., 40, 155–160, https://doi.org/10.1029/2012GL054560, 2013.
Park, K.-T., Jang, S., Lee, K., Yoon, Y. J., Kim, M.-S., Park, K., Cho, H.-J., Kang, J.-H., Udisti, R., Lee, B.-Y., and Shin, K.-H.: Observational evidence for the formation of DMS-derived aerosols during Arctic phytoplankton blooms, Atmos. Chem. Phys., 17, 9665–9675, https://doi.org/10.5194/acp-17-9665-2017, 2017.
Park, K. T., Lee, K., Kim, T. W., Yoon, Y. J., Jang, E. H., Jang, S., and Lee, B. Y., Hermansen, O.: Atmospheric DMS in the Arctic Ocean and its relation to phytoplankton biomass, Glob. Biogeochem. Cy., 32, 351–359, https://doi.org/10.1002/2017GB005805, 2018.
Pekney, N. J., Davidson, C. I., Zhou, L., and Hopke, P. K.: Application of PSCF and CPF to PMF-modeled sources of PM2.5 in Pittsburgh, Aerosol Sci. Tech., 40, 952–961, https://doi.org/10.1080/02786820500543324, 2006.
Polimene, L., Archer, S. D., Butenschön, M., and Allen, J. I.: A mechanistic explanation of the Sargasso Sea DMS “summer paradox”, Biogeochemistry, 110, 243–255, https://doi.org/10.1007/s10533-011-9674-z, 2012.
Quinn, P., Miller, T., Bates, T., Ogren, J., Andrews, E., and Shaw, G.: A 3-year record of simultaneously measured aerosol chemical and optical properties at Barrow, Alaska, J. Geophys. Res.-Atmos., 107, 4130, https://doi.org/10.1029/2001JD001248, 2002.
Quinn, P., Shaw, G., Andrews, E., Dutton, E., Ruoho-Airola, T., and Gong, S.: Arctic haze: current trends and knowledge gaps, Tellus B, 59, 99–114, https://doi.org/10.1111/j.1600-0889.2006.00238.x, 2007.
Quinn, P. K., Bates, T. S., Baum, E., Doubleday, N., Fiore, A. M., Flanner, M., Fridlind, A., Garrett, T. J., Koch, D., Menon, S., Shindell, D., Stohl, A., and Warren, S. G.: Short-lived pollutants in the Arctic: their climate impact and possible mitigation strategies, Atmos. Chem. Phys., 8, 1723–1735, https://doi.org/10.5194/acp-8-1723-2008, 2008.
Radke, L. F., Lyons, J. H., Hegg, D. A., Hobbs, P. V., and Bailey, I. H.: Airborne observations of Arctic aerosols. I: Characteristics of Arctic haze, Geophys. Res. Lett., 11, 393–396, https://doi.org/10.1029/GL011i005p00393, 1984.
Satheesh, S. and Moorthy, K. K.: Radiative effects of natural aerosols: A review, Atmos. Environ., 39, 2089–2110, https://doi.org/10.1016/j.atmosenv.2004.12.029, 2005.
Sharma, S., Ishizawa, M., Chan, D., Lavoué, D., Andrews, E., Eleftheriadis, K., and Maksyutov, S.: 16-year simulation of Arctic black carbon: Transport, source contribution, and sensitivity analysis on deposition, J. Geophys. Res.-Atmos., 118, 943–964, https://doi.org/10.1029/2012JD017774, 2013.
Shaw, G. E.: The Arctic haze phenomenon, B. Am. Meteorol. Soc., 76, 2403–2414, https://doi.org/10.1175/1520-0477(1995)076<2403:TAHP>2.0.CO;2, 1995.
Shen, L., Wang, H., Lu, S., Li, L., Yuan, J., Zhang, X., Tian, X., and Tang, Q.: Observation of aerosol size distribution and new particle formation at a coastal city in the Yangtze River Delta, China, Sci. Total Environ., 565, 1175–1184, https://doi.org/10.1016/j.scitotenv.2016.05.164, 2016.
Shen, X., Sun, J., Zhang, X., Zhang, Y., Zhang, L., and Fan, R.: Key features of new particle formation events at background sites in China and their influence on cloud condensation nuclei, Front. Environ. Sci. Eng., 10, 5, https://doi.org/10.1007/s11783-016-0833-2, 2016.
Siegel, D. A., Behrenfeld, M., Maritorena, S., McClain, C. R., Antoine, D., Bailey, S. W., and Yoder, J. A.: Regional to global assessments of phytoplankton dynamics from the SeaWiFS mission, Remote Sens. Environ., 135, 77–91, https://doi.org/10.1016/j.rse.2013.03.025, 2013.
Stanier, C. O., Khlystov, A. Y., and Pandis, S. N.: Nucleation Events During the Pittsburgh Air Quality Study: Description and Relation to Key Meteorological, Gas Phase, and Aerosol Parameters, Aerosol Sci. Tech., 38, 253–264, https://doi.org/10.1080/02786820390229570, 2004.
Stefels, J., Steinke, M., Turner, S., Malin, G., and Belviso, S.: Environmental constraints on the production and removal of the climatically active gas dimethylsulphide (DMS) and implications for ecosystem modelling, Biogeochemistry, 83, 245–275, https://doi.org/10.1007/s10533-007-9091-5, 2007.
Ström, J., Umegård, J., Tørseth, K., Tunved, P., Hansson, H. C., Holmén, K., Wismann, V., Herber, A., and König-Langlo, G.: One year of particle size distribution and aerosol chemical composition measurements at the Zeppelin Station, Svalbard, March 2000–March 2001, Phys. Chem. Earth Pt. A/B/C, 28, 1181–1190, https://doi.org/10.1016/j.pce.2003.08.058, 2003.
Ström, J., Engvall, A.-C., Delbart, F., Krejci, R., and Treffeisen, R.: On small particles in the Arctic summer boundary layer: observations at two different heights near Ny-Ålesund, Svalbard, Tellus B, 61, 473–482, https://doi.org/10.3402/tellusb.v61i2.16845, 2009.
Toon, O. B. and Pollack, J. B.: Atmospheric aerosols and climate: Small particles in the Earth's atmosphere interact with visible and infrared light, altering the radiation balance and the climate, American Scientist, 68, 268–278, available at: https://www.jstor.org/stable/27849822 (last access: 2 November 2020), 1980.
Tovar-Sánchez, A., Duarte, C. M., Alonso, J. C., Lacorte, S., Tauler, R., and Galbán-Malagón, C.: Impacts of metals and nutrients released from melting multiyear Arctic sea ice, J. Geophys. Res., 115, C07003, https://doi.org/10.1029/2009JC005685, 2010.
Tunved, P., Ström, J., and Krejci, R.: Arctic aerosol life cycle: linking aerosol size distributions observed between 2000 and 2010 with air mass transport and precipitation at Zeppelin station, Ny-Ålesund, Svalbard, Atmos. Chem. Phys., 13, 3643–3660, https://doi.org/10.5194/acp-13-3643-2013, 2013.
Uhlig, C., Damm, E., Peeken, I., Krumpen, T., Rabe, B., Korhenon, M., and Ludwichowski, K.-U.: Sea Ice and Water Mass Influence Dimethylsulfide Concentration in the Central Arctic Ocean, Front. Earth Sci., 7, 179, https://doi.org/10.3389/feart.2019.00179, 2019.
Vehkamäki, H., Dal Maso, M., Hussein, T., Flanagan, R., Hyvärinen, A., Lauros, J., Merikanto, P., Mönkkönen, M., Pihlatie, K., Salminen, K., Sogacheva, L., Thum, T., Ruuskanen, T. M., Keronen, P., Aalto, P. P., Hari, P., Lehtinen, K. E. J., Rannik, Ü., and Kulmala, M.: Atmospheric particle formation events at Värriö measurement station in Finnish Lapland 1998-2002, Atmos. Chem. Phys., 4, 2015–2023, https://doi.org/10.5194/acp-4-2015-2004, 2004.
Venzac, H., Sellegri, K., Laj, P., Villani, P., Bonasoni, P., Marinoni, A., Cristofanelli, P., Calzolari, F., Fuzzi, S., and Decesari, S.: High frequency new particle formation in the Himalayas, P. Natl. Acad. Sci. USA, 105, 15666–15671, https://doi.org/10.1073/pnas.0801355105, 2008.
Wang, Y., Zhang, X., and Draxler, R. R.: TrajStat: GIS-based software that uses various trajectory statistical analysis methods to identify potential sources from long-term air pollution measurement data, Environ. Model. Softw., 24, 938–939, https://doi.org/10.1016/j.envsoft.2009.01.004, 2009.
Wang, Z., Wu, Z., Yue, D., Shang, D., Guo, S., Sun, J., Ding, A., Wang, L., Jiang, J., Guo, H., Gao, J., Cheung, H. C., Morawska, L., Keywood, M., and Hu, M.: New particle formation in China: Current knowledge and further directions, Sci. Total Environ., 577, 258–266, https://doi.org/10.1016/j.scitotenv.2016.10.177, 2017.
Weller, R., Schmidt, K., Teinilä, K., and Hillamo, R.: Natural new particle formation at the coastal Antarctic site Neumayer, Atmos. Chem. Phys., 15, 11399–11410, https://doi.org/10.5194/acp-15-11399-2015, 2015.
Wiedensohler, A., Covert, D. S., Swietlicki, E., Aalto, P., Heintzenberg, J., and Leck, C.: Occurrence of an ultrafine particle mode less than 20 nm in diameter in the marine boundary layer during Arctic summer and autumn, Tellus B, 48, 213–222, https://doi.org/10.3402/tellusb.v48i2.15887, 1996.
Willis, M. D., Burkart, J., Thomas, J. L., Köllner, F., Schneider, J., Bozem, H., Hoor, P. M., Aliabadi, A. A., Schulz, H., Herber, A. B., Leaitch, W. R., and Abbatt, J. P. D.: Growth of nucleation mode particles in the summertime Arctic: a case study, Atmos. Chem. Phys., 16, 7663–7679, https://doi.org/10.5194/acp-16-7663-2016, 2016.
Woo, K. S., Chen, D. R., Pui, D. Y. H., and McMurry, P. H.: Measurement of Atlanta Aerosol Size Distributions: Observations of Ultrafine Particle Events, Aerosol Sci. Tech., 34, 75–87, https://doi.org/10.1080/02786820120056, 2010.
Wu, Z., Hu, M., Liu, S., Wehner, B., Bauer, S., Ma ßling, A., Wiedensohler, A., Petäjä, T., Dal Maso, M., and Kulmala, M.: New particle formation in Beijing, China: Statistical analysis of a 1-year data set, J. Geophys. Res.-Atmos., 112, D09209, https://doi.org/10.1029/2006JD007406, 2007.
Xiao, S., Wang, M. Y., Yao, L., Kulmala, M., Zhou, B., Yang, X., Chen, J. M., Wang, D. F., Fu, Q. Y., Worsnop, D. R., and Wang, L.: Strong atmospheric new particle formation in winter in urban Shanghai, China, Atmos. Chem. Phys., 15, 1769–1781, https://doi.org/10.5194/acp-15-1769-2015, 2015.
Yu, H., Ren, L., and Kanawade, V. P.: New particle formation and growth mechanisms in highly polluted environments, Curr. Pollut. Rep., 3, 245–253, https://doi.org/10.1007/s40726-017-0067-3, 2017.
Zhan, J., Li, W., Chen, L., Lin, Q., and Gao, Y.: Anthropogenic influences on aerosols at Ny-Ålesund in the summer Arctic, Atmos. Pollut. Res., 8, 383–393, https://doi.org/10.1016/j.apr.2016.10.010, 2017.
Zhang, M., Park, K.-T., Lin, Q., Yan, J., Park, K., Wu, Y., Chen, L., Jang, E., Gao, W., Tan, G., and Wang, J: Atmospheric dimethyl sulfide and its significant influence on the sea-to-air flux calculation over the Southern Ocean, Prog. Oceanogr., 186, 102392, https://doi.org/10.1016/j.pocean.2020.102392, 2020.
Zhang, Y., Zhang, H.-H., Yang, G.-P., and Liu, Q.-L.: Chemical Characteristics and Source Analysis of Aerosol Composition over the Bohai Sea and the Yellow Sea in Spring and Autumn, J. Atmos. Sci., 72, 3563–3573, https://doi.org/10.1175/JAS-D-14-0372.1, 2015.