the Creative Commons Attribution 4.0 License.
the Creative Commons Attribution 4.0 License.
 | 10 Nov 2020
Secondary organic aerosol yields from the oxidation of benzyl alcohol
Sophia M. Charan
Reina S. Buenconsejo
Recent inventory-based analysis suggests that emissions of volatile chemical products in urban areas are competitive with those from the transportation sector. Understanding the potential for secondary organic aerosol formation from these volatile chemical products is therefore critical to predicting levels of aerosol and for formulating policy to reduce aerosol exposure. Experimental and computationally simulated environmental chamber data provide an understanding of aerosol yield and chemistry under relevant urban conditions (5–200 ppb NO and 291–312 K) and give insight into the effect of volatile chemical products on the production of secondary organic aerosol. Benzyl alcohol, one of these volatile chemical products, is found to have a large secondary organic aerosol formation potential. At NO concentrations of ∼ 80 ppb and 291 K, secondary organic aerosol mass yields for benzyl alcohol can reach 1.
- Article
(6755 KB) - Full-text XML
- BibTeX
- EndNote


A major component of ambient fine particulate matter is secondary organic aerosol (SOA), the precursors of which are originally emitted into the atmosphere in the gas-phase (Shrivastava et al., 2017; Goldstein and Galbally, 2007). Through single or multiple generations of oxidation, emitted vapors can become progressively less volatile and eventually condense into the particle phase to form this SOA (Seinfeld and Pandis, 2016).
Understanding the formation of particulate matter is of critical importance. Exposure to particulate matter causes respiratory and cardiovascular disease (Mannucci et al., 2015), and yet particulate matter has remained stubbornly high despite regulation: over 20 million people in the US live in regions with larger concentrations of PM2.5 than deemed safe (EPA, 2012). Additionally, SOA-containing particles can serve as cloud condensation nuclei; the interaction between particulate matter and cloud formation is one of the most important processes in the Earth's radiative budget and therefore in climate predictions (IPCC, 2014).
However, accurately predicting the mass of secondary organic aerosol formed from the oxidation of volatile chemical products (VCPs) poses a major challenge. A mass-balance analysis of VCPs in the Los Angeles atmosphere indicates that VCPs could account for around half of the SOA in that area (McDonald et al., 2018). This analysis was based on estimating secondary organic aerosol yields for a number of these oxygenated compounds that have traditionally not been studied for their SOA formation potential. Direct measurements of the SOA yields of these compounds is paramount to constraining estimates and formulating policy to reduce secondary organic aerosol formation (Burkholder et al., 2017).
This study focuses on one of these volatile chemical products, benzyl alcohol. Benzyl alcohol is a widely used compound in consumer products that can be found in soaps, inks, paints, and, correspondingly, indoor air (Wang, 2015; Harrison and Wells, 2009). It is also emitted from biogenic sources, such as fruits and flowers (Baghi et al., 2012; Bernard et al., 2013; Horvat et al., 1990). The emission-inventory-based analysis by McDonald et al. (2018) of the production rates of volatile chemical products estimated that benzyl alcohol comprised 0.06 % of the total volatile organic compounds (VOCs) in the Los Angeles Basin in 2010. Using the Statistical Oxidation Model, they calculated that for half a day of oxidation under high ambient NOx conditions, benzyl alcohol will have a SOA yield of 0.09. Based on this value, it was further estimated that benzyl alcohol contributes 0.14 % of the total atmospheric secondary organic aerosol in the Los Angeles Basin.
Whereas the SOA yield of benzyl alcohol oxidation estimated in the McDonald et al. (2018) analysis was relatively low, in a laboratory chamber study, Carter et al. (2005) measured the SOA yield of benzyl alcohol to be ∼ 0.3 in a mixture of reactive compounds and 25–30 ppb of NOx. This reactive compound mixture comprised compounds that one would not expect to form significant SOA yield but that may influence the fate of RO2 radicals that could be formed from benzyl alcohol oxidation. That study also estimated the reaction rate constant of benzyl alcohol with OH as cm3 molec−1 s−1. An extension of the study (Li et al., 2018), which also used a base mixture of reactive compounds, determined a benzyl alcohol SOA yield of 0.41.
The goal of determining SOA formation in an environmental chamber is to extrapolate the SOA yields to the atmosphere. Since at different times or in disparate places, different temperatures or NOx mixing ratios may be most relevant, it is important to study SOA formation in a wide parameter space. Studies performed under varying conditions can also assist in teasing out which data result from the atmospheric chamber itself and how these data ought to be corrected for the atmosphere. For example, for toluene, a compound for which benzyl alcohol is a major photooxidation product (Hamilton et al., 2005), Zhang et al. (2014) found a SOA yield 70 % higher at low NOx concentrations than at high NOx concentrations and found that the true SOA yield was a factor of 4 higher than that calculated without accounting for the chamber process of vapor-wall deposition.
While the experiments described here were performed under conditions that minimize corrections required to extrapolate SOA yields to the atmosphere, historically these corrections could be quite significant (Zhang et al., 2014). As a result, we devote Sect. 3 to a detailed discussion of the SOA yield calculation including possible corrections. Understanding these corrections is critical to ensuring that the SOA yields calculated are atmospherically relevant.
2.1 Experimental method and chamber description
All experiments were performed in batch mode in the Caltech 17.9 m3 fluorinated ethylene propylene (FEP) Teflon-walled environmental chamber, which hangs in a temperature-controlled enclosure. The chamber volume was characterized according to the procedure outlined in Schwantes et al. (2017a). While the chamber pressure remains constant throughout the duration of an experiment, the volume decreases as air is sampled by various instruments; the fraction of the volume at the end of the experiment compared to the beginning of it is given in Table 1. Before each experiment, the chamber was flushed for >24 h with clean air (compressed air with ozone, nitrogen oxides, water vapor, and organic carbon removed). The radical source H2O2 was injected at 42 ∘C and 5 L min−1 into the chamber, followed by the injection of benzyl alcohol (Sigma Aldrich ReagentPlus, ≥ 99 %) with gentle heating (60 ∘C) at 2 L min−1 (5 L min−1 for experiments S1–S3 and E1) for > 50 min. The purity of the benzyl alcohol was verified with nuclear magnetic resonance (NMR) spectroscopy. Meanwhile, a 0.06 M (NH4)2SO4 solution (0.15 M for experiments S2 and E1) was atomized and the resulting particles dried, charge-conditioned with a TSI Model 3088 soft X-ray neutralizer, and then injected into the chamber for varying lengths of time (depending on the desired initial seed concentration; note that no particles were injected for experiment S1). The solution was sonicated before each injection. Then, NO (506.9 ppm ± 2 %, Airgas Specialty Gases, Certified Standard) or, for experiment E1, NO2 (488 ppm, Air Liquide) was injected into the chamber at 5 L min−1 to achieve the desired initial NO or NO2 concentration. Ultraviolet broadband lights centered around 350 nm were used to photolyze H2O2 with a rate of s−1, calculated using the measured variation in irradiance with wavelength and the NO2 photolysis rate ( s−1) found using a 0.29 L quartz tube and the procedure outlined in Zafonte et al. (1977). Experiment L1 was performed at 8 % of the light strength of the other experiments ( s−1).
Table 1Experiments analyzed for this study.
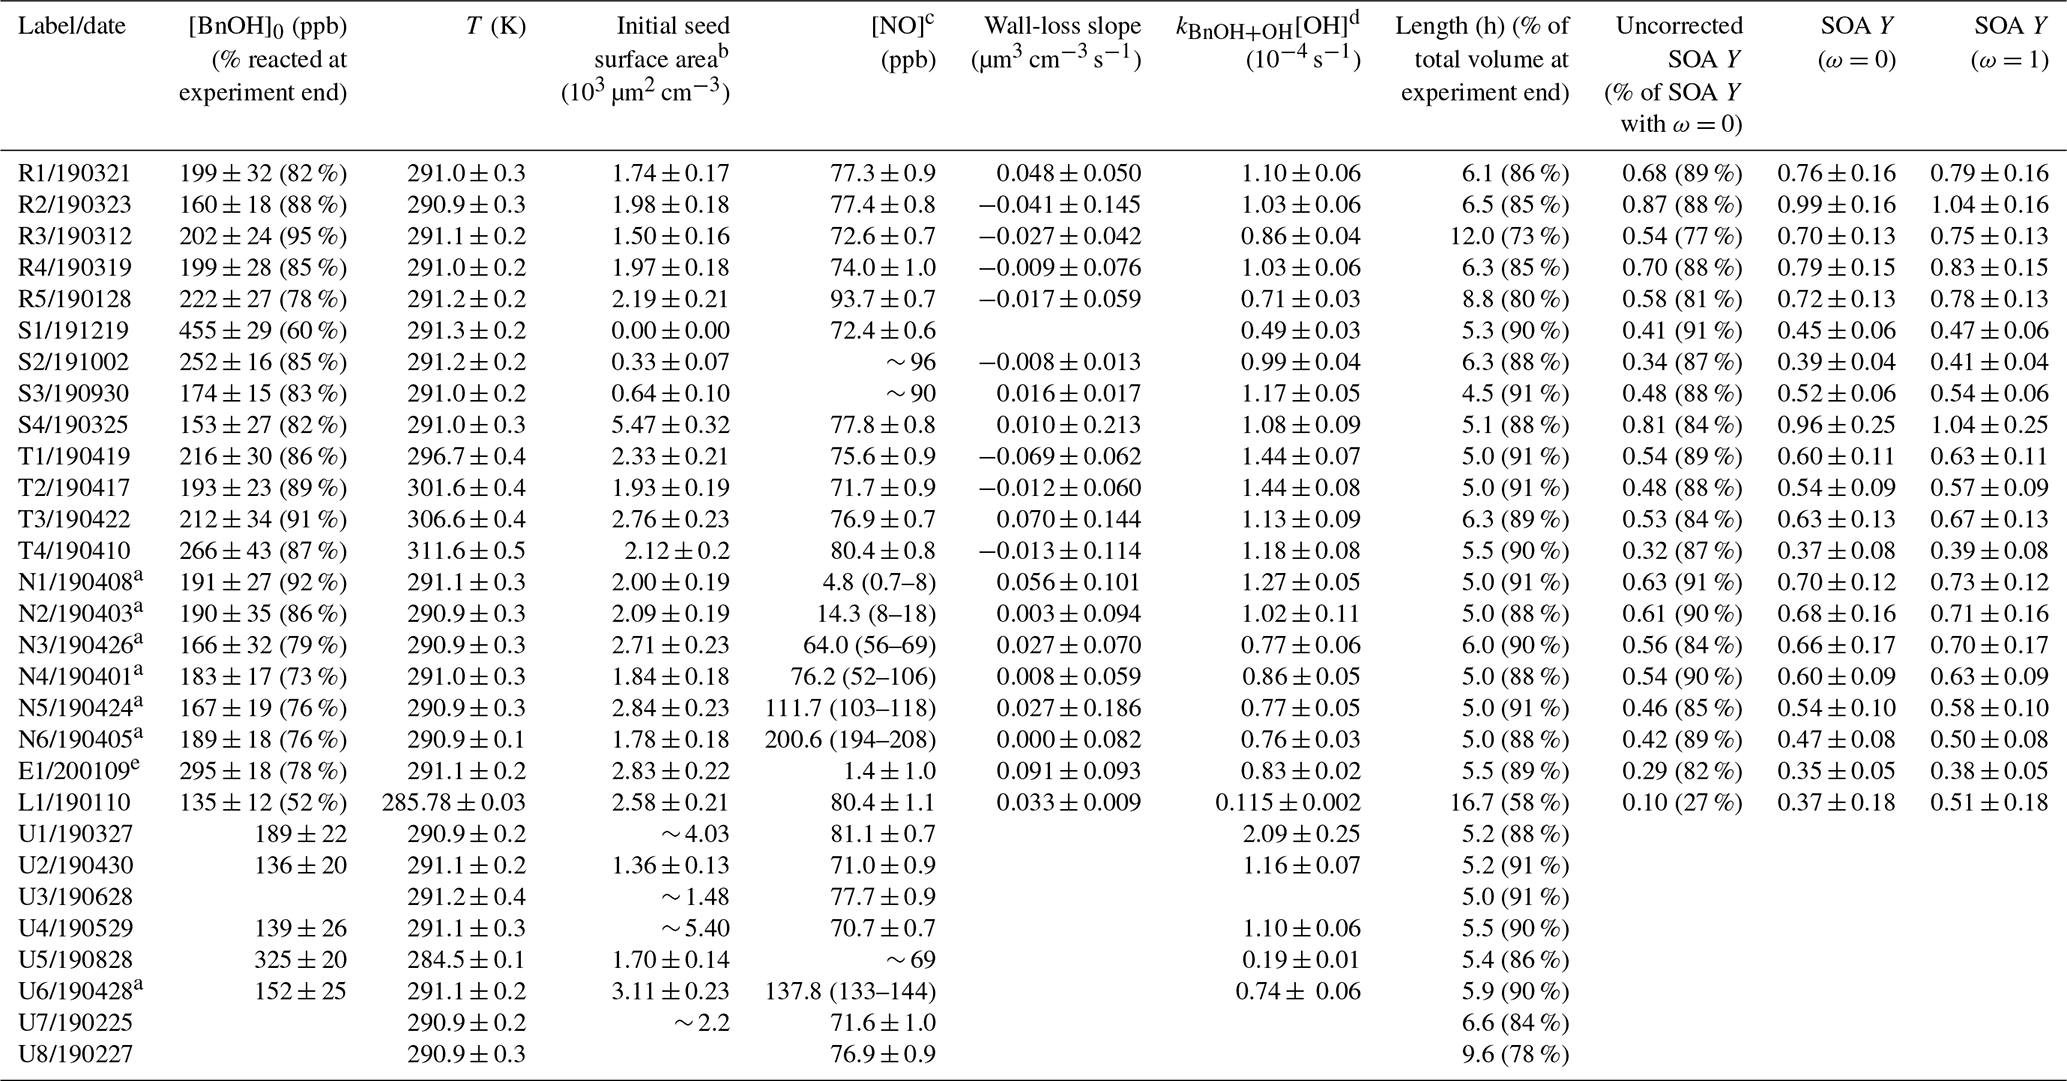
a For these experiments (N1–N6 and U6), [NO] was held constant through a continuous injection. b Experiments with particles outside the range of the scanning mobility particle sizer (SMPS) used for particle measurement or those
with other measurement issues are reported without uncertainties and should be taken as approximate values. This applies to experiments U1, U3–U4, and U7–U8. c For constant [NO] experiments, the average [NO] is reported along
with the range of [NO] throughout the experiment. For all other experiments, the initial [NO] is given with the standard deviation during the background collection period. For experiments with NOx measurement problems, an
approximate value is given. d The reported value is from a first-order exponential fit of the benzyl alcohol decay. e Experiment E1 had an initial NO2 mixing ratio of 71.0 ± 0.8 ppb. All other experiments began with no initial NO2.
A Vaisala HMM211 probe was used to measure the temperature and humidity of the chamber. Humidity was calibrated for RH from 11 % to 95 % (using LiCl, KNO3, Mg(NO3)2, and MgCl2 salts). A Teledyne nitrogen oxide analyzer (Model T200) was used to measure the NO and NO2 concentrations throughout the experiments; note that this instrument measures the contribution of NOy compounds (e.g., organic nitrates) as NO2. Due to some drift between experiments, linear fits were performed on the slope and offset calibrations, except for experiments S2–S3 and U5, due to a calibration problem. Ozone was measured with a Horiba ambient monitor. NO, NO2, and O3 concentrations were recorded every 30 s. Humidity and temperature uncertainties were calculated as standard deviations from the mean value, where measurements were taken every 30 s throughout the experiment. Initial NO and NO2 mixing ratios were determined (as well as their standard deviations) prior to irradiation during the background collection period (usually ≳ 60 min). For experiments N1–N6 and U6, NO was continuously injected during oxidation to maintain a stable NO mixing ratio.
2.2 Gas-phase measurements
A CF3O− chemical ionization mass spectrometer (CIMS) measured oxidation products and the benzyl alcohol concentration by scanning m∕z ratios between 50 and 330. The CIMS is equipped with a Varian 1200 triple quadrupole mass analyzer. A custom-built inlet was used to ensure that the sample was taken at a constant temperature (the top of the inlet was 25 ∘C). To reduce loss of vapor to the tubing prior to analysis, the CIMS sampled off of a bypass flow that was accelerated using a mechanical pump.
The 193 m∕z signal (the mass of benzyl alcohol and CF3O−), which was measured every 162 to 172 s, was normalized to the 86 m∕z signal (the M+1 peak for CF3O−) and used to measure the benzyl alcohol concentration. This signal was calibrated using dilutions of an 800 L Teflon bag of ∼ 44 ppb benzyl alcohol. The concentration in this bag was verified using Fourier transform infrared absorption (FT-IR) spectroscopy with a 19 cm path length and absorption cross sections from the Pacific Northwest National Laboratory (PNNL) database. In this way, any wall or sampling loss was accounted for since the CIMS sampled from the same volume as the FT-IR. Multiple FT-IR samples were taken in succession until there were consistent spectra; this was to ensure a minimal effect from any compound deposited on the FT-IR instrument walls or sampling lines.
For the experiments labeled U3 and U7–U8, there were errors with the CIMS measurements. Correspondingly, Table 1 does not report an initial benzyl alcohol concentration, a first-order exponential fit to the benzyl alcohol decay, or any SOA yields. The experiments are still included in Table 1 because their results are used to understand differences in chemical composition.
During the background collection period of ∼ 1 h for each experiment, the standard deviation of the benzyl alcohol mixing ratio, along with the uncertainty in the calibration, was used to estimate the uncertainty of the initial benzyl alcohol mixing ratio (see Table 1). This combined standard deviation was also considered as the uncertainty in the measurement of the time-resolved gas-phase mixing ratio throughout the experiment. The SOA yield is determined from the reacted benzyl alcohol, which is the difference between the measured benzyl alcohol concentration at any given time and the initial benzyl alcohol concentration. The variance of the reacted benzyl alcohol is the sum of the variances of the initial and measured benzyl alcohol mixing ratios. The uncertainty reported in Table 1 is, then, the square root of the reacted benzyl alcohol mixing ratio variance.
The conversion from mixing ratio to mass concentration of reacted benzyl alcohol was performed assuming a constant pressure of 1 atm. Note that the chamber is located three floors from a weather station, which reported an average atmospheric pressure of 0.97 atm in the year 2019 (TCCON Weather Data, 2020); thus, 1 atm is a reasonable estimate of the pressure in the experiments.
2.3 Particle-phase measurements
To measure the particle size distribution, a custom-built SMPS with a 308100 TSI differential mobility analyzer (DMA) and a TSI 3010 butanol condensation particle counter (CPC) was used with a sheath flow rate of 2.64 L min−1, an aerosol flow rate from the chamber of 0.515 L min−1, and a dilution flow of 0.485 L min−1. A full size scan was collected every 5.5 min (for experiments S1–S3 and E1 scans were performed every 6 min), and the voltage was scanned over 4 min from 15 to 9875 V. Data inversion was performed using the method described in Mai et al. (2018). Total number, volume, and surface area concentrations were determined assuming 431 size bins between 22 and 847 nm. When the sample flow was < 0.515 L min−1, an adjustment to the total number concentration was performed to account for the sampled flow. Particles were charged with a 500-microcurie Po-210 source, except for experiments S1–S3 and E1, which used an X-ray source.
When the aerosol size distribution was close to the edges of the measurable range, a logarithmic fit of the distribution tail was performed on the edges of the distribution: diameters of 382 to 600 nm were used to fit particles above 600 nm, and those with diameters 35 to 200 nm were used to fit particles with diameters smaller than 35 nm. Fits of the tail distribution were performed on the upper end of the size distribution for experiment N5, which produced an average of a 3.4 % decrease from the raw measurement in the volume concentration; the lower end of the size distribution for experiment S2, which led to a volume concentration adjustment of < 0.1 %; and on both the upper and lower ends of the size distribution for the nucleation experiment S1, which (for those points after at least 100 min of oxidation) led to a volume concentration difference of < 1 % from that measured in the absence of any adjustment. Particle volume was converted to particle mass with a SOA density of 1.4 g cm−3, consistent with past work on isoprene (Dommen et al., 2006; Kroll et al., 2005, 2006) and on benzyl alcohol (Li et al., 2018).
Uncertainty in the particle size was assumed not to exceed 2 nm, as is typical. For the CPC-associated margin of error, according to approximate Poisson statistics, the uncertainty of the number in each particle size bin was taken as the square root of the number concentration in that bin and that value of uncertainty was propagated into surface area and volume measurements both by bin and, eventually, for the total number concentration. Additionally, an uncertainty in the measured volume concentration due to sample noise was added from the uncertainty of the wall-loss-corrected volume concentrations in the background collection period prior to lights on (see Sect. 3.2.1).
For experiments U1–U8, there were issues with the particle-volume measurements or with the particle-wall-deposition correction (see Sect. 3.2.1). While these experiments were used for the analysis of chemical composition, no SOA yields or wall-loss slopes are reported. Additionally, experiments U1, U3–U4, and U7 report approximate initial seed surface area concentrations. There is no initial measured seed surface area concentration for experiment U8.
Aerosol-phase bulk composition was determined using an in situ high-resolution time-of-flight aerosol mass spectrometer (AMS, Aerodyne Research) in the high-sensitivity V mode. Data were analyzed with Igor Pro (version 6.37) and the Squirrel (1.57l) and Pika (1.16l) toolkits. Elemental composition was determined following the improved-ambient method from Canagaratna et al. (2015) and Aiken et al. (2008). Absolute uncertainties of O:C and H:C ratios are ±28 % and ±13 %, respectively (Canagaratna et al., 2015).
Measurements from the AMS can be utilized to determine the mass fraction of organonitrates (RONO2) in the aerosol phase following the method described by Farmer et al. (2010). Both inorganic and organic nitrates fragment to an m∕z of 30 (NO+) and an m∕z of 46 (), but the ratio of these two fragments for organonitrates (including those derived from aromatic hydrocarbons) and for ammonium nitrate is quite different, and this difference can be utilized to determine the contribution of organonitrates to the nitrate signal in the AMS (Farmer et al., 2010; Fry et al., 2013; Kiendler-Scharr et al., 2016; Sato et al., 2010). The measured mass ratio of NO∕NO2 (called the ratio) is used to show the contribution of organonitrates to aerosol mass (see Appendix A2). Note that fragments of the form are sufficiently scarce that they are neglected: the N:C ratio was never more than 0.026 for the experiments considered here.
For experiments N1–N3 and U1–U6, the chemical composition of particle-phase compounds was further analyzed using offline ultra-high-performance liquid chromatography electrospray ionization quadruple time-of-flight mass spectrometry (UPLC/ESI-QToF-MS) (Zhang et al., 2016). This method is described in Appendix A1.
3.1 Method
The secondary organic aerosol yield (SOA Y) is given by
where ΔBnOHmeas is the reacted mass of benzyl alcohol, that is, the difference between the initial concentration and the measured concentration at a given time. ΔSOAmeas is the difference between the measured and wall-deposition-corrected aerosol mass concentration at a given time and the aerosol concentration prior to the beginning of oxidation. The wall-deposition correction assumes that once a particle deposits on the wall, suspended gas-phase molecules no longer condense onto it; its growth ceases. This corresponds to the technical assumption that ω=0, where ω is a proportionality factor that describes the degree to which vapor condenses onto particles already deposited on the chamber walls compared to those suspended in the bulk of the chamber: if ω=0, once a particle deposits on the chamber wall it is lost to the system and no longer acts as a condensation sink; if ω=1, a particle deposited on the chamber wall acts as a condensation sink identically to that of a suspended particle (Trump et al., 2016; Weitkamp et al., 2007).
The SOA yield is bounded by the assumptions that ω=0 and ω=1. The extent of difference between these cases is dependent on characteristics of the chamber (e.g., the rate of particle-wall deposition) and of the chemical system (e.g., the amount of kinetic vs. equilibrium particle growth that occurs) (Trump et al., 2016). Appendix B describes the calculation of and the corresponding assumptions.
Table 1 shows the SOA yields calculated with uncertainties for the ω=0 and the ω=1 assumption. The SOA yield calculation with both ω=0 and ω=1 is shown for experiment R1 in Fig. 1. Since the difference between the SOA yield calculated with ω=1 and with ω=0 is dependent on the amount of organic aerosol that deposits onto the chamber walls, experiments with a higher initial aerosol concentration or that simply last for a longer period tend to have a greater disparity between SOA yields calculated with the ω=0 assumption and those calculated with the ω=1 assumption. Even so, for all the experiments considered here, the ω=1 calculated SOA yield is within the uncertainty of the SOA yield found assuming that ω=0. Furthermore, optimization of chamber parameters indicates that the ω=0 case is closer to reality than the ω=1 case (see Table C2 and the discussion in Appendix C4).
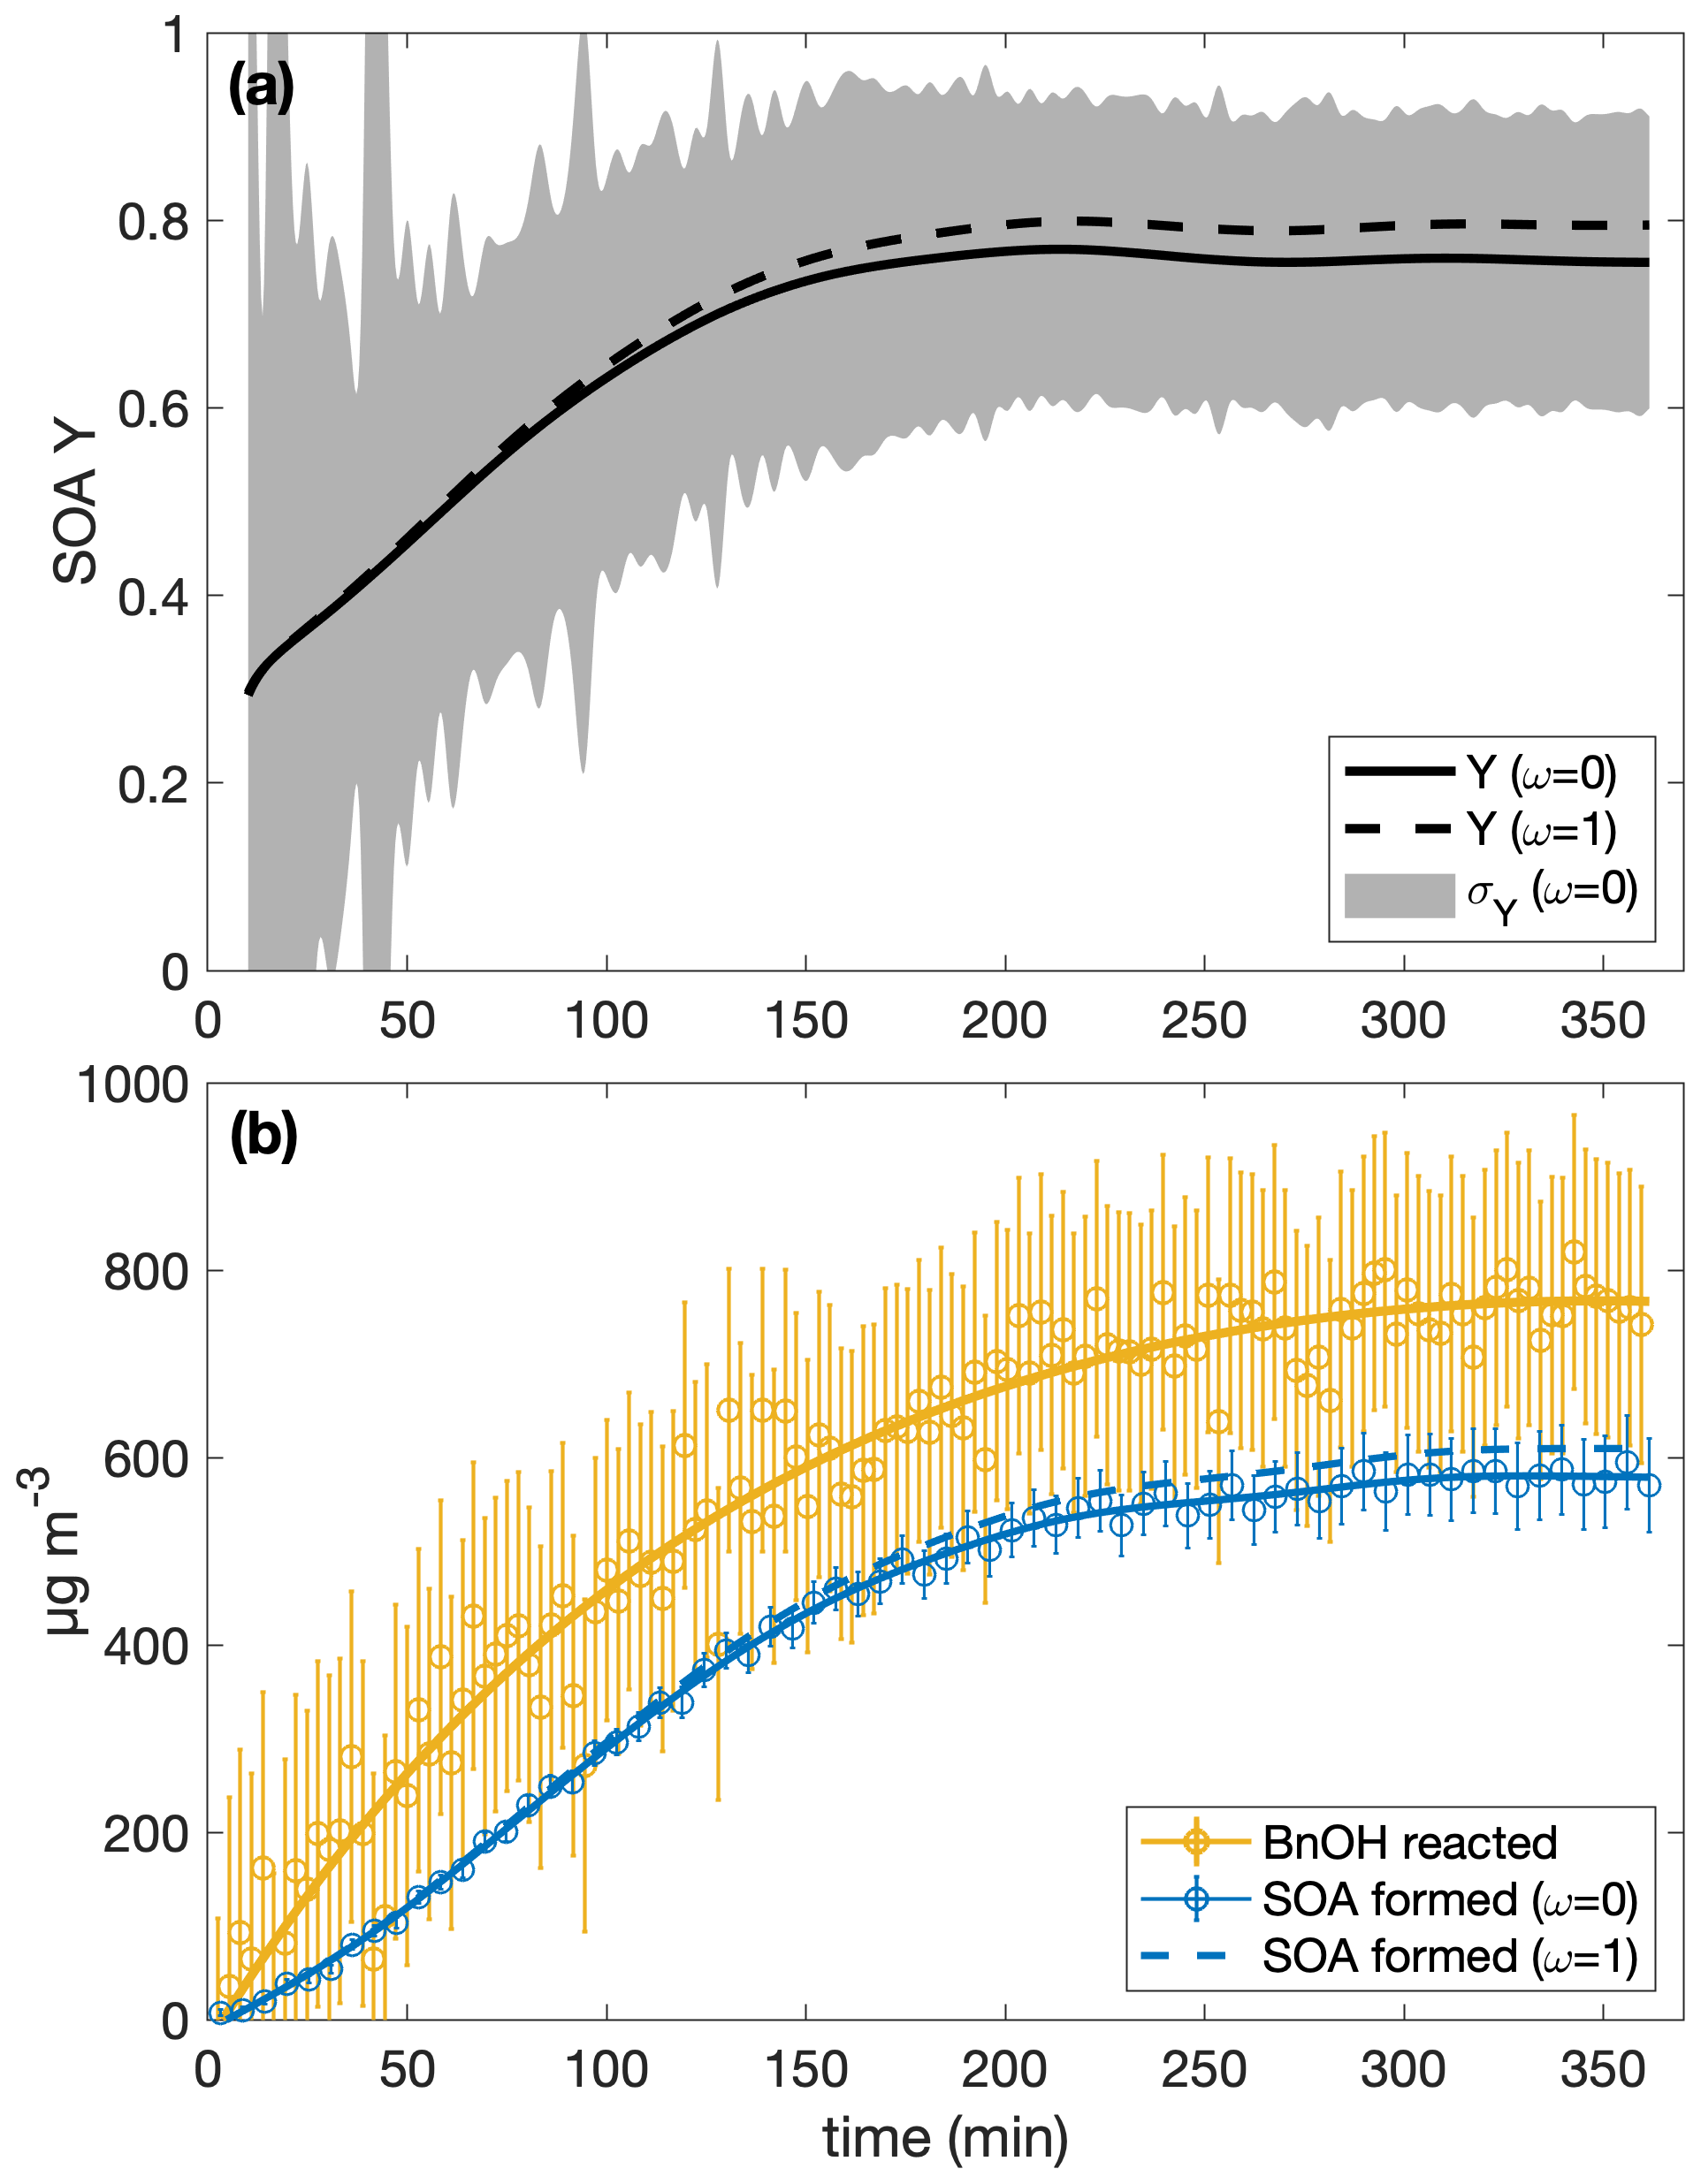
Figure 1(a) The SOA yield for experiment R1 calculated with the assumption that ω=0 is shown as a solid curve and with ω=1 as a dashed one. The shaded regions indicate the associated uncertainty for the ω=0 case. Due to low signal at the beginning, the first 10 min of the experiment are not shown. Panel (b) shows the wall-deposition-corrected mass concentration of SOA formed assuming ω=0 (solid blue curve fitted to the circles and error bars) and ω=1 (dashed blue curve). The measured mass concentration of benzyl alcohol is indicated by the yellow circles with associated error bars to which the yellow curve is fit.
3.2 Corrections
The chamber walls have, primarily, two effects on the SOA yield results: (1) particles with organic mass on them may deposit on the chamber walls and not be detected (this is called particle-wall deposition) or (2) low-volatility compounds that, in the atmosphere, would condense onto suspended particles and form secondary organic aerosol mass instead deposit directly onto the chamber walls (this is called vapor-wall deposition).
Since vapor-wall deposition can involve loss to the wall of the oxidation products and not just the precursor compound, it is difficult to directly correct for the effect of vapor-wall deposition on the observed SOA yield. This is because, often, as is the case here, not all the oxidation products are fully measured and characterized. Instead, one can minimize its effect by increasing the presence of the suspended aerosol surface area concentration so that the suspended aerosol outcompetes the chamber wall as a condensation sink. To do so, however, increases the effect of particle-wall deposition because, as there are more particles in the chamber, a greater fraction will generally deposit onto the chamber walls (due to a nonlinear decay) (Charan et al., 2019).
Noting that one must always account for particle-wall deposition, since even a nucleation experiment will produce particles that may deposit on the chamber walls while one is attempting to measure them, we take this approach of correcting for particle-wall deposition and operating our experiments in a regime that minimizes the effect of vapor-wall deposition.
3.2.1 Particle-wall deposition
To determine the particle-wall-deposition correction parameters for the 17.9 m3 chamber, two-parameter fits to the eddy-diffusivity coefficient (ke) and the mean electric field experienced within the chamber (), following the protocol in Charan et al. (2018), were performed on dry ammonium sulfate experiments with an assumed density of 1770 kg m−3. For this study, two experiments were carried out for 8 h in the dark with only ammonium sulfate seed present, one was a 6 h experiment under irradiation, and an additional four were 4 h dark experiments with the precursors of a VOC oxidation experiment. All dark experiments were carried out at 25.6 ∘C and that in the presence of light was performed at 28.6 ∘C. Analysis began 30 min after initial mixing and used 15 size bins to improve the counting statistics. All bins were included in analysis.
When a two-parameter minimization on ke and for each experiment was performed following the protocol described in Charan et al. (2019), initial guesses of ke were varied between 0.15 and 5 s−1 and of between 0 and 50 V cm−1. Overall, three of the seven experiments gave V cm−1, and the other four gave , 2.3, 3.9, and 5.1 V cm−1. Note that this is small: over 20 h of solely particle-wall deposition and coagulation for an initial surface area concentration of 2.7×103 µm2 cm−3 and a lognormal distribution centered around ∼ 125 nm, an V cm−1 gave a number concentration 86 % of that when (Charan et al., 2018); a characteristic value for a chamber with charge is ∼45 V cm−1 (McMurry and Rader, 1985). This chamber, unlike many with larger values of , is constantly suspended and does not touch the enclosure walls.
When all the experiments were analyzed together, with an initial guess of ke varying between 0.001 and 10 s−1, the minimization function converged with ke=0.0769 s−1. Even for those experiments that gave when optimized, all fit approximately as well to their one-parameter minimization and to the all-experiment optimized value (ke=0.0769 s−1) as to their individually optimized values. One-parameter optimization (optimizing only for ke, while assuming ) was also performed for each of the seven experiments. Uncertainty in wall loss was determined by taking the smallest ke value found from each of these experiments (0.0004 s−1) as a lower bound and the largest ke value (0.5 s−1) as an upper bound. The total mass concentration of SOA formed, which was used to calculate the SOA yield, was found from a smoothing spline fit of the particle-wall-deposition-corrected volume concentration (R2≥0.994). Wang et al. (2018a) have shown, for a similarly configured chamber to those used here, that neither UV lights, nor flushing of the chamber, nor gas-phase injections had an effect on particle-wall deposition.
As additional verification, for three experiments performed under the standard replication conditions for this study, the contents of the chamber were allowed to sit undisturbed for 4 h prior to the lights being turned on. During these 4 h, the wall loss correction was performed using the parameters ke=0.0769 s−1 and , for which it was verified that these values gave constant volume concentrations.
Prior to the commencement of oxidation, all experiments were mixed and then allowed to sit undisturbed for ≥ 1 h. During this background collection period, during which we assume no aerosol growth took place, the wall-deposition-corrected volume concentration was calculated using the ke and parameters given above. To quantify the degree to which this volume concentration was properly wall-deposition corrected, the slope of a linear fit of the volume concentration as a function of the time (with a 95 % confidence interval) during this background period is reported in Table 1. Since experiment S1 was performed in the absence of initial seed, the aerosol volume concentration during the background collection time was 0 and no slope is reported. For all 20 experiments in which a SOA yield is reported (excluding S1), the wall-deposition-corrected volume concentration during the background collection time was relatively constant: the absolute value of the slopes for all experiments was <0.1 µm3 cm3 s−1 and the mean was 0.03 µm3 cm−3 s−1.
The initial particle surface area concentration was taken to be the average of the wall-loss-corrected values of the seed volume during the background collection period.
3.2.2 Vapor-wall deposition
Based on three periods of vapor wall loss prior to experiment S3, each > 100 min, the timescale of the loss of benzyl alcohol to the Teflon chamber walls is on the order of days (∼ 2 to 5 d). While benzyl alcohol itself may be lost slowly, benzyl alcohol oxidation products might partition to the wall. The accommodation coefficient of vapor to suspended particles (αp) was derived to be on the order of 10−2 (see Appendix C). This also implies the presence of a seed surface area effect because the slower the gas–particle equilibration, the more likely it is that the chamber wall is an attractive condensation sink. Indeed, this value of αp corresponds to competitive kinetic and quasi-equilibrium growth for the parameters of the chamber and predicted oxidation products (see the dimensionless group Ki in Charan et al., 2019).
To understand the extent to which the chamber wall is competitive with the suspended aerosol as a condensation sink, the initial seed surface area concentration was varied for otherwise identical experimental conditions. Figure 2 shows this observed SOA yield, where no vapor-wall-deposition corrections are performed, for a range of initial seed surface area concentrations. Above ∼ 1800 µm2 cm−3, there appears to be little change in the observed SOA yield; thus, we assume that the effect of vapor-wall deposition is minimal.
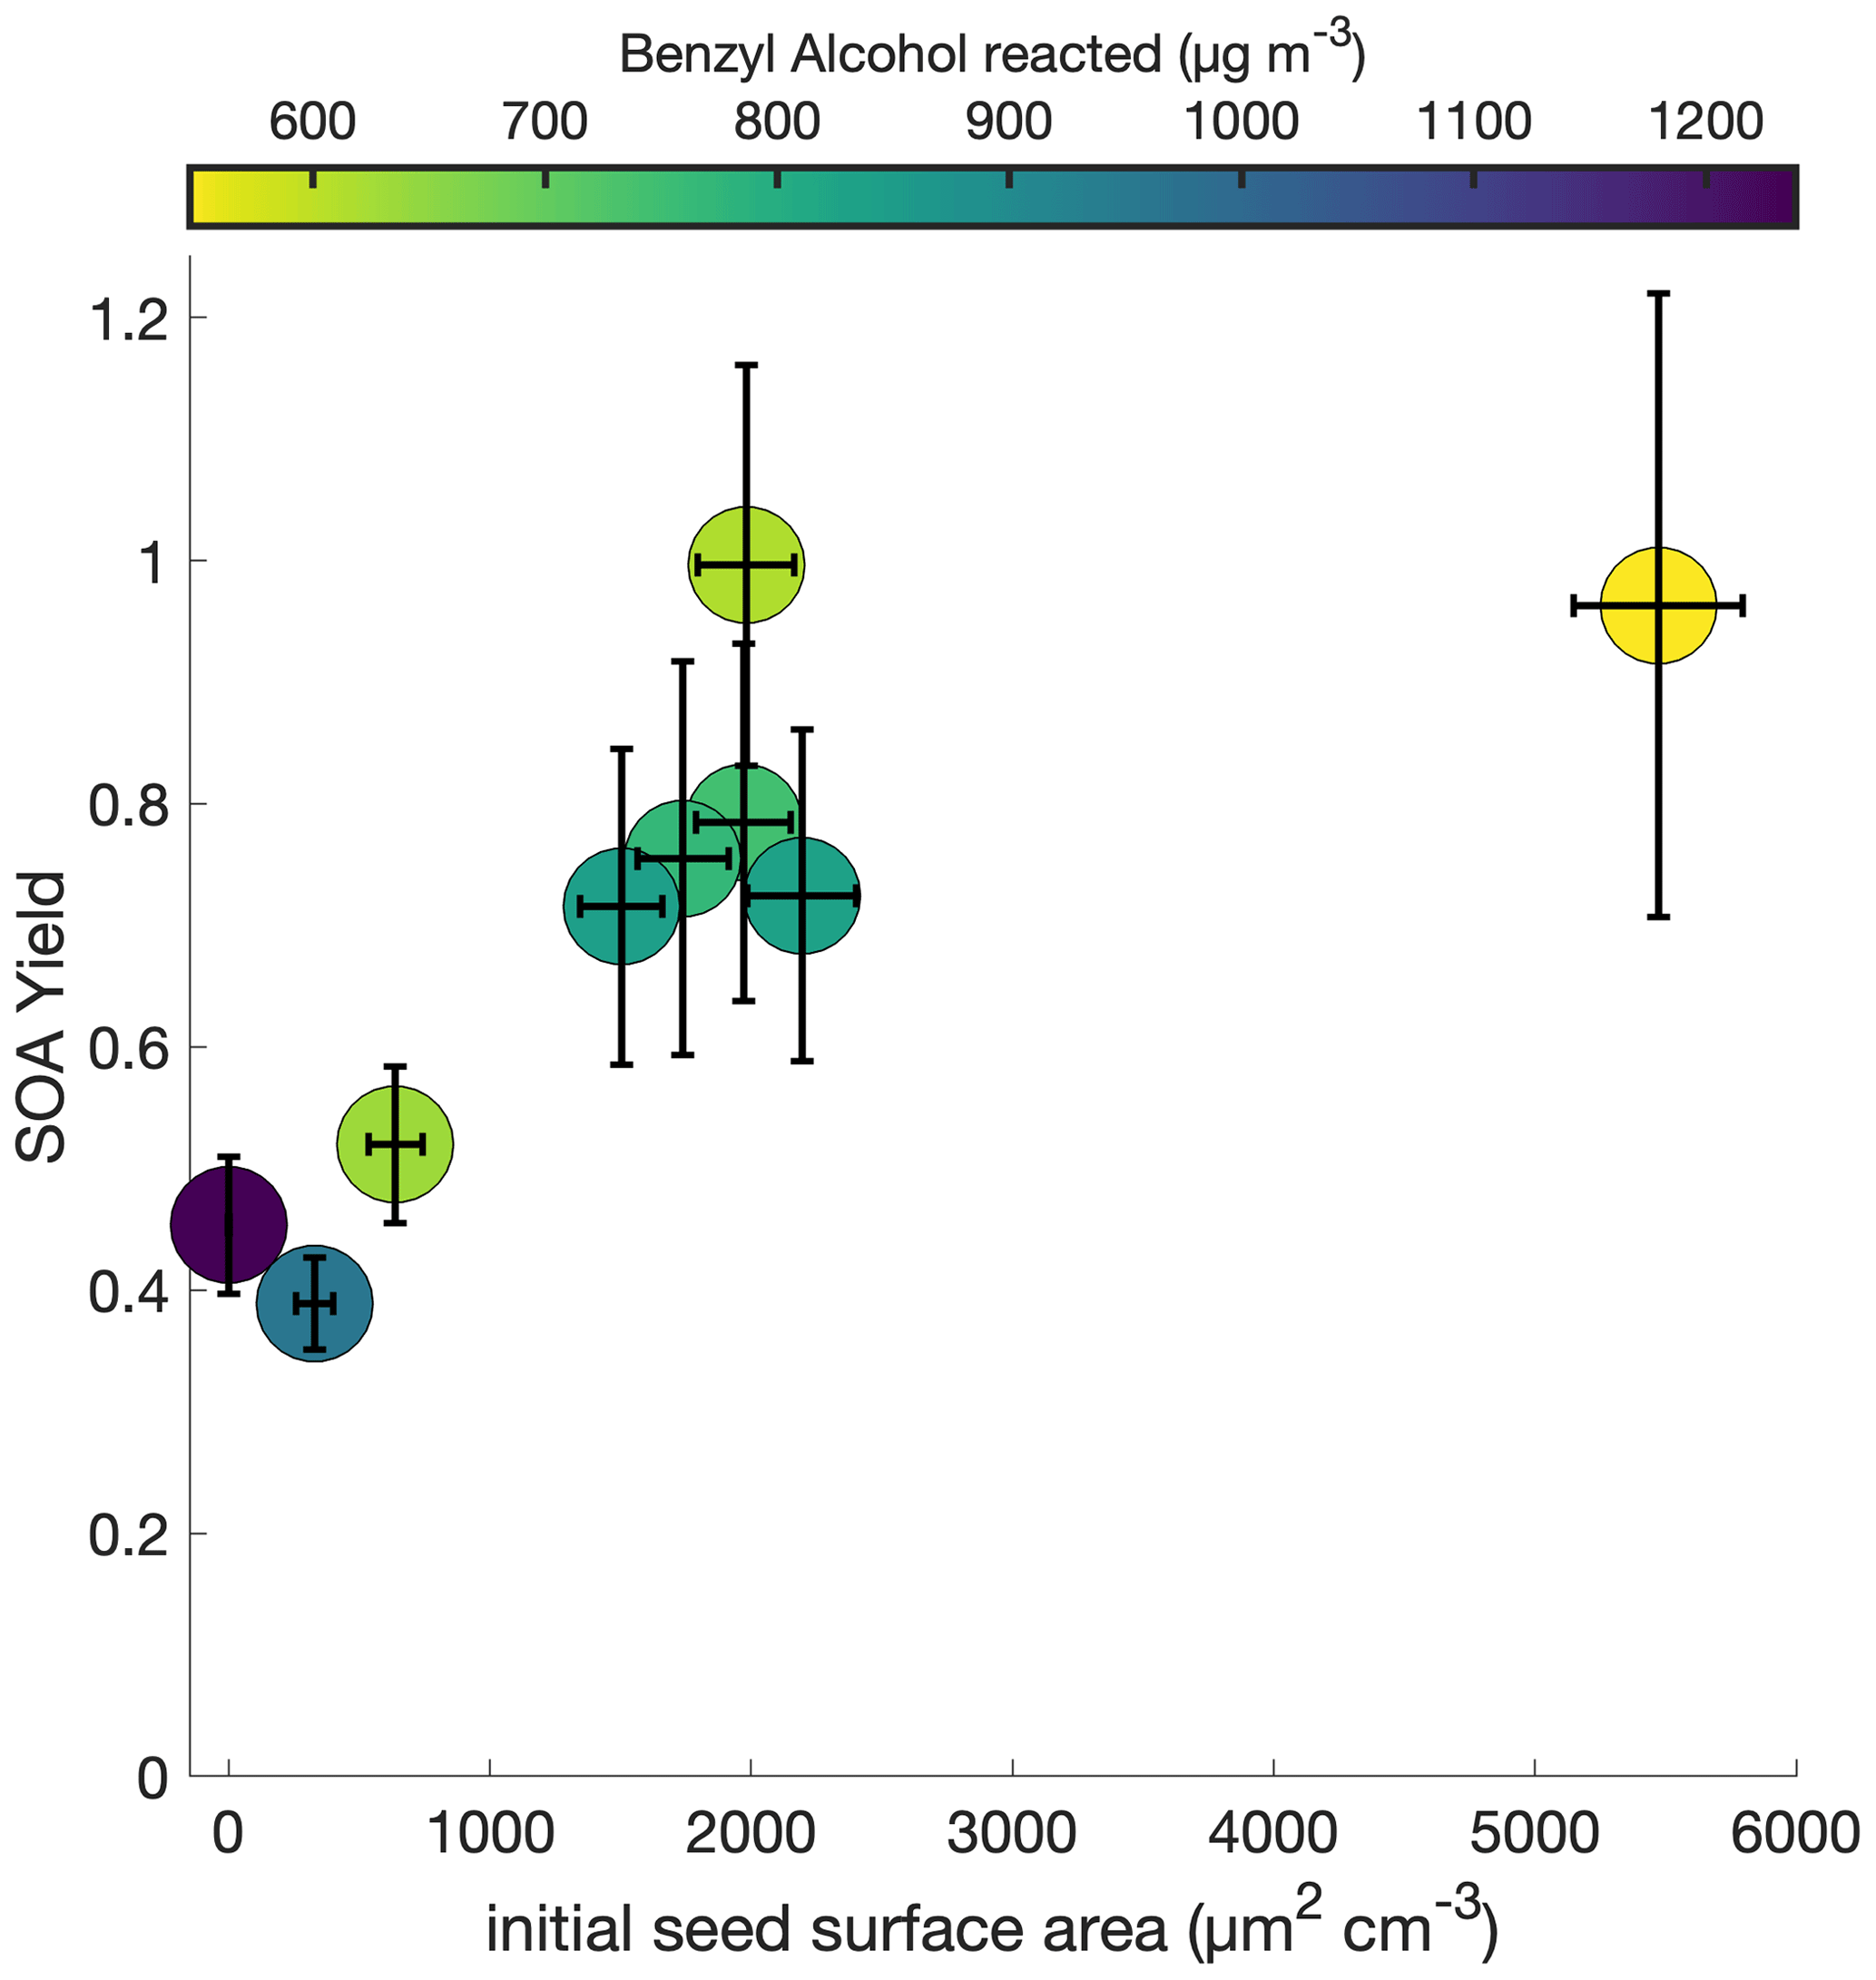
Figure 2Variation in observed benzyl alcohol SOA yield with an initial NO mixing ratio of 80 ppb at 291 K as a function of the amount of benzyl alcohol reacted and the initial aerosol seed surface area. The lack of a difference in the yield over differing seed surface areas above ∼ 1800 µm2 cm−3 indicates that the experiments lie within a regime where the seed surface area does not affect the measured SOA yield.
For each chamber and each chemical system, the initial seed surface area concentration at which the effect of vapor-wall deposition is no longer significant is different: this is a function of, among other factors, the particle–vapor equilibration time, the accommodation coefficient of the gas-phase product to the chamber walls, the chamber dimensions, and the initial precursor concentration (Charan et al., 2019; Zhang et al., 2015).
In theory, the fact that we can neglect the effects of vapor-wall deposition on SOA yield at a temperature of 291 K and an initial NO mixing ratio of ∼ 80 ppb (as is the case for experiments R1–R5 and S1–S4, which are shown in Fig. 2) does not mean that we can neglect the effects for all temperatures and all NO mixing ratios, since different experimental conditions may change the chemistry of the system. However, while the identities and relative ratios of gas-phase products may differ for the different experiments explored in this paper, and hence the propensity to partition into the wall may vary, it is assumed that the products are sufficiently similar that the range at which vapor-wall deposition is considered insignificant remains the same. And, so, we apply the assumption that vapor-wall deposition minimally affects the observed SOA yield at initial seed surface area concentrations above ∼1800 µm2 cm−3 to all experiments in this paper.
3.3 Uncertainties in measured SOA yields
The SOA yield is defined as the ratio of the mass of aerosol formed to the mass of precursor reacted (see Eq. 1). One may overestimate the yield by underestimating the amount of benzyl alcohol reacted or by overestimating the amount of aerosol formed. If the particle-wall-deposition adjustment overcorrects the aerosol formed, it would seem as if a higher yield exists than that in actuality. Table 1 shows the SOA yield that would be calculated assuming that no particles were lost to the chamber walls during the experiment: this is simply the difference between the measured aerosol mass at the end of the experiment and that at the beginning, divided by the total reacted benzyl alcohol mass. Except for experiment R3 and L1, which ran for 12 and 17 h, respectively, the raw particle volumes at the end of the experiments were >80 % of the wall-deposition-corrected volumes. So, even if there are errors in the particle-wall-deposition correction, the SOA yields will still be quite large. For experiment R1, the assumed uncertainty that comes from particle-wall deposition is ∼8 %. This dominates, for ΔSOAmeas, the random and counting error. The total uncertainty in ΔSOAmeas for experiment R1 is, including the uncertainty in the aerosol density, the wall deposition, and the random error, ∼9 %.
Most of the reported uncertainty in the SOA yield comes not from the wall-deposition correction but from the uncertainty in the benzyl alcohol concentration. For experiment R1, the random error in the benzyl alcohol signal, measured during the background collection period, was 15 %. Combined with the uncertainty of the calibration (6 %), this was a 16 % uncertainty. This same error was applied to the concentration of benzyl alcohol measured at the end of the experiment. Since , the uncertainty of Δ[BnOH]meas is 19.5 %.
With the 9 % and 19.5 % uncertainties in ΔSOAmeas and Δ[BnOH]meas, respectively, we get a 21 % uncertainty in the final calculated SOA yield. Most of this comes from the precursor concentration.
Uncertainty from vapor-wall deposition is not included in the calculated error, but any vapor-wall deposition would only decrease the fraction of organic aerosol observed. That is, the true ΔSOAmeas would be larger than the calculated ΔSOAmeas. If experiments were not run at a sufficiently large aerosol surface area concentration to neglect the loss of gas-phase products to the chamber walls, the true SOA yield will only be larger than what is reported here.
4.1 Adsorptive and absorptive aerosol growth
The uptake and growth of aerosol can occur either through adsorption or absorption of oxidation products. Generally, we think of secondary organic aerosol growth as governed by absorption, though adsorption is also possible, especially at the large surface area concentrations used in this study to reduce the effect of vapor-wall deposition. To estimate the relative effects of these two processes, we use the gas–particle partitioning coefficient given by (Pankow, 1994, 1987)
where the first term comes from adsorption and the second from absorption. The absorbent vapor pressure, is in units of atm. If we assume that the molecular weight of the organic material MWom=188 g mol µg mol−1, which is the molecular weight of the major low-volatility oxidation product of benzyl alcohol calculated by Wang (2015); the activity coefficient of a compound in the organic phase is γ=1; and the temperature is T=291 K (matching that in experiment R1), the absorptive term is m3 atm µg−1, where fom is the mass fraction of absorbing organic in the aerosol phase.
The specific surface area of the particulate matter, Atsp, changes little throughout experiment R1. At the beginning of the experiment, when particles are the smallest, Atsp≈0.14 cm2 µg−1. Using Eq. (60) from Pankow (1987), the surface concentration of sorption sites on an adsorbing surface is mol cm−2 for the organic phase and mol cm−2 for ammonium sulfate. Note that the calculation for the organic phase uses ρom=1.4 g cm−3. To get an upper-bound estimate of adsorption, if we take , the adsorptive term is m3 atm µg−1, where ΔQ is the enthalpy difference between desorption from the particle surface and vaporization of the pure liquid and has units of kcal mol−1.
To determine the relative importance of adsorption and absorption, we need ΔQ and fom. For liquid-like adsorption, ΔQ≈0, but for SOA from polycyclic aromatic hydrocarbons rings and organochlorines, ΔQ≈2–4 kcal mol−1 and ΔQ≈1–2 kcal mol−1, respectively (Pankow, 1987; Yamasaki et al., 1982). For experiment R1, fom is 0.1 by 10 min and 0.5 by 1 h. At the end of the experiment, fom=0.8.
Depending on the value of ΔQ, the length into the experiment at which adsorption is insignificant changes. If ΔQ≈0, adsorption will be responsible for <15 % partitioning 10 min into the experiment. If ΔQ≲0.9 kcal mol−1, adsorption will be responsible for <15 % partitioning 1 h into the experiment, and if ΔQ≲1.2 kcal mol−1, adsorption will be responsible for <15 % partitioning at the end of the experiment. Note that, since prior to the commencement of oxidation, no aerosol growth is observed, the seed aerosol neither adsorbs nor absorbs benzyl alcohol.
4.2 Absorptive particle partitioning
If absorption dominates gas–particle partitioning, the SOA yield would depend on the amount of organic material in the aerosol phase (ΔSOAmeas, which varies with fom) if equilibrium growth occurs, as is shown in Fig. 3 (Pankow, 1994; Odum et al., 1996). Traditionally, this partitioning is given by
where a one-product model has n=1 and a two-product model has n=2 (Pankow, 1994; Odum et al., 1996; Ng et al., 2007). The stoichiometric fraction of product i in mass units is αi. Kom,i is the absorptive partitioning coefficient for the organic phase for species i, which is from Eq. (2) (Odum et al., 1996).
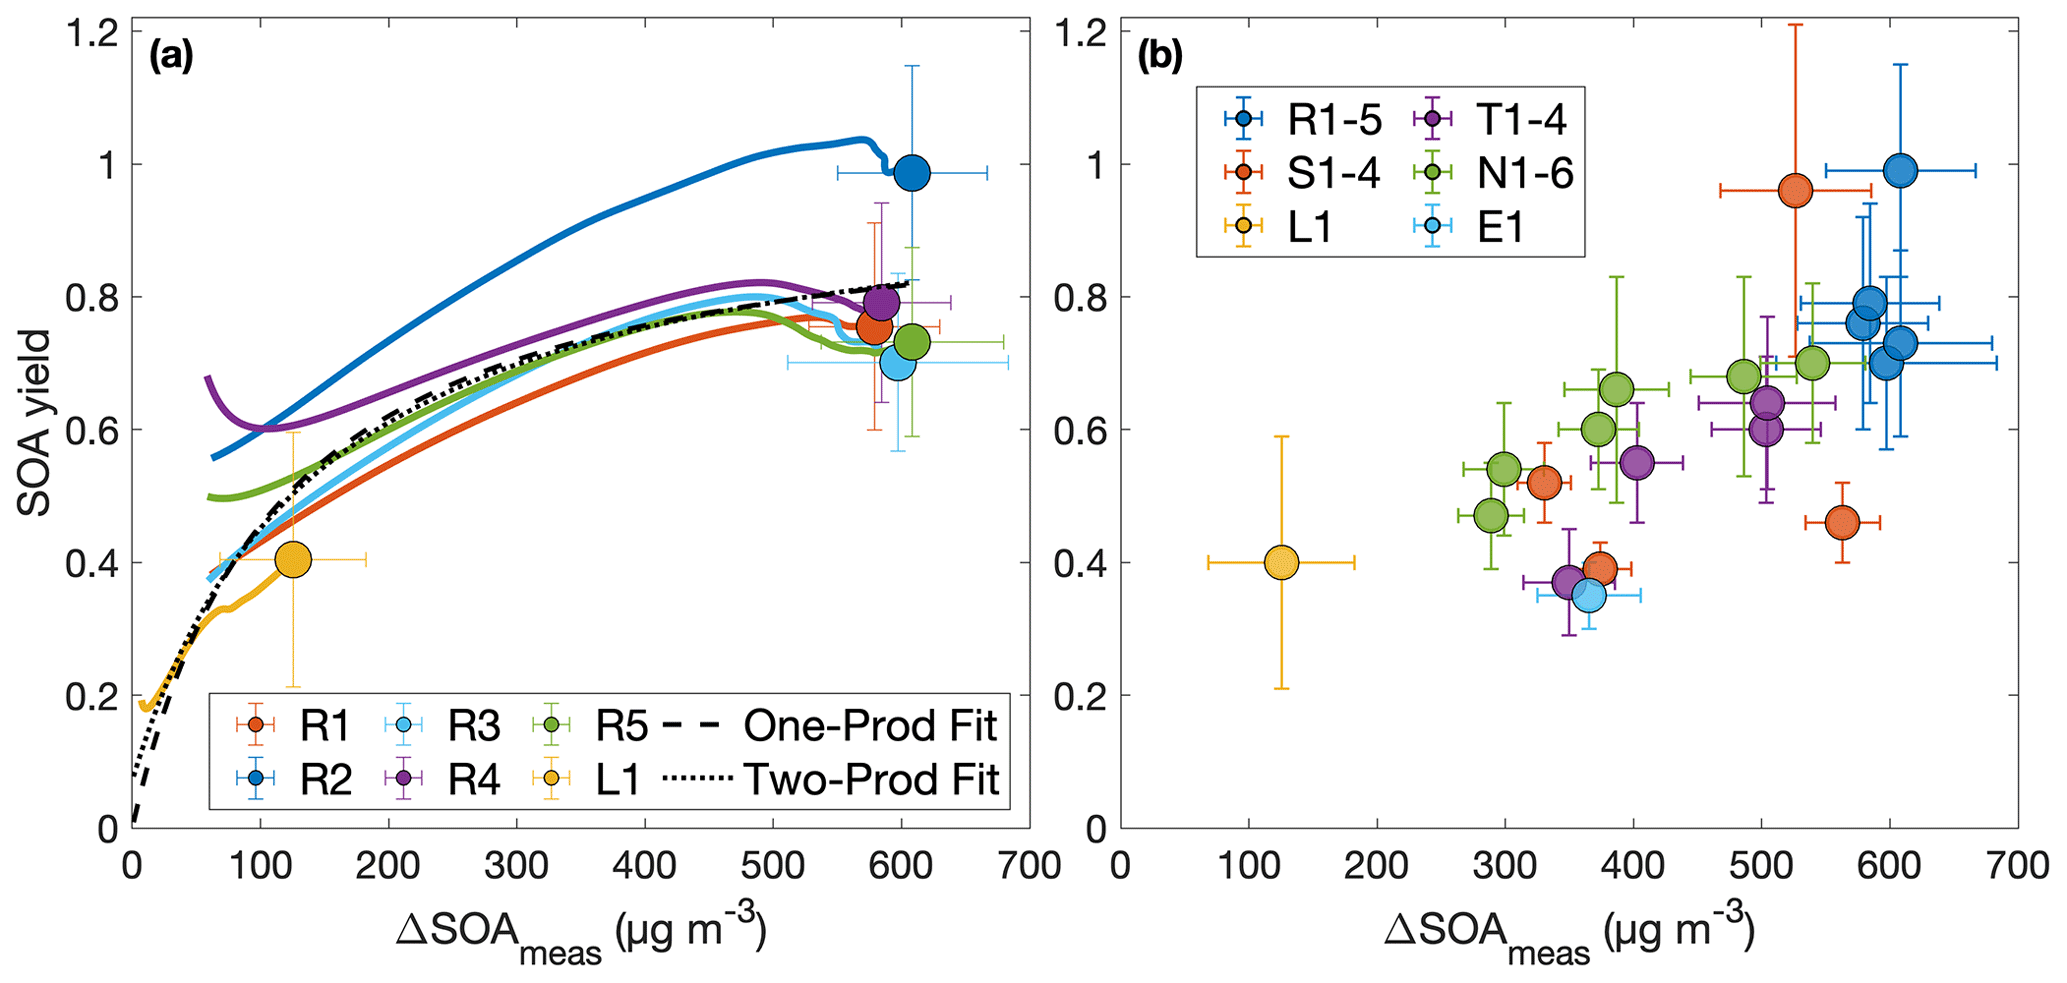
Figure 3Secondary organic aerosol yields as a function of organic aerosol formed (a) throughout experiments performed under similar initial conditions (R1–R5 and L1) and (b) at the end of oxidation for experiments with quantitative SOA yields. In panel (a), the first 30 min of oxidation are removed due to low signal and large uncertainties in SOA yield. Note that the experiment run at a lower oxidation rate (L1) nearly matches the outcomes of those run under otherwise similar conditions (R1–R5), though the discrepancy may be due to the slightly lower temperature of experiment L1 (286 K compared to 291 K). The measured SOA yield appears to depend on the organic aerosol mass concentration, ΔSOAmeas, which indicates that particle partitioning is important for SOA yield determination. Panel (a) also includes a one-product and two-product fit to the data.
The two-product model does not improve from the one-product model (dotted curve in Fig. 3a) but only creates a very large non-volatile compound (Kom≫1) that is formed in very small quantities (α≪1) and the other compound nearly matches the compound found in the one-product optimization. The one-product optimization gives α=0.97 and Kom=0.009 if all points are equally weighted. If we only include the end points, this gives α=1.05 and Kom=0.005.
At ≳500 µg m−3, the SOA yield flattens out. This indicates that, above this ΔSOAmeas, the partitioning coefficients for the oxidative products are sufficiently large (that is, the products are sufficiently non-volatile), that Y approaches α, the gas-phase stoichiometric fraction in mass units for the oxidation products (Ng et al., 2007).
4.3 Time dependence
While, usually, the SOA yield is reported as a single number at the end of an experiment, it can also be understood as a function of time since multiple generations of oxidation products usually exist (Cappa et al., 2013). For example, in the α-pinene system, the SOA yield has been shown to depend on the total hydroxyl radical exposure (Donahue et al., 2012; Wang et al., 2018b). Figure 4 shows, for each experiment, the terminal SOA yield and the bands indicating at which times each of the experiments lie within 10 %, 5 %, and 1 % of the final reported yield. The most atmospherically representative value of α is that to which the experiments converge. For almost all the experiments, the yields appear to have converged sufficiently to justify the reporting of the final yield, though the benzyl alcohol concentration may not yet have all reacted (see Table 1); as more reacts, more aerosol is formed but the SOA yield levels out. Experiments R3 and R5, which were run for considerably longer than other experiments, show that the final SOA yield changed little from earlier in oxidation, when the other experiments were terminated.
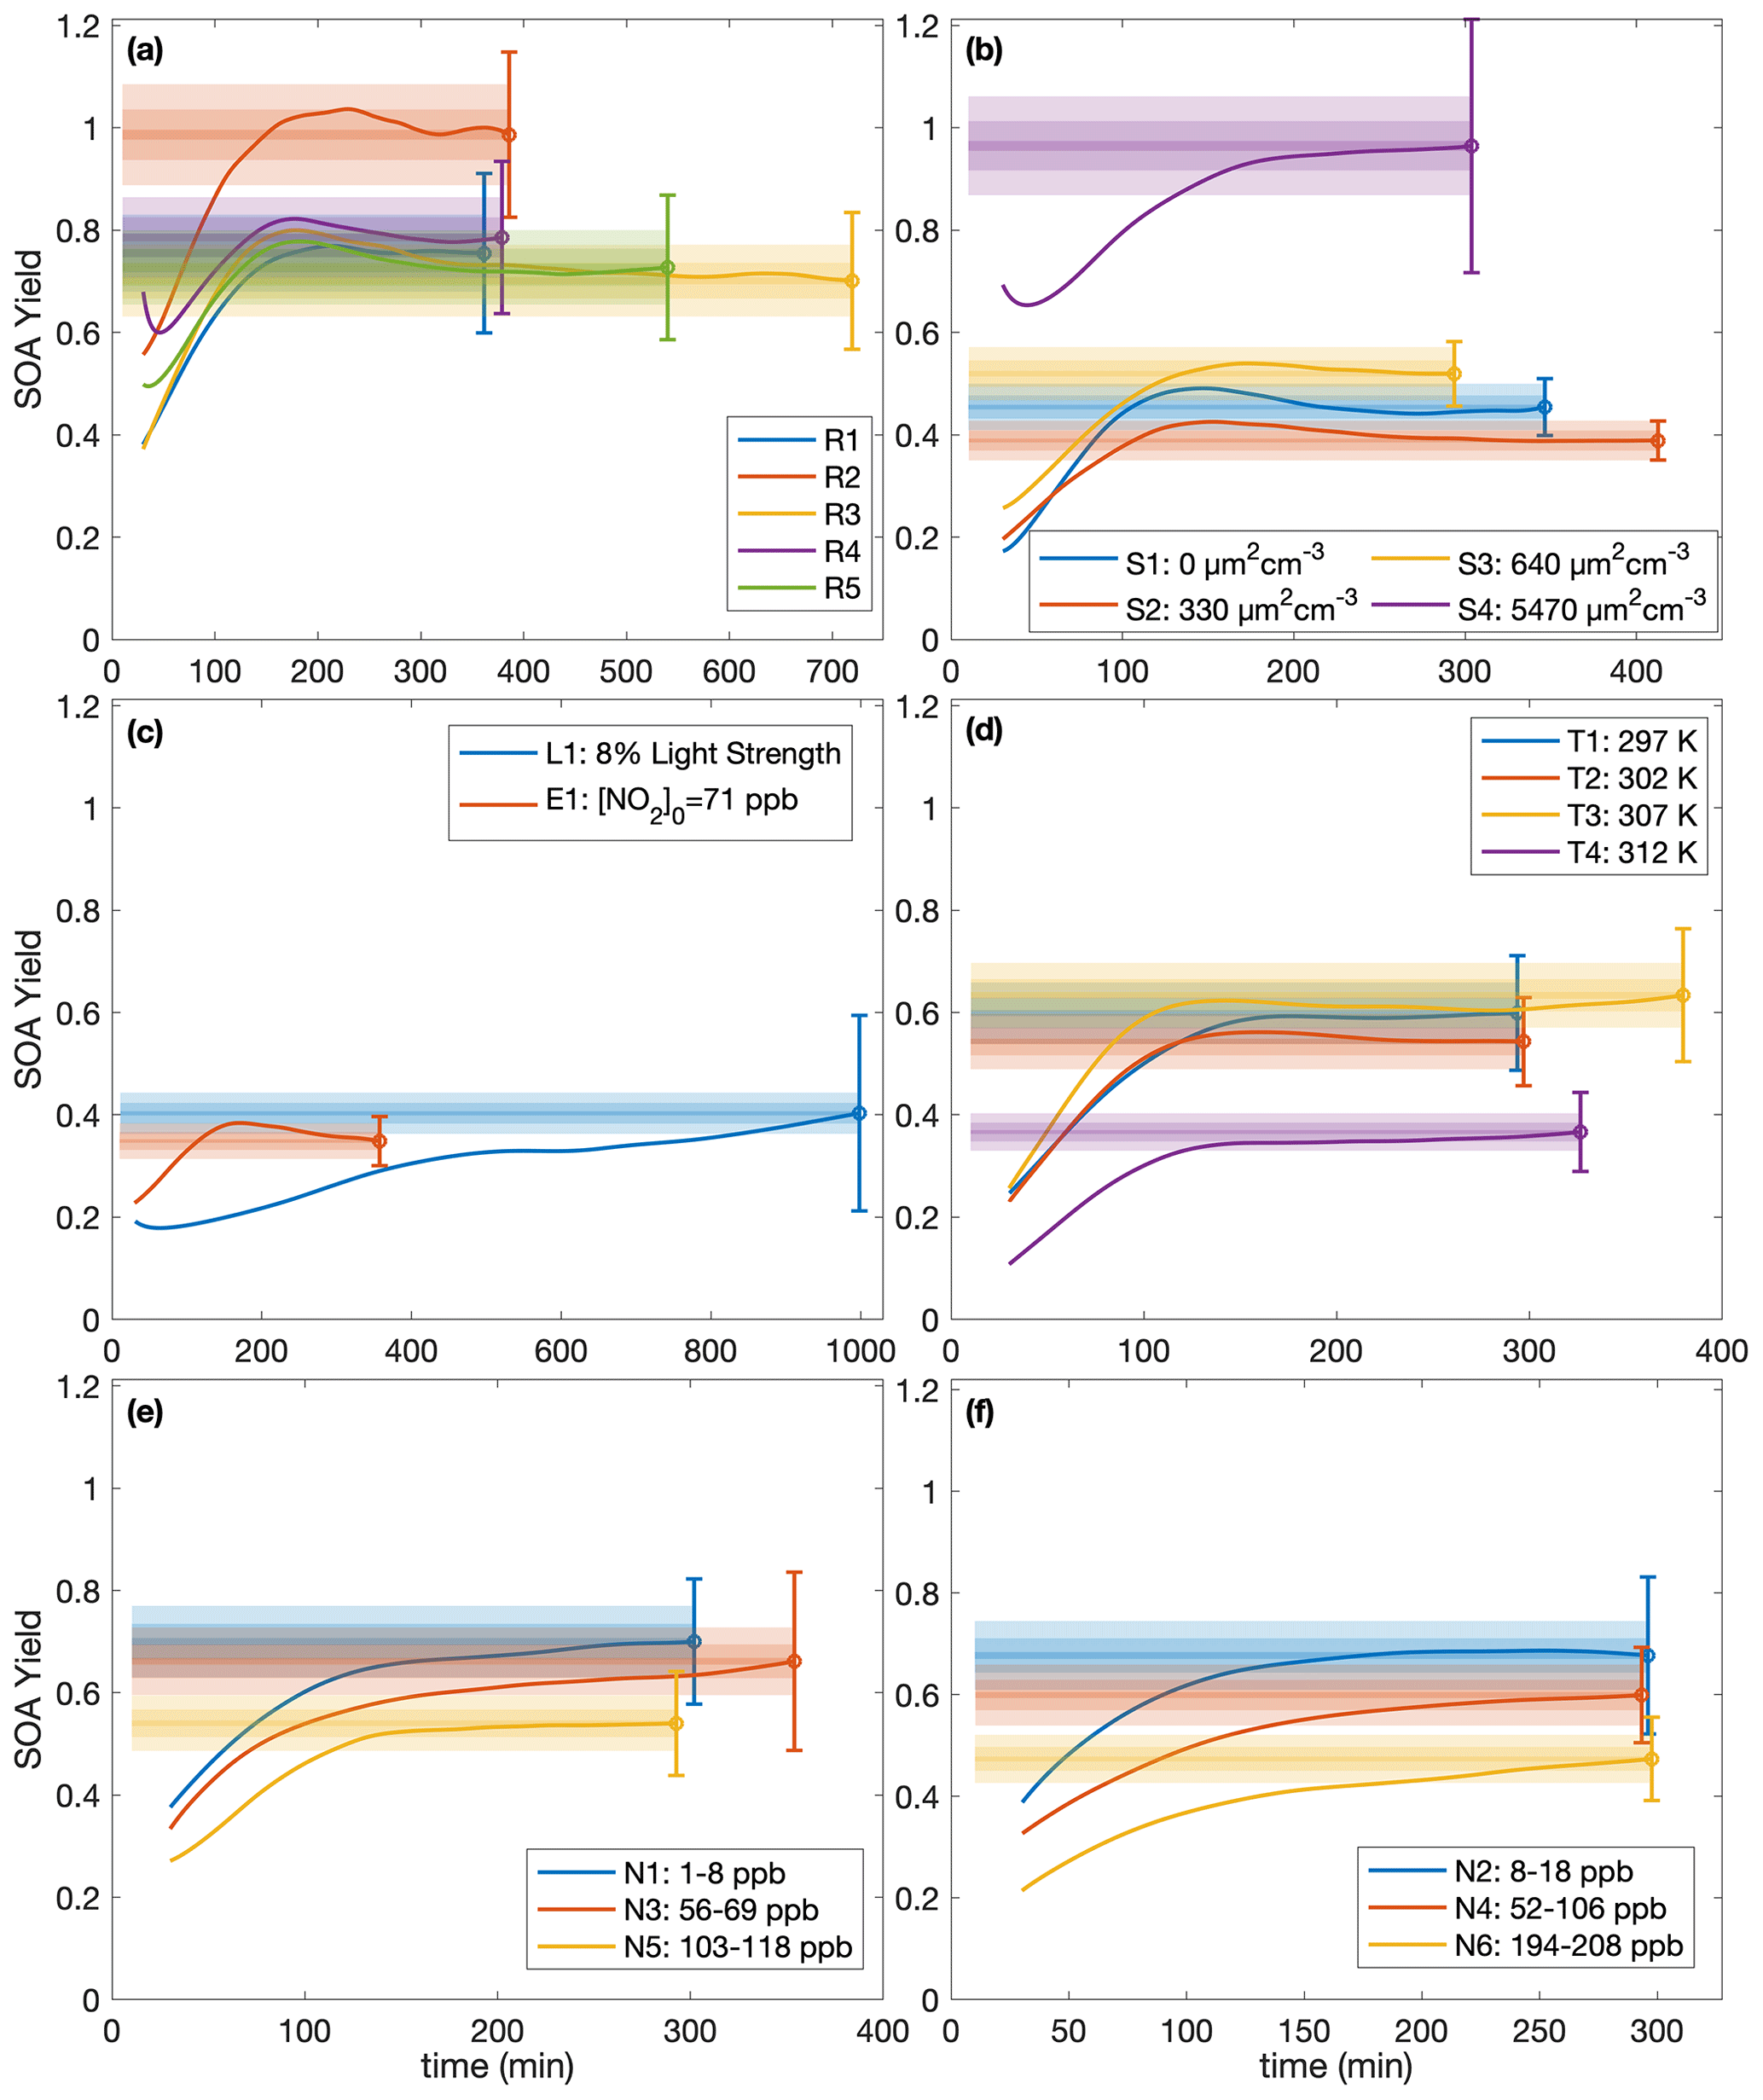
Figure 4SOA yield calculated assuming ω=0 as a function of time for (a) experiments run under approximately identical conditions, (b) different initial surface area experiments, (c) the low-light strength experiment (L1) and the initial NO2 experiment (E1), (d) different temperature experiments, and (e–f) variable constant NO mixing ratio experiments. The measured SOA yields are indicated by the solid line, and the reported end yield is the circle with the reported error bars. The lightest shaded region is ± 10 % of the reported end yield, the medium-shared region is ± 5 %, and the darkest shaded region is ± 1 %. The first 30 min of oxidation are omitted due to low signal and large noise at the beginnings of the experiments.
Note that for experiment L1, also run for considerably longer than the other experiments, the light strength was ∼8 % of that in all the other experiments. At this lower oxidation rate, the SOA yield takes much longer to converge but does appear to be a function of ΔSOAmeas (Fig. 3). This shows that the convergence time depends on the rate of oxidation. Table 1 includes the amount of benzyl alcohol that reacted by the end of the experiment and a first-order exponential fit to the decay (kBnOH+OH[OH]): for all except experiment L1, the kBnOH+OH[OH] is similar, indicating a similar decay. Note that since the exact [OH] is not calculated, kBnOH+OH[OH] is reported assuming that [OH] is constant throughout the experiment.
4.4 Temperature dependence
Figure 5 shows the SOA yield of benzyl alcohol over a range of temperatures, all corresponding to approximately the same initial surface area range (1500–2800 µm2 cm−3) and the same initial NO mixing ratio of ∼80 ppb (see R1–R5 and T1–T4 in Table 1). In general, a lower yield of benzyl alcohol exists at higher temperatures; this is expected due to the decreased volatility of oxidation products at lower temperatures and to the increased rapidity of second-generation reactions, which may potentially form high-volatility fragments before the lower volatility first-generation products have time to partition into the particle phase.
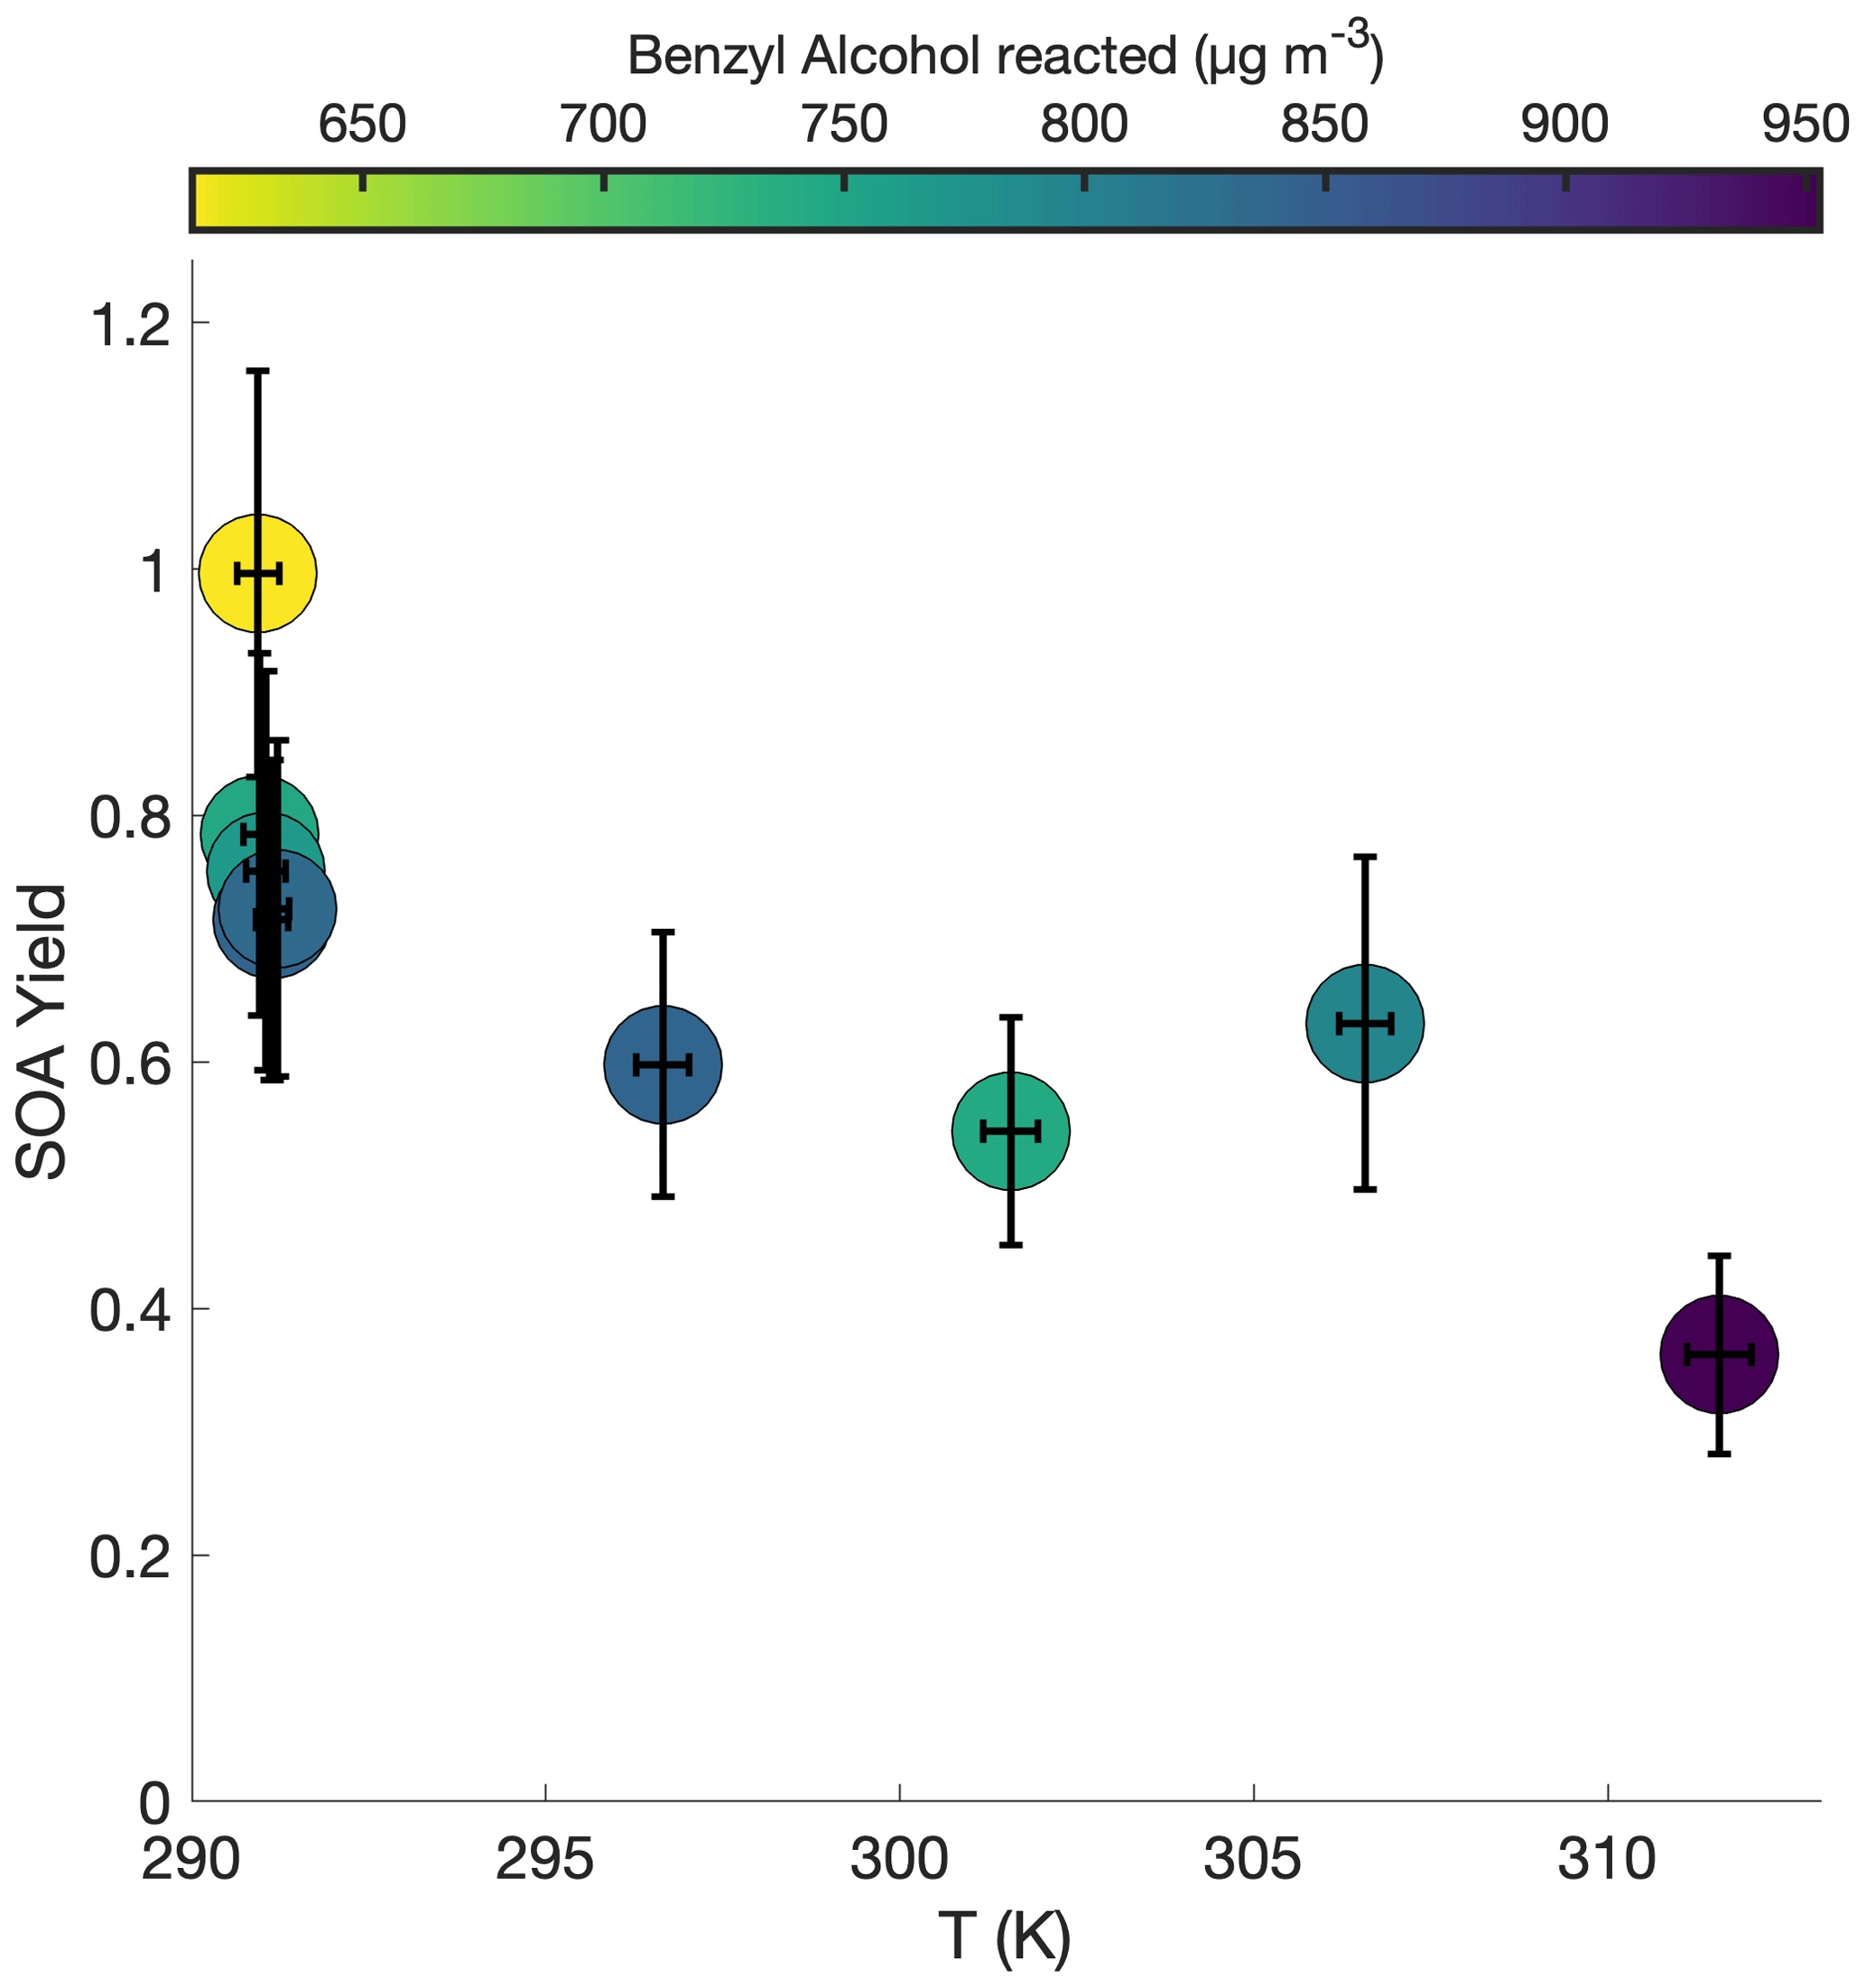
Figure 5Variation in SOA yield over several hours of benzyl alcohol oxidation as a function of temperature with an initial NO mixing ratio of 72 to 81 ppb as a function of the amount of benzyl alcohol reacted for experiments R1–R3 and T1–T4. The color is proportional to the amount of benzyl alcohol that has reacted at the end of the experiment. Experiments began with between 78 and 102 ppb of benzyl alcohol and initial seed surface area concentrations of 1800 to 2900 µm2 cm−3. Error bars are given for the yields at the end of each experiment (experiment lengths are given in Table 1).
At the lowest temperature measured, where one would expect the greatest seed surface area effect (that is, the most competition between the wall and suspended aerosol condensation sinks), we have already determined that we are outside the range of the seed surface area effect (Fig. 2). So, one would not expect that the difference in SOA yield is related to competition with the chamber wall.
A higher SOA yield at lower temperatures is also supported in Fig. 6, which shows how the chemical makeup of the aerosol is different for aerosol formed at different temperatures: the O:C ratio is higher and the H:C ratio is lower on aerosol formed at higher temperatures, meaning that more volatile compounds that might condense at lower temperatures (and have a smaller O:C ratio and a lower H:C ratio) do not condense at the higher temperature (Fig. 6a and c). Though the difference is slight, there is a trend for a larger ratio (Fig. 6b) and, correspondingly, a larger mass fraction of organonitrates at higher temperatures. The former indicates that the organonitrates may be less volatile than other nitrogen-containing compounds that may condense into the aerosol phase (including, potentially, inorganic ammonium nitrate). The latter suggests that the gas-phase branching may be different. It may be that fewer organonitrates are formed at lower temperatures.
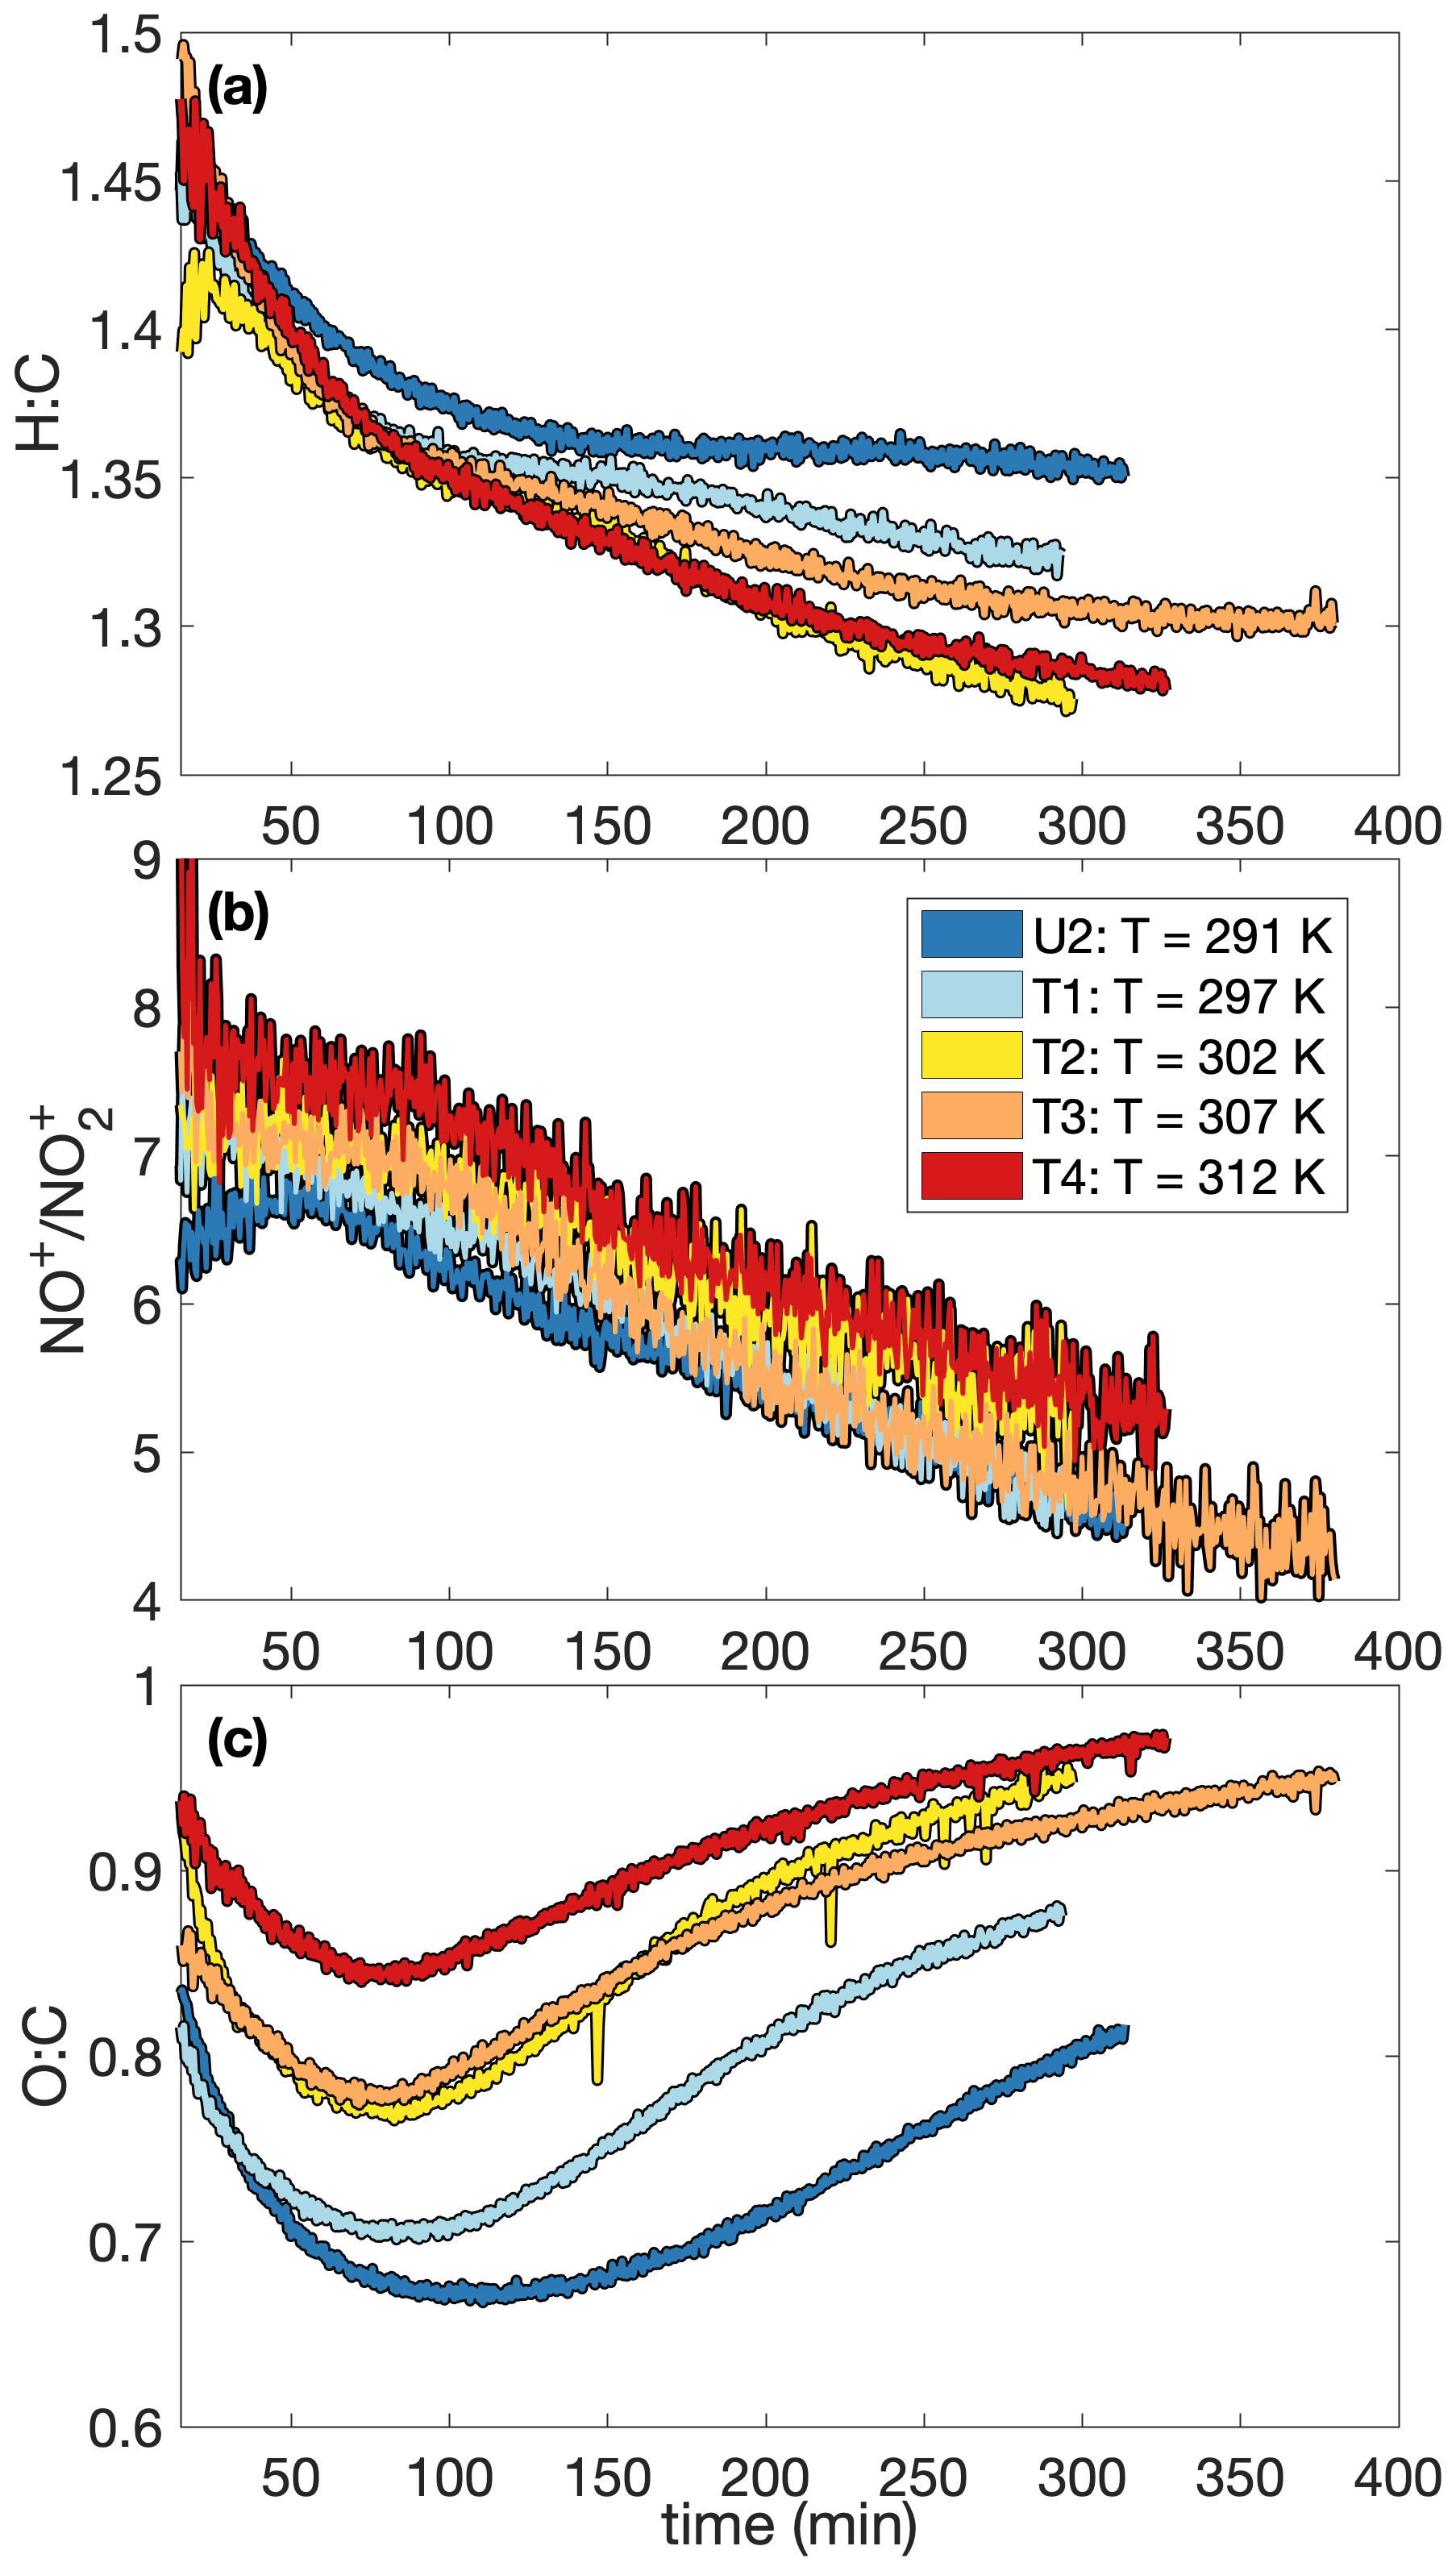
Figure 6Variation in (a) the hydrogen-to-carbon atomic ratio, (b) the ratio, and (c) the oxygen-to-carbon atomic ratio indicate that the difference in SOA yield observed at different temperatures might be a result of chemical differences in the aerosol formed. At higher temperatures, O:C ratios are larger and H:C ratios tend to be smaller. There is also a slight increase in the ratio with temperature. Absolute uncertainties are 13 % and 28 % for the H:C and O:C ratios, respectively. Since the ratios are relevant only when there is a sufficient amount of aerosol present, the first 15 min after oxidation are not shown. A SOA yield is not calculated for experiment U2 due to uncertainties in the rate of particle-wall deposition, but that should not affect the chemical composition of the aerosol.
If Eq. (3) governs the SOA yield curve, then one would expect the curve to asymptotically approach α as ΔSOAmeas increases. The partitioning coefficient Kom is explicitly temperature dependent, but α is temperature dependent only insofar as the oxidation products preferred for formation change with temperature. In Fig. 7, the flattening out of the SOA yield curves indicates that it is α (and not just Kom) that changes with temperature. This points to a change in chemistry accounting for the difference in SOA yields at different temperatures.
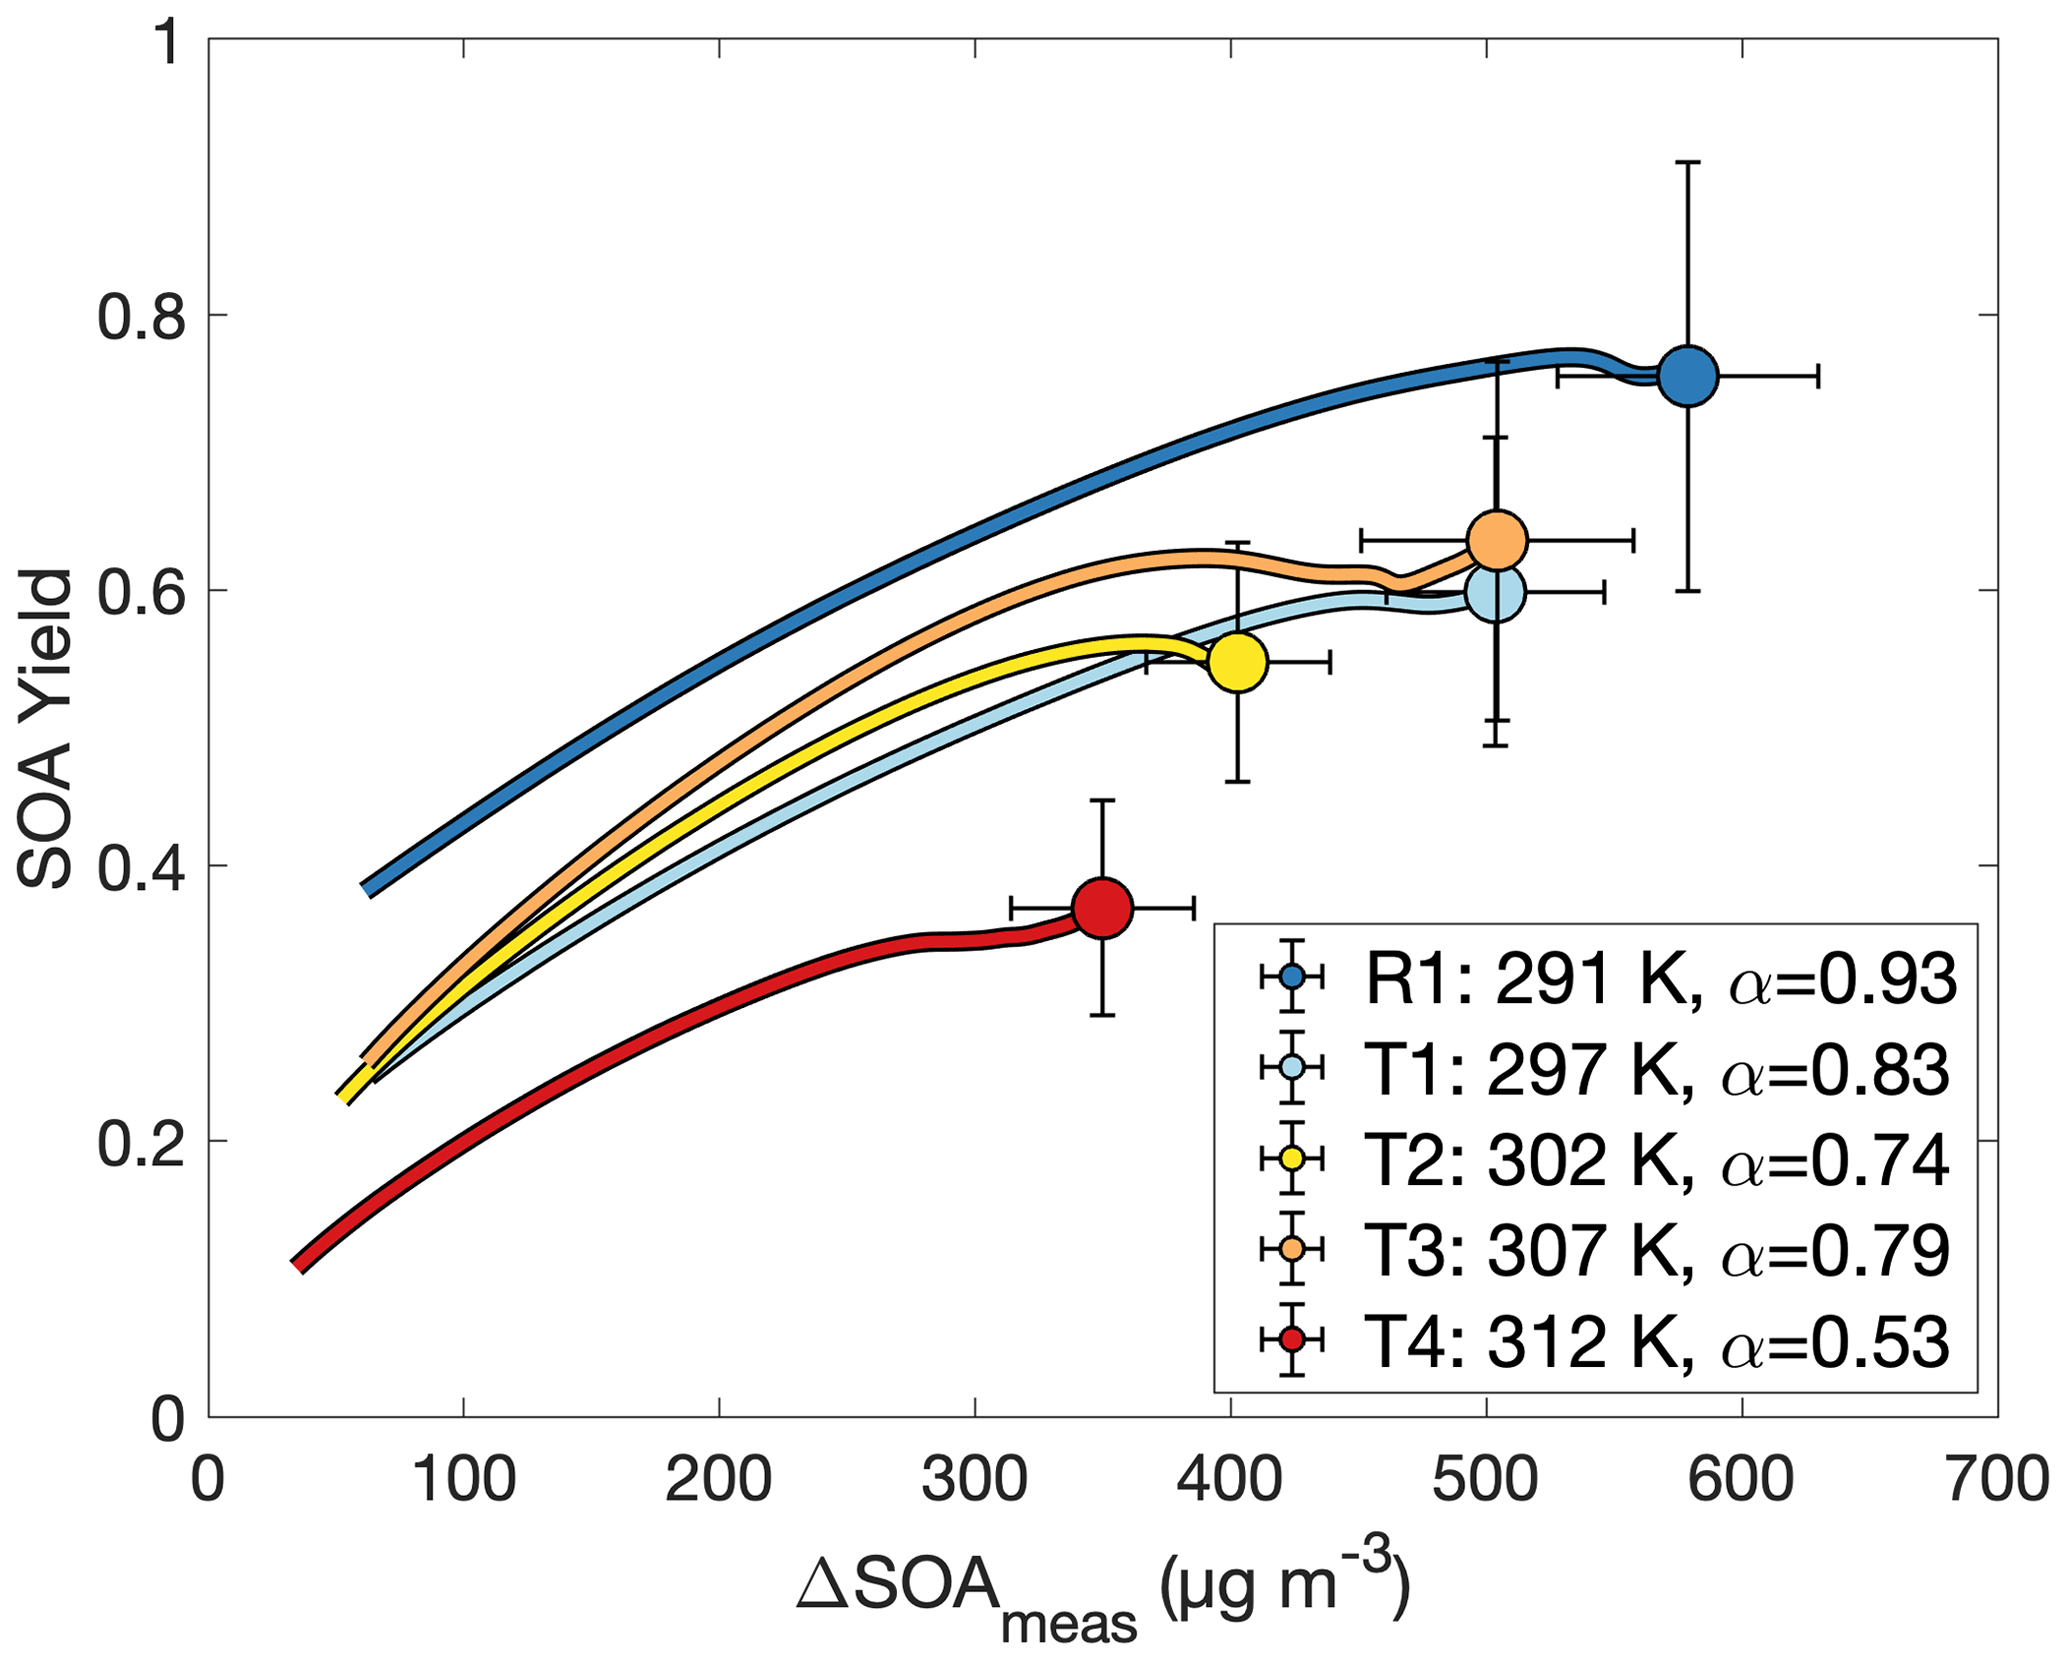
Figure 7Secondary organic aerosol yields as a function of organic aerosol formed for experiments R1 and T1–T4, all run at different temperatures and otherwise similar initial conditions. The value of α is from a fit to a two-parameter fit to Eq. (3) (Kom is not shown). Data are shown only after 30 min into the experiment to minimize the error from noise at the beginning of oxidation.
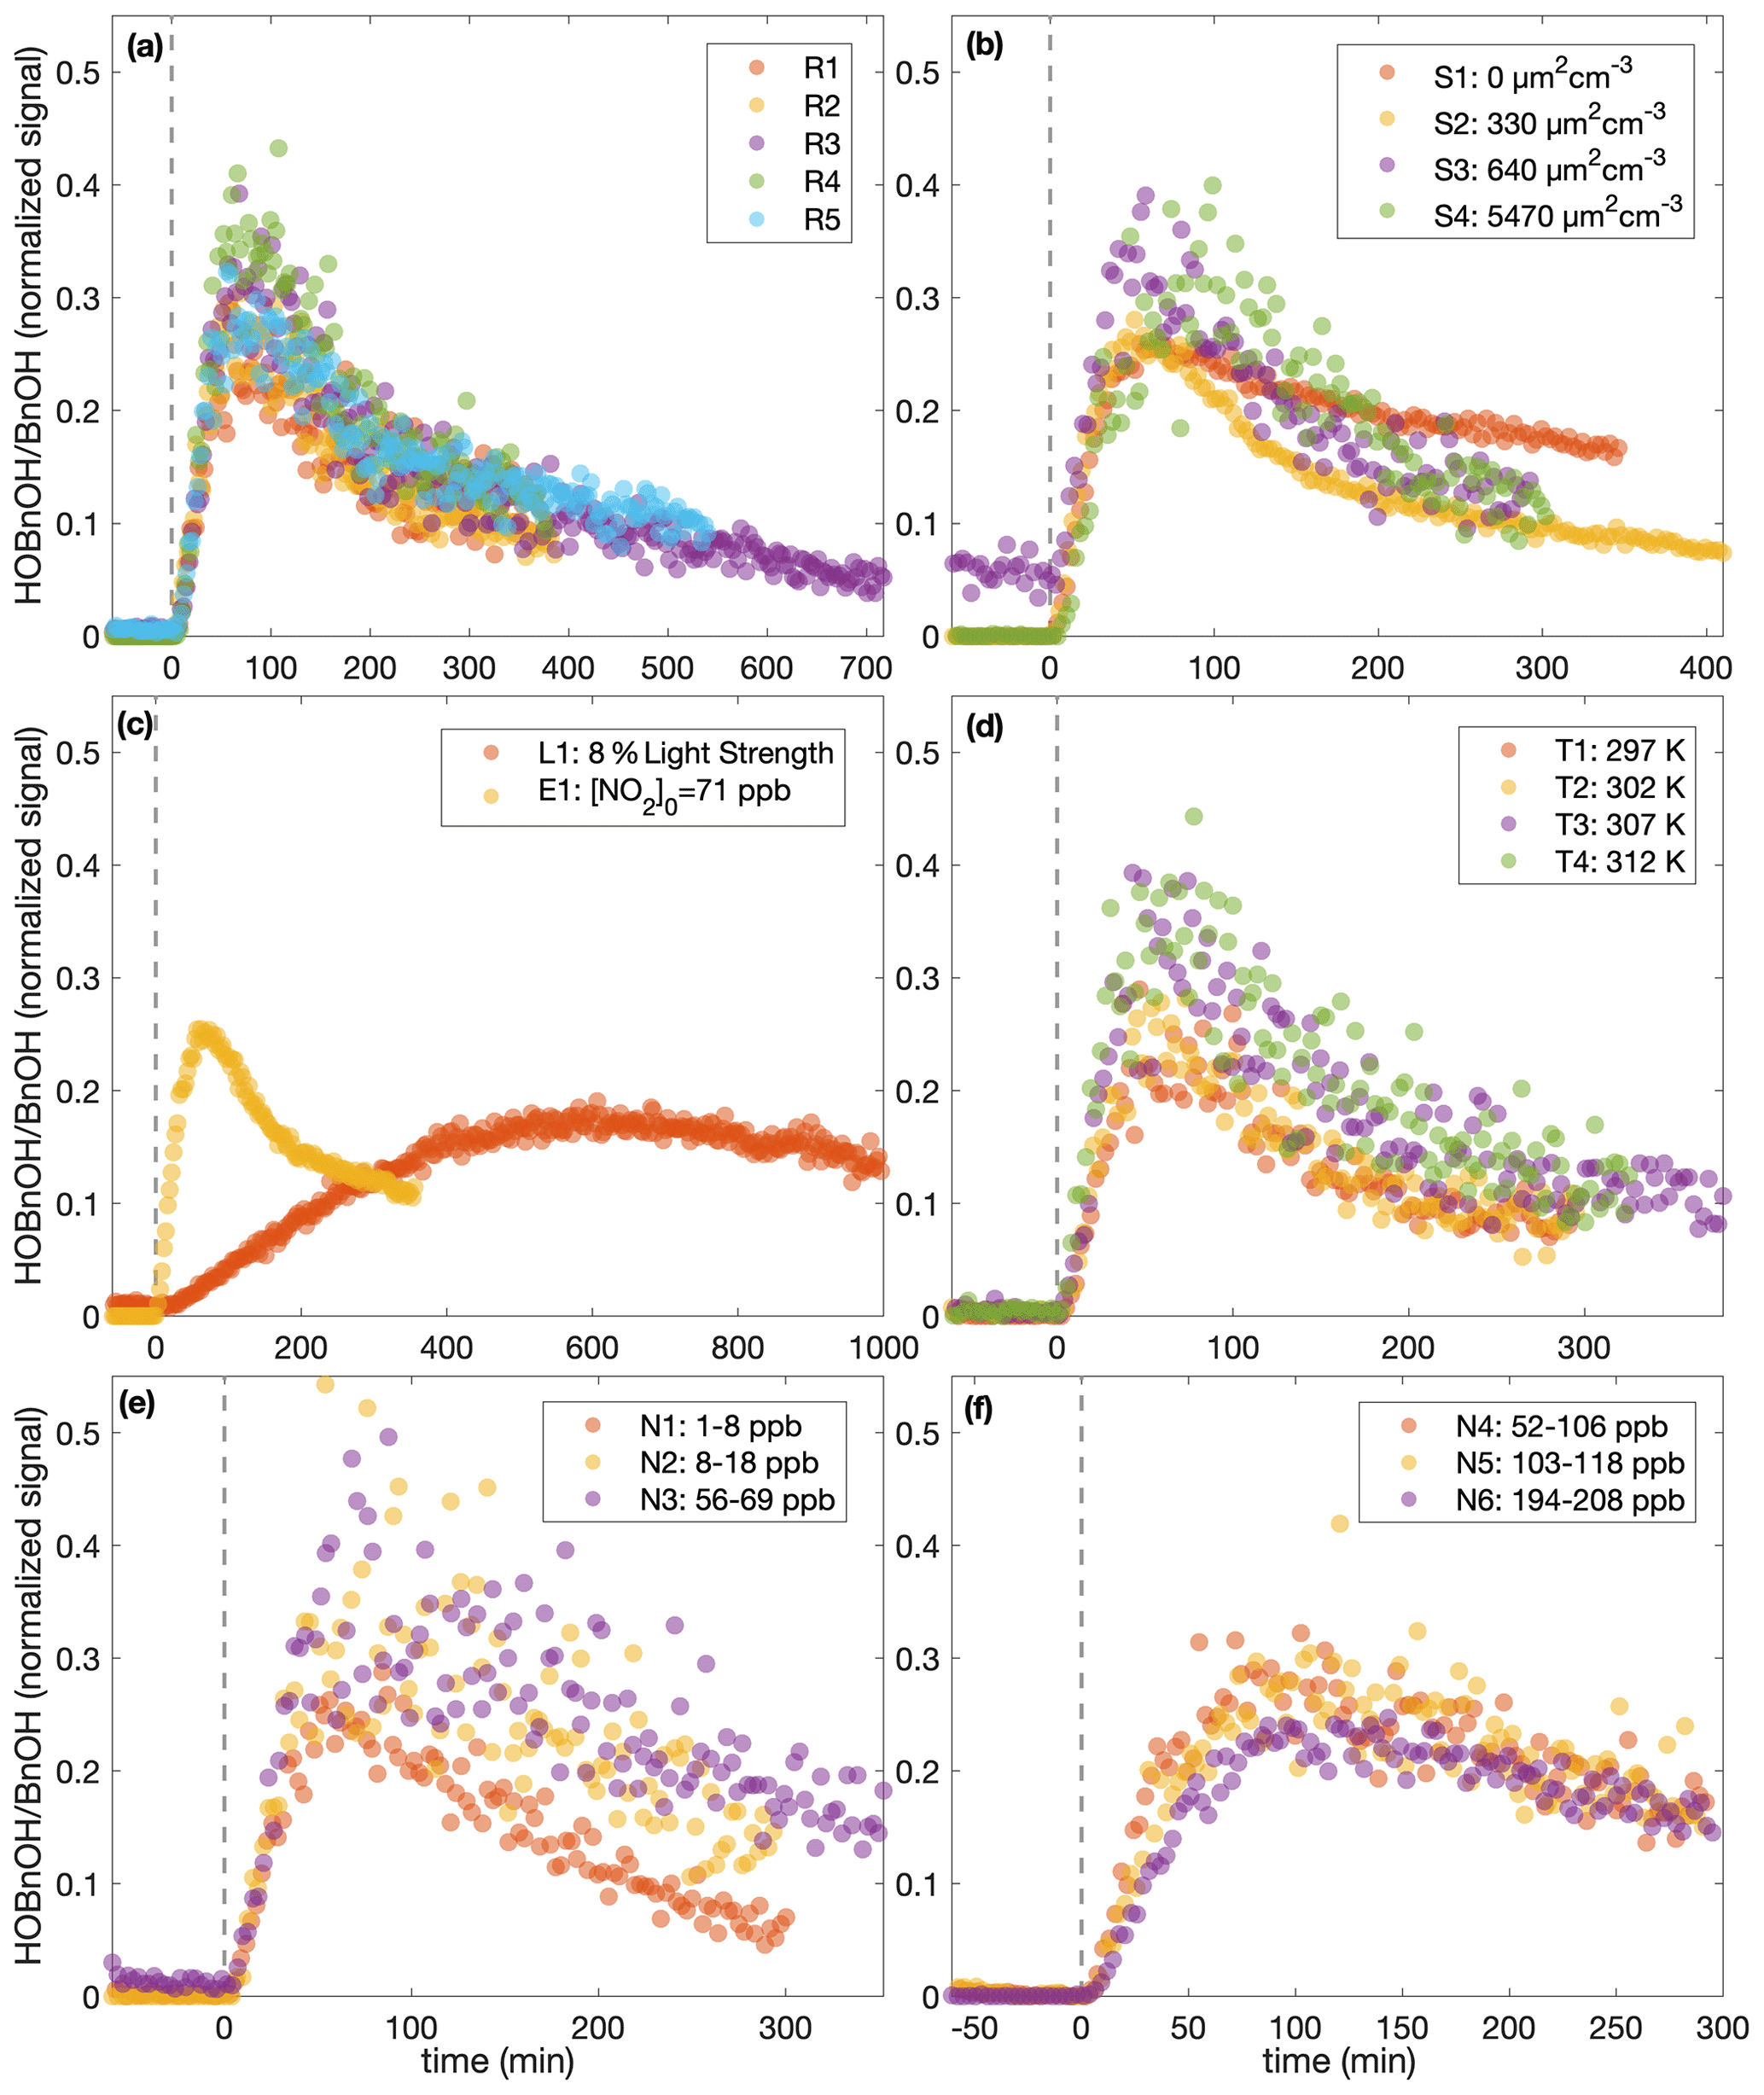
Figure 8The normalized hydroxybenzyl alcohol (HOBnOH) signal divided by the initial normalized benzyl alcohol signal (as calculated during the background collection period) for (a) similar experiments (R1–R5), (b) different initial surface experiments (S1–S4), (c) the low-light strength experiment (L1) and the initial NO2 experiment (E1), (d) different temperature experiments (T1–T4), (e) low constant NO mixing ratio experiments (N1–N3), and (f) high constant NO mixing ratio experiments (N4–N6). The horizontal axis indicates the time from the beginning of oxidation. For all except experiment L1, the light strength was identical. Note that the random error in the initial benzyl alcohol mixing ratio is on the order of 10 %.
This difference in chemistry accounting for the difference observed in the SOA yield is also supported by observations in the gas phase. The gas-phase concentration of hydroxybenzyl alcohol (HOBnOH) has a molar mass of 124 g mol−1 and is detected at M+19, corresponding to the addition of F− (Schwantes et al., 2017b). This signal normalized to the reactant ion signal by the initial benzyl alcohol concentration (expressed in signal normalized to reactant ion signal) for each of the experiments described here is given in Fig. 8. Note that this is, essentially, the HOBnOH concentration divided by the initial benzyl alcohol concentration. The temporal evolution of HOBnOH for nearly identical experiments is fairly reproducible, as shown in Fig. 8a. The formation of HOBnOH or the rate at which it reacts away seems to increase slightly at higher temperatures (Fig. 8d), which also indicates that it is a change in chemical composition that accounts for changes in the SOA yield.
4.5 Nitric oxide mixing ratio dependence
To probe the different chemical pathways that form, the SOA yield dependence on variable NO concentrations was investigated (Fig. 9). NO mixing ratios were maintained throughout experiments N1–N6 and U6, leading to an increase in the total NOx in the system. NOx increased by ∼ 60 ppb for experiment N1 and ∼ 100–200 ppb for experiments N2–N6 and U6. Generally, the SOA yield seems to decrease with increased NO concentration.
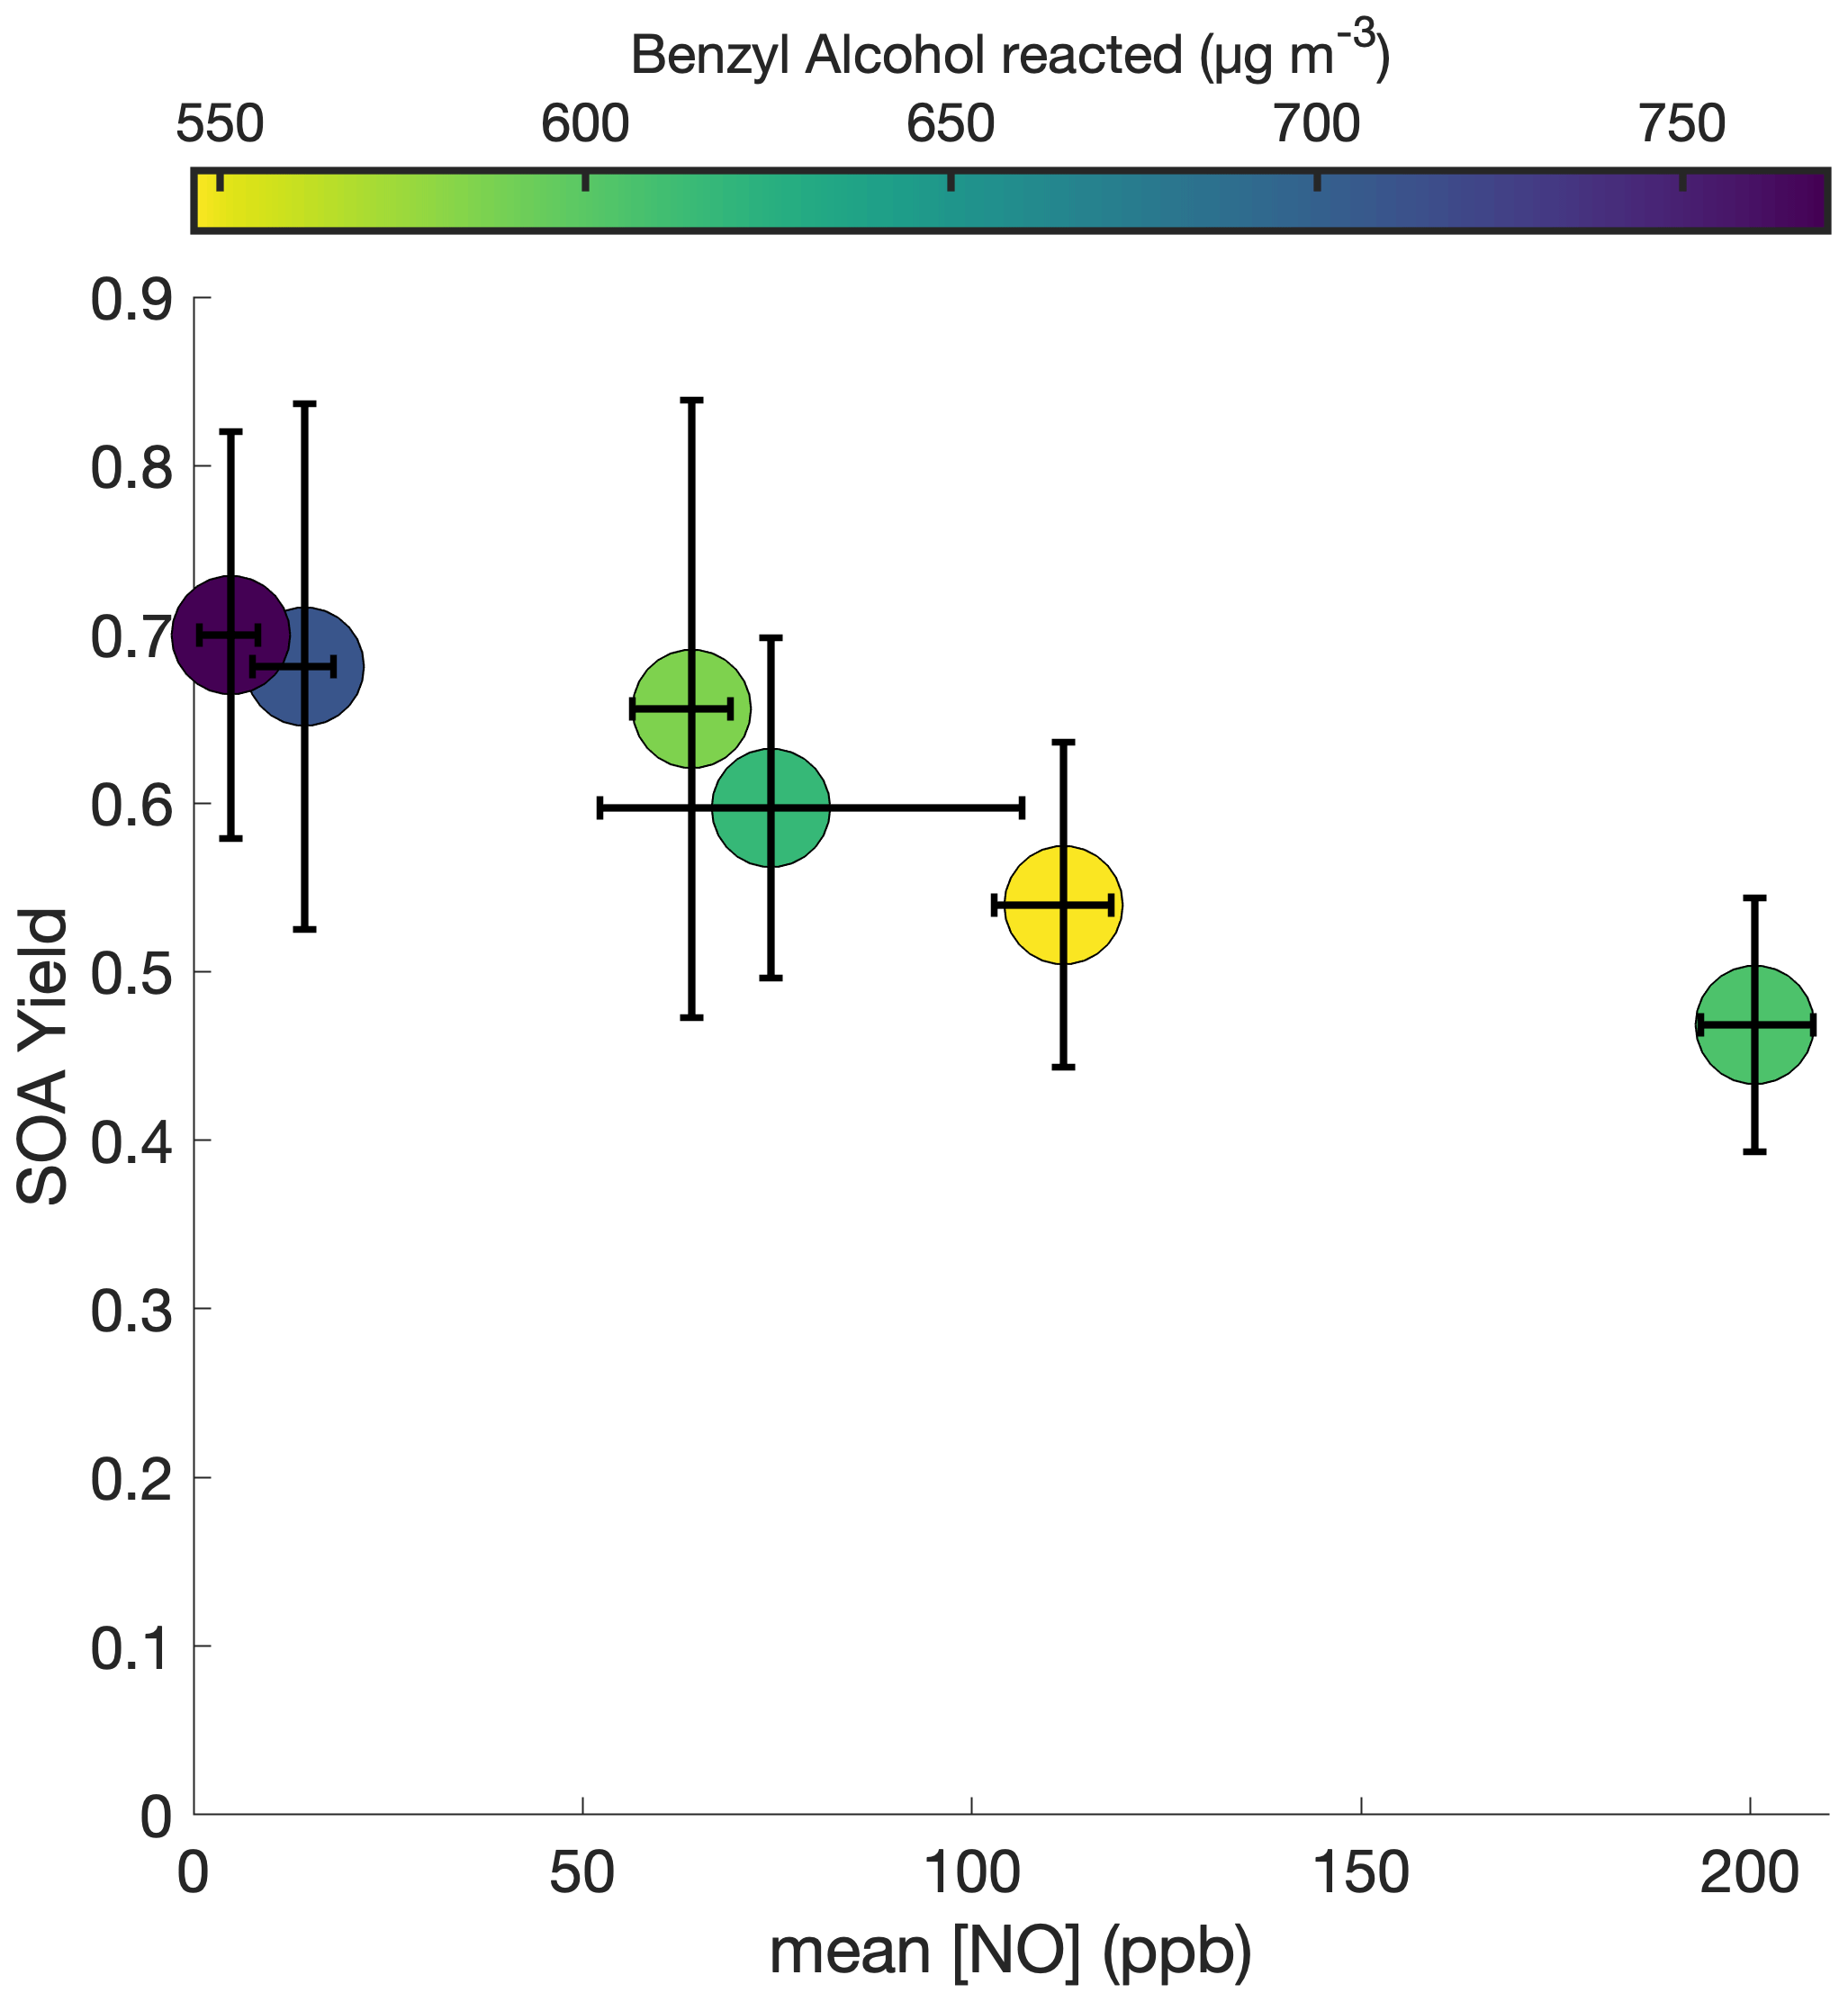
Figure 9SOA yield under different constant [NO] conditions for experiments N1–N6. To maintain the desired NO mixing ratio, NO was injected throughout these experiments at varying rates. All experiments were performed at 291 K, with initial benzyl alcohol mixing ratios between 70 and 82 ppb, and with initial seed surface area concentrations of 1800 to 2900 µm2 cm−3. The x-axis error bars show the full range of NO concentrations experienced throughout the experiment.
As shown in Fig. 10c, there are also larger O:C ratios after ∼ 2 h of oxidation for the lower NO mixing ratios (N1, N2, and N4). Note that experiment N4 appears to behave more similarly to N1–N2 than to N5–N6 and U6; the control on the NO mixing ratio for N4 was much less successful than for the other constant NO experiments (see the error bars in Fig. 9). While the [NO] throughout experiment N4 was, on average, 74 ppb, it was only 62 ppb on average during the first 3 h of oxidation (experiment N3 had an average [NO] of 62 ppb during the first 3 h of oxidation).
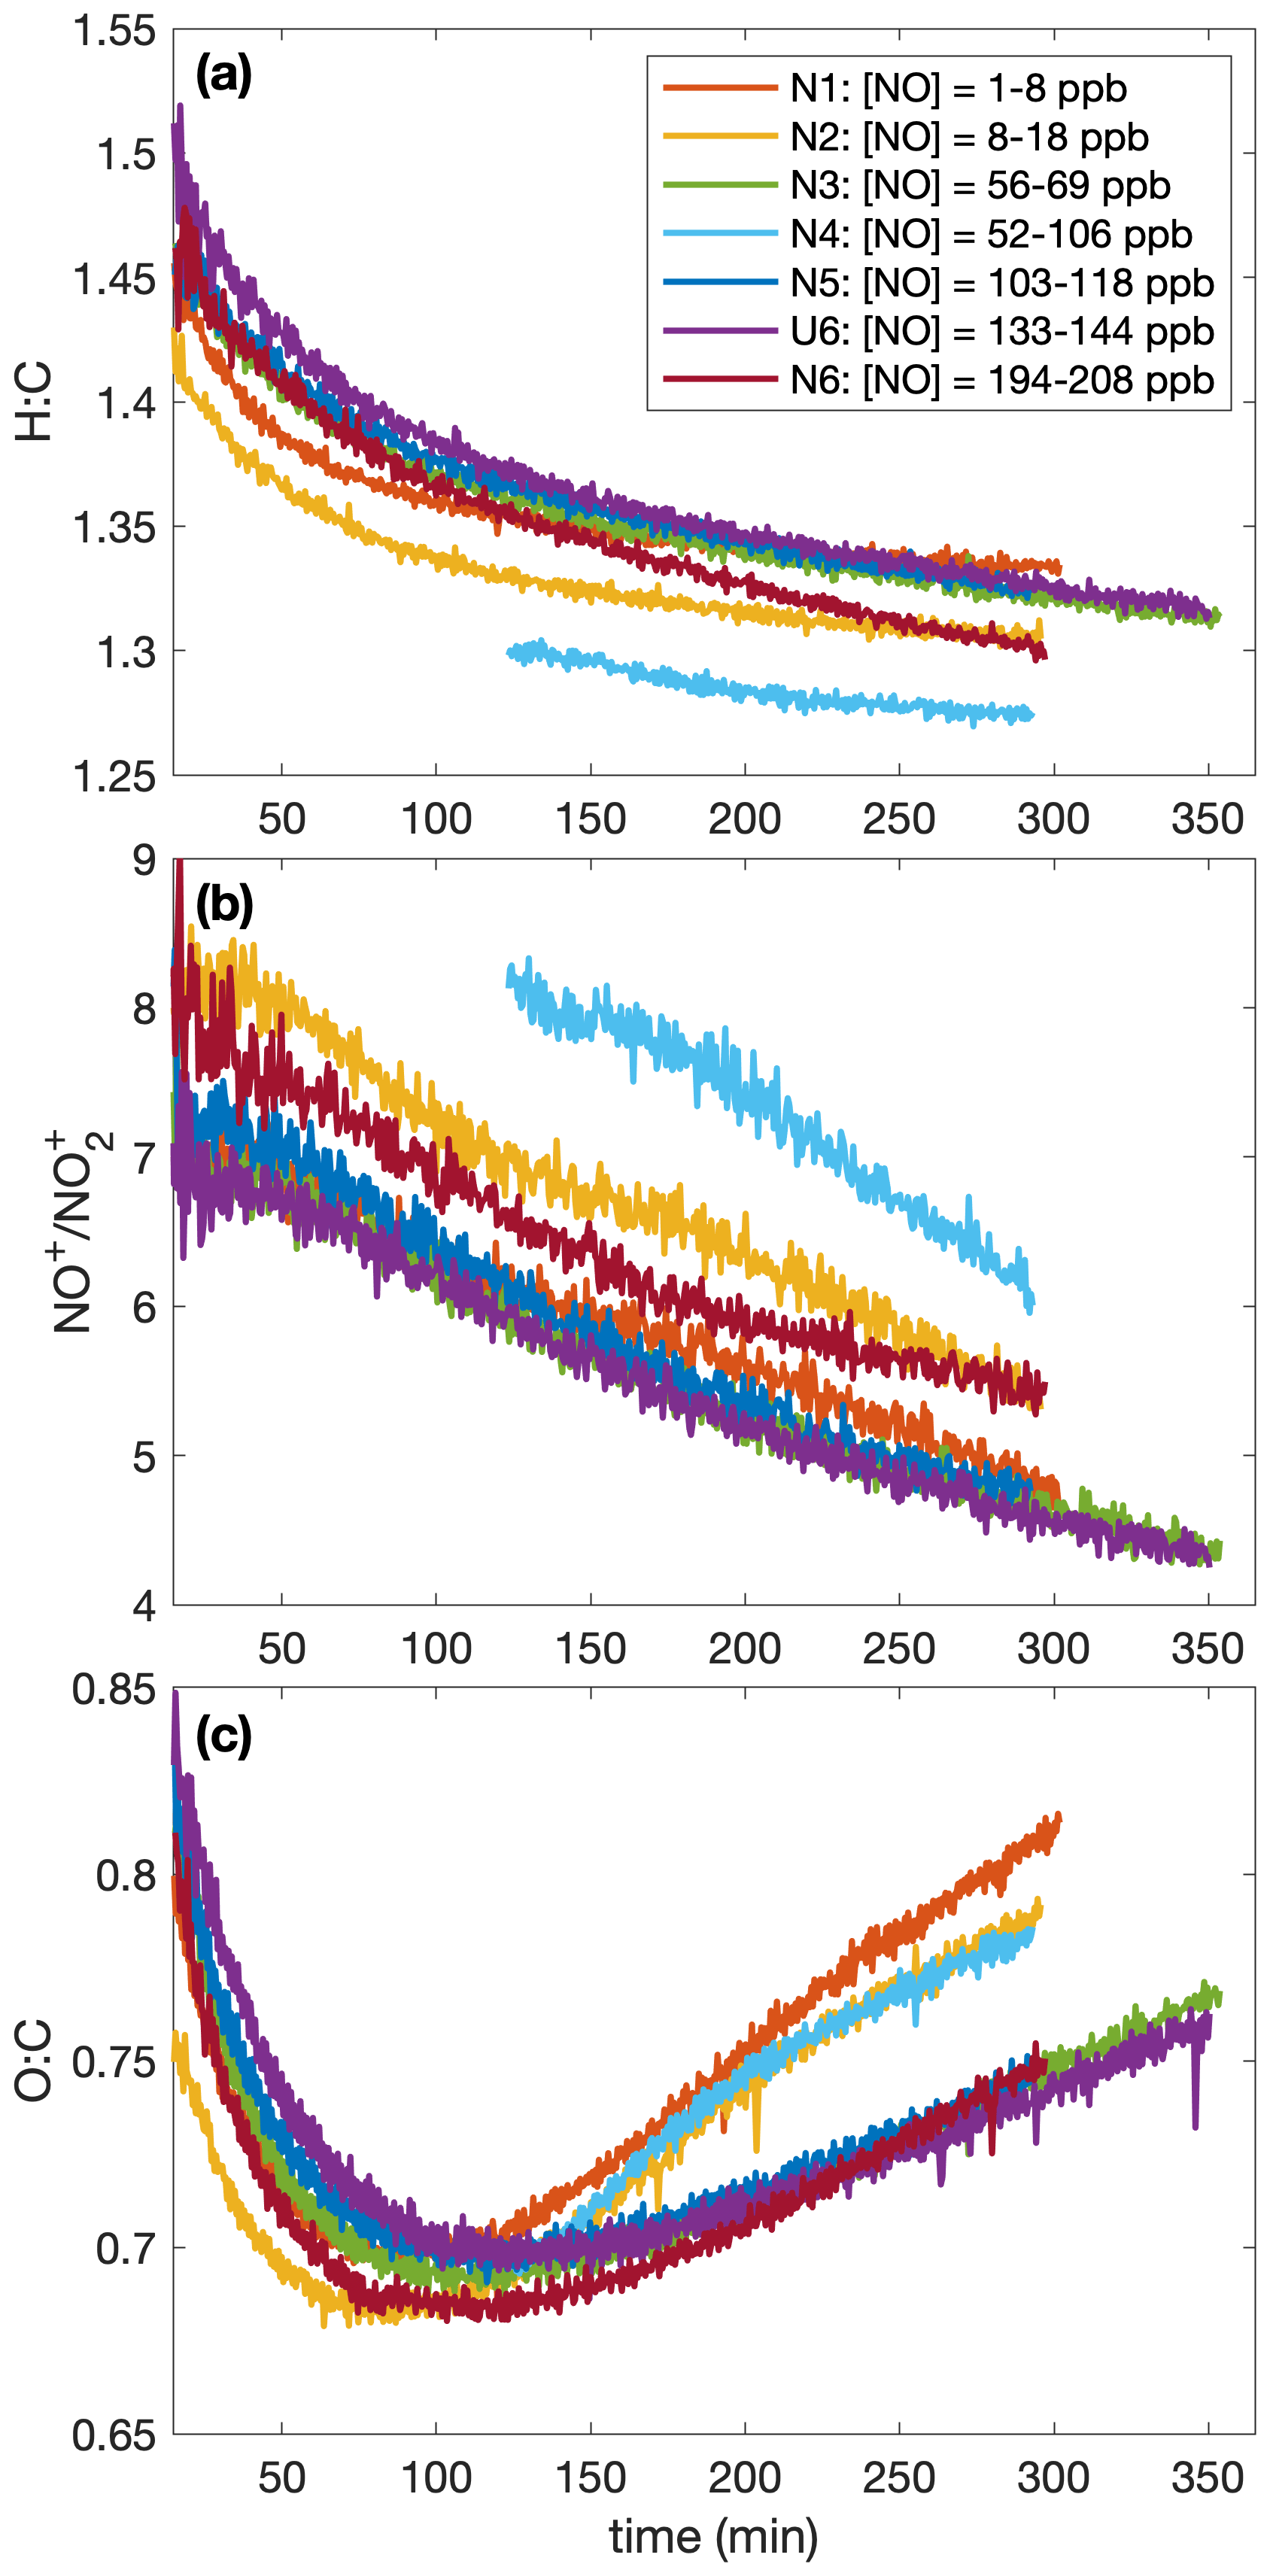
Figure 10Variation in the (a) hydrogen-to-carbon atomic ratio, the (b) NO-to-NO2 signal mass ratio, and the (c) oxygen-to-carbon atomic ratio indicates that the difference in SOA yield observed at different NO mixing ratios is a result of chemical differences in the aerosol formed. The lower [NO] experiments have a higher O:C ratio later in the experiment than the high [NO] ones; no trend is obvious in H:C ratios. Absolute uncertainties are 13 % and 28 % for the H:C and O:C ratios, respectively. Since the ratios are relevant only when there is a sufficient amount of aerosol present, the first 15 min after oxidation are not shown. Data were collected only after ∼ 2 h of oxidation for experiment N4. A SOA yield is not calculated for experiment U6 due to uncertainties in the rate of particle-wall deposition, but that should not affect the chemical composition of the aerosol.
Figure 8e shows a difference in the gas-phase chemistry at different NO mixing ratios for the lower constant [NO] experiments (N1–N3), but there appears to be little difference in the HOBnOH concentration for the higher constant [NO] experiments (Fig. 8f). This also matches the observed change in O:C ratios (indicating a change in chemical composition) between experiments N1, N2, and N3 (but not between N5, U6, and N6).
This change in chemical composition could be in the prevalence of organonitrates. It appears that at the beginning of each experiment, the first secondary organic aerosol formed comprised a significant portion of organonitrates (as much >20 % by mass), as shown in Fig. A1. While the mass fraction of organonitrates is not reported for the experiments shown in Figs. 6 and 10 (due to calibration issues), the ratio trend is the same as that for the experiments shown in Fig. A1, where the mass fraction can be reported. Note that one pathway to form organonitrates is by reaction with the nitrate radical; since all our analysis from the AMS is of experiments with the ultraviolet lights on, one does not expect a significant concentration of nitrate radicals (Seinfeld and Pandis, 2016). Instead, we expect the organonitrates to have been formed by a reaction; this reaction has a high gas-phase yield for organonitrates for large compounds (Arey et al., 2001; Rollins et al., 2010). Nitroaromatics could also form from the addition of NO2 to a radical intermediate, as has been suggested as the formation mechanism for nitrocatechols from laboratory studies of m-cresol (Iinuma et al., 2010).
Indeed, UPLC analysis found a high prevalence of RNO2 compounds (see Table A1), which likely will not lead to the same ratios as organonitrates and might contribute fragments that could lower the ratio. For all experiments with filters collected (N1–N3 and U1–U6), nearly all compounds detected with UPLC analysis were nitroaromatics. This indicates that the low-volatility products that condense into the aerosol phase retain their aromatic rings. Some of the ring-retaining compounds have C7 structures, as does benzyl alcohol. However, several of the compounds detected are C6 structures, indicating the possible loss of the methanol group. In particular, UPLC analysis showed a particularly high concentration of nitrocatechol in the aerosol. The atomic ratios of oxygen-to-carbon atoms (O:C) are quite large: between 0.6 and 1.0, which matches that of very oxygenated rings (Fig. C1) but could also match nitrocatechol (O:C of 0.67).
As oxidation continued, more non-nitrogenated organic compounds condensed into the particle phase, decreasing the mass concentration of organonitrates. Simultaneously, the ratio decreased, which could have been caused by nitric acid, formed from OH+NO2, partitioning into the aerosol phase and forming nitrate ions. Partitioning of HNO3 into secondary organic aerosol has been observed by Ranney and Ziemann (2016). Another possibility is that other compounds, such as organonitrites, might produce fragments that lower the ratio throughout the experiment.
It is possible, however, that there are non-ring-retaining compounds which condense onto SOA that are simply not detectable by the UPLC. Additionally, the prevalence of nitroaromatics may be a result of the UPLC analysis method that is particularly sensitive to nitroaromatics: the detection of aerosol-phase compounds via the UPLC/MS method is limited to detecting compounds that are water soluble and lie within the detection limits of the instrument. Though filters were stored at low temperatures, on-filter chemistry or hydrolysis in the aqueous phase could occur. This could alter the molecular weight of the original compounds collected in the particle phase (Zhang et al., 2016).
Nevertheless, the presence of many nitrogen-containing compounds in the particle phase is clear. This is supported by other studies: nitroaromatic hydrocarbons have been observed from daytime oxidation, sourced from anthropogenic sources, and attributed to the particle phase (Ikemori et al., 2019). These compounds have been observed in toluene chamber oxidation studies run at constant 15–20 ppb NOx mixing ratios, for which benzyl alcohol was one of the measured oxidation products (Hamilton et al., 2005).
Perhaps at higher NO concentrations there are more nitroaromatics, and these compounds are more volatile than the nitrogen-free oxidation products (such as the very oxygenated rings). Though the differences in H:C and O:C ratios are slight, the larger O:C ratios – corresponding to the very oxygenated rings – that are seen at lower NO concentrations support the theory that the compounds formed differ (see Fig. 10).
Experiment E1, which is similar to experiments R1–R5 except that, prior to the beginning of oxidation, it begins with 71.0 ± 0.8 ppb of NO2 and no NO, shows a much lower SOA yield than that from experiments R1–R5. This suggests that it is the NO that is the relevant reactant that causes initially high SOA formation. This is supported by the significant mass fraction of organonitrates at the beginning of the experiments; organonitrates are formed by reaction with NO.
4.6 SOA bulk properties
Throughout all the experiments, the O:C ratio also first decreases and then increases. If particle growth is kinetically controlled (supported by a modeled ; see Appendix C), the change in O:C ratio throughout the experiment might simply be a result of the greater abundance of higher volatility oxidation products at the beginning of the experiment. Only the lowest volatility products (which are, presumably, compounds with the highest O:C ratios) condense initially, but as higher volatility compounds build up they may eventually partition into the aerosol phase, decreasing the O:C ratio. As lower volatility second- and third-generation compounds are formed, these might then increase the O:C ratio observed. There may also be particle-phase chemical reactions, such as oligomerization (Gao et al., 2004), that lead to the change in O:C ratio throughout the experiment, or the observed change could result from a change in the nitrogen-containing compounds in the aerosol phase. Note that, when there is a large contribution of organonitrates to the aerosol, the O:C ratio will be an underestimate (Aiken et al., 2008).
The secondary organic aerosol yields of benzyl alcohol determined in this study range from 0.35 to 0.99. McDonald et al. (2018), who found that volatile chemical products might contribute very significantly to SOA formation in cities like Los Angeles, estimated a SOA yield of 0.090±0.023 for benzyl alcohol. Even in its upper limit, this is less than a third of the SOA yields found in this study. While benzyl alcohol is one of a number of volatile chemical products in the atmosphere, estimates of its atmospheric SOA level based on accounting studies lie significantly below those predicted by experimental chamber studies such as that presented here.
The one-product absorptive partitioning model predicted a mass-based stoichiometric coefficient of α≈0.97 for oxidation products that partitioned into the aerosol phase. If we assume that these oxidation products can be described by very oxygenated rings with a molecular weight of 188 g mol−1, then this corresponds to a mole-based branching ratio of 0.56. This exceeds modestly the value of 0.41 calculated by Wang (2015) for the formation of very oxygenated rings from benzyl alcohol oxidation (see Fig. C1 and Appendix C2). While the SOA yields calculated here appear high, they are not far from those predicted in the gas phase for the least volatile oxidation products.
A molecular weight of 188 g mol−1 for benzyl alcohol oxidation products also appears to be reasonable: these products would have an oxygen-to-carbon atom ratio of 0.86 (see Table C1), which is close to the ratios we see in Figs. 6 and 10 of as much as 0.95 and 0.83, respectively.
When extrapolating SOA yields to the atmosphere, one should note that all these experiments were conducted at <9 % relative humidity, which is far below the deliquescence point. Additionally, all experiments were conducted in the presence of NOx. Care should be taken when extrapolating these conditions to humid and low-NOx environments.
The benzyl alcohol mixing ratios used in this study (> 130 ppb) exceed substantially those in the atmosphere. Especially since we have suggested that, at least initially, SOA growth may proceed in a kinetically controlled (or mass-transfer-limited) regime, this could be a problem for extrapolating these results to the behavior of benzyl alcohol in the atmosphere. However, the long reaction time and the asymptotic nature of the SOA yields (Figs. 4 and 3a) suggest that the SOA yield has reached equilibrium and would be the same regardless of the precursor concentration. Furthermore, Figs. 2, 5, and 9 all show the mass of benzyl alcohol reacted at the end of an experiment as a function of SOA yield and the relevant other variable (initial seed surface area concentration, temperatures, and constant NO mixing ratio, respectively). The amount of benzyl alcohol does not correlate to observed SOA yield in any of these figures.
This is seen more clearly in Fig. 11, where Fig. 11a shows the set of experiments carried out under approximately the same initial conditions and Fig. 11b shows all the experiments with a calculated SOA yield given in Table 1. Even for experiments R1–R5, designed to be nearly identical, there are some differences in initial benzyl alcohol mixing ratios (Fig. 11a). However, these differences do not lead to a discernible trend in the observed SOA yield (in neither Fig. 11a nor b); if anything, there appears to be an increase in SOA yield as the initial benzyl alcohol ratio decreases and, if this trend were applied to extrapolation to the atmosphere, we would only expect to see larger SOA yields in the atmosphere than those reported here.
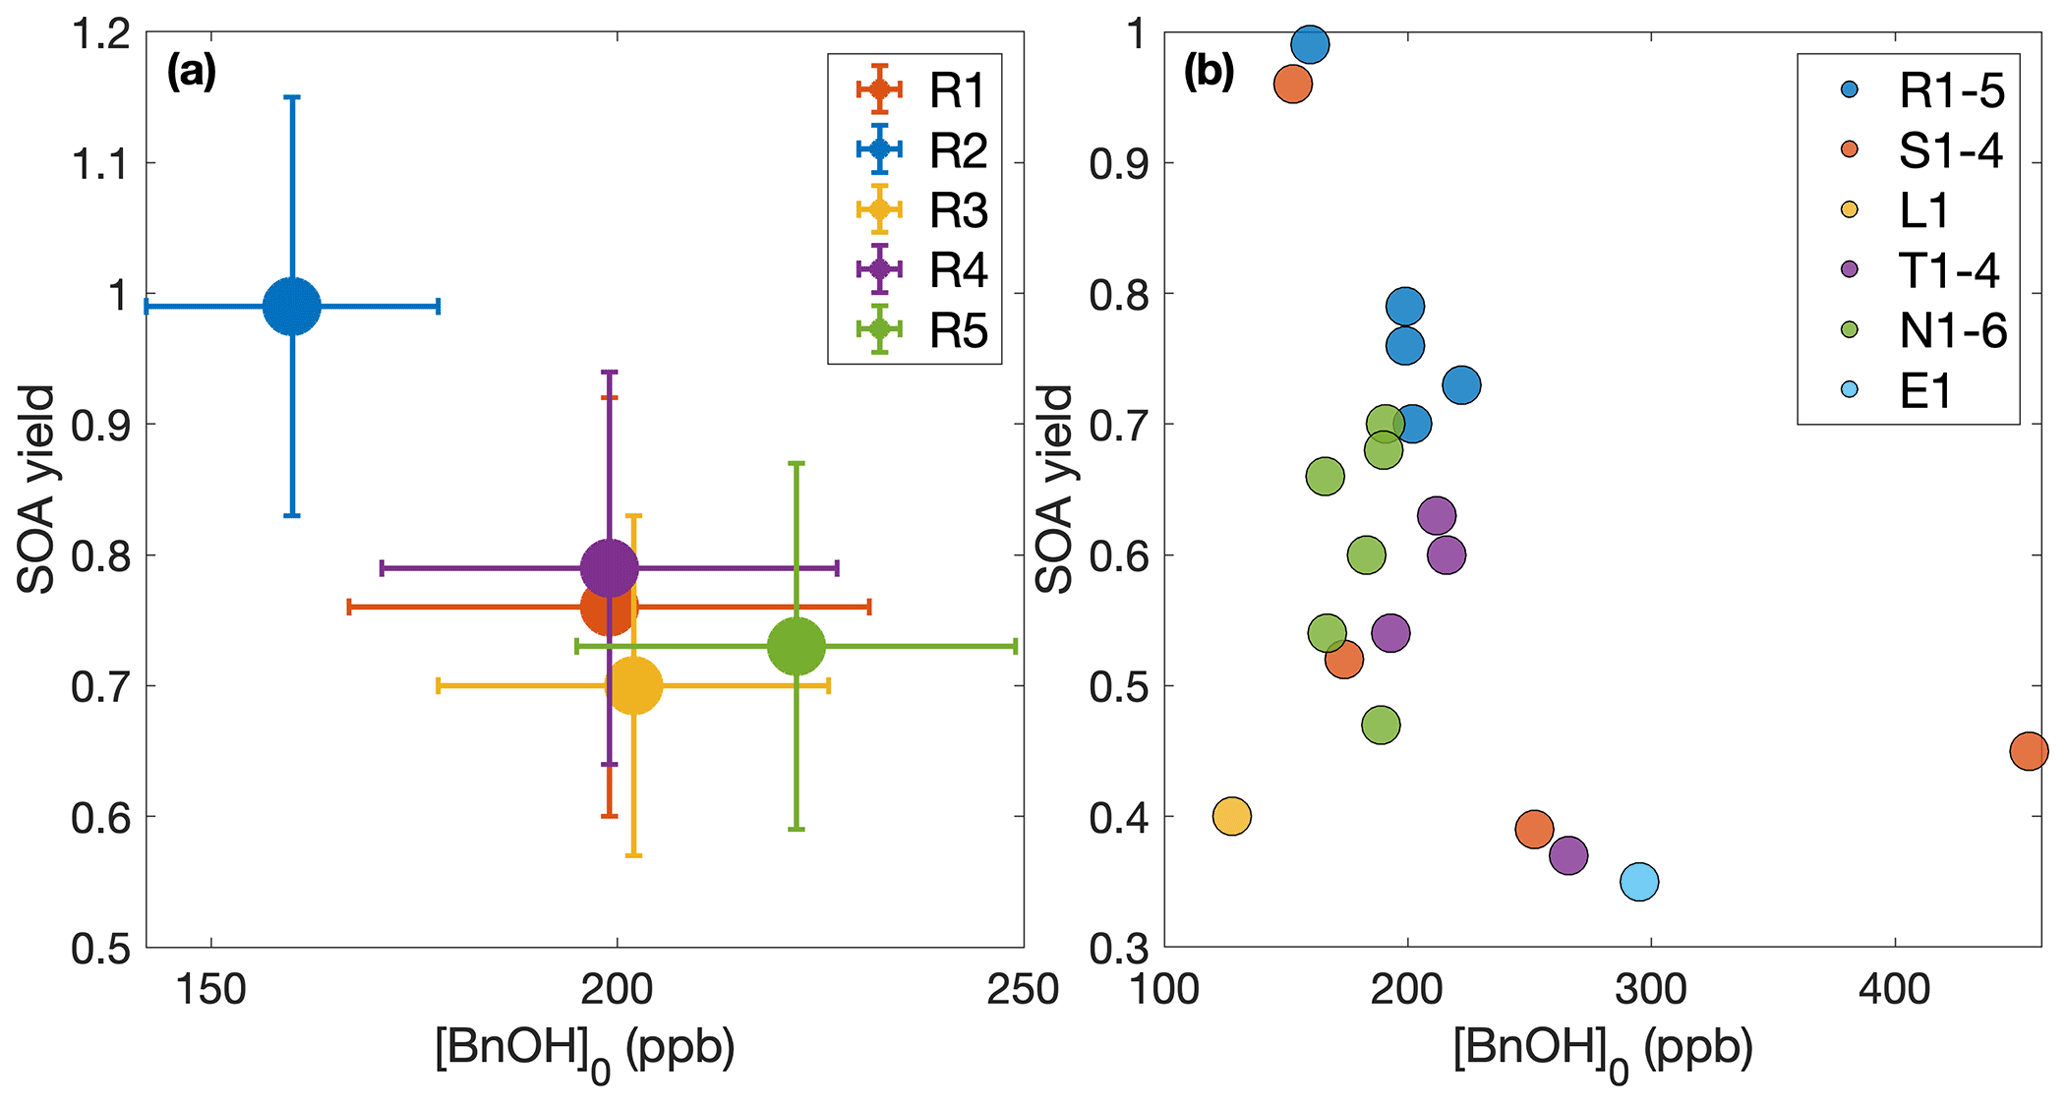
Figure 11Effect of benzyl alcohol concentration on SOA yield. (a) Experiments R1–R5, which are all run under approximately the same conditions, with uncertainties. (b) All the experiments where a quantitative SOA yield is calculated. In both panels, we assume that ω=0. No trend is discernible in either panel.
As the SOA formed from benzyl alcohol has a NO mixing ratio dependence and a temperature dependence, and exhibits vapor-wall-deposition effects, it seems likely that other oxygenated compounds emitted from volatile chemical products will have similar behavior.
A1 Offline liquid chromatography analysis
Many nitroaromatics were observed in the aerosol phase using offline ultra-high-performance liquid chromatography electrospray ionization quadruple time-of-flight mass spectrometry (UPLC/ESI-QToF-MS). Post-oxidation samples were taken using 47 mm Pall Teflon filters, which were collected for ≥ 2 h at 6.5 L min−1 using an upstream activated carbon denuder. Additional Teflon filters were collected during photooxidation at 2 L min−1. This experimental setup is described by Kenseth et al. (2018).
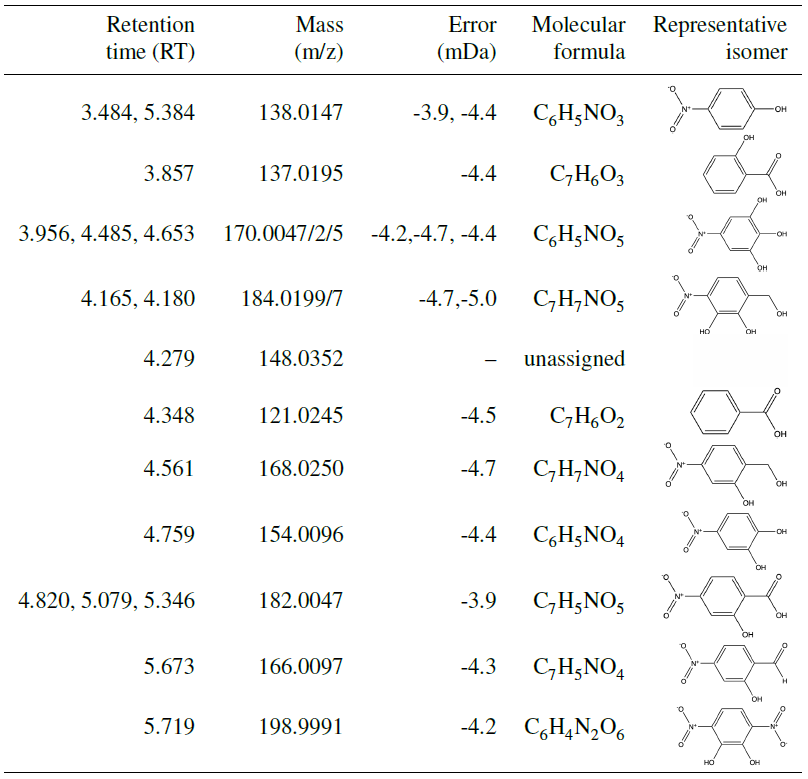
The SOA collected was extracted by placing each filter sample into 6 mL of Milli-Q water and agitating the samples on an orbital shaker for 1 h. In an effort to prevent on-filter chemistry from occurring, samples were stored at −14 ∘C after initial collection and before extraction. Analysis using UPLC-MS was carried out in negative mode (where the parent molecule is observed at M–H), which is sensitive to the nitroaromatics formed in the aerosol phase. The 12 min eluent program for UPLC-MS and MS/MS fragmentation analysis required 4 µL of sample with gradient eluents between a 0.1 % formic acid/99.9 % water solution and a 100 % acetonitrile solution. The total flow rate was 0.3 mL min−1, and masses were scanned from to 1000. The method was similar to that in Kenseth et al. (2018). MassLynx software was used to analyze the resulting spectra, which calculates possible chemical formulas based on masses quantified during analysis. Mass assignments were limited to carbon-, oxygen-, and nitrogen-containing formulas as these were the only chemically viable formulas for benzyl alcohol oxidation chemistry. The structures assigned to chemical formulas from MassLynx analysis were based on structures that corresponded to expected oxidation products and were confirmed based on MS/MS fragmentation analysis. Isomeric analysis was not conducted for these compounds; thus, structures in Table A1 represent just one possible isomer. Several experiments with similar reaction conditions (U1–U4; see Table 1) were analyzed to probe reproducibility of this technique; these experiments showed consistent results.
Other organic compounds may be present in the SOA collected that are insoluble in the extractant solvent, not able to elute from the chromatographic column, or not detectable in negative ion mode (Surratt et al., 2008). Additionally, the UPLC-MS exhibits different sensitivities to compounds depending on the polarizability of the compound as well as its ability to ionize. It is likely that the UPLC-MS is quite sensitive to the nitroaromatics reported in this work as compared to other compounds.
The prevalence of nitroaromatics in the constant NO concentration experiments is discussed in Sect. 4.5.
A2 ratio
The measured mass ratio of NO to NO2 (called the ratio) is calibrated for ammonium nitrate for experiments R4 and U7–U8 (3.20 ± 0.04) and is assumed for organonitrates (7.2 ± 1.1). The organonitrate ratio was calculated using the ammonium nitrate ratio and the correlation derived by Fry et al. (2013). From this ratio, the time-resolved ratio of the fraction of the nitrate signal that comes from organonitrates for each experiment (xON) can be obtained using Eq. (1) in Farmer et al. (2010). With the mass concentration of nitrates () and the mass concentration determined to be organics (mOrg), the time-resolved organonitrate mass fraction of the aerosol is . This is plotted in Fig. A1.
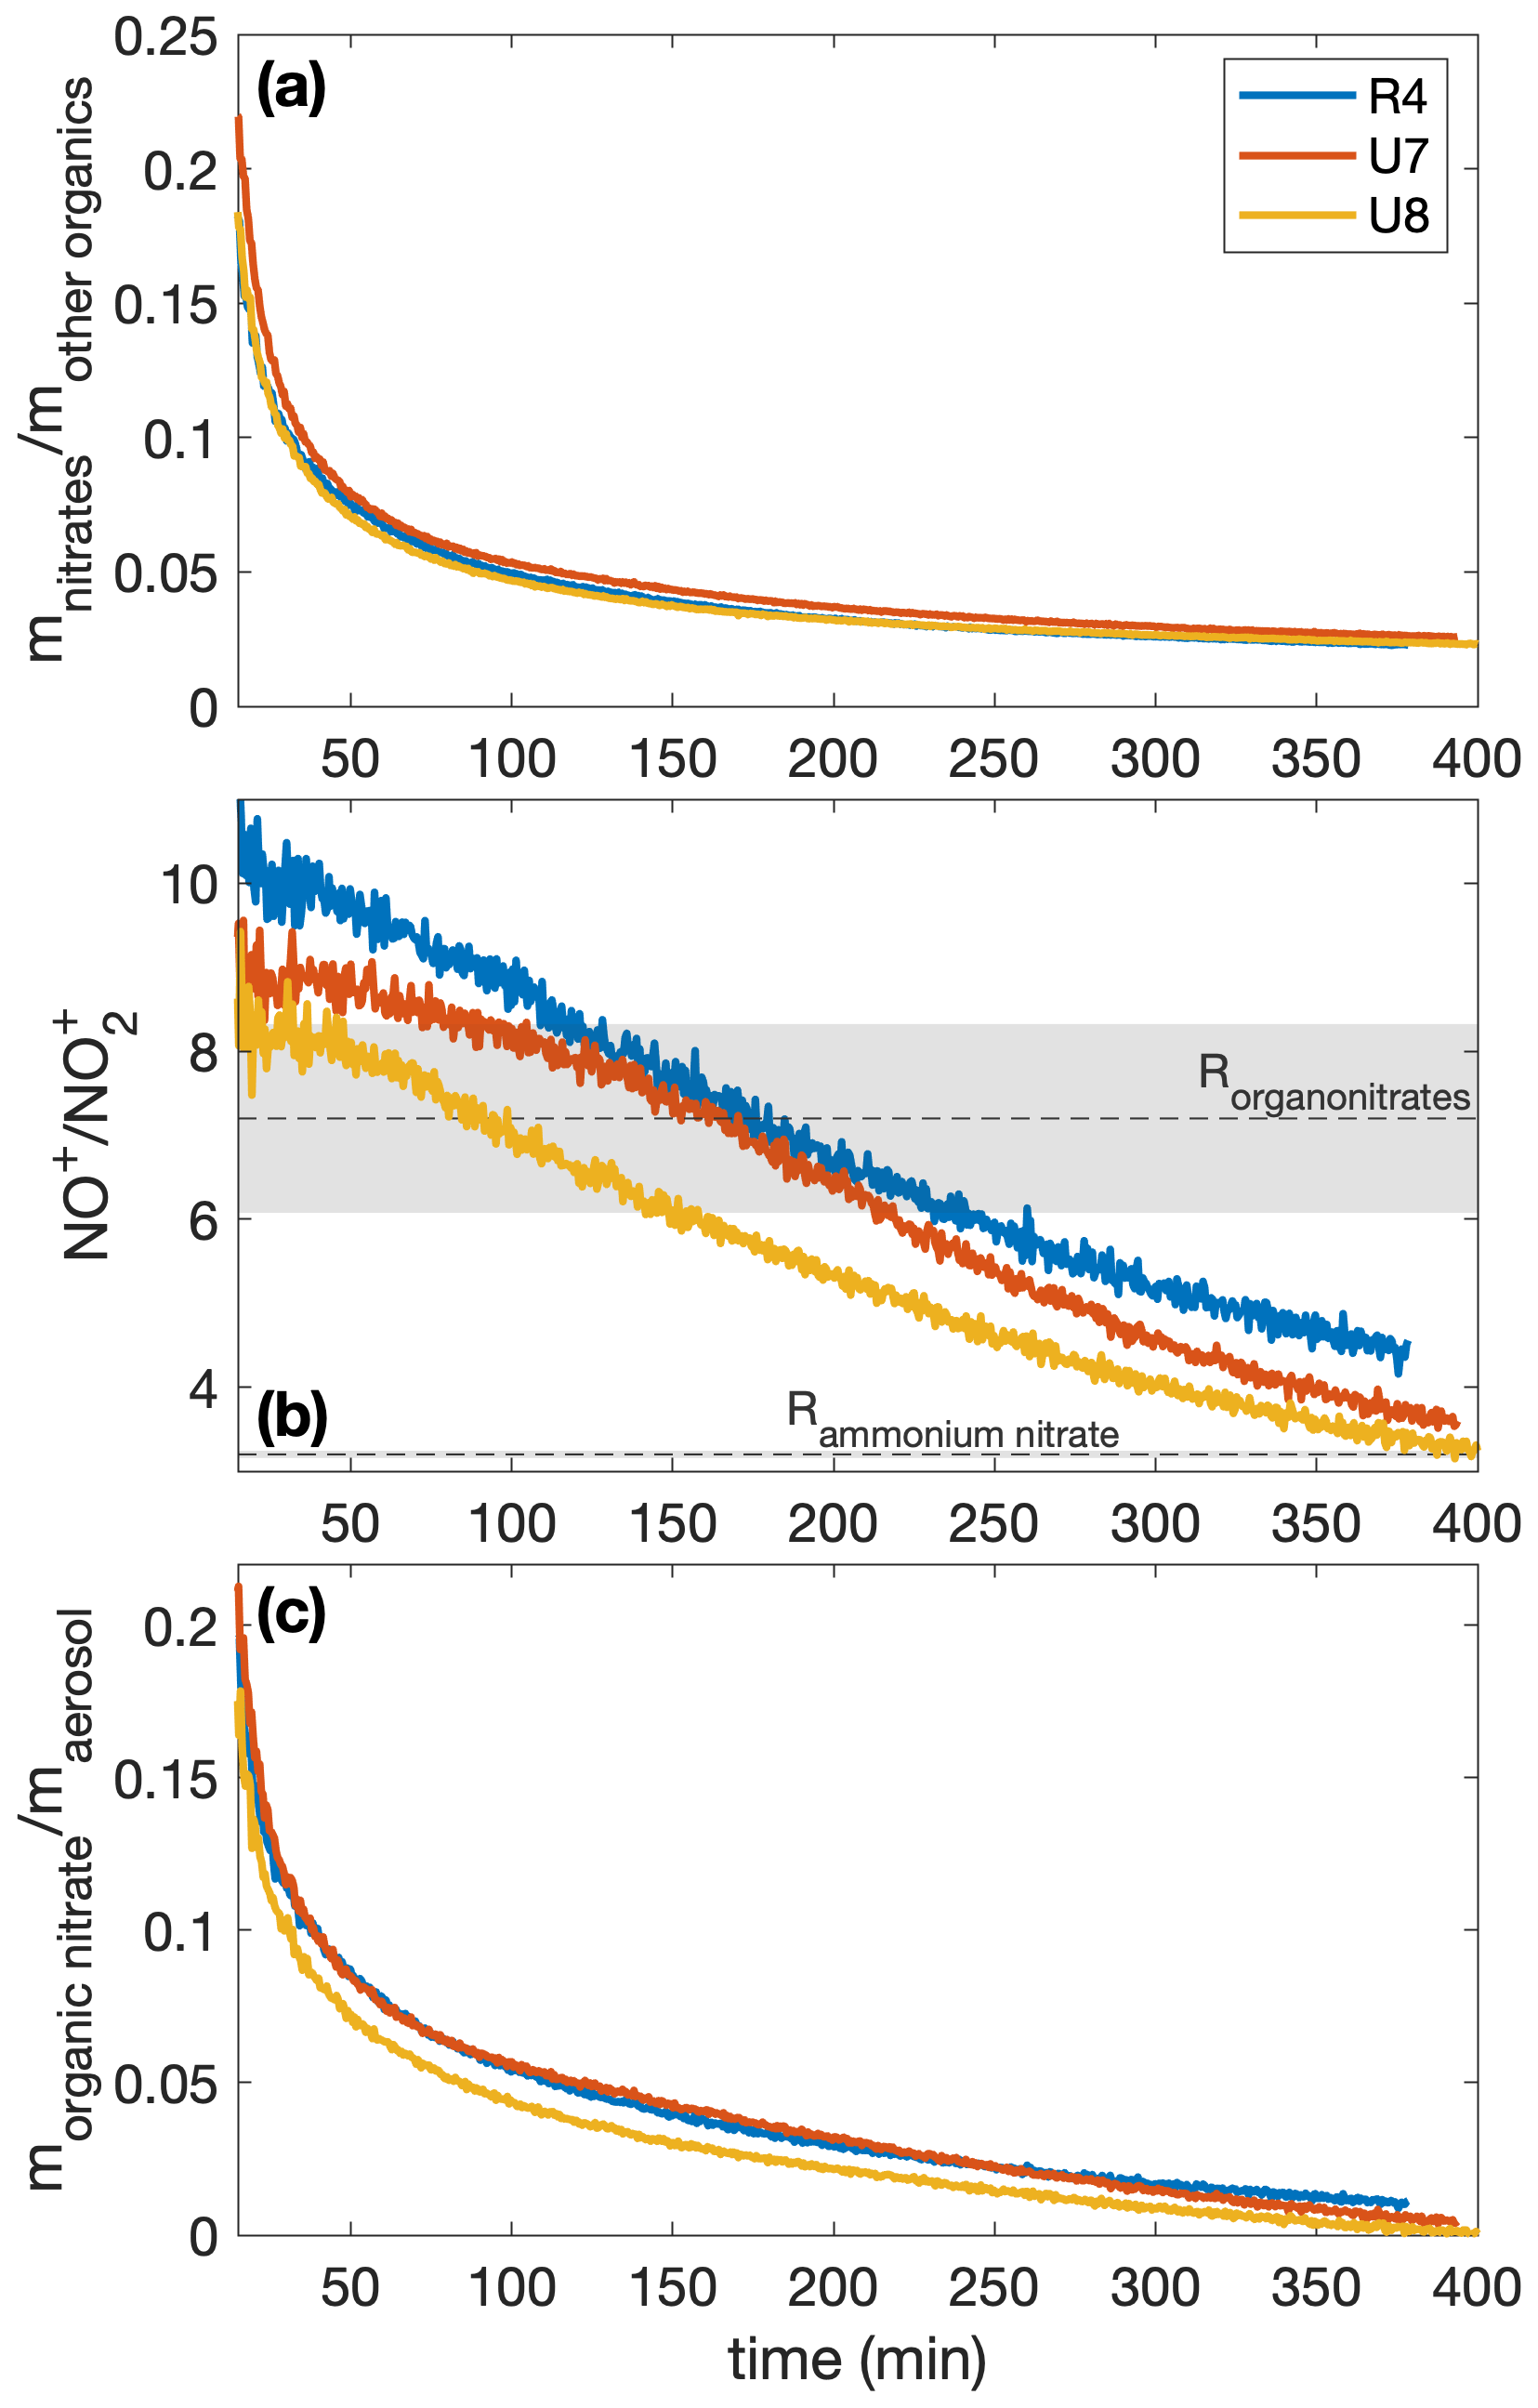
Figure A1The mass ratios of (a) the nitrates to organics without nitrogen, (b) the NO+ to the signal from the AMS, and (c) the organonitrate to total organic aerosol mass for experiments R4, U7, and U8. All experiments were performed under similar initial conditions (291 K, [NO]0=71–77 ppb). Since the ratios are relevant only when there is a sufficient amount of aerosol present, the first 15 min after oxidation are not shown. In panel (b), the assumed organonitrate and ammonium nitrate ratios are shown as dashed lines with the uncertainty as the corresponding shaded region.
To estimate the upper bound (ω=1) of the yield, we assumed that only particles that deposited after the onset of oxidation would take up vapor. That is, inorganic seed deposited during the background collection period of each experiment is not considered.
While different-sized particles both deposit to the wall and grow due to condensation at different rates, to simplify the calculation of the SOA yield upper bound, the volume-weighted mean diameter of the suspended size distribution was determined for each time point such that , where Ntotal,t is the total number concentration at time point t, nbins is the number of diameter size bins measured by the SMPS, Dp,i is the mean diameter of each size bin, and Ni,t is the number concentration of particles of diameter Dp,i at time t. Then, the upper bound assumption of SOA mass formed during the experiment is given by
where ρ is the particle density, Nlost,t is the number concentration of particles lost to the chamber wall between ti and ti+1, and tend is the time in the experiment considered. This calculation was performed for 1 min time steps.
C1 Important parameters
To interpret the SOA yields and extrapolate them to the atmosphere, there are a few parameters that are useful. To understand the degree of kinetic vs. quasi-equilibrium growth, the accommodation coefficient to suspended particles, αp, is useful; as αp approaches 1, the system becomes closer to quasi-equilibrium growth.
While the difference in the assumed SOA yield between the case where gas-phase oxidation products produced in the chamber bulk readily partition onto particles deposited on the chamber wall (ω=1) and the case where the particles cease to participate in partitioning once deposited (ω=0) is slight, the general assumption is that ω=0 and any verification of that is useful for understanding chamber data. While we do not calculate ω here, if the accommodation coefficient to particles deposited on the chamber walls (αpw) is ∼0, that indicates that ω≈0.
C2 Gas-phase reactions
Oxidation of benzyl alcohol in the present system occurs predominantly via reaction with the hydroxyl radical (OH). The reaction with OH proceeds via H-abstraction from the CH2 group or OH addition to the aromatic ring; its products may include benzaldehyde, hydroxybenzyl alcohol, 3-hydroxy-2-oxopropanal, butenedial, and glyoxal (Wang, 2015; Harrison and Wells, 2009). Measured rate constants for reaction with the OH radical found using a relative-rate method are cm3 molecule−1 s−1 at 297±3 K (Harrison and Wells, 2009; Bernard et al., 2013).
A chemical understanding of the gas-phase oxidation of benzyl alcohol is useful for modeling the system, which can aid in understanding the gas- and particle-phase dynamics. Note that while gas-phase dynamics affect the SOA formed, the assumptions made in this section do not affect the measured SOA yields and are only used for understanding the system.
The measured gas-phase yield of benzaldehyde from the reaction of benzyl alcohol with OH is 24 ± 5 % at 298 K (Harrison and Wells, 2009; Bernard et al., 2013), which also matches well with a calculated value of 29.6 % (Wang, 2015). For gas-phase modeling and related optimization, we use branching ratios following the results of Wang (2015), which combine theoretical and experimental branching results: 0.25 to form benzaldehyde, 0.11 to form o-hydroxybenzyl alcohol (note that this differs somewhat from the measured yield of 0.22; Bernard et al., 2013), 0.23 to high-volatility fragments (including glyoxal and butenedial), and the remaining 0.41 to low-volatility and ring-containing products. Since the intermediate reactions are theoretically much faster than the initial reaction of OH with benzyl alcohol (except for the reactions of benzaldehyde), we employ the mechanism given in Fig. C1, in which compounds of similar volatilities are grouped into the precursor (BnOH), benzaldehyde (BnAl), fragments (Frags), very oxygenated rings (VORings), and hydroxybenzyl alcohol (HOBnOH).
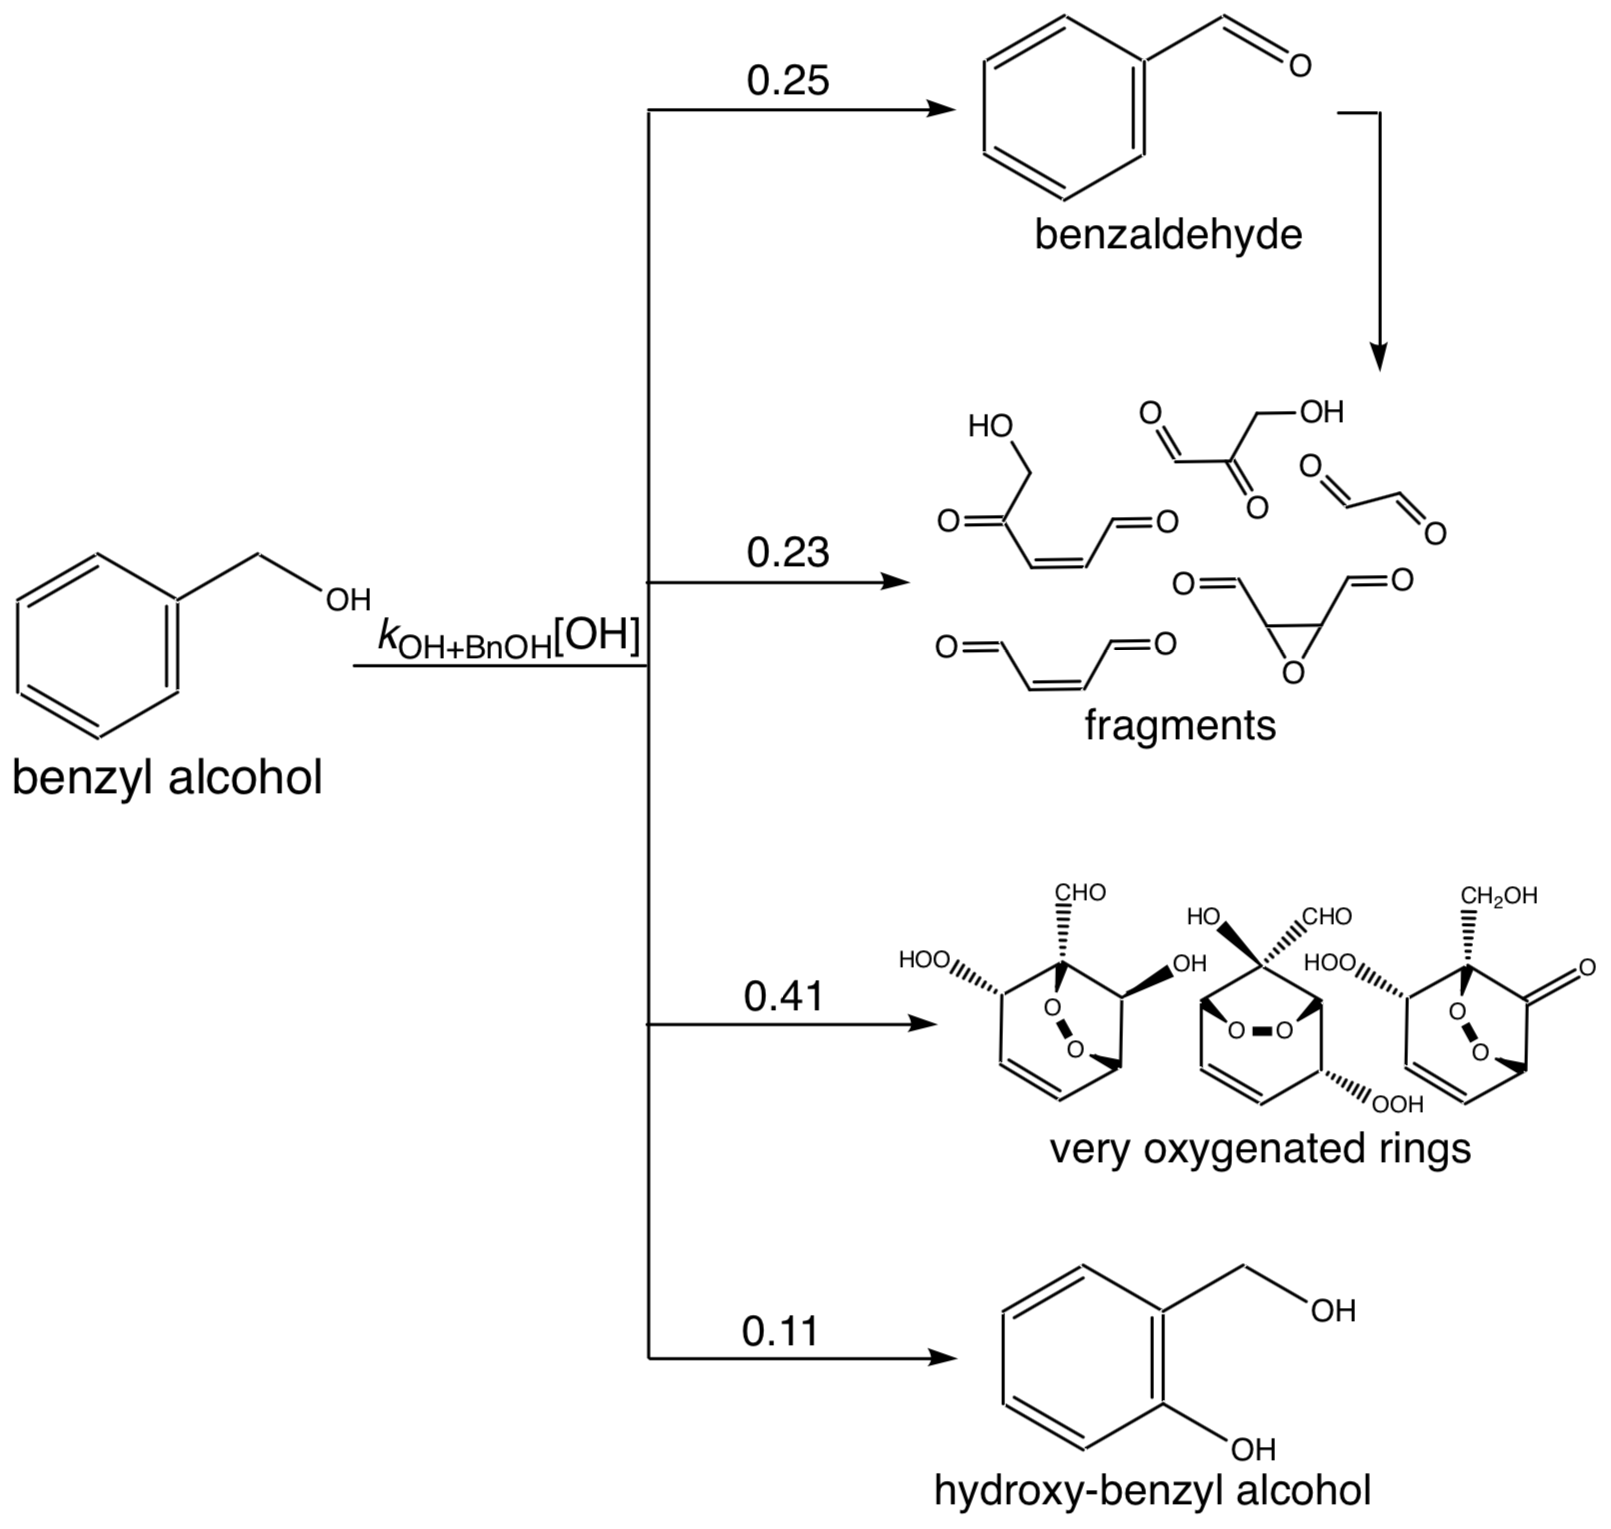
Table C1Compound class properties for simulating chamber experiments.
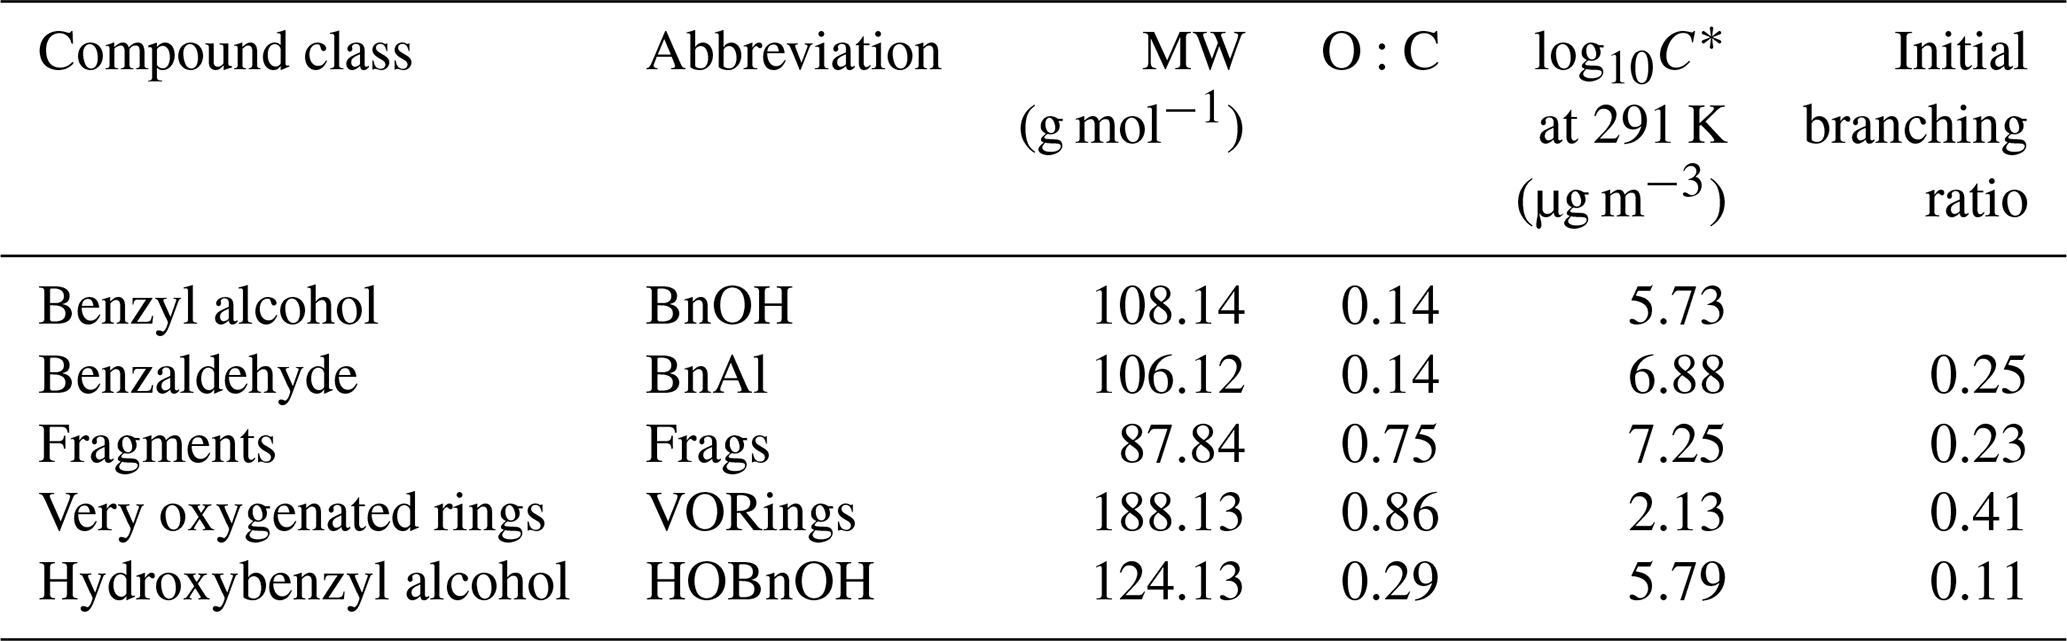
In Table C1, the molecular weights used for each compound class are the weighted values by component predicted by Wang (2015). For each compound class, the estimated vapor pressure is the component-weighted value found using the EVAPORATION method (Topping and Jones, 2016) at the mean temperature of the experiment under consideration; for reference, the saturation mass concentration C∗ is given in Table C1 at 291 K. Note that using EVAPORATION gives results similar to the Nannoonal–Myrdal method. The oxygen-to-carbon ratio is also given for each compound class. Note that none of these predicted products are organonitrates or other nitrogen-containing organic compounds, as observed in the aerosol (see Sect. 4.6). The lack of nitrogen-containing products, especially at the very beginning of oxidation, could be responsible for some of the discrepancy between the observed and simulated results.
C3 Methodology
All optimization procedures and modeling are based on a fixed-bin model, as described in Charan et al. (2019). A density of 1.4 g cm−3, consistent with past work on similar compounds (Dommen et al., 2006; Kroll et al., 2005, 2006; Brégonzio-Rozier et al., 2015), and a surface tension of 28.21 dyn cm−1, that of benzene particles (Seinfeld and Pandis, 2016), are assumed for the particles with SOA. Wall accommodation coefficients are calculated using the saturation mass concentrations of each compound class (see Table C1) and the empirical fit described in Huang et al. (2018).
Modeling is carried out by fixing the decay of benzyl alcohol to the second-order exponential fit of the concentration. Since, in theory, , if [OH] were constant throughout the experiment then [BnOH] should follow a first-order exponential decay in time (the decay constant for this fit is given in Table 1). A slightly better fit was found to a second-order exponential decay, which is used for modeling.
Note that the model is not designed for nucleation experiments, because seeding the model with small particles requires these particles to grow very quickly and therefore requires a much smaller time step. Hence, for the surface area experiments, we do not model experiment S1.
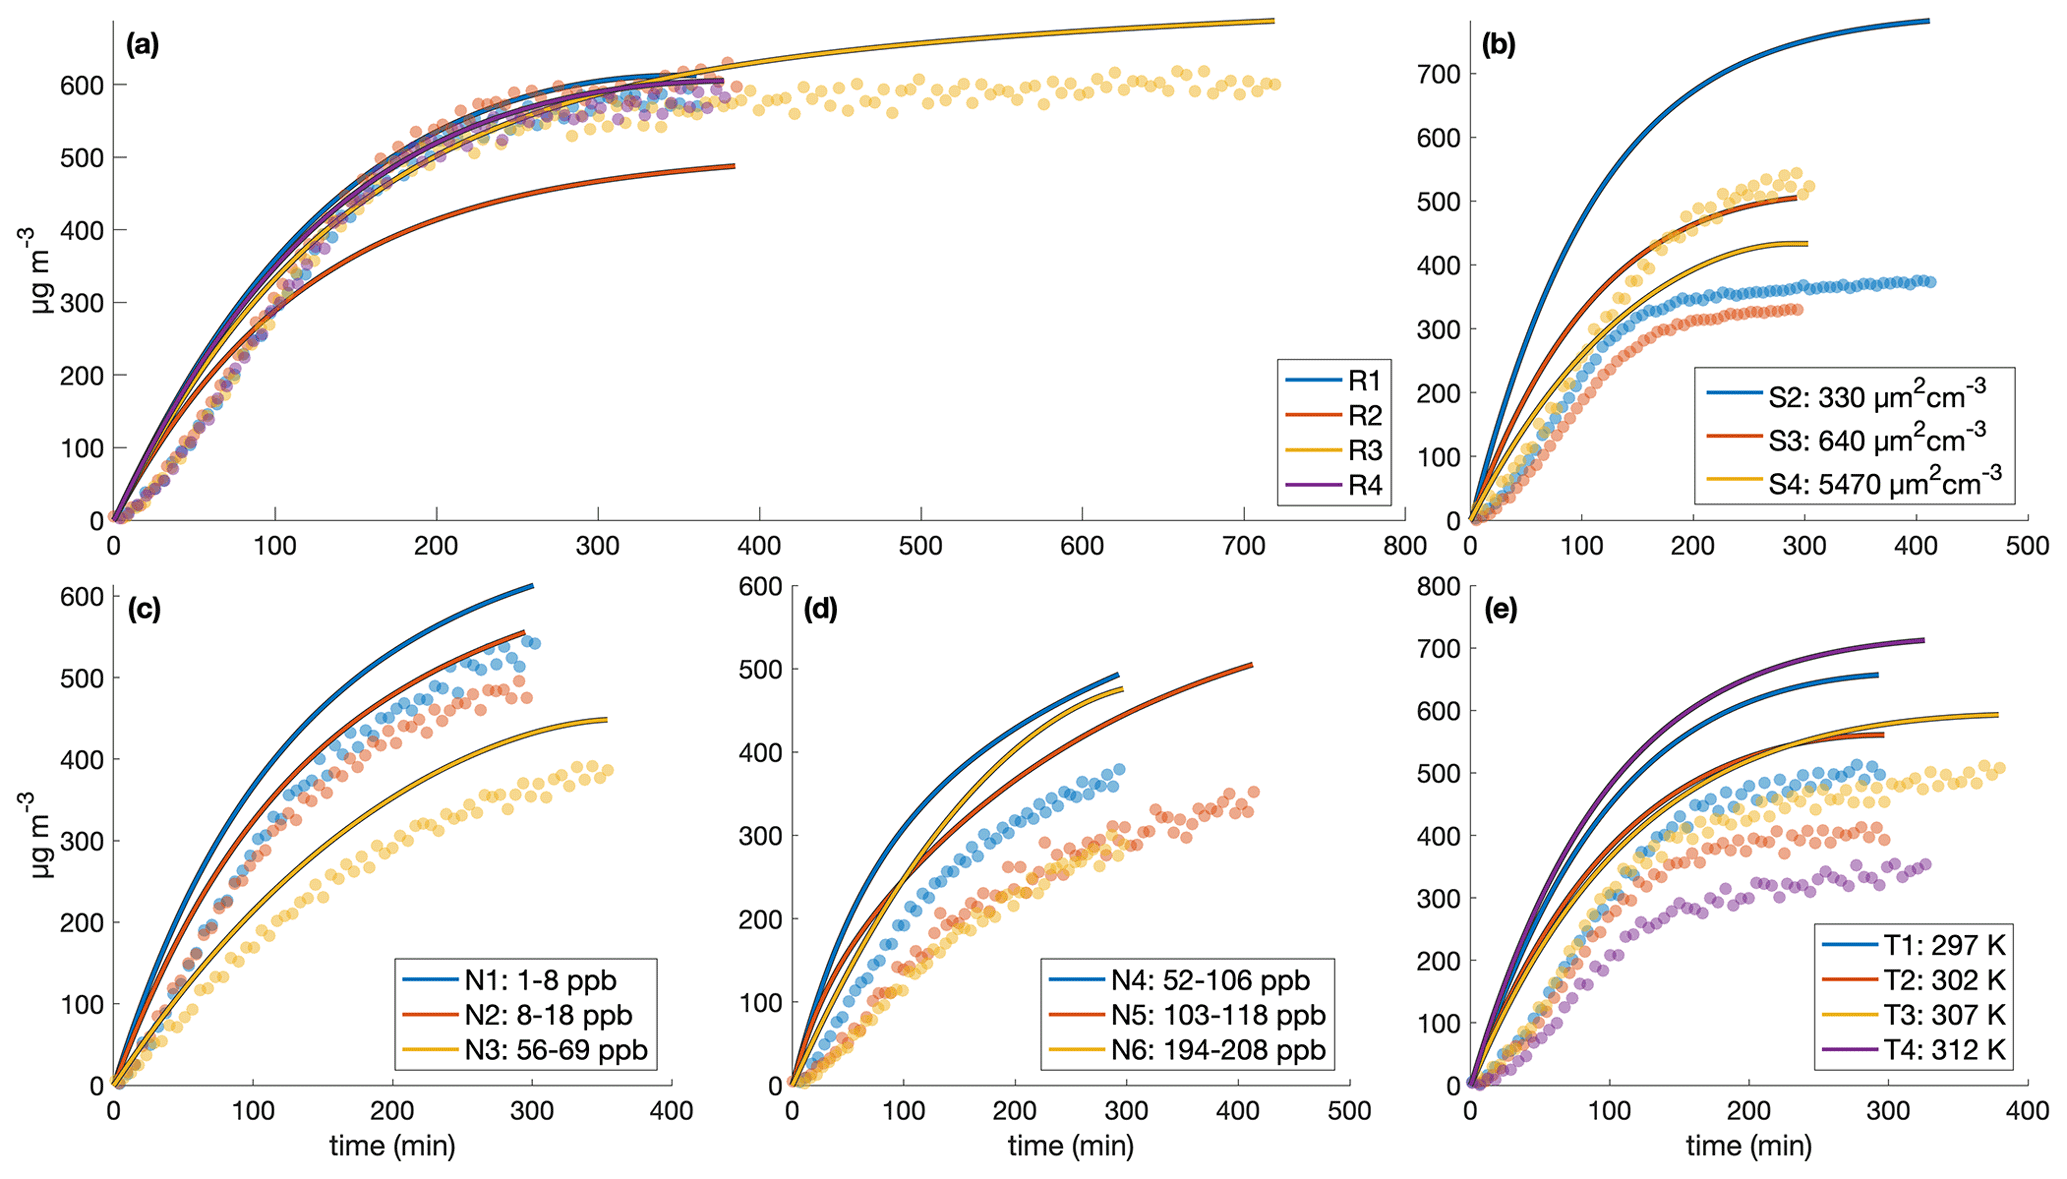
Figure C2Comparison of measured (circles) and simulated (curves) secondary organic aerosol mass concentrations for different initial surface area concentrations assuming no vapor-wall deposition for the (a) similar experiments, (b) different surface area experiments, (c) low constant NO concentrations, (d) high constant NO concentrations, and (e) different temperature experiments. The decay of benzyl alcohol was simulated using a second-order exponential fit to the data. The accommodation coefficient of vapor to suspended particles αp=1. Also, αpw=0 and µg m3. Simulation time steps were taken as 1 min.
Because several of the simulation parameters are not constrained (the equivalent saturation concentration of the wall, Cw, the accommodation coefficient of vapor to suspended particles, αp, the accommodation coefficient of vapor to deposited particles, αpw, the accommodation coefficient of each product to the wall, αw,i), modeling of the system is associated with considerable uncertainty. If one is confident in the branching ratios under each condition, then one could determine αw for each product and optimize αp and Cw with experiments run under approximately identical conditions except for initial seed surface area concentrations (S2–S4 and R1–R4). Differences in products could then be determined at different temperatures (using experiments T1–T4) and at different constant NO concentrations (using experiments N1–N6).
C4 Simulation results
With the base assumption that αp=1, αpw=0, and µg m3, the model reproduces experiments R1–R4 fairly well and most of the other experiments less successfully (see Fig. C2). Even for experiment R1, where the simulation captures the total organic mass well (Fig. C2a), the size distribution evolution is less successfully captured (Fig. C3).
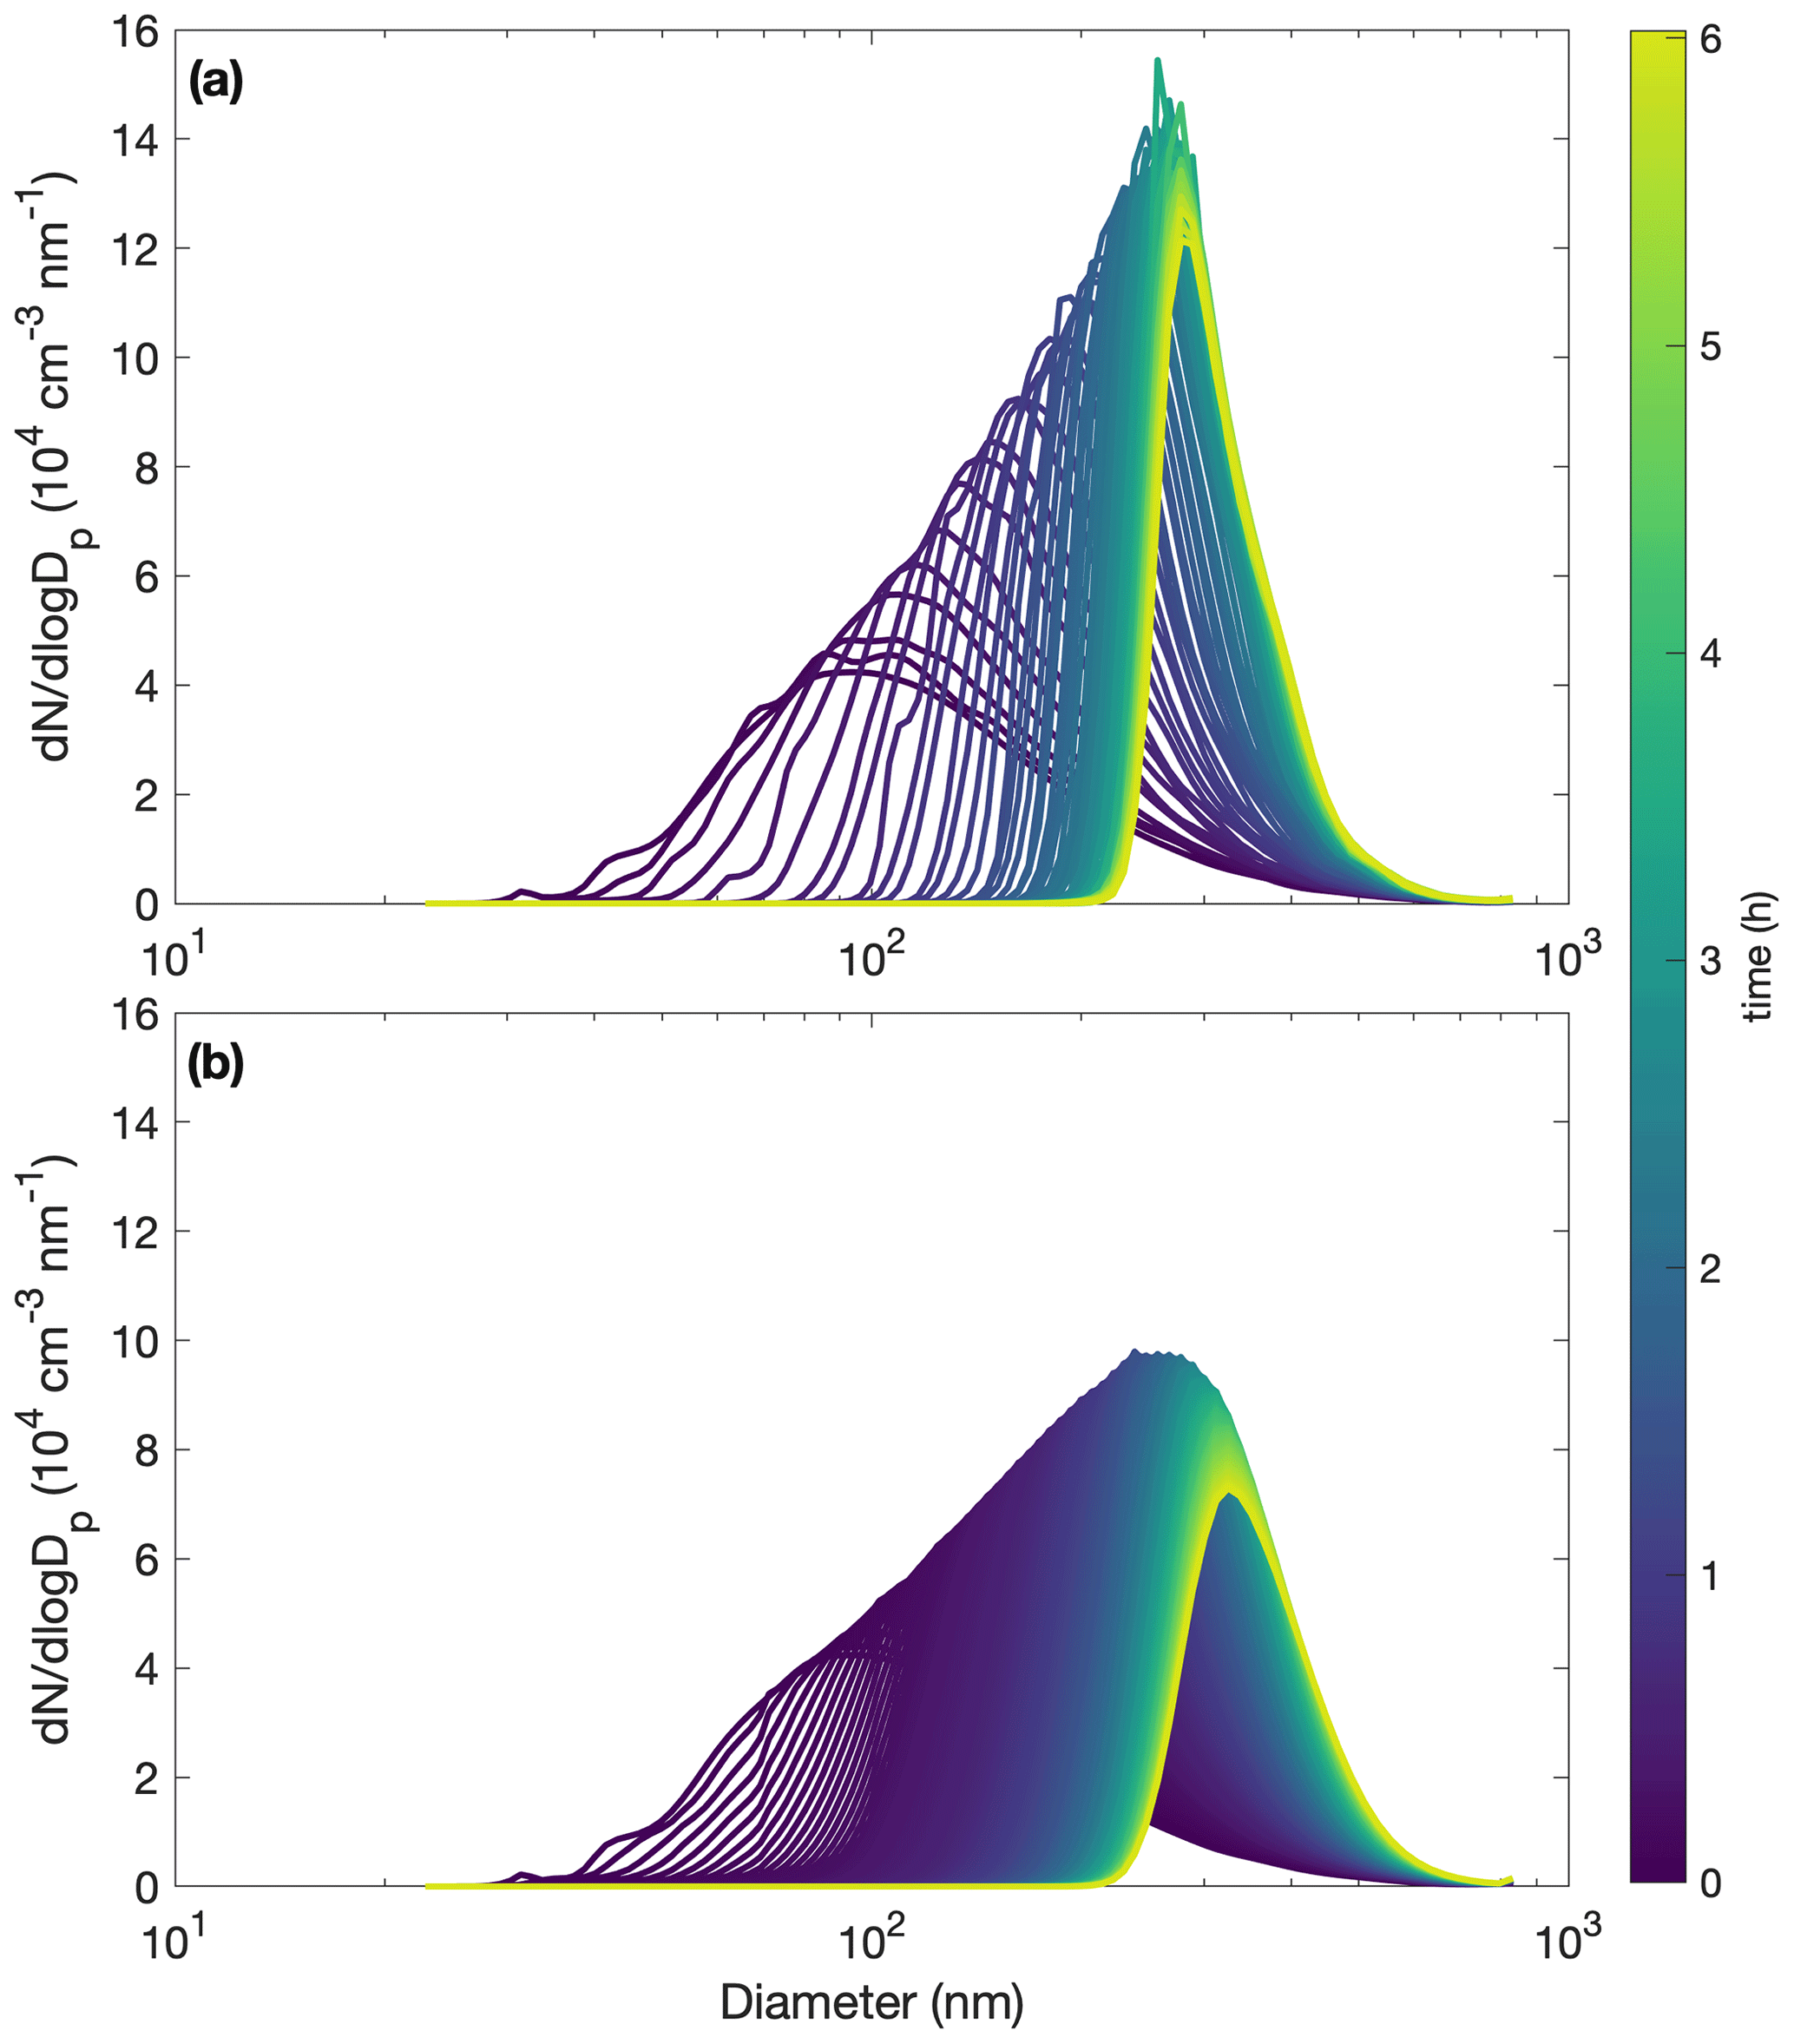
Figure C3Comparison of measured (a) and simulated (b) particle size distributions throughout oxidation for experiment R1. The decay of benzyl alcohol is represented using a second-order exponential fit to the data. The accommodation coefficient of vapor to suspended particles αp=1. Also, αpw=0 and µg m3. Computational time steps are taken as 1 min.
Five experiment sets were chosen to optimize parameters, where the reproduction experiments are those performed under very similar initial conditions: low NO mixing ratios, high NO mixing ratios, reproduction experiments R1–R4, surface area experiments S2–S4 with one reproduction experiment R1, and surface area experiments S2–S4 with reproduction experiments R1–R4. Deriving the true αp by first optimizing solely for αp (with αpw=0 and Cw=104 µg m−3) for each experiment set shows that αp is on the order of 10−2. This is the case for optimizations performed on all of the experiment sets. It is also the case if, instead of holding αpw and Cw at constant values, they are also allowed to change during optimization. These results are shown in Table C2. Note that this is less than the general average for many studied aerosol (∼ 0.9) and specifically for the similar compound toluene, which was determined to be (Liu et al., 2019).
Table C2Optimization of parameters. The equivalent saturation mass concentration of the Teflon wall, Cw, has units of µg m−3. The accommodation coefficients of vapor to suspended particles (αp) and of vapor to deposited particles (αpw) are unitless. For all optimizations, starting conditions were αp=1, αpw=0, and Cw=104. When not optimized, αpw=0, Cw=104, and αp is given in parentheses.

This suggests that mass-transfer limitations may be important for understanding the growth of SOA under these conditions. An accommodation coefficient close to 1 means that equilibrium between the gas- and particle-phase is quickly reached because there are few mass-transfer limitations. The smaller αp found here indicates that the particles are highly viscous, i.e., that it takes some time for the particle phase to equilibrate with the gas phase. This is equivalent to saying that the system is kinetically controlled. For systems with lower values of αp, one expects to see more of a seed surface area effect, which is discussed in Sect. 3.2.2.
Since any optimizations involving αpw indicated very small values, for this chamber it appears that ω=0 is closer to reality than ω=1. This is because if αpw≈0, then effectively no gas-phase compounds are condensing onto particles that have already deposited on the chamber wall, which is the same as the assumption that ω≈0.
Chamber data are available upon request and through the Index of Chamber Atmospheric Research in the United States (ICARUS).
JHS supervised the work. RSB performed the filter collection and the UPLC-MS analysis, and conducted experiments U1 and U3–U5. SMC designed the experiments, carried out the modeling, and conducted the rest of the data collection and analysis. SMC wrote the manuscript with contributions from RSB. All authors reviewed and edited the manuscript.
The authors declare that they have no conflict of interest.
The authors would like to thank Yuanlong Huang for his help with the SMPS and CIMS and for his general helpfulness and insight; Benjamin Schulze for his assistance with the AMS; Christopher Kenseth for his assistance with the AMS and UPLC; Lu Xu for his guidance on the AMS analysis; Nathan Dalleska for his help troubleshooting chromatography methods and with UPLC analysis; John Crounse for his general help and for synthesis of CF3O− for the CIMS; Paul Wennberg for the use of his FT-IR and for his insight into the chemistry of the system; Chris Cappa for very helpful comments on an early draft of this paper; and David Cocker III, Weihan Peng, and Qi Li for the use of their SMPS for comparison purposes, suggestions for experimental conditions, and troubleshooting assistance.
This research has been supported by the California Air Resources Board (contract no. 18RD009) and the National Science Foundation (grant no. 1745301).
This paper was edited by Alma Hodzic and reviewed by two anonymous referees.
Aiken, A. C., DeCarlo, P. F., Kroll, J. H., Worsnop, D. R., Huffman, J. A., Docherty, K. S., Ulbrich, I. M., Mohr, C., Kimmel, J. R., Sueper, D., Sun, Y., Zhang, Q., Trimborn, A., Northway, M., Ziemann, P. J., Canagaratna, M. R., Onasch, T. B., Alfarra, M. R., Prevot, A. S. H., Dommen, J., Duplissy, J., Metzger, A., Baltensperger, U., and Jimenez, J. L.: O∕C and OM∕OC Ratios of Primary, Secondary, and Ambient Organic Aerosols with High-Resolution Time-of-Flight Aerosol Mass Spectrometry, Environ. Sci. Technol., 42, 4478–4485, https://doi.org/10.1021/es703009q, 2008. a, b
Arey, J., Aschmann, S. M., Kwok, E. S., and Atkinson, R.: Alkyl Nitrate, Hydroxyalkyl Nitrate, and Hydroxycarbonyl Formation from the NOx-Air Photooxidations of C5–C8 n-Alkanes, J. Phys. Chem. A, 105, 1020–1027, https://doi.org/10.1021/jp003292z, 2001. a
Baghi, R., Helmig, D., Guenther, A., Duhl, T., and Daly, R.: Contribution of flowering trees to urban atmospheric biogenic volatile organic compound emissions, Biogeosciences, 9, 3777–3785, https://doi.org/10.5194/bg-9-3777-2012, 2012. a
Bernard, F., Magneron, I., Eyglunent, G., Daële, V., Wallington, T. J., Hurley, M. D., and Mellouki, A.: Atmospheric chemistry of benzyl alcohol: Kinetics and mechanism of reaction with OH radicals, Environ. Sci. Technol., 47, 3182–3189, https://doi.org/10.1021/es304600z, 2013. a, b, c, d
Brégonzio-Rozier, L., Siekmann, F., Giorio, C., Pangui, E., Morales, S. B., Temime-Roussel, B., Gratien, A., Michoud, V., Ravier, S., Cazaunau, M., Tapparo, A., Monod, A., and Doussin, J.-F.: Gaseous products and secondary organic aerosol formation during long term oxidation of isoprene and methacrolein, Atmos. Chem. Phys., 15, 2953–2968, https://doi.org/10.5194/acp-15-2953-2015, 2015. a
Burkholder, J. B., Abbatt, J. P., Barnes, I., Roberts, J. M., Melamed, M. L., Ammann, M., Bertram, A. K., Cappa, C. D., Carlton, A. M. G., Carpenter, L. J., Crowley, J. N., Dubowski, Y., George, C., Heard, D. E., Herrmann, H., Keutsch, F. N., Kroll, J. H., McNeill, V. F., Ng, N. L., Nizkorodov, S. A., Orlando, J. J., Percival, C. J., Picquet-Varrault, B., Rudich, Y., Seakins, P. W., Surratt, J. D., Tanimoto, H., Thornton, J. A., Zhu, T., Tyndall, G. S., Wahner, A., Weschler, C. J., Wilson, K. R., and Ziemann, P. J.: The Essential Role for Laboratory Studies in Atmospheric Chemistry, Environ. Sci. Technol., 51, 2519–2528, https://doi.org/10.1021/acs.est.6b04947, 2017. a
Canagaratna, M. R., Jimenez, J. L., Kroll, J. H., Chen, Q., Kessler, S. H., Massoli, P., Hildebrandt Ruiz, L., Fortner, E., Williams, L. R., Wilson, K. R., Surratt, J. D., Donahue, N. M., Jayne, J. T., and Worsnop, D. R.: Elemental ratio measurements of organic compounds using aerosol mass spectrometry: characterization, improved calibration, and implications, Atmos. Chem. Phys., 15, 253–272, https://doi.org/10.5194/acp-15-253-2015, 2015. a, b
Cappa, C. D., Zhang, X., Loza, C. L., Craven, J. S., Yee, L. D., and Seinfeld, J. H.: Application of the Statistical Oxidation Model (SOM) to Secondary Organic Aerosol formation from photooxidation of C12 alkanes, Atmos. Chem. Phys., 13, 1591–1606, https://doi.org/10.5194/acp-13-1591-2013, 2013. a
Carter, W. P. L., Malkina, I. L., Cocker III, D. R., and Song, C.: Environmental Chamber Studies Of VOC Species In Architectural Coatings And Mobile Source Emissions, Tech. rep., Center for Environmental Research and Technology, University of California, available at: http://citeseerx.ist.psu.edu/viewdoc/summary?doi=10.1.1.81.305 (last access: 20 August 2020), 2005. a
Charan, S. M., Kong, W., Flagan, R. C., and Seinfeld, J. H.: Effect of particle charge on aerosol dynamics in Teflon environmental chambers, Aerosol Sci. Tech., 52, 854–871, https://doi.org/10.1080/02786826.2018.1474167, 2018. a, b
Charan, S. M., Huang, Y., and Seinfeld, J. H.: Computational Simulation of Secondary Organic Aerosol Formation in Laboratory Chambers, Chem. Rev., 119, 11912–11944, https://doi.org/10.1021/acs.chemrev.9b00358, 2019. a, b, c, d, e
Dommen, J., Metzger, A., Duplissy, J., Kalberer, M., Alfarra, M. R., Gascho, A., Weingartner, E., Prevot, A. S., Verheggen, B., and Baltensperger, U.: Laboratory observation of oligomers in the aerosol from isoprene/NOx photooxidation, Geophys. Res. Lett., 33, 1–5, https://doi.org/10.1029/2006GL026523, 2006. a, b
Donahue, N. M., Kroll, J. H., Pandis, S. N., and Robinson, A. L.: A two-dimensional volatility basis set – Part 2: Diagnostics of organic-aerosol evolution, Atmos. Chem. Phys., 12, 615–634, https://doi.org/10.5194/acp-12-615-2012, 2012. a
EPA, U. S.: Green Book: PM-2.5 (2012) Designated Area/State Information with Design Values, available at: https://www3.epa.gov/airquality/greenbook/kbtcw.html (last access: 20 August 2020), 2012. a
Farmer, D. K., Matsunaga, A., Docherty, K. S., Surratt, J. D., Seinfeld, J. H., Ziemann, P. J., and Jimenez, J. L.: Response of an aerosol mass spectrometer to organonitrates and organosulfates and implications for atmospheric chemistry, P. Natl. Acad. Sci. USA, 107, 6670–6675, https://doi.org/10.1073/pnas.0912340107, 2010. a, b, c
Fry, J. L., Draper, D. C., Zarzana, K. J., Campuzano-Jost, P., Day, D. A., Jimenez, J. L., Brown, S. S., Cohen, R. C., Kaser, L., Hansel, A., Cappellin, L., Karl, T., Hodzic Roux, A., Turnipseed, A., Cantrell, C., Lefer, B. L., and Grossberg, N.: Observations of gas- and aerosol-phase organic nitrates at BEACHON-RoMBAS 2011, Atmos. Chem. Phys., 13, 8585–8605, https://doi.org/10.5194/acp-13-8585-2013, 2013. a, b
Gao, S., Ng, N. L., Keywood, M., Varutbangkul, V., Bahreini, R., Nenes, A., He, J., Yoo, K. Y., Beauchamp, J. L., Hodyss, R. P., Flagan, R. C., and Seinfeld, J. H.: Particle Phase Acidity and Oligomer Formation in Secondary Organic Aerosol, Environ. Sci. Technol., 38, 6582–6589, https://doi.org/10.1021/es049125k, 2004. a
Goldstein, A. H. and Galbally, I. E.: Known and Unexplored Organic Constituents in the Earth's Atmosphere, Environ. Sci. Technol., 41, 1514–1521, https://doi.org/10.1021/es072476p, 2007. a
Hamilton, J. F., Webb, P. J., Lewis, A. C., and Reviejo, M. M.: Quantifying small molecules in secondary organic aerosol formed during the photo-oxidation of toluene with hydroxyl radicals, Atmos. Environ., 39, 7263–7275, https://doi.org/10.1016/j.atmosenv.2005.09.006, 2005. a, b
Harrison, J. C. and Wells, J. R.: Gas-phase chemistry of benzyl alcohol: Reaction rate constants and products with OH radical and ozone, Atmos. Environ., 43, 798–804, https://doi.org/10.1016/j.atmosenv.2008.11.001, 2009. a, b, c, d
Horvat, R. J., Chapman, G. W., Robertson, J. A., Meredith, F. I., Scorza, R., Callahan, A. M., and Morgens, P.: Comparison of the Volatile Compounds from Several Commercial Peach Cultivars, J. Agr. Food Chem., 38, 234–237, https://doi.org/10.1021/jf00091a051, 1990. a
Huang, Y., Zhao, R., Charan, S. M., Kenseth, C. M., Zhang, X., and Seinfeld, J. H.: Unified Theory of Vapor–Wall Mass Transport in Teflon-Walled Environmental Chambers, Environ. Sci. Technol., 52, 2134–2142, https://doi.org/10.1021/acs.est.7b05575, 2018. a
Iinuma, Y., Böge, O., and Herrmann, H.: Methyl-nitrocatechols: Atmospheric tracer compounds for biomass burning secondary organic aerosols, Environ. Sci. Technol., 44, 8453–8459, https://doi.org/10.1021/es102938a, 2010. a
Ikemori, F., Nakayama, T., and Hasegawa, H.: Characterization and possible sources of nitrated mono- and di-aromatic hydrocarbons containing hydroxyl and/or carboxyl functional groups in ambient particles in Nagoya, Japan, Atmos. Environ., 211, 91–102, https://doi.org/10.1016/j.atmosenv.2019.05.009, 2019. a
IPCC: Climate Change 2014: Synthesis report, Tech. rep., Intergovernmental Panel on Climate Change, Geneva, Switzerland, https://doi.org/10.1017/CBO9781107415324, 2014. a
Kenseth, C. M., Huang, Y., Zhao, R., Dalleska, N. F., Hethcox, J. C., Stoltz, B. M., and Seinfeld, J. H.: Synergistic O3 + OH oxidation pathway to extremely low-volatility dimers revealed in β-pinene secondary organic aerosol, P. Natl. Acad. Sci. USA, 115, 8301–8306, https://doi.org/10.1073/pnas.1804671115, 2018. a, b
Kiendler-Scharr, A., Mensah, A. A., Friese, E., Topping, D., Nemitz, E., Prevot, A. S. H., Äijälä, M., Allan, J., Canonaco, F., Canagaratna, M., Carbone, S., Crippa, M., Dall Osto, M., Day, D. A., De Carlo, P., Di Marco, C. F., Elbern, H., Eriksson, A., Freney, E., Hao, L., Herrmann, H., Hildebrandt, L., Hillamo, R., Jimenez, J. L., Laaksonen, A., McFiggans, G., Mohr, C., O'Dowd, C., Otjes, R., Ovadnevaite, J., Pandis, S. N., Poulain, L., Schlag, P., Sellegri, K., Swietlicki, E., Tiitta, P., Vermeulen, A., Wahner, A., Worsnop, D., and Wu, H.-C.: Ubiquity of organic nitrates from nighttime chemistry in the European submicron aerosol, Geophys. Res. Lett., 43, 7735–7744, https://doi.org/10.1002/2016GL069239, 2016. a
Kroll, J. H., Ng, N. L., Murphy, S. M., Flagan, R. C., and Seinfeld, J. H.: Secondary organic aerosol formation from isoprene photooxidation under high-NOx conditions, Geophys. Res. Lett., 32, 1–4, https://doi.org/10.1029/2005GL023637, 2005. a, b
Kroll, J. H., Ng, N. L., Murphy, S. M., Flagan, R. C., and Seinfeld, J. H.: Secondary organic aerosol formation from isoprene photooxidation, Environ. Sci. Technol., 40, 1869–1877, https://doi.org/10.1021/es0524301, 2006. a, b
Li, W., Li, L., Chen, C. l., Kacarab, M., Peng, W., Price, D., Xu, J., and Cocker, D. R.: Potential of select intermediate-volatility organic compounds and consumer products for secondary organic aerosol and ozone formation under relevant urban conditions, Atmos. Environ., 178, 109–117, https://doi.org/10.1016/j.atmosenv.2017.12.019, 2018. a, b
Liu, X., Day, D. A., Krechmer, J. E., Brown, W., Peng, Z., Ziemann, P. J., and Jimenez, J. L.: Direct measurements of semi-volatile organic compound dynamics show near-unity mass accommodation coefficients for diverse aerosols, Commun. Chem., 2, 98, https://doi.org/10.1038/s42004-019-0200-x, 2019. a
Mai, H., Kong, W., Seinfeld, J. H., and Flagan, R. C.: Scanning DMA Data Analysis II. Integrated DMA-CPC Instrument Response and Data Inversion, Aerosol Sci. Tech., 6826, 1–35, https://doi.org/10.1080/02786826.2018.1528006, 2018. a
Mannucci, P. M., Harari, S., Martinelli, I., and Franchini, M.: Effects on health of air pollution: a narrative review, Intern. Emerg. Med., 10, 657–662, https://doi.org/10.1007/s11739-015-1276-7, 2015. a
McDonald, B. C., de Gouw, J. A., Gilman, J. B., Jathar, S. H., Akherati, A., Cappa, C. D., Jimenez, J. L., Lee-Taylor, J., Hayes, P. L., McKeen, S. A., Cui, Y. Y., Kim, S.-W., Gentner, D. R., Isaacman-VanWertz, G., Goldstein, A. H., Harley, R. A., Frost, G. J., Roberts, J. M., Ryerson, T. B., and Trainer, M.: Volatile chemical products emerging as largest petrochemical source of urban organic emissions, Science, 359, 760–764, https://doi.org/10.1126/science.aaq0524, 2018. a, b, c, d
McMurry, P. and Rader, D.: Aerosol Wall losses in electrically charged chambers, Aerosol Sci. Tech., 4, 249–268, https://doi.org/10.1080/02786828508959054, 1985. a
Ng, N. L., Kroll, J. H., Chan, A. W. H., Chhabra, P. S., Flagan, R. C., and Seinfeld, J. H.: Secondary organic aerosol formation from m-xylene, toluene, and benzene, Atmos. Chem. Phys., 7, 3909–3922, https://doi.org/10.5194/acp-7-3909-2007, 2007. a, b
Odum, J. R., Hoffmann, T., Bowman, F., Collins, D., Flagan, R. C., and Seinfeld, J. H.: Gas particle partitioning and secondary organic aerosol yields, Environ. Sci. Technol., 30, 2580–2585, https://doi.org/10.1021/es950943+, 1996. a, b, c
Pankow, J. F.: Review and comparative analysis of the theories on partitioning between the gas and aerosol particulate phases in the atmosphere, Atmos. Environ., 21, 2275–2283, https://doi.org/10.1016/0004-6981(87)90363-5, 1987. a, b, c
Pankow, J. F.: An absorption model of gas/particle partitioning of organic compounds in the atmosphere, Atmos. Environ., 28, 185–188, https://doi.org/10.1016/1352-2310(94)90093-0, 1994. a, b, c
Ranney, A. P. and Ziemann, P. J.: Kinetics of Acid-Catalyzed Dehydration of Cyclic Hemiacetals in Organic Aerosol Particles in Equilibrium with Nitric Acid Vapor, J. Phys. Chem. A, 120, 2561–2568, https://doi.org/10.1021/acs.jpca.6b01402, 2016. a
Rollins, A. W., Fry, J. L., Hunter, J. F., Kroll, J. H., Worsnop, D. R., Singaram, S. W., and Cohen, R. C.: Elemental analysis of aerosol organic nitrates with electron ionization high-resolution mass spectrometry, Atmos. Meas. Tech., 3, 301–310, https://doi.org/10.5194/amt-3-301-2010, 2010. a
Sato, K., Takami, A., Isozaki, T., Hikida, T., Shimono, A., and Imamura, T.: Mass spectrometric study of secondary organic aerosol formed from the photo-oxidation of aromatic hydrocarbons, Atmos. Environ., 44, 1080–1087, https://doi.org/10.1016/j.atmosenv.2009.12.013, 2010. a
Schwantes, R. H., Mcvay, R. C., Zhang, X., Coggon, M. M., Lignell, H., Flagan, R. C., Wennberg, P. O., and Seinfeld, J. H.: Science of the Environmental Chamber, in: Advances in Atmospheric Chemistry Volume I, edited by: Barker, J., Steiner, A., and Wallington, T., World Scientific, Singapore, 1–93, 2017a. a
Schwantes, R. H., Schilling, K. A., McVay, R. C., Lignell, H., Coggon, M. M., Zhang, X., Wennberg, P. O., and Seinfeld, J. H.: Formation of highly oxygenated low-volatility products from cresol oxidation, Atmos. Chem. Phys., 17, 3453–3474, https://doi.org/10.5194/acp-17-3453-2017, 2017b. a
Seinfeld, J. H. and Pandis, S. N.: Atmospheric Chemistry and Physics: From Air Pollution to Climate Change, 3rd edn., John Wiley & Sons, Hoboken, USA, 2016. a, b, c
Shrivastava, M., Cappa, C. D., Fan, J., Goldstein, A. H., Guenther, A. B., Jimenez, J. L., Kuang, C., Laskin, A., Martin, S. T., Ng, N. L., Petaja, T., Pierce, J. R., Rasch, P. J., Roldin, P., Seinfeld, J. H., Shilling, J., Smith, J. N., Thornton, J. A., Volkamer, R., Wang, J., Worsnop, D. R., Zaveri, R. A., Zelenyuk, A., and Zhang, Q.: Recent advances in understanding secondary organic aerosol: Implications for global climate forcing, Rev. Geophys., 55, 509–559, https://doi.org/10.1002/2016RG000540, 2017. a
Surratt, J. D., Gómez-González, Y., Chan, A. W. H., Vermeylen, R., Shahgholi, M., Kleindienst, T. E., Edney, E. O., Offenberg, J. H., Lewandowski, M., Jaoui, M., Maenhaut, W., Claeys, M., Flagan, R. C., and Seinfeld, J. H.: Organosulfate Formation in Biogenic Secondary Organic Aerosol, J. Phys. Chem. A, 112, 8345–8378, https://doi.org/10.1021/jp802310p, 2008. a
TCCON Weather Data: Barometric Pressure, available at: http://tccon-weather.caltech.edu/index.php, last access: 20 August 2020. a
Topping, D. and Jones, D.: UManSysProp, available at: http://umansysprop.seaes.manchester.ac.uk/tool/vapour_pressure (last access: 20 August 2020), 2016. a
Trump, E. R., Epstein, S. A., Riipinen, I., and Donahue, N. M.: Wall effects in smog chamber experiments: A model study, Aerosol Sci. Tech., 50, 1180–1200, https://doi.org/10.1080/02786826.2016.1232858, 2016. a, b
Wang, L.: The Atmospheric Oxidation Mechanism of Benzyl Alcohol Initiated by OH Radicals: The Addition Channels, ChemPhysChem, 16, 1542–1550, https://doi.org/10.1002/cphc.201500012, 2015. a, b, c, d, e, f, g, h
Wang, N., Jorga, S. D., Pierce, J. R., Donahue, N. M., and Pandis, S. N.: Particle wall-loss correction methods in smog chamber experiments, Atmos. Meas. Tech., 11, 6577–6588, https://doi.org/10.5194/amt-11-6577-2018, 2018a. a
Wang, N., Kostenidou, E., Donahue, N. M., and Pandis, S. N.: Multi-generation chemical aging of α-pinene ozonolysis products by reactions with OH, Atmos. Chem. Phys., 18, 3589–3601, https://doi.org/10.5194/acp-18-3589-2018, 2018b. a
Weitkamp, E. A., Sage, A. M., Pierce, J. R., Donahue, N. M., and Robinson, A. L.: Organic Aerosol Formation from Photochemical Oxidation of Diesel Exhaust in a Smog Chamber, Environ. Sci. Technol., 41, 6969–6975, https://doi.org/10.1021/es070193r, 2007. a
Yamasaki, H., Kuwata, K., and Miyamoto, H.: Effects of Ambient Temperature on Aspects of Airborne Polycyclic Aromatic Hydrocarbons, Environ. Sci. Technol., 16, 189–194, https://doi.org/10.1021/es00098a003, 1982. a
Zafonte, L., Rieger, P. L., and Holmes, J. R.: Nitrogen Dioxide Photolysis in the Los Angeles Atmosphere, Environ. Sci. Technol., 11, 483–487, https://doi.org/10.1021/es60128a006, 1977. a
Zhang, X., Cappa, C. D., Jathar, S. H., McVay, R. C., Ensberg, J. J., Kleeman, M. J., and Seinfeld, J. H.: Influence of vapor wall loss in laboratory chambers on yields of secondary organic aerosol, P. Natl. Acad. Sci. USA, 111, 5802–5807, https://doi.org/10.1073/pnas.1404727111, 2014. a, b
Zhang, X., Schwantes, R. H., McVay, R. C., Lignell, H., Coggon, M. M., Flagan, R. C., and Seinfeld, J. H.: Vapor wall deposition in Teflon chambers, Atmos. Chem. Phys., 15, 4197–4214, https://doi.org/10.5194/acp-15-4197-2015, 2015. a
Zhang, X., Dalleska, N., Huang, D., Bates, K., Sorooshian, A., Flagan, R., and Seinfeld, J.: Time-resolved molecular characterization of organic aerosols by PILS + UPLC/ESI-Q-TOFMS, Atmos. Environ., 130, 180–189, https://doi.org/10.1016/j.atmosenv.2015.08.049, 2016. a, b
- Abstract
- Introduction
- Instruments and procedure
- Calculations of SOA yield
- SOA yields
- Conclusions
- Appendix A: Organonitrates in the aerosol phase
- Appendix B: Calculation of
- Appendix C: Chamber simulation
- Data availability
- Author contributions
- Competing interests
- Acknowledgements
- Financial support
- Review statement
- References