the Creative Commons Attribution 4.0 License.
the Creative Commons Attribution 4.0 License.
 | 05 Nov 2020
Photovoltaic power potential in West Africa using long-term satellite data
Ina Neher
Susanne Crewell
Stefanie Meilinger
Uwe Pfeifroth
Jörg Trentmann
This paper addresses long-term historical changes in solar irradiance in West Africa (3 to 20∘ N and 20∘ W to 16∘ E) and the implications for photovoltaic systems. Here, we use satellite irradiance (Surface Solar Radiation Data Set – Heliosat, Edition 2.1 – SARAH-2.1) and temperature data from a reanalysis (ERA5) to derive photovoltaic yields. Based on 35 years of data (1983–2017), the temporal and regional variability as well as long-term trends in global and direct horizontal irradiance are analyzed. Furthermore, a detailed time series analysis is undertaken at four locations.
According to the high spatial resolution SARAH-2.1 data record (), solar irradiance is largest (up to a 300 W m−2 daily average) in the Sahara and the Sahel zone with a positive trend (up to 5 W m−2 per decade) and a lower temporal variability (<75 W m−2 between 1983 and 2017 for daily averages). In contrast, the solar irradiance is lower in southern West Africa (between 200 W m−2 and 250 W m−2) with a negative trend (up to −5 W m−2 per decade) and a higher temporal variability (up to 150 W m−2). The positive trend in the north is mostly connected to the dry season, whereas the negative trend in the south occurs during the wet season. Both trends show 95 % significance. Photovoltaic (PV) yields show a strong meridional gradient with the lowest values of around 4 kWh kWp−1 in southern West Africa and values of more than 5.5 kWh kWp−1 in the Sahara and Sahel zone.
- Article
(11750 KB) - Full-text XML
- BibTeX
- EndNote


The United Nations proposed the Sustainable Development Goals to achieve a better and more sustainable future (United Nations, 2015). The seventh goal, to “ensure access to affordable, reliable, sustainable and modern energy for all”, implies a shift away from fossil-fuel-based sources towards renewable energy sources. Particularly in regions with high irradiance, solar power is a promising option (e.g., Haegel et al., 2017; Solangi et al., 2011). However, potential sites and their yield need to be investigated carefully to ensure long-term sustainable investment.
With regard to energy availability and security, West Africa is one of the least developed regions in the world (ECOWAS, 2017). Therefore, the power system will need to be strongly expanded in this region, as a gap exists between electricity supply and demand (Adeoye and Spataru, 2018). West Africa receives high amounts of global horizontal irradiance (GHI) (Solargis, 2019); moreover, due to their locations within the descending branch of the Hadley cell, the Sahara and the Sahel zone are generally dry with little cloudiness, leading to a high sunshine duration (Kothe et al., 2017). Thus, photovoltaic (PV) power seems to be a promising technology in this region, and the development of a PV system would be worthwhile. Before investing in a PV system, three points need to be considered using different resolutions of GHI (the sum of direct irradiance, DIR, and diffuse horizontal irradiance, DHI), which has the major impact on PV systems (Sengupta et al., 2017). First, high spatial resolution GHI is needed to select a profitable location. Second, the long-term variability and trends in the historical GHI can be analyzed as a basis to project future system performance in order to estimate the profitability and risks of the plant. Finally, high temporal resolution GHI can be used to dimension the plant and storage system as well as the maintenance in order to optimize the plant. However, ground-based measurements of irradiance are not available continuously over long-term timescales and cover only a few discrete locations in the region.
Satellite-based irradiance measurements have the advantage that they are available for long time periods and cover wide spatial regions (Gueymard and Wilcox, 2011). In particular, geostationary satellites can deliver data at a temporal resolution of less than 1 h and at a high spatial resolution. Using these data, potential PV yields can be calculated in order to select a profitable location and to analyze the long-term profitability and risks. Furthermore, such data sets enable the analysis of the diurnal variability that needs to be taken into account for storage sizing and power system design. Here, the first point is addressed using the daily averaged data to provide an overview of the potential PV yields over the entire region. The European Organisation for the Exploitation of Meteorological Satellites (EUMETSAT) Satellite Application Facility on Climate Monitoring (CM SAF) provides the Surface Solar Radiation Data Set – Heliosat, Edition 2.1 (SARAH-2.1), a 35-year-long climate data record at a 30 min resolution that covers the whole of Africa and Europe (Pfeifroth et al., 2019a). The validation of this data set using stations from the Baseline Surface Radiation Network (BSRN) shows high quality, with a target accuracy of 15 W m−2 (Pfeifroth et al., 2019b). However, only one of the BSRN stations lies close to the West African region (the majority of the stations are in Europe; see Pfeifroth et al., 2019b, for station details). As solar irradiance is affected by the atmosphere (cloud, aerosol and trace gases), several assumptions regarding optical properties need to be taken into account with respect to the satellite data retrieval. Specifically, aerosol loads can fluctuate greatly (Neher et al., 2019; Slingo et al., 2006), and they reach their highest global values in the West African region (Kinne et al., 2013). Thus, a detailed validation of the full 35-year SARAH-2.1 data set for West Africa is needed and has not yet been performed.
Besides the atmospheric impact, solar irradiance reaching the top layer of a PV power module is affected by the solar zenith and the tilting angle of the module. Furthermore, soiling and reflections on the front of the modules and shade from their surroundings have additional impacts on the amount of radiation that can be transformed to a direct current by the PV cell. The cell temperature (which is impacted by the incoming irradiance, ambient temperature and wind speed) adjusts the efficiency of the PV cell (Skoplaki and Palyvos, 2009). Explicit models for PV power simulation are available (Neher et al., 2019; Ishaque et al., 2011; King et al., 2004); however, they require explicit input data at a high temporal resolution which is often not available. Therefore, a simplified model for PV yield estimations based on daily data has been developed and applied here.
In this study, the central research question “How do long-term atmospheric variability and trends impact photovoltaic yields in West Africa?” is answered by analyzing the SARAH-2.1 data record for the region in question. To give a comprehensive answer, the article is structured using the following sub-questions.
-
How accurate is the SARAH-2.1 data set for the considered region of West Africa?
-
What are the trends and variability in solar irradiance between 1983 and 2017 in West Africa?
-
How different are these trends and variability for varying latitudes and seasons?
-
What implications can be drawn for photovoltaic power?
This article is organized as follows. Section 2 introduces the ground- and satellite-based data. Methodologies to estimate photovoltaic power are described in Sect. 3. The satellite data validation with ground-based measurements is presented in Sect. 4. The variability and trend analysis of the GHI and DIR for the time period from 1983 to 2017 is shown in Sect. 5. Furthermore, the temporal variability at different latitudes is analyzed. Section 6 estimates the implications of solar irradiance variability and trends for PV yields focusing on West Africa, using a simplified yield estimation based on measurements at three locations. Finally, the conclusions are given in Sect. 7.
West Africa (which is defined as the region from 3 to 20∘ N and from 20∘ W to 16∘ E in this study) is a region with a pronounced dry and wet season. In large parts of West Africa one wet season occurs during the summer months, the duration of which decreases with rising latitude; however, two wet seasons occur along the coastal region (typically during June and July and during September). Nevertheless, here we use one single definition of seasons according to Mohr (2004): one dry season from October to April and one wet season from May to September. To reinforce our results, we performed the analysis with a sharper definition of seasons (a dry season from November to March, and a wet season from June to August) and found similar results. The difference in seasons is mainly caused by the West African monsoon (WAM) circulation and the intertropical convergence zone (ITCZ). The ITCZ moves from north to south and back in an annual cycle according to the seasons (north during the wet and south during the dry season). West Africa is generally rather flat with the highest elevations typically below 1000 m (Fig. 1a, Global Land One-km Base Elevation Project, GLOBE, database; Hastings and Dunbar, 1999). Some exceptions are Mount Cameroon in the southeast of the study area along the border of Nigeria and Cameroon, Fouta Djallon and the Guinea Highlands in Guinea, Jos Plateau in the center of Nigeria and the Aïr Mountains in northern Niger. In these regions (as well as locally for lower mountain ranges) orographically enhanced cloudiness might occur. The enhanced cloudiness associated with the moist tropical region is clearly visible in the mean cloud albedo used as input for the SARAH-2.1 data retrieval between 1983 and 2017 (see Fig. 1b, from the SARAH-2.1 data set described later). Clouds have the major influence on the irradiance analyzed in this study. The West African climate zones related to the albedo climatology (used for the SARAH-2.1 data retrieval) have a higher albedo of up to 0.35 in the desert region in the north and a lower albedo of down to 0.1 in the forest region in the south (see Fig. 1c; Surface and Atmospheric Radiation Budget, SARB, data from Clouds and the Earth’s Radiant Energy System, CERES). Frequent dust outbreaks occur over the entire region (Cowie et al., 2014); therefore, the highest climatological aerosol optical depth (AOD) of up to 0.35 can be found in northern Mali (see Fig. 1d, from the European Center for Medium Range Weather Forecast, Monitoring Atmospheric Composition and Climate, MACC, and used for the SARAH-2.1 data retrieval). However, in local measurements, AOD values reach daily averages of up to 4 in the Sahel region (AERONET, 2014). Hence, aerosols can have a high impact on the irradiance (independent of clouds) and, in turn, on solar power (Neher et al., 2019).
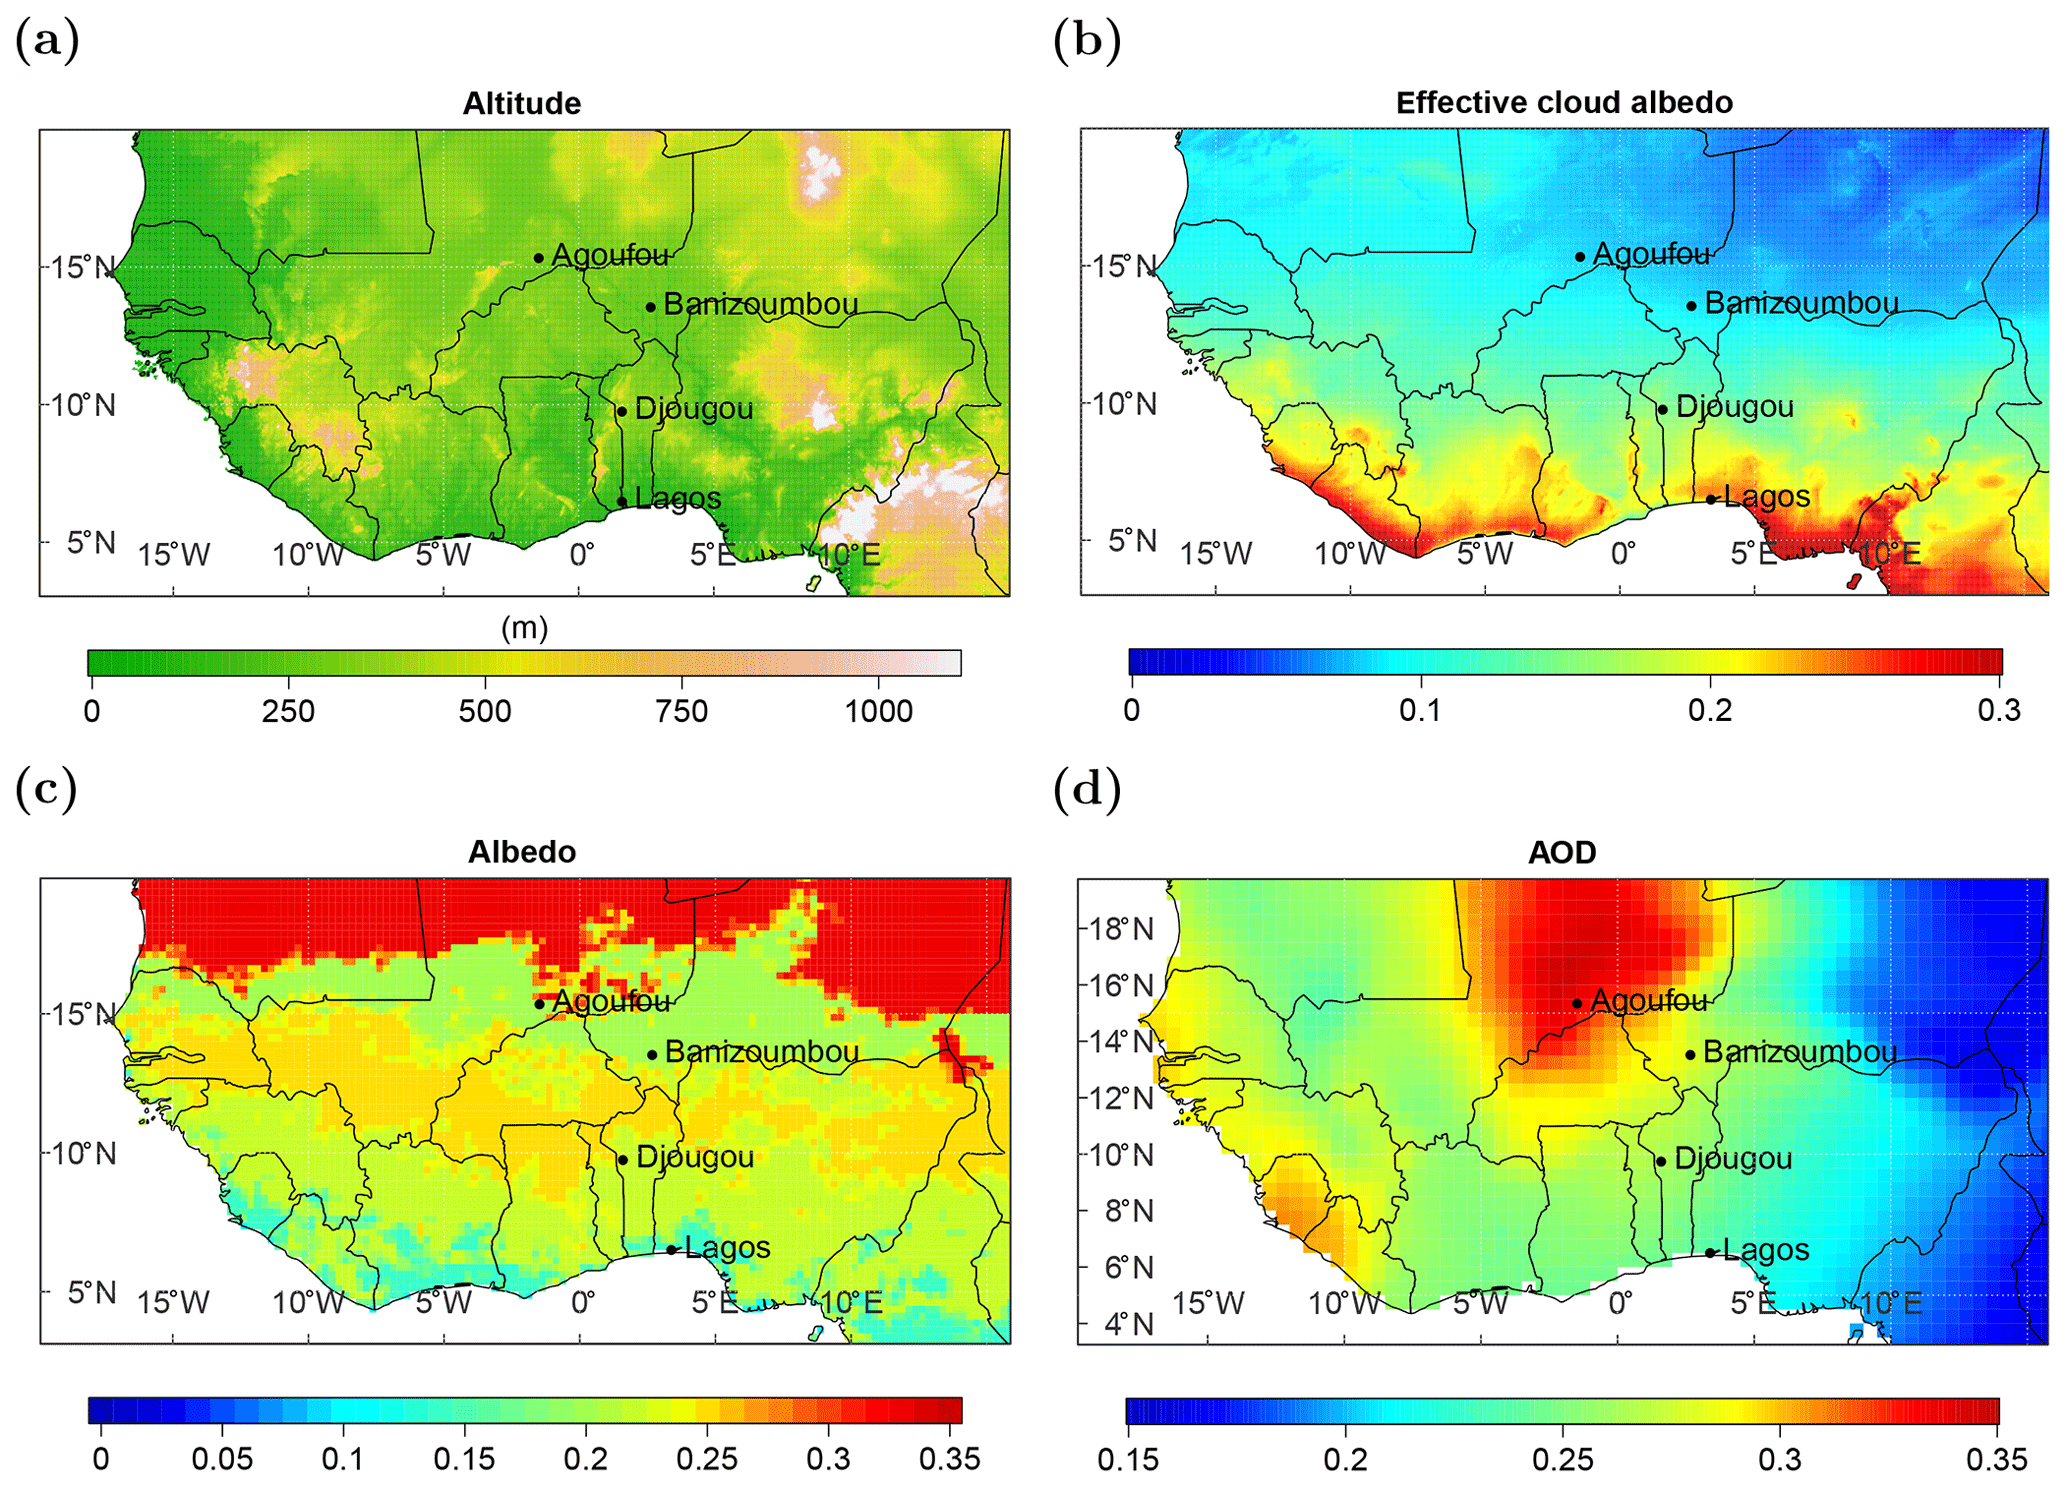
Figure 1(a) Topography of the region considered (Global Land One-km Base Elevation Project, GLOBE, database; Hastings and Dunbar, 1999), (b) mean cloud albedo between 1983 and 2017 (from the SARAH-2.1 data set described in Sect. 2.1), (c) albedo climatology (Surface and Atmospheric Radiation Budget, SARB, data from Clouds and the Earth's Radiant Energy System, CERES) and (d) aerosol optical depth climatology (European Center for Medium Range Weather Forecast, Monitoring Atmospheric Composition and Climate, MACC). The locations of the three ground-based sites (Agoufou, Banizoumbou and Djougou) and the additional location used for the time series analysis in Sect. 5.2 (Lagos) are marked.
2.1 Satellite-based data
The Surface Solar Radiation Data Record – Heliosat, Edition 2.1 (SARAH-2.1), data set is provided by the EUMETSAT CM SAF and covers the time period from 1983 to 2017 (Pfeifroth et al., 2019a, 2018). In addition to other parameters, the data set provides the surface incoming shortwave radiation (GHI), the surface incoming direct radiation (DIR), the direct normal irradiance (DNI) and the effective cloud albedo (CAL). The products of SARAH-2.1 are retrieved from the first- and second-generation geostationary METEOSAT satellite service, covering the whole of West Africa with a 30 min temporal and a spatial resolution. For the retrieval, the Heliosat algorithm to estimate the effective cloud albedo (Hammer et al., 2003) is combined with a cloud-free radiative transfer model (Mueller et al., 2012). Furthermore, several climatological parameters are used for the retrieval: the precipitable water vapor (ERA-Interim), the monthly AOD climatology (see Fig. 1d, MACC), the monthly ozone climatology (standard US atmosphere) and the surface albedo (see Fig. 1c, SARB data from CERES). For the generation of the SARAH-2.1 data record, the visible channel (0.5–0.9 µm) of the METEOSAT Visible and Infrared Imager (MVIRI) is used until 2005, and the two visible channels (0.6 and 0.8 µm) of the Spinning Enhanced Visible and Infrared Imager (SEVIRI) are used after 2005. A detailed description of the retrieval is given in Mueller et al. (2015) and references therein.
The advantage of the SARAH-2.1 data set compared with SARAH-1 is a higher stability in early years (due to the removal of erroneous satellite images) and during the transition from the first- to second-generation METEOSAT satellite in 2006. Furthermore, the water vapor climatology used was topographically corrected and the consideration of situations with high zenith angles was improved to account for an overestimation of cloud detection at low satellite viewing angles. A mean absolute error (MAE; in comparison to 15 BSRN stations between 1994 and 2017) of 5.5 and 11.7 W m−2 for the respective monthly and daily GHI is reached (Pfeifroth et al., 2019b).
In this study, the SARAH-2.1 data record (GHI and DIR at a daily resolution) is used for the trend and variability analysis over the whole 35 years and for the entire region. Daily and monthly means of the GHI are compared to the measured GHI at the three African Monsoon Multidisciplinary Analysis (AMMA) sites. CM SAF SARAH-2.1 data are downloaded as daily and monthly averaged data. A detailed description of the averaging approach can be found in Trentmann and Pfeifroth (2019). Instantaneous (30 min) data are used to estimate PV yields at the three AMMA sites to develop a simpler empirical PV model. The 30 min records were linearly interpolated using the diurnal cycle of the clear-sky irradiance, and the temporal resolution of the measured meteorological data (ambient temperature and wind speed) was adjusted to the satellite data.
2.2 Ground-based data
Ground-based measurements of the GHI complemented by ancillary data over several years are available from the African Monsoon Multidisciplinary Analysis program (AMMA, 2018; Redelsperger et al., 2006) at three sites (Agoufou, Mali; Banizoumbou, Niger; and Djougou, Benin; Fig. 1). The sites are distributed over different land areas: one desert site, one site in the Sahel region and one site in the savanna. The data availability is limited to several years at the beginning of the 21st century. All relevant parameters, including the location, instrument information and measuring times are summarized in Table 1. Additionally, measurements of ambient temperature and wind speed were taken at the three sites during the AMMA campaign. AMMA data are measured at a 15 min resolution. To calculate robust daily averages, each of the 15 min values for a day needs to be available to calculating the mean. If only one measurement is missing, the day is disregarded. Monthly averages are calculated if there are at least 10 daily averages available over the month.
Campbell Scientific (2010)Skye Instruments (2019)Kipp and Zonen (2019)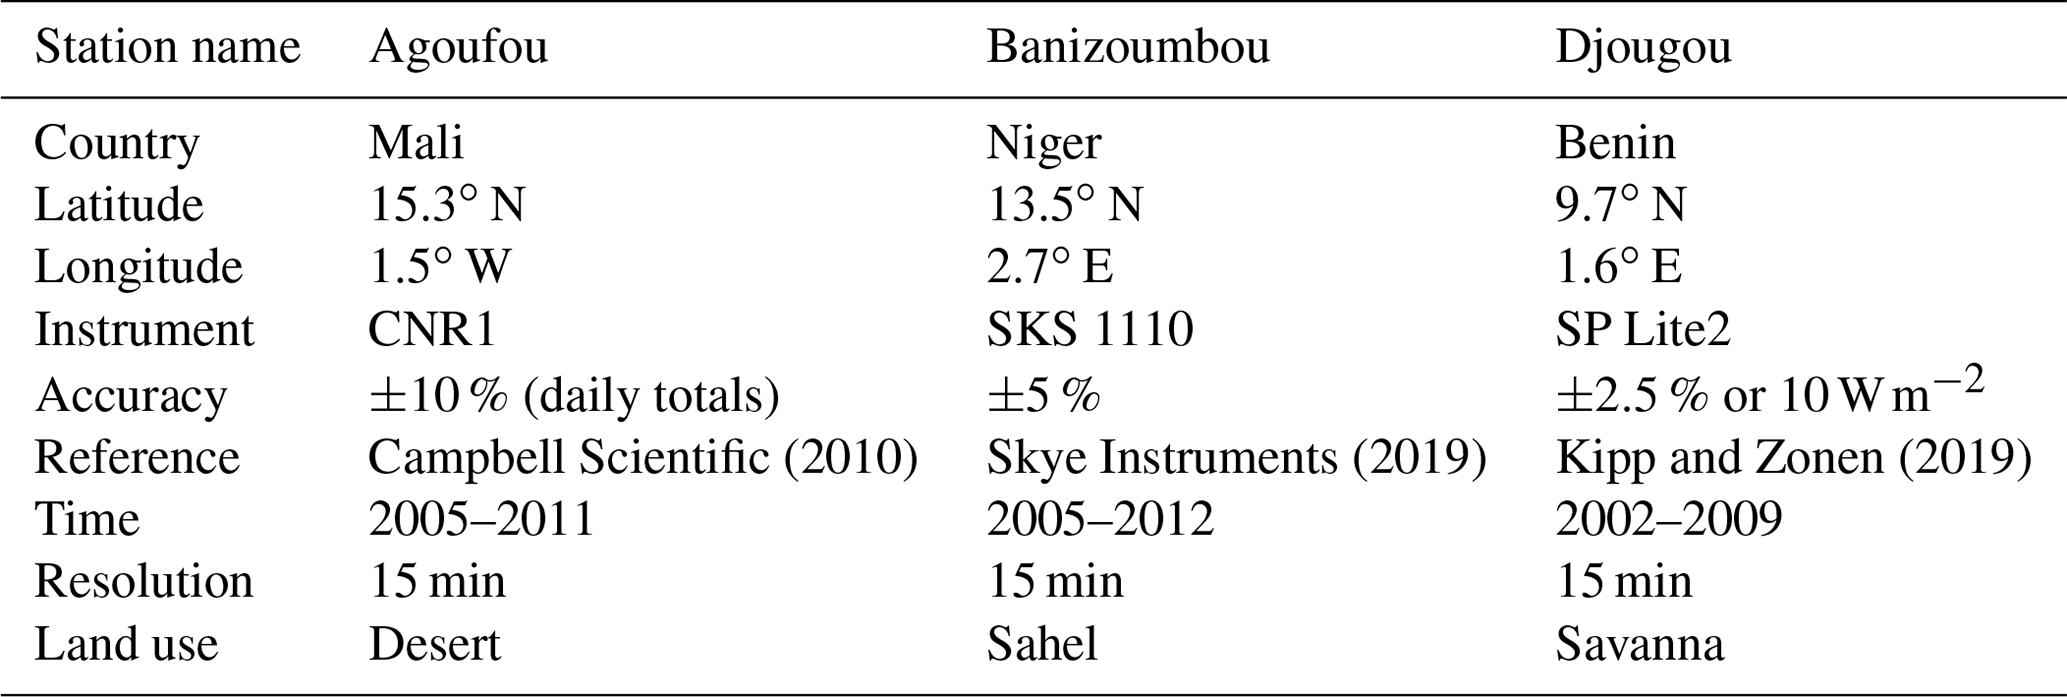
At all sites, AOD measurements from the Aerosol Robotic Network (AERONET Holben et al., 1998) are available. The AOD measurements are retrieved from solar radiances at certain wavelengths and are cloud screened during post-processing (Giles et al., 2019). Here, the Level 2.0, Version 3, quality-assured data set at a wavelength of 440 nm is used. For the comparison with daily satellite data (see Sect. 4), daily averages are downloaded from AERONET (AERONET, 2014); thus, all data series of 1 d are averaged. Monthly averages are calculated as previously described for the AMMA data set.
Our ultimate goal is to describe the PV potential over the entire region for a standardized PV power plant. For this purpose, a simplified linear regression is fitted on the basis of the three reference sites where the necessary information is available. Furthermore, the uncertainties concerning cell temperature are estimated (see Sect. 3.2) and the GHI used (from the SARAH-2.1 data set) is validated (see Sect. 4). Therefore, ERA5 data are used (Hersbach et al., 2020; Copernicus Climate Change Service, 2017) for the daily mean temperature. The ERA5 archive is based on a global reanalysis and is available from 1979 onward. The single calculation steps, including all necessary input data, are shown in Fig. 2.
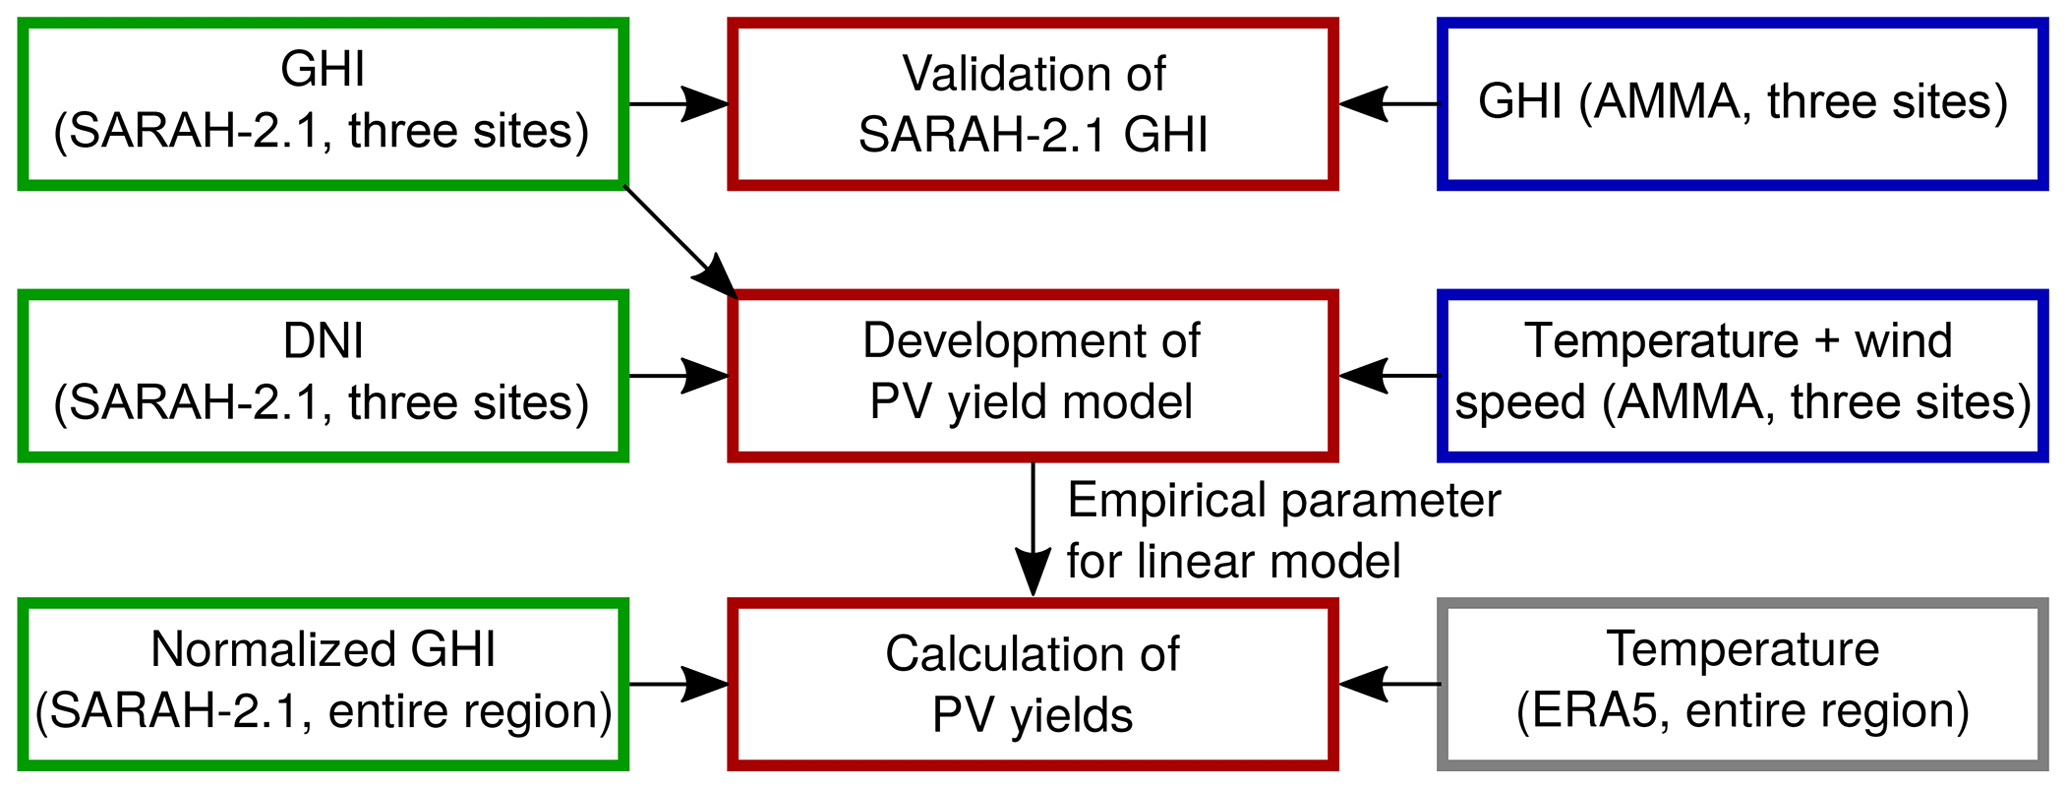
Figure 2Connection of calculation steps (red) within this study, including all of the input data required (green denotes satellite data, gray denotes reanalysis data and blue denotes observational data).
3.1 Model development
To estimate the PV power potential, an empirical linear model is developed with a temporal resolution of 1 d, using a normalized GHI (from SARAH-2.1) as input. This linear model is derived by simplifying the widely known two-diode model (e.g., Ishaque et al., 2011). For this purpose, explicit PV power calculations are integrated over the diurnal cycle using AMMA measurements (ambient temperature and wind speed) and SARAH-2.1 data (GHI and DIR) at the three measuring sites as input for the full model, serving as a reference and to train the linear model.
The two-diode equation calculates the current (I) – voltage (U) – characteristics of a PV module from cell temperature Tc, global tilted irradiance (GTI) and typical modules characteristics:
Thus, two diodes (D1 and D2) are assumed in parallel, with differing saturation currents ( and ), each depending on the cell temperature. The diode “ideality factors” (n1 and n2) are constant: n1=1 and n2=2 (Salam et al., 2010). Furthermore, two resistors are connected, one in parallel (RP) for the description of leakage currents and one in series (RS) for the description of voltage drops, with a constant value for the system. The thermal voltage UT is proportional to the cell temperature. A parallel current source can be assumed for the rayed solar cell. The current source produces the photocurrent IPH(GTI,Tc) depending on the incoming solar irradiance and the cell temperature. Thus, the following simplification is possible:
where f is a function, which depend on the cell temperature, the current and the voltage.
The photocurrent depends linearly on the incoming tilted irradiance and is the major term of I(U),
By assuming a typical silicon PV module (SolarWorld 235 poly; SolarWorld, 2012), the modules characteristics are given by A, where STC denotes the short circuit current at standard test conditions, Ki=0.00034 ISC K−1 is the temperature coefficient for the current, and and GHISTC=1000 W m−2 are the STC conditions for the PV modules. By simplifying Eq. (3) with (for the typical cell temperature of 46 ∘C used in the PV community and STC, the right term would be 0.06 A), the temperature dependence is ignored here. The maximum power point (MPP) is calculated as the product of I and U, and the PV yield PVy is derived as the integrated MPP over each day:
The linear relation of the PV yields and incoming irradiance is used for a simplified linear model for the daily PV yield (PVy):
For our purpose, it is sufficient to replace GTI with a normalized GHI (GHInorm; also to reduce the seasonal variability) from SARAH-2.1, which is calculated by dividing the GHI by the cosine of the minimum daily zenith angle. Note that due to the high importance of the cell temperature, the fitting parameters (Eq. 5) depend on temperature. The parameter b indicates the impact of the inverter, as it requires a certain amount of power to work. The slope a indicates the efficiency, including the conversion of watts per square meter (W m−2) to kilowatt hours per kilowatt peak (kWh kWp−1). Uncertainties due to a varying temperature and the coefficients ai(T) and bi(T) are estimated by calculating the explicit PV power, including temperature, at three sites and its variability (see Sect. 3.2).
To determine ai(T) and bi(T) explicit PV power calculations are undertaken using the PV power model part of the “Solar Power modeling including atmospheric Radiative Transfer” (SolPaRT) model at Agoufou (Mali), Banizoumbou (Niger) and Djougou (Benin) at a 15 min resolution (Neher et al., 2019). These calculations require knowledge of the incoming radiation on the tilted plane and cell temperature over the diurnal cycle. These parameters can be derived using the GHI, DIR, the solar zenith angle, the ambient temperature and the wind speed. The impact of soiling and shading is excluded here, as these factors are highly dependent on the local conditions and the cleaning cycle of the modules. For the explicit calculations, the SARAH-2.1 data record of the GHI, depending on the solar zenith angle, and the modules orientation (latitude assumed as the tilt and southern orientation) are used to determine the radiation on the tilted plane. Assuming an installation with 11 modules (typical size of one row in a PV plant and several can be connected in parallel), the inverter is only slightly (96 %) over-dimensioned, as high irradiance is expected in the region considered. The input data for the model calculations, including the sources, are summarized in Table 2.

3.2 Uncertainties of PV yield estimation
The PV power is explicitly calculated (using Eq. 1, the temperature information from AMMA, and the GHI and DIR from SARAH-2.1) at the three measurement sites (Agoufou, Mali; Banizoumbou, Niger; and Djougou, Benin) at a 15 min resolution. For each day, the PV yield (integral over each day and normalization over the plant peak – given in kWh kWp−1) is derived. On a daily basis the GHI itself depends on atmospheric conditions (clouds, aerosols and greenhouse gases) and season (solar zenith angle). PV yields are highly correlated with the daily mean normalized GHI (see Fig. 3).
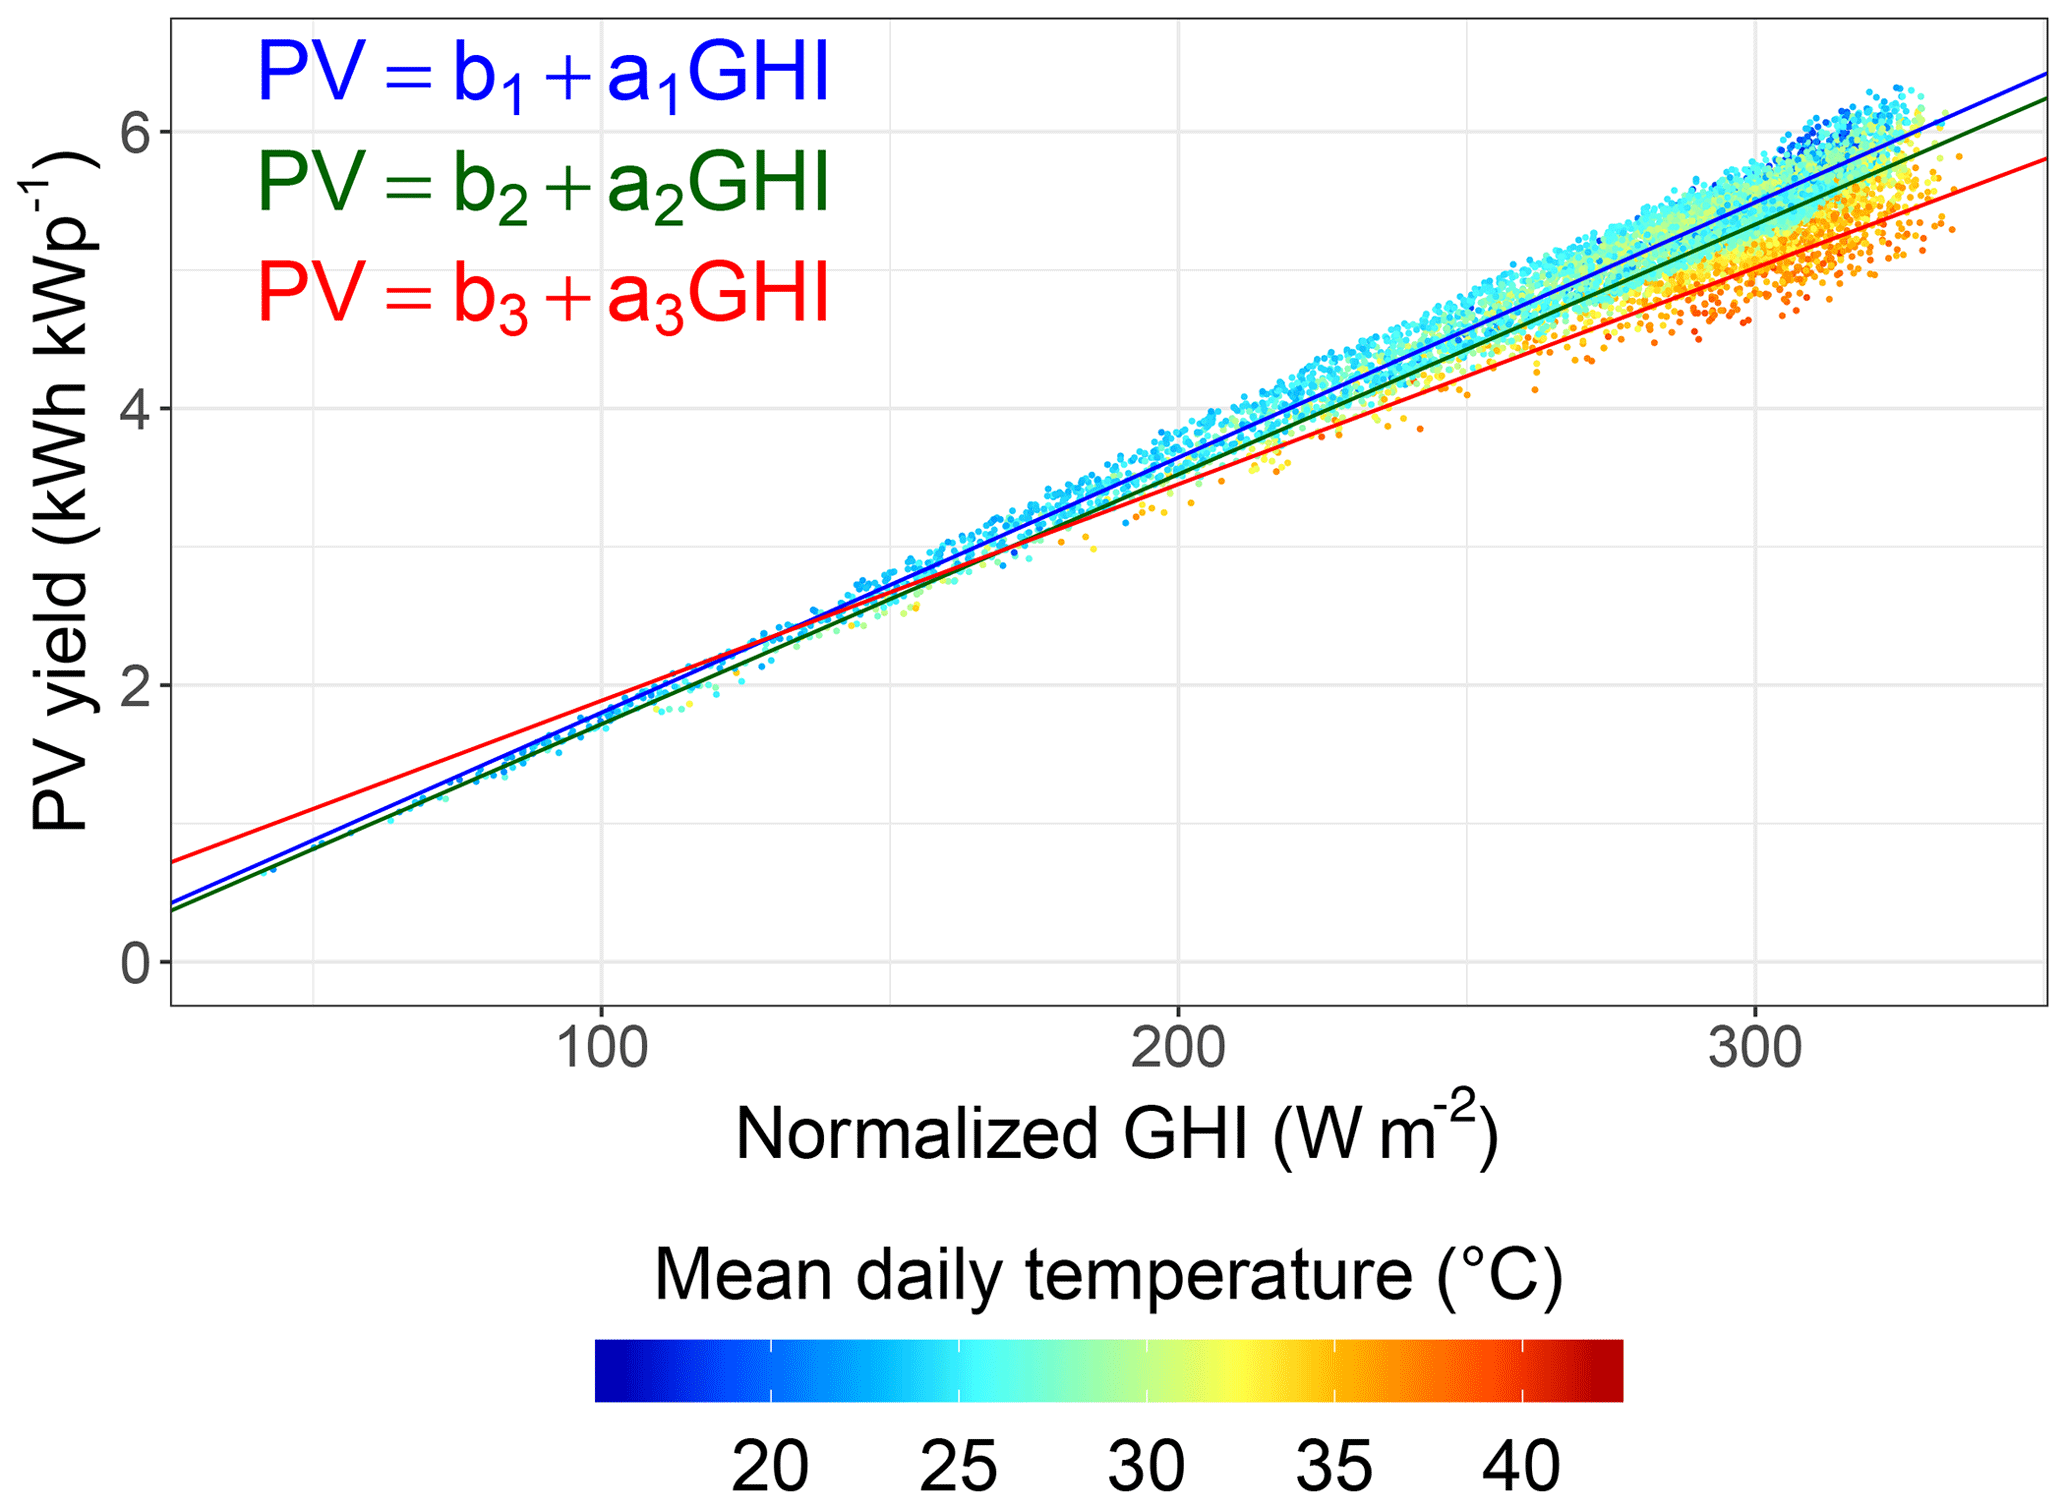
Figure 3PV yield as a function of normalized global horizontal irradiance combining the calculations at all three measurement sites at three temperature levels: (blue), (green), and (red). The mean daily temperature is marked as shown in the color bar.
However, the mean daily temperature additionally impacts PV yields. Therefore, three regression lines (see Equation 5) are determined at different temperature levels, (blue), (green) and (red). No further significant improvement was found for a finer separation into more temperature classes. The mean daily temperature values from ERA5 are used to define the temperature level of each point during each time step. The explained variance (R2) is highest for the lowest temperature ranges (0.98) and increases (0.78) for the highest (see Table 3). The root mean square error (RMSE) and R2 as well as the single fitting parameters ai and bi are summarized in Table 3.
Table 3Statistical and fitting parameters of PV yield correlation.
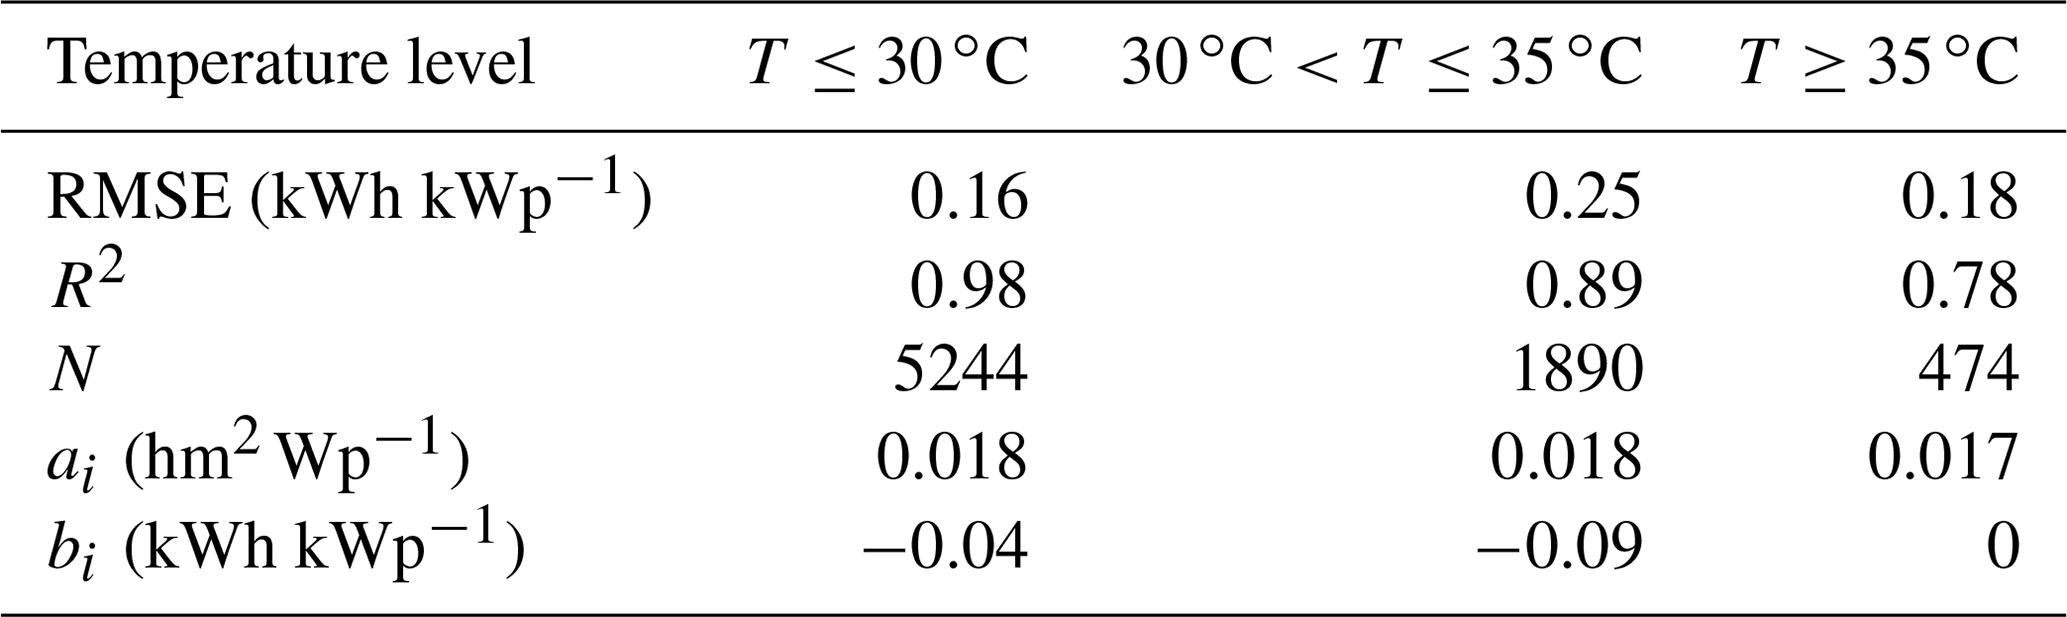
The slope a decreases at increasing temperatures. The parameter b was set to zero for , as it can not be positive for physical reasons. The uncertainty is highest at the highest temperature level (RMSE: ±0.67 kWh kWp−1) and lowest at the lowest temperature level (RMSE: ±0.16 kWh kWp−1). The variability in PV yields increases with the normalized GHI for two reasons: first, temperature levels can reach higher values at a higher normalized GHI, which would induce a higher reduction of PV yields compared with lower temperature levels; second, the temperature effect on PV yields is relative and can reach higher effective PV yield reductions at a higher normalized GHI.
Previous studies have compared the SARAH-2.1 GHI to ground-based measurements from the BSRN (Pfeifroth et al., 2019b), as they provide benchmarks for accuracy (±2 % or 5 W m−2 for GHI). However, there is currently no BSRN station running in West Africa; therefore, we use ground-based measurements of the GHI from the AMMA campaign at three sites for the satellite data validation (see Table 1). The comparison of the SARAH-2.1 GHI with the observed GHI is conducted for daily and monthly means (see Fig. 4). Statistical parameters, i.e., R2, root mean square error (RMSE), MAE and bias, are used for comparison.

Figure 4Comparison of the simulated and observed GHI as daily (left column) and monthly (middle column) averages at three sites over the given time horizon: (a) Agoufou (2005–2008), (b) Banizoumbou (2005–2012) and (c) Djougou (2002–2009). The difference between the measured AOD and the climatological AOD for the satellite data retrieval (ΔAOD) is indicated using color. If no measured AOD is available, the points are gray. The third column shows the correlation between ΔAOD and ΔGHI (ΔGHI refers to the observed GHI minus the satellite GHI).
In Banizoumbou (Fig. 4b; MAE of 15.8 W m−2 for daily and 7.6 W m−2 for monthly means), the SARAH-2.1 performance is consistent with a previous evaluation against BSRN stations (Pfeifroth et al., 2019b). Similarly, the bias of −0.9 % to −1.2 %, the R2 of around 0.8, and the RMSE of 20.1 W m−2 for the daily mean GHI and 9.5 W m−2 for the monthly mean GHI are of the same order of magnitude as those found by Pfeifroth et al. (2019b). However, the GHI is overestimated at the two other sites (bias of up to 12 %). At the desert site (Agoufou), the R2 is only 0.5 for the monthly mean GHI. Due to the sandy environment, dust deposition on the measurement equipment might have caused errors in the GHI observations (measurement uncertainties are 2 % in Banizoumbou and Djougou and 10 % in Agoufou). Furthermore, the measurement equipment instrument maintenance is unknown and could be a source of additional uncertainty. In Djougou (savanna site), the overestimation is comparably high with a bias of 12 % and an MAE of over 25 W m−2. The monthly mean GHI values generally show higher accuracy, as the variability is reduced due to averaging.
The three sites provide evidence of a higher MAE in West Africa (up to 27.6 W m−2) compared with the validation with mainly European BSRN stations in Pfeifroth et al. (2019b) (MAE: 11.7 W m−2) for the daily GHI. One reason for this deviation could be the generally higher GHI in West Africa (Solargis, 2019) compared with Europe (where most of the BSRN stations used are located). Furthermore, higher aerosol loads, which are not explicitly treated in the satellite retrieval, in West Africa compared with the rest of the world could also cause the deviation.
To study whether deviations from the climatological AOD used in SARAH-2.1 (see Fig. 1d) might explain the deviation, we investigate the impact of the difference between the measured AOD and the climatological AOD for the satellite data retrieval (ΔAOD). A higher overestimation of the GHI was found at higher ΔAOD at all sites (up to 100 W m−2 for 1<ΔAOD <2; see Fig. 4, the colors in scatter plots and the right column). Therefore, the correlation between ΔAOD and ΔGHI (the latter being the difference between the observed and satellite GHI) shows an overall overestimation at higher ΔAOD in Agoufou and Djougou, whereas an underestimation is visible in some situations in Banizoumbou. The absence of a systematic effect raises our confidence in the use of satellite data to provide an overview of PV potential in West Africa.
As the climatological AOD used in the SARAH-2.1 retrieval shows values between 0.15 and 0.3 (see Fig. 1d), high ΔAOD (e.g., values above 0.5) are connected to high aerosol loads (e.g., dust outbreaks and biomass burning; Marticorena et al., 2011). Thus, the missing explicit treatment of AOD in the satellite retrieval could be a reason for the low accuracy here. Especially during events with high aerosol loads, an explicit treatment in the SARAH-2.1 data retrieval could improve the accuracy of the GHI. Using only values with ΔAOD <0.5, the RMSE is reduced by around 1 % to 30 % (Agoufou: 29 % for daily and 25 % for monthly GHI; Banizoumbou: 6 % for daily and 1 % for monthly GHI; Djougou: 13 % for daily and 30 % for monthly GHI).
Ineichen (2010) compared the ground-based measured GHI to different satellite products in Africa for the single year of 2006, including several AMMA sites in West Africa, and found standard deviations between 12 % and 37 % as well as a bias between −1 % and 11 %. These values lie within a similar range to our calculations. However, especially during the West African summer monsoon, low-level clouds are likely not realistically represented in satellite products and climate models in southern West Africa (Hannak et al., 2017; Linden et al., 2015). Hannak et al. (2017) found an overestimation of the GHI of up to 50 W m−2 in the rainy season (July–September) for SARAH-1 data in comparison with measurements in southern West Africa between 1983 and 2008. In Kothe et al. (2017), monthly sums of sunshine duration from SARAH-2 (1983–2015) were compared to Global Climate Data (CLIMAT) (Deutscher Wetterdienst, 2019) in Europe and Africa. At several stations in West Africa, they found an overestimation of more than 50 h of satellite-based monthly sunshine duration compared with CLIMAT. The majority of the CLIMAT stations are located on the southern edge of the Sahel region or south of it. Thus, the findings are especially relevant for southern West Africa. Pfeifroth et al. (2019b) analyzed the accuracy of the SARAH-2 data record for Europe and found a slight decadal but stable trend of −0.8 W m−2.
Given these results, we conclude that the SARAH-2.1 data record can be used to get an overview of the temporal and spatial irradiance variability as well as an overview of trends in order to estimate the PV potential in West Africa. However, especially in southern West Africa, the systematical overestimation of solar irradiance in the SARAH-2.1 data set (Kniffka et al., 2019; Hannak et al., 2017) needs to be considered in the conclusions of the variability and trend analysis. As a consequence of the positive offset in southern West Africa, the actual north–south gradient in the satellite data set is underestimated. In particular, the systematic offset would not have an impact on the trend analysis. Overall, an expansion of measurements over longer time periods (the measured data are available for less than 20 % of the time period and at only three sites) could increase the significance of our validation.
In this section, the temporal and spatial variability in the GHI and DIR is analyzed for West Africa (latitude from 3 to 20∘ N and longitude from 20∘ W to 16∘ E) over a 35-year time period (1983–2017). Therefore, the temporal mean and its interquartile range (IQR; identifying the range for 50 % of the data with the 25 % and 75 % quantile as borders) are derived. The analysis is conducted based on the daily values. For GHI, the analysis is expanded for the respective dry and the wet seasons. Furthermore, a trend analysis is undertaken for the GHI by assuming a simple linear trend based on annual values. The significance of the trend is checked by calculating the 95 % confidence interval. The trends are significantly positive (negative) if the upper and lower value of the 95 % confidence interval are positive (negative). At four locations, distributed over different latitudes, a time series analysis is additionally undertaken. Monthly means and monthly anomalies are derived for all seasons separately.
5.1 Spatial analysis
The spatial distribution of the annual mean GHI and DIR are shown in Fig. 5. For each grid point, the IQR of all daily mean values is also provided for the GHI and DIR.
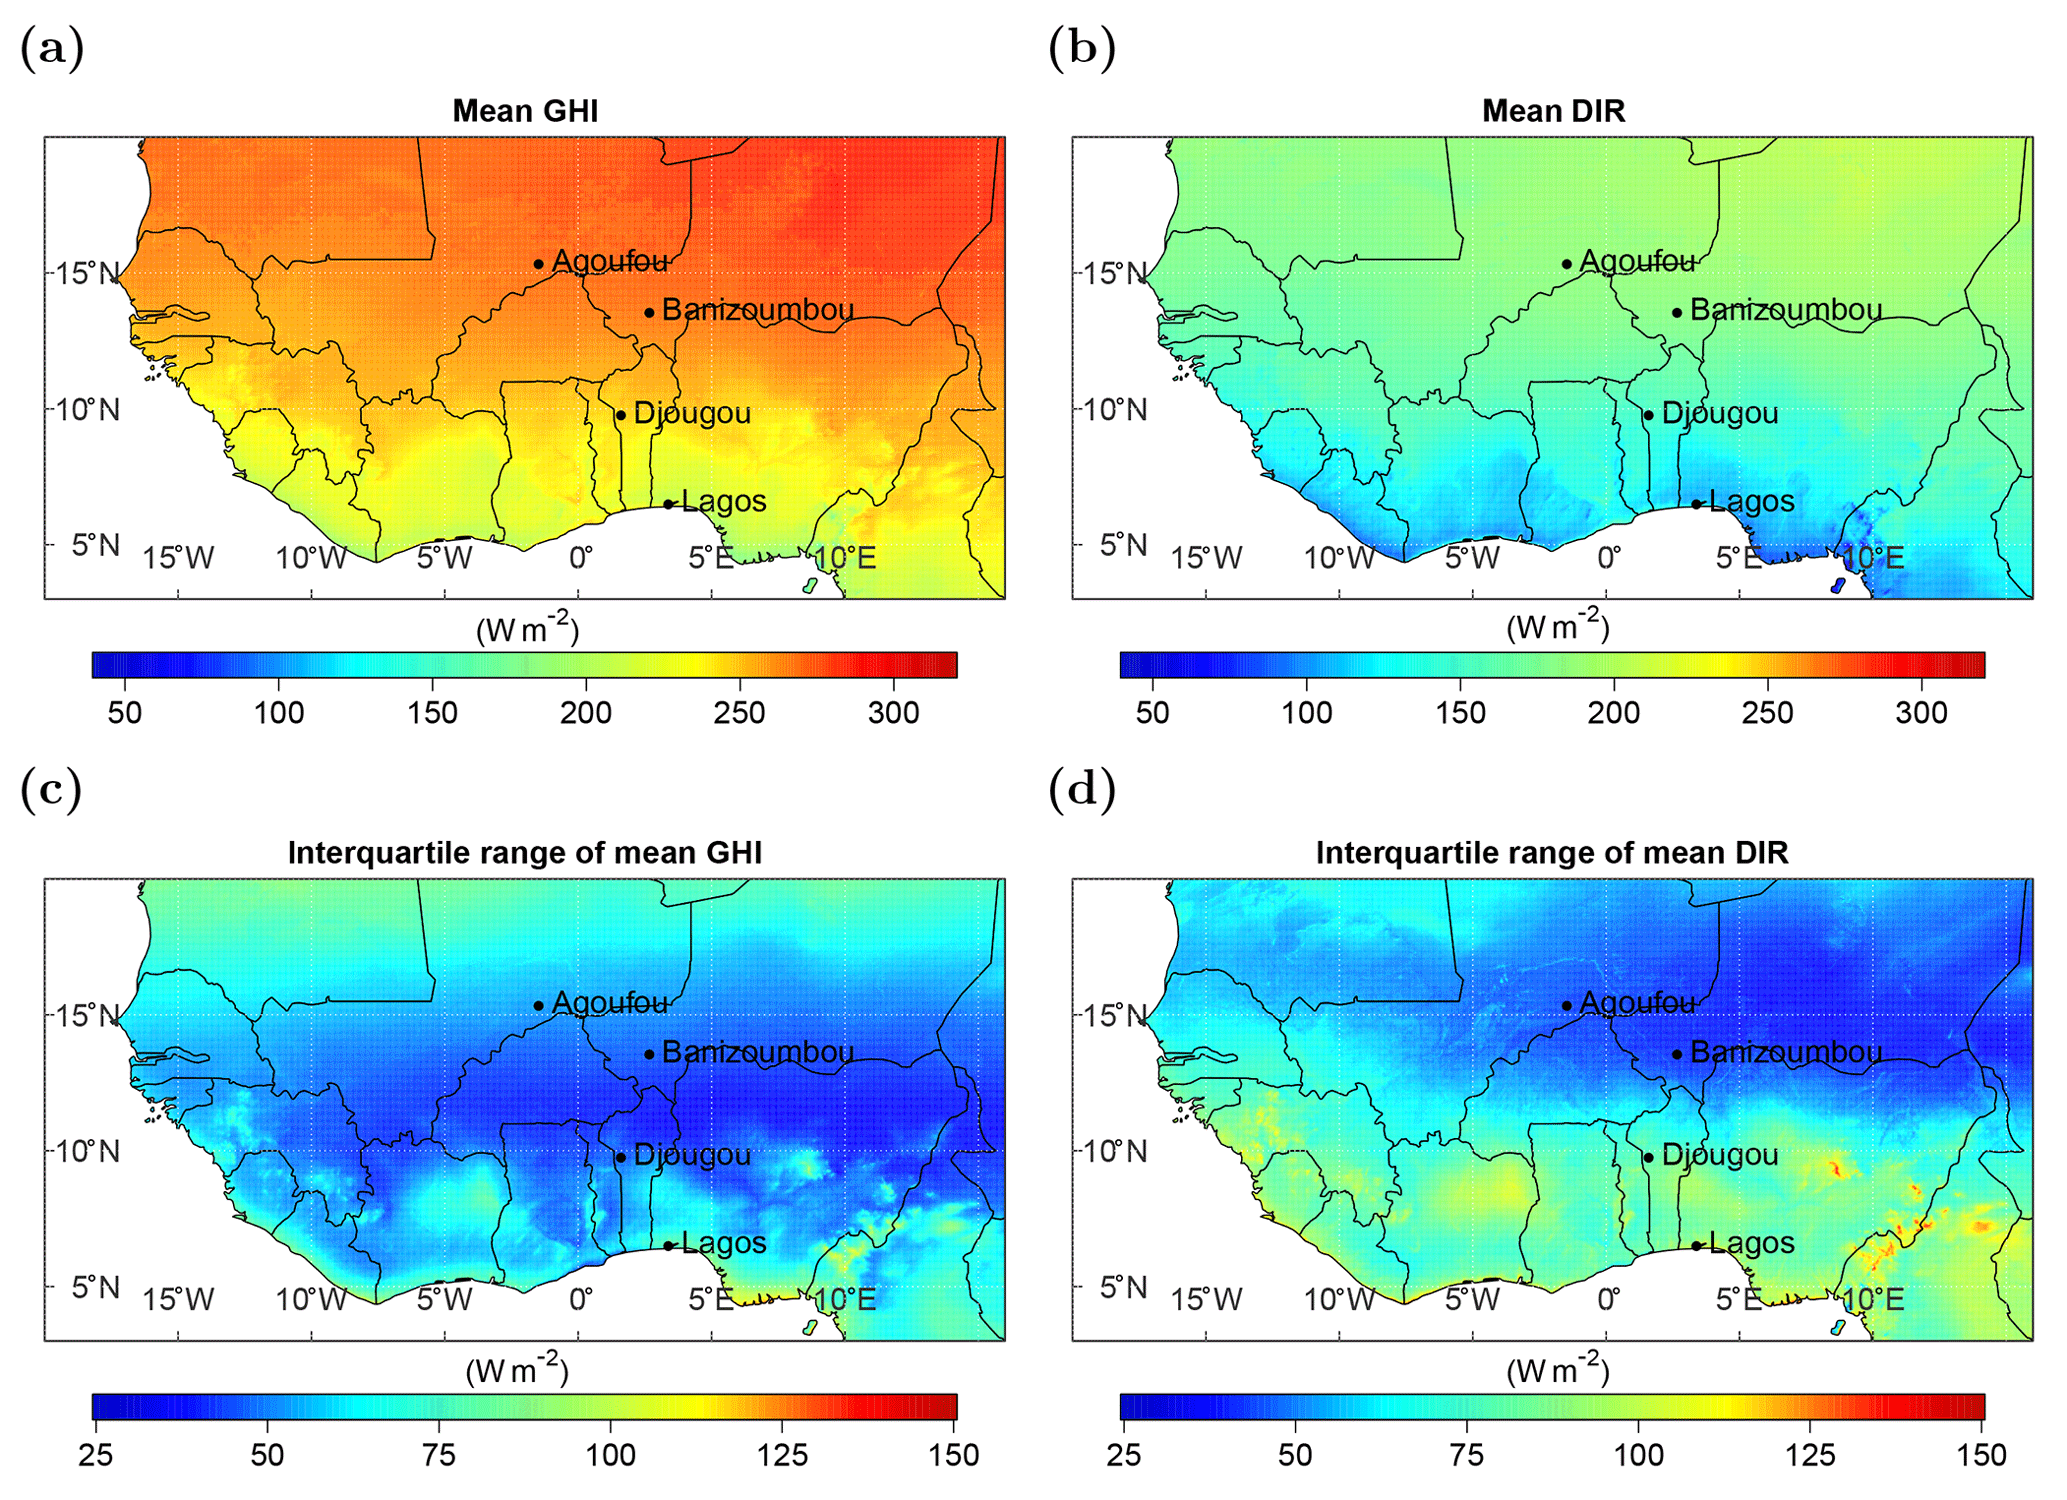
Figure 5Mean (1983–2017) global horizontal irradiance (a) and direct horizontal irradiance (b) with their respective temporal interquartile ranges given in panels (c) and (d).
The irradiance is high in the Sahel zone and the Sahara (with a GHI >250 W m−2 and a DIR of around 200 W m−2 north of around 13∘ N; see Fig. 5a and b). Towards the southern coast the irradiance decreases as the cloud cover increases (see Fig. 1b). The impact of clouds seems to be especially high in southern West Africa, south of the Sahel zone. However, the satellite-retrieved GHI might even be overestimated in this region (see Sect. 4). The temporal variability is higher in southern West Africa (locally up to 150 W m−2) than in the Sahara and the Sahel zone (higher IQR in the south compared with the north), especially for the DIR in coastal or mountainous regions, and is typical for variable cloud conditions. The impact of clouds on the DIR is higher than on the GHI, as forward-scattered light on cloud droplets is still included in the GHI but not in the DIR. The high amount of water vapor in coastal regions could favor the formation of clouds and could, therefore, be a reason for the higher variability in the DIR. Furthermore, the wet season is actually longer in southern West Africa than in the northern regions (CLISS, 2016), which leads to longer periods with high cloud cover that could be further favored by orographic cloud development (see Fig. 1b). However, the same analysis with a more confined definition of seasons (the dry season from November to March and the wet season from May to August) leads to similar results.
When looking at the dry and wet seasons separately, the spatial GHI distribution reveals a complementary structure (see Fig. 6; including the difference in the temporal IQR).
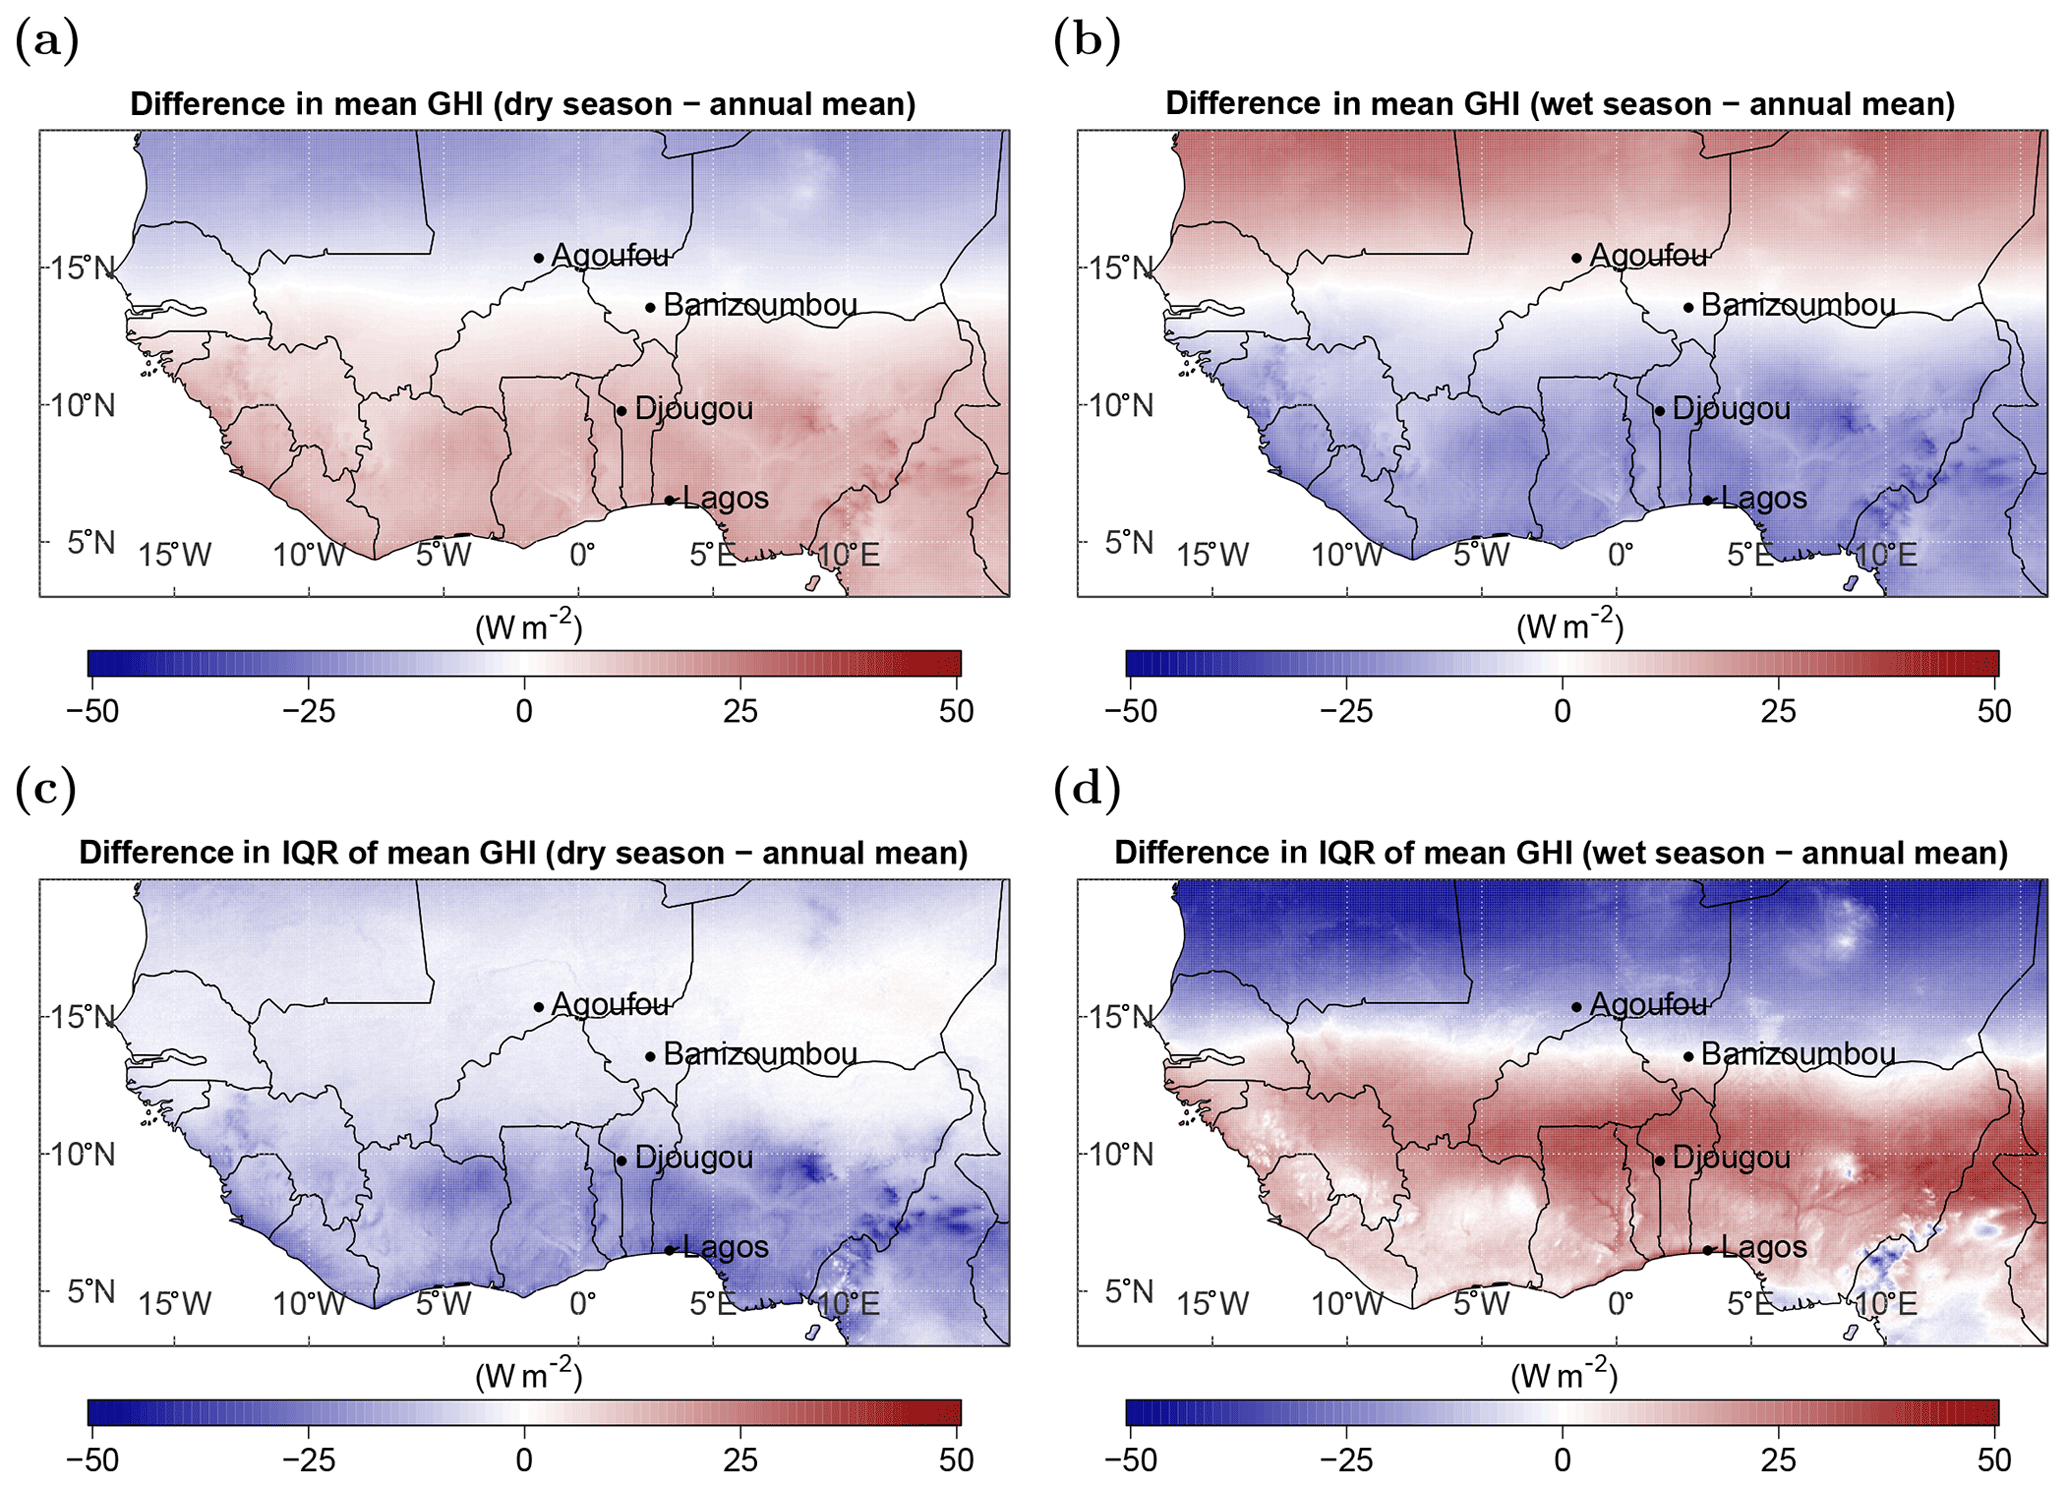
Figure 6The difference between the mean annual GHI and the mean seasonal GHI during the dry season (a) and the wet season (b), and the difference in their respective interquartile ranges (c, d).
For the GHI, a sharp line at around 13 to 14∘ N divides the northern region of the Sahel zone and the Sahara from southern West Africa. North of this line, the GHI is lower than the annual mean (up to −26 W m−2) during the dry season and higher (up to +36 W m−2) during the wet season. The northern region experiences low cloudiness throughout the year (the mean effective cloud albedo is lower than 0.1 in the major part of this region; see Fig. 1b). Therefore, the irradiance mainly depends on the solar zenith angle, which is lower during the wet season than during the dry season. Lower solar zenith angles result in higher surface irradiance under clear-sky conditions. In southern West Africa (south of 13∘ N), the GHI is higher (up to +33 W m−2) during the dry season and lower (up to −46 W m−2) during the wet season, compared with the annual mean. Cloudiness is comparably high in this region (with a mean effective cloud albedo of up to 0.3; see Fig. 1b). Therefore, clouds are the major modulator of solar irradiance in this area. As clouds predominantly occur during the wet season, the GHI is lower during this season.
The difference in the temporal variability is given as the difference in the IQR (season – annual mean). During the dry season, the temporal variability in the GHI shows an overall reduction over land compared with the annual mean. However, in southern West Africa the reduction reaches more than −50 W m−2, whereas the reduction is hardly visible in the northern regions. During the wet season, the temporal variability in the GHI shows the same sharp boundary at around 13 to 14∘ N as the GHI. The temporal variability is lower (reaching more than a −50 W m−2 difference) in northern West Africa and higher (reaching more than a +50 W m−2 difference) in southern West Africa compared with the annual mean. This variability is mainly driven by the WAM, which occurs during the wet season (Sultan et al., 2003).
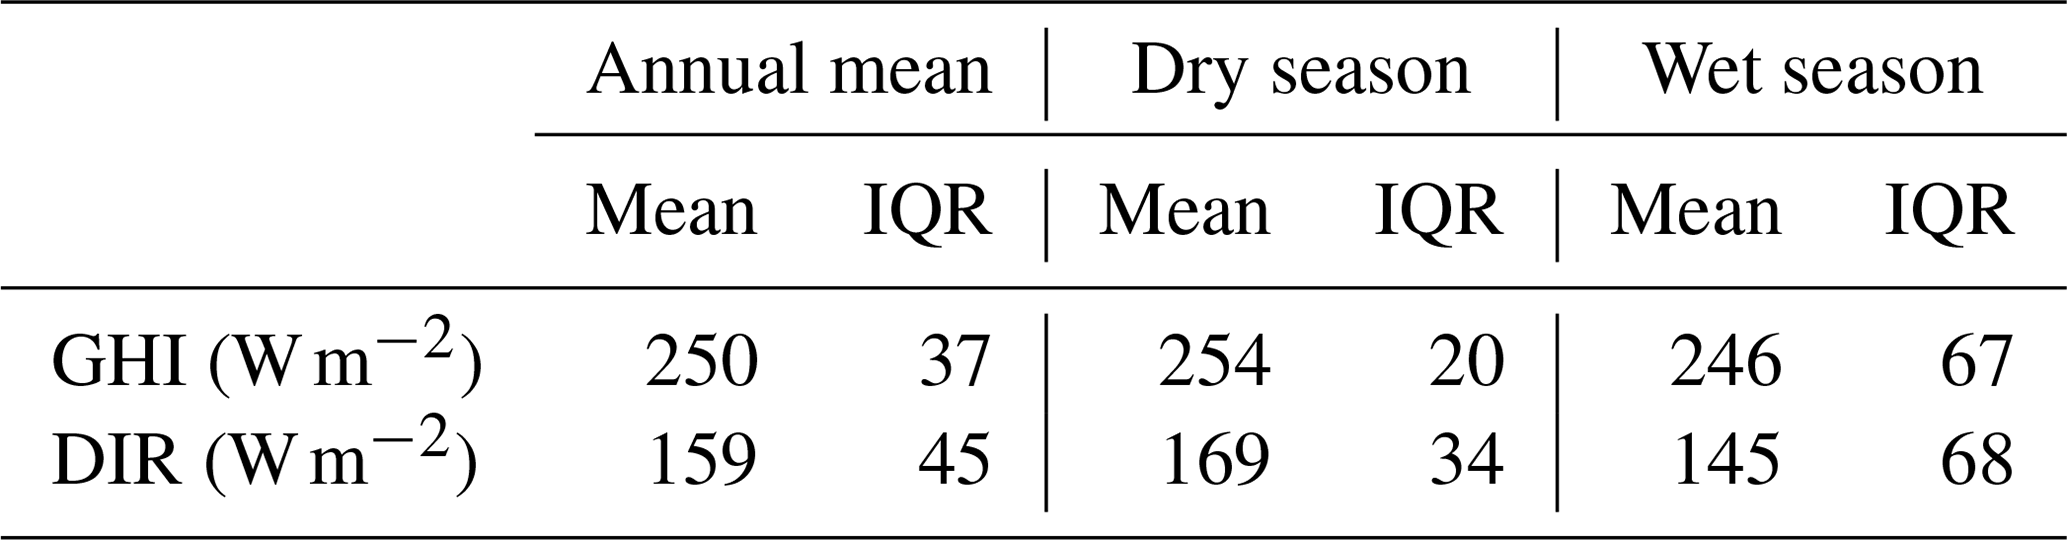
The regional mean and its IQR (concerning the spatial variability) for the GHI and DIR are summarized in Table 4. The regional variability in the solar irradiance is higher during the wet season than in the dry season, as clouds, which predominantly occur during the wet season, have a large impact on solar radiation. During the wet season, the regional variability of the GHI is within a similar range to that of the DIR, with an IQR of 67 W m−2 for the GHI and 68 W m−2 for the DIR. As the mean DIR is smaller than the mean GHI, the percentage variability is higher for the DIR. This is a clear sign that variable cloudiness leads to a higher variability in diffuse irradiance.
Table 4Regional mean and regional interquartile range (IQR) of the temporal mean GHI and DIR between 1983 and 2017 for the annual mean, the dry season and the wet season.
5.2 Temporal analysis
The results show strong gradients between the north and south as well as between the wet and the dry season. To detect anomalies and changes in variability along the north–south axis, four locations are chosen for a time series analysis of the SARAH-2.1 data record (the three measuring sites from Sect. 4 and one coastal location – Lagos, Nigeria, 6.5∘ N, 3.4∘ E; see Fig. 7). The respective data record (see Sect. 2.1) is used between 1983 and 2017 at a daily resolution.
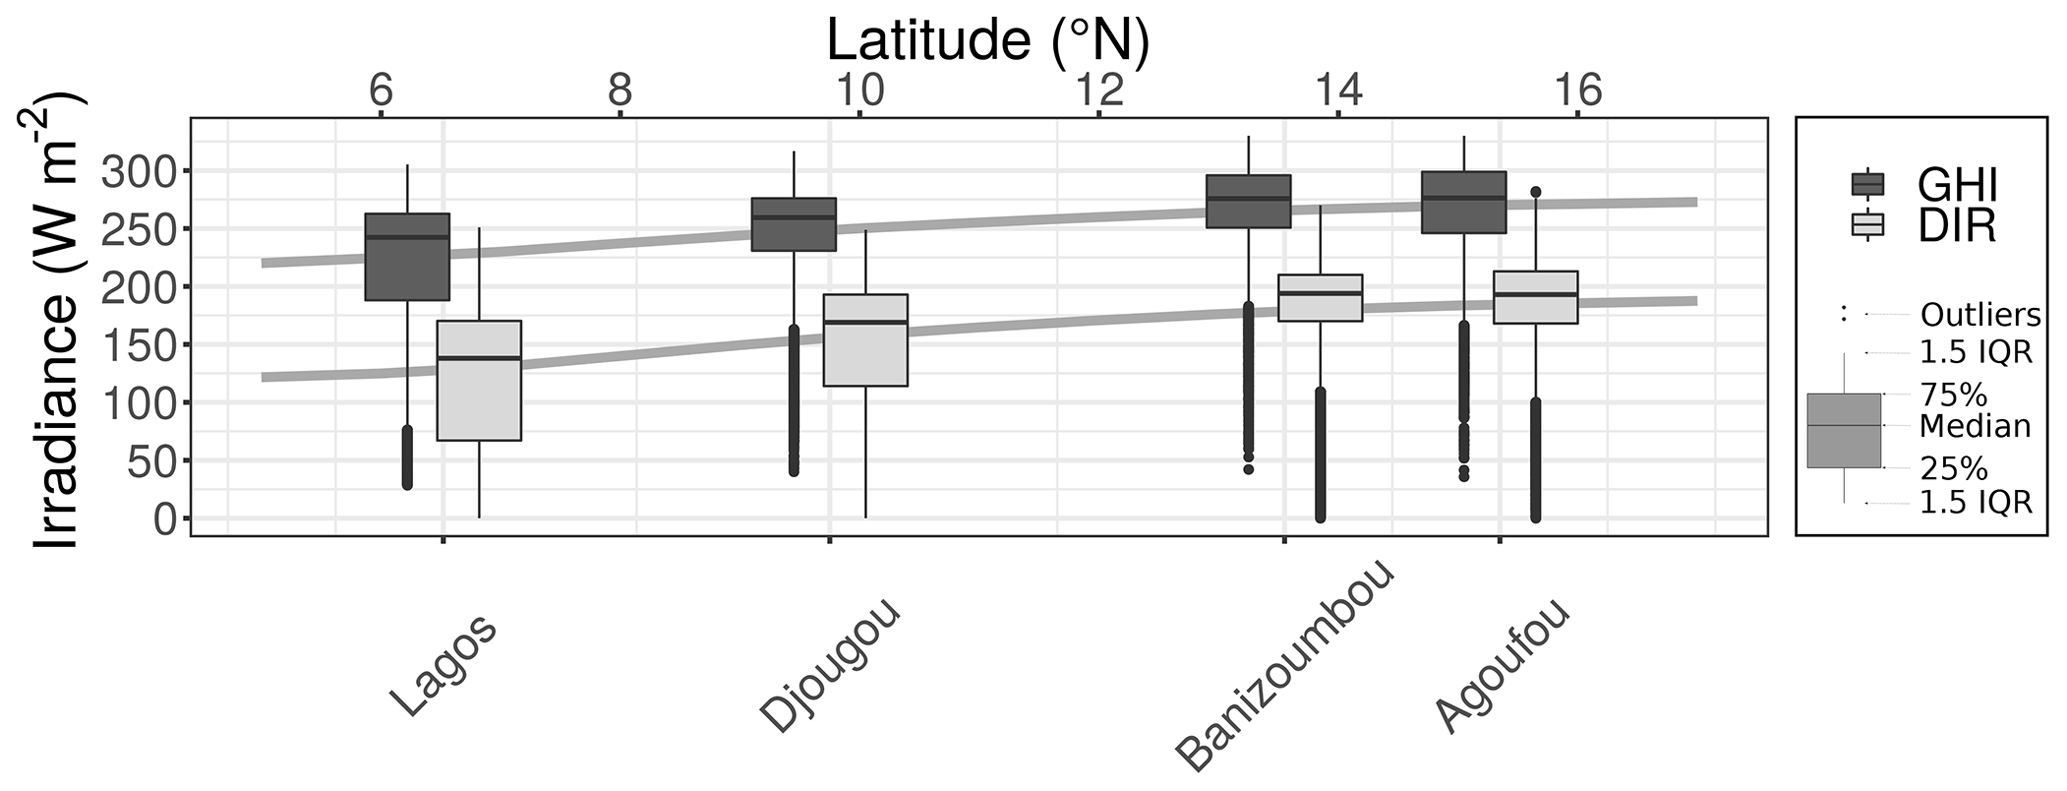
Figure 7Median daily global (dark gray) and direct horizontal irradiance (light gray) from the SARAH-2.1 data set at Agoufou, Mali; Banizoumbou, Niger; Djougou, Benin; and Lagos, Nigeria as a function of latitude. The variability is illustrated by the box plots, showing the interquartile range and whiskers. The gray line connects the mean GHI (top) and DIR (bottom) over each latitude of the study region.
The median GHI and DIR decline with decreasing latitude (see also Fig. 7), while their variability increases with decreasing latitude (as the IQR increases). The higher frequency of clouds in southern West Africa likely drives this variability. At the desert and Sahel locations (Agoufou and Banizoumbou), the IQR of the GHI is larger than the IQR of DIR. Thus, the variability in the north is higher for the GHI than for the DIR, whereas the inverse is found at the southern locations (Djougou and Lagos).
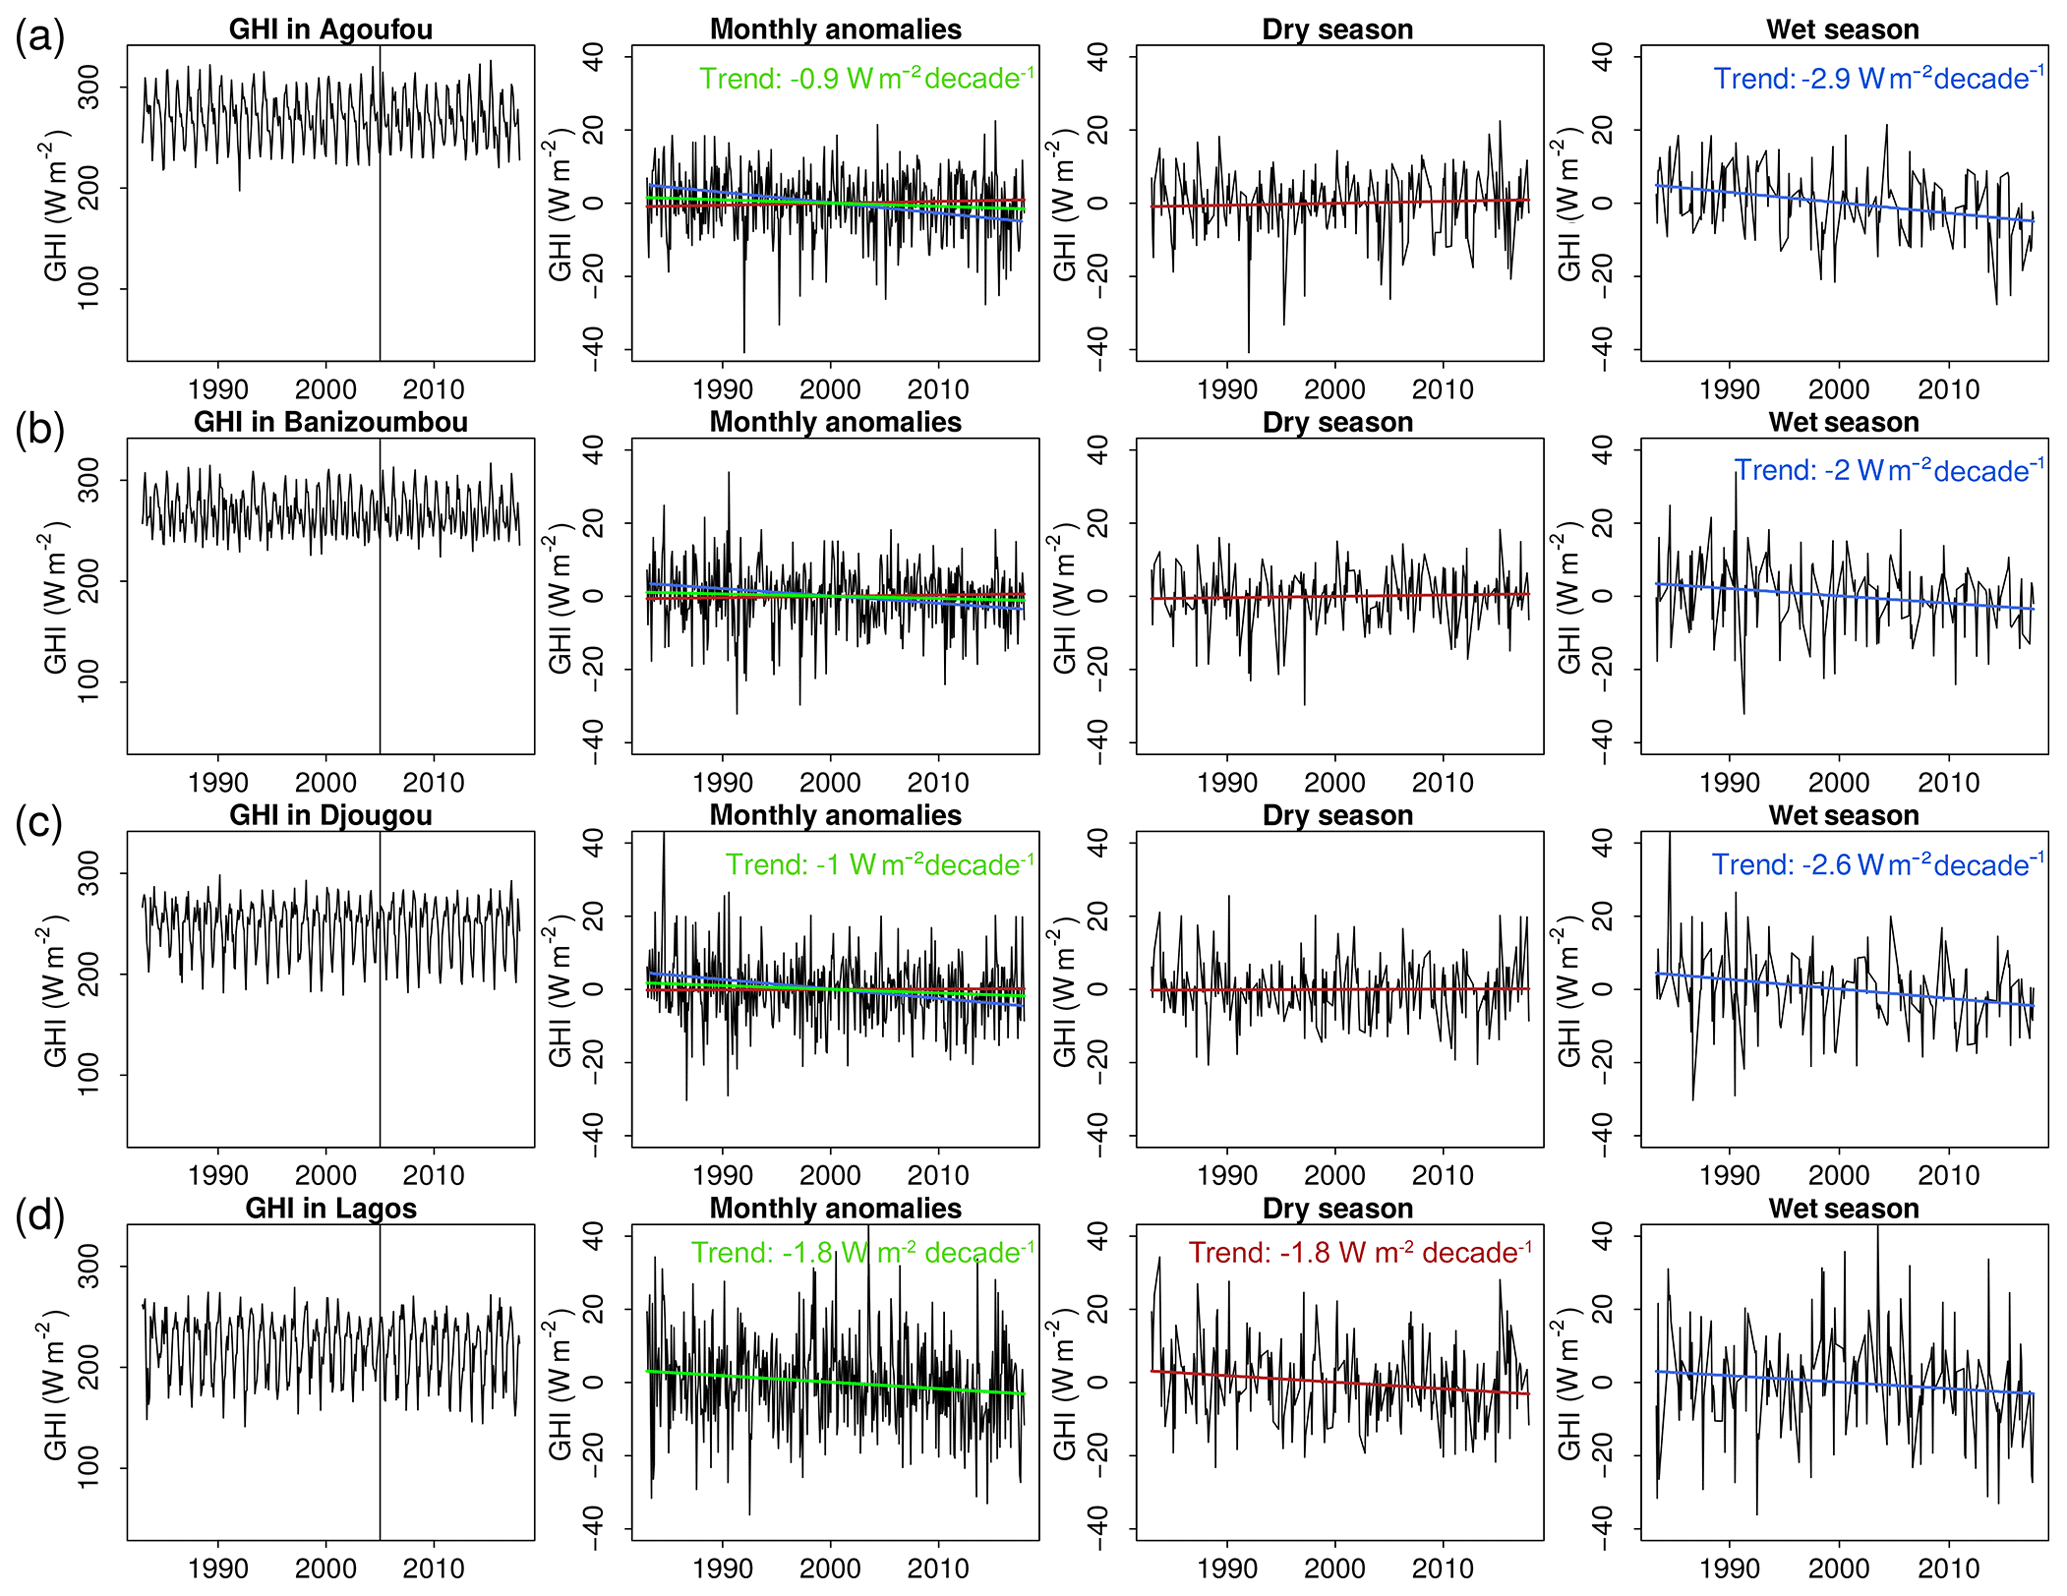
Figure 8Satellite-based time series of monthly mean global horizontal irradiance and their monthly anomalies and trends for the annual mean (green), the dry season (red) and the wet (blue) season in Agoufou (a), Banizoumbou (b), Djougou (c) and Lagos (d). The linear trend in the anomalies is shown monthly as well as for the respective dry and wet seasons. Trends are quantified in the single plot windows if they are significant (p value <0.05). The black vertical line indicates the change from the Meteosat first- to second-generation satellites.
For a more detailed representation, time series of the monthly mean GHI and DIR and their anomalies for the four locations are shown in Fig. 8. At the southernmost location (Lagos) the trends in anomalies are similar for the wet and the dry seasons (negative trend of −1.8 W m−2 per decade). At all of the other locations, the dry season anomalies are rather constant (showing no significance), whereas the wet season anomalies show decreasing significant trends (ranging from −2 to −2.9 W m−2 per decade) which provides a significant trend over the full year for Agoufou, Djougou and Lagos. For all of the locations, no significant partition can be seen for the change from Meteosat first- to second-generation satellites in 2005.
As long-term changes in climate conditions (e.g., temperature and precipitation) have been found over the entire region (Barry et al., 2018), the trends in global irradiance over the last 35 years are analyzed (see Fig. 9) because they are of high importance for a future PV system. Especially during the wet season, mean temperature increased along the coast between 1983 and 2010 (Yaro and Hesselberg, 2016). The general positive trend in temperature over the region (of up to 0.22∘ per decade) can also be found in the ERA5 data.
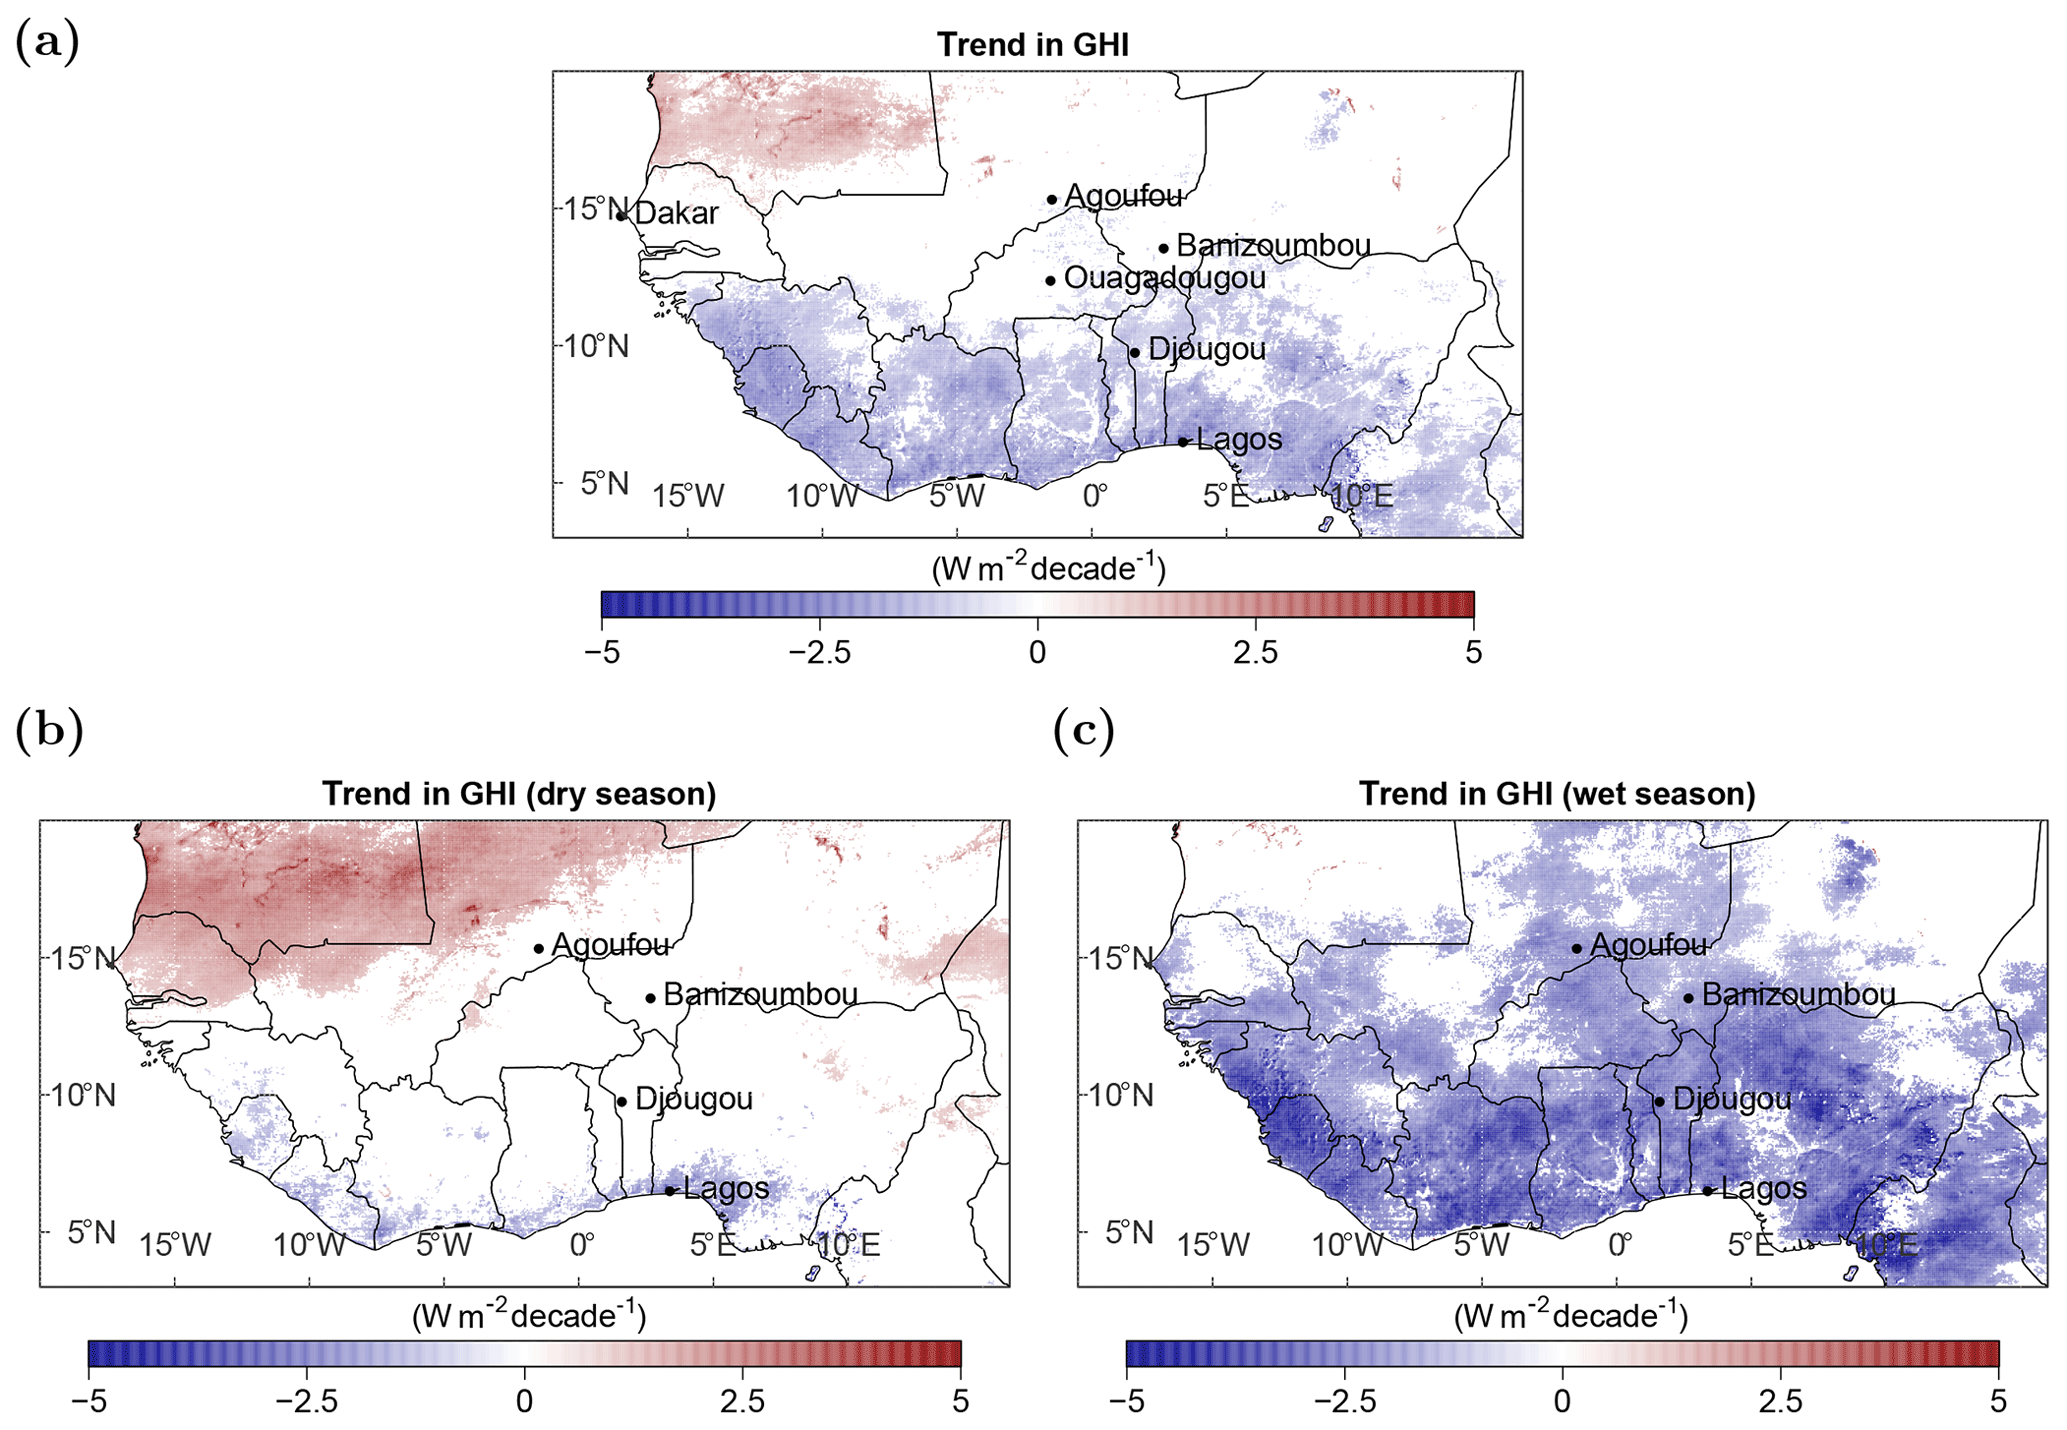
Figure 9Linear trend for the annual mean global irradiance (a) and the global irradiance in the dry (b) and wet seasons (c) for all significant cases (based on the 95 % confidence interval). Ouagadougou (Burkina Faso) and Dakar (Senegal) are additionally visualized here, as values at these locations are compared within this section.
Trends in the GHI during the time period from 1983 to 2017 are positive in the West African Sahara and negative south of the Sahel zone. By looking at the respective dry and wet seasons, the major part of the negative trend can be attributed to the wet season. The positive trend mainly occurs during the dry season. Overall, the decadal trends are small (in the range of 1 %–2 % per decade) compared with the absolute surface irradiance and the IQR. However, the absolute values of the trend reach around ±5 W m−2 per decade and are significant (based on the 95 % confidence interval). Compared with the uncertainties of the satellite data (MAE of up to 27.6 W m−2; see Sect. 4), the trends might seem negligible. However, the reported uncertainties are not bias corrected, and they represent, in particular in the case of Djougou, the systematic overestimation of the GHI by the satellite estimate. The estimation of the temporal trend is unaffected by any systematic over- or underestimation; hence, it can still be derived with certain confidence.
The negative trend south from the Sahel region indicates increasing cloud cover or a higher amount of water vapor in the air. Especially low-level clouds are frequent during the wet season in southern West Africa (Linden et al., 2015). These clouds were analyzed during the Dynamics–Aerosol–Chemistry–Cloud Interactions in West Africa (DACCIWA) campaign in 2016 (Knippertz et al., 2015). They form at night and are present during the day with a peak in cloudiness in the mornings. Local aerosols can increase the cloud droplet number concentration by 13 %–22 % (Taylor et al., 2019), brightening the clouds and reducing the GHI. The southern regions of West Africa have been affected by agricultural expansion and urbanization over the last few decades (CLISS, 2016). This leads to a higher portion of local aerosols in the atmosphere that can serve as cloud condensation nuclei and foster cloud formation and cloud optical properties. Furthermore, a positive trend in water vapor was found on the coast of tropical oceans in West Africa from satellite data (Mears et al., 2018), which would reduce the GHI at the surface.
The positive trend in irradiance in the Sahara might be driven by the reduction in the movement of dust, which has been found in several data sets since the 1980s (Cowie et al., 2013). Furthermore, a reduction in cloudiness could be a reason for the increasing irradiance.
The detected trends are within the range of global dimming and brightening tendencies (−9 to +4 W m−2 per decade), which originate from atmospheric changes (that are caused by factors such as anthropogenic pollution and are visible due to aerosol variation and aerosol–cloud interactions; Wild, 2012). The abovementioned trends in cloud occurrence could be driven by a change in the WAM, the Hadley cell circulation and water vapor as well as the shift of the ITCZ (Byrne et al., 2018; Roehrig et al., 2013). Furthermore, aerosols can also play a decisive role. As mentioned before, aerosols are highly variable in the West African region and can reach extreme values (AOD up to 4). Aerosols are not treated explicitly in the satellite retrievals; therefore, their variability can cause high uncertainties in the trend analysis, especially during the dry season, when clouds are mostly absent and aerosols are the major modulator of the GHI. Furthermore, in West Africa, different aerosol types are present in the atmosphere (e.g., dust, marine, anthropogenic and biomass burning aerosols), which differ in their atmospheric impact on the GHI (absorption and scattering as well as spectral dependence). However, Neher et al. (2019) found that the impact of the AOD is around 4 times higher than the impact of the aerosol composition on PV power in West Africa. Yoon et al. (2012) reported a negative trend in AOD for Dakar in Senegal (1996–2009) and Ouagadougou in Burkina Faso (1995–2007) and a positive trend in Banizoumbou in Niger (1995–2009). The detected trends in the GHI from SARAH-2.1 data (1983–2017) at these locations are negative in Banizoumbou and positive in Dakar. Thus, changes in aerosols could be a major driver of trends in the GHI. However, the trend in the GHI is negative in Ouagadougou; thus, other meteorological changes, such as clouds, might be larger than the trend in AOD. In general, trend analysis is a complex topic. However, a clear regional distribution might enable us to better identify the causes of trends when looking at PV power.
Photovoltaic yields are calculated for each day over the whole region using a linear model (Eq. 5) with the parameters derived in Sect. 3.2 for each temperature range (see Fig. 10 for mean PV yields and temporal IQR). The temperature level is taken from ERA5 as daily means. As we used a linear approach, the uncertainty in the satellite data would propagate linearly for PV yield estimates.
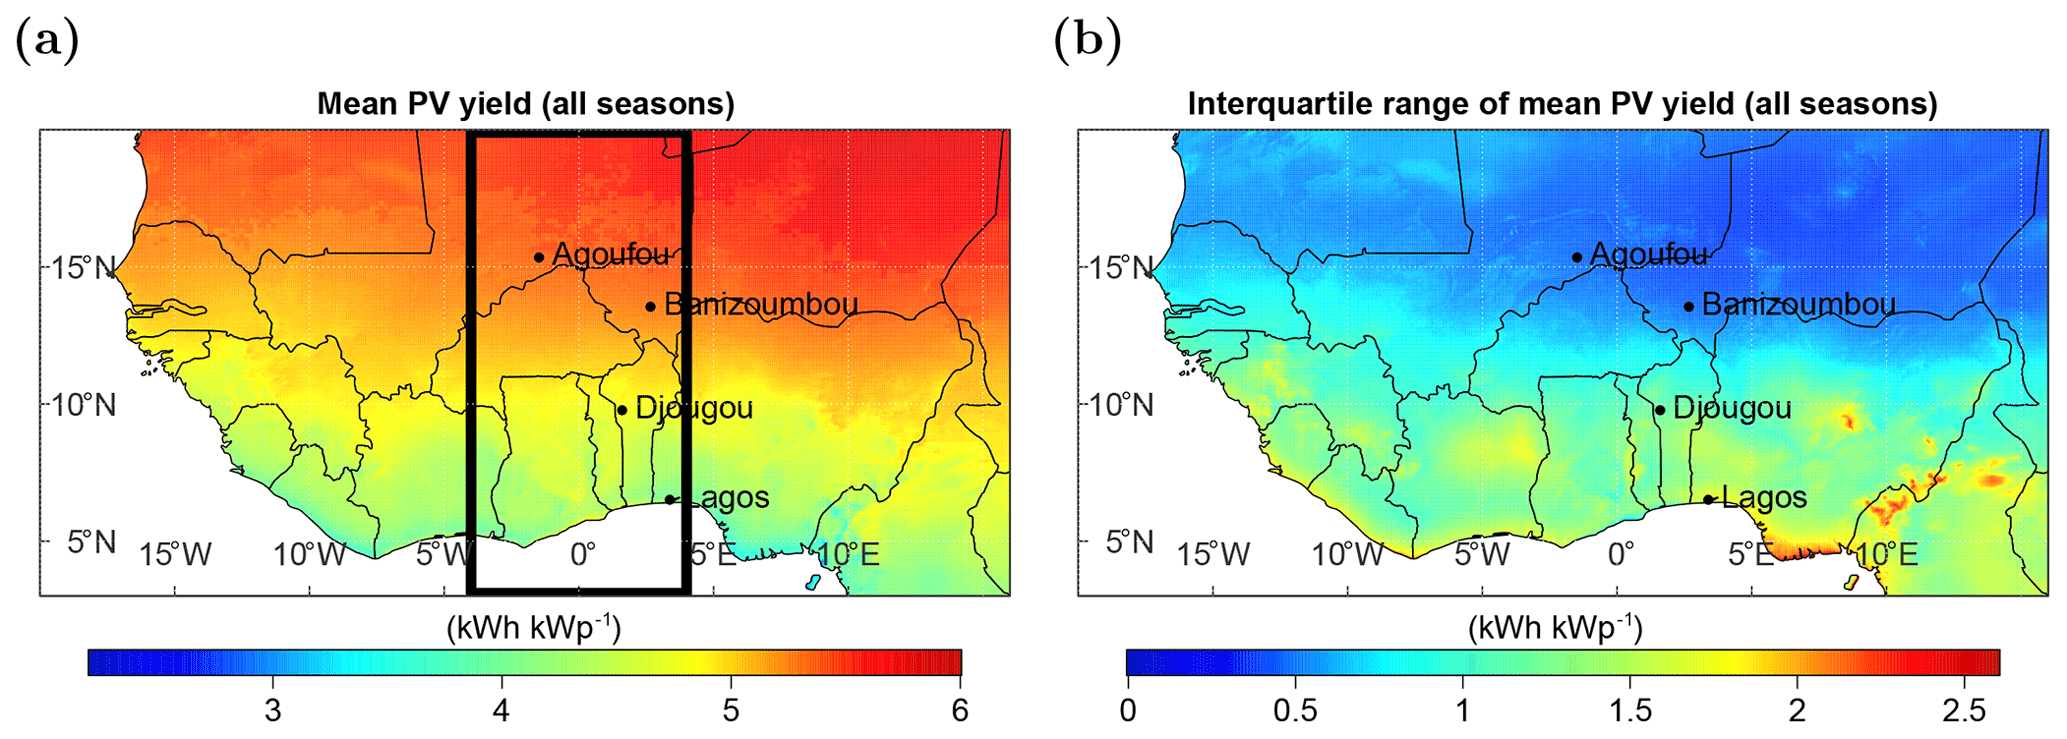
Figure 10The annual mean (1983–2017) PV yield (a) and its interquartile range (b) over the full region. The black box in (a) marks the longitude range for Fig. 11.
As a result of using a linear regression to derive the PV yields, the temporal variability in the PV yields (mean: 4.9 kWh kWp−1; IQR: 20 %) is lower than the temporal variability in the GHI (mean: 250 W m−2; IQR: 24 %). However, the regional variability is 3 percentage points higher for PV yields (IQR: 18 %) than for the GHI (IQR: 15 %). Here, we go a step further and analyze the regional variability over each latitude (in the longitude range between 4∘ W and 4∘ E to exclude ocean regions), annually as well as for the respective dry and wet seasons. Figure 11 shows the variability in the temporal mean PV yield for each latitude separately.

Figure 11(a) Mean (temporal) PV yield at each latitude for the total year, (b) population density for each latitude (NASA, 2020), and (c) mean PV yield at each latitude for the dry season (October–April; light gray) and the wet season (May–September; dark gray) in the longitude range between 4∘ W and 4∘ E. The single points mark the temporal mean PV yield calculated with the explicit model and the measured ambient temperature (star) as well as the PV yield calculated with the simple model and the measured GHI (cross) at the three sites: Agoufou (2005–2008), Banizoumbou (2005–2012) and Djougou (2002–2009). The gray background box in (c) marks the latitude range where the definition of seasons is most accurate.
The explicitly calculated PV yields at Banizoumbou and Djougou lie within the variability range of the corresponding latitude, demonstrating the appropriateness of the simplified model for PV calculations. However, the most northern site, Agoufou, is lower than the daily modeled data at 15∘ N. A possible reason for this might be the high temperatures encountered here. The uncertainties of the linear model are highest for high temperatures (RMSE: 0.67 kWh kWp−1; see Table 3). In the northern part of West Africa the monthly mean temperature can reach more then 40 ∘C (Berrisford et al., 2011). Thus, the PV yields at high latitudes could actually be lower. Furthermore, the PV yield at each site is calculated with ground-based measured temperatures, whereas the model uses daily temperatures from ERA5. At Agoufou, the averaged daily mean of the ground-based temperature over the total time span is around 3.5 ∘C higher than the mean ERA5 temperature.
In general, the overestimation of satellite data in Agoufou and Djougou as well as the slight underestimation in Banizoumbou (see Sect. 4) can be seen in the PV yields calculated with the simple model and using the measured GHI as an input (crosses in Fig. 11a). In Agoufou, the PV yields, calculated with the linear model, are similar to the explicitly calculated PV yields. In Banizoumbou, the results are higher than the PV yields calculated with satellite data, whereas they are lower in Djougou. Especially in Djougou, the irradiance decreases over the 35 years of satellite data availability; this leads to lower values in the 2000s compared with the mean.
By looking at the full latitude range, PV yields are smaller at low latitudes (around 4.5 kWh kWp−1) with a higher regional variability and more outliers. At high latitudes, the PV yields reach around 5.5 kWh kWp−1, which is around 22 % higher than at low latitudes. Furthermore, an overestimation of solar irradiance was found in southern West Africa (see Sect. 4). Thus, the spacial gradient between north and south could actually be higher than that suggested by the satellite estimation. The population density shows an inverse latitudinal gradient to the PV potential, with a higher density at low latitudes and a lower density at high latitudes (see Fig. 11b).
During the dry season, the PV yields are similarly spread over different latitudes to the annual PV yields. However, the yields are slightly higher (by around 0.25 kWh kWp−1) at low latitudes (between 3 and 10∘ N). During the wet season, a band of lower PV yields (less than 4 kWh kWp−1) is visible between 3 and 9∘ N; this is the region where low-level clouds frequently occur (Linden et al., 2015).
Currently, a deficit exists between power demand and supply in West African countries (Adeoye and Spataru, 2018). Furthermore, the power demand may increase 5-fold by 2030 compared with the demand in 2013 (IRENA, 2015). Thus, new large-scale power plants need to be developed and current infrastructure needs to be advanced. The West African Power Pool (WAPP) was founded in 1999 to coordinate these developments. The WAPP business plan outlines the connection of 14 countries with respect to high-voltage transmission by 2025 (WAPP, 2015). Specifically, photovoltaic (PV) power is set to expand, with a technical potential of around 100 PWh yr−1 (Hermann et al., 2014), and there are high expectations that it will meet a large share of the future power supply (IRENA, 2015). Therefore, long-term changes in PV power potential are relevant and are addressed in this study.
Solar irradiance is the key driver of photovoltaic power potential. The dimension and development of new power plants requires a specific site analysis of solar irradiance to estimate expected economic benefits. Therefore, long-term changes and day-to-day variability need to be taken into account to dimension the plant, the necessary storage capacities and to design the grid. In this study, 35 years of satellite-based irradiance data (the SARAH-2.1 data record) is locally validated and used to get a spatially complete distribution of the photovoltaic potential over West Africa (3 to 20∘ N and 20∘ W to 16∘ E).
In summary and as expected, there is a strong contrast in the photovoltaic potential during the dry and wet seasons, which is controlled by the West African monsoon (WAM) and the accompanying seasonal movement of the intertropical convergence zone. The dry season provides higher photovoltaic yields than the wet season, especially in southern West Africa (around 4.75 kWh kWp−1 in the dry season down to 3.75 kWh kWp−1 in the wet season). Furthermore, a strong contrast can be seen between the higher potential in the northern regions of West Africa (up to 5.5 kWh kWp−1) and the lower potential in the southern regions of West Africa (around 4.5 kWh kWp−1). The temporal variability is higher in the south and lower in the north as a result of the WAM. Generally, the variability is more pronounced for the photovoltaic potential than for the global horizontal irradiance, as additional impacts of the inverter reduce the yields of a PV power plant by a certain threshold.
In the Sahara and Sahel zone, the daily average global horizontal irradiance reaches up to 300 W m−2 and shows a positive trend of up to around +5 W m−2 per decade. An inverse trend (with up to around -5 W m−2 per decade) and lower irradiance is found in southern West Africa, with a daily average global horizontal irradiance below 250 W m−2. These trends lie within the range of global dimming and brightening tendencies. Furthermore, the temporal variability is higher in southern West Africa (reaching an IQR of up to 150 W m−2 in mountainous areas) than in the Sahara and Sahel zone (where the IQR remains below 100 W m−2). With respect to the direct horizontal irradiance, the difference between northern and southern West Africa is similar to the difference in the global horizontal irradiance. However, especially in the mountainous region in Nigeria, the temporal variability is more distinct for direct horizontal irradiance than for global horizontal irradiance.
Regarding seasons, there is a sharp difference between the wet and the dry seasons. During the dry season, the average solar irradiance and its IQR are rather constant (a global irradiance of around 254 W m−2 and an IQR of around 20 W m−2), whereas the average solar irradiance varies over the region during the wet season (with higher values in the north than in the south and an IQR of around 67 W m−2). Compared with the annual values, the dry season provides a higher global horizontal irradiance in the south and a lower global horizontal irradiance in the north, whereas the opposite was found during the wet season. Therefore a dividing line can be drawn at about 13∘ N to separate the south from the north with respect to the daily variability. This seasonal shift is particularly visible at low latitudes (higher urban density than at high latitudes). This seasonality is dominated by high cloudiness caused by the moist monsoon winds from the southwest during the wet season and the dry Harmattan winds from the northeast during the dry season. To overcome such seasonal differences in power generation, a smart combination with other power sources (e.g., hydropower and wind) is necessary to reduce storage capacity requirements (Sterl et al., 2020) and related costs for long-term storage.
By looking at the abovementioned characteristics, the development of PV power plants is more likely in northern West Africa, as higher yields can be reached. However, more power is consumed in the southern parts of West Africa, close to the coast, where the population is higher. Therefore, power generation in the north would reiterate the necessity of grid development along a north–south axis to transport power from the insolation-rich Sahara to urban regions in the south. Larger investments in PV systems in the south would instead evoke the development of large storage capacities to compensate for fluctuations in PV power generation due to the higher variability in solar irradiance in the south than in the Sahel zone and the Sahara. The difference in the north–south potential has increased over the last 35 years. If this trend is ongoing in the future, the potential PV power in southern and northern West Africa might differ even more. This should be considered in future grid planing.
Besides the constant seasonal and intra-day variability, extreme events can affect power generation drastically. Major dust outbreaks frequently occur during the dry season in the Sahara and the Sahel zone and can cause reductions in power generation of up to 79 % over several days (Neher et al., 2019). For such events, storage capacities for several days might be needed (e.g., in solely solar-based micro grids).
This analysis provides an overview of the photovoltaic potential in West Africa. However, the explicit modeling of a photovoltaic power module at a higher temporal resolution could better resolve the impact of temperature and the inverter for each grid point. Furthermore, to explicitly dimension the grid and the storage capacity required, a demand–supply power model that includes all available power sources is necessary. This should be subject of further research.
The SARAH-2.1 dataset can be accessed at https://wui.cmsaf.eu/safira/action/searchProdukt (Pfeifroth et al., 2019a), https://doi.org/10.5676/EUM_SAF_CM/SARAH/V002. The AMMA dataset can be accessed at https://baobab.sedoo.fr/AMMA/ (AMMA, 2018).
IN performed the data analysis and was responsible for the development of the paper. JT and UP provided the CM SAF data and gave advice on the paper during the writing process. SC and SM provided the overall scientific guidance, discussed results and gave advice during the writing process.
The authors declare that they have no conflict of interest.
The authors would like to thank the numerous data providers. Meteorological data from the AMMA Database was used in this study. Based on a French initiative, the AMMA was built by an international scientific group and is currently funded by a large number of agencies from countries such as France, the UK, the US and Africa. It has been the beneficiary of a major financial contribution from the European Community's Sixth Framework research program. Detailed information on the scientific coordination and funding is available on the AMMA International website: http://www.amma-international.org, last access: 13 January 2020. We thank Philippe Goloub and Didier Tanre for their effort establishing and maintaining AERONET sites in Agoufou, Banizoumbou and Djougou and for providing aerosol data. The CM SAF SARAH-2.1 data record was accessed via https://www.cmsaf.eu, last access: 15 August 2019.
This research has been supported by the Heinrich Böll Foundation though a PhD fellowship to the first author, Ina Neher.
This paper was edited by Stelios Kazadzis and reviewed by three anonymous referees.
Adeoye, O. and Spataru, C.: Sustainable development of the West African Power Pool: Increasing solar energy integration and regional electricity trade, Energy. Sustain. Dev., 45, 124–134, https://doi.org/10.1016/j.esd.2018.05.007, 2018. a, b
AERONET: Aeronet data description, available at: https://aeronet.gsfc.nasa.gov/new_web/data_description_AOD_V2.html (last access: 2 February 2019), 2014. a, b
AMMA: AMMA database, available at: https://baobab.sedoo.fr/AMMA/ (last access: 13 January 2020), 2018. a
Barry, A. A., Caesar, J., Klein Tank, A. M., Aguilar, E., McSweeney, C., Cyrille, A. M., Nikiema, M. P., Narcisse, K. B., Sima, F., Stafford, G., Touray, L. M., Ayilari-Naa, J. A., Mendes, C. L., Tounkara, M., Gar-Glahn, E. V., Coulibaly, M. S., Dieh, M. F., Mouhaimouni, M., Oyegade, J. A., Sambou, E., and Laogbessi, E. T.: West Africa climate extremes and climate change indices, Int. J. Climatol., 38, e921–e938, https://doi.org/10.1002/joc.5420, 2018. a
Berrisford, P., Dee, D., Fielding, K., Fuentes, M., Kallberg, P., Kobayashi, S., and Uppala, S.: The ERA-Interim Archive Version 2.0, Tech. rep., European Centre for Medium Range Weather Forecasts, available at: https://www.ecmwf.int/node/8174 (last access: 2 January 2020), 2011. a
Byrne, M. P., Pendergrass, A. G., Rapp, A. D., and Wodzicki, K. R.: Response of the Intertropical Convergence Zone to Climate Change: Location, Width, and Strength, Curr. Clim. Change Rep., 4, 355–370, https://doi.org/10.1007/s40641-018-0110-5, 2018. a
Campbell Scientific: CNR1, CNR1-L - Solar and Far Infrared Radiation Balance Radiaometers, Tech. rep., Campbel Scientific, 2010. a
CLISS: Landscapes of west africa - A Window on a changing world, Tech. rep., U.S. Geological Survey EROS, 47914 252nd St, Garretson, SD 57030, United States, 2016. a, b
Copernicus Climate Change Service (C3S): ERA5: Fifth generation of ECMWF atmospheric reanalyses of the global climate, Copernicus Climate Change Service Climate Data Store (CDS), available at: https://cds.climate.copernicus.eu/cdsapp#/home (last access: 6 January 2020), 2017. a
Cowie, S. M., Knippertz, P., and Marsham, J. H.: Are vegetation-related roughness changes the cause of the recent decrease in dust emission from the Sahel?, Geophys. Res. Lett., 40, 1868–1872, https://doi.org/10.1002/grl.50273, 2013. a
Cowie, S. M., Knippertz, P., and Marsham, J. H.: A climatology of dust emission events from northern Africa using long-term surface observations, Atmos. Chem. Phys., 14, 8579–8597, https://doi.org/10.5194/acp-14-8579-2014, 2014. a
Deutscher Wetterdienst: Global Climate Data, available at: https://www.dwd.de/EN/ourservices/climat/climat.html (last access: 14 June 2019), 2019. a
ECOWAS: Project Information Document/Integrated Safeguards Data Sheet (PID/ISDS), Tech. Rep. Phase 1, World Bank, 2017. a
Giles, D. M., Sinyuk, A., Sorokin, M. G., Schafer, J. S., Smirnov, A., Slutsker, I., Eck, T. F., Holben, B. N., Lewis, J. R., Campbell, J. R., Welton, E. J., Korkin, S. V., and Lyapustin, A. I.: Advancements in the Aerosol Robotic Network (AERONET) Version 3 database – automated near-real-time quality control algorithm with improved cloud screening for Sun photometer aerosol optical depth (AOD) measurements, Atmos. Meas. Tech., 12, 169–209, https://doi.org/10.5194/amt-12-169-2019, 2019. a
Gueymard, C. A. and Wilcox, S. M.: Assessment of spatial and temporal variability in the US solar resource from radiometric measurements and predictions from models using ground-based or satellite data, Sol. Energy, 85, 1068–1084, https://doi.org/10.1016/j.solener.2011.02.030, 2011. a
Haegel, N. M., Margolis, R., Buonassisi, T., Feldman, D., Froitzheim, A., Garabedian, R., Green, M., Glunz, S., Henning, H.-m., Holder, B., Kaizuka, I., Kroposki, B., Matsubara, K., Niki, S., Sakurai, K., Schindler, R. A., Tumas, W., Weber, E. R., Wilson, G., Woodhouse, M., and Kurtz, S.: Terawatt-scale photovoltaics: Trajectories and challenges, Science, 356, 141–143, https://doi.org/10.1126/science.aal1288, 2017. a
Hammer, A., Heinemann, D., Hoyer, C., Kuhlemann, R., Lorenz, E., Müller, R., and Beyer, H. G.: Solar energy assessment using remote sensing technologies, Remote Sens. Environ., 86, 423–432, https://doi.org/10.1016/S0034-4257(03)00083-X, 2003. a
Hannak, L., Knippertz, P., Fink, A. H., Kniffka, A., and Pante, G.: Why do global climate models struggle to represent low-level clouds in the west african summer monsoon?, J. Climate, 30, 1665–1687, https://doi.org/10.1175/JCLI-D-16-0451.1, 2017. a, b, c
Hastings, D. A. and Dunbar, P. K.: Global Land One-kilometer Base Elevation (GLOBE) Digital Elevation Model, Documentation, Tech. Rep. 34, United States Department of Commerce, National Oceanic and Atmospheric Administration, 1999. a, b
Hermann, S., Miketa, A., and Fichaux, N.: Estimating the Renewable Energy Potential in Africa, Tech. rep., International Renewable Energy Agency, Abu Dhabi, 2014. a
Hersbach, H., Bell, B., Berrisford, P., Hirahara, S., Horányi, A., Muñoz-Sabater, J., Nicolas, J., Peubey, C., Radu, R., Schepers, D., Simmons, A., Soci, C., Abdalla, S., Abellan, X., Balsamo, G., Bechtold, P., Biavati, G., Bidlot, J., Bonavita, M., De Chiara, G., Dahlgren, P., Dee, D., Diamantakis, M., Dragani, R., Flemming, J., Forbes, R., Fuentes, M., Geer, A., Haimberger, L., Healy, S., Hogan, R., Hólm, E., Janisková, M., Keeley, S., Laloyaux, P., Lopez, P., Lupu, C., Radnoti, G., de Rosnay, P., Rozum, I., Vamborg, F., Villaume, S., and Thépaut, J.-N.: The ERA5 Global Reanalysis, Q. J. R. Meteorol. Soc., 146, 1999–2049, 2020. a
Holben, B., Eck, T., Slutsker, I., Tanré, D., Buis, J., Setzer, A., Vermote, E., Reagan, J., Kaufman, Y. J., Nakajima, T., Lavenu, F., Jankowiak, I., and Smirnov, A.: AERONET - A Federated Instrument Network and Data Archive for Aerosol Characterization, Remote Sens. Environ., 66, 1–16, https://doi.org/10.1016/S0034-4257(98)00031-5, 1998. a
Ineichen, P.: Satellite based short wave irradiance validation over Africa Satellite based short wave irradiance validation over Africa, Tech. rep., Université de Genève, Geneva, available at: http://archive-ouverte.unige.ch/unige:23517 (last access: 16 October 2019), 2010. a
IRENA: Africa 2030: Roadmap for a Renewable Energy Future, Tech. rep., IRENA, Abu Dhabi, 2015. a, b
Ishaque, K., Salam, Z., and Taheri, H.: Accurate MATLAB Simulink PV System Simulator Based on a Two-Diode Model, J. Power Electron., 11, 179–187, https://doi.org/10.6113/JPE.2011.11.2.179, 2011. a, b
King, D. L., Boyson, W. E., and Kratochvil, J. A.: Photovoltaic array performance model, Tech. rep., Sandia National Laboratories, https://doi.org/10.2172/919131, 2004. a
Kinne, S., O'Donnel, D., Stier, P., Kloster, S., Zhang, K., Schmidt, H., Rast, S., Giorgetta, M., Eck, T. F., and Stevens, B.: MAC-v1: A new global aerosol climatology for climate studies, J. Adv. Model. Earth Sy., 5, 704–740, https://doi.org/10.1002/jame.20035, 2013. a
Kipp and Zonen: SP Lite2 Silicon Pyranometer, Tech. rep., Kipp and Zonen, 2019. a
Kniffka, A., Knippertz, P., and Fink, A. H.: The role of low-level clouds in the West African monsoon system, Atmos. Chem. Phys., 19, 1623–1647, https://doi.org/10.5194/acp-19-1623-2019, 2019. a
Knippertz, P., Coe, H., Chiu, J. C., Evans, M. J., Fink, A. H., Kalthoff, N., Liousse, C., Mari, C., Allan, R. P., Brooks, B., Danour, S., Flamant, C., Jegede, O. O., Lohou, F., and Marsham, J. H.: The DACCIWA project: Dynamics-aerosol-chemistry-cloud interactions in West Africa, B. Am. Meteorol. Soc., 96, 1451–1460, https://doi.org/10.1175/BAMS-D-14-00108.1, 2015. a
Kothe, S., Pfeifroth, U., Cremer, R., Trentmann, J., and Hollmann, R.: A satellite-based sunshine duration climate data record for Europe and Africa, Remote Sens., 9, 429, https://doi.org/10.3390/rs9050429, 2017. a, b
Linden, R., Fink, A. H., and Redl, R.: Satellite-based climatology of low-level continental clouds in southern West Africa during the summer monsoon season, J. Geophys. Res.-Atmos., 120, 1186–1201, https://doi.org/10.1002/2014JD022614, 2015. a, b, c
Marticorena, B., Haywood, J., Coe, H., Formenti, P., Liousse, C., Mallet, M., and Pelon, J.: Tropospheric aerosols over West Africa: Highlights from the AMMA international program, Atmos. Sci. Lett., 12, 19–23, https://doi.org/10.1002/asl.322, 2011. a
Mears, C. A., Smith, D. K., Ricciardulli, L., Wang, J., Huelsing, H., and Wentz, F. J.: Construction and Uncertainty Estimation of a Satellite-Derived Total Precipitable Water Data Record Over the World's Oceans, Earth Space Sci., 5, 197–210, https://doi.org/10.1002/2018EA000363, 2018. a
Mohr, K. I.: Interannual, monthly, and regional variability in the Wet season diurnal cycle of precipitation in sub-Saharan Africa, J. Climate, 17, 2441–2453, https://doi.org/10.1175/1520-0442(2004)017<2441:IMARVI>2.0.CO;2, 2004. a
Mueller, R., Behrendt, T., Hammer, A., and Kemper, A.: A new algorithm for the satellite-based retrieval of solar surface irradiance in spectral bands, Remote Sens., 4, 622–647, https://doi.org/10.3390/rs4030622, 2012. a
Mueller, R., Pfeifroth, U., Traeger-Chatterjee, C., Trentmann, J., and Cremer, R.: Digging the METEOSAT Treasure – 3 Decades of Solar Surface Radiation, Remote Sens., 7, 8067–8101, https://doi.org/10.3390/rs70608067, 2015. a
NASA: Population density, available at: https://sedac.ciesin.columbia.edu/data/set/gpw-v4-population-density-rev11/data-download (last access: 29 May 2020), 2020. a
Neher, I., Buchmann, T., Crewell, S., Pospichal, B., and Meilinger, S.: Impact of atmospheric aerosols on solar power, Meteorol. Z., 28, 305–321, https://doi.org/10.1127/metz/2019/0969, 2019. a, b, c, d, e, f
Pfeifroth, U., Sanchez-Lorenzo, A., Manara, V., Trentmann, J., and Hollmann, R.: Trends and Variability of Surface Solar Radiation in Europe Based On Surface- and Satellite-Based Data Records, J. Geophys. Res.-Atmos., 123, 1735–1754, https://doi.org/10.1002/2017JD027418, 2018. a
Pfeifroth, U., Kothe, S., Trentmann, J., Hollmann, R., Fuchs, P., Kaise, J., and Werscheck, M.: Surface Radiation Data Set – Heliosat (SARAH) – Edition 2.1, Satellite Application Facility on Climate Monitoring, Offenbach, Germany, https://doi.org/10.5676/EUM_SAF_CM/SARAH/V002_01, 2019a. a, b
Pfeifroth, U., Trentmann, J., and Kothe, S.: Validation Report: Meteosat Solar Surface Radiation and Effective Cloud Albedo Climate Data Record SARAH-2 . 1 climate data records, Tech. rep., DWD, https://doi.org/10.5676/EUM_SAF_CM/SARAH/V002, 2019b. a, b, c, d, e, f, g, h
Redelsperger, J.-L., Thorncroft, C. D., Diedhiou, A., Lebel, T., Parker, D. J., and Polcher, J.: African Monsoon Multidiscplinary Analysis: An International Research Project and Field Campaign, B. Am. Meteorol. Soc., 87, 1739–1746, https://doi.org/10.1175/BAMS-87-12-1739, 2006. a
Roehrig, R., Bouniol, D., and Guichard, F.: The Present and Future of the West African Monsoon : A Process-Oriented Assessment of CMIP5 Simulations along the AMMA Transect, J. Climate, 26, 6471–6505, https://doi.org/10.1175/JCLI-D-12-00505.1, 2013. a
Salam, Z., Ishaque, K., and Taheri, H.: An improved two-diode photovoltaic (PV) model for PV system, in: 2010 Joint International Conference on Power Electronics, Drives and Energy Systems and 2010 Power India, New Delhi, India, 20–23 December 2010, 1–5, https://doi.org/10.1109/PEDES.2010.5712374, 2010. a
Sengupta, M., Habte, A., Kurtzn, S., Dobos, A., Wilbert, S., Lorenz, E., Stoffel, T., Renné, D., Myers, D., Wilcox, S., Blanc, P., and Perez, R.: Best practices handbook for the collection and use of solar resource data for solar energy applications: Second Edition, Tech. rep., National Renewable Energy Laboratory, https://doi.org/10.18777/ieashc-task46-2015-0001, 2017. a
Skoplaki, E. and Palyvos, J. A.: On the temperature dependence of photovoltaic module electrical performance: A review of efficiency/power correlations, Sol. Energy, 83, 614–624, https://doi.org/10.1016/j.solener.2008.10.008, 2009. a
Skye Instruments: Pyranometer SKS 1110, Tech. rep., Skye Instruments, 2019. a
Slingo, A., Ackerman, T. P., Allan, R. P., Kassianov, E. I., McFarlane, S. A., Robinson, G. J., Barnard, J. C., Miller, M. A., Harries, J. E., Russell, J. E., and Dewitte, S.: Observations of the impact of a major Saharan dust storm on the atmospheric radiation balance, Geophys. Res. Lett., 33, L24817, https://doi.org/10.1029/2006GL027869, 2006. a
Solangi, K. H., Islam, M. R., Saidur, R., Rahim, N. a., and Fayaz, H.: A review on global solar energy policy, Renew. Sust. Energ. Rev., 15, 2149–2163, https://doi.org/10.1016/j.rser.2011.01.007, 2011. a
Solargis: Solar Resource Map 2019, available at: https://solargis.com/maps-and-gis-data/download/africa (last access: 27 February 2020), 2019. a, b
SolarWorld: Data sheet of SolarWorld 235 poly module, Tech. rep., Solar World, 2012. a
Sterl, S., Vanderkelen, I., Chawanda, C. J., Russo, D., Brecha, R. J., van Griensven, A., Van Lipzig, N. P., and Thiery, W.: Smart renewable electricity portfolios in West Africa, Nat. Sustain., 3, 710–719 https://doi.org/10.1038/s41893-020-0539-0, 2020. a
Sultan, B., Janicot, S., and Diedhiou, A.: The West African monsoon dynamics. Part I: Documentation of intraseasonal variability, J. Climate, 16, 3389–3406, https://doi.org/10.1175/1520-0442(2003)016<3389:TWAMDP>2.0.CO;2, 2003. a
Taylor, J. W., Haslett, S. L., Bower, K., Flynn, M., Crawford, I., Dorsey, J., Choularton, T., Connolly, P. J., Hahn, V., Voigt, C., Sauer, D., Dupuy, R., Brito, J., Schwarzenboeck, A., Bourriane, T., Denjean, C., Rosenberg, P., Flamant, C., Lee, J. D., Vaughan, A. R., Hill, P. G., Brooks, B., Catoire, V., Knippertz, P., and Coe, H.: Aerosol influences on low-level clouds in the West African monsoon, Atmos. Chem. Phys., 19, 8503–8522, https://doi.org/10.5194/acp-19-8503-2019, 2019. a
Trentmann, J. and Pfeifroth, U.: Algorithm Theoretical Baseline Document: Meteosat Solar Surface Radiation and effective Cloud Albedo Climate Data Records – Heliosat: The MAGICSOL method applied for the generation of SARAH-2.1, Tech. rep., DWD, https://doi.org/10.5676/EUM_SAF_CM/SARAH/V001, 2019. a
United Nations: Sustainable Development Goals, available at: https://sdgs.un.org/goals (last access: 21 October 2020), 2015. a
WAPP: 2016-2019 WAPP Business Plan, Tech. rep., West African Power Pool, available at: http://www.ecowapp.org/sites/default/files/2015-2019_business_plan.pdf (last access: 5 November 2019), 2015. a
Wild, M.: Enlightening global dimming and brightening, B. Am. Meteorol. Soc., 93, 27–37, https://doi.org/10.1175/BAMS-D-11-00074.1, 2012. a
Yaro, J. A. and Hesselberg, J.: Adaptation to climate change and variability in rural West Africa, Springer, Switzerland, https://doi.org/10.1007/978-3-319-31499-0, 2016. a
Yoon, J., von Hoyningen-Huene, W., Kokhanovsky, A. A., Vountas, M., and Burrows, J. P.: Trend analysis of aerosol optical thickness and Ångström exponent derived from the global AERONET spectral observations, Atmos. Meas. Tech., 5, 1271–1299, https://doi.org/10.5194/amt-5-1271-2012, 2012. a
- Abstract
- Introduction
- Region overview and data sources
- Photovoltaic yield estimation
- Validation of satellite data with ground-based measurements
- Changes in solar irradiance
- Implications for photovoltaic yields
- Challenges for the West African power sector
- Data availability
- Author contributions
- Competing interests
- Acknowledgements
- Financial support
- Review statement
- References