the Creative Commons Attribution 4.0 License.
the Creative Commons Attribution 4.0 License.
 | 02 Nov 2020
Impacts of aerosol–radiation interaction on meteorological forecasts over northern China by offline coupling of the WRF-Chem-simulated aerosol optical depth into WRF: a case study during a heavy pollution event
Yang Yang
Min Chen
Xiujuan Zhao
Shuiyong Fan
Jianping Guo
Shaukat Ali
To facilitate the future inclusion of aerosol–radiation interactions in the regional operational numerical weather prediction (NWP) system RMAPS-ST (adapted from Weather Research and Forecasting, WRF) at the Institute of Urban Meteorology (IUM), China Meteorological Administration (CMA), the impacts of aerosol–radiation interactions on the forecast of surface radiation and meteorological parameters during a heavy pollution event (6–10 December 2015) over northern China were investigated. The aerosol information was simulated by RMAPS-Chem (adapted from the WRF model coupled with Chemistry, WRF-Chem) and then offline-coupled into the Rapid Radiative Transfer Model for General Circulation Models (RRTMG) radiation scheme of WRF to enable the aerosol–radiation feedback in the forecast. To ensure the accuracy of the high-frequency (hourly) updated aerosol optical depth (AOD) field, the temporal and spatial variations of simulated AOD and aerosol extinction coefficient at 550 nm were evaluated against in situ and satellite observations. Comparisons with in situ and Moderate Resolution Imaging Spectroradiometer (MODIS), AErosol Robotic NETwork (AERONET), and Cloud-Aerosol Lidar and Infrared Pathfinder Satellite Observation (CALIPSO) satellite observations showed that the model could reproduce the spatial and vertical distribution as well as the temporal variation of the polluted episode. Further comparison of PM2.5 with in situ observation showed WRF-Chem reasonably captured the PM2.5 field in terms of spatial distribution and magnitude, with the correlation coefficients of 0.85, 0.89, 0.76, 0.92 and 0.77 in Beijing, Shijiazhuang, Tianjin, Hebei and Henan, respectively. Forecasts with and without the aerosol information were conducted further, and the differences of surface radiation, energy budget and meteorological parameters were evaluated against surface and sounding observations. The offline-coupling simulation (with aerosol–radiation interaction active) showed a remarkable decrease in downward shortwave (SW) radiation reaching the surface, thus helping to reduce the overestimated SW radiation during the daytime. The simulated surface radiation budget was also improved, with the biases of net surface radiation decreased by 85.3 %, 50.0 %, 35.4 % and 44.1 % during the daytime in Beijing, Tianjin, Taiyuan and Jinan respectively, accompanied by the reduction of sensible (16.1 W m−2, 18.5 %) and latent (6.8 W m−2, 13.4 %) heat fluxes emitted by the surface around noon. In addition, the cooling of 2 m temperature (∼0.40 ∘C) and the decrease in horizontal wind speed near the surface (∼0.08 m s−1) caused by the aerosol–radiation interaction over northern China helped to reduce the bias by ∼73.9 % and ∼7.8 % respectively, particularly during the daytime. Further comparisons indicated that the simulation-implemented AOD could better capture the vertical structure of atmospheric wind. Accompanied with the lower planetary boundary layer and the increased atmospheric stability, both U and V wind at 850 hPa showed convergences which were unfavorable for pollutant dispersion. Since RMPAS-ST provides meteorological initial conditions for RMAPS-Chem, the changes of meteorology introduced by aerosol–radiation interaction would routinely impact the simulations of pollutants. To verify the statistical significance of the results, we further conducted the 24 h forecasts for a longer period lasting 27 d (13 January–8 February 2017), with no AOD field (NoAero) and WRF-Chem-simulated hourly AOD fields (Aero) included, as well as a constant AOD value of 0.12 (ClimAero). The 1-month results were statistically significant and indicated that the mean RMSE of 2 m temperature (wind speed at 10 m) in Aero and ClimAero relative to NoAero was reduced by 4.0 % (1.9 %) and 1.2 % (1.6 %). More detailed evaluations and analysis will be addressed in a future article. These results demonstrated the influence of aerosol–radiation interactions on the improvement of predictive accuracy and the potential prospects to offline coupling of near-real-time aerosol information in regional RMAPS-ST NWP in northern China.
- Article
(24358 KB) - Full-text XML
- BibTeX
- EndNote


Aerosol–radiation interactions modify the radiative energy budget of the earth–atmosphere system through the interaction between aerosols and solar radiation by scattering and absorbing mechanisms as well as the absorption and emitting of thermal radiation (Ramanathan et al., 2001; Yu et al., 2006). The aerosol–radiation interaction may cool or heat the earth–atmosphere system and alter surface and atmospheric radiation and temperature structure on regional and global climate, which has been widely reported and studied (Hansen et al., 1997; Ramanathan et al., 2001; Kaufman et al., 2002; Liao et al., 2006; Zhang et al., 2010; Ghan et al., 2012; Yang and Ren, 2017). Considering the lifetime of most aerosol particles and their locally uneven distribution, as well as their high dependence on emission sources and local meteorological conditions for dispersion (Rodwell and Jung, 2008; Liu et al., 2012; Liao et al, 2015), the impacts of episodic aerosol events over regional areas are worthy of more concern (Cheng et al., 2017; Zheng et al., 2019).
With substantial aerosol loading, aerosol particles have significant influences on meteorology, and many endeavors by both field experiments and numerical models have been devoted to studying the impacts of aerosol–radiation interaction on meteorological fields, including surface solar radiation, planetary boundary layer (PBL), atmospheric heating rate, atmospheric stability (Hansen et al., 1997; Ackerman et al., 2000; Quan et al., 2014; Yang et al., 2017; Wang et al., 2018), cloud formation due to thermodynamic changes, and the onset or reduction of precipitation systems (Grell et al., 2011; Guo et al., 2016, Jiang et al., 2017). For instance, in worldwide, the simulations with the Weather Research and Forecasting (WRF) model coupled with Chemistry (WRF-Chem) showed that by purely taking into account the aerosol–radiation interactions, aerosols may reduce incoming solar radiation by up to −9 % (−16 %) and 2 m temperatures by up to 0.16 ∘C (0.37 ∘C) in January (July) over the continental US (Zhang et al., 2010), affect meso-scale convection systems owing to thermodynamic changes over Atlantic Ocean during Saharan dust eruption periods (Chen et al., 2017), and lead to distinct changes in precipitation due to the changes in temperature profile and stabilities induced by the aerosol–radiation interaction over eastern China (Huang et al., 2016).
Northern China experienced heavy air pollution in the past two decades, with particulate matter (PM) being the primary pollutant, particularly during wintertime (Chan and Yao, 2008; Q. Zhang et al., 2015; Zhao et al., 2019) due to the combination of high primary and precursor emissions and frequent stable meteorological conditions in this area (Elser et al., 2016; Zhang et al., 2018). The effects of aerosol–radiation interaction on meteorology were expected to be much more significant over northern China. Applying the WRF and Community Multi-scale Air Quality Model (CMAQ) system (WRF-CMAQ), Wang et al. (2014) and Sekiguchi et al. (2018) reported a 53 % reduction in solar radiation reaching the surface and a ∼100 m decrease in planetary boundary layer height (PBLH) in response to the presence of aerosols during a severe winter haze episode in China. Wang et al. (2015a, b) used the online chemical weather forecasting mode Global–Regional Assimilation and PrEdiction System coupled with the Chinese Unified Atmospheric Chemistry Environment (GRAPES/CUACE) and illustrated that the solar radiation at ground decreased by 15 % in Beijing–Tianjin–Hebei, China, and its near surroundings, accompanied by a decrease in turbulence diffusion of about 52 % and a decrease in PBLH of about 33 % during a haze episode in summertime 2008.
Considering the significant influence of the aerosol–radiation interaction on meteorological forecasts as illustrated in many studies (Kaufman et al., 2002; Zhang et al., 2010), several weather forecast centers are conducting research to facilitate the inclusion of more complex aerosol information in operational numerical weather prediction (NWP) models. For example, Rodwell and Jung (2008) showed the local medium-range forecast skills were improved due to the application of new climatological aerosol distribution in the European Centre for Medium-Range Weather Forecasts (ECMWF). Recently, a positive impact up to a 48 h lead time on the 2 m temperature and forecasts of surface radiative fluxes was reported in ECMWF by applying the prognostic aerosols compared to the monthly climatological aerosol (Rémy et al., 2015). Toll et al. (2016) found that the inclusion of aerosol effects in the NWP system was beneficial to the accuracy of simulated radiative fluxes, temperature and humidity in the lower troposphere over Europe. In addition, it was shown that the quality of weather forecasts at UK MET office can be further advanced when the real-time aerosol distribution rather than climatological distribution was included, with the decreased bias of downward SW at the surface (−2.79 W m−2 vs. −5.30 W m−2) and the mean sea-level pressure (0.71 hPa vs. 0.80 hPa) (Mulcahy et al., 2014; Toll et al., 2015). For this research on operational NWP systems, both online and offline approaches (where aerosol information was simulated by a separate chemistry system and then offline coupled to the NWP model) were widely used.
In most previous research-targeted modeling studies over northern China, the aerosol–radiation interaction has been widely assessed in online-coupled meteorology–chemistry models, which might not be practical for NWP purposes. Considering aerosol particles differ by morphology, size and chemical composition, the numerical treatment of aerosol particles in atmospheric models needs a sophisticated method and considerable simplifications, which may bring in more assumptions and uncertainties in online coupling (Baklanov et al., 2014). Moreover, the online simulations require quite high computational costs and could not meet the requirement of efficiency for operational NWP. Grell and Baklanov (2011) illustrated that the offline approach could generate almost identical results compared to online simulation with the offline-coupling intervals of about 0.5–1 h. Thus, the computationally economic offline simulation provides a feasible and computationally less demanding approach to include the aerosol–radiation interaction in an operational NWP system. Péré et al. (2011) adopted an offline-coupling between the chemistry–transport model CHIMERE and WRF to study the radiative forcing of high load aerosols during the heat wave of summer 2003 over western Europe. Wang et al. (2018) offline implemented the daily AOD from the Moderate Resolution Imaging Spectroradiometer (MODIS) to WRF during heavy winter pollution in Beijing to study the effect of aerosols on the boundary layer. Still, there have been few studies that adopted offline simulation to investigate the impacts of aerosol–radiation interactions over northern China in an NWP system. At the Institute of Urban Meteorology, a regional operational NWP system, RMAPS-ST (adapted from WRF), and regional air quality model, RMPSA-Chem (adapted from WRF-Chem), were applied operationally. In this study, we investigate the radiative effects of aerosols and their feedbacks on weather forecasting over northern China during a pollution event occurring in winter 2015, and further potential impacts of changed meteorology to the transport and dissipation of pollution. The simulations were in the configurations of the two systems, aiming to present the offline coupling of the high-frequency real-time aerosol distribution simulated by WRF-Chem and WRF and evaluate the potential effects of aerosol–radiation interactions on the forecast skills in the RMAPS-ST system for future applications.
The remainder of the paper is organized as follows. Section 2 presents the model configuration and experimental design. In Sect. 3, the model's capabilities in capturing and forecasting the pollution episode are validated with observations first, and impacts of aerosol–radiation interactions on meteorological forecasting over northern China are analyzed further. The final section provides the concluding remarks.
WRF is a state-of-the-art atmospheric modeling system designed for both meteorological research and NWP. The WRF version 3.8.1 released in August 2016 was used in this study for a domain covering northern China with a horizontal resolulation of 9 km (222×201 grid points, Fig. 1a), and for 50 vertical levels. The lateral boundary conditions (BCs) and initial conditions (ICs) for meteorological variables are provided by the forecast of ECMWF. The major physical schemes include the Assymetric Convective Model Version 2 (ACM2) PBL scheme (Pleim, 2007); the Thompson microphysics without an aerosol-aware option (Thompson et al., 2008); the Kain-Fritsch cumulus parameterization (Kain, 2004); and the National Center for Environmental Prediction, Oregon State University, Air Force, and Hydrologic Research Lab's (NOAH) land-surface module (Chen and Dudhia, 2001; Ek et al., 2003). The land-use data have been reprocessed, with a higher accuracy and finer classification for urban areas (Zhang et al., 2013), and the urban canopy model (UCM) was not activated.
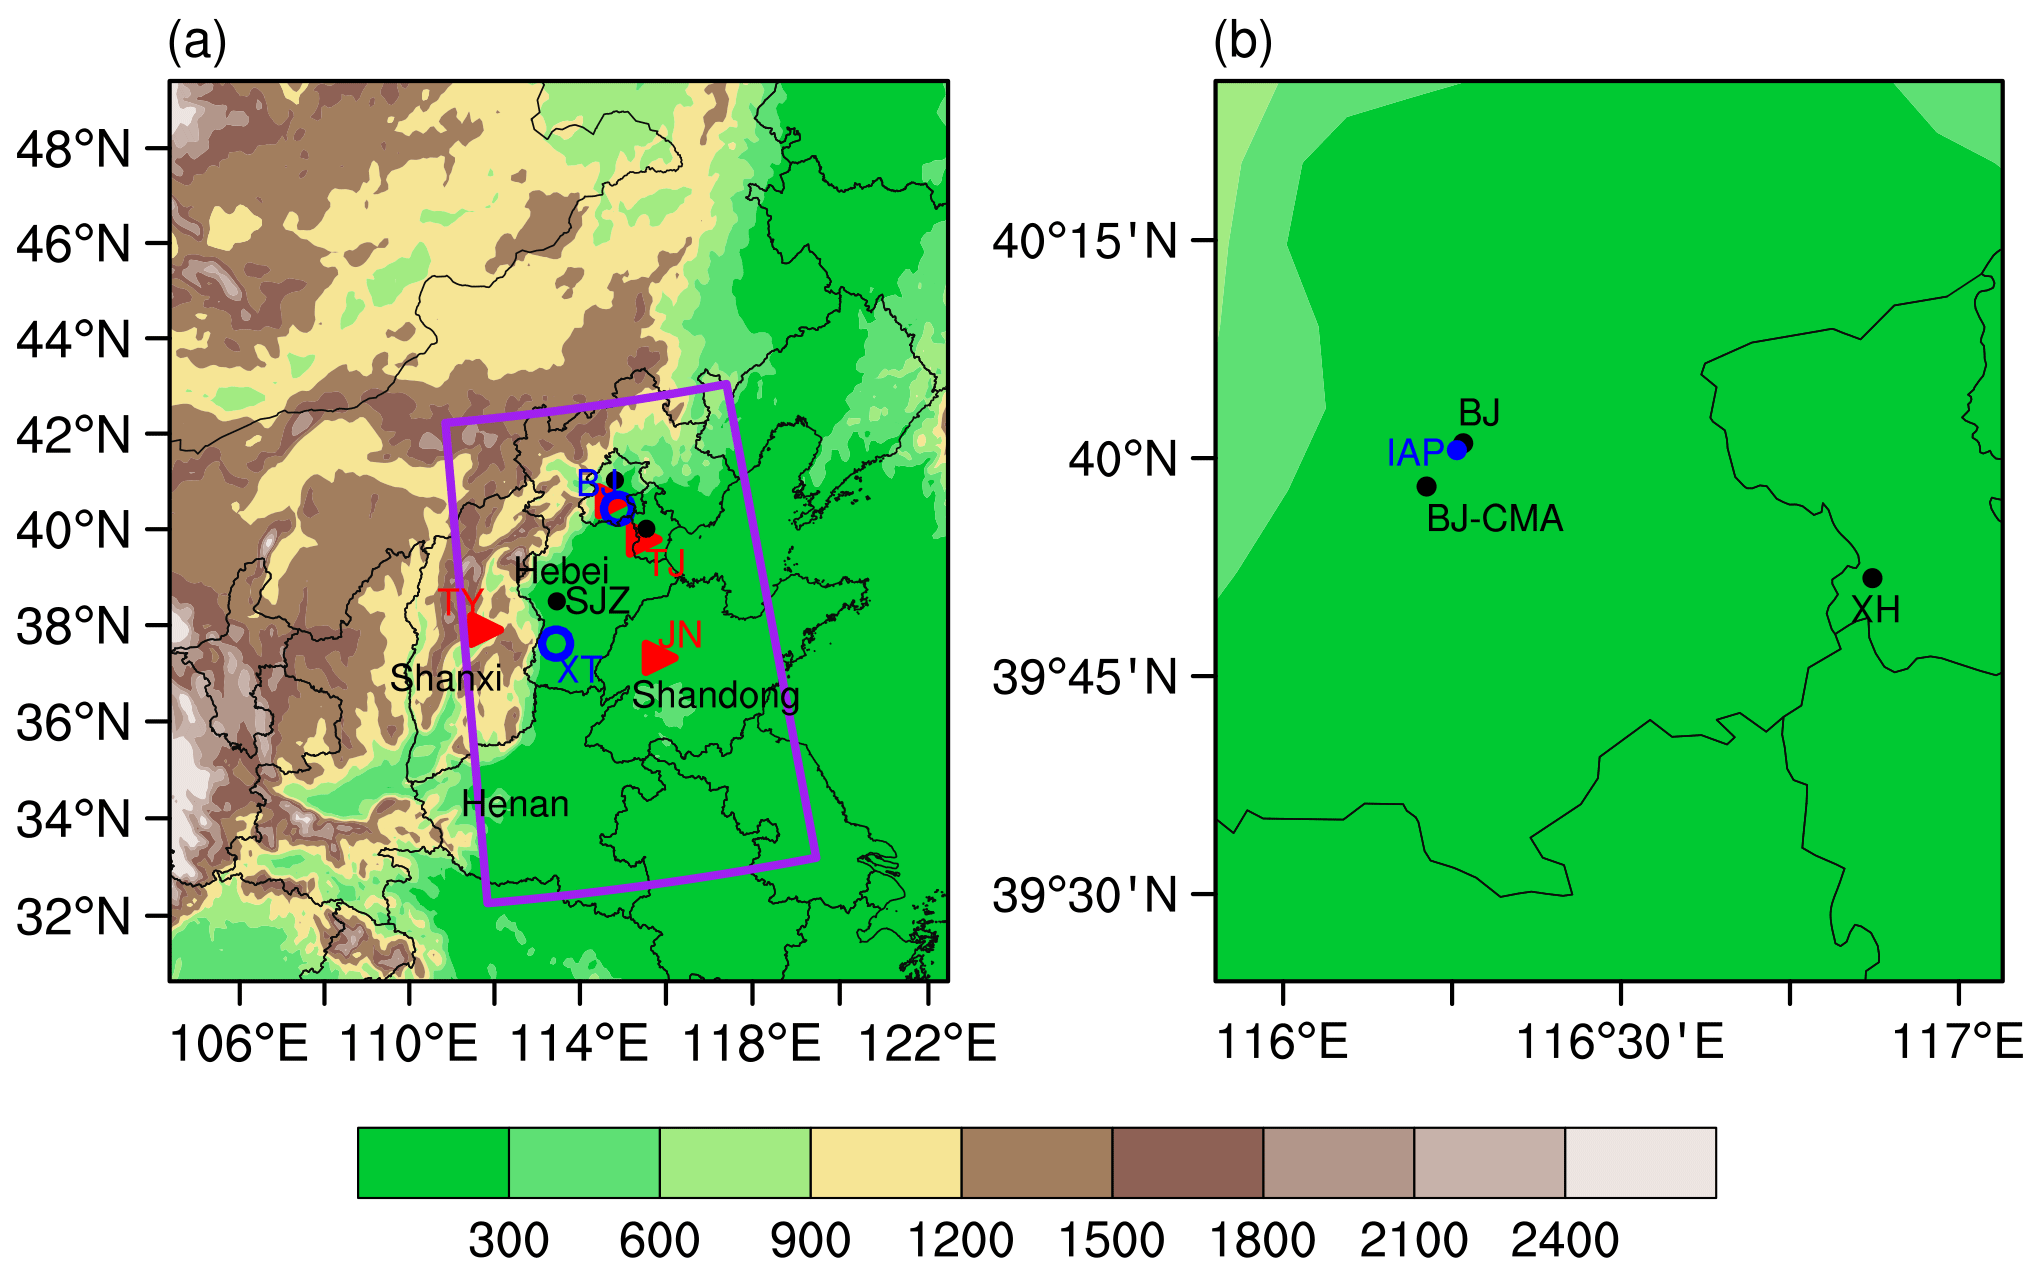
Figure 1(a) The model domain and the terrain height (shadings, m). Purple box denotes the NCP, triangles are the observational sites of radiation (BJ: Beijing, TJ: Tianjin, TY: Taiyuan and JN: Jinan), circles are sites of sounding observation (BJ: Beijing and XT: Xingtai), dots denote the major cities for validation of PM2.5 (BJ: Beijing, SJZ: Shijiazhuang and TJ: Tianjin). Names of provinces are also added (Hebei, Shanxi, Shandong and Henan). (b) The observational sites of AOD, including AERONET sites (black dots, BJ: Beijing, BJ-CMA: Beijing-CMA and XH: Xianghe) and the IAP in situ (blue dot) site.
The shortwave and longwave radiation scheme is the Rapid Radiative Transfer Model for General Circulation Models (RRTMG) (Iacono et al., 2008). The RRTMG scheme is a new version of RRTM added in Version 3.1 and includes the Monte Carlo independent column approximation (MCICA) method of random cloud overlap. A recent intercomparison study showed that the RRTMG had relatively smaller mean errors in solar flux at the surface and the top of the atmosphere (Oreopoulos et al., 2012) and was considered a recommended WRF configuration for air quality modeling (Rogers et al., 2013). The RRTMG scheme is capable of including the climatological aerosol data with spatial and temporal variations or an external time-varying 3D aerosol input through the option of AER_OPT (Ruiz-Arias et al., 2014). In the present study, the real-time hourly aerosol optical depth (AOD) at 550 nm from external files was input into WRF following the second approach. The AOD at 550 nm was calculated as the vertical integral of extinction coefficients at 550 nm from the WRF-Chem simulation.
WRF-Chem version 3.3.1 was applied in this study, and the horizontal resolution was 9 km, with 222×201 grid points covering northern China, which was the same configuration of WRF mentioned above. WRF-Chem simulates the formation, transformation and transport processes of both primary and secondary atmospheric pollutants, including gases and PM species (Zhao et al., 2019). Physical parameterizations included a single-layer urban canopy model, Noah land-surface, Yonsei University (YSU) PBL, Grell-Devenyi ensemble convection, Thompson microphysics, and RRTM longwave and Goddard shortwave radiation (Chen and Dudhia, 2001; Hong et al., 2006; Grell and Dévényi, 2002; Thompson et al., 2008; Mlawer et al., 1997; Chou and Suarez, 1999). A carbon bond mechanism Z (CBMZ) including comprehensive reactions and alterable scenarios was used as the gas-phase mechanism. The model for Simulating Aerosol Interactions and Chemistry (MOSAIC) is used with four size bins (Zaveri and Peters, 1999). Anthropogenic emission data were from the MEIC (2012) inventory (http://www.meicmodel.org/, last access: 1 November 2020) with a resolution of . Meteorological ICs and BCs were obtained from the final analysis data (FNL) with a resolution of from the National Centers for Environmental Prediction (NCEP). To generate aerosol fields for the study period (2–11 December), 9 d WRF-Chem simulations from 2 December were conducted using prescribed idealized profiles as ICs and BCs for chemical species.
To estimate the aerosol radiative forcing and its feedbacks on meteorological fields, two sets of 24 h WRF forecasts were conducted at 00:00 UTC from 2 to 10 December 2015. The only difference between the two sets of forecasts is whether the aerosol radiative feedback is activated (Aero, with WRF-Chem simulated hourly AOD fields as input fields) or not (NoAero, no aerosol included), and other schemes remained the same. It is noted that the aerosol–cloud interactions were not included in the study.
The sites of observations over simulated domain and northern China plains (NCP, purple box in Fig. 1a) were shown in Fig. 1. The 550 nm AOD retrievals from Level 2 of MODIS sensors onboard polar orbiting Terra and Aqua satellites were adopted to evaluate the spatial distribution of modeled AOD. The vertical distributions of aerosol extinction coefficient at 550 nm were compared with those from Cloud-Aerosol Lidar and Infrared Pathfinder Satellite Observations (CALIPSO) satellite. Moreover, three sites of the AErosol Robotic NETwork (AERONET) were used to validate the simulation (black dots in Fig. 1b), and the observed AOD obtained from observation at the Institute of Atmospheric Physics (IAP), Chinese Academy of Sciences (39∘58′28′′ N, 116∘22′16′′ E), in Beijing city (blue dot in Fig. 1b) was also included as supplementary. The hourly observed PM2.5 concentrations of a total of 813 and 332 monitoring stations over the study domain and NCP, respectively, were from the released data by the China National Environmental Monitoring Centre (http://106.37.208.233:20035/, last access: 1 November 2020, colored dots in Fig. 3a). For given cities (dots in Fig. 1a), hourly PM2.5 concentration was represented by the average of data from all monitoring sites located in the city. Simulated meteorological variables including 2 m temperature and wind speed at 10 m were evaluated using in situ observations from the National Meteorological Information Center (http://data.cma.cn/data/cdcindex.html, last access: 1 November 2020) of the China Meteorological Administration (CMA, dots in Fig. 8a). The radiations were observed at IAP and in situ stations of CMA (shown as triangles in Fig. 1a). The vertical observation of atmospheric wind speed from sounding were also used (circles in Fig. 1a). The variables, sources, numbers of sites in the domain and NCP, and the frequency of chemical and meteorological observations were also listed in Table 1.
Table 1The variables, sources, numbers of sites in the domain and the NCP, and the frequency of chemical and meteorological observations.
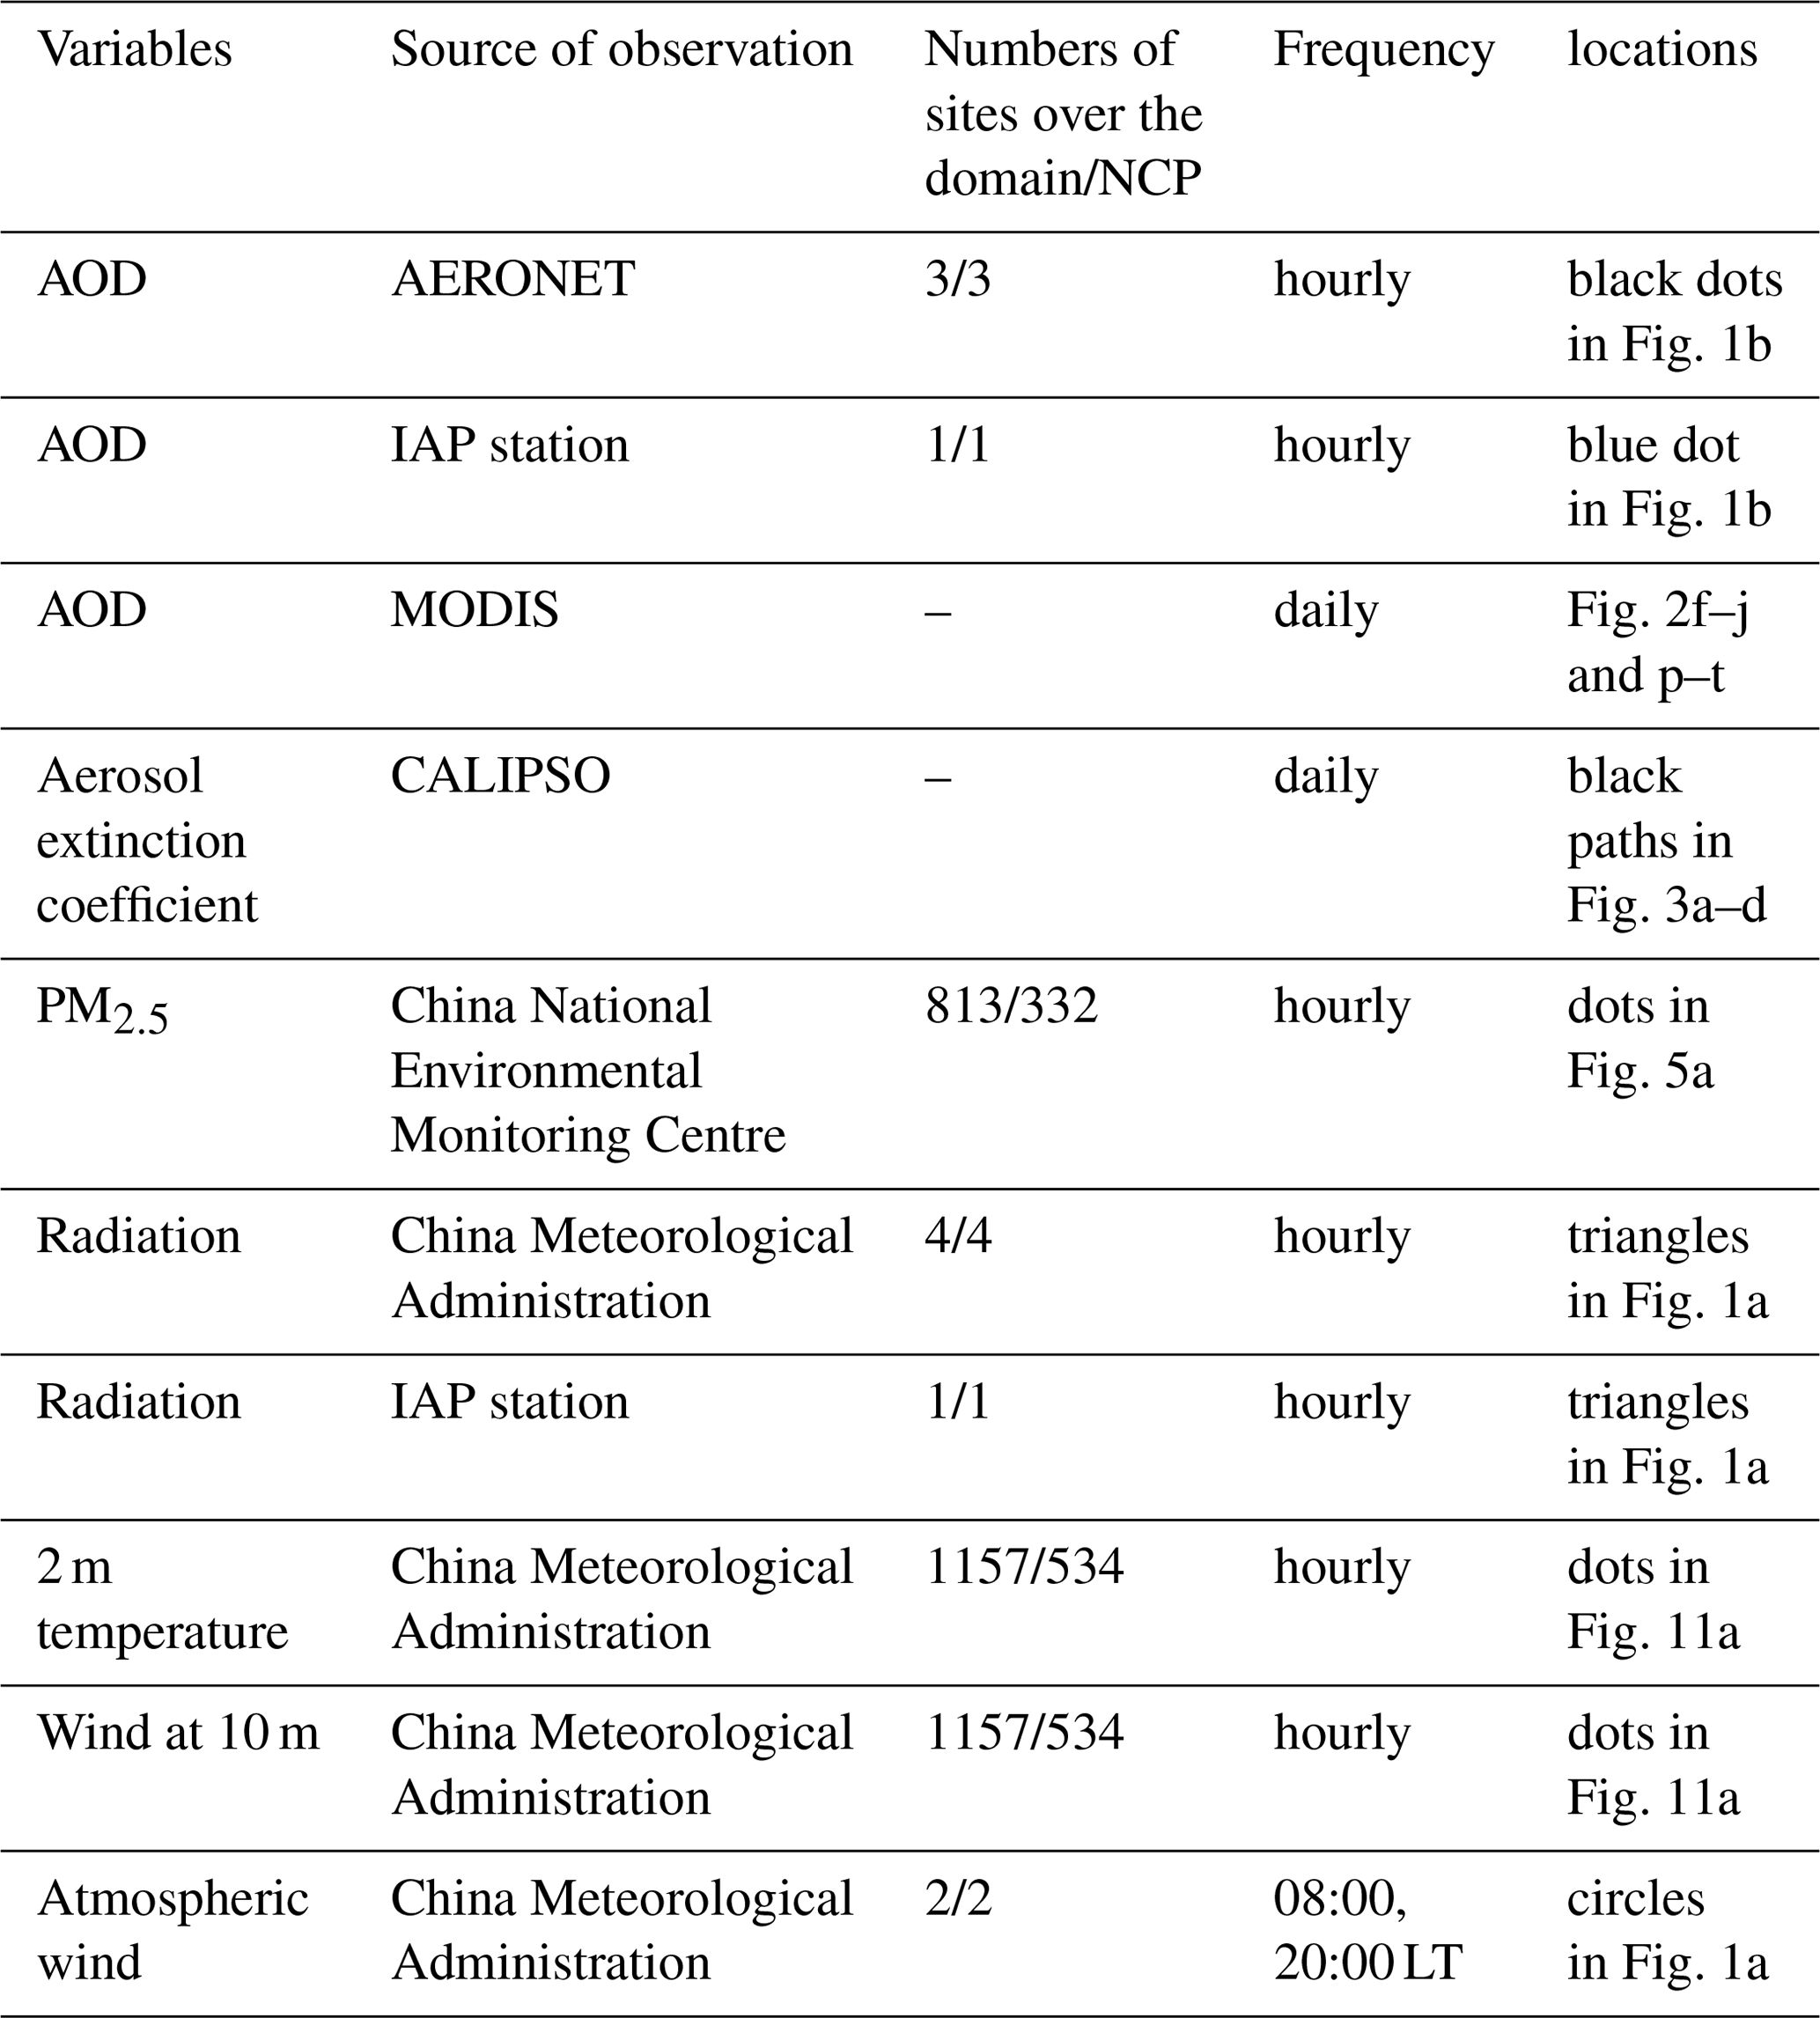
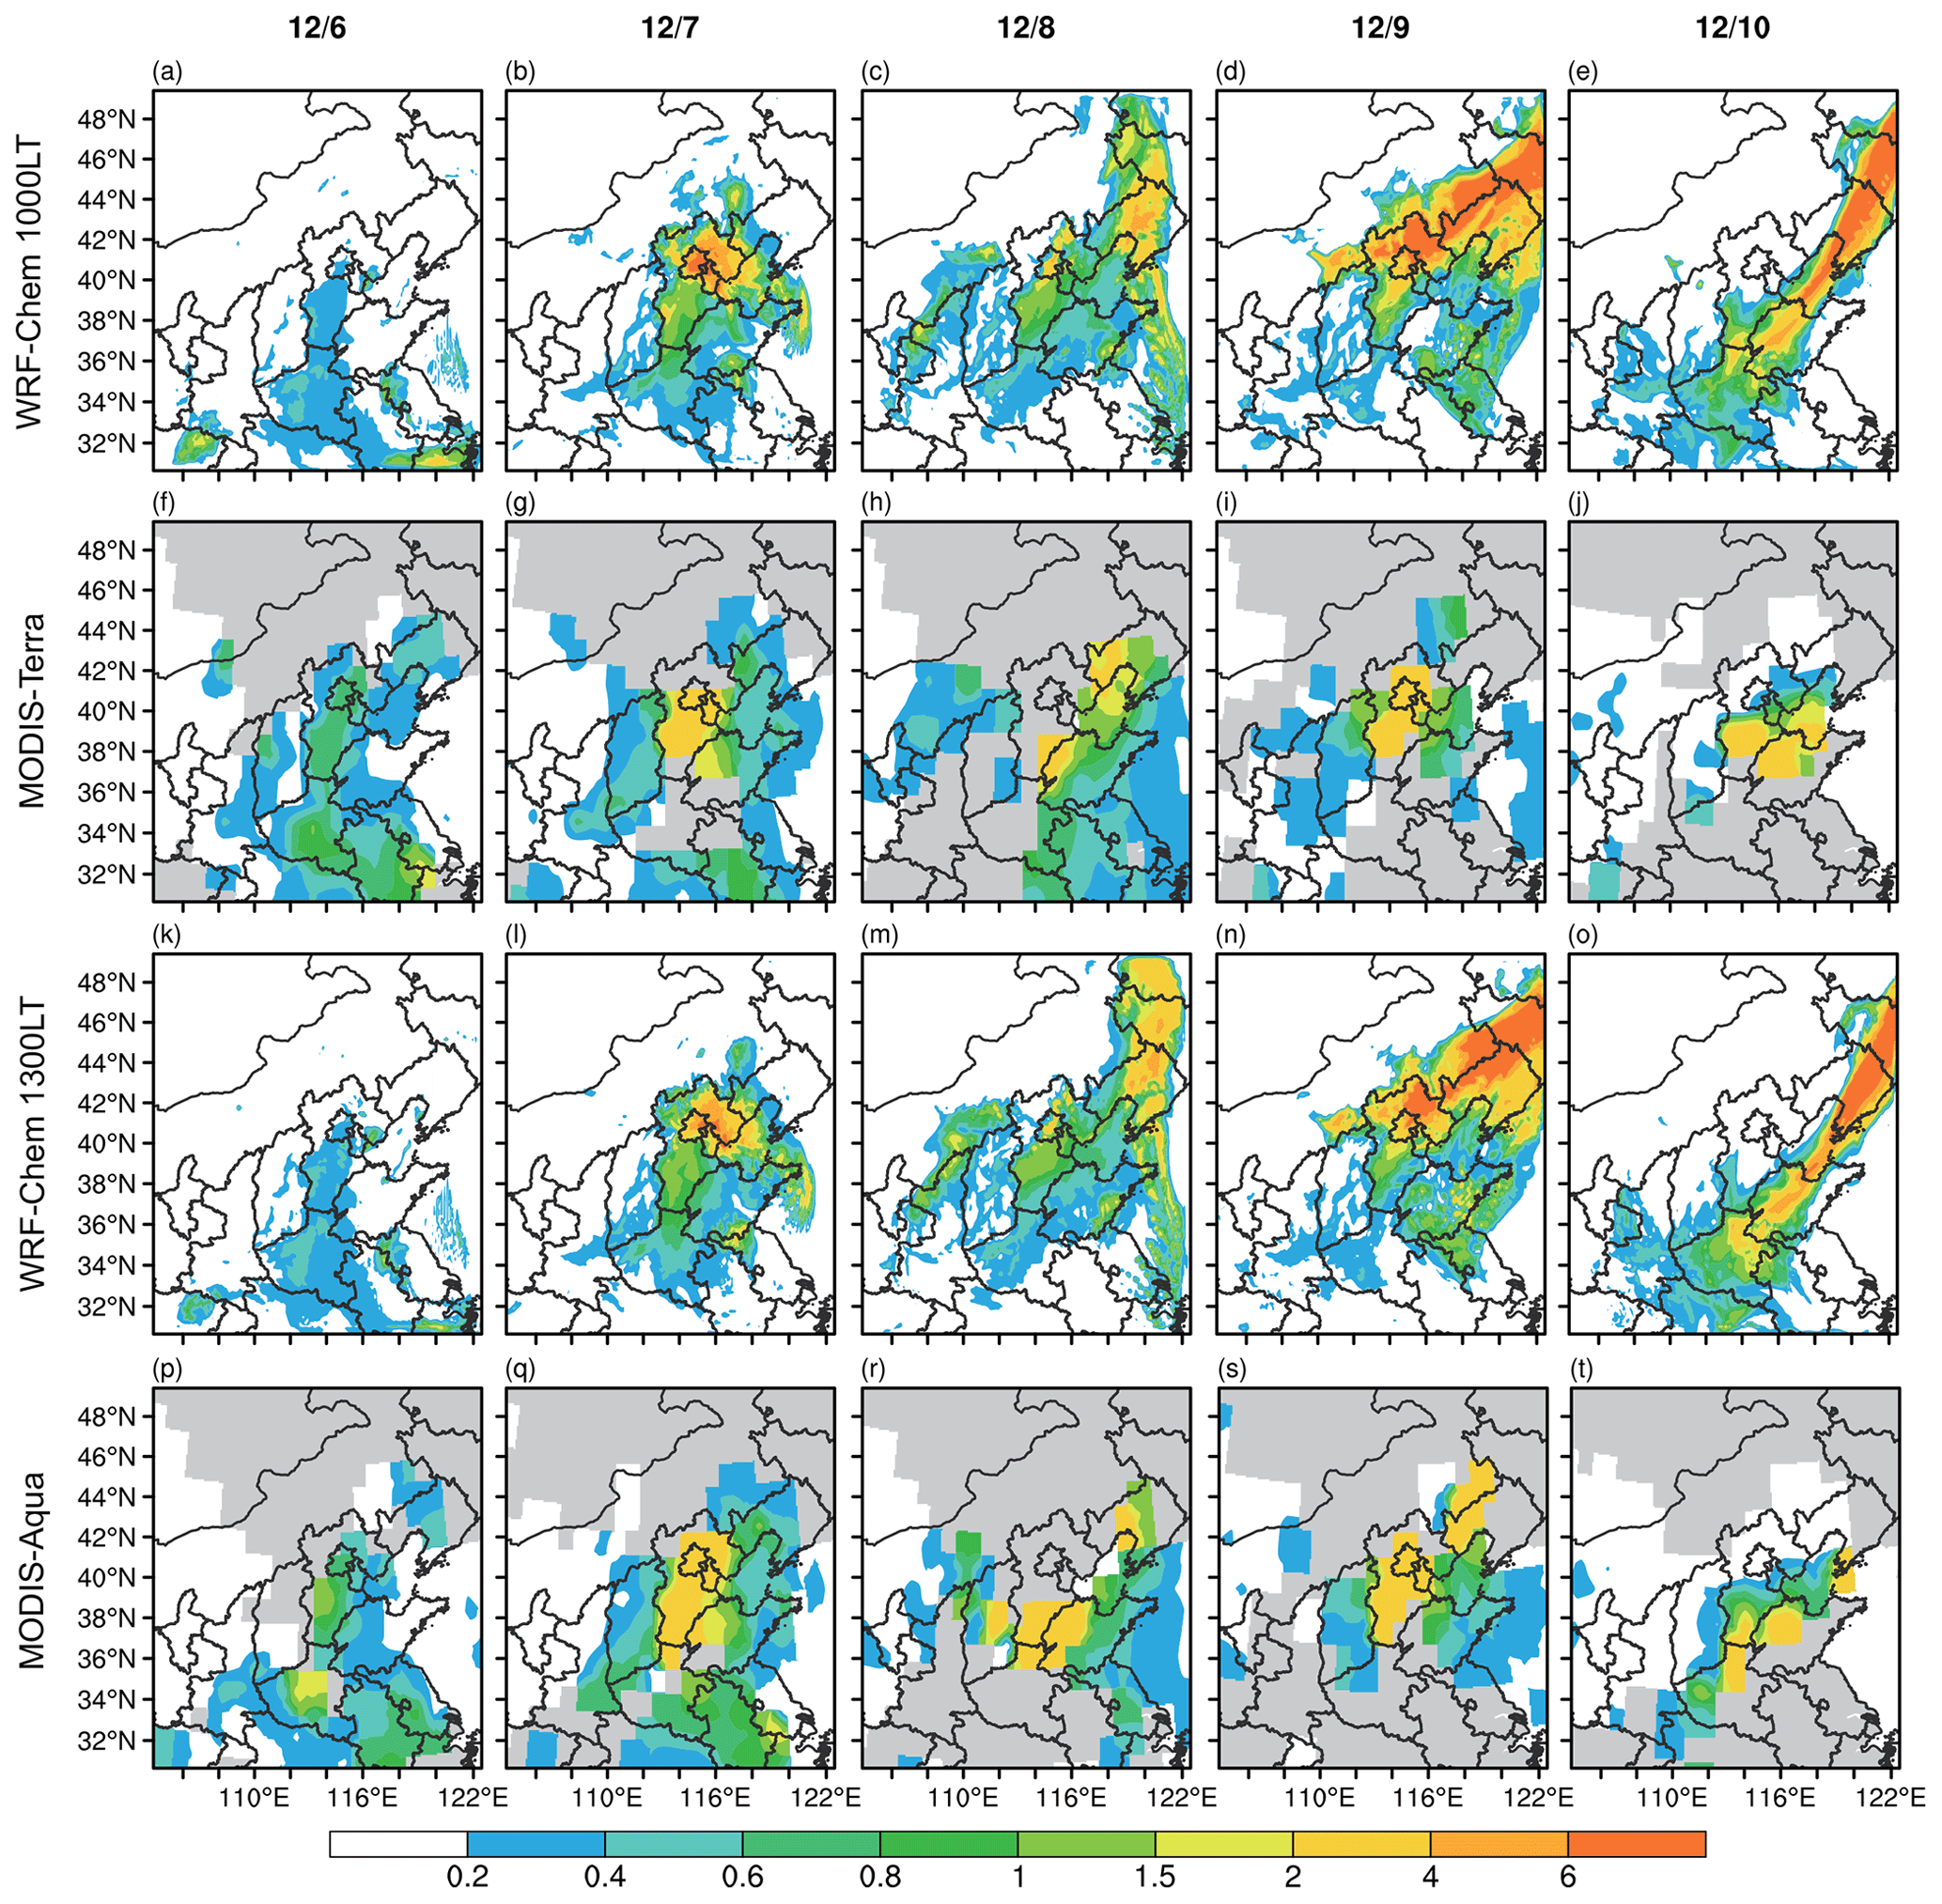
Figure 2The WRF-Chem simulated and MODIS observed spatial distribution of AOD on 6–10 December (from left to right). The first (a–e) and third rows (k–o) are WRF-Chem simulations at 10:00 and 13:00 LT (MODIS path times) respectively. The second (f–j) and fourth (p–t) rows are MODIS Terra and Aqua observations, respectively. Gray areas in (f–j) and (p–t) denote the missing values.
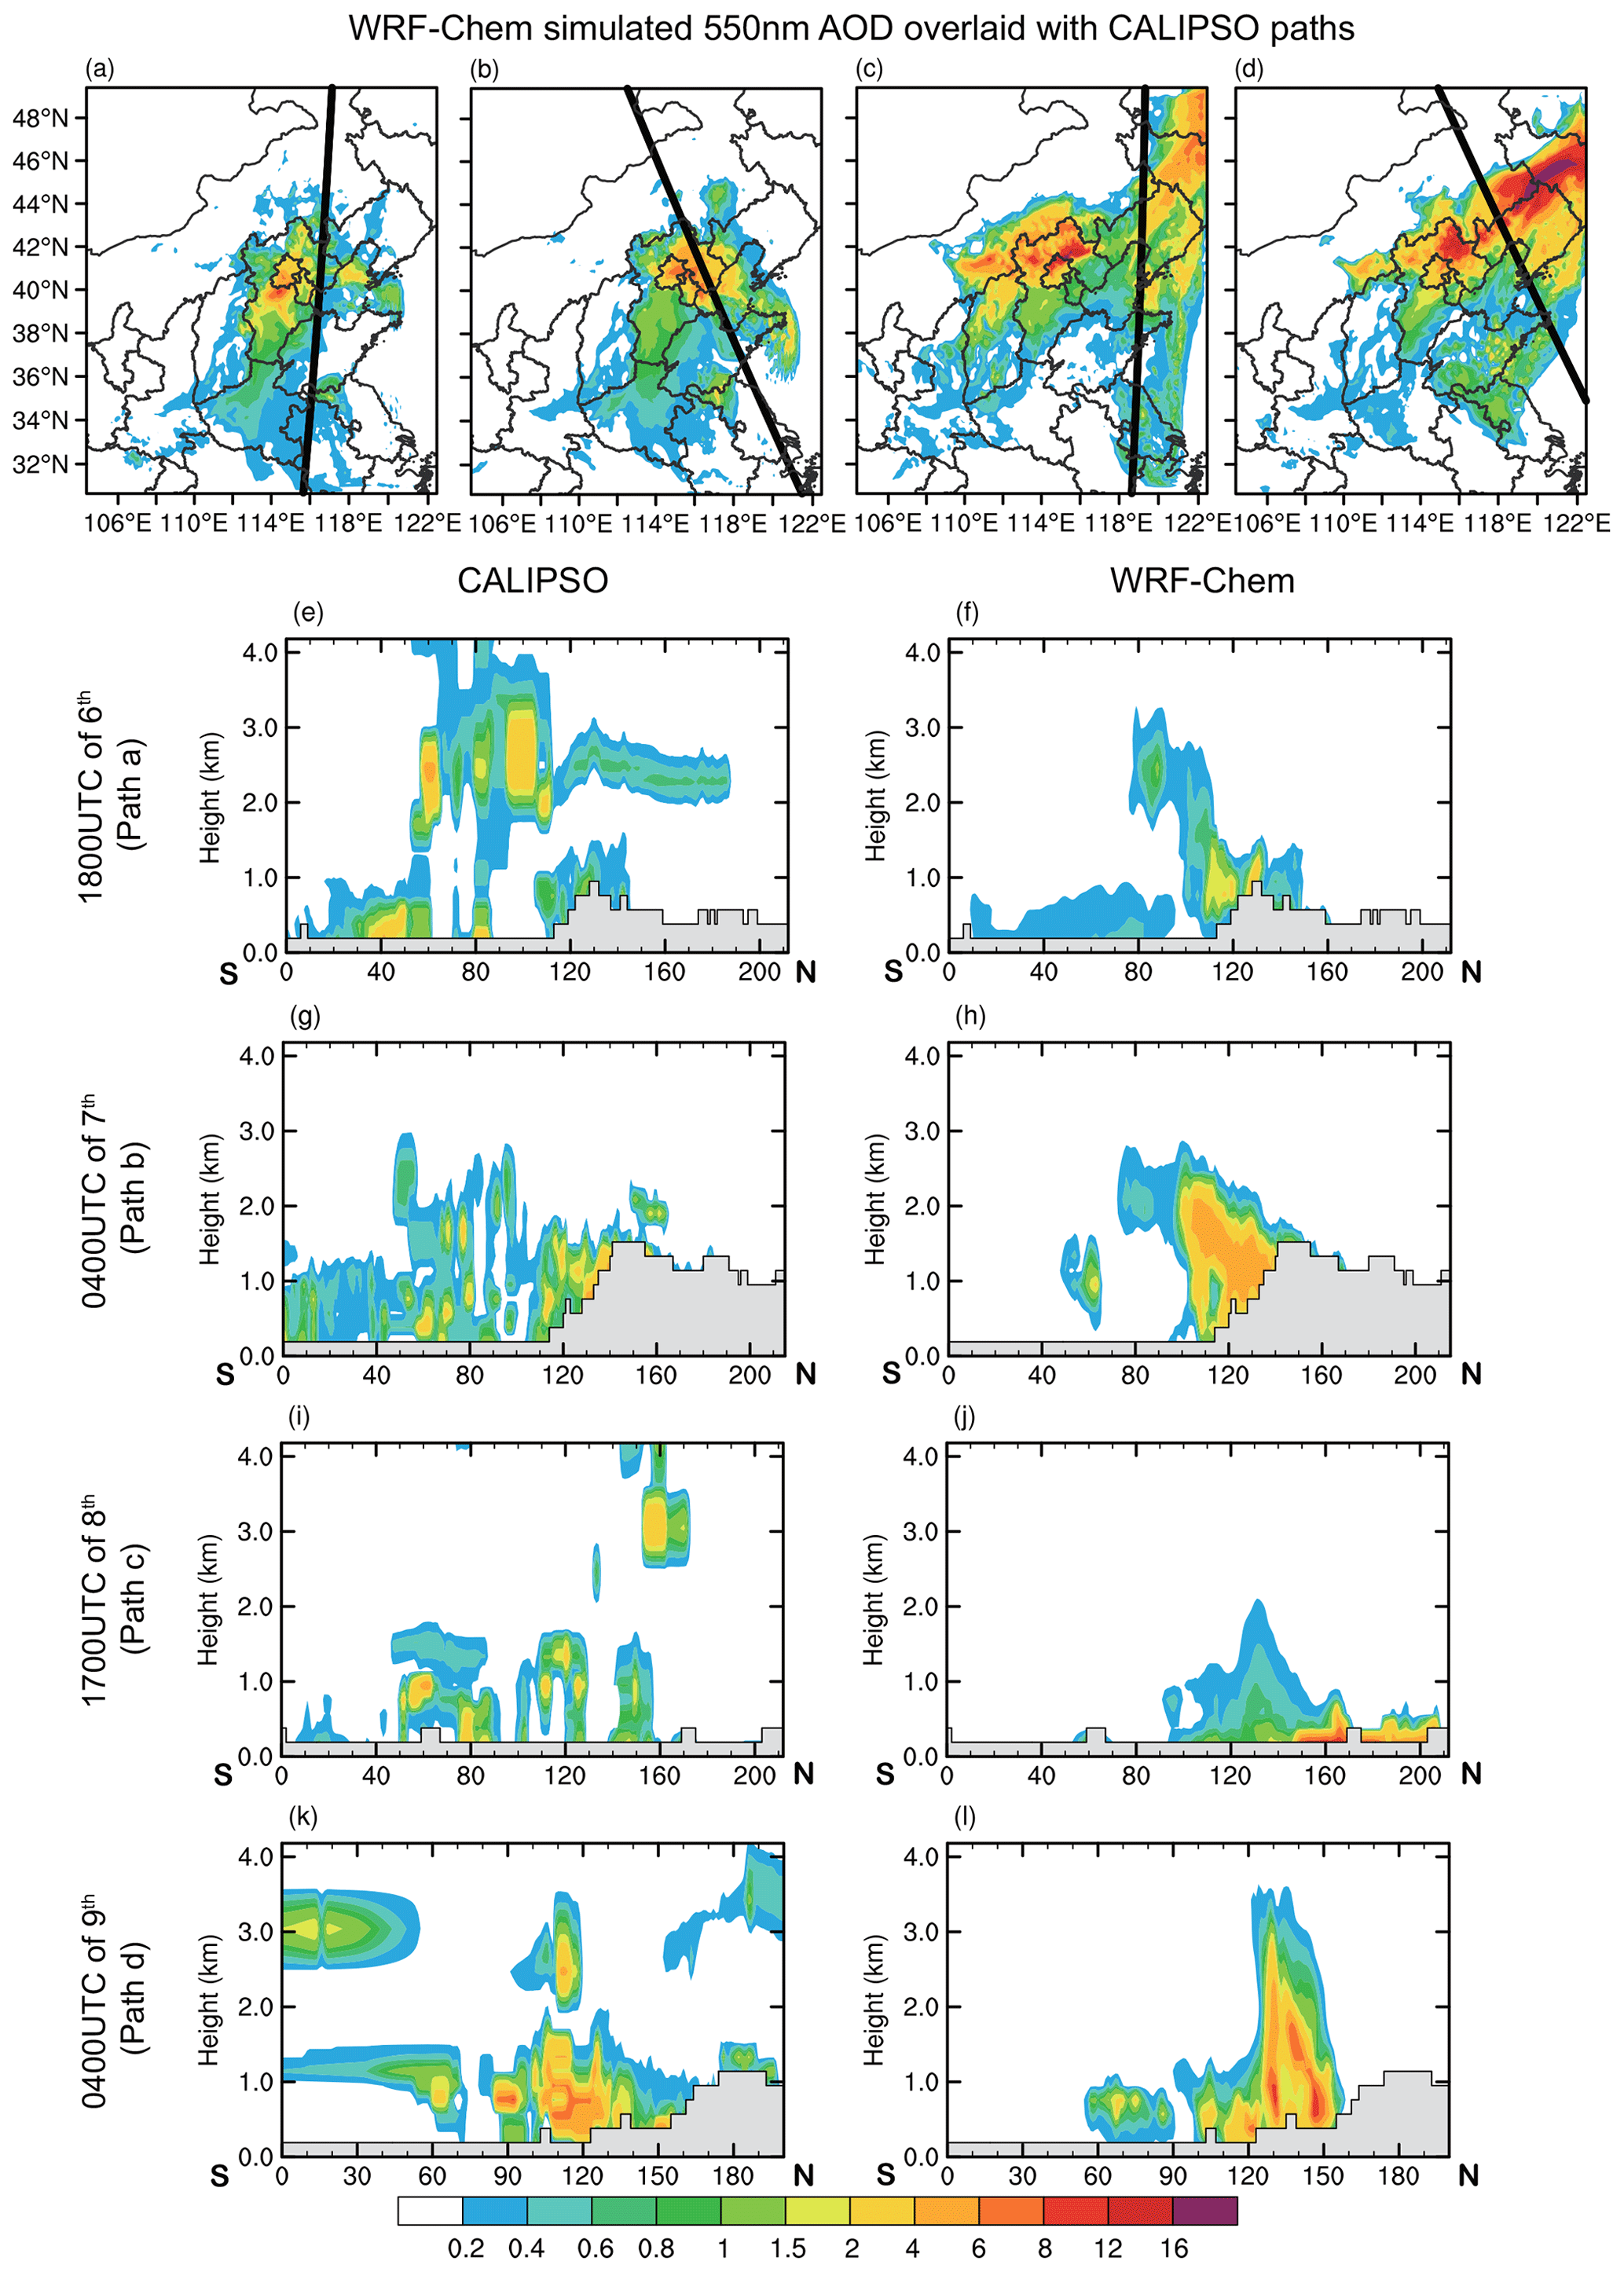
Figure 3The WRF-Chem-simulated 550 nm AOD (shadings) on (a) 18:00 UTC on 6 December, (b) 04:00 UTC on 7 December, (c) 17:00 UTC on 8 December, (d) 04:00 UTC on 9 December overlaid with CALIPSO paths (black thick solid). Panels (e–l) denote the corresponding vertical distributions of aerosol extinction coefficient at 550 nm from (e, g, i, k) CALIPSO and (f, h, j, l) model simulations. Gray areas in (e–l) denote the terrain.
3.1 Evaluation of AOD and PM2.5 simulated by WRF-Chem
Before the offline coupling of the WRF-Chem simulated hourly AOD to meteorological model WRF, we first validated the simulated AOD and ensured the model's capability to reproduce the features of the aerosol field. Figure 2 shows the spatial distribution of modeled AOD and AOD from MODIS Terra and Aqua. It was seen that WRF-Chem is capable of capturing the AOD spatial distribution and also reproduced the transport paths during the event. The simulated high-value AOD was located in Henan on 6 December, then the center moved to Hebei and Beijing on 7 December and shifted to northeast areas afterwards. The variations of simulated AOD were in consistent with both Terra and Aqua with slightly overestimated peak value of AOD. In particular, the simulated shifting of AOD center to northeast areas was also observed in Aqua (Fig. 2r and s). To further verify the vertical distribution of aerosol extinction coefficients, Fig. 3 displays the vertical distributions of simulated 550 nm aerosol extinction coefficient compared to those from CALIPSO. Four cross sections along CALIPSO paths on 6 to 9 December are shown. The results indicated that the model could generally reproduce the vertical distribution of extinction coefficients at 550 nm in terms of comparable magnitude with those from CALIPSO, particularly on 6, 7 and 9 December. However, CALIPSO showed more high values at lower altitude (below 1 km) that model failed to capture; the inconsistency may be associated with both CALIPSO retrieval uncertainties at the low altitude and the model itself. Figure 4 further displays the temporal variation of simulated AOD at 550 nm (blue solid) at four sites, in comparison with three AERONET stations (black circles in Fig. 4a–c) and the IAP site (black circles in Fig. 4d) for the period during 3 to 11 December 2015 (local time, LT). As shown in blue solids in Fig. 4a, the simulated AOD increased since 6 December and reached the peak value of 9 on 7 December, and the high AOD value maintained until 9 December and reached the second peak. The second peak was also observed from AERONET though most of them were missing during the pollution event. The temporal variations of AOD at Beijing-CMA and IAP (Fig. 4b and d) were similar to those at Beijing station (Fig. 4a). Meanwhile, the simulated AOD at Xianghe (Fig. 4c) was relatively lower than those at other stations.
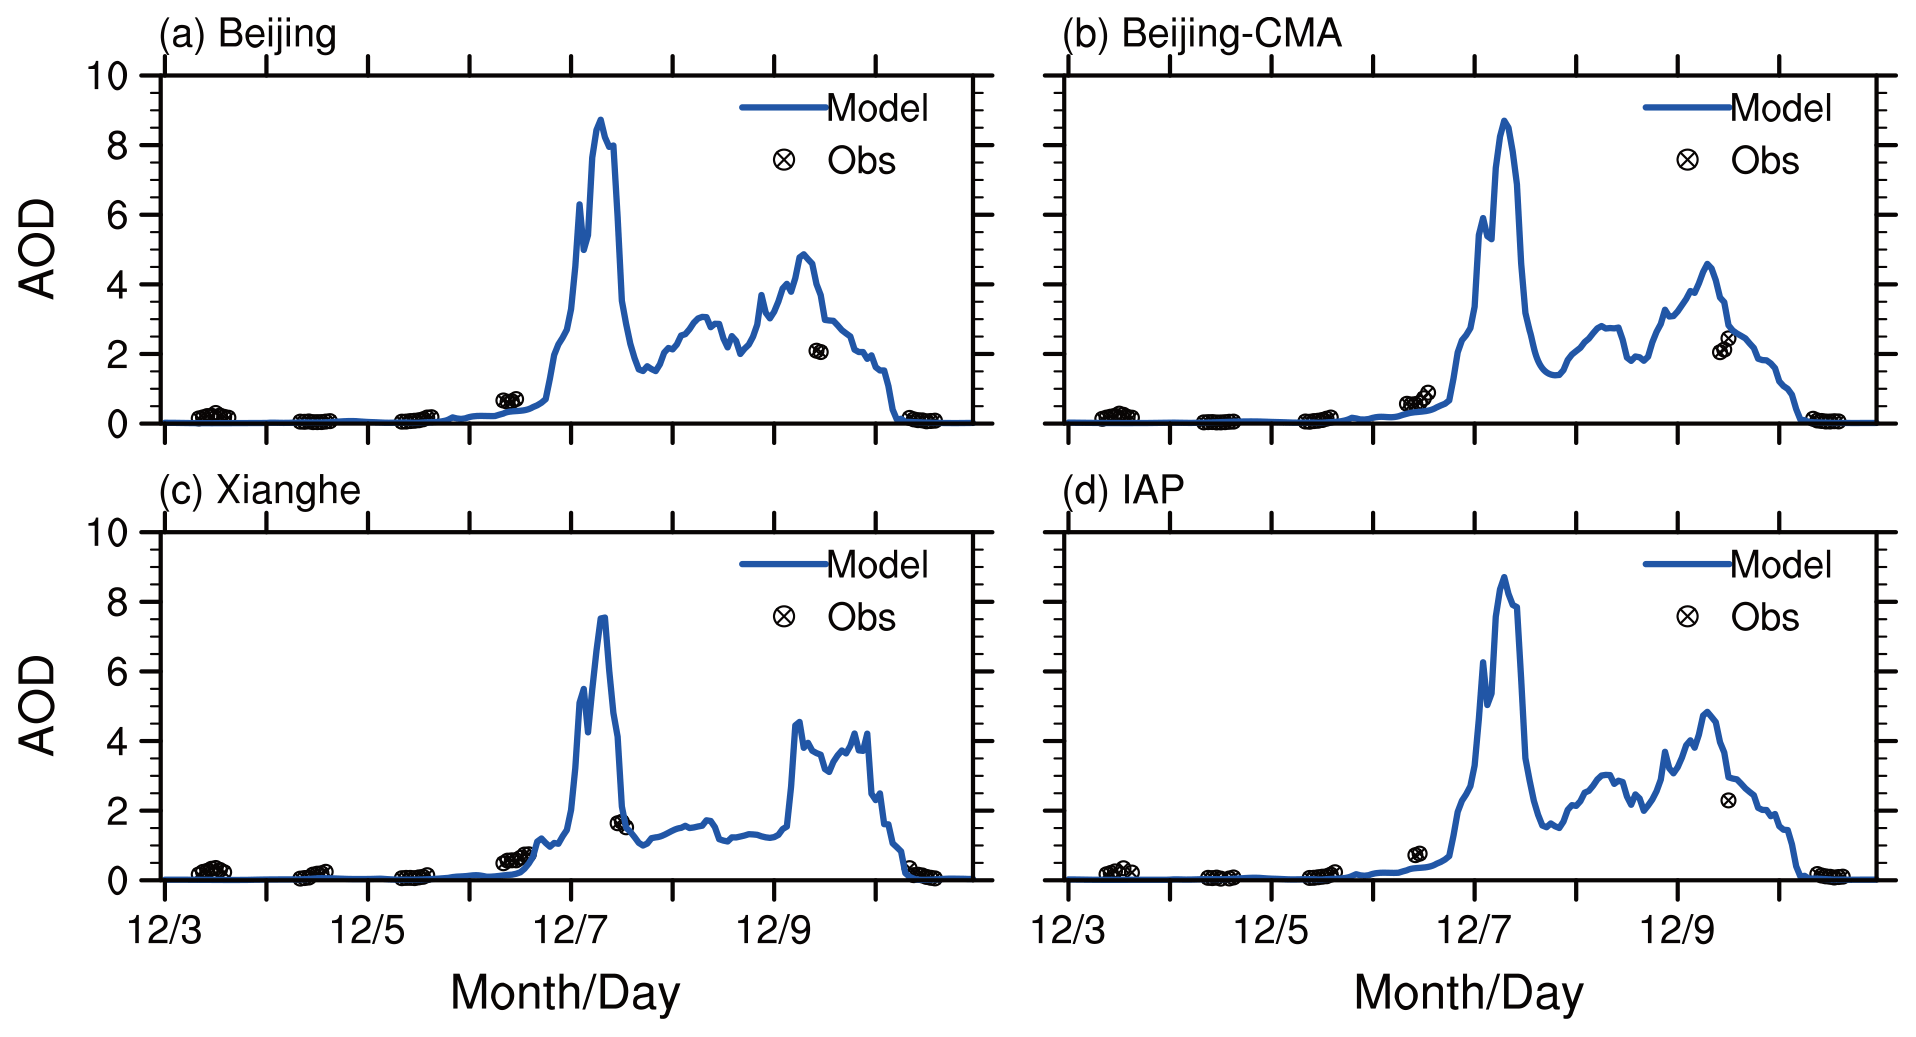
Figure 4Temporal variation of observed (black dots) and simulated (blue) AOD at 550 nm during 3–10 December (LT) at (a) Beijing, (b) Beijing-CMA, (c) Xianghe and (d) IAP. AOD observations are from (a–c) AERONET and (d) the IAP in situ site.
Considering that the aerosol extinction was mainly attributed to scattering and absorption of solar radiation by PM2.5 and their hygroscopic growth with relative humidity (Cheng et al., 2006), next we compared the simulated PM2.5 concentrations with corresponding in situ observation over the model domain. As shown in Fig. 5, the simulated and observed pollution were both initiated over Henan province on 6 December, further intensified and shifted northward afterwards. The polluted center was located over south of Hebei province and maintained until 10 December, with the maximum PM2.5 concentration exceeding 440 µg m−3. The results indicated that WRF-Chem could capture the spatial features of PM2.5 and its temporal variation well, in spite of the slight discrepancy of the center position during 9 and 10 December. Figure 6 displays the mean bias, root mean square error (RMSE) and correlation coefficient during the heavy pollution and relatively cleaner periods. It was seen that the biases of PM2.5 were generally less than 40 µg m−3, with the correlation coefficient exceeding 0.8 during the clean period (Fig. 6a–c). Compared with the clean period, the bias and RMSE were generally larger during the polluted period (Fig. 6d–f). The PM2.5 concentrations over most areas of the domain were underestimated, with the maximum bias exceeding 160 µg m−3. Overall, the correlation coefficient was generally higher than 0.4 in northern China during the polluted period, particularly over Beijing, with the correlation coefficient reaching 0.8.

Figure 5Observed (colored dots) and WRF-Chem simulated (shadings) spatial distribution of PM2.5 concentrations (µg m−3) at 08:00 LT on (a) 6 December, (b) 7 December, (c) 8 December, (d) 9 December, (e) 10 December and (f) 11 December.
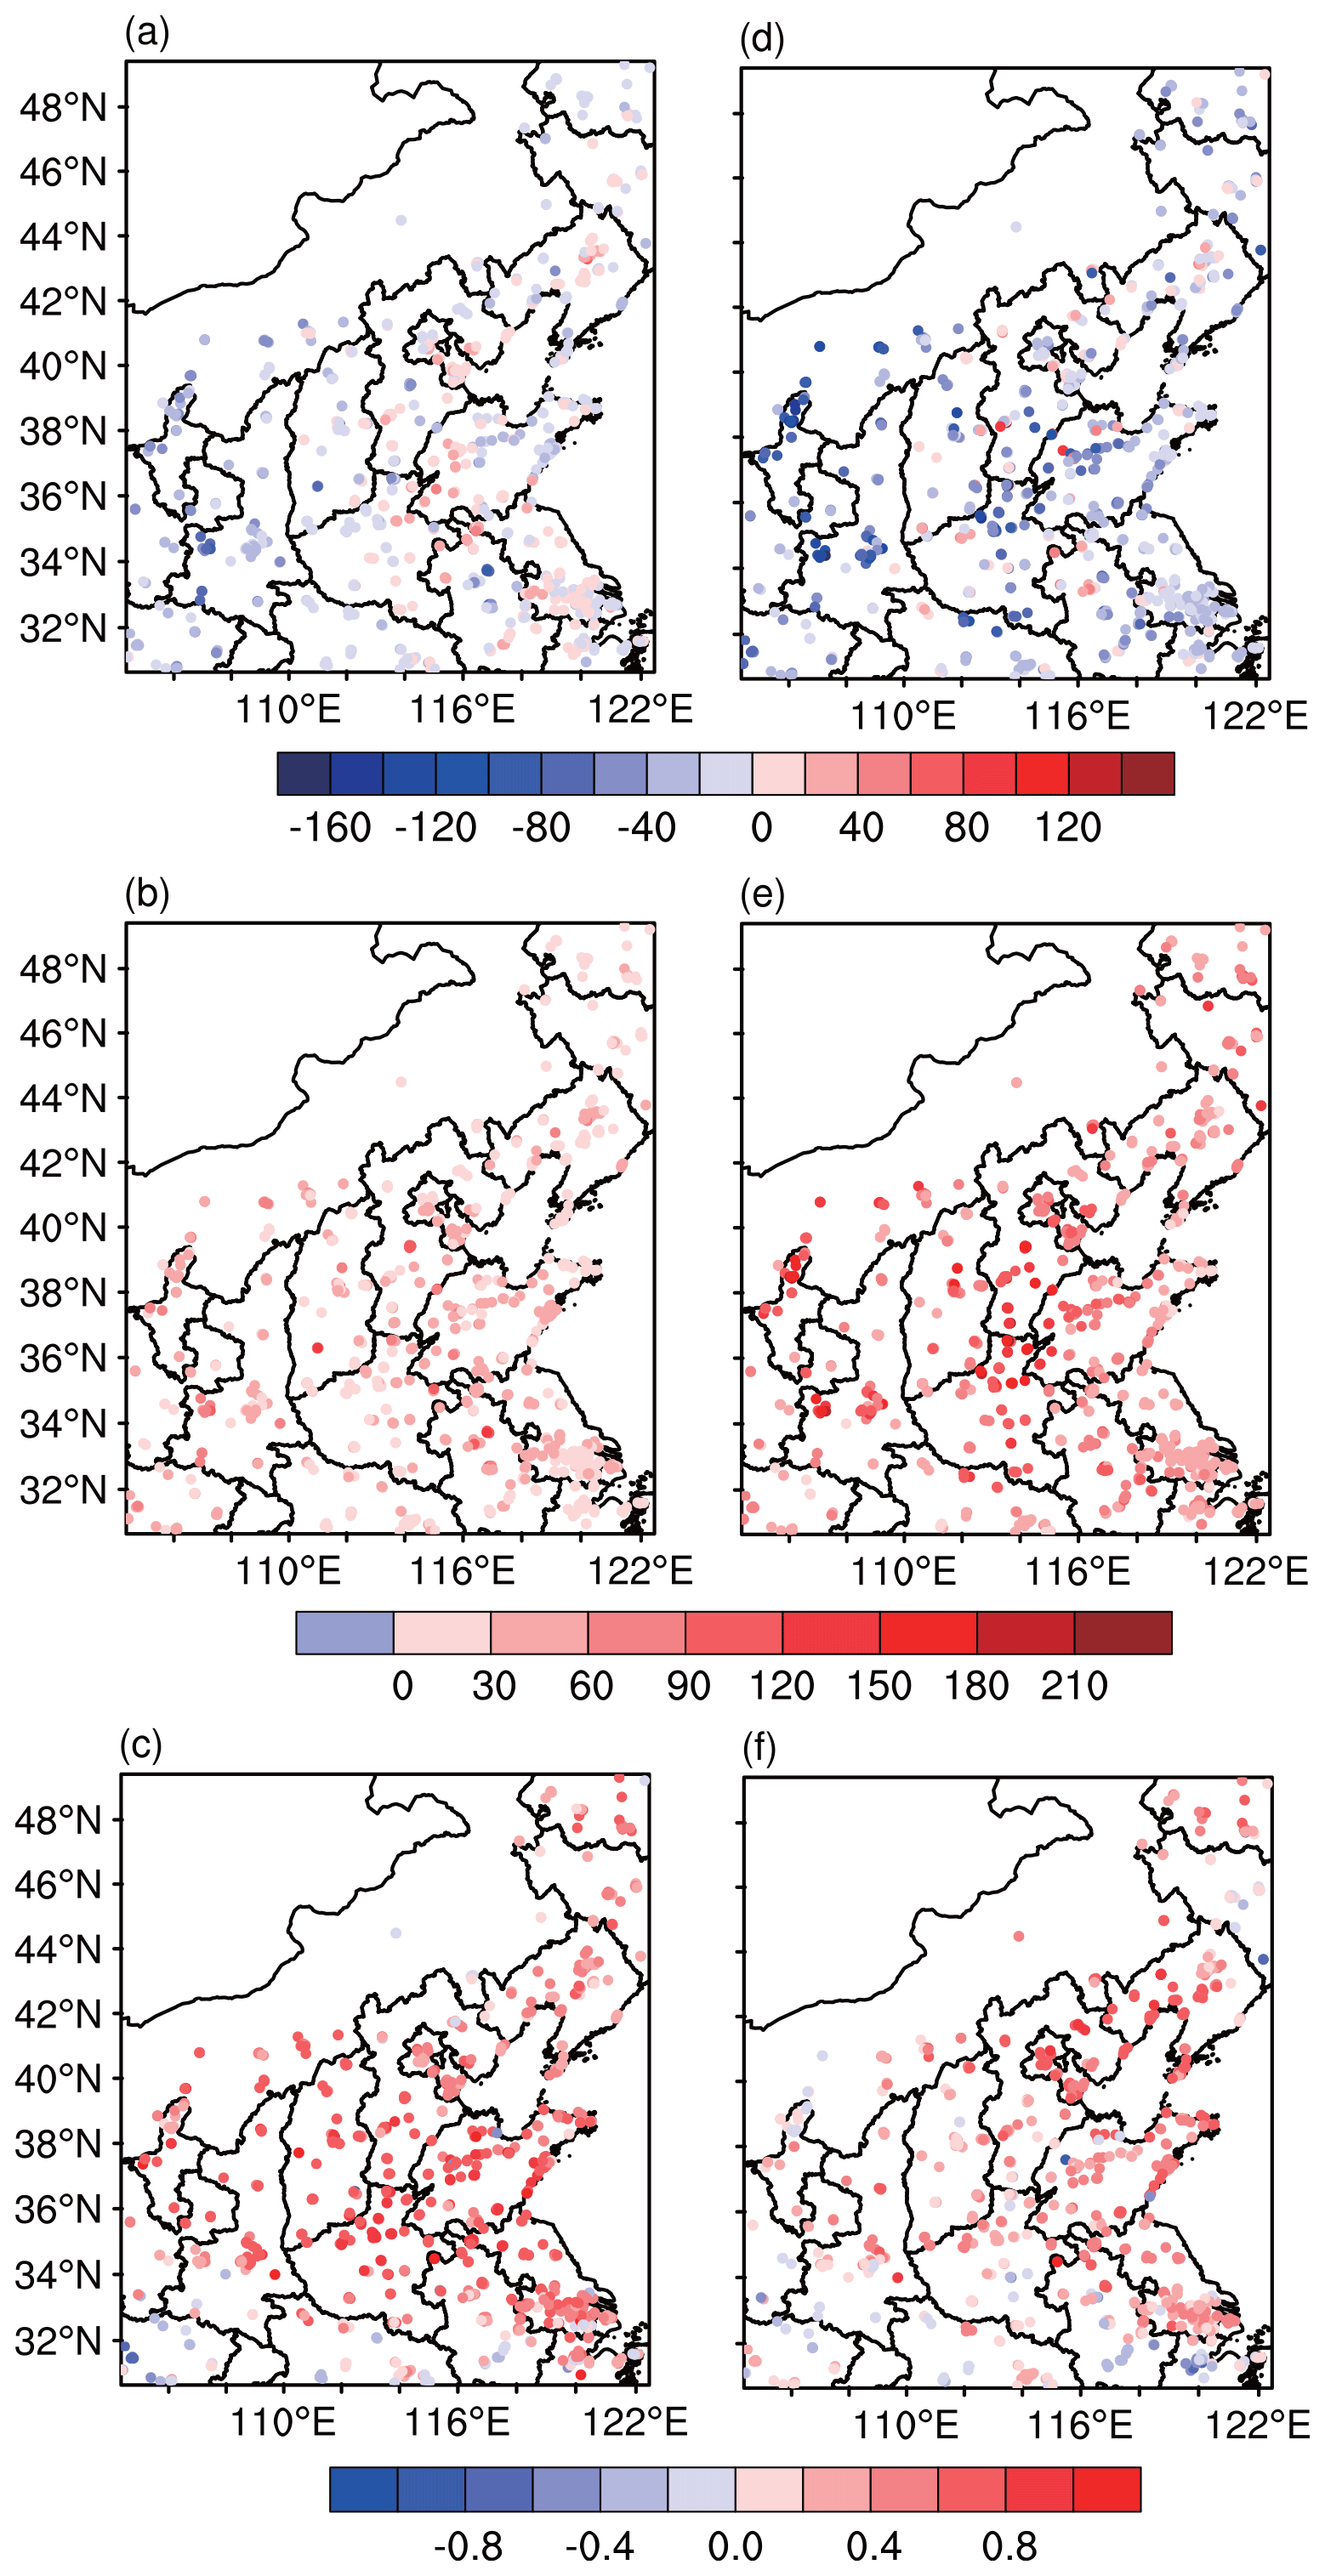
Figure 6The (a, d) bias (µg m−3), (b, e) RMSE (µg m−3) and (c, f) correlation coefficient (1) averaged (a–c) during the clean period (3 to 5 December) and (d–f) the polluted period (6 to 10 December).
To further assess the temporal evolutions of the pollution, the simulated PM2.5 concentrations at three major cities (Beijing, Shijiazhuang and Tianjin, shown as black dots in Fig. 1a) and two provinces (Hebei and Henan) in northern China were compared with observations as shown in Fig. 7. It showed that the hourly variations of PM2.5 concentration, including the occurrence of several high peaks at the three cities, as well as the gradual accumulation of pollution in Hebei and Henan could be reasonably reproduced by WRF-Chem. The correlation coefficients (R) between simulation and observation in Beijing, Shijiazhuang, Tianjin, Hebei and Henan were 0.85, 0.89, 0.76, 0.92 and 0.77 respectively. It should be noted that there is a slight overestimation (underestimation) of the peak magnitude during 9 to 10 December in Beijing and Shijiazhuang (Tianjin, Hebei and Henan); the overestimation in Beijing and Shijiazhuang is possibly associated with the frequent emission changes caused by emission-control measures in reality which are not dynamically updated in the model; the underestimation is more related with the deficiency of model skills, such as missing heterogeneous reaction paths in the chemistry scheme.
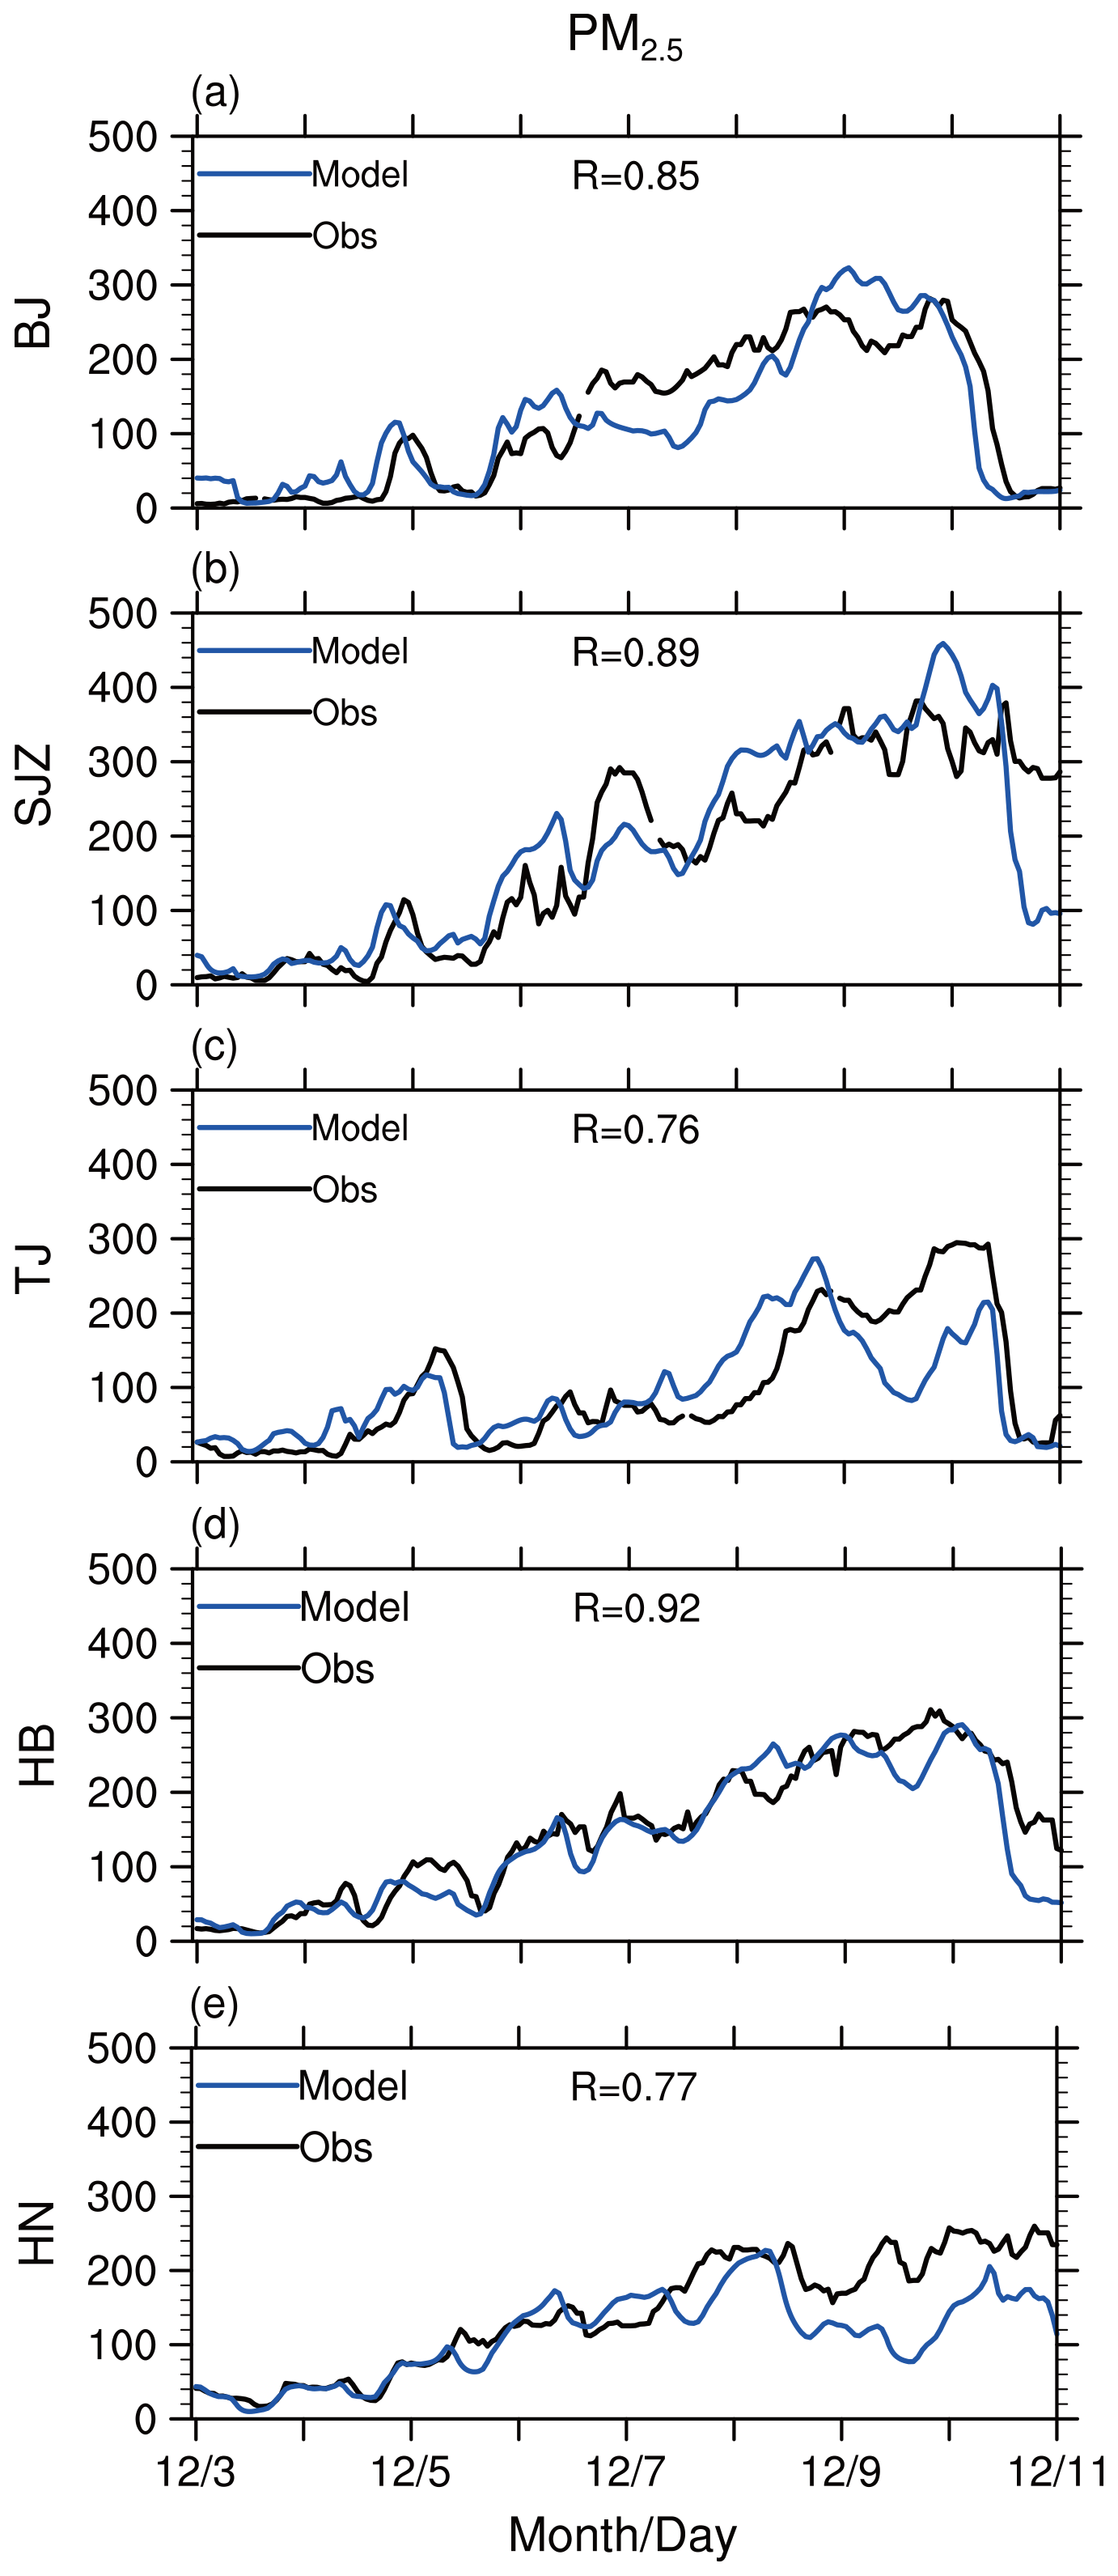
Figure 7Observed (black) and WRF-Chem simulated (blue) temporal variation of PM2.5 (µg m−3) at three major cities, (a) Beijing (BJ), (b) Shijiazhuang (SJZ) and (c) Tianjin (TJ), and two provinces, (d) Hebei (HB) and (e) Henan (HN).
3.2 Aerosol effects on meteorological simulations
In this section, the influences of aerosol–radiation interaction on the spatial and temporal variations of the radiation and energy budget simulated by the WRF model were analyzed, and their impacts on the forecasts of meteorological fields were discussed further.
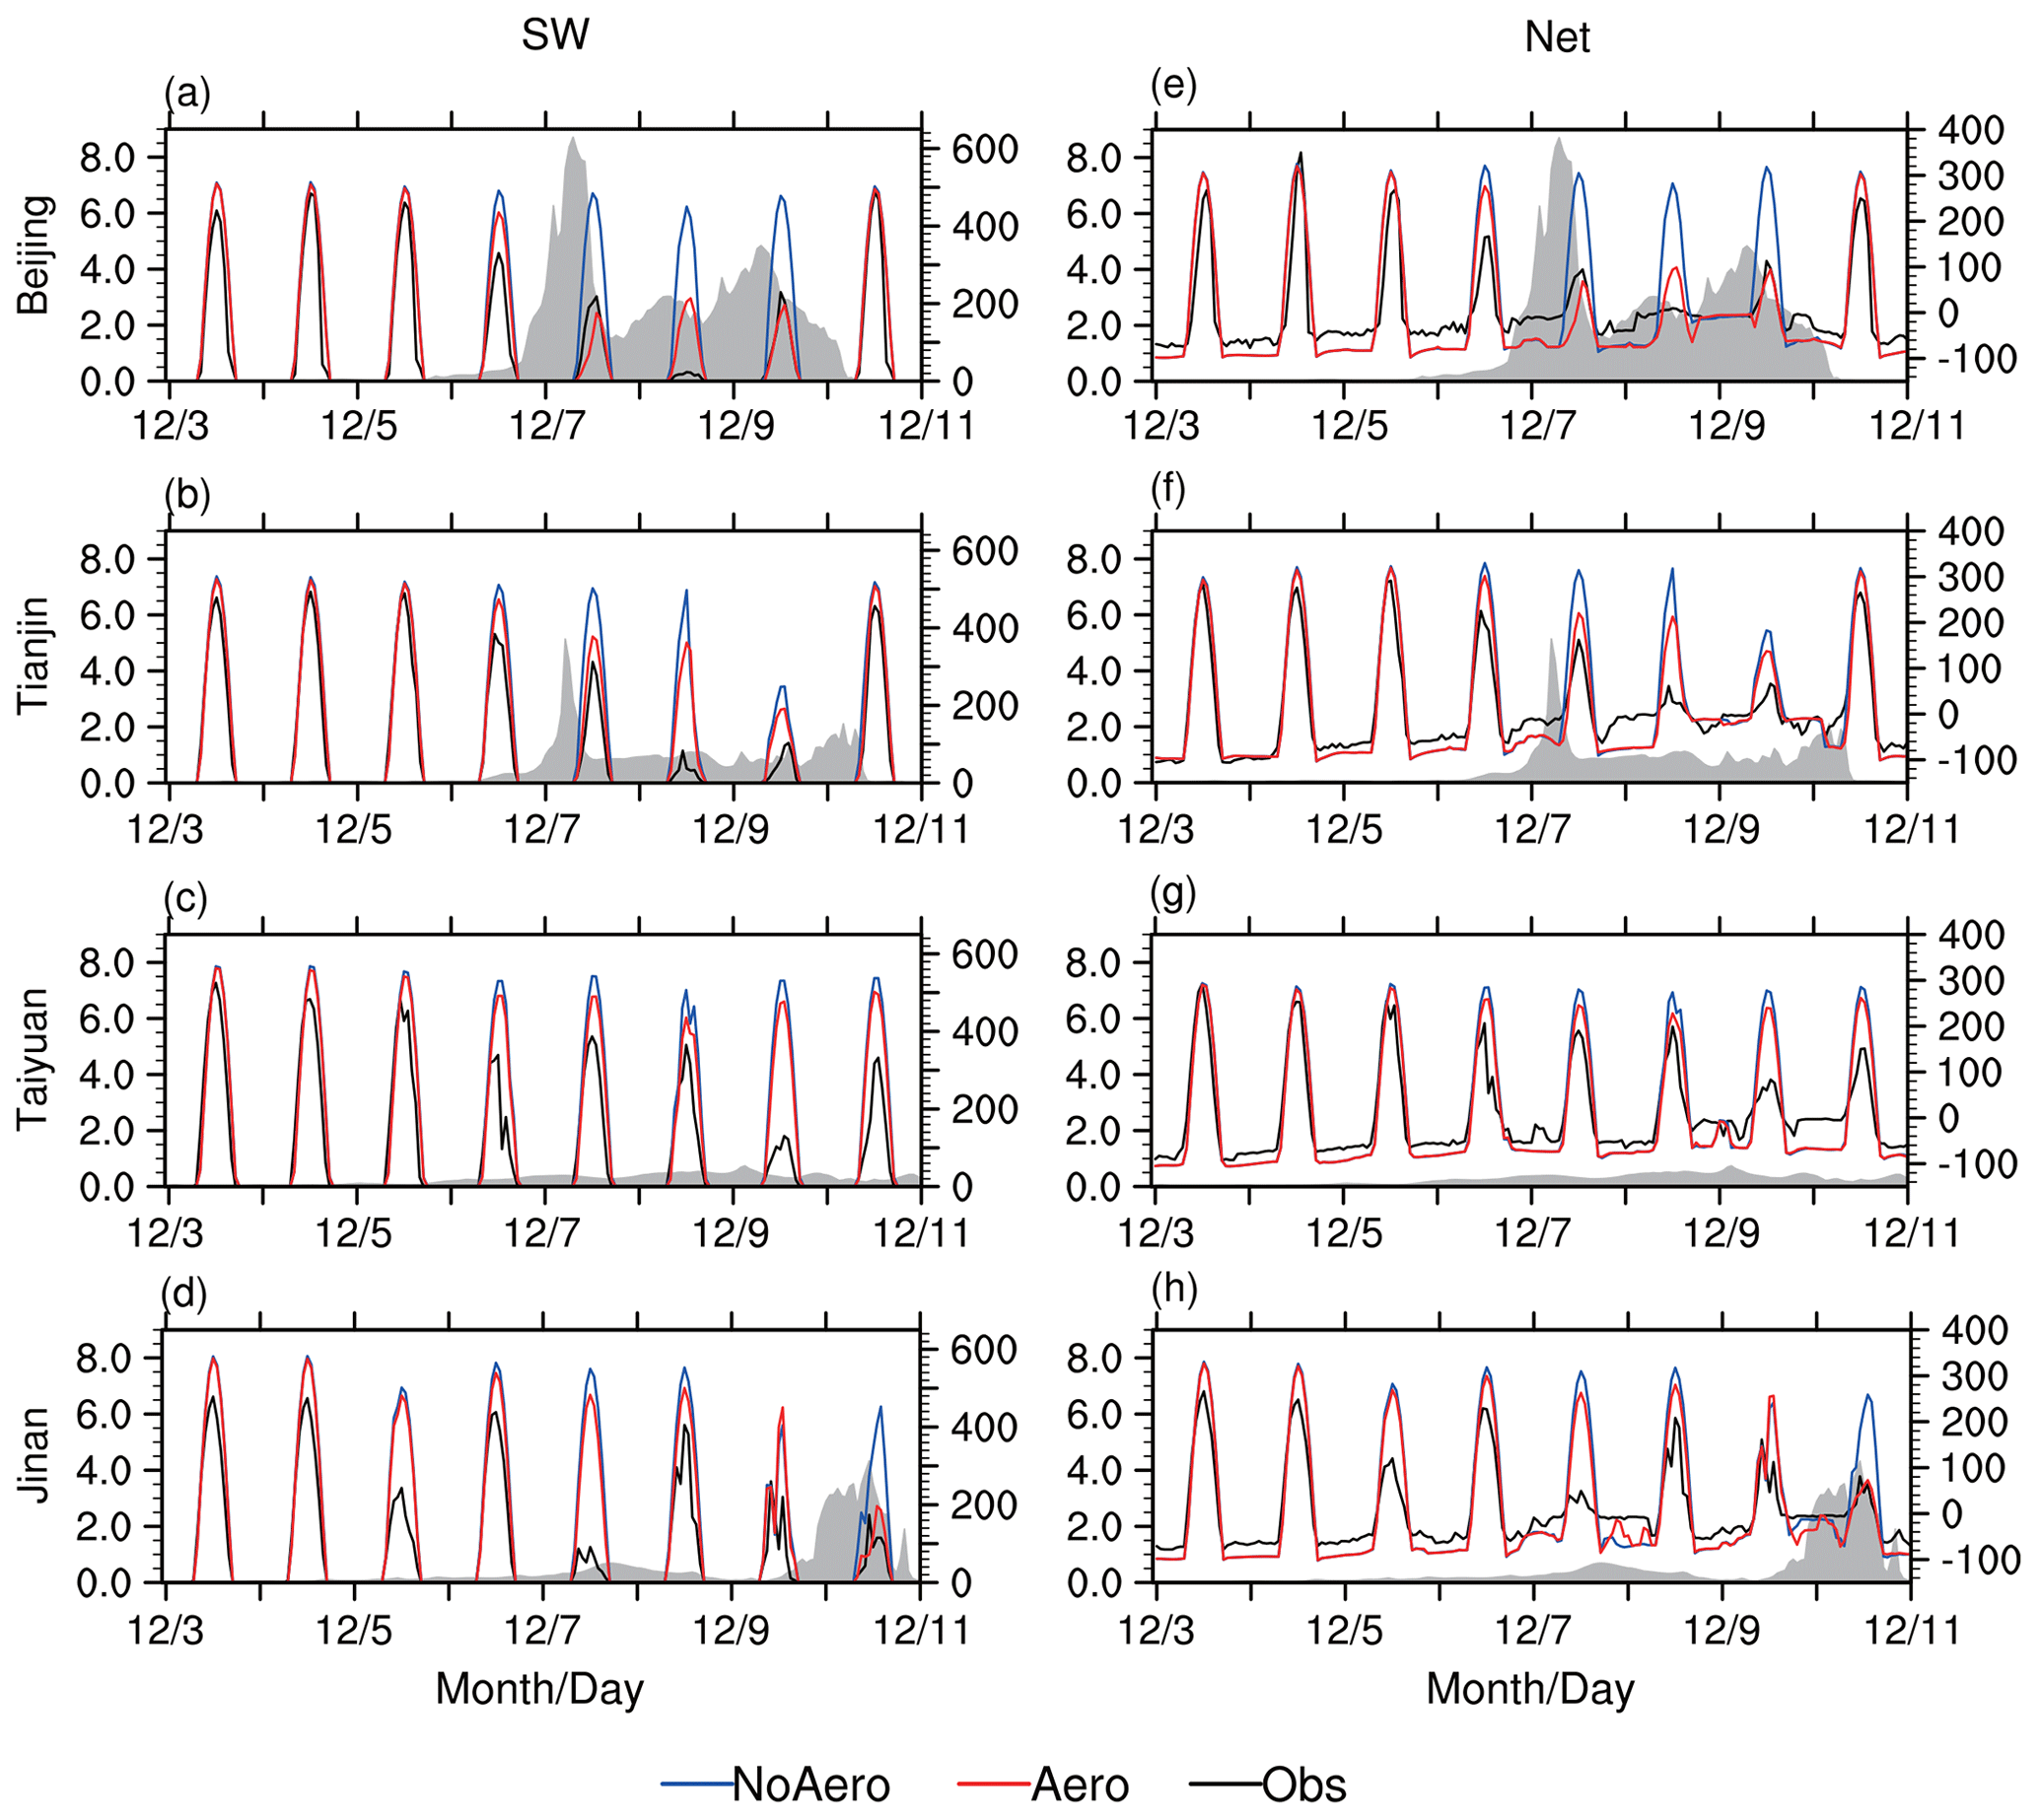
Figure 8(a–d) Observed (black) and WRF-simulated (NoAero: blue, Aero: red) temporal variation of downward shortwave radiation at the surface (W m−2, right axis) in (a) Beijing, (b) Tianjin, (c) Taiyuan and (d) Jinan. The gray areas indicate the simulated AOD (left axis) by WRF-Chem. Panels (e–h) are the same as (a–d), but for net radiation at the surface (W m−2).
3.2.1 Aerosol impacts on simulations of radiative forcing and heat fluxes
To illustrate the impacts of aerosol–radiation interaction on the forecasts of radiation during the pollution event, the simulated surface downward SW radiation and net radiation in Beijing, Tianjin, Taiyuan and Jinan, as denoted by the triangles in Fig. 1a, were compared with observations in Fig. 8. To show the relationship with aerosol, the time series of AOD for 3–11 December were overlaid as gray shadings in Fig. 8. During the clean stage with quite low AOD values (close to 0) before 6 December, both simulations (with and without aerosols) reproduced the temporal variation of downward SW in Beijing reasonably well despite the slight overestimation around noon (Fig. 8a). However, the overestimated downward SW in NoAero turned out to intensify extensively from 6 December onwards and was sustained until 10 December, accompanied by the occurrence of pollution with high AOD values. Meanwhile, the downward SW was much lower in Aero than that in NoAero due to aerosol extinction, with similar temporal variations and comparable magnitude at the peak time compared to the observations. Similarly, the variations of downward SW from the Aero simulation were also closer to observations at Tianjin, Taiyuan and Jinan than those in NoAero (Fig. 8b–d). It was noted that the most significant improvement of simulated downward SW at Jinan appeared on 10 December and was later than that in Beijing, which was consistent with the AOD's variations at Jinan. Moreover, the surface energy balance was also affected by the reduction of downward SW radiation reaching the ground due to the presence of aerosol particles. As shown in Fig. 8e–h, corresponding to the changes in downward SW, the variations of net radiation at the surface in Aero were also in better agreement with observations during the polluted period than in NoAero, particularly during the daytime, with high AOD values.
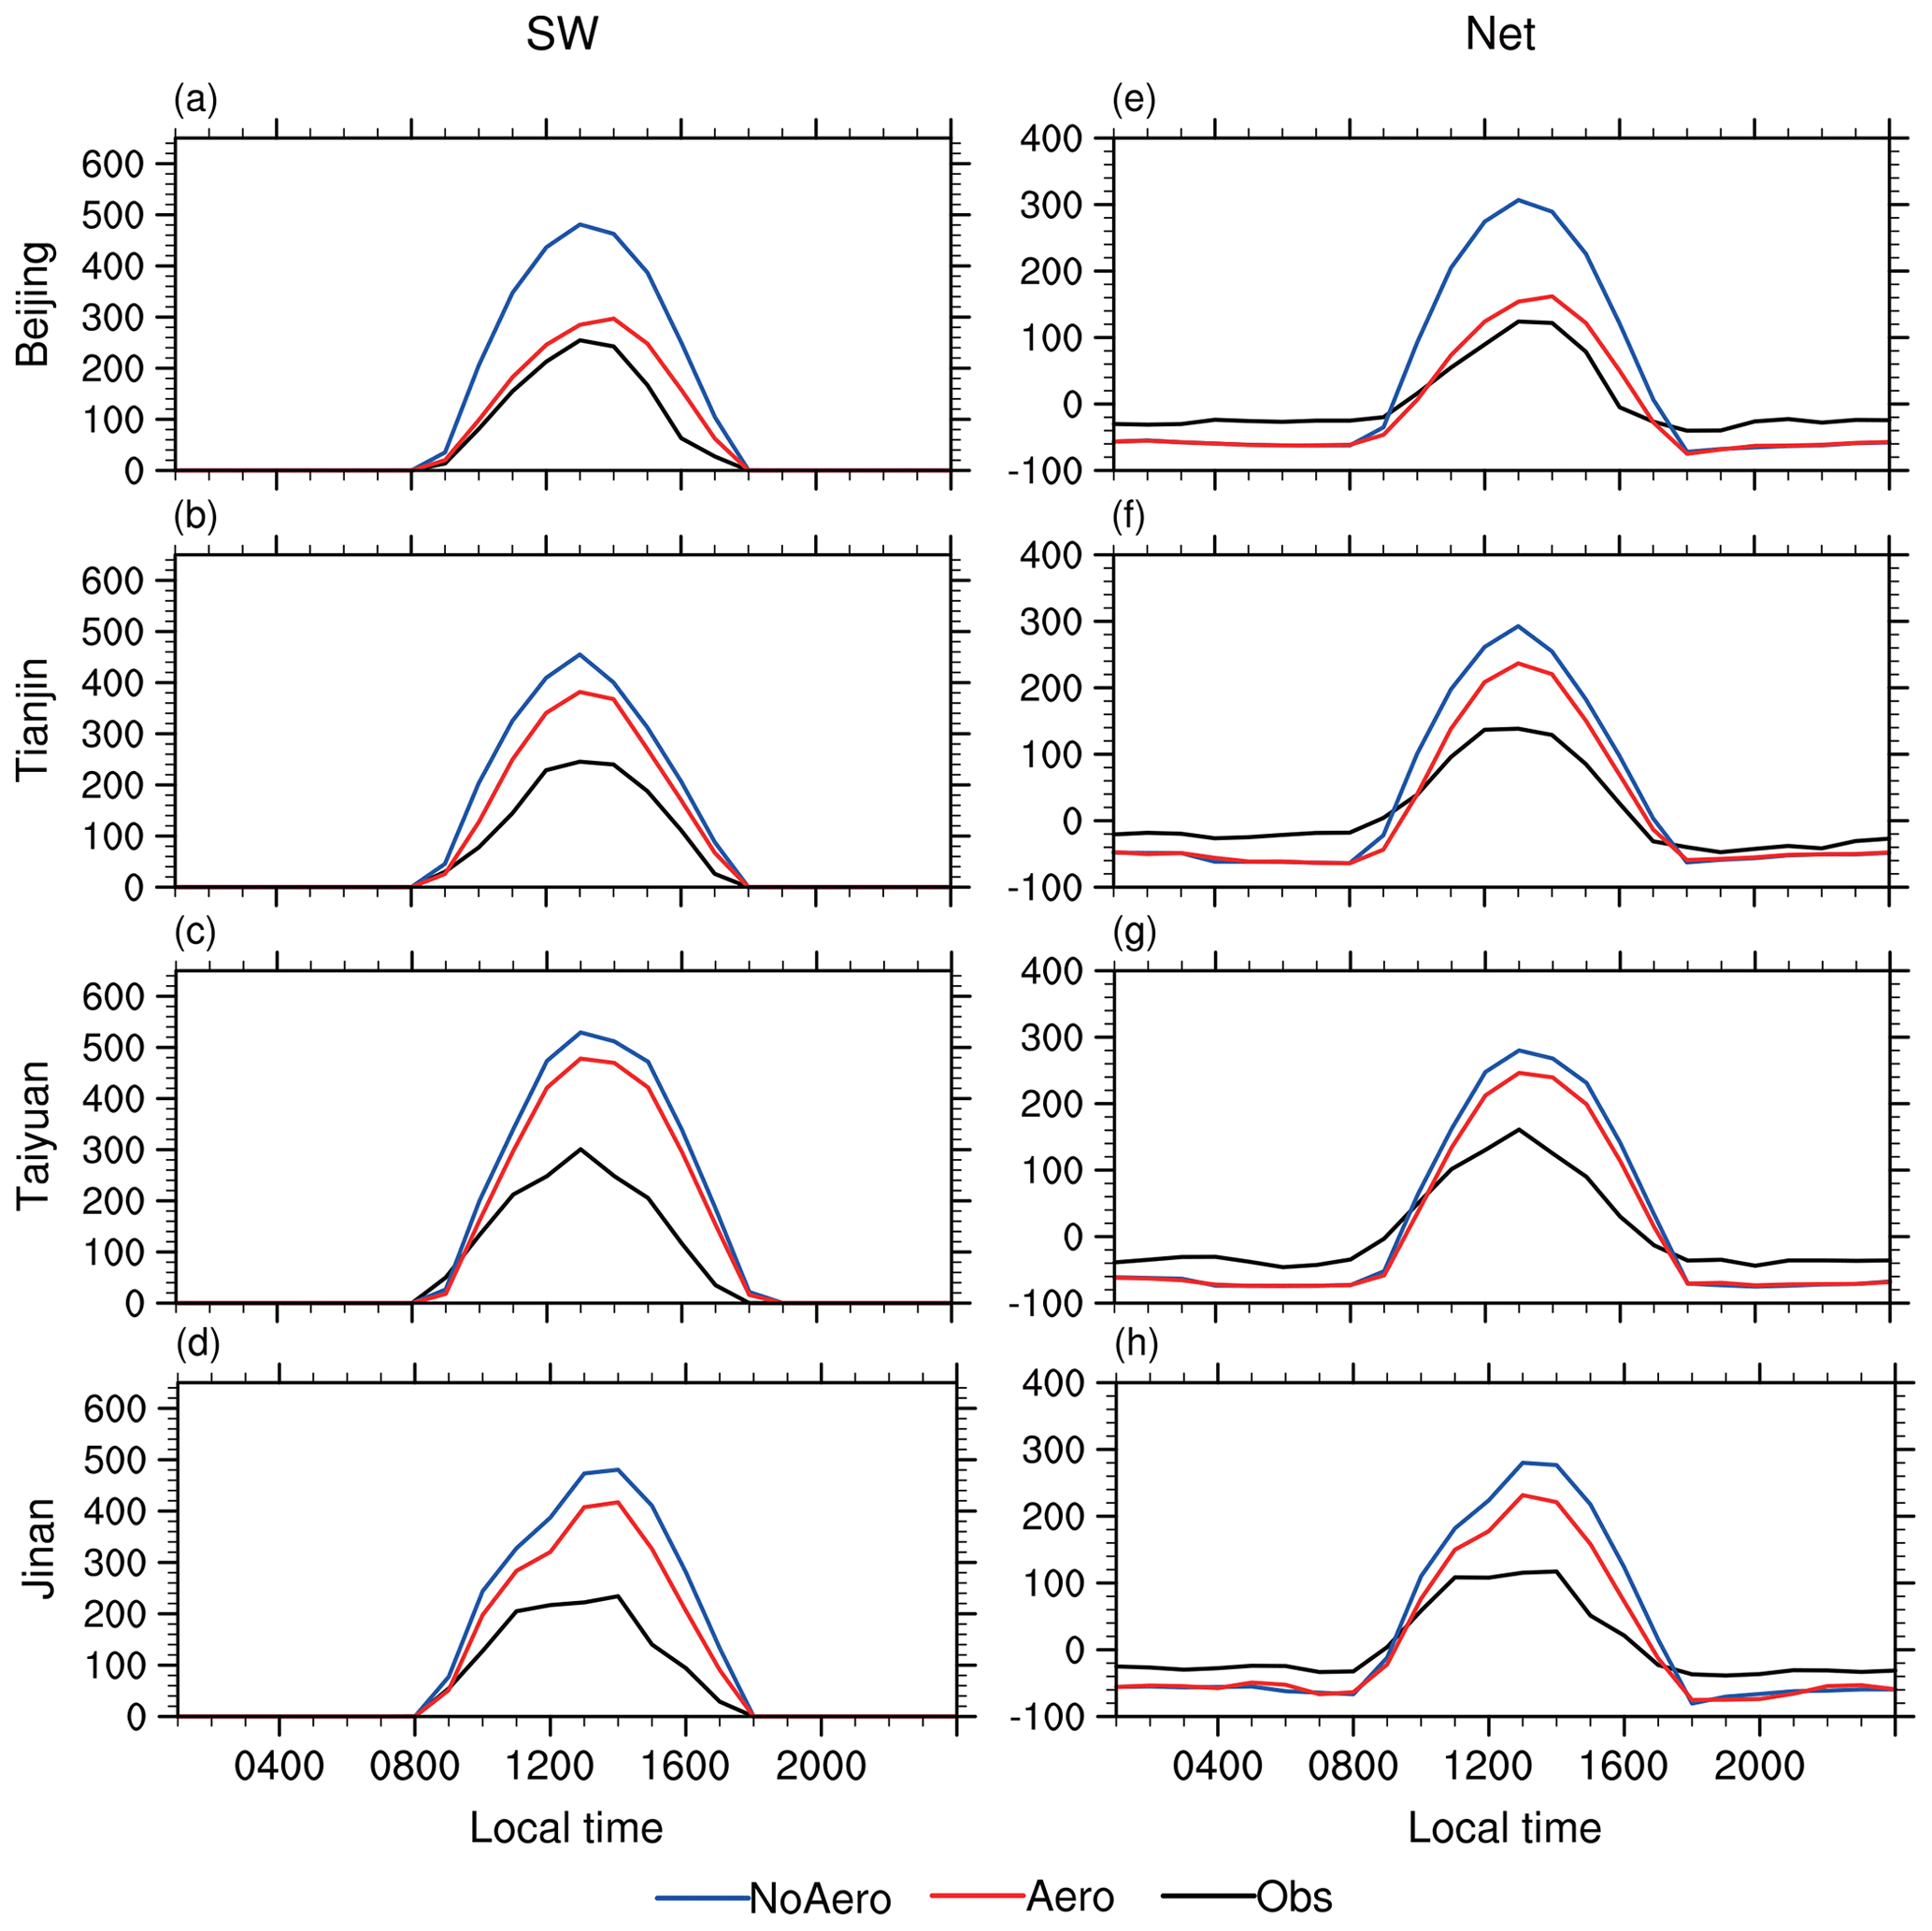
Figure 9(a–d) Observed (black) and simulated (NoAero: blue, Aero: red) diurnal cycles of downward shortwave radiation at the surface (W m−2) averaged from 6 to 10 December 2015 at (a) Beijing, (b) Tianjin, (c) Taiyuan and (d) Jinan, respectively. Panels (e–h) are the same as (a–d), but for net radiation at the surface (W m−2).
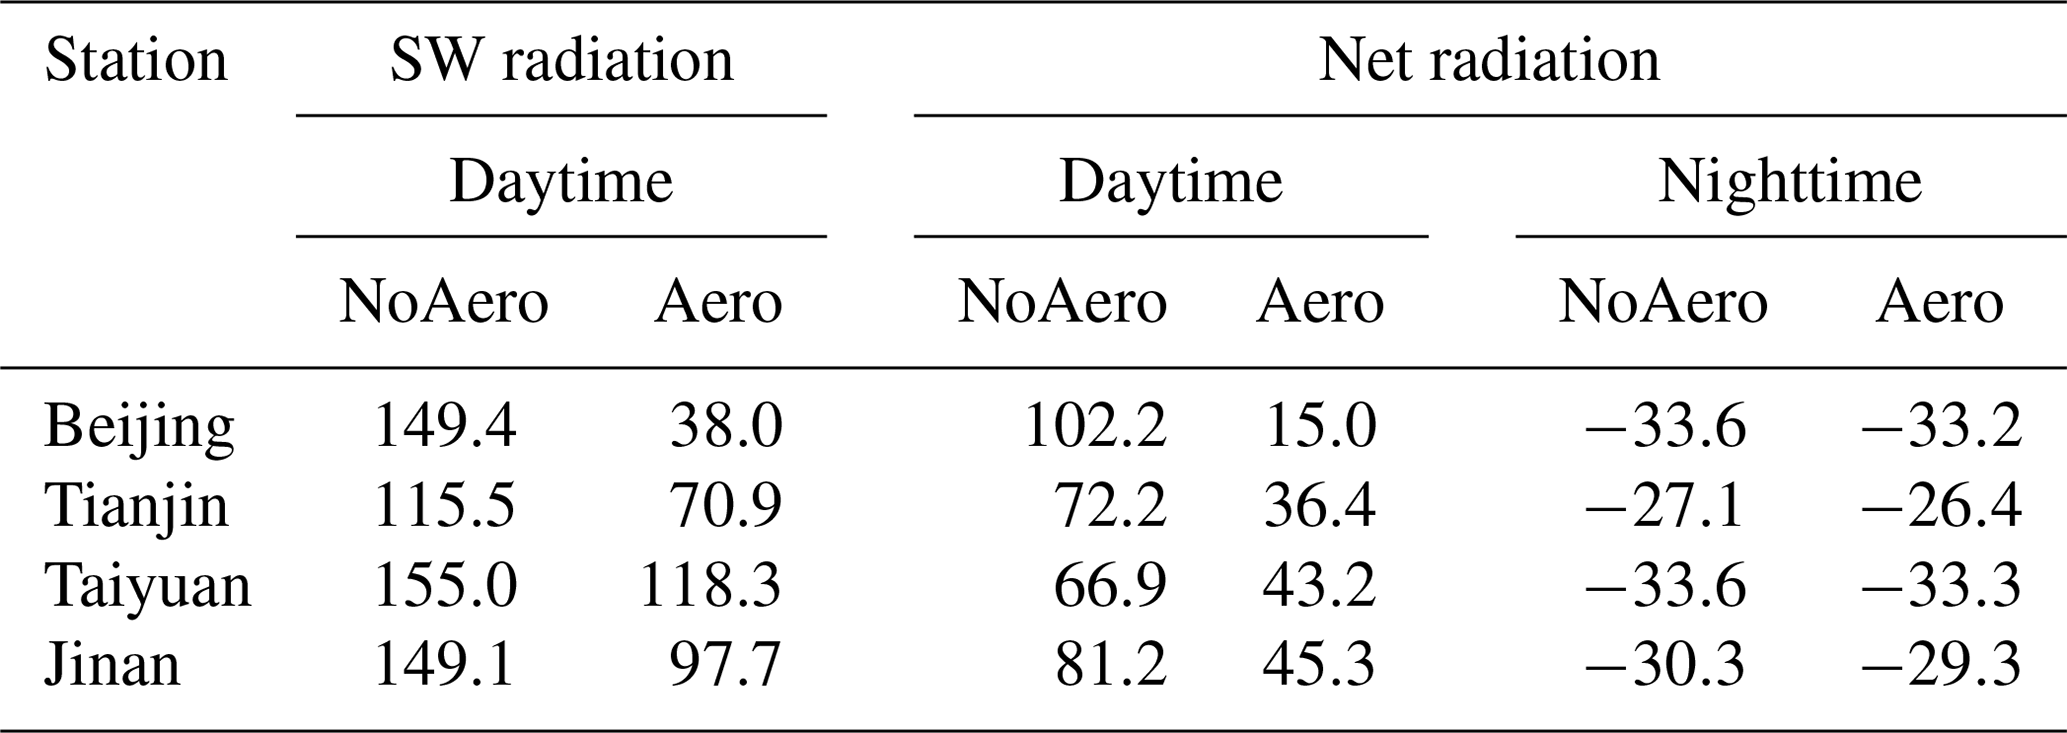
To further quantify the influence of the aerosol–radiation interaction on the diurnal variation of surface radiation, next we compared the simulated averaged diurnal variation of downward SW and net radiation during the polluted episode (6 to 10 December) with observation. Figure 9a shows that there existed a large overestimation of surface downward SW during the daytime in NoAero. Particularly, the overestimated downward SW tended to increase from the morning onwards (from 08:00 LT) and peak around noon (13:00 LT) with the maximum bias reaching 226.5 W m−2, and the mean bias of ∼149.4 W m−2 during the daytime (averaged during 08:00 to 18:00 LT, Table 2). However, the overestimated SW radiation was remarkably reduced in Aero with the mean bias of 38.0 W m−2 during the daytime. Similarly, the diurnal variation and magnitude of downward SW radiation at the surface were also better captured at Tianjin, Taiyuan and Jinan in Aero (Fig. 9b–d), with a lower bias (70.9, 118.3 and 97.7 W m−2) than in NoAero (115.5, 155.0 and 149.1 W m−2) during the daytime. Note the biases of SW radiation in Tianjin, Taiyuan and Jinan were not improved as much as in Beijing due to the lower AOD. Consistent with this finding, the reduction of downward SW was also reported in the United States (Zhang et al., 2010) and Europe (Toll et al., 2016), with a relatively lower decrease (10 and 18 W m−2); the relatively larger reductions (30–110 W m−2) in northern China are possibly due to the higher aerosol load. Figure 9e–h present the diurnal variations of net radiation, with positive (negative) net radiation during the daytime (nighttime) in observation, and the NoAero tended to overestimate (underestimate) the net radiation at the surface during the daytime (nighttime), indicating that there existed surplus energy income and outcome in the model that is greater than those in observation, inducing the larger magnitude of the diurnal cycle of net radiation. By including the aerosol–radiation interaction in the model, the simulated diurnal variations of net radiation were markedly improved, particularly during the daytime, with a reduction of bias by 85.3 %, 50.0 %, 35.4 % and 44.1 % in Beijing, Tianjin, Taiyuan and Jinan, respectively.
Table 2Mean bias of downward SW radiation at the surface (W m−2) and net radiation at the surface (W m−2) from NoAero and Aero relative to observation during the daytime (averaged 08:00 to 18:00 LT) and nighttime (averaged 19:00 to 07:00 LT), averaged from 6 to 11 December 2015 in Beijing, Tianjin, Taiyuan and Jinan respectively.
In response to the decrease in downward SW radiation and net radiation at the ground level during the daytime, the surface fluxes also changed in the presence of aerosol extinction within the energy-balanced system. Figure 10 displays the difference of surface sensible and latent heat flux between Aero and NoAero at 13:00 LT, when the influences of the aerosol on radiation reach their peak. Compared to the NoAero simulation, both the surface sensible and latent heat flux emitted by the surface were reduced in the Aero simulation, with domain averages of 16.1 W m−2 (18.5 %) and 6.8 W m−2 (13.4 %) respectively. It was noted that the decrease in the surface latent heat flux was less pronounced than that of surface sensible heat flux, suggesting the impact of aerosol–radiation interaction on the humidity was less significant than that of temperature, which was also reported over United States (Fan et al., 2008) and western Europe (Péré et al., 2011).
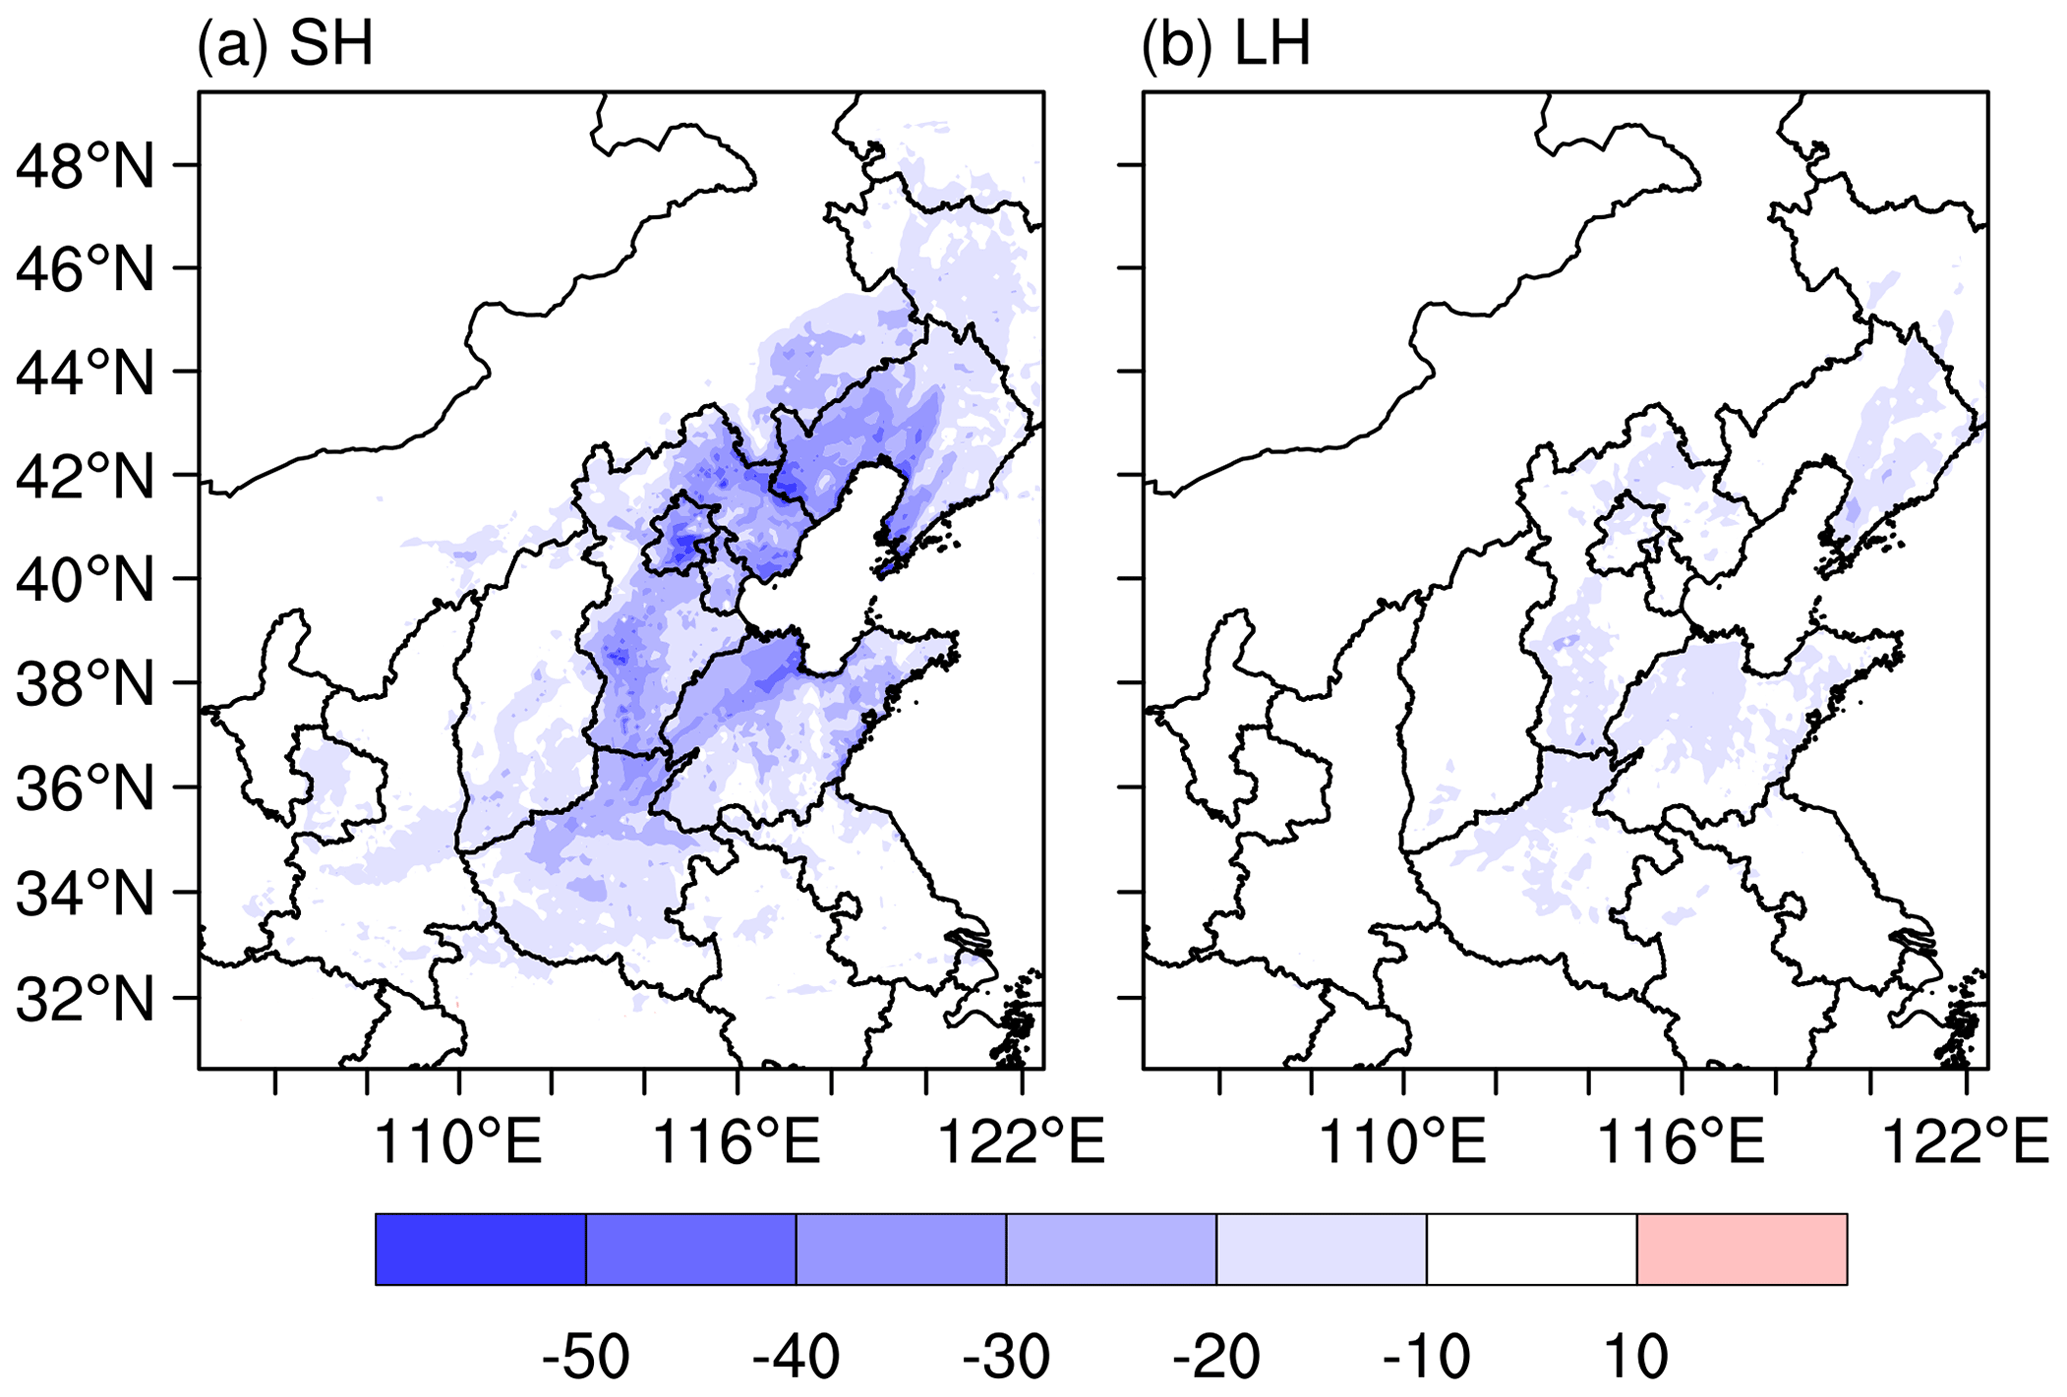
Figure 10The differences (Aero minus NoAero) of (a) surface sensible heat flux and (b) surface latent heat flux (W m−2, upward is positive) at 13:00 LT averaged from 6 to 10 December 2015.
3.2.2 Aerosol impacts on simulations of temperature, PBLH and wind fields
The changes in radiation and energy budget through the impacts of aerosol–radiation interaction would certainly induce changes in PBL thermodynamics and dynamics, which would result in changes in the forecasts of meteorological fields. The impacts on the forecasts of 2 m temperature, PBLH and wind fields due to the aerosol–radiation interaction are discussed in the following subsection.
Figure 11 presents the diurnal variation of averaged bias of 2 m temperature during polluted period in NoAero (panels a–e) and Aero (panels f–j) compared with the in situ observations during 11:00 to 23:00 LT. It is obvious that the temperature of NoAero was significantly overestimated for a wide range over northern China, particularly over the plain areas including south of Hebei, Henan and Shanxi provinces. The warm biases tended to intensify in the afternoon and reach ∼3 ∘C over the south part of Hebei province (Fig. 11b and c). Accompanied by the warm biases over plain areas throughout the day, the mountain areas were dominated by the cold biases until 17:00 LT and turned to warm biases afterwards, which were attributed to the frozen water in soil due to the wet bias of soil moisture over mountain areas, inducing overestimated energy transport from the atmosphere to soil during the daytime. Compared to NoAero, the lower temperature in Aero due to the decreased surface solar radiation, caused by aerosol extinction, led to the reduced warm bias in the NCP region. However, the cold bias in the Beijing area was slightly intensified, which may partly explain the overestimated PM2.5 concentration in Beijing and can be improved by incorporating more accurate aerosol information in the future. It was noted that the cold biases over mountain areas associated with the model physics deficiency cannot be corrected by aerosol–radiation effects; thus the correction of aerosol–radiation effects may get complex results and differ from other regions due to the pre-existing model deficiencies.
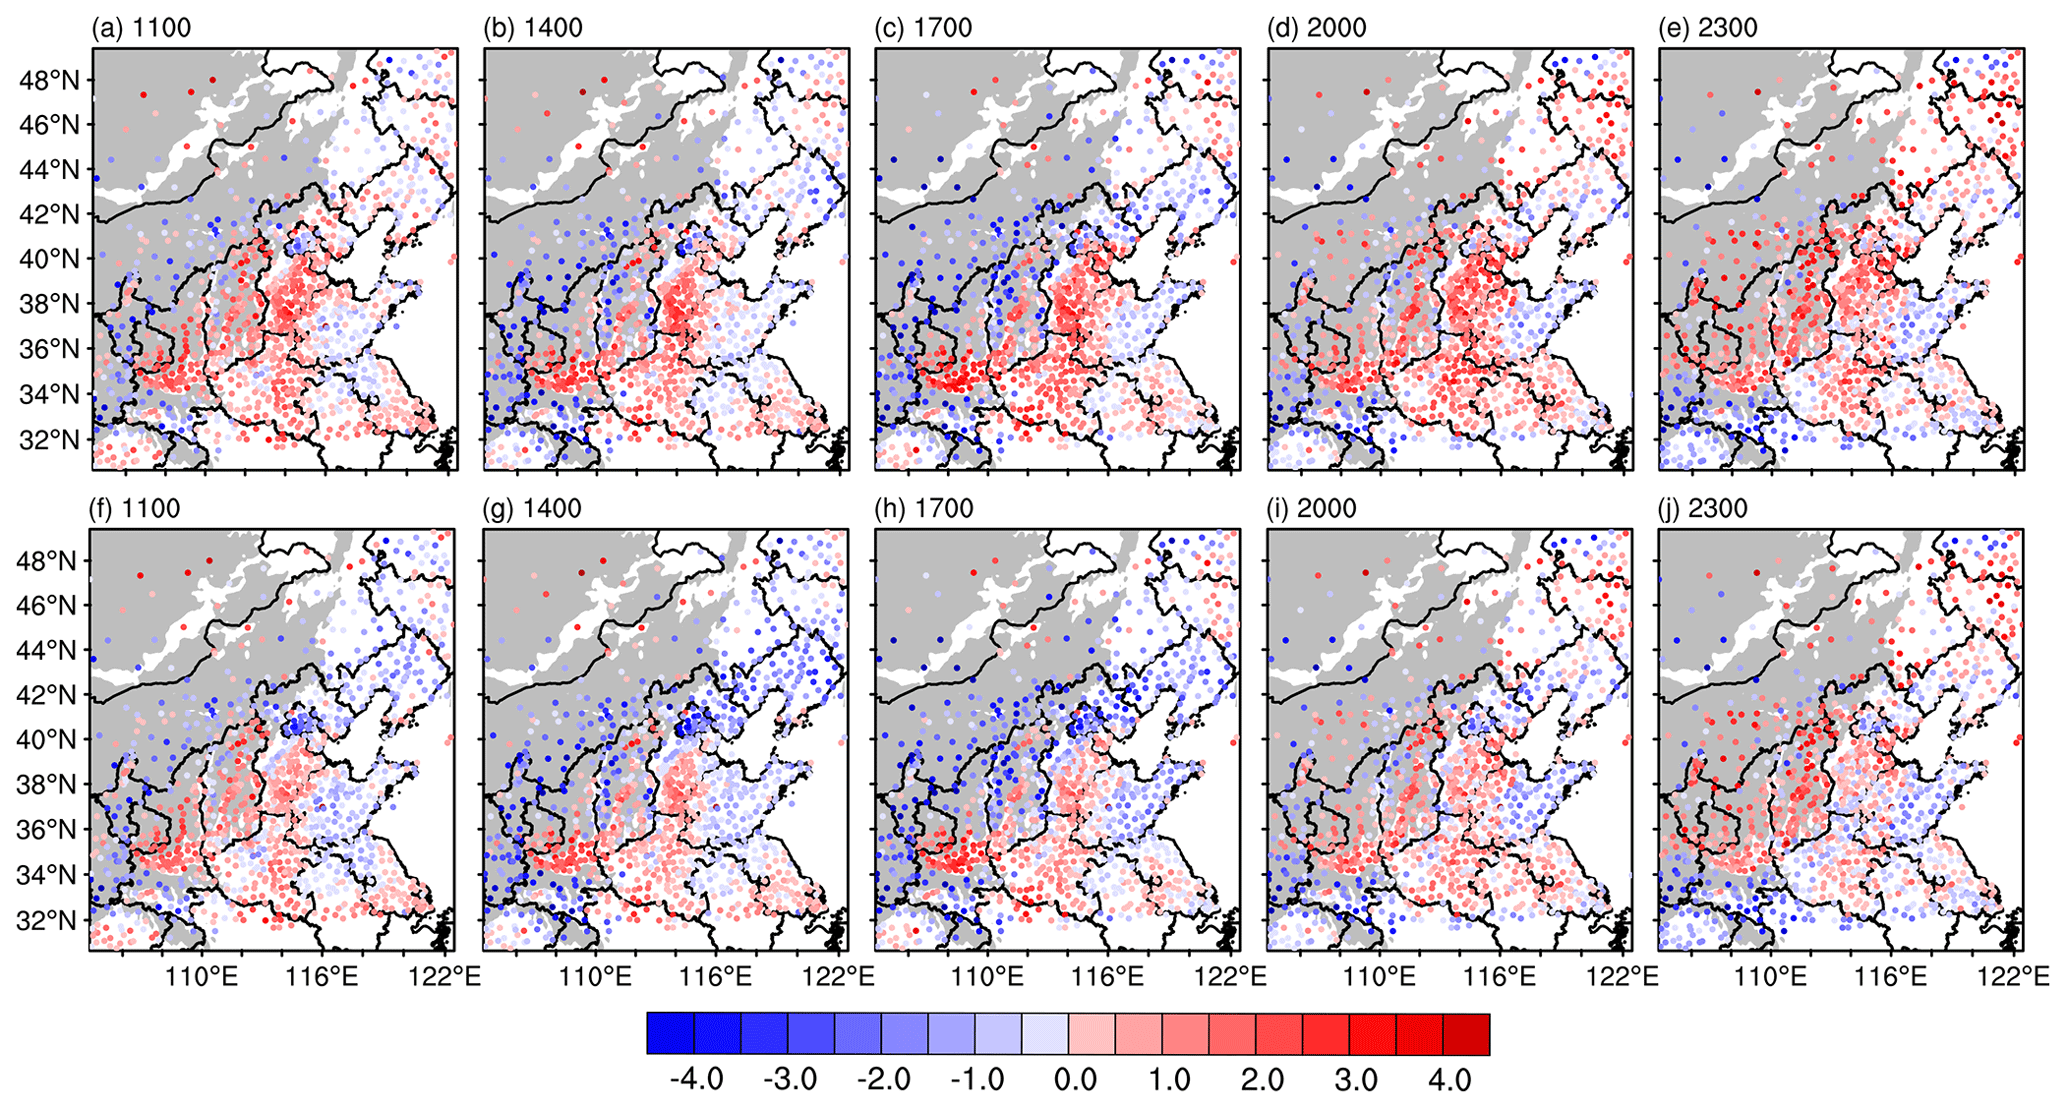
Figure 11The bias of 2 m temperature (∘C) at (a) 11:00 LT, (b) 14:00 LT, (c) 17:00 LT, (d) 20:00 LT and (e) 23:00 LT in NoAero averaged from 6 to 10 December 2015. Panels (f–j) are the same as (a–e), but for Aero. The gray areas denote the areas of terrain height above 1000 m.
To quantitatively evaluate the agreement of simulated 2 m temperature with observations, the mean bias and RMSE were employed, and their averaged diurnal variations during the polluted episode (6 to 10 December) averaged over the NCP, denoted by the purple box in Fig. 1a, are displayed in Fig. 12. As shown in Fig. 12a, the warm bias in NoAero was sustained during the entire 24 h forecast, ranging from 0.3 to 0.9 ∘C. Compared to NoAero, the NCP area-averaged warm bias was remarkably reduced by ∼0.40 ∘C (∼73.9 %) due to aerosol–radiation interaction, with the maximum reaching ∼0.54 ∘C (∼95.0 %) at 11:00 LT (Fig. 12a and c). Consistently with mean bias, the RMSE was also lower in Aero than NoAero, particularly during 11:00 to 20:00 LT during the daytime (Fig. 12b and d).
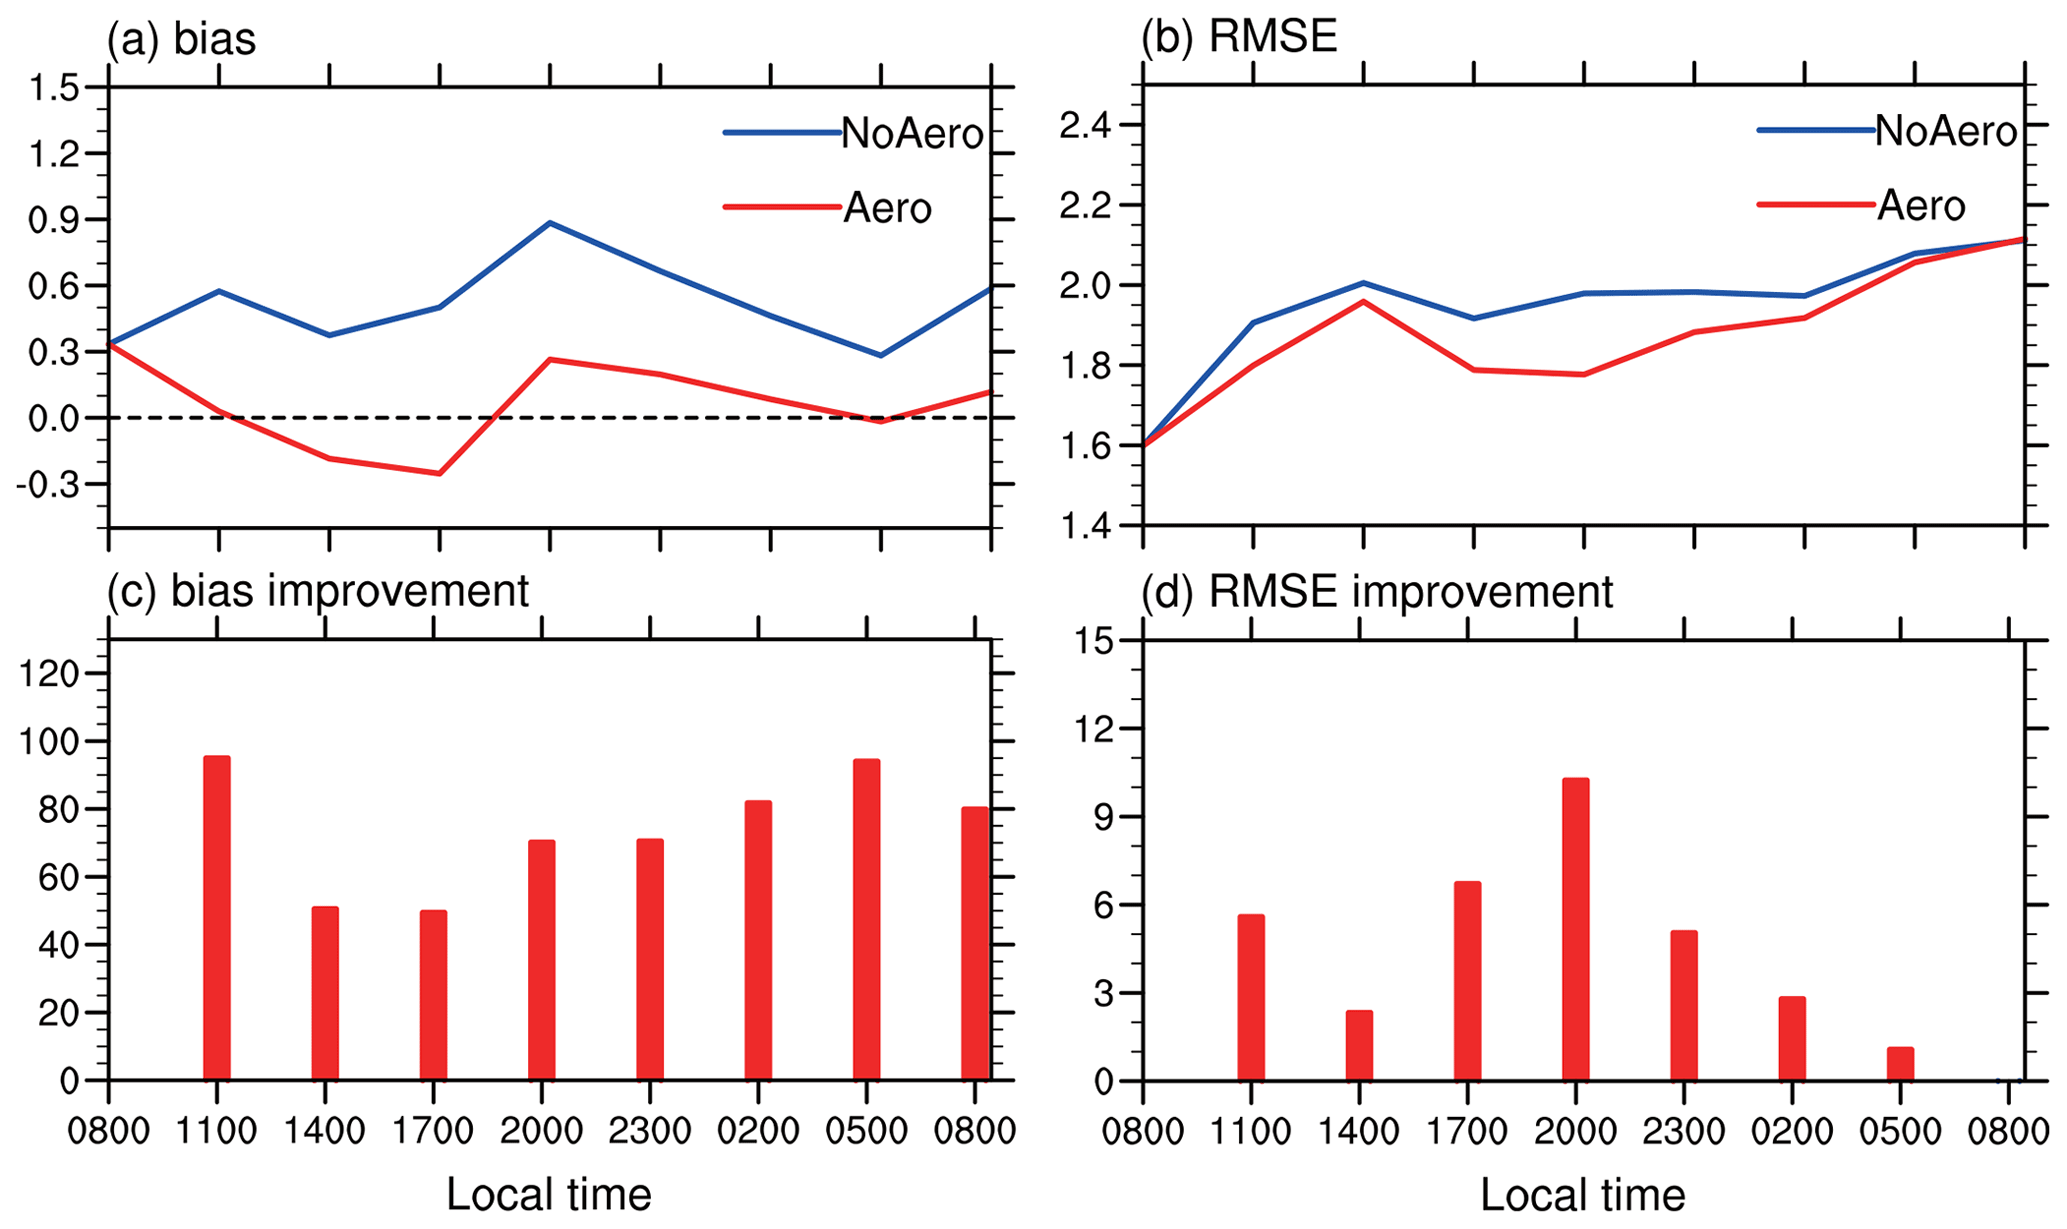
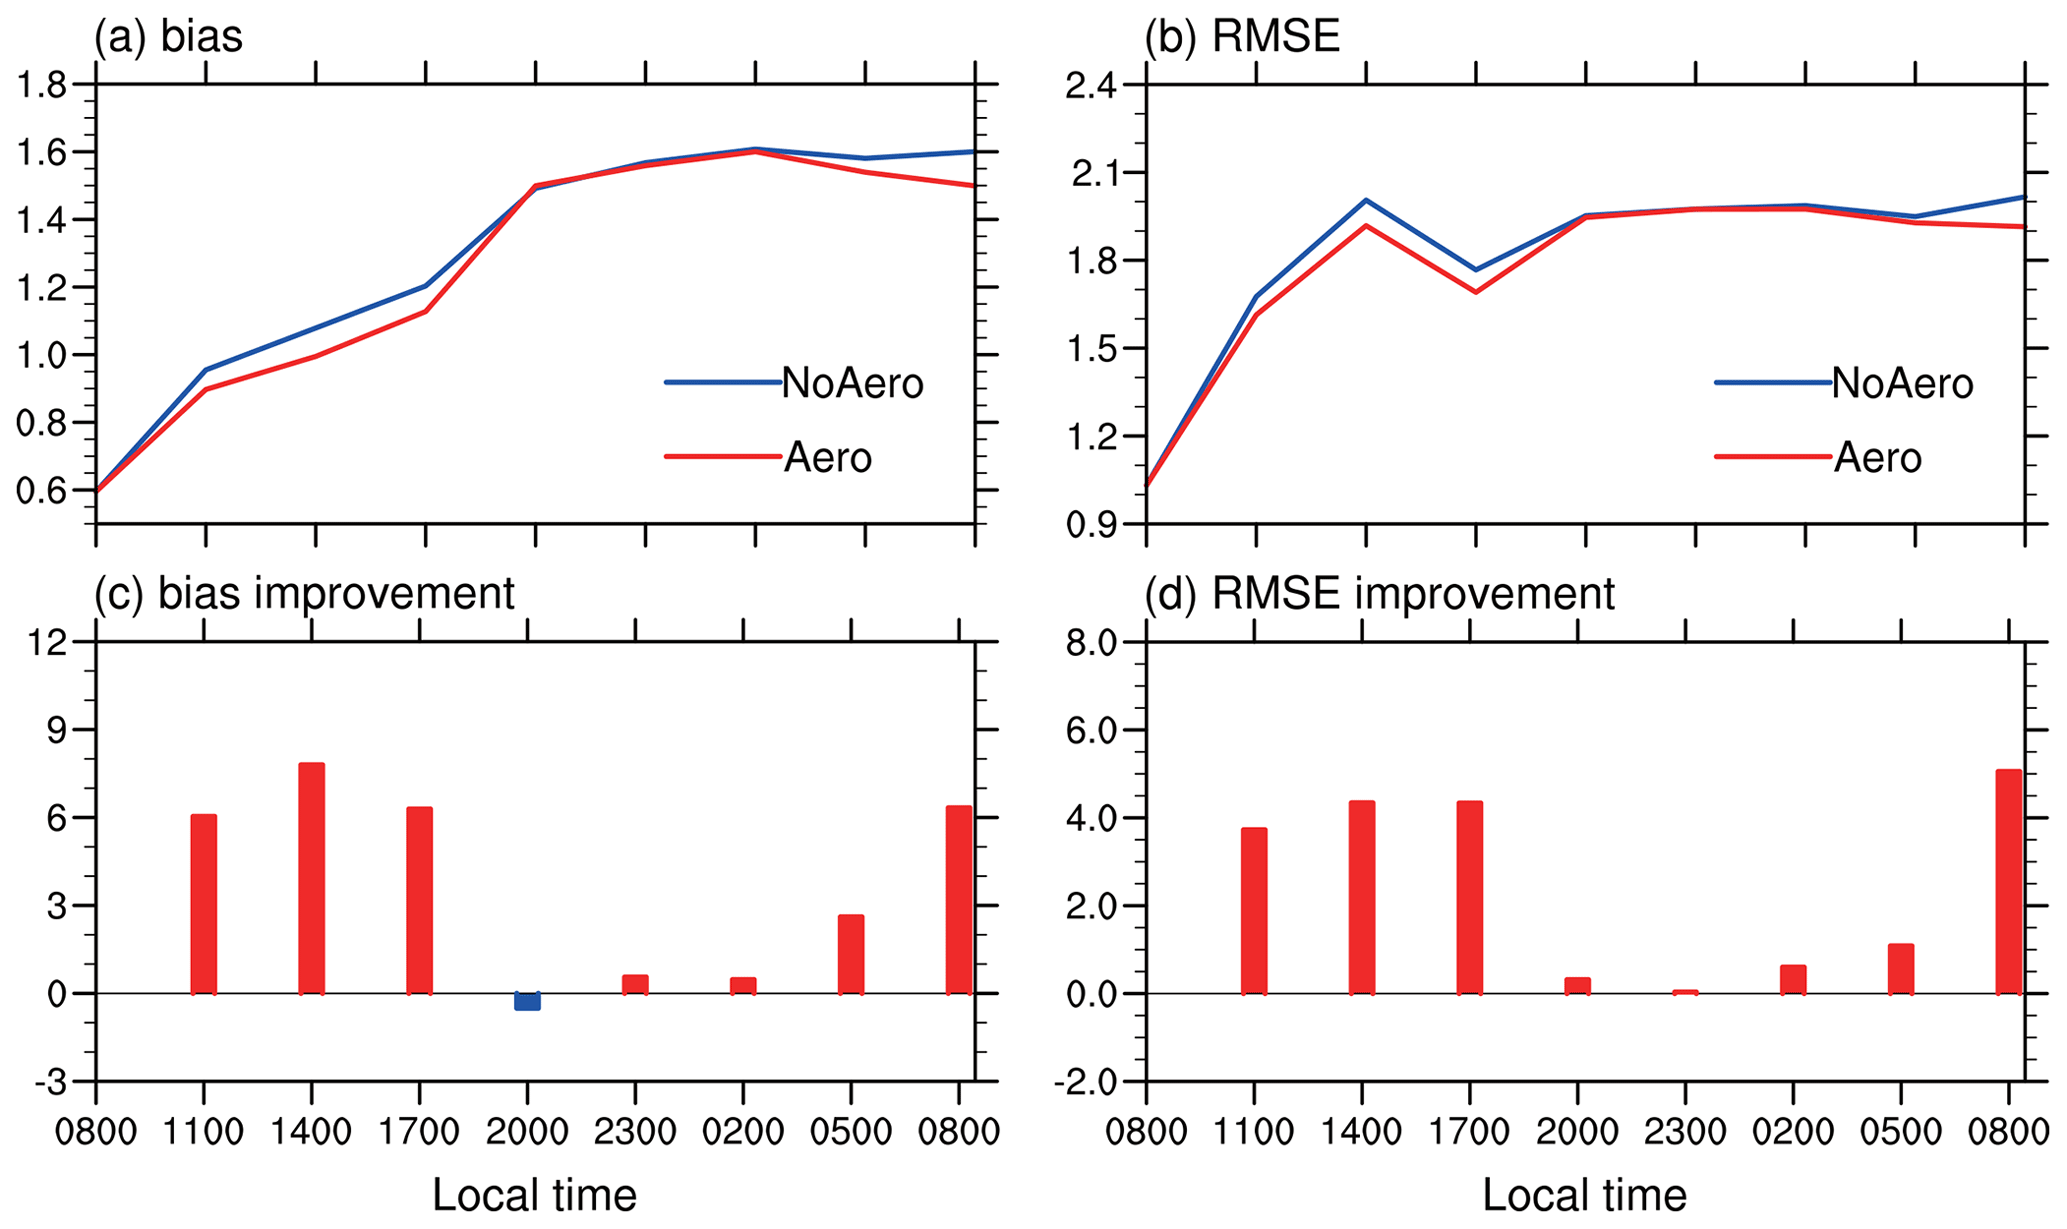
Figure 12Area-averaged (a) bias and (b) RMSE of simulated 2 m temperature (∘C) in NoAero (blue) and Aero (red) over NCP area (defined in Fig. 1a), averaged from 6 to 10 December 2015, and the mean improvement (%) of (c) the absolute value of bias and (d) RMSE in Aero relative to NoAero.
The aerosol–radiation interaction may also have profound impacts on atmospheric structure in addition to radiation and temperature (Rémy et al., 2015). PBLH is one of the key parameters to describe the structure of the PBL and is closely related to air pollution. It was indicated that the mean daytime PBLH over northern China was around 300–600 m (Fig. 13a) and declined by about 40–200 m (10 %–40 %) in Aero over the region with highest PM2.5 concentration, particularly over Beijing, Tianjin and Hebei (Fig. 13b and c). As shown in dashed lines in Fig. 14, the NCP area-averaged PBLH around noon (14:00 LT) was diminished dramatically by aerosol–radiation interaction during the pollution event over northern China, with the maximum decrease reaching −155.2 m on 7 December. The reduction of PBLH could be the consequence of a more stable atmosphere in Aero than NoAero, which was induced by the terrestrial cooling in the lower part of the planetary boundary layer and the solar heat due to the absorbing in the upper layers (solid lines in Fig. 14).
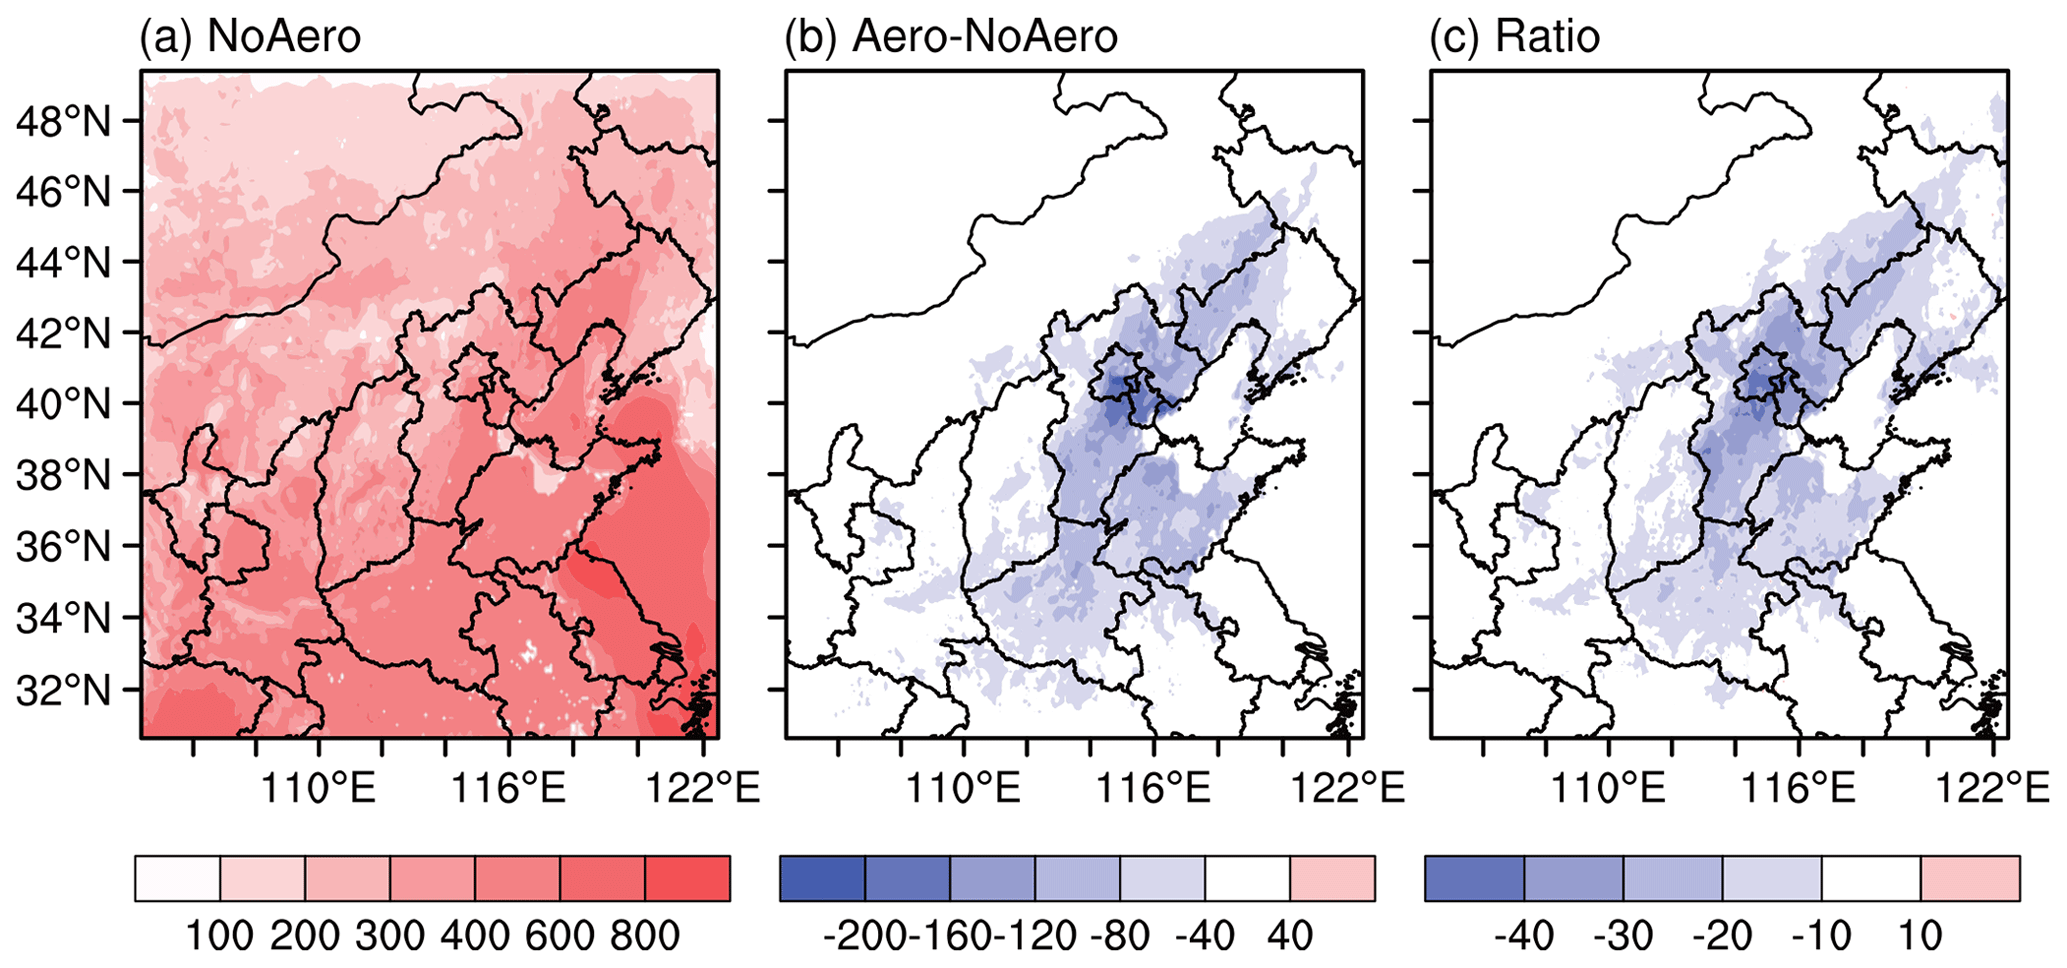
Figure 13(a) Daytime mean PBLH (m) in NoAero, (b) the difference between Aero and NoAero (Aero minus NoAero) and (c) the ratio of changes (%) averaged during 6 to 10 December 2015.

Figure 14NCP (defined in Fig. 1a) area-averaged vertical profiles of potential temperature (K, solid) and planetary boundary layer height (m, dash) in NoAero (blue) and Aero (red) at 14:00 LT on (a) 6 December, (b) 7 December, (c) 8 December, (d) 9 December and (e) 10 December 2015.
The near-surface wind field changes due to aerosol–radiation interaction were further investigated. Figure 15 shows the wind vector in NoAero (a–e), Aero (f–j) and their difference (k–o). It can be seen from Fig. 15a–e that northern China was dominated by the anticyclonic circulation, accompanied by the relatively weaker northeast wind over the Beijing and Hebei areas. The comparisons of Aero and NoAero (Fig. 15k–o) showed that the northeast wind was increased, with the maximum reaching 1 m s−1 by aerosol–radiation interaction over Beijing and Hebei, where a high particle concentration is located (shadings in Fig. 15f–j). Figure 15k–o also indicate the changes of west wind over the south part of the domain and southeast wind over the ocean areas, which tended to weaken the anticyclonic circulation and thus declined the wind speed there. The reduced wind speed due the inclusion of aerosol–radiation interaction was possibly due to the thermal-wind adjustment in response to the more stable near-surface atmosphere, which was also addressed in previous work using WRF-Chem (B. Zhang et al., 2015).
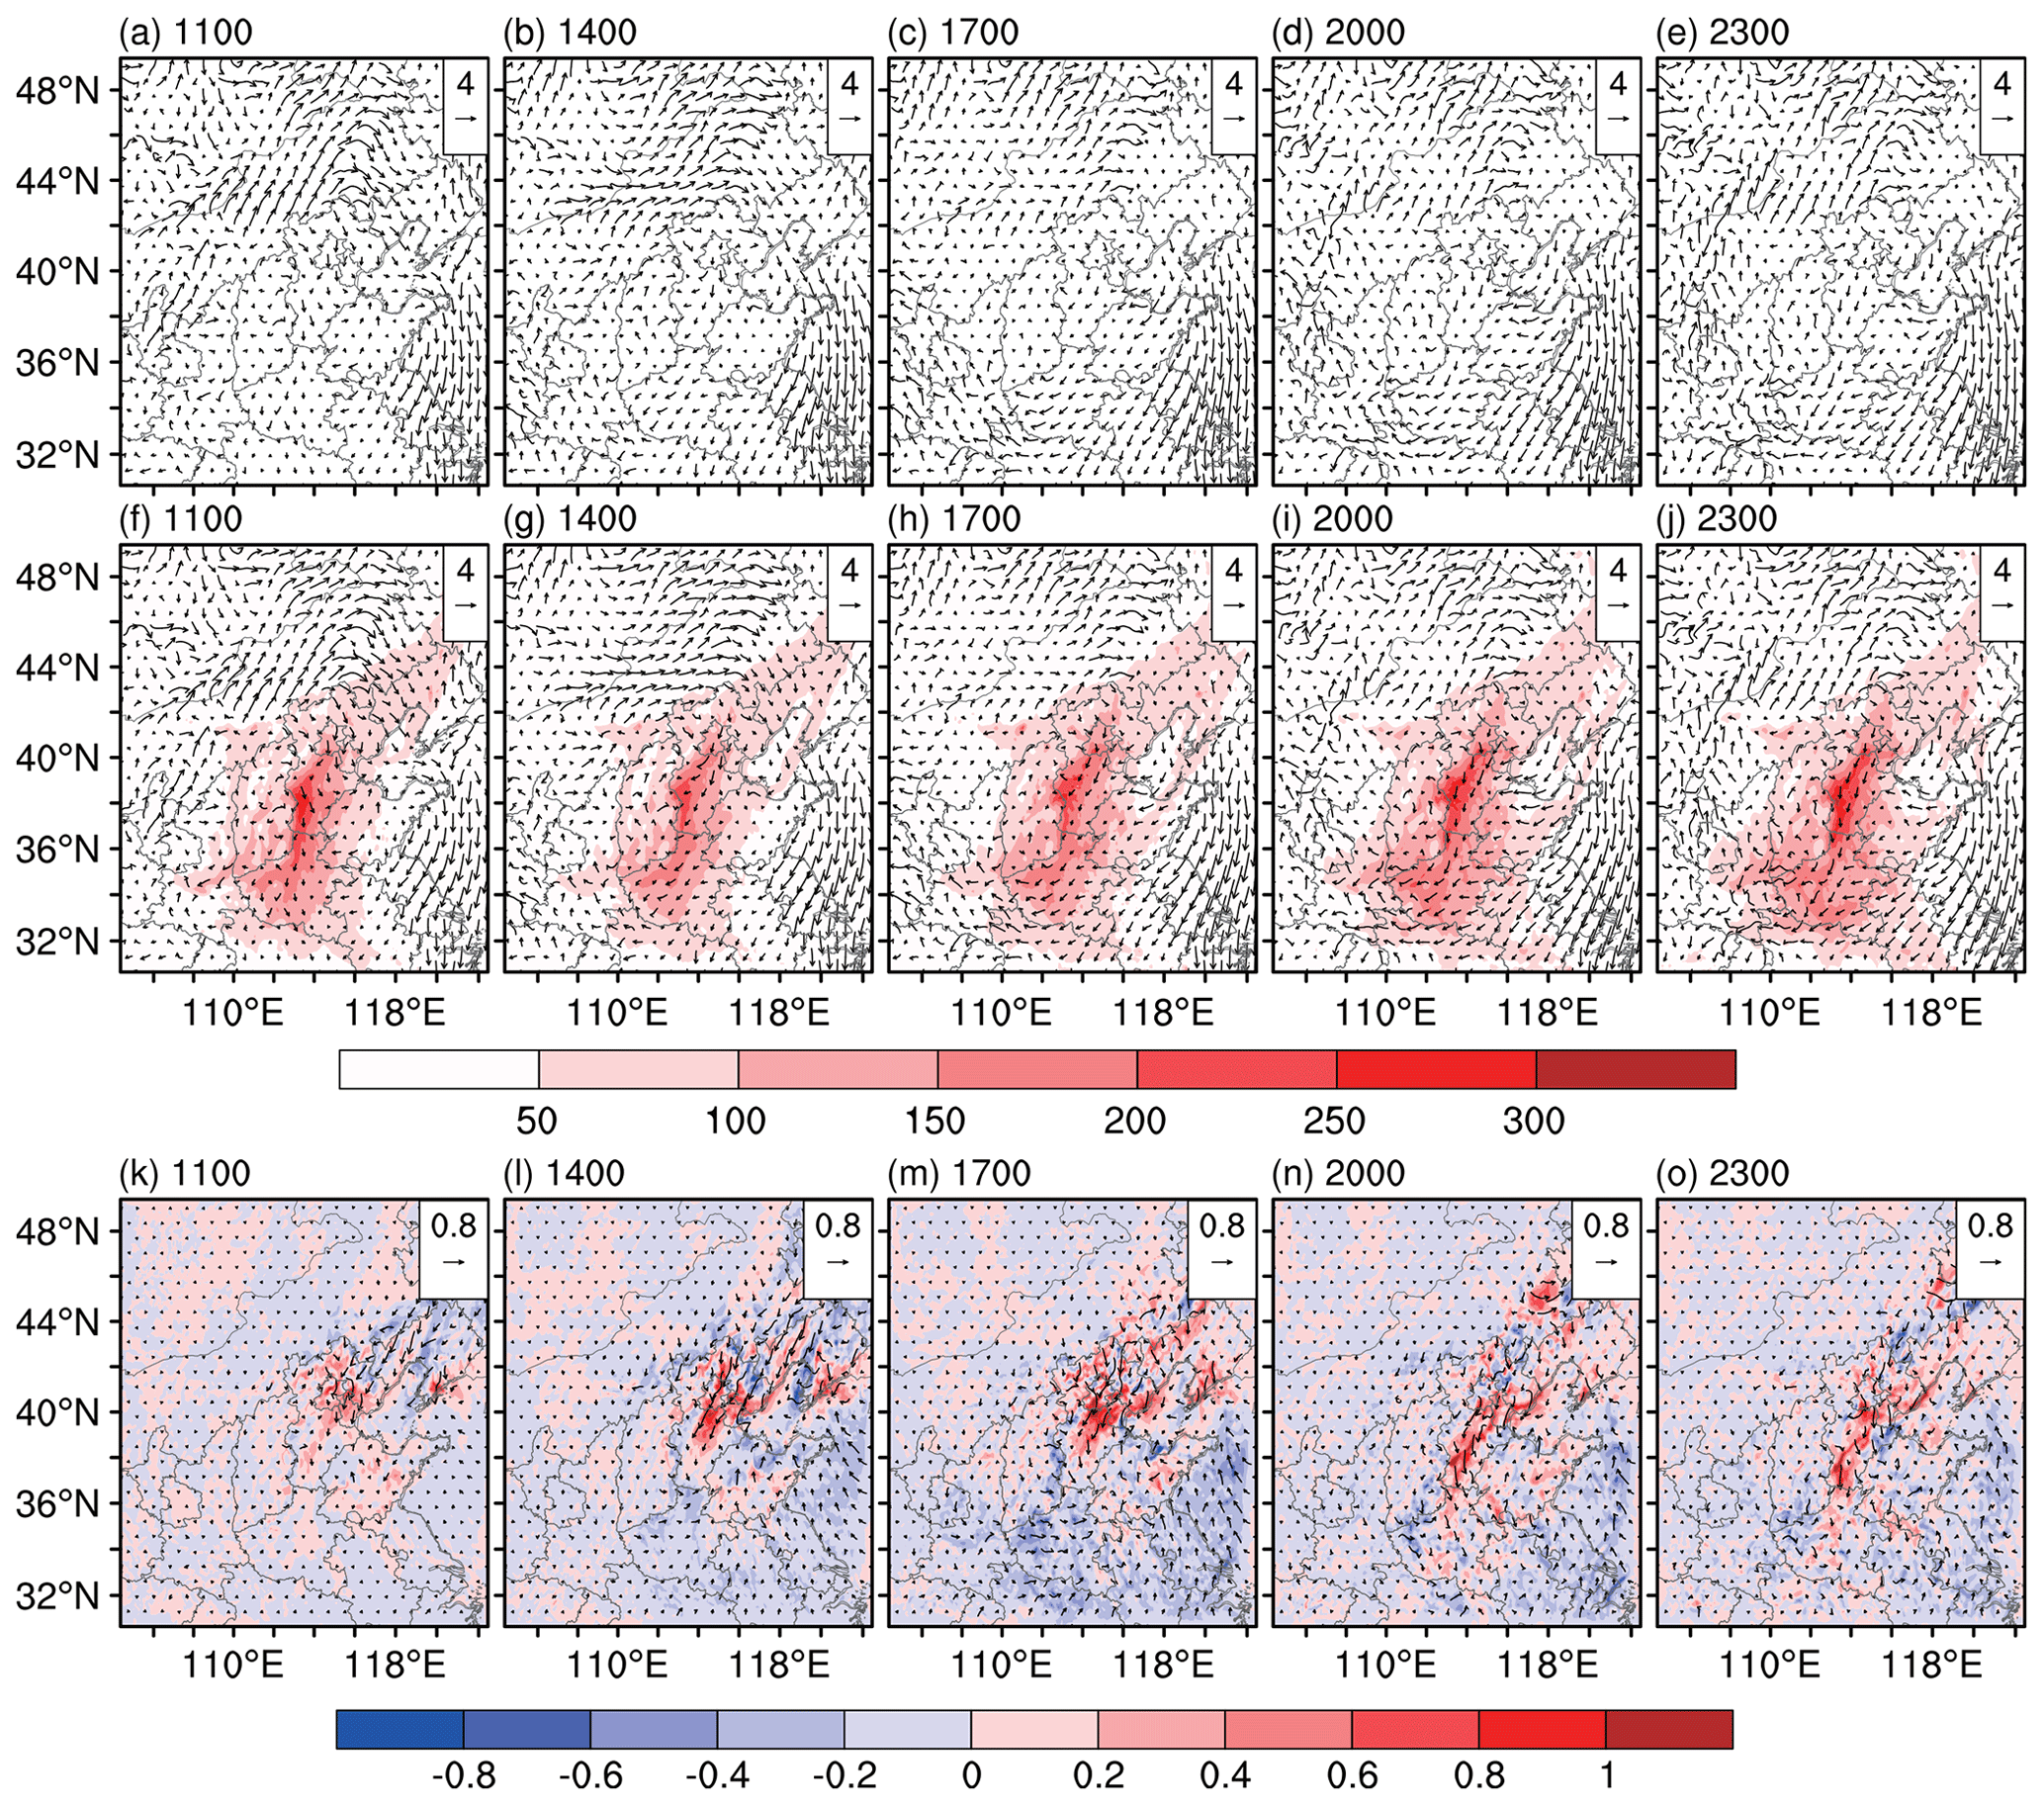
Figure 15The 10 m wind (vector) at 11:00, 14:00, 17:00, 20:00 and 23:00 LT in (a–e) NoAero and (f–j) Aero averaged during 6 to 10 December 2015, shadings in (f–j) are simulated PM2.5 concentrations (µg m−3). (k–o) The difference of 10 m wind (vector) and wind speed (shadings) between Aero and NoAero (Aero minus NoAero).
The comparisons between simulated wind speeds against in situ observation averaged during 6 to 10 December are displayed in Fig. 16. In regard to NoAero, the simulated wind speed at 10 m was overestimated over nearly the whole domain, with the maximum bias up to 3 m s−1 except in some mountain sites (Fig. 16a–j). It might be due to the omission of the UCM model as the overestimation is more prominent in city clusters (especially in Beijing and southern Hebei) than other areas. Figure 16k–o show the difference of absolute value of bias between Aero and NoAero and indicate the bias of simulated wind speed was decreased over south and northeast part of the domain during afternoon (Fig. 16k–m) by aerosol–radiation interaction, while increased over the Beijing and Hebei areas, particularly during nightfall (Fig. 16n) due to the intensified wind speed. The NCP area-averaged bias and RMSE of wind speed at 10 m are further shown in Fig. 17. It was seen that the aerosol–radiation interaction helped to reduce the overestimation of wind speed at 10 m up to 0.08 m s−1 (∼7.8 %), particular during the daytime (Fig. 17a and c). Correspondingly, the RMSE of Aero was also lower than that of NoAero, indicating that the inclusion of aerosol–radiation interaction helped to improve the prediction of near-surface wind speed on the domain-averaged scale.
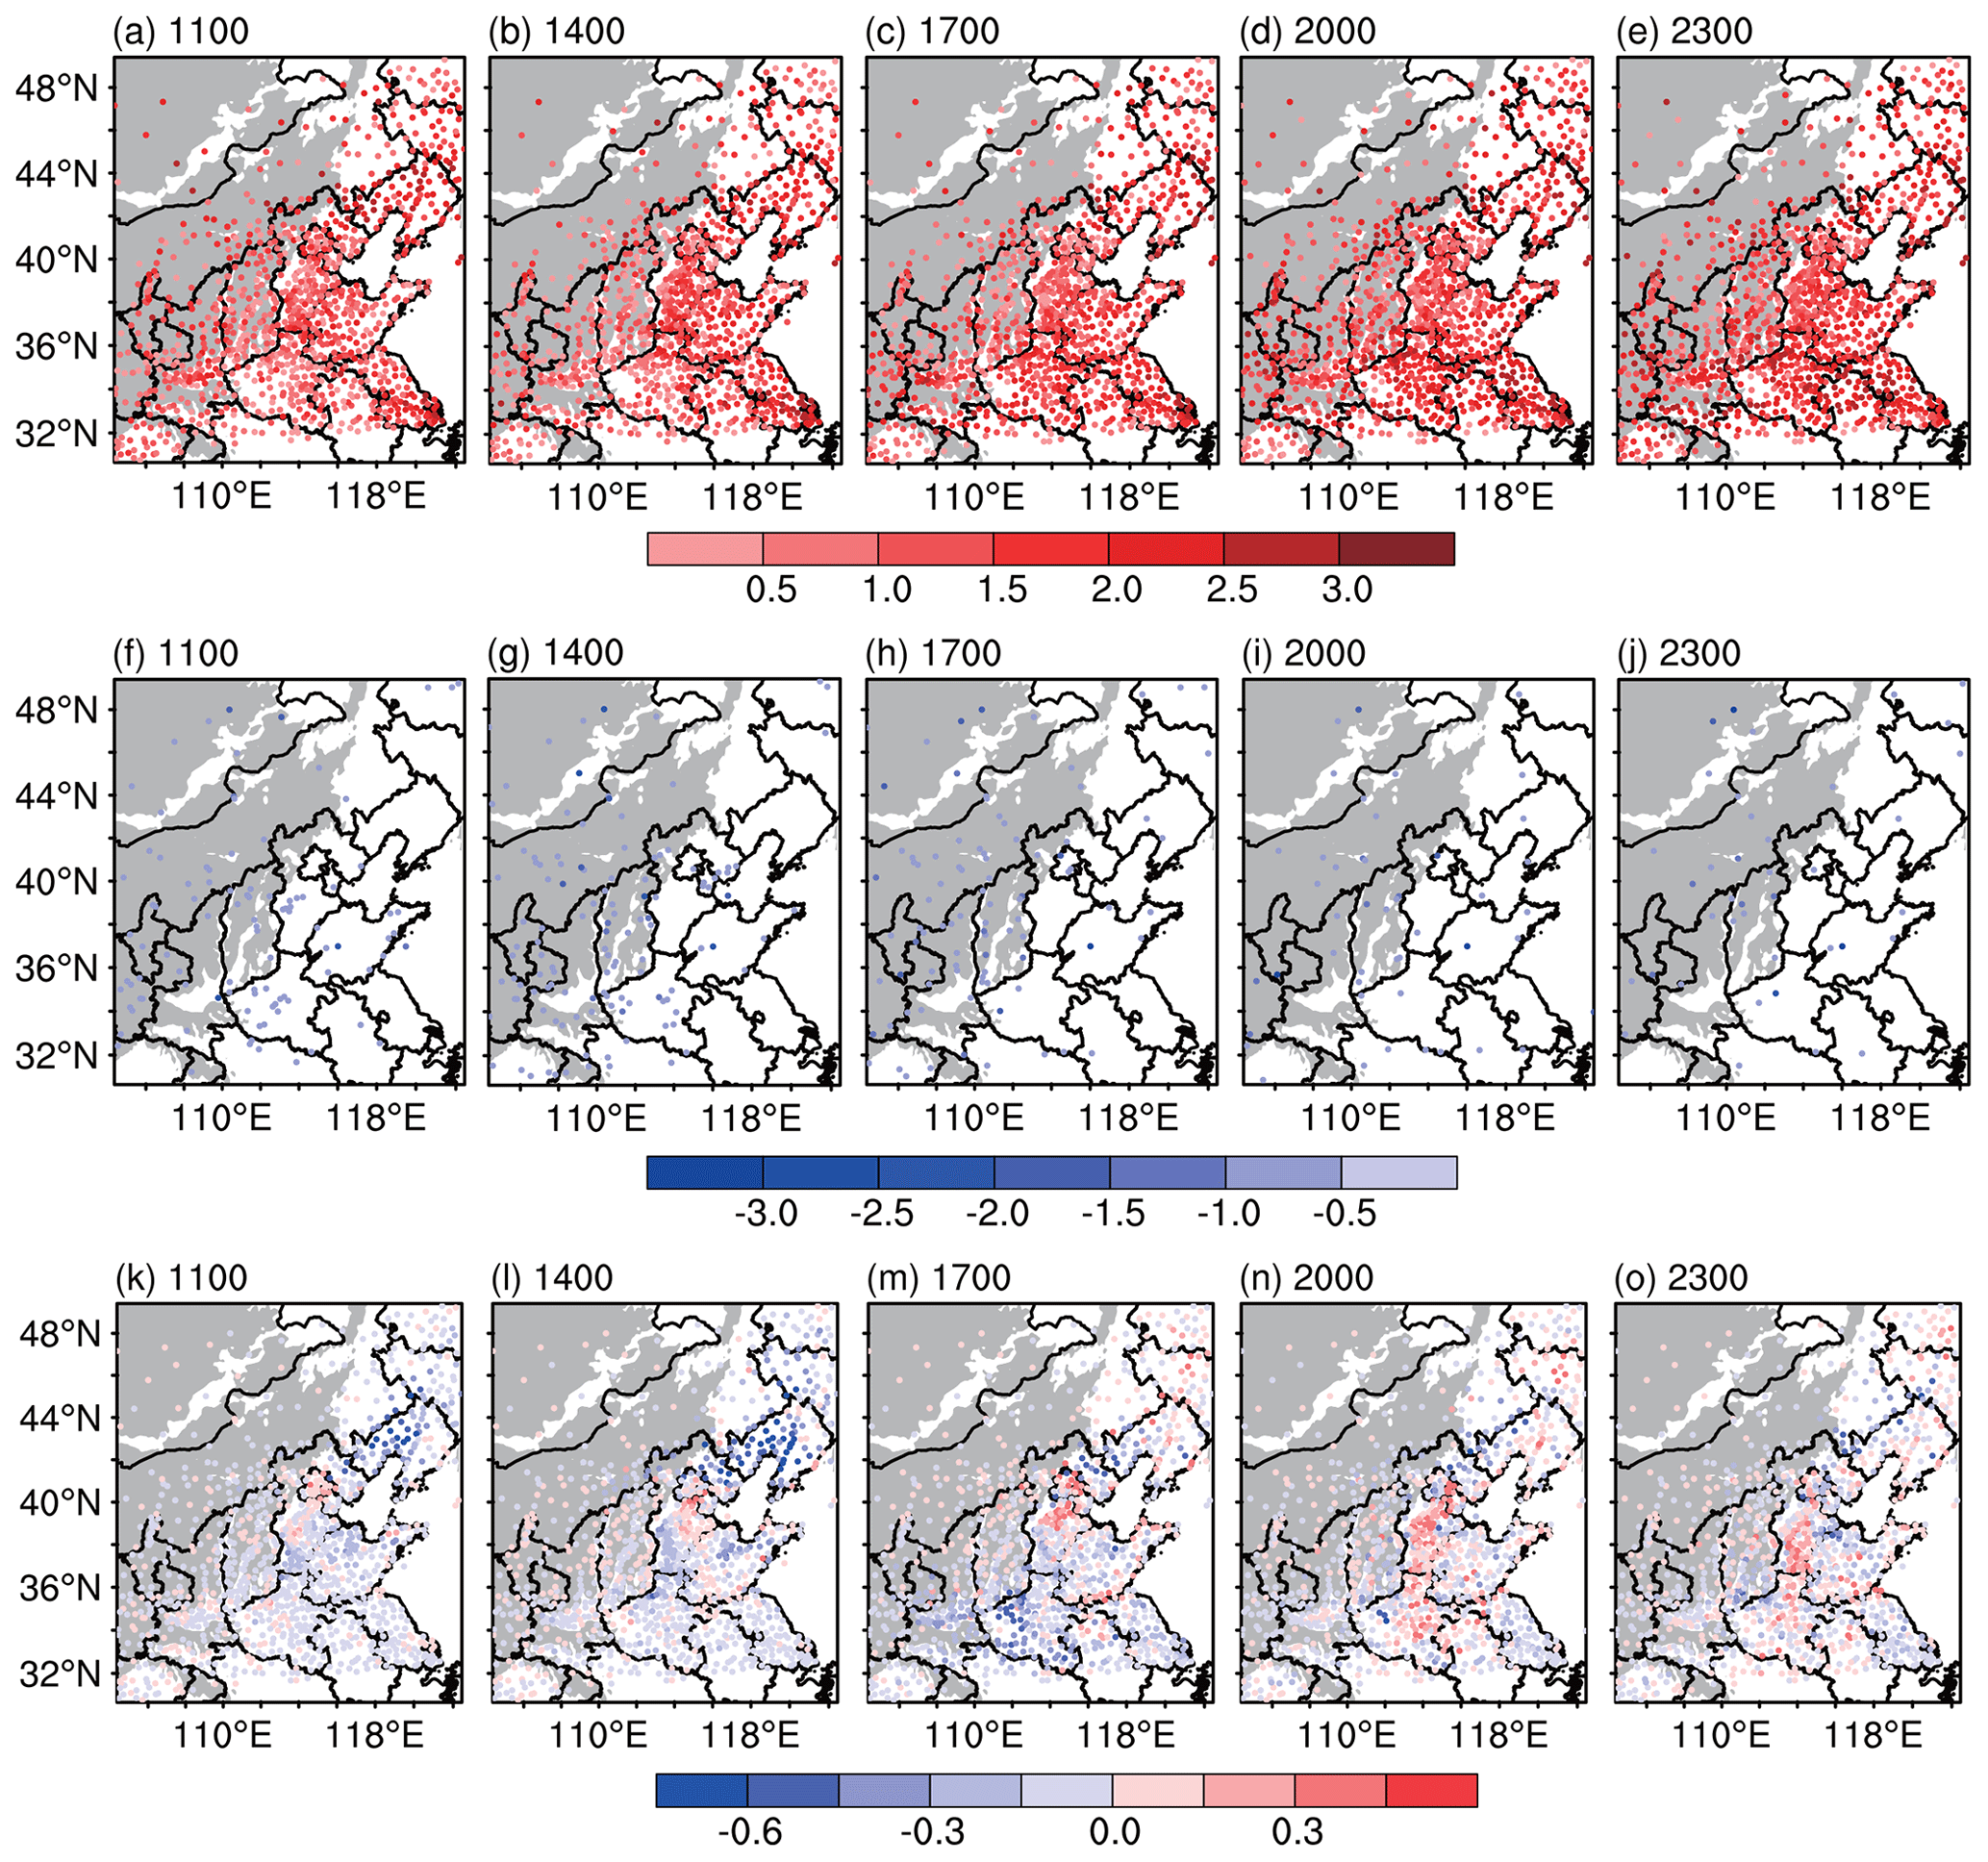
Figure 16The bias of 10 m wind speed (m s−1) at 11:00, 14:00, 17:00, 20:00 and 23:00 LT for (a–e) overestimated sites and (f–j) underestimated sites in NoAero averaged during 6 to 10 December 2015. (k–o) The difference of absolute value of bias (m s−1) between Aero and NoAero (Aero minus NoAero). The gray areas denote the areas of terrain height above 1000 m.
Although the changes of wind speed are less straightforward than those of radiation, the aerosol–radiation interactions can also affect dynamic fields (vertical wind shear) through the changes of atmospheric thermal structure and the thermal wind relation when the interaction lasts long enough (Huang et al., 2019). Figure 18 displays vertical profiles of wind speed at the stations of Beijing and Xingtai in the simulation and is verified with sounding observations. It was shown that the NoAero underestimated (overestimated) the low-level wind speed at 08:00 LT (20:00 LT) at both Beijing and Xingtai. However, the wind speed was increased (decreased) at 08:00 LT (20:00 LT) in Aero relative to NoAero, indicating the positive impacts on the simulation of atmospheric winds by aerosol–radiation interaction.
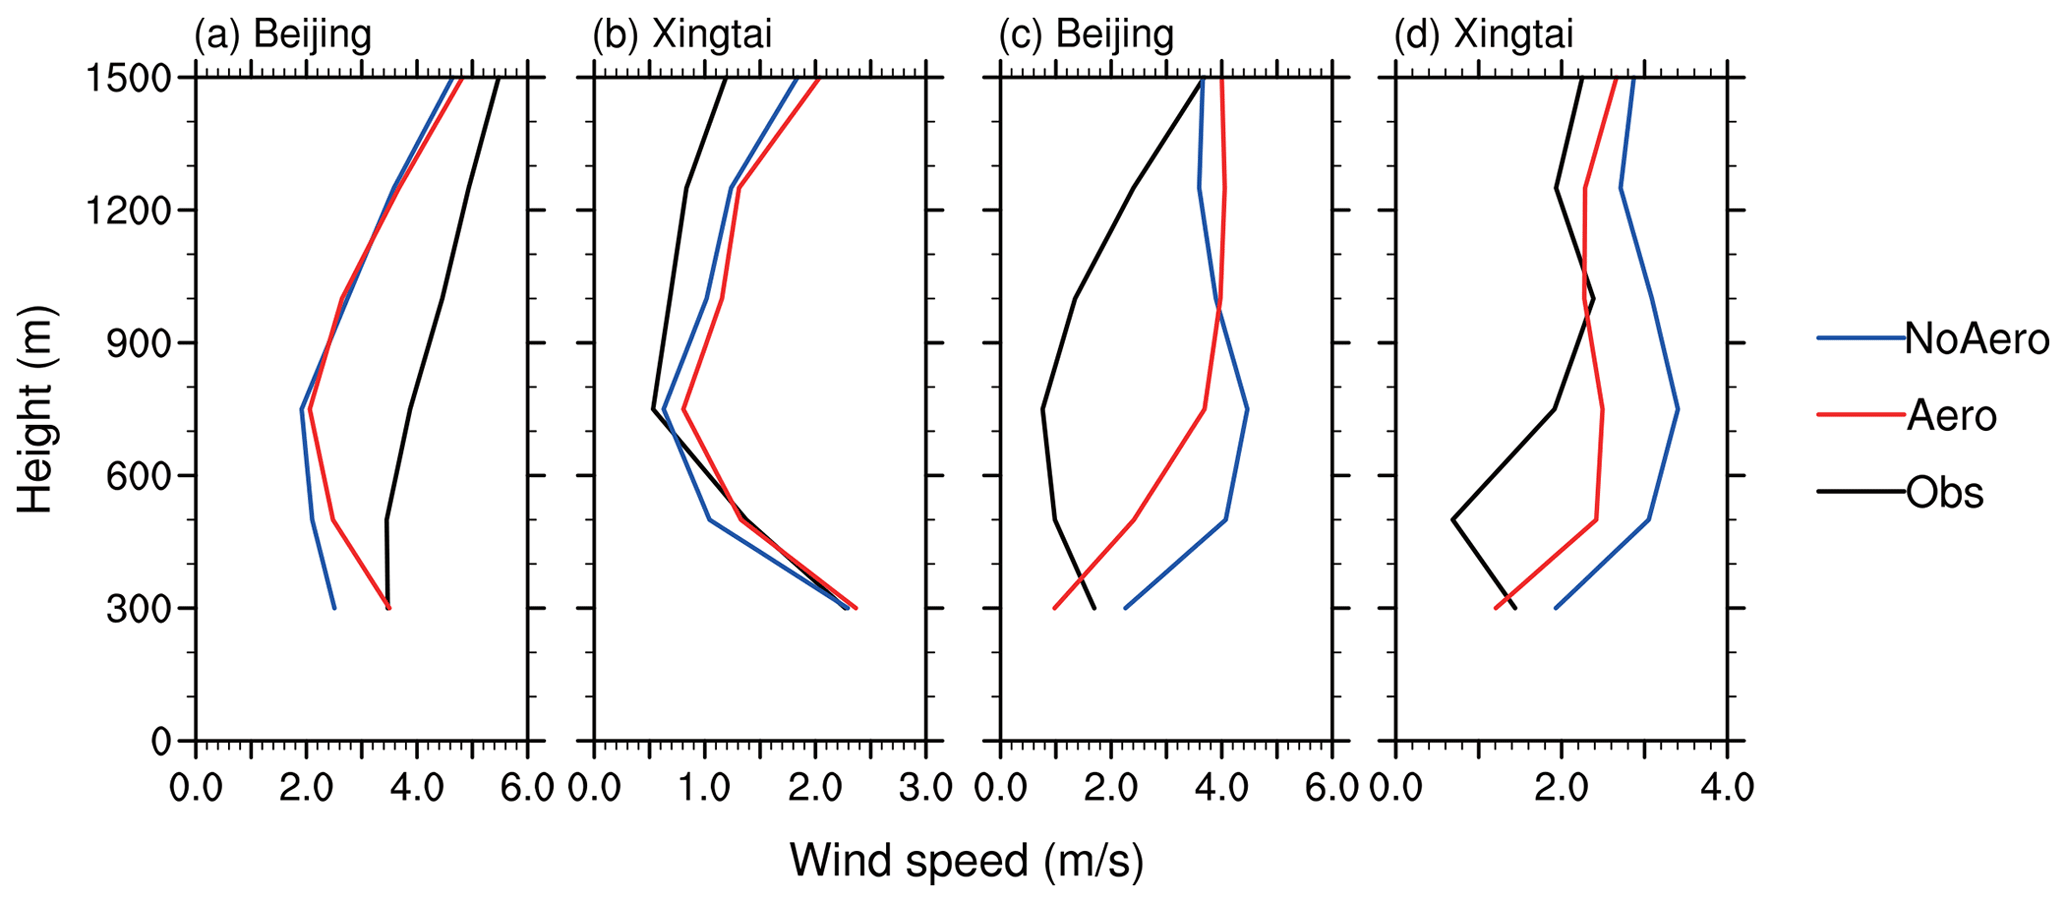
Figure 18(a, b) Observed (black) and simulated (NoAero: blue, Aero: red) vertical profiles of atmospheric wind speed (m s−1) at (a) Beijing and (b) Xingtai at 08:00 LT averaged from 6 to 10 December. Panels (c, d) are the same as (a, b), but at 20:00 LT.
Since the forecast meteorological fields by WRF (RMPAS-ST) are routinely applied to WRF-Chem (RMAPS-Chem) as meteorological ICs in the air quality operational system at IUM, the changed meteorology due to aerosol–radiation interaction will further influence the forecast of pollution through meteorological ICs. In regard to further feedback of aerosol–radiation interactions to the transport and dissipation of the pollutants, their impacts on the wind field at 850 hPa were further discussed as it is strongly correlated with haze formation (Zhang et al., 2018; Zhai et al., 2019). Figure 19a–e display that northern China was dominated by the anticyclone circulation at 850 hPa, associated with the southwest (northwest) wind in the west (east) of the northern part of the domain. The difference of U (zonal, eastward is positive) winds between Aero and NoAero (Fig. 16f–j) shows that the U wind was intensified over west Hebei, accompanied by the quite small changes in Beijing area, indicating that the increased U wind was blocked by the mountains and could not transport the pollutants over Hebei and Beijing to the east (Fig. 19f–h). On the other hand, the changes of V (meridional, northward is positive) show different patterns over north and south of the 38∘ N (Fig. 19k–o). In the south part, the increased northward wind due to aerosol–radiation interaction may help to transport pollutants from highly polluted areas to Hebei and Beijing. In the north of the domain, the negative (positive) changes of V wind indicated the reduced northward (southward) wind in west (east) Hebei, which could suppress the diffusion of the pollutants. As a result, both U and V changes induced by the aerosol–radiation interaction will prevent pollutants from dispersing and may exacerbate the pollution in Heibei and Beijing, which confirms the more stable boundary layer due to aerosol–radiation interaction as discussed earlier.
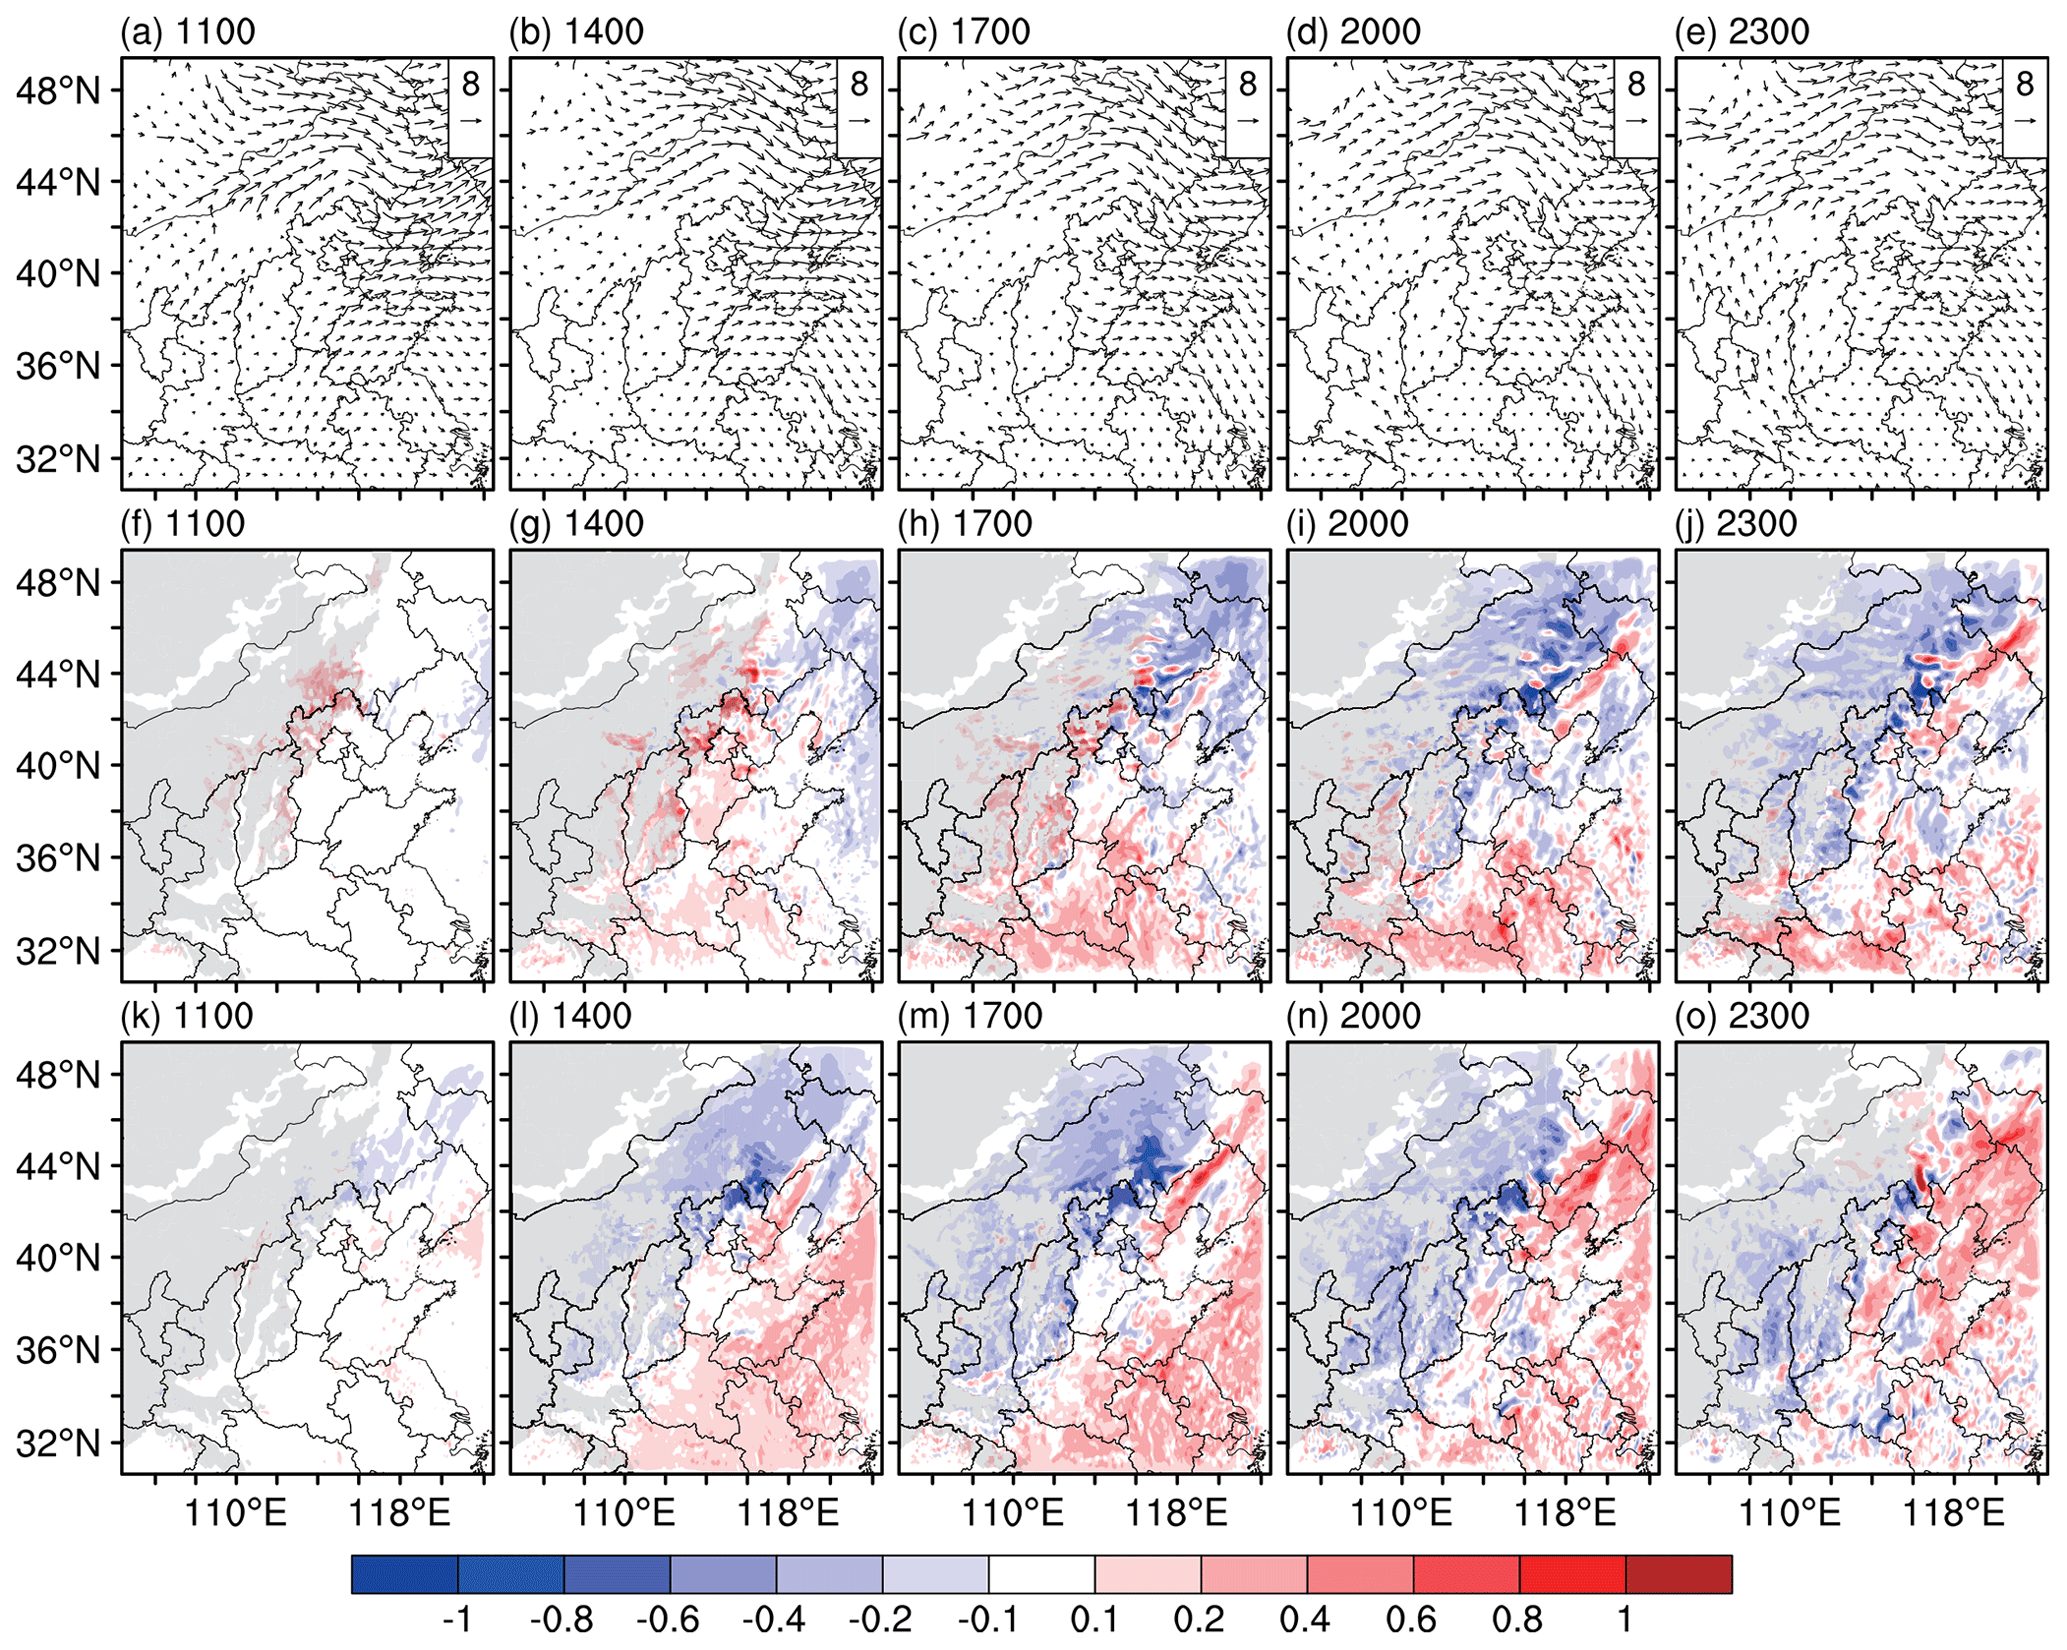
Figure 19The wind at 850 hPa (vector) at 11:00, 14:00, 17:00, 20:00 and 23:00 LT in NoAero averaged during 6 to 10 December 2015. The difference of (f–j) U and (k–o) V wind speed between Aero and NoAero (Aero minus NoAero). The gray areas denote the areas of terrain height above 1000 m.
To facilitate the future inclusion of aerosol–radiation interactions in the regional operational NWP system, RMAPS-ST (adapted from WRF), at IUM, CMA, the impacts of aerosol–radiation interactions on the forecast of surface radiation and meteorological parameters during a heavy pollution event (6–10 December 2015) over northern China were investigated. The aerosol information (550 nm AOD 2D field) were simulated by WRF-Chem and then offline-coupled into the RRTMG radiation scheme of WRF to enable the aerosol–radiation feedback in the forecast. Two sets of 24 h forecasts were performed at 00:00 UTC from 2 to 11 December 2015. The only difference between the two sets of forecasts was whether the aerosol radiative feedback was activated (Aero, with WRF-Chem simulated hourly AOD fields as input fields) or not (NoAero, no aerosol included), while the other schemes remained the same.
The capability of WRF-chem to reproduce the polluted episode was confirmed first before the offline coupling of AOD to WRF. The validation of simulated AOD and aerosol extinction coefficient against MODIS and CALIPSO confirmed that the model could reproduce both the spatial and vertical distribution of 550 nm AOD. Further results indicate that the temporal variations of simulated AOD at 550 nm was inconsistent with AERONET and in situ observations at IAP. In addition, the spatial distributions of PM2.5 as well as their magnitude, particularly during the peak stage (8 to 9 December) of the pollution event, were reasonably well captured by WRF-Chem, with the correlation coefficients of 0.85, 0.89, 0.76, 0.92 and 0.77 in Beijing, Shijiazhuang, Tianjin, Hebei and Henan, respectively.
Further, the impacts of aerosol–radiation interaction on the forecasts of surface radiation, energy budget and meteorology parameters were evaluated against surface and sounding observations. The results showed that the decrease in downward SW radiation reaching the surface induced by aerosol effects helped to reduce the overestimation of SW radiation during the daytime. Moreover, the simulated surface radiation budget has also been improved, with the biases of net radiation at the surface decreased by 85.3 %, 50.0 %, 35.4 % and 44.1 % during the daytime in Beijing, Tianjin, Taiyuan and Jinan respectively, accompanied by the reduction of sensible (16.1 W m−2, 18.5 %) and latent (6.8 W m−2, 13.4 %) heat fluxes emitted by the surface around noon.
The energy budget changed by aerosol extinction further cools 2 m temperature by ∼0.40 ∘C over NCP, reducing warm bias by ∼73.9 % and also leading to lower RMSE, particularly during the daytime. Since aerosol cools the lower planetary boundary layer and meanwhile warms the high atmosphere, it induced the more stable stratification of the atmosphere and the declination of PBLH by 40–200 m (10 %–40 %) over NCP. Associated with the changes of planetary boundary structure and a more stable near-surface atmosphere, the aerosol–radiation interaction tended to weaken the anticyclonic circulation including the east wind over the south part of the domain and northwest wind over the ocean areas. Thus the bias of wind speed over the south and northeast parts of the domain decreased particularly during the afternoon, while it increased over Beijing and Hebei areas. In regard to the NCP average, the overestimated 10 m wind speed was improved during whole day with the maximum up to 0.08 m s−1 (∼7.8 %) at 14:00 LT. The comparison between simulated vertical profiles of atmospheric wind speed with soundings also indicated that Aero was in better agreement with observations and aerosol–radiation interaction helped to improve the prediction of dynamic fields such as atmospheric wind through the thermal wind relation by altering the atmospheric structure.
The impacts of aerosol–radiation interactions on the wind field at 850 hPa were further discussed. The results showed that aerosol–radiation interaction will prevent pollutants from dispersing and may exacerbate the pollution through changes of both U and V wind, which confirms the more stable boundary layer due to aerosol–radiation interactions. These wind field changes may also influence the forecast of the transport and dissipation of the pollutants by WRF-Chem through changed meteorological ICs.
This study analyzed the impacts of aerosol–radiation interaction on radiation and meteorological forecast by using the offline-coupling of WRF and high-frequency updated AOD simulated by WRF-Chem, which is more computationally economic than the online simulation with the integration time for a 96 h forecast of about 40 % of that for online simulation. This approach allows for a potential application to include aerosol–radiation interaction in our current operational NWP systems. The results revealed that aerosol–radiation interaction had a profound influence on the improvement of predictive accuracy and the potential prospects for its application in regional NWP in northern China. To verify the statistical significance of the results, we further conducted the 24 h forecasts for a longer period lasting 27 d (13 January–8 February 2017), with no AOD field (NoAero) and WRF-Chem-simulated hourly AOD fields (Aero) included, as well as a constant AOD value of 0.12 (ClimAero), respectively. The results showed that the mean RMSE of 2 m temperature (wind speed at 10 m) in Aero and ClimAero relative to NoAero was reduced by 4.0 % (1.9 %) and 1.2 % (1.6 %), respectively (not shown). The 1-month results indicated that the simulation with the inclusion of WRF-Chem simulated hourly AOD fields outperformed the other two simulations and showed more improvement on the meteorological forecast than the simulation with climatological AOD fields. More detailed evaluations and analysis will be addressed in a future article. As the simulated AOD was adopted in the present study, it should be noted that there is a discrepancy between simulated AOD and observation in both spatial distribution and temporal variation, which may influence the impacts of aerosol–radiation interaction. Meanwhile, surface energy budget and atmospheric dynamics are also influenced by aerosol–cloud interaction, which are related to cloud microphysical processes and are not discussed in this study.
Data are available upon request from the first authors Yang Yang (yyang@ium.cn) and corresponding authors Xiujuan Zhao (xjzhao@ium.cn) and Dan Chen (dchen@ium.cn).
YY, MC, XZ and DC designed the experiments, YY and XZ performed the simulations and carried them out. YY and DC prepared the paper with contributions from all co-authors.
The authors declare that they have no conflict of interest.
This work was jointly supported by the National Key R & D Program of China (grant nos. 2017YFC1501406 and 2018YFF0300102), Natural Science Foundation of Beijing Municipality (8161004), National Natural Science Foundation of China (grant nos. 41705076, 41705087 and 41705135), Beijing Major Science and Technology Project (Z181100005418014) and Beijing Natural Science Foundation (grant no. 8204074).
This research has been supported by the National Key R & D Program of China (grant nos. 2017YFC1501406 and 2018YFF0300102), the Natural Science Foundation of Beijing Municipality (grant no. 8161004), the National Natural Science Foundation of China (grant nos. 41705076, 41705087 and 41705135), the Beijing Major Science and Technology Project (grant no. Z181100005418014), and Beijing Natural Science Foundation (grant no. 8204074).
This paper was edited by Michael Schulz and reviewed by Angela Benedetti and one anonymous referee.
Ackerman, A. S., Toon, O. B., Stevens, D. E., Heymsfield, A. J., Ramanathan, V., and Welton, E. J.: Reduction of tropical cloudiness by soot, Science, 288, 1042–1047, https://doi.org/10.1126/science.288.5468.1042, 2000.
Baklanov, A., Schlünzen, K., Suppan, P., Baldasano, J., Brunner, D., Aksoyoglu, S., Carmichael, G., Douros, J., Flemming, J., Forkel, R., Galmarini, S., Gauss, M., Grell, G., Hirtl, M., Joffre, S., Jorba, O., Kaas, E., Kaasik, M., Kallos, G., Kong, X., Korsholm, U., Kurganskiy, A., Kushta, J., Lohmann, U., Mahura, A., Manders-Groot, A., Maurizi, A., Moussiopoulos, N., Rao, S. T., Savage, N., Seigneur, C., Sokhi, R. S., Solazzo, E., Solomos, S., Sørensen, B., Tsegas, G., Vignati, E., Vogel, B., and Zhang, Y.: Online coupled regional meteorology chemistry models in Europe: current status and prospects, Atmos. Chem. Phys., 14, 317–398, https://doi.org/10.5194/acp-14-317-2014, 2014.
Chan, C. K. and Yao, X.: Air pollution in mega cities in China, Atmos. Environ., 42, 1–42, https://doi.org/10.1016/j.atmosenv.2007.09.003, 2008.
Chen, D., Liu, Z., Davis, C., and Gu, Y.: Dust radiative effects on atmospheric thermodynamics and tropical cyclogenesis over the Atlantic Ocean using WRF–Chem coupled with an AOD data assimilation system, Atmos. Chem. Phys., 17, 7917–7939, https://doi.org/10.5194/acp-17-7917-2017, 2017.
Chen, F. and Dudhia, J.: Coupling an advanced land surface-hydrology model with the Penn State-NCAR MM5 modeling system. Part I: Model implementation and sensitivity, Mon. Weather Rev., 129, 569–585, https://doi.org/10.1175/1520-0493(2001)129<0569:CAALSH>2.0.CO;2, 2001.
Cheng, X., Sun, Z., Li, D., Xu, X., Jia, M., and Cheng, S.: Short-term aerosol radiative effects and their regional difference during heavy haze episodes in January 2013 in China, Atmos. Environ., 165, 248–263, https://doi.org/10.1016/j.atmosenv.2017.06.040, 2017.
Cheng, Y. F., Eichler, H., Wiedensohler, A., Heintzenberg, J., Zhang, Y. H., Hu, M., Herrmann, H., Zeng, L. M., Liu, S., Gnauk, T., Brüggemann, E., and He, L.Y., Mixing state of elemental carbon and non-light-absorbing aerosol components derived from in situ particle optical properties at Xinken in Pearl River Delta of China, J. Geophys. Res.-Atmos., 111, D20204, https://doi.org/10.1029/2005JD006929, 2006.
Chou, M. D. and Suarez, M. J.: A solar radiation parameterization for atmospheric studies, Tech. Rep. NASA/TM-1999-104606, Technical Report Series on Global Modeling and Data Assimilation, NASA/TM-1999-104606, Vol. 15, NASA, available at: http://citeseerx.ist.psu.edu/viewdoc/download;jsessionid=23E5B65E3D200CE47F7315D1D629F259?doi=10.1.1.331.6516&rep=rep1&type=pdf (last access: 1 November 2020), 1999.
Ek, M. B., Mitchell, K. E., Lin, Y., Rogers, E., Grunmann, P., Koren, V., Gayno, G., and Tarpley, J.D.: Implementation of Noah land surface model advances in the National Centers for Environmental Prediction operational mesoscale Eta model, J. Geophys. Res.-Atmos, 108, 8851, https://doi.org/10.1029/2002JD003296, 2003.
Elser, M., Huang, R.-J., Wolf, R., Slowik, J. G., Wang, Q., Canonaco, F., Li, G., Bozzetti, C., Daellenbach, K. R., Huang, Y., Zhang, R., Li, Z., Cao, J., Baltensperger, U., El-Haddad, I., and Prévôt, A. S. H.: New insights into PM2.5 chemical composition and sources in two major cities in China during extreme haze events using aerosol mass spectrometry, Atmos. Chem. Phys., 16, 3207–3225, https://doi.org/10.5194/acp-16-3207-2016, 2016.
Fan, J., Zhang, R., Tao, W. K., and Mhor, K. I.: Effects of aerosol optical properties on deep convective clouds and radiative forcing, J. Geophys. Res., 113, D08209, https://doi.org/10.1029/2007JD009257, 2008.
Ghan, S. J., Liu, X., Easter, R. C., Zaveri, R., Rasch, P. J., Yoon, J.-H., Eaton, B.: Toward a Minimal Representation of Aerosols in Climate Models: Comparative Decomposition of Aerosol Direct, Semidirect, and Indirect Radiative Forcing, J. Climate, 25, 6461–6476, https://doi.org/10.1175/JCLI-D-11-00650.1, 2012.
Grell, G. A. and Baklanov, A.: Integrated modelling for forecasting weather and air quality: a call for fully coupled approaches, Atmos. Environ., 45, 6845–6851, https://doi.org/10.1016/j.atmosenv.2011.01.017, 2011.
Grell, G. A. and Dévényi, D.: A generalized approach to parameterizing convection combining ensemble and data assimilation techniques, Geophys. Res. Lett., 29, 1693, https://doi.org/10.1029/2002GL015311, 2002.
Grell, G., Freitas, S. R., Stuefer, M., and Fast, J.: Inclusion of biomass burning in WRF-Chem: impact of wildfires on weather forecasts, Atmos. Chem. Phys., 11, 5289–5303, https://doi.org/10.5194/acp-11-5289-2011, 2011.
Guo, J., Deng, M., Lee, S. S., Wang, F., Li, Z., Zhai, P., Liu, H., Lv, W., Yao, W., and Li, X.: Delaying precipitation and lightning by air pollution over the pearl river delta. Part I: observational analyses, J. Geophys. Res.-Atmos, 121, 6472–6488, https://doi.org/10.1002/2015JD023257, 2016.
Hansen, J., Sato, M., and Ruedy, R.: Radiative forcing and climate response, J. Geophys. Res.-Atmos, 102, 6831–6864, https://doi.org/10.1029/96JD03436, 1997.
Hong, S.-Y., Noh, Y., and Dudhia, J.: A new vertical diffusion package with an explicit treatment of entrainment processes, Mon. Weather Rev., 134, 2318–2341, https://doi.org/10.1175/Mwr3199.1, 2006.
Huang, C.-C., Chen, S.-H., Lin, Y.-C., Earl, K., Matsui, T., Lee, H.-H., Tsai, I-C., Chen, J.-P., and Cheng, C.-T.: Impacts of Dust–Radiation versus Dust–Cloud Interactions on the Development of a Modeled Mesoscale Convective System over North Africa, Mon. Weather Rev., 47, 3301–3326, https://doi.org/10.1175/MWR-D-18-0459.1, 2019.
Huang, X., Ding, A., Liu, L., Liu, Q., Ding, K., Niu, X., Nie, W., Xu, Z., Chi, X., Wang, M., Sun, J., Guo, W., and Fu, C.: Effects of aerosol–radiation interaction on precipitation during biomass-burning season in East China, Atmos. Chem. Phys., 16, 10063–10082, https://doi.org/10.5194/acp-16-10063-2016, 2016.
Iacono, M. J., Delamere, J. S., Mlawer, E. J., Shephard, M. W., Clough, S. A., and Collins, W. D.: Radiative forcing by long-lived greenhouse gases: Calculations with the AER radiative transfer models, J. Geophys. Res.-Atmos, 113, D13103, https://doi.org/10.1029/2008JD009944, 2008.
Jiang, M., Feng, J., Li, Z., Sun, R., Hou, Y.-T., Zhu, Y., Wan, B., Guo, J., and Cribb, M.: Potential influences of neglecting aerosol effects on the NCEP GFS precipitation forecast, Atmos. Chem. Phys., 17, 13967–13982, https://doi.org/10.5194/acp-17-13967-2017, 2017.
Kain, J. S.: The Kain-Fritsch convective parameterization: An update, J. Appl. Meteorol., 43, 170–181, 2004.
Kaufman, Y. J., Tanre, D., and Boucher, O.: A satellite view of aerosols in the climate system, Nature, 419, 215–223, https://doi.org/10.1038/nature01091, 2002.
Liao, H., Chen, W. T., and Seinfeld, J. H.: Role of climate change in global predictions of future tropospheric ozone and aerosols, J. Geophys. Res., 111, D12304, https://doi.org/10.1029/2005JD006852, 2006.
Liao, L., Lou, S. J., Fu, Y., Chang, W. J., and Liao, H.: Radiative forcing of aerosols andits impact on surface air temperature on the synoptic scale in eastern China, Chinese J. Atmos. Sci., 39, 68–82, https://doi.org/10.3878/j.issn.1006-9895.1402.13302, 2015.
Liu, X., Zhang, Y., Cheng, Y., Hu, M., and Han, T.: Aerosol hygroscopicity and its impact on atmospheric visibility and radiative forcing in Guangzhou during the 2006 PRIDE-PRD campaign, Atmos. Environ. 60, 59–67, https://doi.org/10.1016/j.atmosenv.2012.06.016, 2012.
Mlawer, E. J., Taubman, S. J., Brown, P. D., Iacono, M. J. and Clough, S. A.: Radiative transfer for inhomogeneous atmospheres: RRTM, a validated correlated-k model for the longwave, J. Geophys. Res., 102, 16663–16682, https://doi.org/10.1029/97JD00237, 1997.
Mulcahy, J. P., Walters, D. N., Bellouin, N., and Milton, S. F.: Impacts of increasing the aerosol complexity in the Met Office global numerical weather prediction model, Atmos. Chem. Phys., 14, 4749–4778, https://doi.org/10.5194/acp-14-4749-2014, 2014.
Oreopoulos, L., Mlawer, E., Delamere, J., Shippert, T., Cole, J., Fomin, B., Iacono, M., Jin, Z., Li, J., Manners, J., Räisä-nen, P., Rose, F., Zhang, Y., Wilson, M. J., and Rossow, W. B.: The Continual Intercomparison of Radiation Codes: Results from Phase I, J. Geophys. Res.-Atmos., 117, D06118, https://doi.org/10.1029/2011JD016821, 2012.
Péré, J. C., Mallet, M., Pont, V., and Bessagnet B.: Impact of aerosol direct radiative forcing on the radiative budget, surface heat fluxes, and atmospheric dynamics during the heat wave of summer 2003 over western Europe: A modeling study, J. Geophys. Res., 116, D23119, https://doi.org/10.1029/2011JD016240, 2011.
Pleim, J. E.: A Combined local and nonlocal closure model for the atmospheric boundary layer. Part I: Model description and testing, J. Appl. Meteorol. Clim., 46, 1383–1395, https://doi.org/10.1175/JAM2539.1, 2007.
Quan, J., Tie, X., Zhang, Q., Liu, Q., Li, X., Gao, Y., and Zhao D.: Characteristics of heavy aerosol pollution during the 2012–2013 winter in Beijing, China, Atmos. Environ., 88, 83–89, https://doi.org/10.1016/j.atmosenv.2014.01.058, 2014.
Ramanathan, V., Crutzen, P. J., Kiehl, J. T., and Rosenfeld, D.: Aerosols, Climate and the Hydrological Cycle, Science, 294, 2119–2124, 2001.
Rémy, S., Benedetti, A., Bozzo, A., Haiden, T., Jones, L., Razinger, M., Flemming, J., Engelen, R. J., Peuch, V. H., and Thepaut, J. N.: Feedbacks of dust and boundary layer meteorology during a dust storm in the eastern Mediterranean, Atmos. Chem. Phys., 15, 12909–12933, https://doi.org/10.5194/acp-15-12909-2015, 2015.
Rodwell, M. J. and Jung, T.: Understanding the local and global impacts of model physics changes: an aerosol example, Q. J. Roy. Meteorol. Soc., 134, 1479–1497, https://doi.org/10.1002/qj.298, 2008.
Rogers, R. E., Deng, A. J., Stauffer, D. R., Gaudet, B. J., Jia, Y. Q., Soong, S. T., and Tanrikulu, S.: Application of the Weather Research and Forecasting Model for Air Quality Modeling in the San Francisco Bay Area, J. Appl. Meteorol. Clim., 52, 1953–1973, https://doi.org/10.1175/JAMC-D-12-0280.1, 2013.
Ruiz-Arias, J. A., Dudhia, J., and Gueymard, C. A.: A simple parameterization of the short-wave aerosol optical properties for surface direct and diffuse irradiances assessment in a numerical weather model, Geosci. Model Dev., 7, 1159–1174, https://doi.org/10.5194/gmd-7-1159-2014, 2014.
Sekiguchi, A., Shimadera, H., and Kondo, A.: Impact of Aerosol Direct Effect on Wintertime PM2.5 Simulated by an Online Coupled Meteorology–Air Quality Model over East Asia, Aerosol Air Qual. Res., 18, 1068–1079, https://doi.org/10.4209/aaqr.2016.06.0282, 2018.
Thompson, G., Field, P. R., Rasmussen, R. M., and Hall, W. D.: Explicit forecasts of winter precipitation using an improved bulk microphysics scheme. Part II: Implementation of a new snow parameterization, Mon. Weather Rev., 136, 5095–5115, https://doi.org/10.1175/2008MWR2387.1, 2008.
Toll, V., Reis. K., Ots, R., Kaasik, M., Männik, A., Prank, M., and Sofiev, M.: SILAM and MACC reanalysis aerosol data used for simulating the aerosol direct radiative effect with the NWP model HARMONIE for summer 2010 wildfire case in Russia, Atmos. Environ., 121, 75–85, https://doi.org/10.1016/j.atmosenv.2015.06.007, 2015.
Toll, V., Gleeson, E., Nielsen, K.P., Männik, A., Mašek, J., Rontu, L., and Post, P.: Impacts of the direct radiative effect of aerosols in numerical weather prediction over Europe using the ALADIN-HIRLAM NWP system, Atmos. Res., 172–173, 163–173, https://doi.org/10.1016/j.atmosres.2016.01.003, 2016.
Wang, H., Xue, M., Zhang, X. Y., Liu, H. L., Zhou, C. H., Tan, S. C., Che, H. Z., Chen, B., and Li, T.: Mesoscale modeling study of the interactions between aerosols and PBL meteorology during a haze episode in Jing–Jin–Ji (China) and its nearby surrounding region – Part 1: Aerosol distributions and meteorological features, Atmos. Chem. Phys., 15, 3257–3275, https://doi.org/10.5194/acp-15-3257-2015, 2015a.
Wang, H., Shi, G. Y., Zhang, X. Y., Gong, S. L., Tan, S. C., Chen, B., Che, H. Z., and Li, T.: Mesoscale modelling study of the interactions between aerosols and PBL meteorology during a haze episode in China Jing–Jin–Ji and its near surrounding region – Part 2: Aerosols' radiative feedback effects, Atmos. Chem. Phys., 15, 3277–3287, https://doi.org/10.5194/acp-15-3277-2015, 2015b.
Wang, J., Wang, S., Jiang, J., Ding, A., Zheng, M., Zhao, B., Wong, D. C., Zhou, W., Zheng, G., Wang, L., Pleim, J. E., and Hao, J.: Impact of aerosol–meteorology interactions on fine particle pollution during China's severe haze episode in January 2013, Environ. Res. Lett., 9, 094002, https://doi.org/10.1088/1748-9326/9/9/094002, 2014.
Wang, X, He, X., Miao, S., and Dou, Y.: Numerical simulation of the influence of aerosol radiation effect on urban boundary layer, Sci. China Earth Sci., 61, 1844–1858, https://doi.org/10.1007/s11430-018-9260-0, 2018.
Yang, X., Zhao, C., Zhou, L., Wang, Y., and Liu, X.: Distinct impact of different types of aerosols on surface solar radiation in China, J. Geophys. Res.-Atmos., 121, 6459–6471, https://doi.org/10.1002/2016JD024938, 2017.
Yang, Y. and Ren, R. C.: On the contrasting decadal changes of diurnal surface temperature range between the Tibetan Plateau and southeastern China during the 1980s–2000s, Adv. Atmos. Sci., 34, 181–198, https://doi.org/10.1007/s00376-016-6077-z, 2017.
Yu, H., Kaufman, Y. J., Chin, M., Feingold, G., Remer, L. A., Anderson, T. L., Balkanski, Y., Bellouin, N., Boucher, O., Christopher, S., DeCola, P., Kahn, R., Koch, D., Loeb, N., Reddy, M. S., Schulz, M., Takemura, T., and Zhou, M.: A review of measurement-based assessments of the aerosol direct radiative effect and forcing, Atmos. Chem. Phys., 6, 613–666, https://doi.org/10.5194/acp-6-613-2006, 2006.
Zaveri, R. A. and Peters, L. K.: A new lumped structure photochemical mechanism for large-scale applications, J. Geophys. Res., 104, 30387–30415, https://doi.org/10.1029/1999JD900876, 1999.
Zhai, S., Jacob, D. J., Wang, X., Shen, L., Li, K., Zhang, Y., Gui, K., Zhao, T., and Liao, H.: Fine particulate matter (PM2.5) trends in China, 2013–2018: separating contributions from anthropogenic emissions and meteorology, Atmos. Chem. Phys., 19, 11031–11041, https://doi.org/10.5194/acp-19-11031-2019, 2019.
Zhang, B., Wang, Y., and Hao, J.: Simulating aerosol–radiation–cloud feedbacks on meteorology and air quality over eastern China under severe haze conditionsin winter, Atmos. Chem. Phys., 15, 2387–2404, https://doi.org/10.5194/acp-15-2387-2015, 2015.
Zhang, Q., Quan, J., Tie, X., Li, X., Liu, Q., Gao, Y., and Zhao, D. L.: Effects of meteorology and secondary particle formation on visibility during heavy haze events in Beijing, China, Sci. Total Environ., 502, 578–584, https://doi.org/10.1016/j.scitotenv.2014.09.079, 2015.
Zhang, Q., Ma, Q., Zhao, B., Liu, X., Wang, Y., Jia, B., and Zhang, X.: Winter haze over North China Plain from 2009 to 2016: Influence of emission and meteorology, Environ. Pollut., 242, 1308–1318, https://doi.org/10.1016/j.envpol.2018.08.019, 2018.
Zhang, Y., Wen, X.-Y., and Jang, C.-J.: Simulating chemistry-aerosol-cloud-radiation-climate feedbacks over the continental U.S. using the online-coupled Weather Research Forecasting Model with chemistry (WRF/Chem), Atmos. Environ., 44, 3568–3582, https://doi.org/10.1016/j.atmosenv.2010.05.056, 2010.
Zhang, Y.-Z, Miao, S.-G., Dai, Y.-J., and Liu, Y.-H.: Numerical simulation of characteristics of summer clear day boundary layer in Beijing and the impact of urban underlying surface on sea breeze, Chin. J. Geophys., 56, 2558–2573, 2013.
Zhao, X., Li, Z., and Xu, J.: Modification and performance tests of visibility parameterizations for haze days, Environ. Sci., 40, 1688–1696, 2019.
Zheng, Y., Che, H., Xia, X., Wang, Y., Wang, H., Wu, Y., Tao, J., Zhao, H., An, J., Li, L., Gui, K., Sun, T., Li, X., Sheng, Z., Liu, C., Yang, X., Liang, Y., Zhang, L., Liu, C., Kuang, X., Luo, S., You, Y., and Zhang, X.: Five-year observation of aerosol optical properties and its radiative effects to planetary boundary layer during air pollution episodes in North China: Intercomparison of a plain site and a mountainous site in Beijing, Sci. Total Environ., 674, 140–158, https://doi.org/10.1016/j.scitotenv.2019.03.418, 2019.