the Creative Commons Attribution 4.0 License.
the Creative Commons Attribution 4.0 License.
 | 31 Oct 2020
Ice-nucleating particle concentrations of the past: insights from a 600-year-old Greenland ice core
Dominik Kleinhenz
Maria Hörhold
Tobias Erhardt
Sarah Richter
Frank Wilhelms
Hubertus Fischer
Martin Ebert
Birthe Twarloh
Damiano Della Lunga
Camilla M. Jensen
Joachim Curtius
Heinz G. Bingemer
Ice-nucleating particles (INPs) affect the microphysics in cloud and precipitation processes. Hence, they modulate the radiative properties of clouds. However, atmospheric INP concentrations of the past are basically unknown. Here, we present INP measurements from an ice core in Greenland, which dates back to the year 1370. In total 135 samples were analyzed with the FRIDGE droplet freezing assay in the temperature range from −14 to −35 ∘C. The sampling frequency was set to 1 in 10 years from 1370 to 1960. From 1960 to 1990 the frequency was increased to one sample per year. Additionally, a few special events were probed, including volcanic episodes. The typical time coverage of a sample was on the order of a few months. Historical atmospheric INP concentrations were estimated with a conversion factor, which depends on the snow accumulation rate of the ice core, particle dry deposition velocity, and wet scavenging ratio. Typical atmospheric INP concentrations were on the order of 0.1 L−1 at −25 ∘C. The INP variability was found to be about 1–2 orders of magnitude. Yet, the short-term variability from samples over a seasonal cycle was considerably lower. INP concentrations were significantly correlated to some chemical tracers derived from continuous-flow analysis (CFA) and ion chromatography (IC) over a broad range of nucleation temperatures. The highest correlation coefficients were found for the particle concentration (spherical diameter dp > 1.2 µm). The correlation is higher for a time period of seasonal samples, where INP concentrations follow a clear annual pattern, highlighting the importance of the annual dust input in Greenland from East Asian deserts during spring. Scanning electron microscopy (SEM) analysis of selected samples found mineral dust to be the dominant particle fraction, verifying their significance as INPs. Overall, the concentrations compare reasonably well to present-day INP concentrations, albeit they are on the lower side. However, we found that the INP concentration at medium supercooled temperatures differed before and after 1960. Average INP concentrations at −23, −24, −25, −26, and −28 ∘C were significantly higher (and more variable) in the modern-day period, which could indicate a potential anthropogenic impact, e.g., from land-use change.
- Article
(4344 KB) - Full-text XML
-
Supplement
(3984 KB) - BibTeX
- EndNote


Ice cores offer an unparalleled opportunity to study atmospheric conditions of the past. The physicochemical state of the atmosphere is recorded and preserved for many atmospheric constituents in the form of entrained gas bubbles and aerosol particles. Fittingly, ice core archives have been dubbed a window into the past by scientists and media alike. Over the past decades, many different parameters and proxies have been measured in ice cores using a diverse set of techniques from a variety of scientific fields. Unfortunately, heterogeneous ice nucleation, which is of primary importance to atmospheric ice formation and therefore very relevant to polar snow accumulation, has not received much attention in ice core sciences. To date, there has been only a single study to analyze the concentration of ice-nucleating particles (INPs) from ice cores (Hartmann et al., 2019). Yet, this parameter is vitally important from an atmospheric science and climate-modeling perspective, since it strongly influences cloud formation and modulates precipitation processes. Mülmenstädt et al. (2015) confirmed that the majority of global precipitation is produced in clouds involving the ice phase. Moreover, INPs influence the phase of a cloud and in turn interact with radiation processes (Lohmann, 2015).
There are a number of open questions regarding the nature of INPs: their geographical and vertical distribution, seasonal variation, and the types of aerosol particles that contribute to their population even in today's atmosphere. Hence, it is hardly surprising that very little knowledge exists about the preindustrial concentrations and sources of INPs. Carslaw et al. (2017) reviewed the state of aerosols in the preindustrial atmosphere. However, they did not discuss this specific matter in depth, because “our understanding of global ice-nucleating particles in terms of particular aerosol components is only just emerging” (Carslaw et al., 2017). They conclude that a potential change in INP concentrations since the preindustrial period remains entirely possible, as are related impacts on cloud formation, precipitation processes, and the radiation budget. Also, knowledge about the preindustrial baseline of cloud-active aerosols is essential for climate modelers, as – together with the scattering and absorption properties of the aerosol – it constrains the baseline upon which the current radiative forcing by anthropogenic aerosols is calculated. In fact, climate models are highly sensitive to the preindustrial aerosol conditions (Andreae et al., 2005; Carslaw et al., 2013). As a consequence, a lack of knowledge of the preindustrial aerosol state leads to large uncertainties when radiative forcings are estimated.
Many modeling studies exist, which suggest that general aerosol characteristics have changed significantly since preindustrial times, such as aerosol composition, number concentration, size distribution, and mixing state (e.g., Stier et al., 2006; Tsigaridis et al., 2006; Hamilton et al. , 2014). Evidently, this trend is implied in ice core observational data for black carbon (McConnell et al., 2007; Kaspari et al., 2011) and various other trace elements and aerosols (Kaspari et al., 2009; Carslaw et al., 2017, and references therein). Yet, the significance of anthropogenic pollution particles to atmospheric ice nucleation is still in question. Recently, Zhao et al. (2019) investigated the effects of pollution aerosol on the ice phase in moderate and strong convective systems in a top-down approach using a combination of satellite observations and model simulations. They present evidence that in the moderate convection case, where heterogeneous ice nucleation is more relevant, the ice particle effective radius is increased, indicating that continental pollution aerosol may in fact contain a considerable fraction of INPs. On the other hand, further experimental studies suggest that most anthropogenic aerosol particles are typically poor INPs. For example, Chen et al. (2018) found that the heavy air pollution of Beijing did not affect the INP concentration in this urban setting in the investigated temperature range from −6 to −25 ∘C. Overall, there are still few studies available on the ice nucleation efficiency of anthropogenic aerosol and some of the presented evidence is conflicting. Although pure pollution aerosols are considered rather inactive INPs, this does not per se mean that the INP population as a whole has not changed at all over the last centuries. On the contrary, it seems rather likely that certain particles with ice-nucleating potential may in fact be more abundant in today’s atmosphere. Biomass burning aerosol is probably the most uncertain and least likely contributor to anthropogenic INPs. Both the magnitude and sign of a potential anthropogenic change in global fire emissions since the preindustrial period is the subject of active scientific debate (Hamilton et al., 2018, and references therein). Moreover, the literature is still divided about the ice-nucleating capability of aerosol particles from biomass burning (or soot in general) (Twohy et al., 2010; McCluskey et al., 2014; Umo et al., 2015; Grawe et al., 2016; Levin et al., 2016; Ullrich et al., 2017; Grawe et al., 2018; Kanji et al., 2020). Anthropogenic metal-enriched particles from industrial processes (e.g., from coal combustion, mining, smelting) have been consistently found in the Arctic during Arctic haze events (e.g., Shaw, 1995). Such heavy metals appear regularly as a small fraction of ice residuals in field experiments (Ebert et al. , 2011; Eriksen Hammer et al. , 2018). The most likely candidate for INPs, however, may actually be soil or desert dust particles from areas that may have been subject to land-use change and desertification since the preindustrial times. The IPCC Special Report Climate Change and Land (IPCC, 2019) estimates that 12 %–14 % of today's global ice-free land surface are croplands. Intensive and extensive pasture land as well as savannahs and shrublands used for livestock farming make up another 30 %–47 %. Due to the expansion of these agricultural areas as well as the practices themselves, the erosion of these agricultural soils is increasing. In fact, it is estimated that soil erosion is currently between 10 and 100 times higher (depending on tillage) than the natural soil formation rate (IPCC, 2019). Eroded soil particles may enter the atmosphere and potentially affect microphysical cloud formation processes. Indeed, soil dust, in part derived from agricultural areas/practices, has been proven to be an active INP in many studies (Conen et al., 2011; Tobo et al., 2014; O'Sullivan et al., 2015; Hill et al., 2016; Steinke et al., 2016). Furthermore, the range and intensity of desertification, which is defined as the land degradation of arid, semiarid and dry sub-humid areas (i.e., drylands), have increased in the past several decades (Shukla et al., 2019). According to the IPCC Special Report, drylands currently cover about 46 % of the global land area, of which approximately 9 % were identified as hotspots of desertification. Especially during droughts such areas are susceptible to higher dust storm activity, which may introduce more mineral dust to the atmosphere. For example, Ganor et al. (2010) found the number of events that transport African dust over the eastern Mediterranean to increase significantly over the years 1958–2006. Concerning Greenland, isotopic studies showed that the main sources of mineral dust aerosol in both glacial times and during the Holocene are natural Chinese desert areas, and in particular the Taklamakan Desert (Svensson et al., 2000; Bory et al., 2003); however a recent increase in mineral dust concentration from these areas due to anthropogenic impacts is not documented. Mineral dust from China, and the Taklamakan Desert in particular, has been characterized in several laboratory ice nucleation studies (Field et al., 2006; Niemand et al., 2012; Boose et al., 2016; Ullrich et al., 2017; Paramonov et al., 2018), which revealed a relatively high ice active site density in the temperature range below −25 ∘C, comparable to other natural deserts such as the Sahara (e.g., Niemand et al., 2012; Boose et al., 2016).
Hartmann et al. (2019) were the first to estimate the concentration of INPs from two Arctic ice cores from Lomonosovfonna, Svalbard (78.82∘ N, 17.43∘ E), and Summit, Greenland (72.58∘ N, 37.64∘ W), using the droplet freezing devices Leipzig Ice Nucleation Array (LINA, 90 × 1 µL) and Ice Nucleation Droplet Array (INDA, 96 × 50 µL). They analyzed 69 samples in total (42 from Svalbard and 27 from Greenland). Svalbard samples were subdivided into multiyear samples (six samples in 2–6-year resolution) and sub-year samples (36 samples with a resolution of some months), which covered the same time periods as the multiyear samples. The investigated time periods were approximately 1480, 1720, 1780, 1800, and 1950. Greenland samples covered the time from 1735 to 1989 with a resolution of about 2–5 years per sample. Cumulative INP data are presented mainly at temperatures of −10, −15, and −20 ∘C. Hartmann et al. (2019) observed no long-term trend in the INP concentration. Furthermore, they found the “short-term” variability of INP concentrations from adjacent sub-year samples to be as large as or even larger than the total variability of the complete data set. In their closing remarks, they recommend that future studies focus on creating a continuous record of ice core INP concentrations for the last few centuries. Further, they suggest including a simultaneous analysis of INP-related chemical and biological substances and analyzing ice cores from other Arctic locations to gain knowledge about the spatial distribution of INP concentrations over time.
Here, we present INP data from an ice core from northeastern central Greenland (B17, 72.25∘ N, 37.62∘ W) that dates back to about 1370 (Weißbach et al., 2016). The ice core was drilled in the framework of the North Greenland Traverse (NGT, 1993–1995) and reaches a depth of about 100 m. In total 135 samples were measured with the FRIDGE instrument (FRankfurt Ice Nuclei Deposition FreezinG Experiment; Klein et al., 2010; Schrod et al., 2016) in its droplet freezing mode (Hiranuma et al., 2015; DeMott et al., 2018; Hiranuma et al., 2019). Samples were selected in regular intervals of 10 years to cover the whole period of the ice core. Most of these discrete samples typically integrate over a time period of half a year. Furthermore, sampling frequency was increased to one sample per year between 1960 and 1990 to establish a statistically sound “modern-day” reference period. Moreover, certain samples were selected based on extraordinarily high concentrations in their “dust” concentration and/or peaks in the electrolytic conductivity, where these peaks are most often caused by H2SO4 (from volcanic eruptions). Prior to our ice nucleation measurements, the ice core was analyzed for dust, conductivity, and soluble particle concentrations of Ca2+, Na+, NH, and NO using continuous-flow analysis (CFA) (Kaufmann et al., 2008) at the University of Bern and for Ca2+, Na+, NH, NO, K+, Mg2+, F−, MSA−, Cl−, Br−, and SO using ion chromatography (IC) at the Alfred Wegener Institute for Polar and Marine Research (AWI), Bremerhaven. Finally, we analyzed a high-resolution period with almost monthly resolution (1463–1464, N=12) to investigate a potential seasonal variation in the INP concentrations.
2.1 Ice core NGT B17
The ice core B17 was drilled during the NGT in 1993–1995 by the Alfred Wegener Institute as one of 13 ice cores along the traverse. The drill site is located east of the main ice divide in central Greenland (72.25∘ N, 37.62∘ W, 2820 m a.s.l.). The ice core has a total depth of 100.8 m, a depth which corresponds to the year 1363 CE. More information about the characteristics of B17 and the other NGT ice cores can be found in Weißbach et al. (2016). Weißbach et al. (2016) present and discuss the density profile, the water accumulation rate, and the ratio of stable water isotopes (δ18O) of the ice cores B16–B23 and B26–B30. Complementary chemical profiles of selected NGT ice cores are presented in Fischer et al. (1998) and Bigler et al. (2002). Recently, Burgay et al. (2019) introduced Fe2+ as a potential new proxy to identify volcanic events by presenting B17 measurements using a chemiluminescence method. The ice core was dated on the basis of identified volcanic layers (Weißbach et al., 2016), interpolating between these tie points, supported by measurements of stable water isotopes.
2.2 Sample preparations and overview of measurements
After the B17 core was drilled in the early 1990s, it was cut into pieces of 1 m each and stored at −25 ∘C in cold storage at AWI. In 2018, a longitudinal subsection of the ice core with a cross section of 35 mm × 35 mm was cut from the whole length of the core. The pieces of the ice core were transported in a frozen state to the University of Bern, where they were continuously melted using a well-established decontamination technique, which is the first step in the continuous-flow analysis (CFA) (Kaufmann et al., 2008) (Sect. 2.3). The decontaminated meltwater flow was then split between the online chemical analysis and a fraction, which was sampled directly into numbered clean vials of discrete aliquots for offline ion chromatography (IC) measurements (Sect. 2.4). Each vial was filled with approximately 1.5–8 mL of sample water, translating to 4–20 cm of core depth. Further, depending on the exact sampling resolution this corresponds to a time resolution of about 1–10 data points per year. Subsequently, the vials were refrozen and shipped to AWI to measure the concentration of major ions in order to complement the CFA measurements. As the IC analysis required a few microliters only, the vials still contained most of the sample water after the measurements. A part of these samples were later selected for the ice nucleation analysis in this study (Sect. 2.5). These samples were transported from Bremerhaven to Frankfurt in a small insulated PP-foam cooling box with additional cold packs. Then, samples were stored inside a freezer (Waeco Coolmatic CF-40) at about −17 ∘C. Hence, it was ensured that samples remained frozen at all times in our laboratory. However, sample vials may have been subject to temperatures between 0 ∘C and room temperature for up to some tens of hours in total (during repeated cycles of melting, storage, and refreezing; non-INP measurements; and transport, etc.). Prior to the ice nucleation measurement (Sect. 2.6), each sample was slowly melted over night in a refrigerator at about 6 ∘C. After the ice nucleation analysis the samples were refrozen. Selected samples that were previously analyzed for their INP activity, were transported to TU Darmstadt for chemical and morphological single-particle analysis using a scanning electron microscope (SEM) (Sect. 2.7).
2.3 Online chemical analysis
For the CFA analysis the subsections of the ice core were melted continuously in a way that separated meltwater from the potentially contaminated outside of the ice from the clean meltwater from the inside. This decontamination technique is effective and even gastight for solid ice (density > 0.82 kg L−1). However, we cannot completely exclude some minor contamination for the relatively porous firn, which is found at the top of the ice core, as it is possible that meltwater is drawn upwards by capillary forces and that surface contaminants may be mixed in here.
A fraction of the clean meltwater stream was used to feed a range of detectors to determine the concentrations of ions in the water using purpose-built spectrophotometric methods (Ca2+, Na+, NH, and NO), electrolytic conductivity, and the concentration of insoluble particles (> 1.2 µm) as detailed in Kaufmann et al. (2008) and references therein. All of these measurements were performed continuously during the melting of the ice core section to produce a continuous high-resolution record. Typical analytically limited resolutions were in the range of 0.5–1.0 cm governed by the smoothing of the individual detection methods.
2.4 Ion chromatography
The vials containing the discrete decontaminated aliquots of the ice core were melted at room temperature prior to the IC analysis. The vials were then placed into an autosampler to be measured. Simultaneous analysis of anions and cations was performed using a two-channel Dionex ICS 5000+ reagent-free HPIC system (Thermo Fisher). For the anion (cation) determination the Dionex IonPac AG18-Fast-4µm guard column (IonPac CG12A-5µm column) and the Dionex IonPac AS18-Fast-4µm analytical column (IonPac CS12A-5µm column) were used. The measurements were calibrated with seven internal standards, prepared from available anion and cation standards. Premixed external standards were used for quality control. In this study, the IC provided a quantitative analysis of the concentration of Ca2+, Na+, NH, NO, K+, Mg2+, F−, MSA−, C1−, Br−, and SO.
2.5 Sample selection
Figure 1a shows the temporal distribution of the selected samples for the ice nucleation experiment (total N=135, 7 % of all samples) throughout the ice core (the complete list of samples is presented in Table S1). We placed a strong emphasis on having a data set with quasi-consistent time intervals for our samples (approximately decadal interval). We considered these time intervals to be both meaningful and feasible. Furthermore, our sample selection strategy was intended to consider the preindustrial INP concentration vs. the INP concentration of the recent past (1960–1990). Therefore, the sample frequency was increased to about one sample per year in the latter time period to potentially enhance the statistical significance. Whenever possible, we selected samples that theoretically represented the same season(s). However, due to the uncertainty in the ice core dating, some of the variability in the INP concentration may be attributed to seasonal differences.
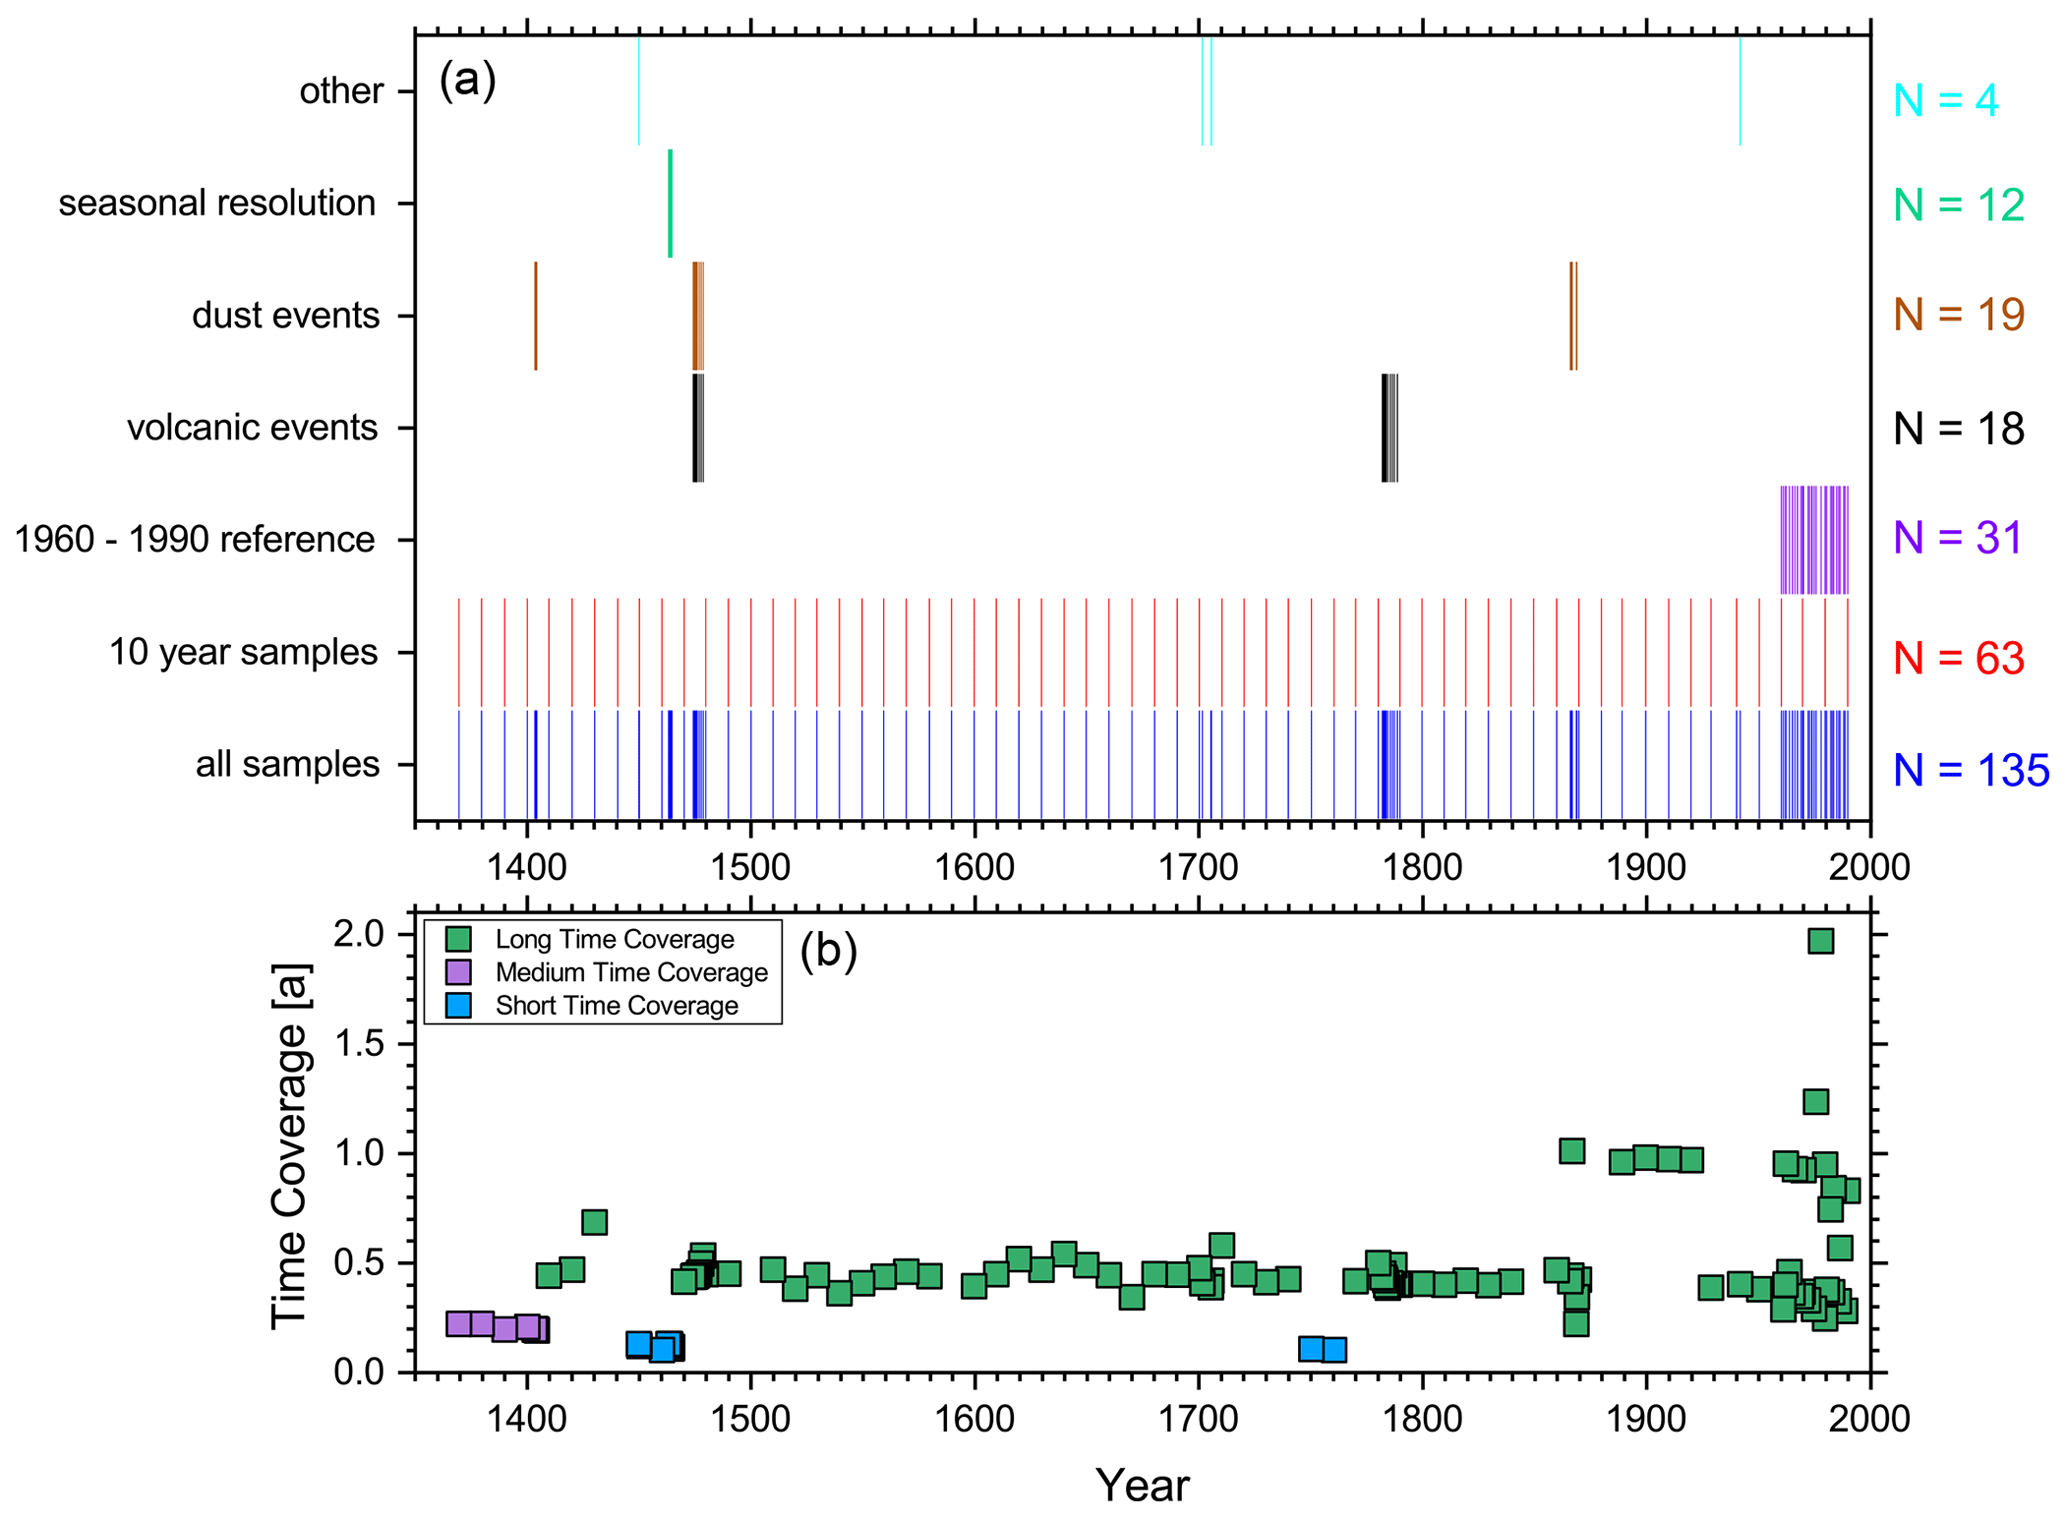
Figure 1(a) Temporal distribution and number of ice nucleation samples for different groups (colors). (b) Time coverage of the samples selected for assessing IN properties. The different colors represent a broad grouping into samples averaging over short, medium, and long time periods.
Moreover, we selected some samples according to peak values in the high-resolution CFA measurements. Samples labeled “dust event” include a respective sample that featured a peak in the high-resolution signal of particles with spherical diameters larger than 1.2 µm, as well as a couple samples collected before and after it. Due to the episodic nature of such an event and the fact that the INP samples were automatically collected as multi-month means, the sample containing the high-resolution peak signal does not necessarily need to have an extraordinarily high average value itself. Similarly, peak samples in the high-resolution signal of conductivity were selected. Large peaks in the electrolytic conductivity record are most often derived from high sulfuric acid deposition in the ice after volcanic eruptions. For example, one group of these “volcanic event” samples can be unequivocally ascribed to the Laki eruption in 1783/84. The eruption of Grímsvötn (Laki) is the best‐characterized historical large volume basaltic fissure eruption in Iceland. The 8-month-lasting Laki eruption occurred from a 27 km long volcanic fissure in the Grímsvötn volcanic system. It emitted ≈15 of lava, 0.4 km3 of tephra, an estimated 122 Tg of SO2, and other gases and trace metals (Thordarson and Self, 1993, 2003; Sigl et al., 2018). Lastly, 12 adjacent samples with a near-monthly resolution were measured in order to estimate the “short-term” variability of the data set and to check for a possible seasonal variation in the INPs (1463–1464).
Figure 1b gives the temporal coverage of each individual analyzed sample. The representative time of a certain sample is given by its lengths, which is estimated by calculating the average time difference between the sample before and after it. The majority (63 %) of the analyzed samples averaged over a time period of 6 ± 2 months. About a quarter of the samples (26 %) averaged over a shorter time and 11 % over a longer time.
2.6 Ice nucleation analysis
The ice nucleation measurements were performed with the FRIDGE instrument (Klein et al., 2010; Schrod et al., 2016). FRIDGE has two operational modes. In its “standard mode” aerosol particles are activated to ice crystals by diffusion of water vapor at supercooled temperatures and near-vacuum conditions (Schrod et al., 2017; DeMott et al., 2018; Thomson et al., 2018; Marinou et al., 2019). In this paper however, we solely used FRIDGE in the droplet freezing mode (Hiranuma et al., 2015; Boose et al., 2016; DeMott et al., 2018; Hiranuma et al., 2019). We focused on the droplet freezing assay (DFA), because (1) immersion freezing is considered to be the most atmospherically relevant process in heterogeneous ice nucleation for mixed-phase clouds (e.g., Murray et al., 2012), (2) the use of a DFA seems to be the natural choice considering that the aerosol particles are already immersed within the ice core meltwater, (3) the technique requires only a few milliliters of sample water, and (4) other methods would likely introduce further contamination sources through the particle generation setup (e.g., atomizer).
The performance of the FRIDGE instrument was tested during the Fifth International Workshop on Ice Nucleation – part 2 (FIN-02, DeMott et al., 2018). In this large-scale laboratory campaign 21 different INP counters were intercompared at the Aerosol Interaction and Dynamics in the Atmosphere (AIDA) facility of the Karlsruhe Institute for Technology (KIT). FRIDGE agreed generally very well with the other instruments (especially for the immersion freezing method) for the various investigated aerosol types (including natural mineral dusts, dust components, and a biological material).
During a measurement of an ice core sample 65 droplets of 2.5 µL ± 5 % each were placed homogeneously at random onto a clean silanized Si substrate of 47 mm diameter on the cold table in the FRIDGE chamber. The droplets were pipetted directly from the sample vial and were semiautomatically dispensed using an Eppendorf Multipette E3 with fresh Eppendorf tips of the highest level of purity (Combotips advanced, Biopur grade, 0.1 mL). Temperature was quickly decreased at first in the range from 14 to 0 ∘C and then slowly lowered at a constant cooling rate of 1 ∘C per minute until all droplets were frozen. The temperature ramp was implemented by a PID-controlled Peltier element. A cryostat (Lauda, Ecoline Staredition RE110; ethanol coolant) was used to dissipate the heat from the Peltier element. Temperature was measured by a PT-100 sensor (precision ± 0.2 ∘C), which was attached to the surface of the wafer. The measurement cell was continuously flushed with synthetic air at a flow of 1 L min−1 to prevent condensation and riming and to minimize contamination from the laboratory environment during the measurement. The freezing of droplets was observed by a charge-coupled device (CCD) camera (AVT Oscar F-510C 2/3′′). A droplet changes its brightness significantly during the freezing event: droplets are nearly translucent when liquid but are opaque when frozen. LabView software automatically detected the moment of freezing, recorded the corresponding temperature, and saved the images every 10 s. The final results were always double-checked by the operator. After all droplets were frozen, the substrate was heated up and cleaned and the process was repeated twice with new droplets. In total, the freezing temperatures of 195 individual droplets were determined for each ice core sample (three runs with 65 droplets). The cumulative INP concentration per milliliter of ice as a function of temperature (NINPice(T)) was calculated by the well-established Vali (1971) equation:
Here, Vd is the volume of each droplet, nfrozen is the number of droplets that are frozen at temperature T, and ntotal is the total number of droplets of each freezing experiment. With the aforementioned experimental values for these variables we are typically able to resolve INP concentrations between 2 and 2000 mL.
Due to the nature of the experiment, droplets freeze in a different temperature range, leading to a slightly inconsistent data set. This means that while some samples have measurement data at a warm temperature, others will not. When we calculate average concentrations, for example, we set the concentration of those non-active samples to zero, knowing that the actual concentration is somewhere between zero and the lowest resolvable concentration (2 per milliliter of ice). The same issue arises at lower temperatures. For some samples all droplets are frozen before reaching a certain temperature. In those cases the concentration was set to the highest resolvable concentration (2000 per milliliter of ice). It should be noted that for some cases the real INP concentration might actually be substantially higher due to the exponential behavior in ice nucleation. The presented average concentrations (Sect. 3) should therefore be considered a lower estimate.
2.7 Scanning electron microscopy
We selected three individual samples (years: 1977, 1680, and 1630) to be analyzed with scanning electron microscopy (SEM) to gain information about the chemical signature of deposited aerosol particles. The 1977 sample was selected exemplarily as an active modern-era sample. The 1680 sample was chosen for its average INP concentration at −25 ∘C, as well as being in the middle of the time series. The 1630 sample was analyzed with SEM, because it had an extraordinarily high INP activity at comparably warm temperatures.
By use of a Quanta 200 FEG environmental scanning electron microscope equipped with an EDAX Genesis energy-dispersive X-ray microanalysis system (EDX), the elemental composition of individual aerosol particles as well as a rough size distribution can be determined.
For this purpose, the samples were melted and subsequently filtered using a 25 mm Nuclepore membrane filter with 0.4 µm pore size and a filter flask at vacuum provided by a water jet. The area of filtration was about 5 cm2, ensuring that particles were concentrated on a relatively small area, which is advantageous to the SEM analysis.
For SEM–EDX analysis on each filter some 100 rectangular fields of about 100 µm × 100 µm in the center of the filter were scanned, and for all detected particles the size was determined and an EDX analysis (acceleration voltage: 20 kV; spot size: 4; acquisition time: 10 s; working distance: 10 mm) was performed. Using this procedure, particles down to approximately 250 nm were detected. Smaller particles will often be overlooked. This is also true for larger carbonaceous particles, because of their poor contrast on the polycarbonate filter.
2.8 Background freezing and uncertainties related to the INP measurements
There are numerous possible sources of contamination in a typical droplet freezing assay, which may cause a droplet to freeze before the homogenous limit. The potential contamination due to the analytical procedure may be evaluated by establishing a “background” from the freezing of “pure” water droplets. Polen et al. (2018) reviewed several droplet freezing techniques, summarized potential contamination sources, and advised on how to report background freezing. In general, contamination may arise from particles in the pure water itself, substrate interferences, or the environment that is in contact with the droplets. However, it is rather difficult to assess how much each of these categories contributes to the freezing spectrum of a specific background sample (Polen et al., 2018). We will now look at each of these factors and describe how exactly they relate to the actual ice nucleation experiment of this paper.
First, the surface of the substrate onto which the droplets are placed can induce freezing. It is well known that the contact angle of the droplets influences the freezing process. Furthermore, microscopical cavities, scratches, cracks, or other surface defects, as well as actual particles on the surface of the substrate may affect the freezing temperature of the droplets. In our setup, we use custom-cut silicon wafer as substrates. The wafers were regularly coated with dichlorodimethylsilane in a vacuum desiccator to create a thin hydrophobic layer on the surface of the substrate. The silanization has several positive effects. First, it “seals off” microscopic surface defects on the wafer. Second, the hydrophobic layer prevents condensation and rime formation and thereby limits the effects of a possible Wegener–Bergeron–Findeisen process. The Si substrates are stored in PetriSlide containers before use. Finally, the surface of a wafer is cleaned thoroughly by hand with pure non-denatured ethanol (Rotipuran, > 99.8 %, Carl Roth) immediately before and after each measurement run.
Obviously, the environment surrounding the sample may affect its freezing temperature. Specifically, the vials in which the water is stored and the tips of the pipette may introduce contamination. Furthermore, the droplets can collect particles from laboratory air during a measurement, which may nucleate ice artificially. Our measurement cell is continuously flushed with particle-free, dehumidified synthetic air at a constant flow rate of 1 L min−1. This largely prevents the droplets from coming in contact with aerosols from the laboratory and inhibits water condensation and growth of frost.
Lastly, we consider the pure water itself, which is used as a medium to establish the background signal, as a source for contamination. No matter how pure a manufacturer certifies its water to be, at very cold temperatures even a single contaminant particle inside a droplet might initiate the ice nucleation process and cause the droplet to freeze. For purposes of background measurements we used the pure water Rotipuran ultra (Carl Roth). However, in the analysis of droplets from the ice core the samples are not in contact with the pure water. Unfortunately, this results in an intrinsic problem of the background evaluation of our ice core measurements. Depending on the relative importance of the role of the reference water in the background measurement, our background freezing spectrum is more or less representative of the ice core freezing spectra. In other words, if non-water contamination effects dominate the freezing in the background measurement, the respective freezing spectrum could be adapted for the ice core measurements. If the majority of droplets in a background measurement freeze, however, due to contaminants in the reference water, the background freezing curve only serves as an upper limit, meaning that the ice core measurements have an unspecified better background than what the background freezing spectrum would suggest. In fact, we observed some samples from the ice core to freeze as late as our typical background measurements (e.g., purple line in Fig. 2), which suggests that at least some contamination is introduced by the ultrapure water itself. Therefore, we chose not to subtract the background freezing spectrum from our measurements as is common practice. Instead we give a range of temperatures, where no or only little interference is expected due to background contamination. Figure 2 shows typical background freezing spectra compared to the average freezing spectrum of the ice core measurements. Accordingly, results of freezing temperatures colder than −30 ∘C are likely to be influenced by a reasonable amount of background freezing (frozen fraction 24 ± 10 %) and should be interpreted with care. Only little background influence is expected, however, for temperatures warmer than −28 ∘C (frozen fraction 9 ± 5 %).
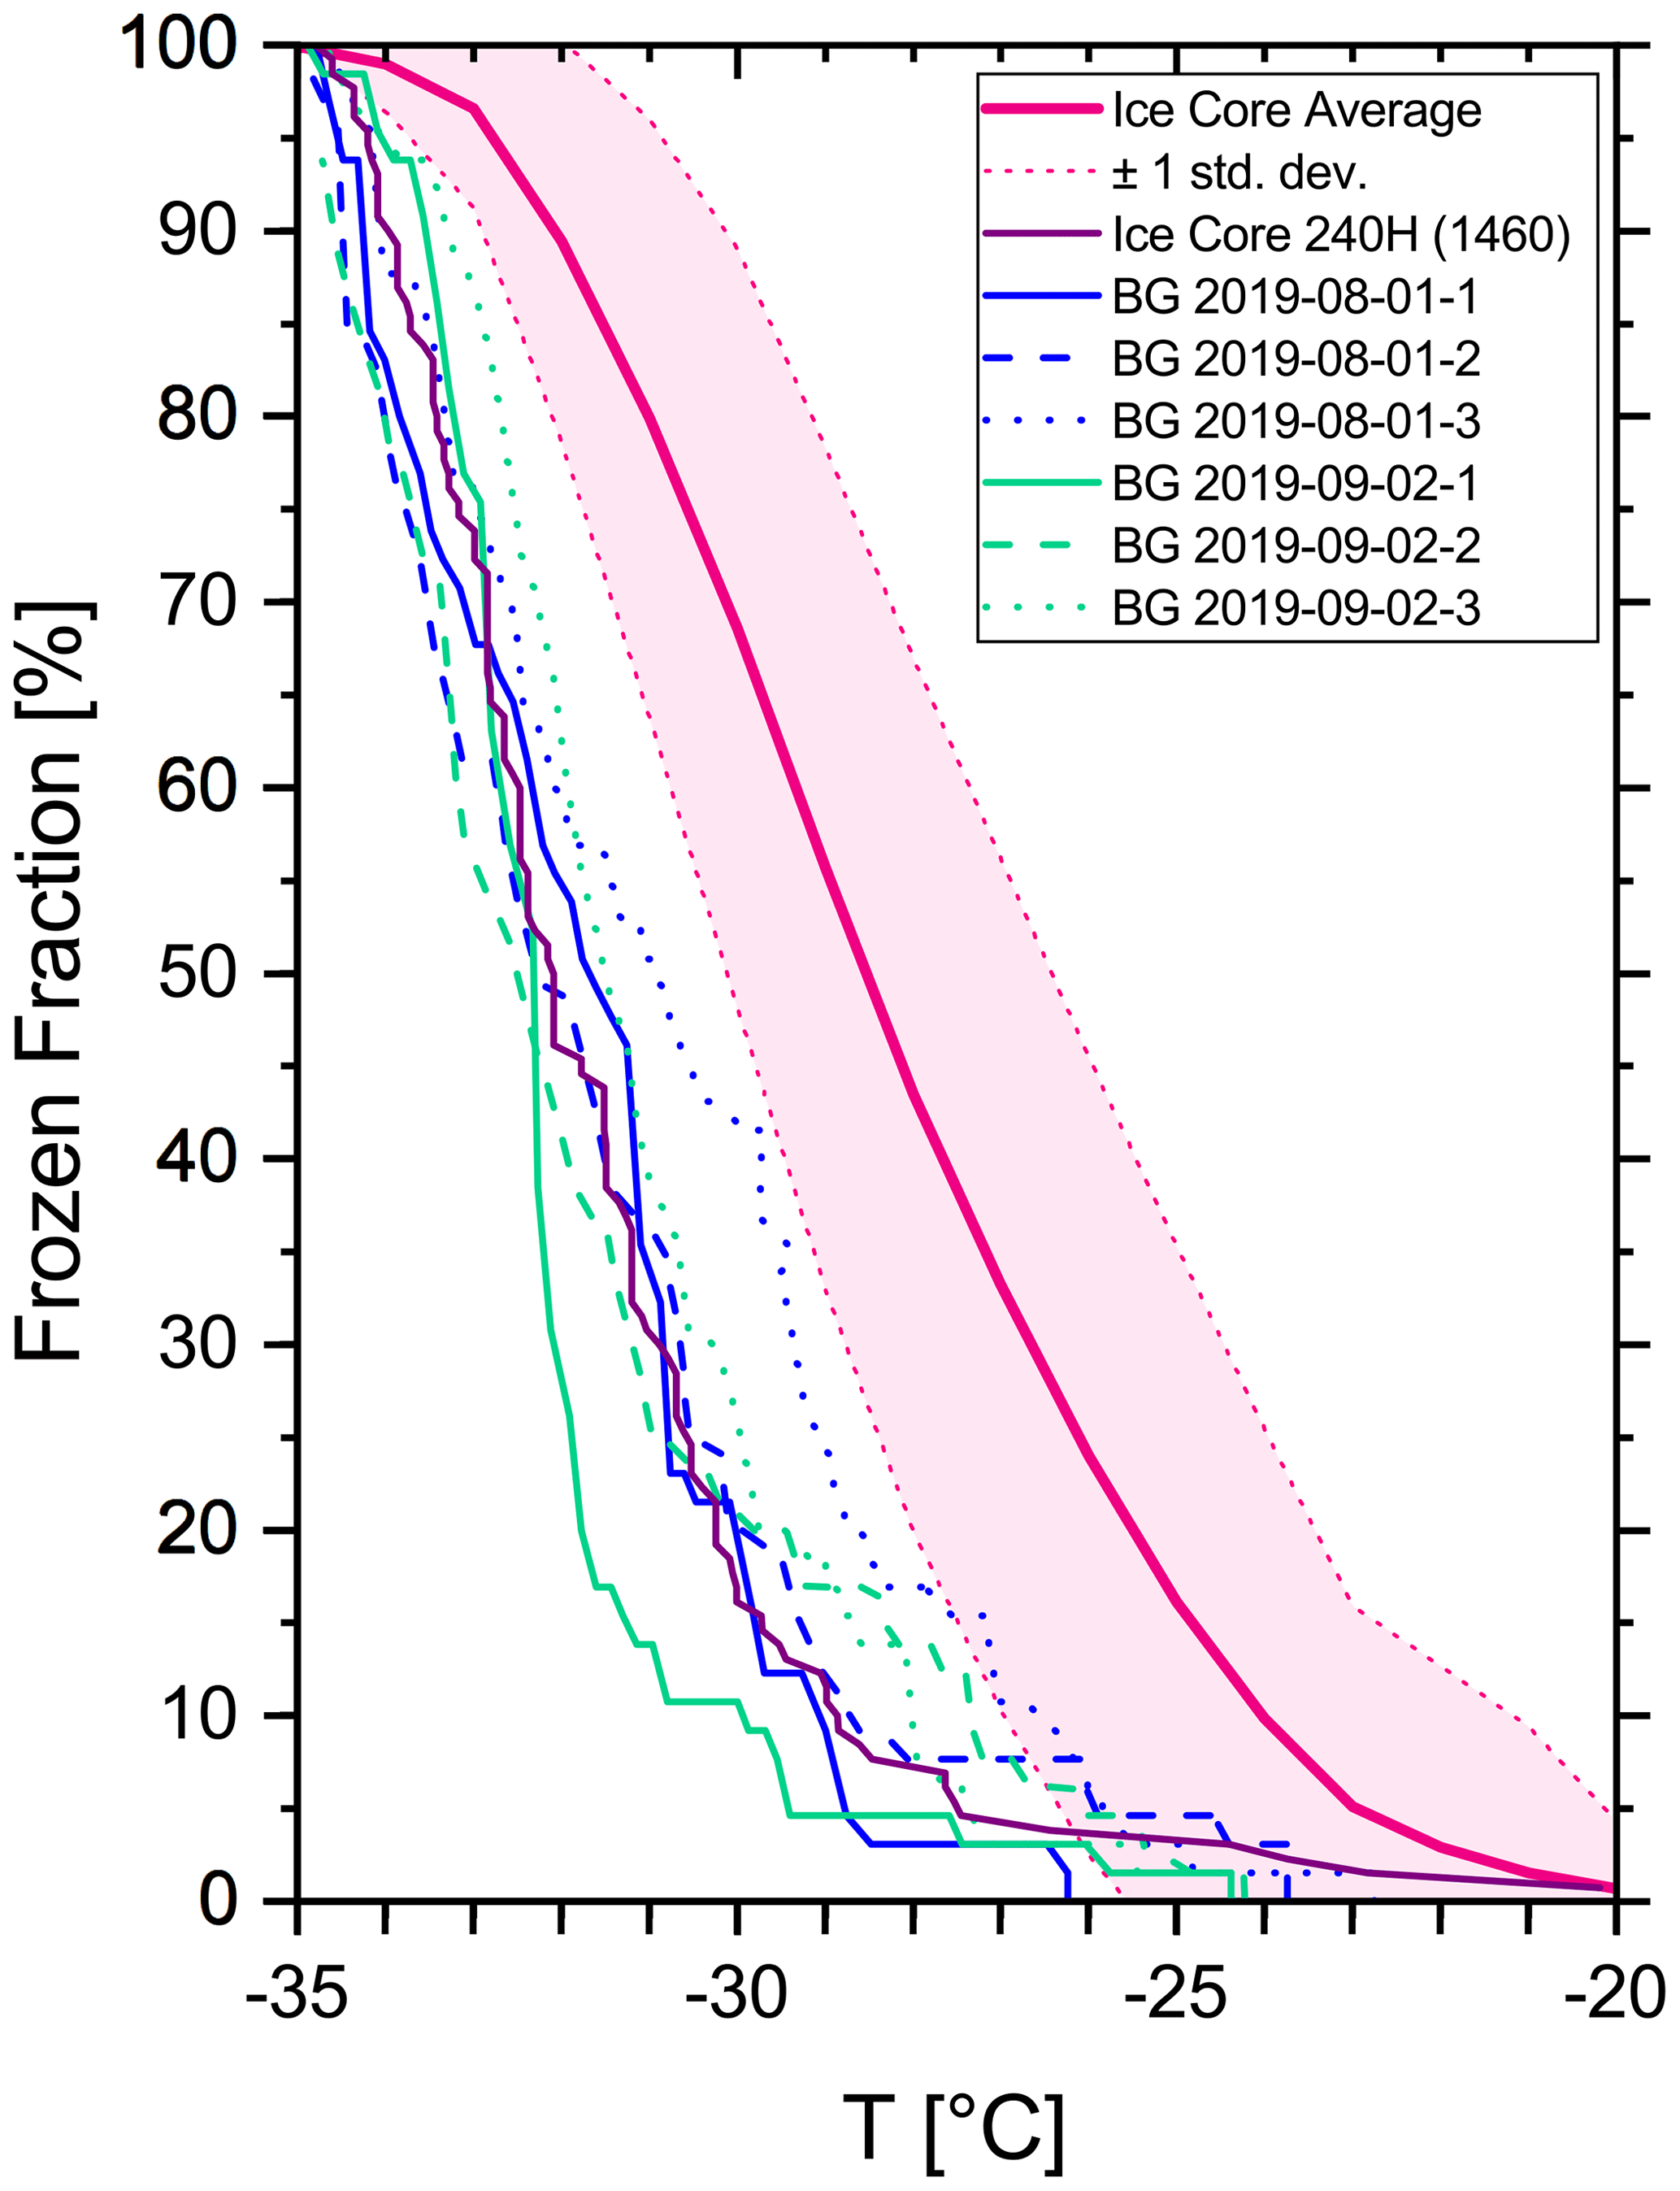
Figure 2Freezing spectrum of background measurements (blue and green lines) compared to the average freezing spectrum from all ice core samples (pink line) ± 1 standard deviation (pink dotted lines). The purple line shows the least active ice core sample for comparison.
Moreover, we tested whether the freezing temperature of an individual droplet can be reproduced. For 120 (4 × 30) droplets the freezing temperatures T1 and T2 were individually measured during two subsequent freezing cycles (Fig. 3). Overall, we found that over a wide range of temperatures the freezing temperature is a property of each individual droplet and can be reproduced fairly accurately. The temperature difference between two subsequent freezing cycles of the same droplet was below ± 0.5 ∘C for 79 % of the cases. Half of the droplets showed a temperature difference of ≤ 0.23 ∘C. Only 5 of 120 droplets differed by more than ± 1 ∘C in their nucleation temperature. Furthermore, the resulting slope of the data was close to unity (1.016) with a strong linear correlation (R2=0.96). These results suggest that (a) temperature uncertainty in FRIDGE is relatively low, (b) repeated cycles of freezing and defreezing of an ice core sample do not greatly affect its ice nucleation properties in the presented temperature range, and (c) this test sample showed a mostly deterministic ice nucleation behavior. However, recent studies indicate that sample storage (i.e., storage temperature) significantly affects the ice nucleation activity of fresh precipitation samples in the range of −7 to −19 ∘C (Beall et al., 2020). For example, samples stored at room temperature lost on average 72 % of their INPs compared to the freshly analyzed samples. An average INP loss of 25 % was still observed, even when samples were stored at −20 ∘C. Storage time did only weakly affect the INP concentrations. Therefore, based on this study a loss of INP activity on the order of a factor of 2–5 is possible if not likely for the ice core measurements presented here. Furthermore, it is likely that the warmer end of INPs were disproportionally affected by these disturbances, while cold-temperature INPs were likely more robust. However, as all the samples experienced the same sample history, relative changes within the ice core can still be interpreted.
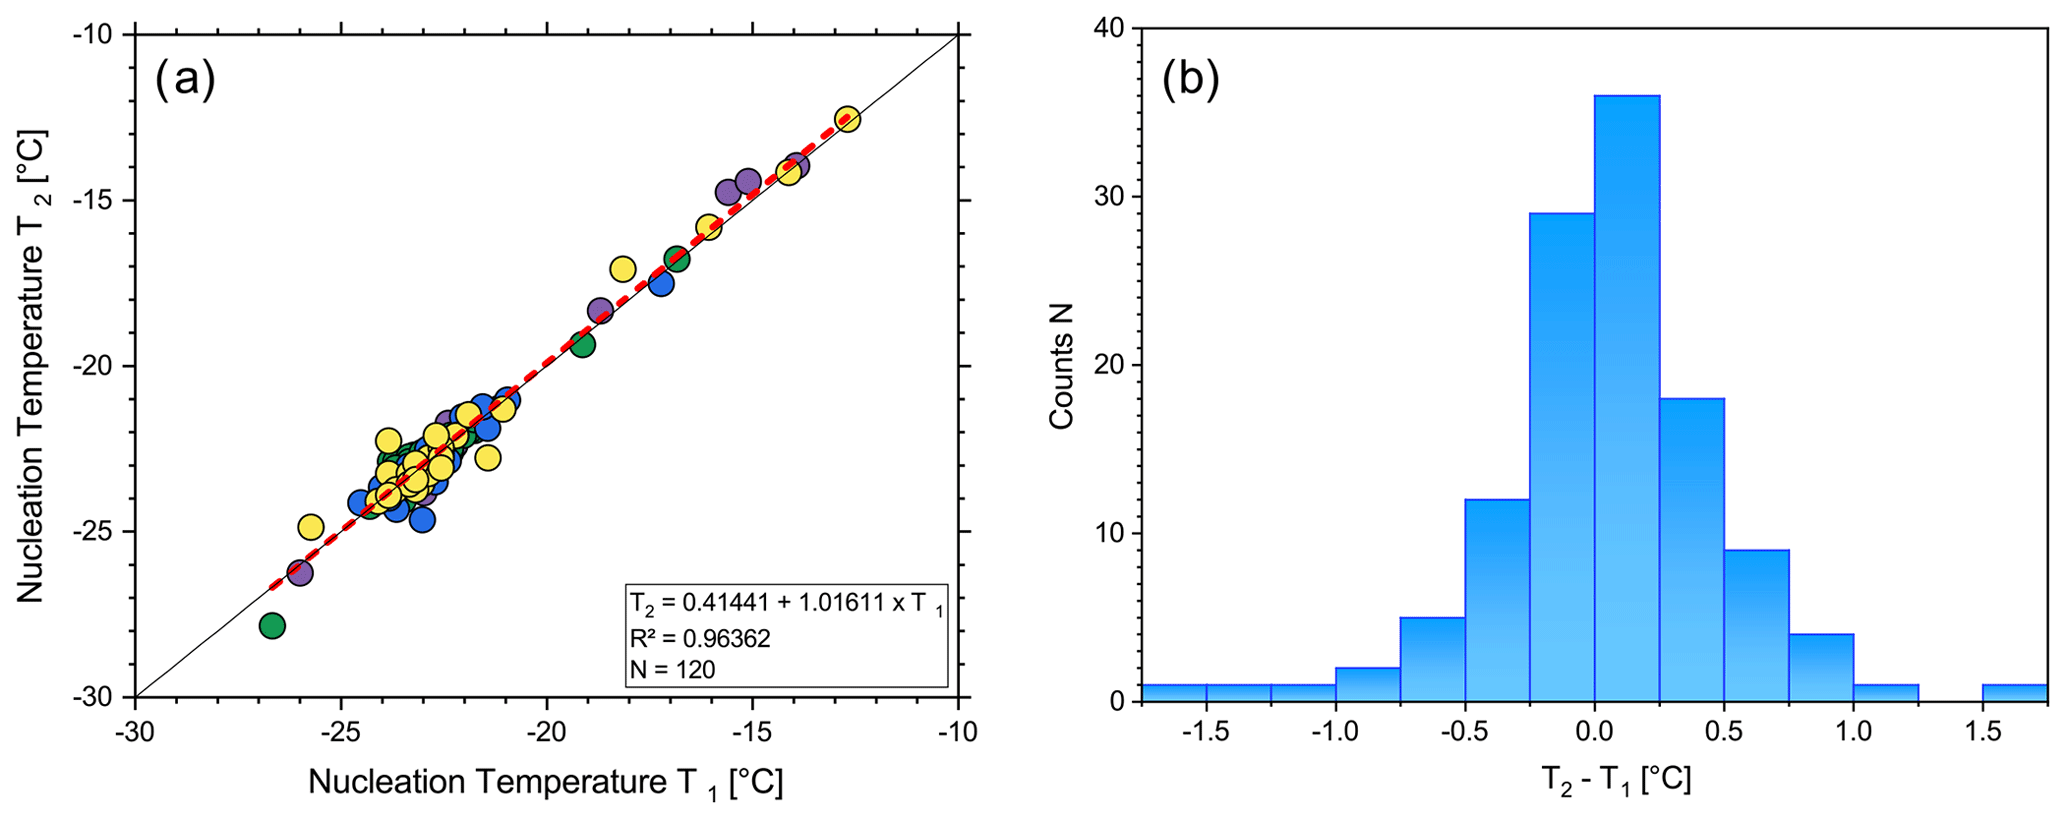
Figure 3(a) Freezing temperatures of individual droplets at two subsequent measurements. The different colors correspond to the four experimental runs of 30 droplets each. The linear regression is shown as a dashed red line and the 1:1 line as a black line. (b) Histogram of the individual droplet temperature difference between the two measurements.
In this paper, we specify the uncertainty of the INP concentration as the 95 % confidence interval, which is derived from the freezing statistics alone (i.e., number of frozen droplets at a certain temperature). The uncertainty of the INP concentration is high for the very first few drops (i.e., often as high or higher than ± 100 %) and levels out usually below ± 20 % at lower temperatures, depending on the specific freezing spectrum.
2.9 Other uncertainties
There are undoubtedly many difficulties and uncertainties associated with estimating (atmospheric) INP concentrations from an ice core. First of all, high standards of precaution need to be met in order to prevent contamination effects (e.g., when cutting the ice, when handling and storing the samples, or during the INP analysis itself). Specifically, we like to emphasize that the topmost part of the ice core is made up of relatively porous firn, which is more prone to post-coring contamination of dust during storage compared to the rest of the ice core. Preliminary results of two particle counters (Abakus: spherical diameter > 1 µm; SPES: spherical diameter < 1 µm) from the B17 ice core (only Abakus) and the EGRIP S6 ice core (Abakus and SPES, 75.62∘ N, 35.97∘ W, 2702 m a.s.l., Chantal Zeppenfeld, 2020, personal communication) suggest that a contamination effect is likely for particles < 1 µm and rather unlikely for particles > 1 µm. However, post-coring contamination still cannot be fully excluded for the latter measurements.
Second, the overarching question is whether general source conditions, transport patterns, and dry and wet deposition efficiencies, which directly influence the number of particles inside the ice as well as their possible source attribution, can be assumed not to have changed substantially over the timescale covered by the ice core. It is likely that for the timescale of a few centuries, when climate conditions were similar to today, this assumption holds (Wolff, 1996), although there is obviously some uncertainty and unknown variability.
Moreover, it is often implicitly assumed that aerosol particles in ice core archives perfectly resemble the actual atmospheric situation at the time the particles entered the ice sheet. Yet, there are a number of possible biases to consider for the case of INPs. There are several routes an aerosol particle could have taken to end up in an Arctic ice core. (a) The aerosol particle may have simply been transported to the ground by dry deposition, (b) it was activated as a cloud nucleus (either INP or cloud condensation nuclei, CCN) and was subsequently removed from the atmosphere via precipitation, or (c) it was removed either by in-cloud or below-cloud scavenging. This means that aerosol particles with good ice nucleation activity may actually be preferably deposited in an ice core compared to particles that are not as ice active (Dibb, 1996). The relative importance of riming processes determines how significant this potential bias is (i.e., the bias is low if most of the particles are transferred to the surface of the ice sheet by riming or dry deposition). Furthermore, INPs are typically large in diameter (> 0.5 µm; DeMott et al., 2010). Dry deposition is generally more efficient for larger particles and for very small particles (Brownian diffusion) than for ∼ 100 nm particles, which represent the largest fraction of the aerosol population. This implies that INPs may be overrepresented in ice core samples compared to non-INPs or the ambient atmosphere at any given time.
The next question is whether aerosol particles irreversibly remain inside of an ice sheet and if so, whether these particles stay physically and chemically inert while being preserved in the ice or if they experience modifications. Indeed, non-volatile atmospheric particles are considered to be essentially chemically inert and physically immobile once they are transferred to the ice. Yet, it is basically unknown if or how surface properties (e.g., active sites) of a particle are modified in the ice. Aerosol particles seem to remain at a given layer throughout the firnification (Bales and Choi, 1996). Aggregation of dust particles has only been observed close to the bottom of the Antarctic ice sheet (Tison et al., 2015). Hartmann et al. (2019) come to the same conclusion that INPs are well preserved in an ice core, and a reconstruction of their concentration for past climates is possible. However, as previously stated, storage conditions may have affected the INP activation.
In contrast, it is likely that aerosol particles will alter physically and chemically during the atmospheric transport from their source region to the Arctic. This includes, but is not limited to, changes in size distribution, mixing state, or coatings. We will therefore not try to speculate about potential atmospheric INP concentrations at a possible source location in the past.
In summary, one should be wary when interpreting results based on aerosol data from an ice core. Statements based on these findings should be assessed carefully. In the light of these uncertainties associated with the transfer processes of INPs between the atmosphere and the ice sheet, the conversion factor from in-ice concentrations to (Arctic) atmospheric concentrations, which will be introduced in the following subsection, should therefore be interpreted only as an order-of-magnitude estimation.
2.10 Conversion to atmospheric concentrations
To convert the cumulative INP concentration per volume of meltwater to an atmospheric concentration, we follow the theoretical considerations presented in Fischer et al. (2007). As for any aerosol particle, an INP can be transferred from the air to the surface of the ice sheet either by dry deposition or by wet deposition. Fischer et al. (2007) state that in a simplified model the total deposition flux Jice (i.e., the sum of the flux of dry and wet deposition, Jdry and Jwet, respectively) to the ice surface is defined by the product of the snow accumulation rate A and the average concentration of the investigated species (i.e., here for INPs: NINPice) in the ice core sample. Over long periods of time the deposition flux can be written as
where NINPatm is the atmospheric INP concentration (or any other investigated species of interest), vdry is the dry deposition velocity, and ε is the effective scavenging efficiency including in-cloud and below-cloud scavenging. Experimentally, ε is often defined as particle concentration in cloud water or in precipitation (snow, ice, or rain) divided by the airborne particle concentration. Rearranging Eq. (2) leads to
Thus, it is possible to calculate the (Arctic) atmospheric INP concentration, when realistic values for the variables A, vdry, and ε are estimated. However, Eq. 3 implies that if deposition fluxes change over the time span of the ice core (in particular the wet deposition, which is directly related to changes in the precipitation rate), the concentration of the investigated species in the ice will change as well. This means that not all potential changes seen in the ice core INP concentration are necessarily caused by actual changes in the atmospheric concentration. Henceforth, we will, however, treat these variables as constants due to the lack of better knowledge and because climate conditions changed only little over the last centuries. In particular, the average snow accumulation of the B17 ice core has been determined by Weißbach et al. (2016) and shows little variation over time ( 0.1 cm w.e. a−1, N=630). Unfortunately, the other deposition parameters are not as well-known.
In general, vdry heavily depends on the particle diameter, shape, density, and physical properties of the particle. The typical range is between 10−2 and 10 cm s−1 (Seinfeld and Pandis, 2006). Smaller particles (dp < 0.1 µm) and larger particles (dp > 1 µm) usually have higher dry deposition velocities than medium-sized particles, where Brownian diffusion and gravitational settling are low (Davidson et al., 1996). Moreover, the nature of the surface itself (e.g., surface type and smoothness) and the level of atmospheric turbulence at the nearest layer to the ground have a major influence on vdry (Seinfeld and Pandis, 2006). Moreover, over the ice sheet, the dry deposition is strongly influenced by snow ventilation effects induced by surface roughness (Cunningham and Waddington, 1993). For the purpose of this paper we use a dry deposition velocity of vdry=0.05 cm s−1, which we derived from a parametrization by Zhang and He (2014).
The scavenging efficiency ε (also known as scavenging ratio or washout ratio) is even less well-known than the dry deposition velocity. The scavenging ratio is a very complex parameter that is controlled by the particle's size, its physical shape and chemical composition, and cloud properties such as droplet size, cloud temperature, and cloud type as well as by the vertical extent of the cloud (Duce et al., 1991; Shao, 2008). Hence, accurate predictions of ε are very difficult (Shao, 2008). Duce et al. (1991) warn that experimentally determined concentrations at the ground do not necessarily have to reflect the conditions near the cloud, where the particles are mainly scavenged. Furthermore, ε can vary greatly for different particle species and should therefore be assessed carefully (Duce et al., 1991). For the purpose of this paper we use a value for ε of 1.11 × 10⁶ that is derived from long time observations by Cheng and Zhang (2017).
Following these assumptions, we derive a best guess of about for converting from NINPice to NINPatm at the B17 drill site (Fig. 4, blue cross). Figure 4a displays the range of the possible conversion factors as a result of other combinations of vdry and ε. Figure 4b shows the sensitivity of the chosen conversion factor associated with the uncertainties in dry and wet deposition efficiencies. Judging from the typical range of literature values of vdry and ε, the uncertainty of the conversion factor is likely within ± 50 % of our best estimate. Likewise, our conversion factor is only about twice as high as the conversion factor proposed in Petters and Wright (2015), who compiled INP data from precipitation measurements and translated these to atmospheric INP concentrations at cloud level. Petters and Wright (2015) based their estimation on the assumption that cloud droplets of typically 1 pL (each containing no more than one INP) dispersed in 1 m3 of air weigh about 0.4 g (cloud water content (CWC) ranges between 0.2 and 0.8 g m−3). Depending on the exact CWC, the uncertainty of the Petters and Wright (2015) estimation is also a factor of 2.
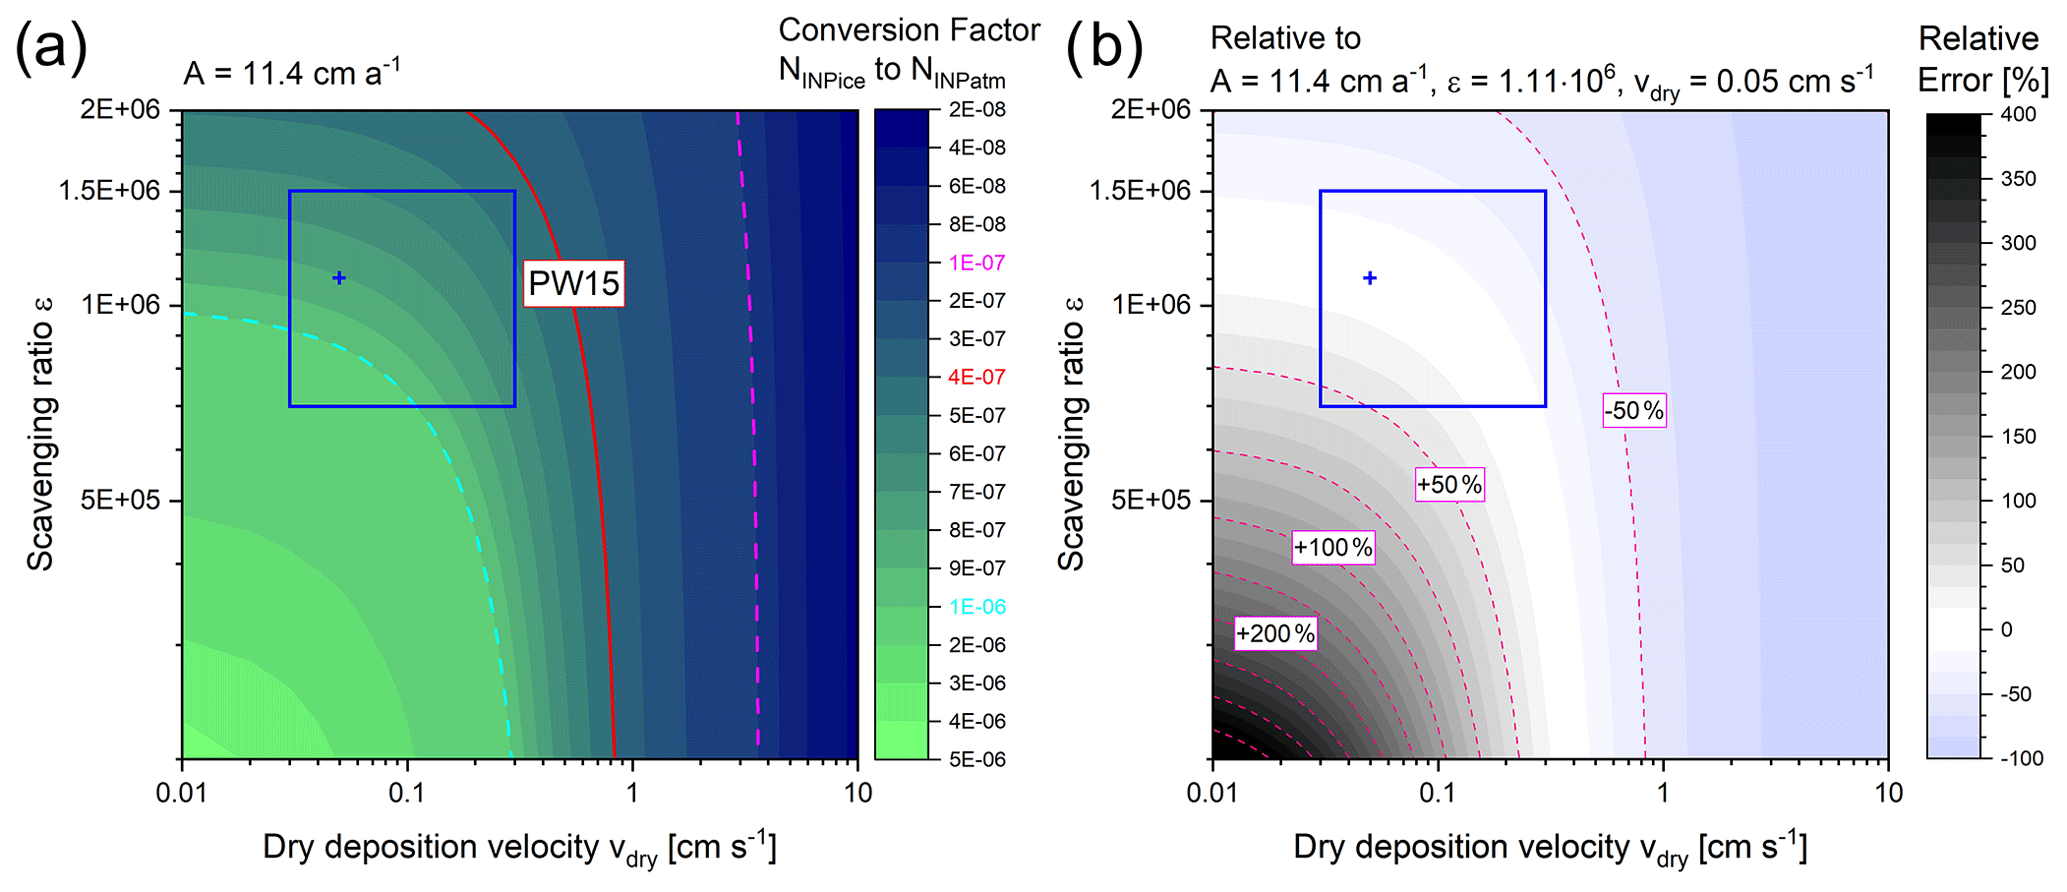
Figure 4(a) Conversion factor between the INP concentration per volume of ice and per volume of air depending on dry deposition velocity and scavenging ratio at a fixed accumulation rate. Our best estimate of is given by a blue cross. A likely range is indicated by a blue rectangle. The conversion factor introduced in Petters and Wright (2015) (PW15, red line) is added for reference. (b) Potential errors relative to our best estimate due to uncertainties in vdry and ε.
Overall, the ice core samples show relatively low ice nucleation activity. Droplets freeze in the range of −14 to −35 ∘C (Fig. 2). On average, 1 % of the droplets are frozen at −21.27 ± 1.43 ∘C, 10 % at −24.93 ± 1.53 ∘C, 25 % at −26.62 ± 1.87 ∘C, 50 % at −28.33 ± 2.09 ∘C, and 90 % at −31.03 ± 2.02 ∘C, respectively. Reiterating our statements from Sect. 2.8, we find a reasonable number of droplets freezing only at temperatures where some influence from background freezing is expected (T < −28 ∘C). Accordingly, the interpretation of the lower end of the data is difficult. Figure 5 shows a time series of the fraction of frozen droplets in samples with a regular time interval of 10 years between each sample. In general, this subset of the data (about half of all samples) reflects the basic characteristics of the ice core samples well (see also Fig. S1 in the Supplement), with a few distinct exceptions, which we will discuss later. The freezing spectra show relatively little variation between individual samples overall, and from sample to sample. Some notable exceptions are samples that feature an early ice nucleation onset (e.g., 1400, 1430, 1630, 1740, 1950) or a freezing spectrum that is completely shifted to warmer freezing temperatures (e.g., 1450, 1550, 1620, 1630, 1930, 1960, 1990). Of these samples, the sample of 1630 stands out the most. Here, a very steep freezing spectrum was observed with a freezing range of only about 3.5 ∘C (−18.27 to −21.74 ∘C). We verified our results by reproducing the measurement of this sample. The separate second measurement confirmed the strikingly different freezing characteristics, thus eliminating a contamination during the FRIDGE measurements themselves. This may point to a real atmospheric event. However, CFA and IC data of that sample do not indicate the presence of volcanic particles or exceptional concentrations in any other trace element. Unfortunately, the single particle analysis by SEM did not provide any additional explanation for the remarkable ice activity of this sample (see Sect. 3.2). A contamination during the sampling generation step cannot be excluded altogether.
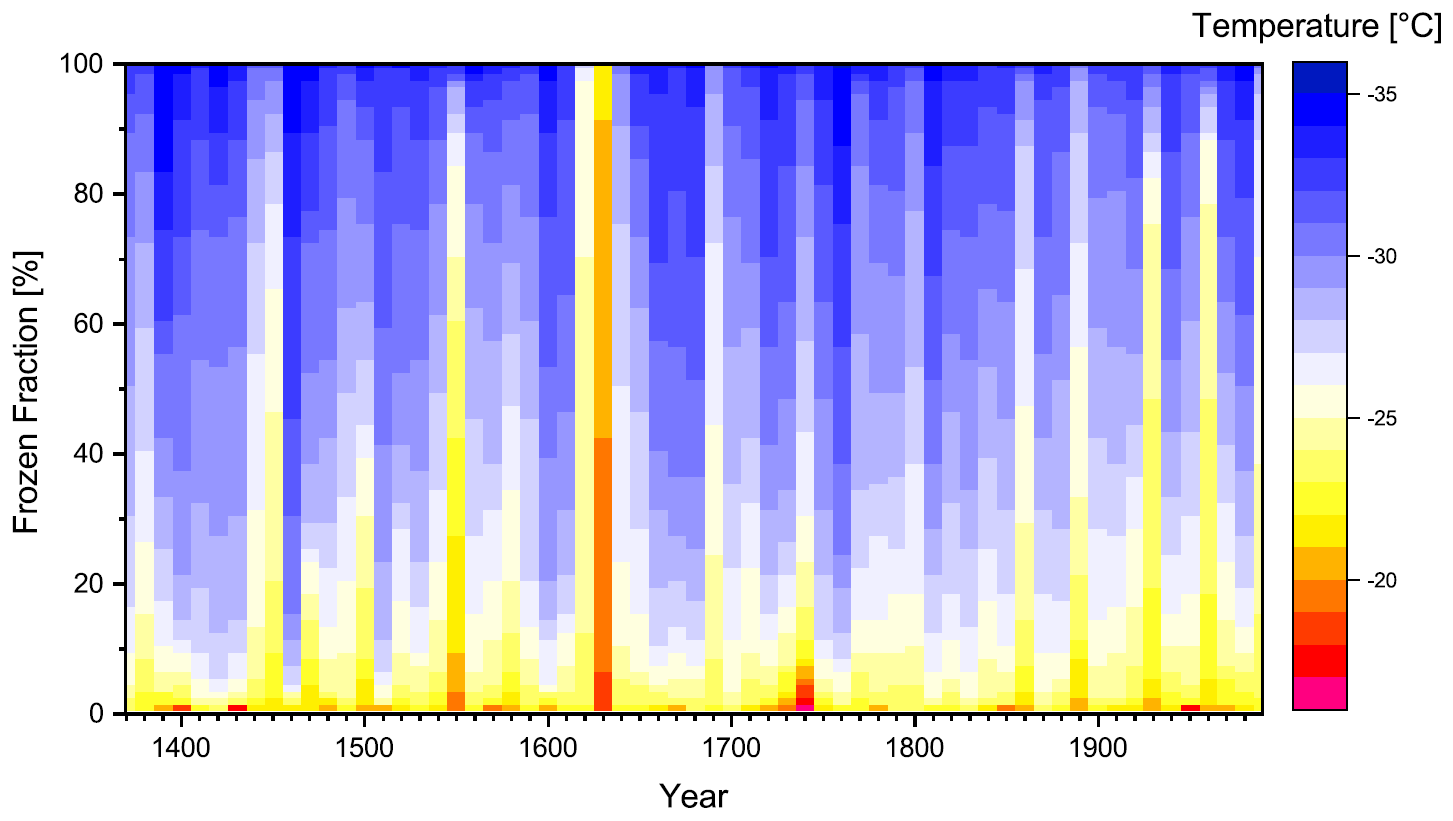
Figure 5Frozen fractions of the samples with regular time intervals of 10 years depending on freezing temperature (colors). The temporal coverage of an individual sample typically averages over about 6 months.
We turn the discussion now to 1 ∘C binned average INP concentrations (± standard deviation) of all ice core samples. At −15 ∘C only 3 % of the samples (4) showed ice nucleation with an average frozen fraction of only 0.02 %. This translates to NINPice of 0.06 ± 0.35 mL−1 or NINPatm of about L−1, respectively. At −20 ∘C 61 samples (45 %) were ice-active, yet still they showed a frozen fraction of only 0.7 % on average. An average NINPice of 3.06 ± 18.76 mL−1 was observed, which corresponds to atmospheric concentrations of about L−1. All samples displayed some freezing activity at −25 ∘C. The previously mentioned sample from 1630 was the only sample that was completely frozen at this temperature. We found an average NINPice of 113.92 ± 272.01 mL−1, which corresponds to an atmospheric concentration of about 0.09 L−1. Only about 4 % of all samples (6) were completely frozen before reaching −30 ∘C. On average, 69.3 % of the droplets were frozen at −30 ∘C. At this temperature, NINPice was found to be 668.09 ± 529.10 mL−1 on average, translating to a NINPatm of 0.53 L−1.
Henceforth, the discussion of results is focused on the characterization of INPs at −25 ∘C specifically. Although usually only a relatively low percentage of droplets was frozen at this temperature (17 ± 20 %), all samples showed some droplet freezing events at this temperature. Only one sample was completely frozen prior to reaching −25 ∘C. Furthermore, we do not expect much influence from background freezing at this temperature (Fig. 2). Figure 6 displays the INP concentrations of the ice core at −25 ∘C. We chose to show the data on both a linear (a) and logarithmic (b) scale, in order to illustrate the typical variation in the INP concentration, while still allowing for easy identification of differences in the absolute INP concentration level. Several important findings can be inferred from the figure. The observed range of variability in the INP concentration is about 1–2 orders of magnitude. We find on average higher and more variable INP concentrations for the last couple of decades compared to the rest of the time series. Nevertheless, there is no obvious trend. Further, back-to-back samples that differ by less than a year (brown, black, and green symbols) typically show a comparably low variability, with the exception of two samples from 1475. These two outliers correspond to samples which show a peak in the particle number and conductivity signal from the CFA measurements. Currently, it is unclear whether this corresponds to a volcanic eruption, which the data seem to suggest. The Laki eruption in 1783, however, did not increase the INP concentrations. Yet, this may have to do with the type of volcanic eruption of Laki, which is categorized as a mostly effusive eruption. In contrast to typical explosive eruptions, during which vast amounts of ash particles are blasted into the atmosphere, effusive mixed eruptions involve alternating mostly liquid lava fountains and flows. Moreover, the location of Greenland (and the ice core drilling site) situated upwind of the Laki eruption source may contribute to the lack of an increased INP burden over the Greenland ice-sheet in 1783. Cryptotephra from the Laki eruption were only detected at one ice core site (GISP2, Summit; Fiacco et al., 1994). The effusive nature of the eruption and the location away from the main wind direction appear to be reflected by the CFA and IC measurements, which do not find increased particle loads during the Laki eruption, but they show the most pronounced peak in conductivity and the SO concentration. Interestingly, other samples with a peak in the particle number concentration did not always translate to high INP concentrations. Overall, however, we did find a moderate yet significant correlation between particles larger than 1.2 µm and the INP concentration over a wide range of temperatures (Table 1). This points to a terrestrial source of INPs. The dust signal in Greenlandic ice cores is mainly associated with long-range transport from East Asian deserts (Bory et al., 2002; Schüpbach et al., 2018). For certain temperatures we find significant correlations between the INP concentration and Ca2+ and the conductivity as well. When the data are grouped into subsets according to Fig. 1, we find that the correlation weakens for the 10-year samples and the modern-day samples but increases for special event and seasonal samples (Table S2). A complete correlation analysis can be found in the Supplement (Table S3).
Table 1Pearson correlation between the INP concentration and selected CFA parameters of the complete data set. Bold coefficients indicate a significant correlation (p < 0.05). The number of samples is given in parentheses.
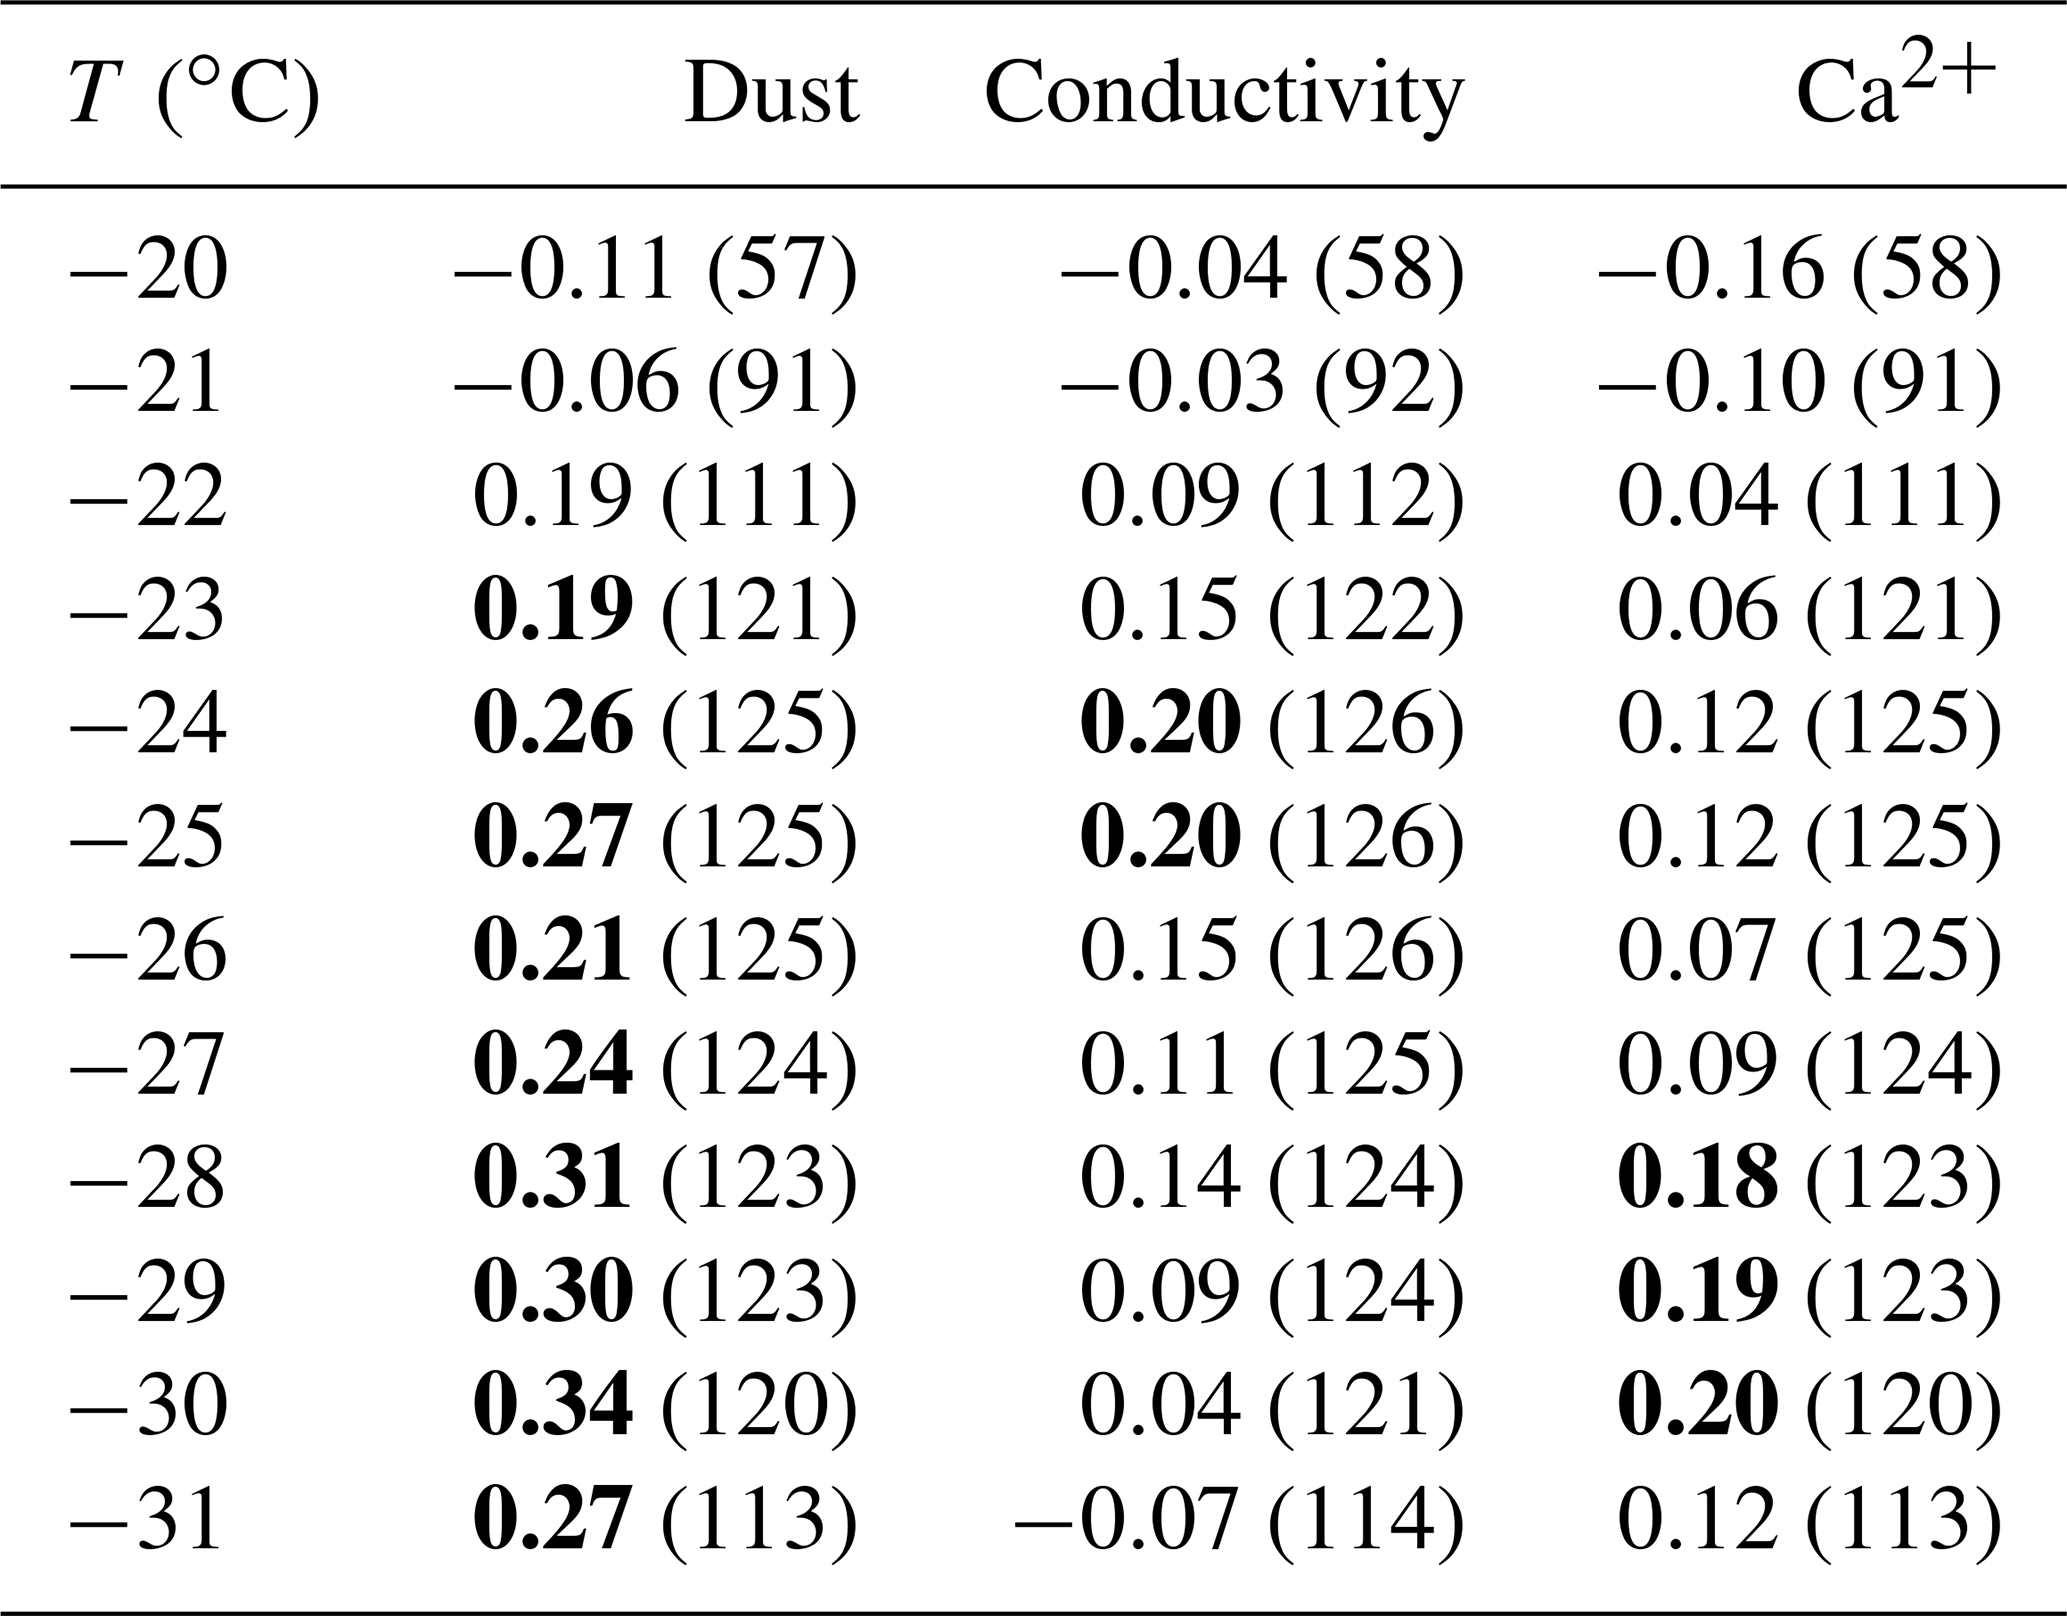
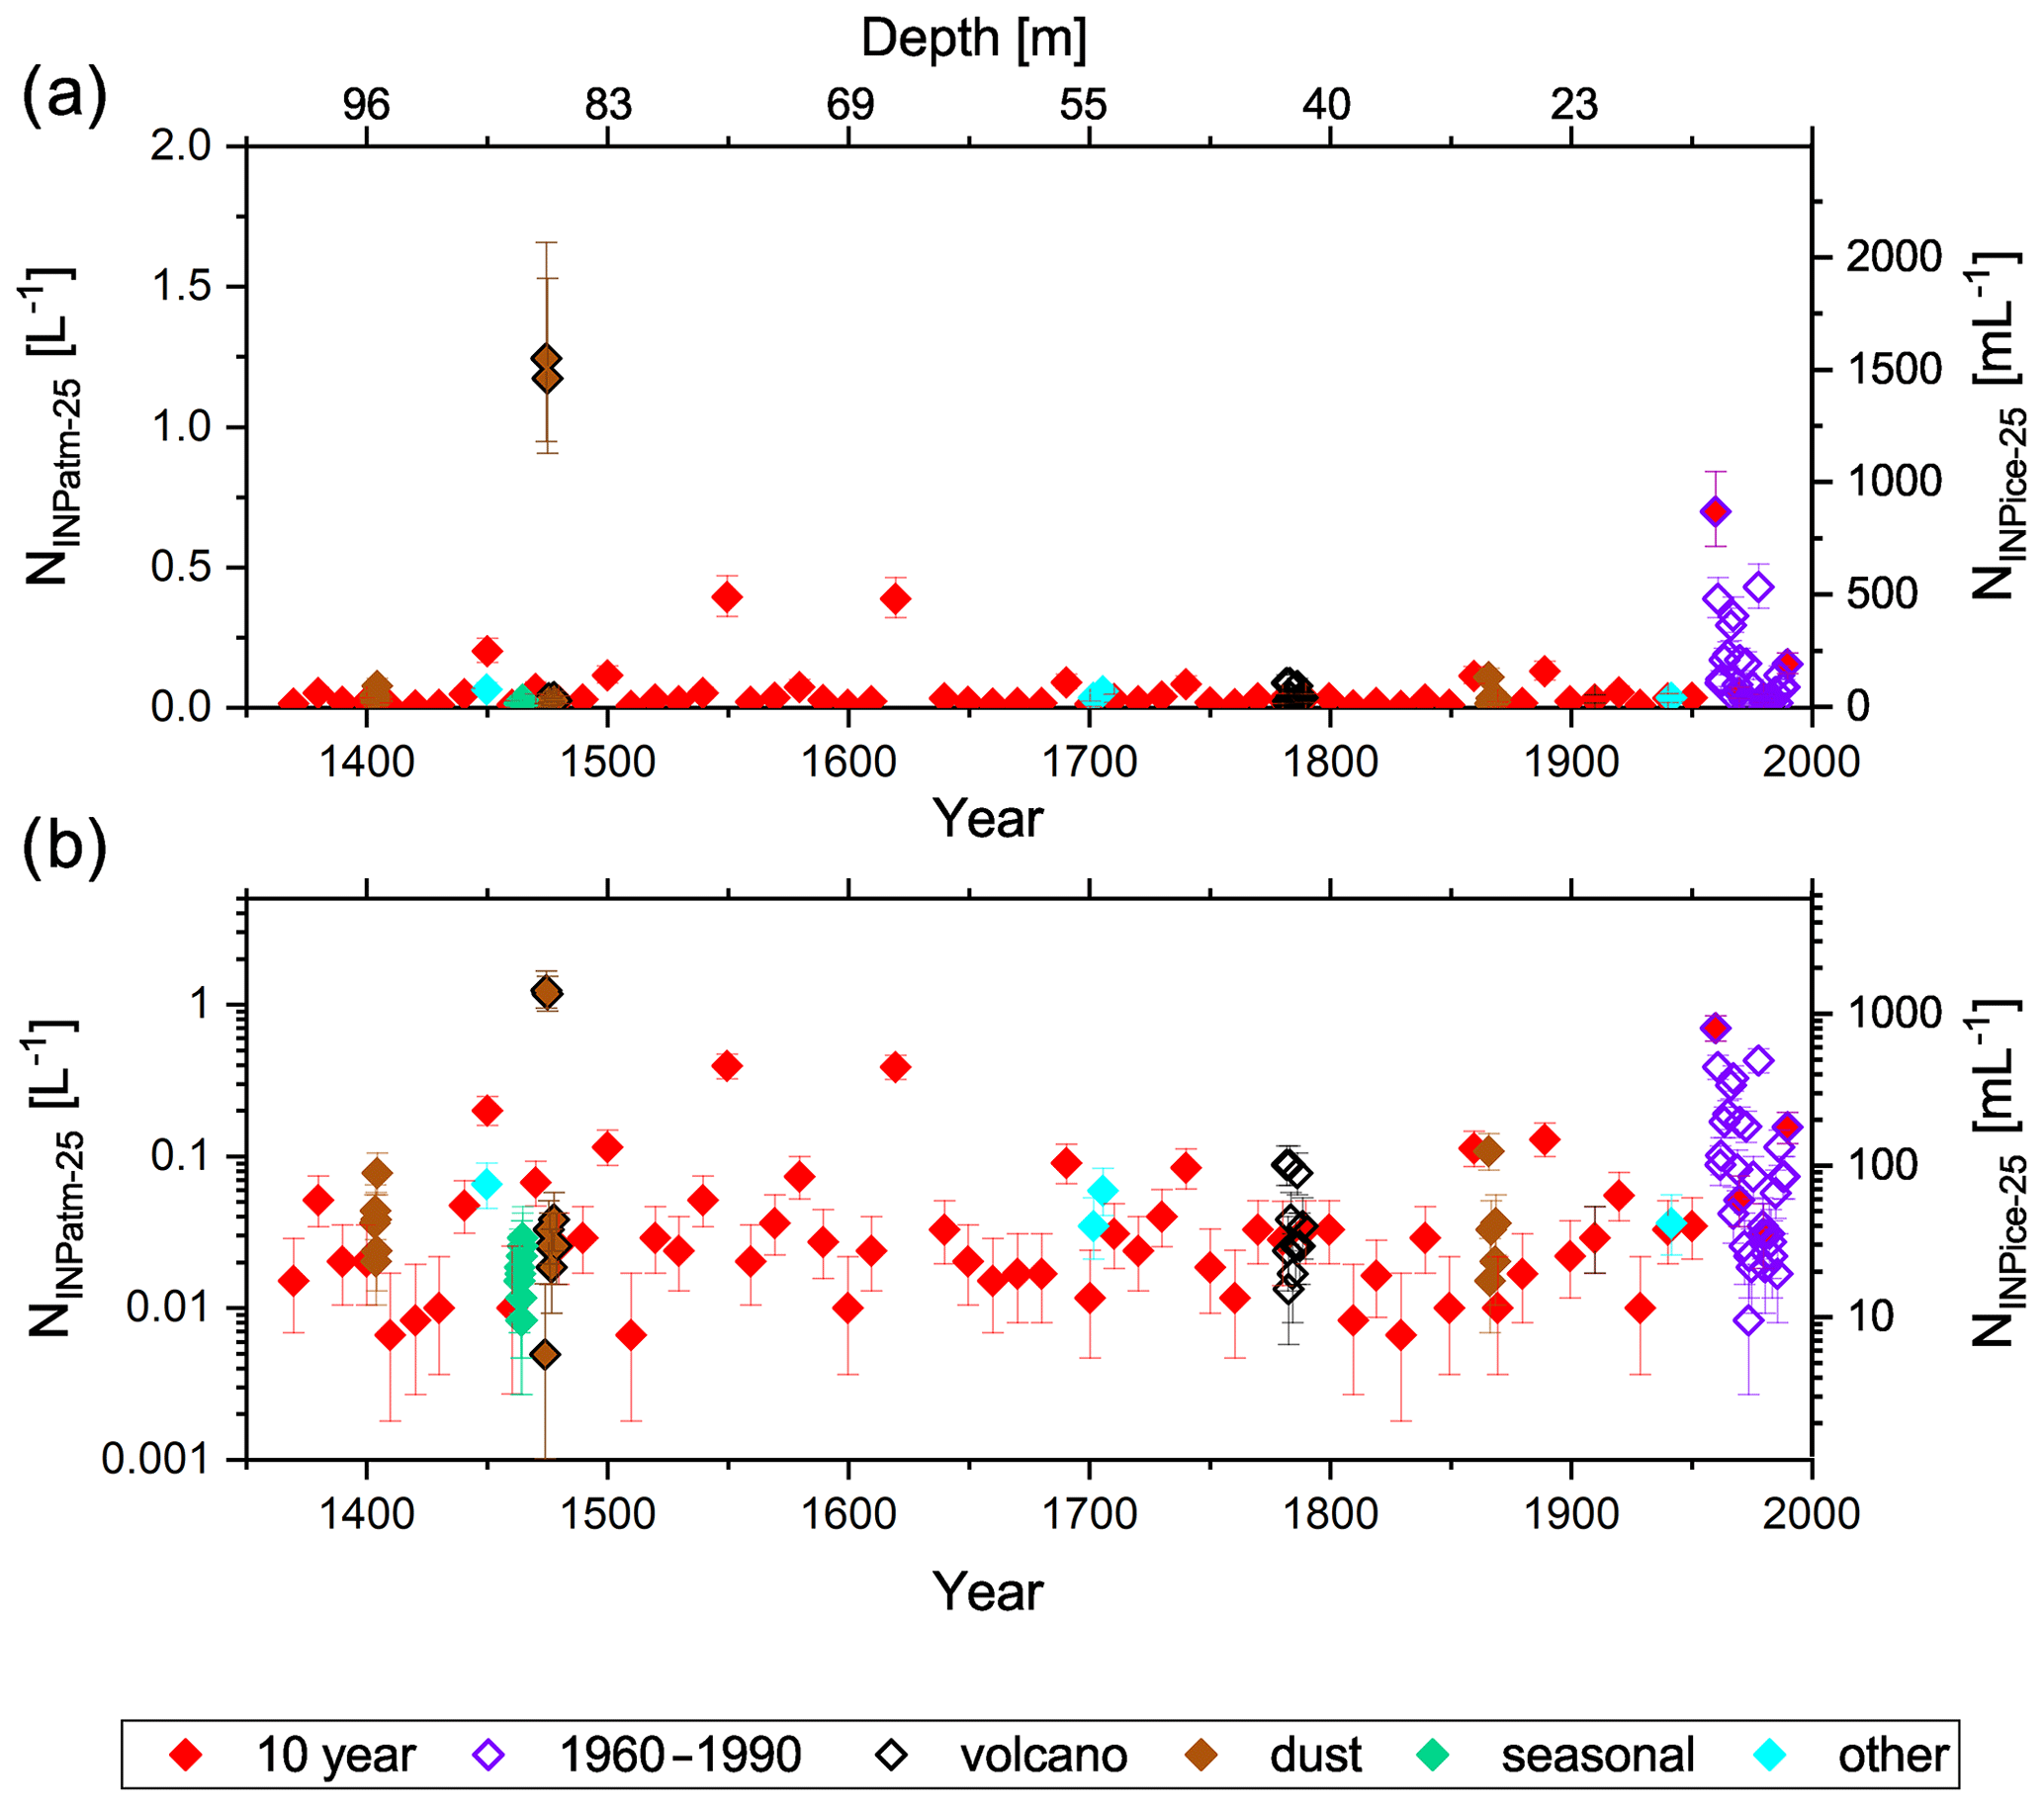
Figure 6INP concentrations (right scale: per volume of ice; left scale: per volume of air) at −25 ∘C on both linear (a) and logarithmic (b) scales. Symbol colors correspond to the different sample groups as introduced in Fig. 1. The ice core's (nonlinear) depth from the top is added for reference on the top x axis.
3.1 Pre-Anthropocene vs. modern-era INP concentrations
Figure 7 presents the frozen fraction vs. temperature spectrum of each sample between 1960 and 1990. Comparing Fig. 7 to Fig. 5, it is visible at first glance that more droplets froze at warmer temperatures (yellow colors) for the modern-day samples than for the 10-year samples, which cover the complete time from 1370 to 1990. Unfortunately, despite the CFA decontamination technique we cannot entirely exclude the possibility that differences emerged or are enhanced due to post-coring contamination of the porous firn, as the ice core was stored for some time. Preliminary measurements (see Sect. 2.9) found a 2-fold increase in particles larger than 1 µm in the top 8 m (roughly the time interval of 1960–1990) compared to older intervals, which does seem to match the results observed by the INP measurements. Further, a distinct seasonality could be established for the dust measurements of the top layers, which argues against a strong contamination effect. Furthermore, the results could be intrinsically influenced to some degree by differences in sampling frequency and time coverage, as well as samples representing different seasons of the year. Regardless, we will compare the ice nucleation characteristics of these two data sets in more detail (i.e., 31 samples from 1960 to 1990 and 59 samples from 1370 to 1950). The observed difference between pre- and post-1960 samples is based on the study of Zalasiewicz et al. (2011), who propose to define the middle of the 20th century as the beginning of the Anthropocene. Furthermore, we excluded the sample from 1630 in most of the following analysis in favor of more consistent freezing spectra. The statistical outlier is certainly important, as it was the only sample that was completely frozen before reaching −22 ∘C. At this state, however, we cannot explain what caused its high IN activity (see Sect. 3.2). Moreover, as stated previously a contamination prior to the INP analysis cannot be excluded completely for this sample. Including the outlier does not change the general results.
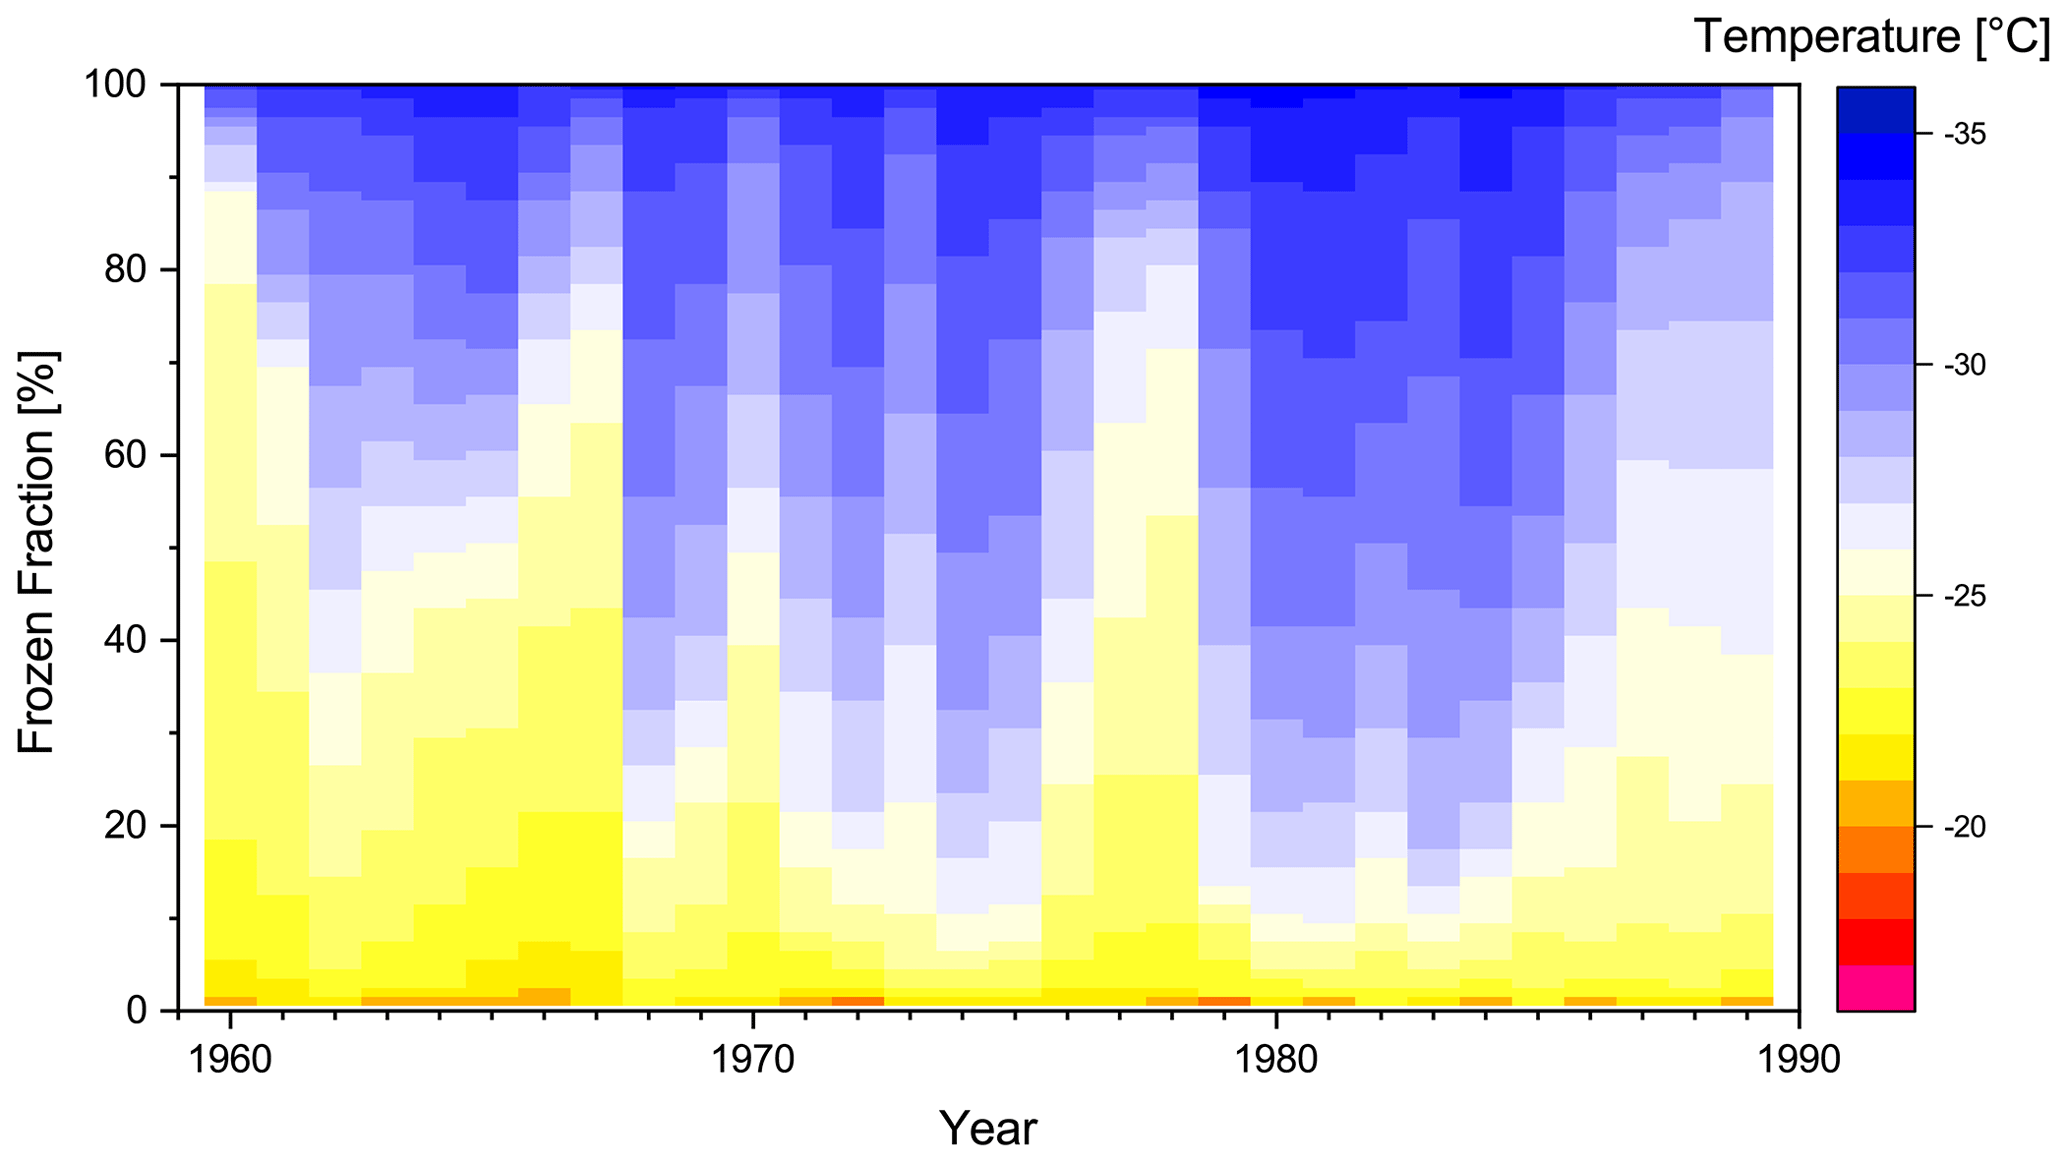
Figure 7Frozen fractions of the modern-day samples depending on freezing temperature (colors). The temporal coverage of an individual sample typically averages over about 6 months. However, data points are interpolated in time to generate yearly columns of regular width. The non-interpolated data are presented in Fig. S2.
Figure 8 illustrates the statistical freezing properties of both data groups using a box–whisker diagram. The figure confirms the previously observed finding that the modern-day samples generally show higher frozen fractions at the same temperature. Furthermore, they exhibit a higher variability than the pre-1960 samples for most nucleation temperatures. The differences intensify at a medium supercooled temperature range (−23 to −26 ∘C). On average, the INP concentrations of the modern-day samples are 1.85 to 3.35 times higher than the samples with 10-year intervals in this specific temperature range (Fig. 9). We tested the significance of these differences with a two-sided t-test. We found that the average INP concentrations of modern-day and pre-Anthropocene samples are in fact significantly different from one another at −23 ∘C (p < 0.0181), −24 ∘C (p < 0.0008), −25 ∘C (p < 0.0011), −26 ∘C (p < 0.0360), and −28 ∘C (p < 0.0463). Figure 10 compares the relative frequencies of observed INP concentrations of the two groups at −25 ∘C. Modern-day samples follow a relatively broad lognormal probability distribution with a median ice INP concentration of about 100 mL−1. The INP frequency distribution of pre-1960 samples, on the other hand, is evidently different from the post-1960 samples. Here, we find INP concentrations below 100 mL−1 more frequently. The distribution is more narrow and seems to be right-skewed to some degree, although the lognormal shape is still matched relatively well. Similar results emerge from the INP distributions at , −24, and −26 ∘C, which can be found in the Supplement (Figs. S3–S5).
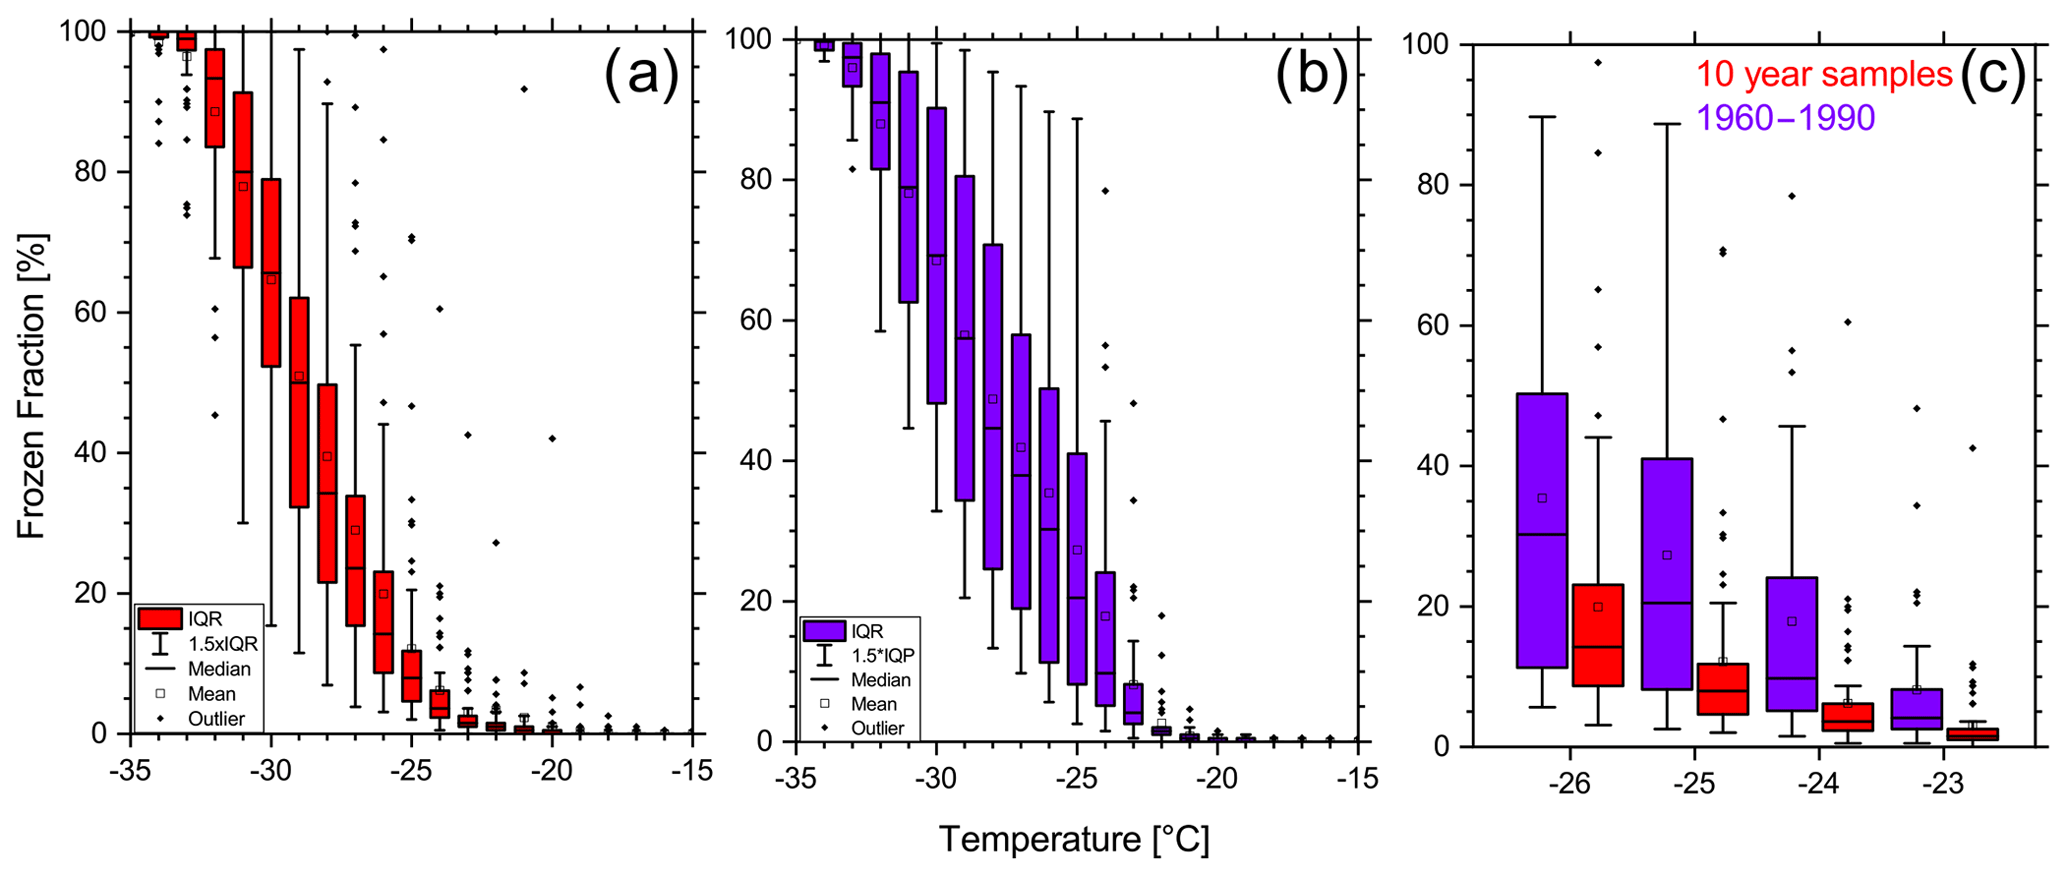
Figure 8Box–whisker plots of the frozen fraction of the 10-year samples (a) and the modern-day samples (b) for the complete temperature range and a detailed comparison of both data sets at medium supercooled temperatures (c).
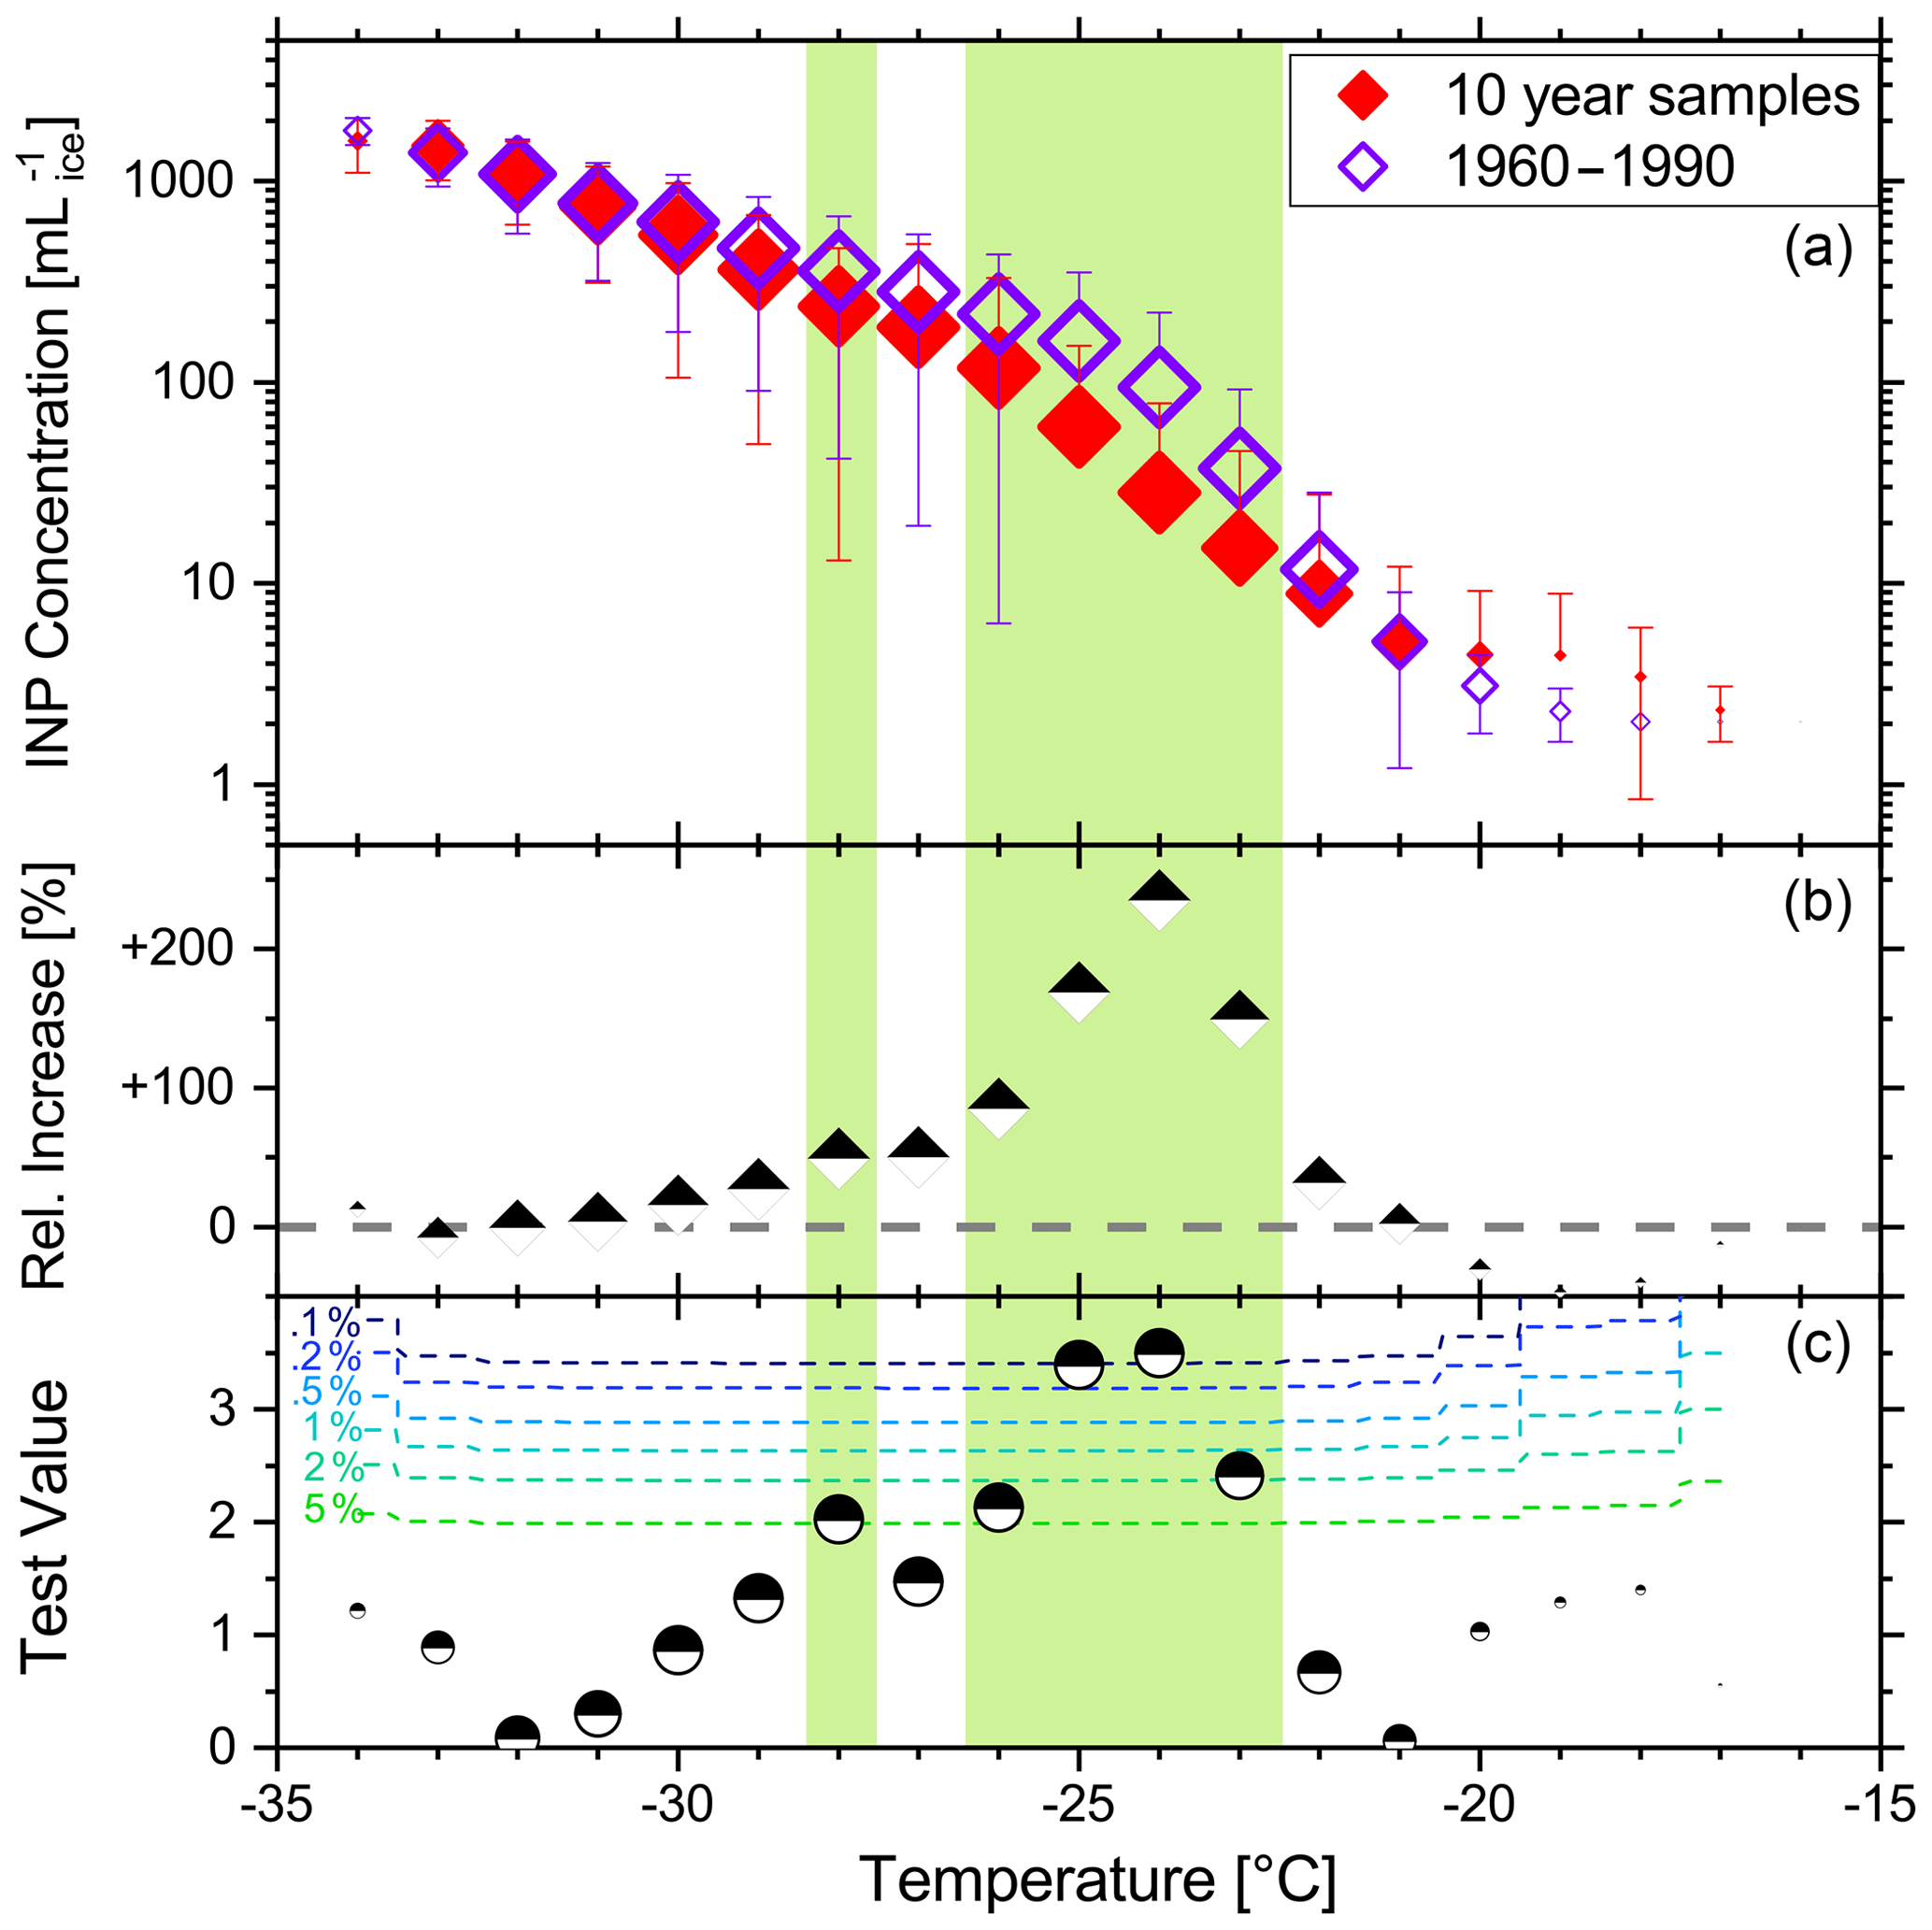
Figure 9(a) Average INP concentrations ± standard deviation (error bars) of the 10-year samples (red) and the modern-day samples (purple). Negative error bars are not shown, when the standard deviation is greater than the average. (b) Relative difference in the INP concentration between both groups. Positive values mean modern-day samples are higher. (c) Test values of a two-sided t-test to evaluate whether the average INP concentrations of both groups are significantly different from each other. Dotted colored lines indicate the significance level of the test. Average INP concentrations that differ significantly from each other at p < 0.05 are highlighted in green. Symbol sizes in all panels correspond to the respective number of ice-active samples at each temperature (maximum number for 10-year samples: N=58; maximum number for 1960–1990 samples: N=31). Note that the 1630 sample is excluded from this figure.
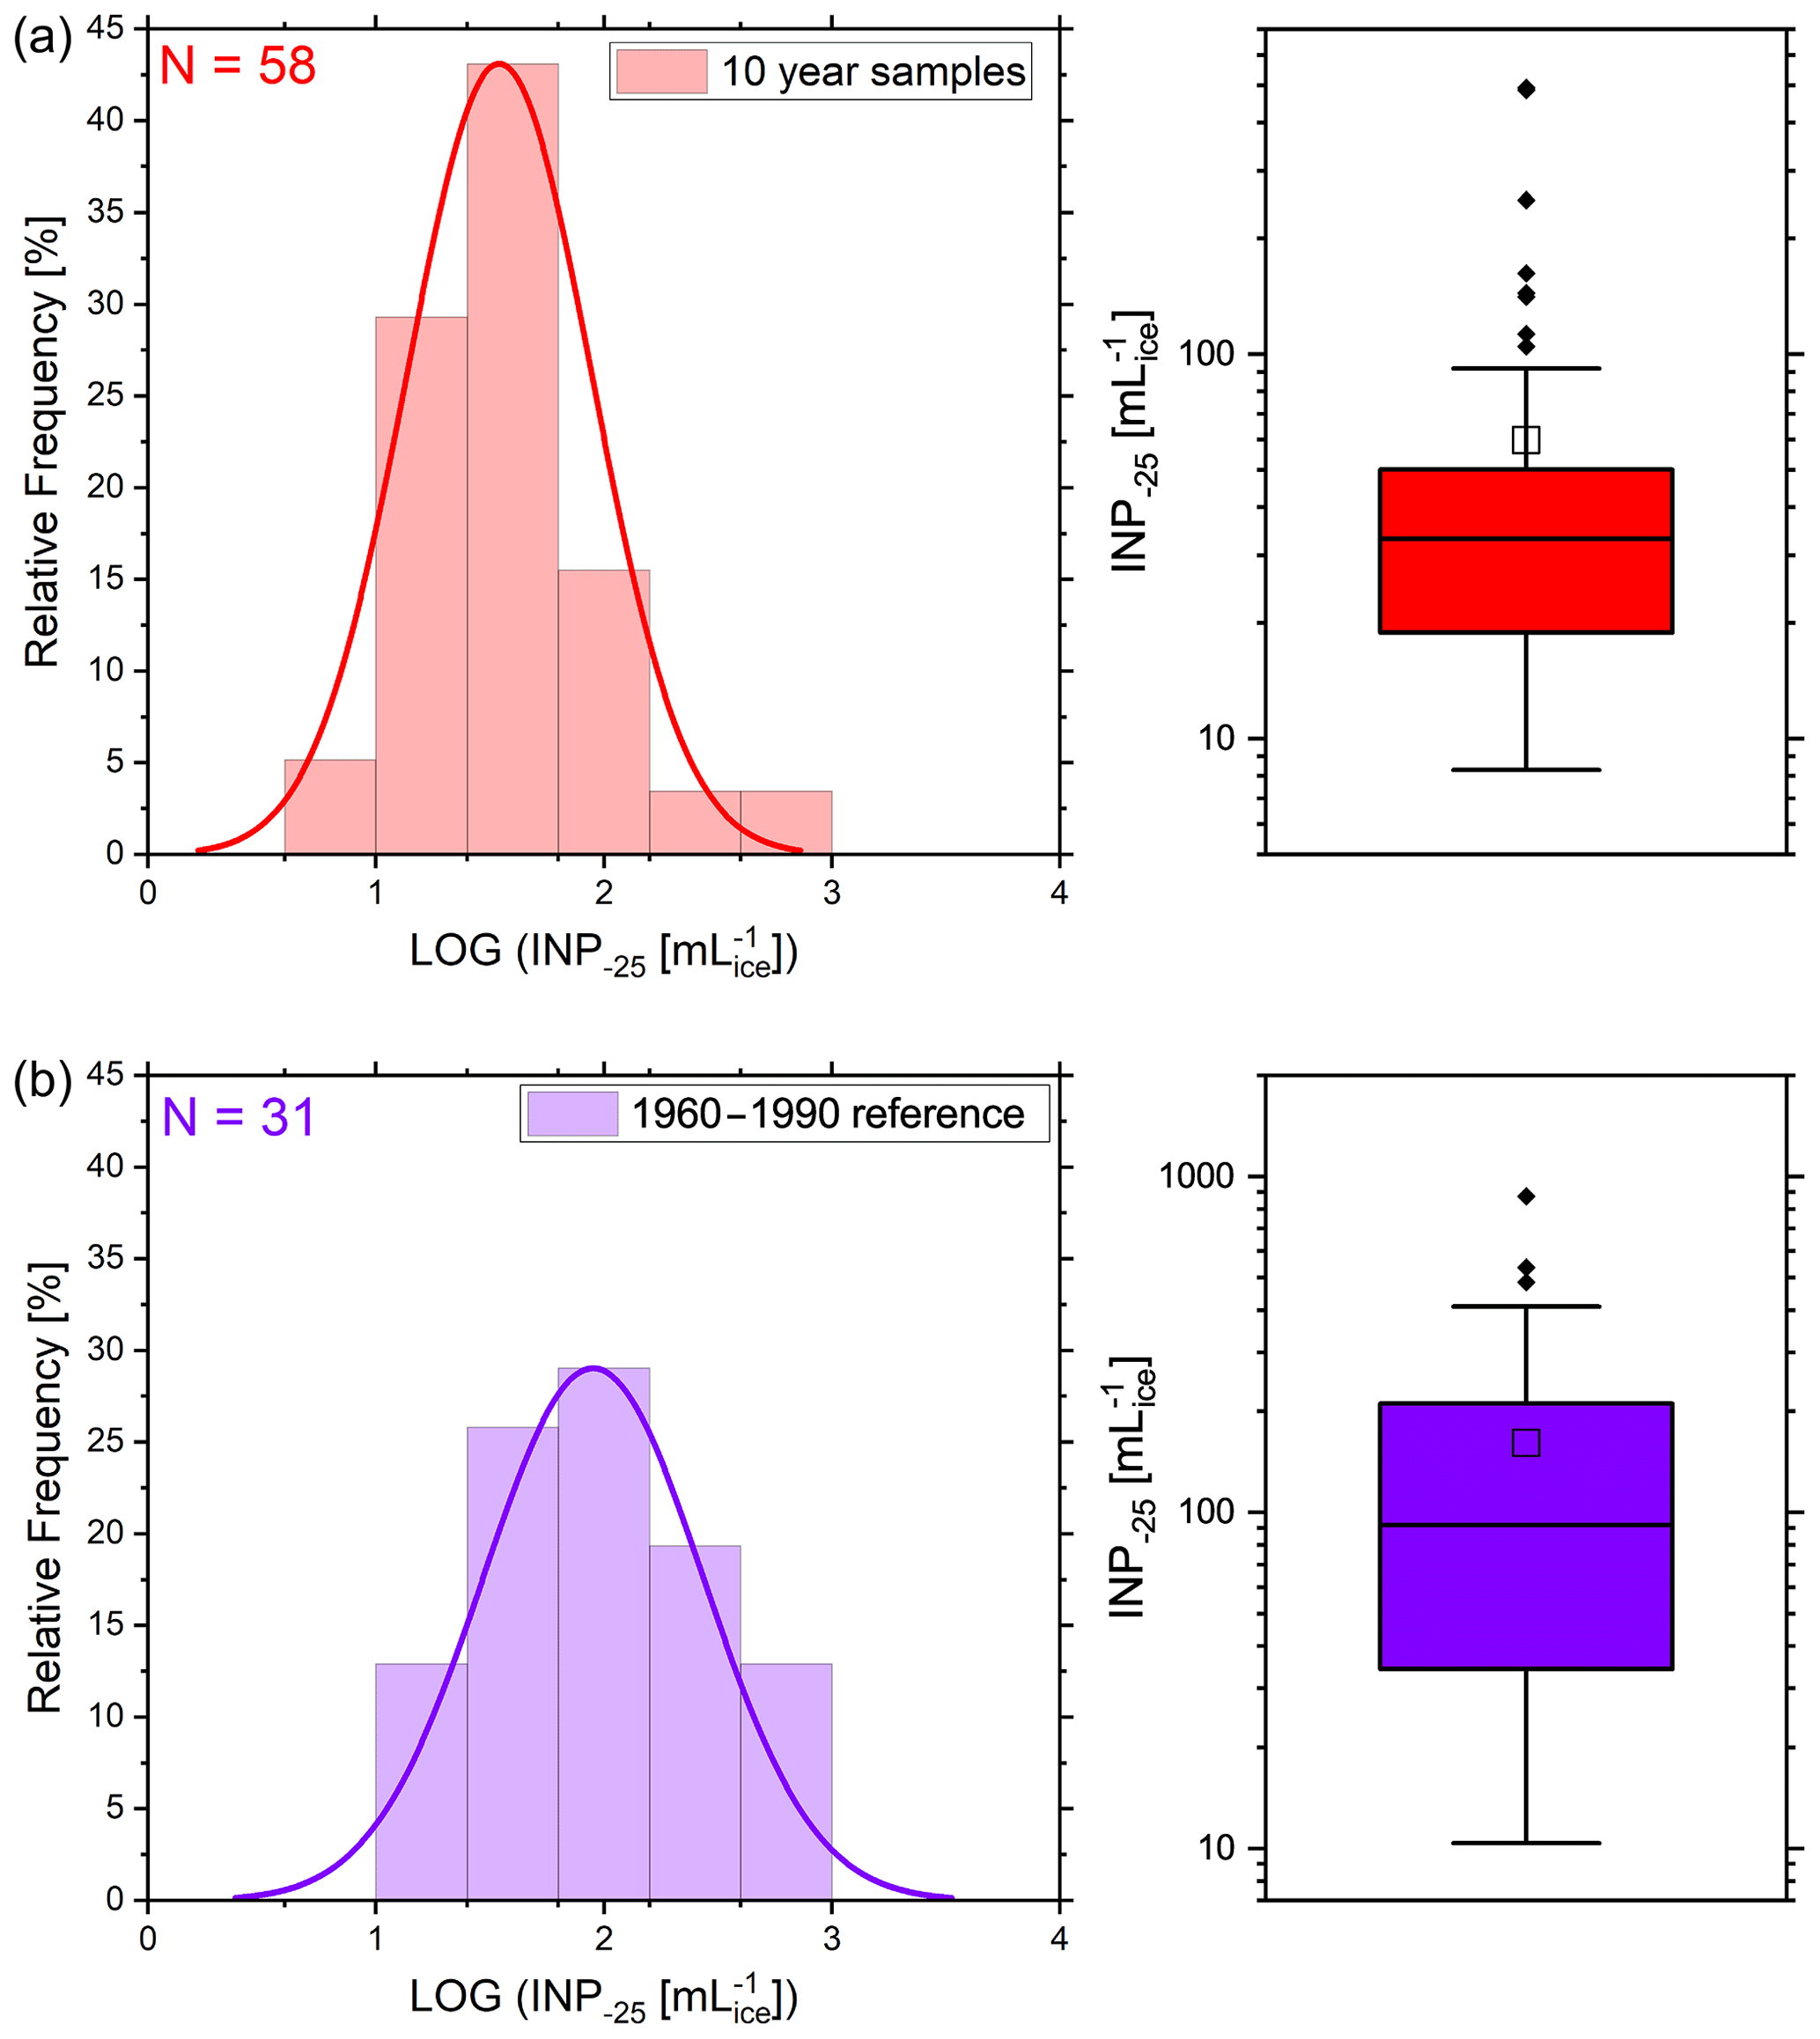
Figure 10Empiric probability density function (bars) of the logarithmic INP concentration at −25 ∘C of the 10-year samples (a) and the modern-day samples (b). The data follow a lognormal distribution (fitted curve). The right panel shows the corresponding box–whisker plot.
Now the question arises of what factors may have caused these significant differences in INP concentrations. Several hypothetical explanations come to mind. First, the changing climate may have influenced both the deposition pathways and their efficiencies (cf. Sects. 2.9 and 2.10). But, at least locally, the accumulation rate at B17 does not show a change between modern and preindustrial times. Further, changes to relevant large-scale atmospheric circulation patterns are essentially unknown for the investigated time period. Assuming there was only little influence by post-coring contamination and no change in climate and circulation, the findings suggest that certain particles that are ice nucleation active in a mid-supercooled temperature regime may be more abundant in today's atmosphere. We already hypothesized about possible candidates in the introduction (e.g., enhanced mineral or soil dust particles due to desertification, land-use change, and agriculture; metals from industrial processes; and/or fire particles from biomass burning emissions). In this regard, we consider it fairly likely that enhanced concentrations of desert dust and soil dust have influenced the modern INP concentrations. Potential atmospheric implications of this hypothesis are discussed in the conclusions.
Considering that the total global agricultural land area is estimated to have increased by a factor of 10 from 1400 to 1992 (Pongratz et al., 2008) combined with the fact that wind erosion has immensely accelerated within the last 2 centuries (Neff et al., 2008), partly due to intensive grazing by the heavily increasing number of domesticated animals, one could even have expected larger differences between the two data groups, especially in the temperature range around −15 ∘C, at which soil dust INPs from fertile agricultural regions are known to be active (O'Sullivan et al., 2015). We can only speculate why we generally did not observe many INPs in this temperature range and why the significant differences between the two data groups were only observed for temperatures below −22 ∘C. First, it is possible that dust from anthropogenic practices was not transported to central Greenland in a detectable amount. According to Groot Zwaaftink et al. (2016), most of the dust input contributing to the dust surface concentration of the Arctic is from Eurasia north of 60, North America north of 60, and Asia south of 60∘ N. In contrast, North America and Europe south of 60∘ N, where land-use change and the agricultural expansion are most prominent, contribute only little to the Arctic dust input (below 1 %). Moreover, Asian agricultural dust sources may not exhibit the necessary high wind speeds to inject mineral dust into the upper troposphere as required for long-range transport to Greenland. In contrast, mineral dust from the Taklamakan desert is intrinsically linked to dust storms in this area.
Second, the more fragile (biological) INPs may have been deteriorated during sample storage (Beall et al., 2020). As a result, the warm end of INPs might have been largely lost, leaving only a homogeneous fraction of very stable INPs behind. Figures 8 and 9 present some evidence for this hypothesis. As seen in Fig. 8, we find a much narrower range of frozen fractions for the 10-year samples, hinting at a rather homogenous population of INPs. On the other hand, the variability is much higher for the modern-day samples, possibly because some of the more fragile INPs were still active. However, as both sample groups experienced the same sample history after coring, this hypothesis would only be reflected by deterioration effects related to the time elapsed since the particles were deposited in the ice. Furthermore, Fig. 9 depicts increasingly greater relative differences in the INP concentration from −30 to −24 ∘C until the warmer end of the data is reached, at which only few samples show ice nucleation activity. This observation could possibly be explained by assuming that the warmer INPs were largely deactivated due to storage effects.
3.2 Chemical composition of single particles
In total 308 particles were analyzed by SEM in the three selected samples (1977: 36 particles; 1680: 188 particles; 1630: 84 particles). Overall, the chemical composition was very similar between the three samples. The dominant part (287 particles – 93 %) were soil particles, i.e., alumosilicates and silicon oxides (Fig. S5a). Besides the soil particles, 19 iron-rich particles, one titanium-rich, and one calcium carbonate particle were found. Most particles are detected in the size interval 1–2 µm (only 13 particles above 5 µm diameter). Looking at the minor elements in the aluminosilicate particles and the typical elemental ratios, most of the detected alumosilicates are most likely feldspars (and here more sodium and potassium feldspars), amphiboles, and pyroxenes. Besides this, some quartz and clay minerals were also found. Unfortunately, due to the low number of analyzed particles, we were unable to determine significant differences in the particulate composition and size distribution between the three samples. For example, only a very small number of particles were detected on the 1977 sample in the analyzed center region of the filter. Generally, the border regions were not analyzed due to a higher risk of artifacts.
Moreover, a few fly ash particles (8 %) were found in the most recent sample (1977), which indicates an anthropogenic chemical signature (Fig. S5b). Otherwise there was no obvious distinction between the modern-era sample and the other two samples with regards to their chemical composition, which might be due to the limited number of particles analyzed.
3.3 Seasonal cycle of INPs during a high-resolution period
Here we present a case study of 12 samples with an improved time resolution (only 1–2 months each). These samples cover a period of about 1.5 years in 1463–1464 (ice core depth: 87.647 to 87.848 m), thus representing a continuous annual cycle. There was no particular reason why this year was explored specifically. As the CFA decontamination step determined the resolution of samples, there were two periods with samples of near-monthly resolution from which seasonal cycles could be established (1744–1763 and 1454–1468). The latter period was chosen for being unaffected by the industrial revolution.
Figure 11 shows the temperature at which 50 % of the droplets were frozen (T50). The T50 temperature is a simple but meaningful metric, which indicates how ice-active a sample is. For the 12 samples T50 ranged between −28.2 and −31.1 ∘C. The entire T50 range of the ice core is from −20.2 to −32.1 ∘C. Thus, with a span of only 2.9 ∘C the seasonal samples have a significantly smaller range in T50 (76 % smaller) than all samples from the ice core. Hence, the long-term INP variation in the ice core is considerably larger than the short-term variation in that specific year.
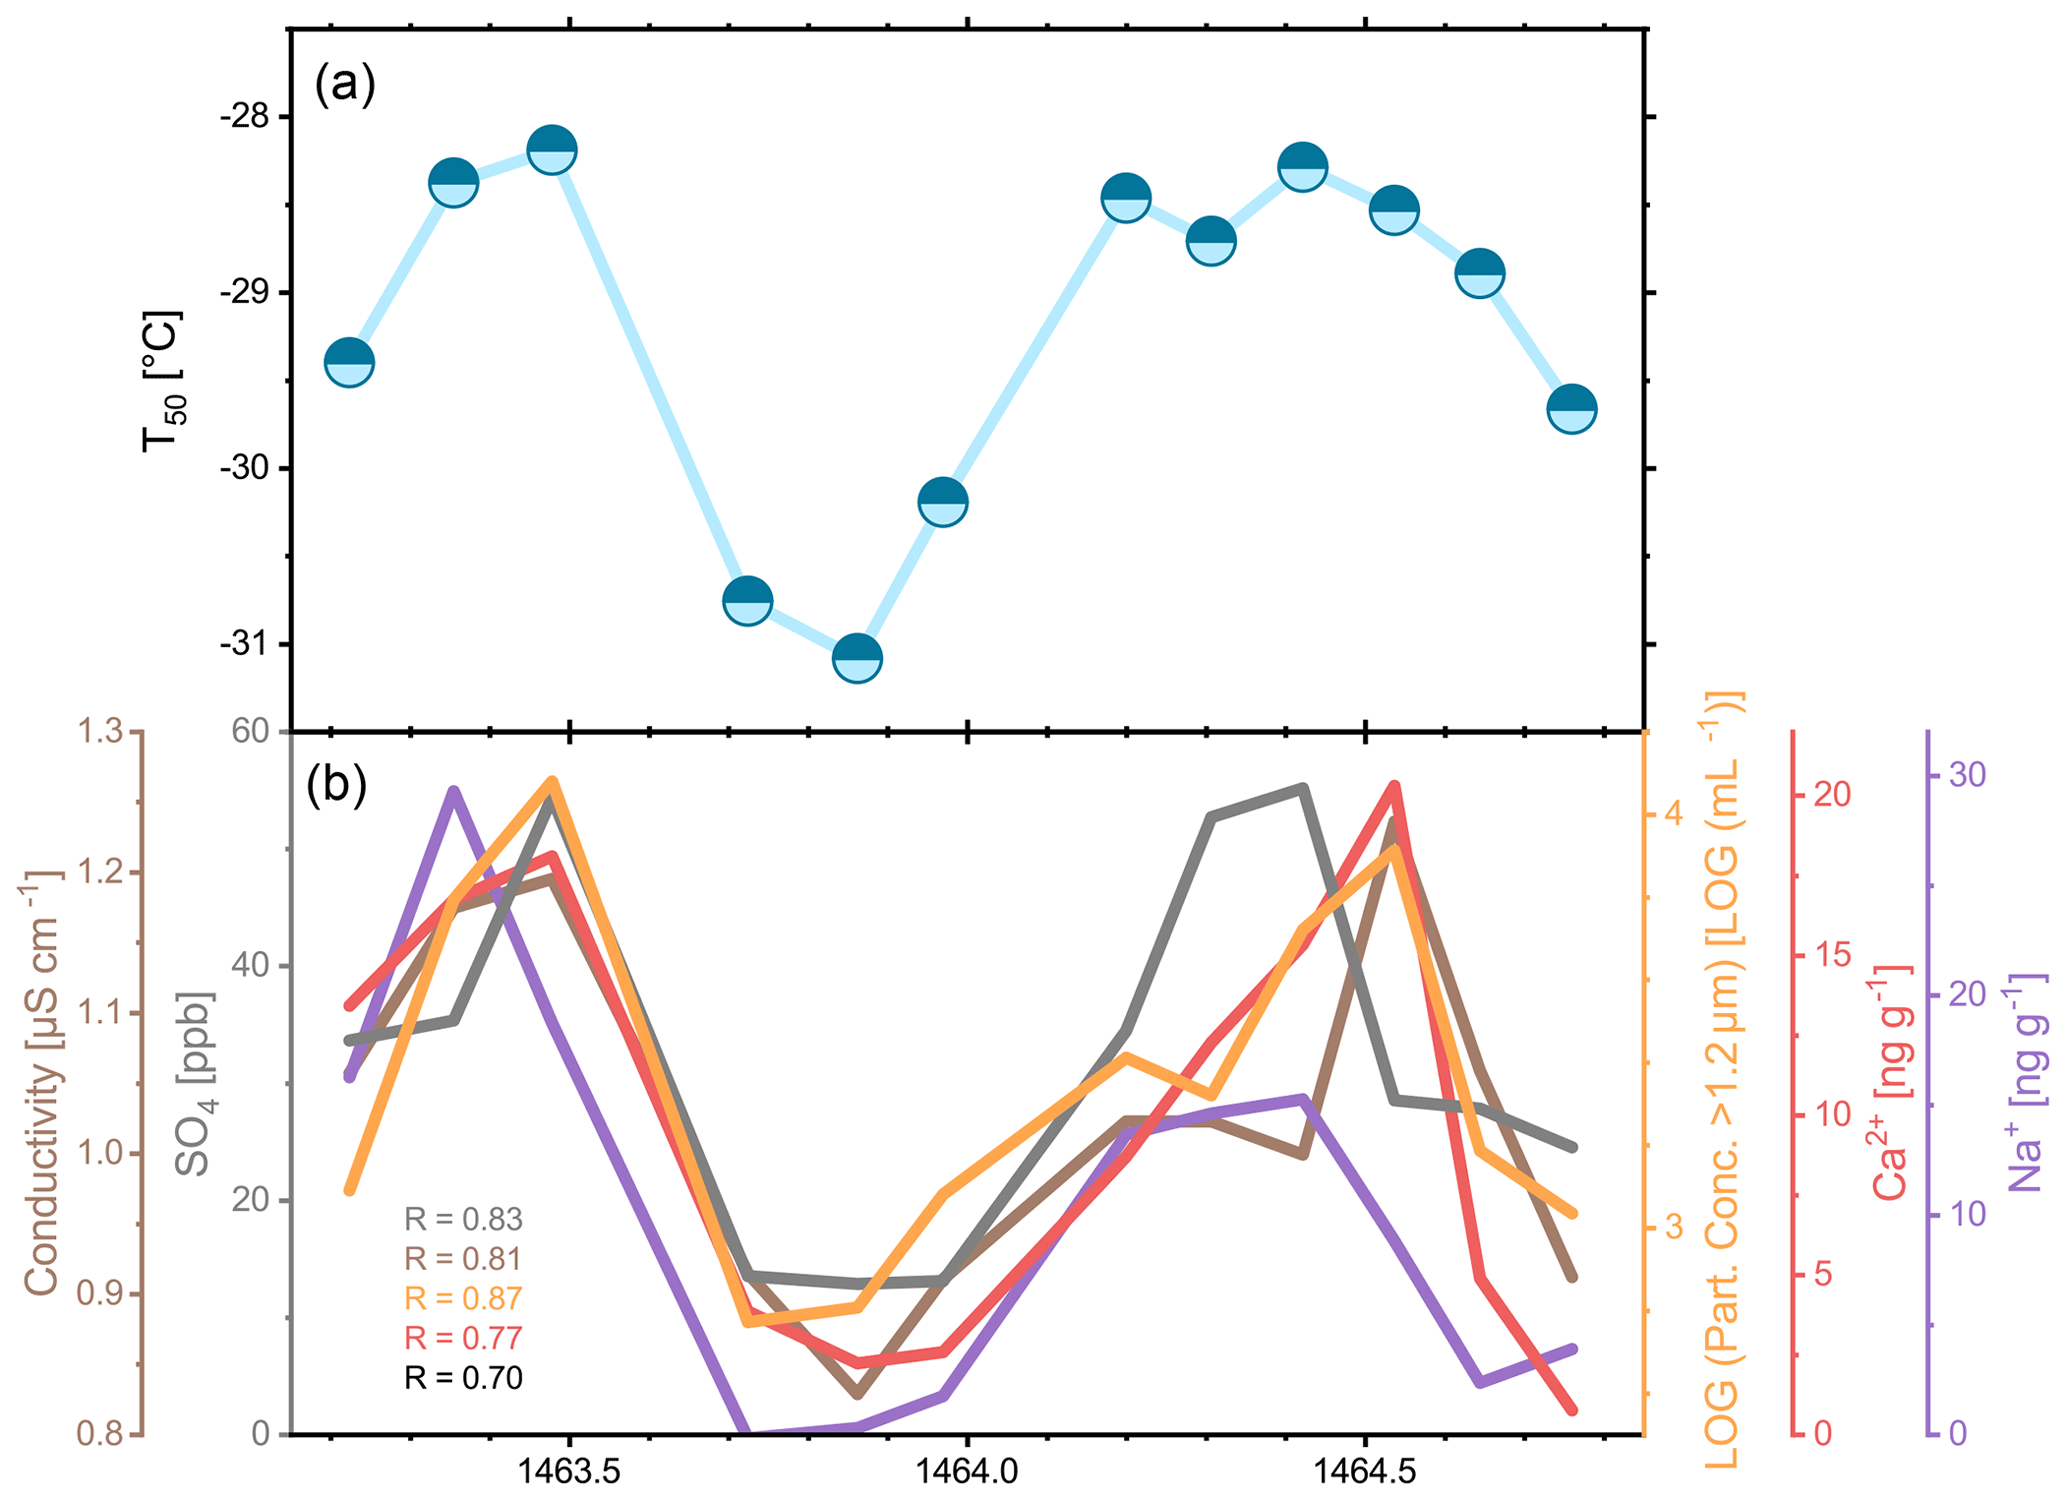
Figure 11(a) Nucleation temperature at which 50 % of the droplets were frozen during a high-resolution period around 1464 (sample resolution: 1–2 months). (b) Corresponding average concentration of IC (SO) and CFA (conductivity, insoluble particles, Ca2+, and Na+) parameters. Pearson coefficients for correlation of parameters to INP concentration are indicated (all p < 0.05). Please note that the x axis may entail some temporal offset, as they refer to individual analyses performed separately on the core which may differ in their depth assignment by 1–2 cm.
The number of data points is too few for an in-depth seasonal analysis, but the ice nucleation activity of the samples shows a clear annual cycle. Interestingly, we find a similar annual pattern for various other IC and CFA parameters (Fig. 11b). The best correlation is found between T50 and the log of the concentration of insoluble particles with spherical diameters larger than 1.2 µm (R=0.87, N=12, p < 0.0003). The minima and maxima of both parameters are largely the same. In addition, even small fluctuations in T50 are reflected in the particle concentration. The results indicate that a higher particle concentration triggers earlier freezing, which is intuitive. A higher number of particles in a droplet means that there is a greater probability of the droplet to contain an INP. These findings suggest that the INP concentration in this year was subject to the annual dust input in Greenland. As the seasonal variability in particulate dust number can be clearly detected throughout the entire core, we expect that such a seasonal INP variability will hold for the entire record. Future high-resolution studies will have to test this assumption. Bory et al. (2002) show that the main dust source in Greenland is the Taklamakan Desert in northern China. At the beginning of the monsoon season, the dust particles are transported to Greenland within a few days via the jet stream and cause the annual maximum dust input for Greenland in spring. Furthermore, episodic dust transport from the Sahara (Lupker et al., 2010) and Iceland (Sanchez-Marroquin et al., 2020) may have contributed as well.
The clear existence of a seasonal cycle and the significant correlation of T50 with the particle concentration also show that the INP background was chosen conservatively and thus confirms the reliability of the data up to this point (at least for the deeper, less porous firn section of the core). Furthermore, the data suggest that even at low temperatures the ice nucleation behavior of the ice core samples is induced by actual atmospheric perturbations.
3.4 Comparison with literature data
Hartmann et al. (2019) found no long-term INP trend in their recent study, in which they analyzed ice core samples from Greenland and Svalbard with two droplet freezing devices. They found the overall range of observed concentrations to be comparable to present-day concentrations. INP concentrations did not seem to be influenced by either anthropogenic impacts or volcanic eruptions. Furthermore, sub-year samples showed a large variability, which was as high or even higher than the total range of the other samples from the ice cores. Hartmann et al. (2019) regularly observed an early nucleation onset, which they interpret as an influence from particles with biological origin.
In general, past atmospheric INP concentrations of this ice core study align reasonably well to the lower end of INP concentrations currently observed in the atmosphere (Fig. 12). INP concentrations in this figure comprise data from vastly different environments and range over 4 orders of magnitude at a certain temperature (Kanji et al., 2017). However, our INP concentrations are significantly lower than those presented in Hartmann et al. (2019). Note that the data are difficult to compare as the freezing spectra do not overlap very well. Ice nucleation in this study occurred largely below −25 ∘C, when most droplets were already frozen in the study of Hartmann et al. (2019). At ∘C Hartmann et al. (2019) found atmospheric INP concentrations from about 0.004 to about 2 L−1, whereas we found INP concentrations between 0.002 and 0.2 L−1. The conversion to atmospheric concentrations was handled differently in both studies, but this does not explain differences of up to 1 order of magnitude. This disparity may arise from experimental (droplet volume), methodological (e.g., sample storage conditions), and/or geographical differences, which may affect the deposition mechanisms and efficiency. Unfortunately, large discrepancies between different INP counters are relatively common, even in controlled laboratory environments (Hiranuma et al., 2015; DeMott et al., 2018; Hiranuma et al., 2019), and can often not be fully explained. Furthermore, the “short-term” variability of adjacent seasonal, dust, and volcano samples was usually lower than the overall variability of the total ice core samples in our study. Whether the INP concentration was influenced by volcanic eruptions or not cannot be assessed conclusively at this point. The Laki eruption of 1783 did not increase the INP concentration; however two samples from 1475 indicate volcanic dust particles with ice nucleation potential.
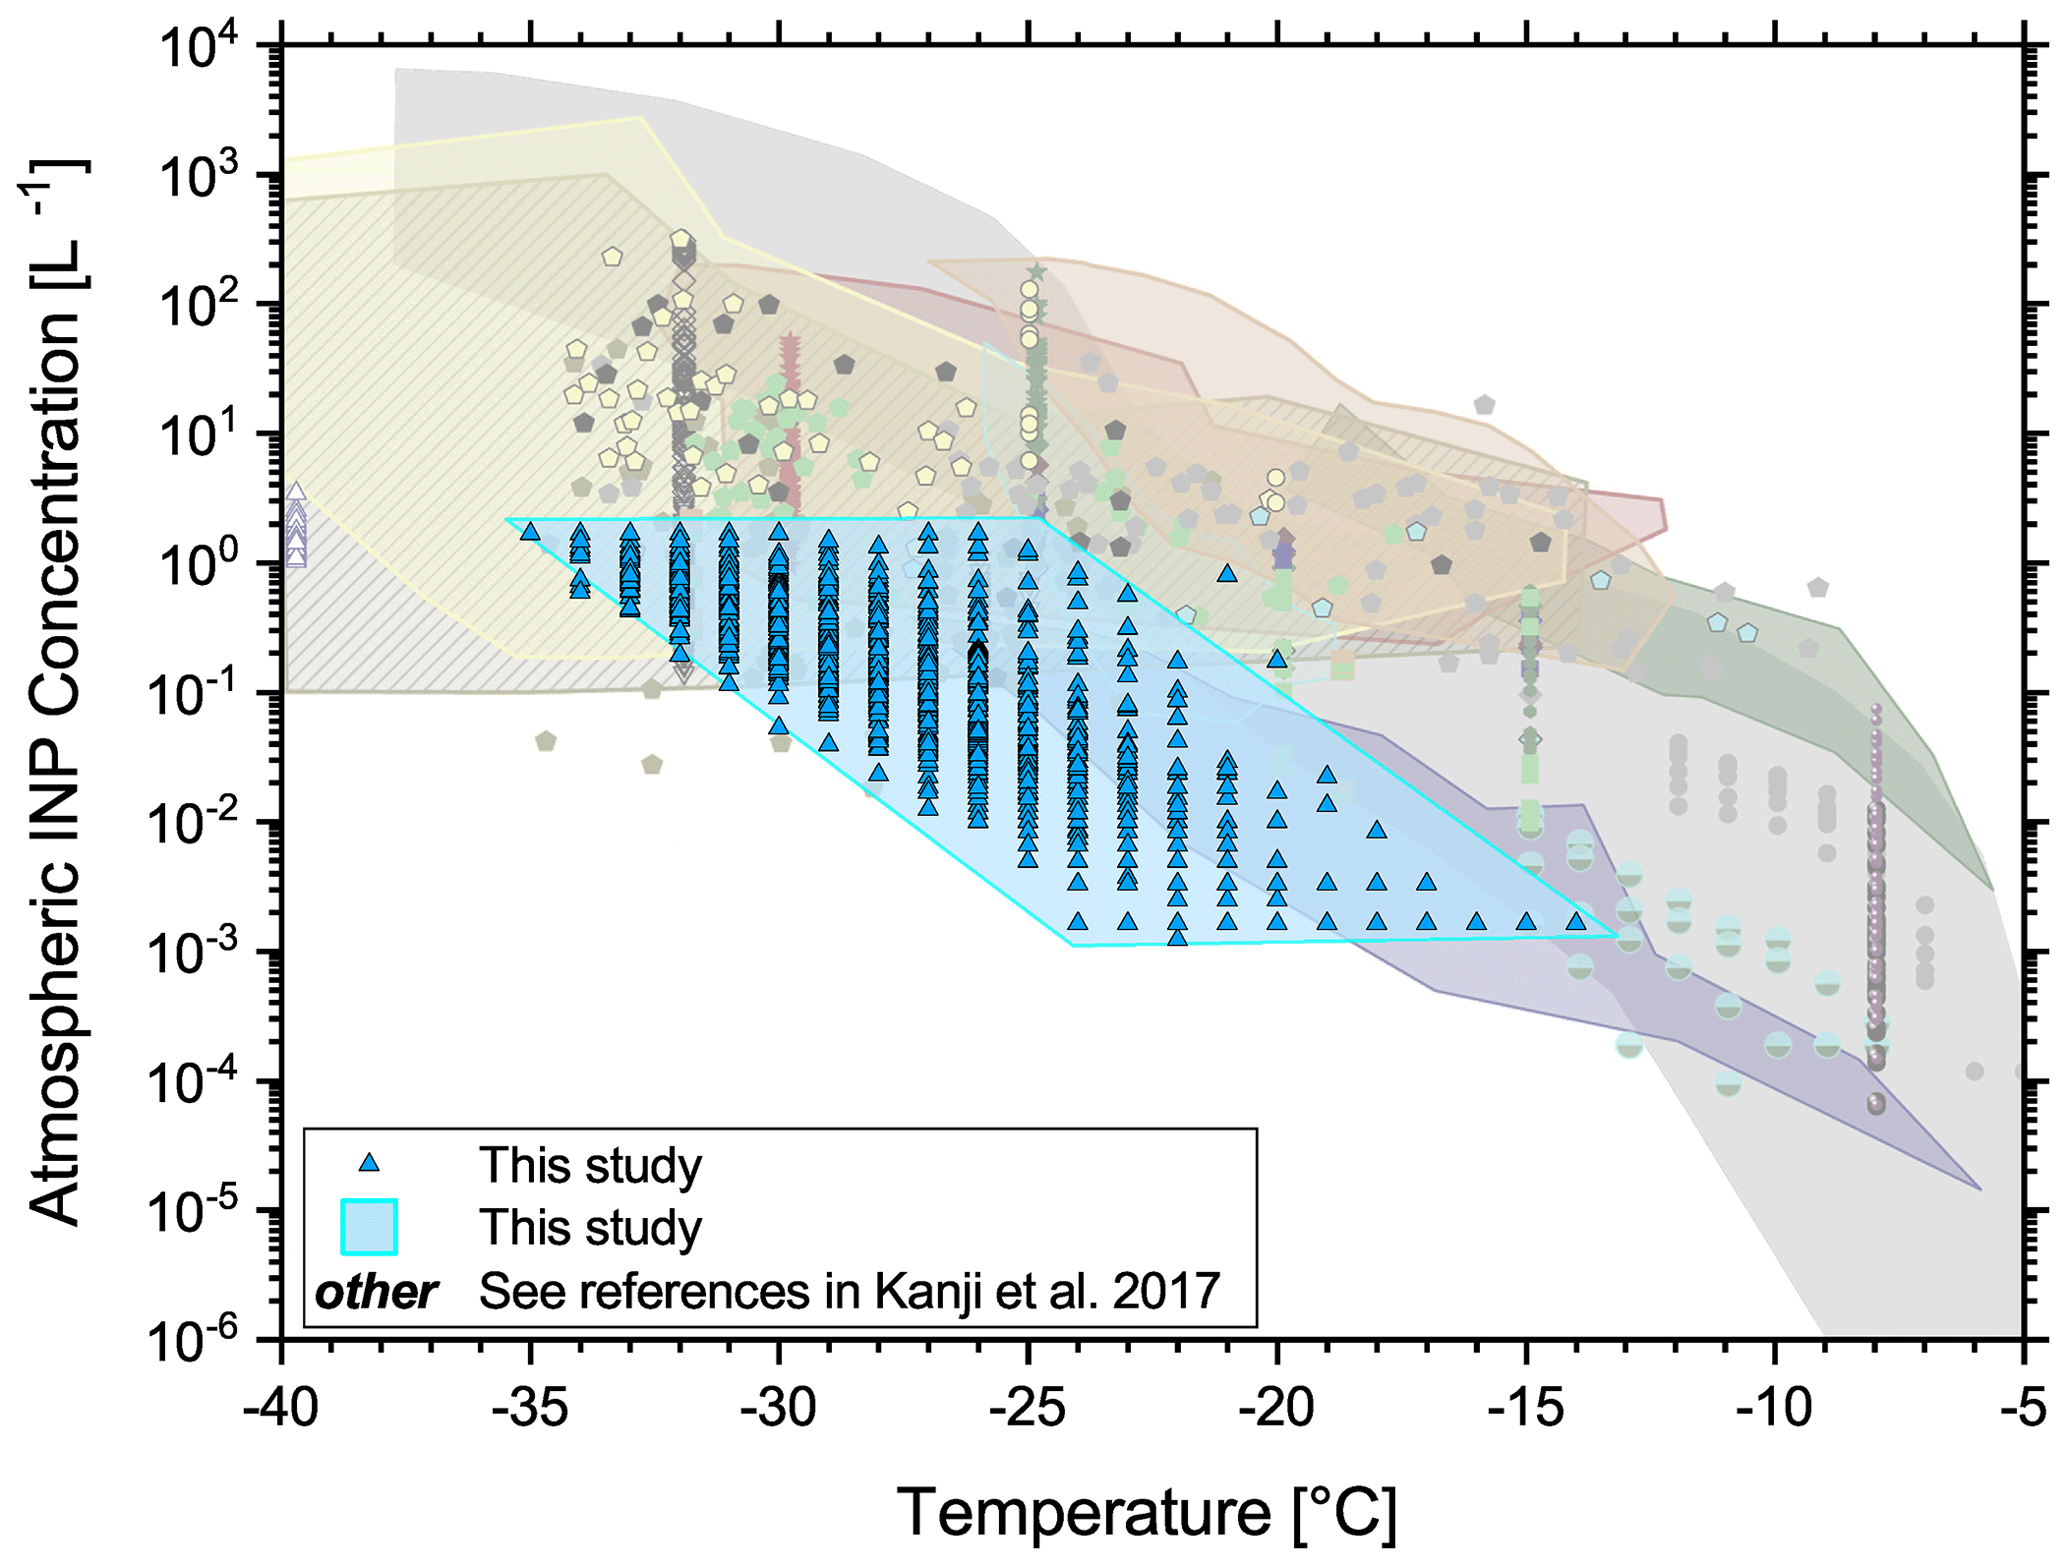
Figure 12Estimated atmospheric INP concentrations of the ice core samples compared to data from other studies of a diverse set of environments as presented in Kanji et al. (2017).
Similarly, we cannot fully exclude an anthropogenic impact on the Arctic INP population. In fact, some evidence indicates that the concentration of INPs active at medium supercooled temperatures has changed significantly after 1960, where we found higher and more variable INP concentrations, compared to the rest of the ice core samples. It is possible that this result could not be observed by Hartmann et al. (2019) for several reasons. First, Hartmann et al. (2019) mainly investigated the temperature regime from −10 to −20 ∘C, while significant differences occurred in our study only below −22 ∘C. Second, the overall temporal distribution of samples in Hartmann et al. (2019) was less regular, had a coarser time resolution, and included only few samples prior to the year 1735. Moreover, we specifically designed our sample selection (regular time intervals of 10 years, increased sample frequency after 1960) with this scientific question in mind.
Moreover, evidence presented in Sect. 3.3 and Table 1 indicated that the long-range-transported dust from East Asian deserts influenced the freezing characteristics of the ice core samples. Laboratory studies characterizing the ice nucleation activity of mineral dust from the Taklamakan desert and other Chinese deserts report active site densities ns at −25 ∘C of approximately 1 × 10¹⁰ m−2 (Niemand et al., 2012; Ullrich et al., 2017) and between 1 × 10¹⁰ and 1 × 10¹¹ m−2 at −30 ∘C (Niemand et al., 2012; Boose et al., 2016; Ullrich et al., 2017; Paramonov et al., 2018). We can only roughly calculate ns from the CFA particle measurements. Lacking a solid particle size distribution measurement, we assumed all counted particles to have a spherical diameter of 1.2 µm. This assumption is obviously flawed, as particles smaller than 1.2 µm were not counted by the CFA measurements, and larger particles were assumed to have this lower size. With this rough assumption, we find an average ns of m−2 at −25 ∘C and m−2 at −30 ∘C, which is in surprisingly good agreement with the literature.
Ice-nucleating particle concentrations of ice core samples were measured in the immersion freezing mode by the FRIDGE droplet freezing assay. This analysis provides valuable insights into atmospheric variables related to microphysical cloud processes of the past 6 centuries. A process-based approach was chosen to estimate order-of-magnitude atmospheric concentrations from the directly observed ice concentration. Ice samples were selected for INP analysis following a systematic protocol.
Overall, the samples were not particularly ice nucleation active, with freezing occurring predominantly below −25 ∘C. However, a selected subset of high-resolution samples displayed meaningful and intuitive results – following a seasonal cycle – even at comparably low temperatures, where some influence from background freezing would usually be expected. Furthermore, we found significant correlations between concentrations of INPs and the insoluble particle concentration > 1.2 µm, Ca2+, and conductivity for a broad range of temperatures. We did not observe a clear trend over time in the INP concentration. Yet, it appears that the population of particles acting as INPs at medium supercooled temperatures has increased since 1960. It is possible that the observed results are caused by an enhanced fraction of particles originating from anthropogenic activity.
This prompts the question of which atmospheric implications can be expected if there were more INPs today than in a preindustrial atmosphere. In general, an increased number of INPs would affect cloud formation processes and consequently radiation interactions (DeMott et al., 2010; Murray, 2017). First, it is generally expected that the lifetime of mixed-phase clouds is shortened in the presence of INPs. Ice crystals will form more rapidly at the expense of cloud droplets and water vapor, leading to earlier precipitation. Since supercooled clouds (e.g., stratus or altocumulus) usually have a net cooling effect, more INPs will consequently decrease this cooling effect due to the shorter lifetime. Similarly, cirrus clouds are also expected to have a shortened lifetime in a high-INP scenario. Compared to a cirrus cloud in which cloud droplets predominantly freeze homogeneously in a narrow temperature range, cirrus clouds that formed by heterogeneous ice nucleation will have fewer but larger ice crystals. Since in this case ice crystals have formed earlier, they have had more time to grow and hence will sooner fall out of the cloud. These upper-tropospheric clouds typically have a net warming effect. A reduced lifetime will decrease this effect. Furthermore, different proportions of water droplets to ice crystals obviously also alter the cloud albedo. Unfortunately, it is rather unclear which of these effects dominates overall.
The apparent finding presented in this study is not to be generalized easily. It investigates only one location in the Arctic, which is quite isolated from direct human influence. It is also possible that, for example, urban aerosols and/or coatings reduce the ice nucleation properties of the INP population as a whole under more direct anthropogenic influence. We stress that the observed differences in the average INP concentration at specific temperatures are statistically significant, but the implications are far from certain. We recommend that our measurements should be repeated and verified in other studies, where we recommend obtaining seasonal resolution of the data, as the existence of a clear seasonality represents an effective check for the quality of the INP results. INP analysis should also be performed immediately after the first melting of the ice core samples.
There is a strong need to investigate INP concentrations of the past, and ice cores provide a unique and feasible opportunity to do so. We suggest analyzing the freezing properties of ice core melt water at different locations worldwide – we feel that other Arctic, Antarctic, and midlatitude Alpine ice cores are equally of interest. Beyond researching a possible anthropogenic INP signal, a multitude of ice core studies could improve our understanding of regional sources and geographical differences of INPs over otherwise inaccessible timescales. Furthermore, we plan to expand our ice core analysis to include a more rigorous, systematic study analyzing the chemical and morphological composition of insoluble aerosol particles as well as their size distribution by scanning electron microscopy. Particle size distributions of liquid samples may also be attainable by the dynamic light scattering and the single-particle scattering and extinction methods. Moreover, future studies would greatly benefit from more comprehensive and precise knowledge about the present-day INP concentration (atmospheric and fresh snow) and its variance, as well as dry and wet deposition metrics at the actual ice core drilling site. Finally, a modeling study could help identify (possibly anthropogenically altered) INP source regions (e.g., based on historical records of land use cover) and estimate the potential atmospheric impact that could be expected from a 3-fold increase in INPs at −24 ∘C since the middle of the twentieth century, as was seen in this study.
The INP data of this study have been uploaded to the PANGAEA data repository: https://doi.org/10.1594/PANGAEA.922047, (Schrod et al., 2020).
The supplement related to this article is available online at: https://doi.org/10.5194/acp-20-12459-2020-supplement.
JS and HB designed the concept of the presented paper. DK, SR, and JS performed the INP measurements. JS compiled and analyzed the INP data with support of DK and SR. JS created the figures. Authors affiliated with the Alfred Wegener Institute and the University of Bern were responsible for the drilling, handling, and cutting of the ice core, performed IC and CFA measurements, and generated the samples for the INP analysis. ME performed the SEM measurements. All authors took part in the discussion of the results. JS wrote the manuscript, receiving valuable input from HB, JC, HF, MH, and TE.
The authors declare that they have no conflict of interest.
The methods and instruments of the ice nucleation experiment of the University of Frankfurt were established through financial support of the Deutsche Forschungsgemeinschaft under Research Cooperations SFB 641 and FOR 1525 (INUIT), which is gratefully acknowledged. Long-term financial support of ice core research at the University of Bern by the Swiss National Science Foundation (SNF) is gratefully acknowledged. Funding for the CFA analyses used in this study was provided by the SNF project iCEP (200020_172506). We thank Remi Dallmayr and Melanie Behrens, who prepared and set up the fraction collection for the CFA campaign, and Chantal Zeppenfeld, who analyzed the Abakus and SPES data.
This open-access publication was funded by the Goethe University Frankfurt. The fond for open-access publications of the Goethe University Frankfurt covered the publication costs of this study.
This paper was edited by Markus Petters and reviewed by three anonymous referees.
Andreae, M. O., Jones, C. D., and Cox, P. M.: Strong present-day aerosol cooling implies a hot future, Nature, 435, 7046, 1187–1190, https://doi.org/10.1038/nature03671, 2005. a
Bales, R. C. and Choi, J.: Conceptual Framework for Interpretation of Exchange Processes, in: Chemical Exchange Between the Atmosphere and Polar Snow, edited by: Wolff, E. W. and Bales R. C., Springer, Berlin, Heidelberg, Germany, 319–338, https://doi.org/10.1007/978-3-642-61171-1_14, 1996. a
Beall, C. M., Lucero, D., Hill, T. C., DeMott, P. J., Stokes, M. D., and Prather, K. A.: Best practices for precipitation sample storage for offline studies of ice nucleation, Atmos. Meas. Tech. Discuss., https://doi.org/10.5194/amt-2020-183, in review, 2020. a, b
Bigler, M., Sommer, S., Stauffer, B., Wagenbach, D., Fischer, H., Kipfstuhl, J., and Miller, H.: Sulphate record from a northeast Greenland ice core over the last 1200 years based on continuous flow analysis, Ann. Glaciol., 35, 250–256, https://doi.org/10.3189/172756402781817158, 2002. a
Boose, Y., Welti, A., Atkinson, J., Ramelli, F., Danielczok, A., Bingemer, H. G., Plötze, M., Sierau, B., Kanji, Z. A., and Lohmann, U.: Heterogeneous ice nucleation on dust particles sourced from nine deserts worldwide – Part 1: Immersion freezing, Atmos. Chem. Phys., 16, 15075–15095, https://doi.org/10.5194/acp-16-15075-2016, 2016. a, b, c, d
Bory, A. J.-M., Biscaye, P. E, Svensson, A., and Grousset, F. E: (2002): Seasonal variability in the origin of recent atmospheric mineral dust at NorthGRIP, Greenland, Earth Planet. Sc. Lett., 196, 123–134, https://doi.org/10.1016/S0012-821X(01)00609-4, 2002. a, b
Bory, A. J.-M., Biscaye, P. E., Piotrowski, A. M., and Steffensen, J. P.: Regional variability of ice core dust composition and provenance in Greenland, Geochem. Geophy. Geosy., 4, 1107, https://doi.org/10.1029/2003GC000627, 2003. a
Burgay, F., Erhardt, T., Della Lunga, D., Jensen, C. M., Spolaor, A., Vallelonga, A., Fischer, H., and Barbante, C.: Fe2+ in ice cores as a new potential proxy to detect past volcanic eruptions, Sci. Total Environ., 654, 1110–1117, https://doi.org/10.1016/j.scitotenv.2018.11.075, 2019. a
Carslaw, K. S., Lee, L. A., Reddington, C. L., Pringle, K. J., Rap, A., Forster, P. M., Mann, G. W., Spracklen, D. V., Woodhouse, M. T., Regayre, L. A., and Pierce, J. R.: Large contribution of natural aerosols to uncertainty in indirect forcing, Nature, 503, 67–71, https://doi.org/10.1038/nature12674, 2013. a
Carslaw, K. S., Gordon, H., Hamilton, D. S., Johnson, J. S., Regayre, L. A., Yoshioka, M., and Pringle, K. J.: Aerosols in the Pre-industrial Atmosphere, Curr. Clim. Change Rep., 3, 1–15, https://doi.org/10.1007/s40641-017-0061-2, 2017. a, b, c
Chen, J., Wu, Z., Augustin-Bauditz, S., Grawe, S., Hartmann, M., Pei, X., Liu, Z., Ji, D., and Wex, H.: Ice-nucleating particle concentrations unaffected by urban air pollution in Beijing, China, Atmos. Chem. Phys., 18, 3523–3539, https://doi.org/10.5194/acp-18-3523-2018, 2018. a
Cheng, I. and Zhang, L.: Long-term air concentrations, wet deposition, and scavenging ratios of inorganic ions, HNO3, and SO2 and assessment of aerosol and precipitation acidity at Canadian rural locations, Atmos. Chem. Phys., 17, 4711–4730, https://doi.org/10.5194/acp-17-4711-2017, 2017. a
Conen, F., Morris, C. E., Leifeld, J., Yakutin, M. V., and Alewell, C.: Biological residues define the ice nucleation properties of soil dust, Atmos. Chem. Phys., 11, 9643–9648, https://doi.org/10.5194/acp-11-9643-2011, 2011. a
Cunningham, J. and Waddington, E. D.: Air flow and dry deposition of non-sea salt sulfate in polar firn: paleoclimatic implications, Atmos. Environ., 27, 2943–2956, https://doi.org/10.1016/0960-1686(93)90327-U, 1993. a
Davidson, C. I., Bergin, M. H., and Kuhns, H. D.: The Deposition of Particles and Gases to Ice Sheets, in: Chemical Exchange Between the Atmosphere and Polar Snow, edited by: Wolff, E. W. and Bales R. C., Springer, Berlin, Heidelberg, Germany, 275–306, https://doi.org/10.1007/978-3-642-61171-1_12, 1996. a
DeMott, P. J., Prenni, A. J., Liu, X., Kreidenweis, S. M., Petters, M. D., Twohy, C. H., Richardson, M. S., Eidhammer T., and Rogers, D. C.: Predicting global atmospheric ice nuclei distributions and their impacts on climate, P. Natl. Acad. Sci. USA, 107, 11217–11222, https://doi.org/10.1073/pnas.0910818107, 2010. a, b
DeMott, P. J., Möhler, O., Cziczo, D. J., Hiranuma, N., Petters, M. D., Petters, S. S., Belosi, F., Bingemer, H. G., Brooks, S. D., Budke, C., Burkert-Kohn, M., Collier, K. N., Danielczok, A., Eppers, O., Felgitsch, L., Garimella, S., Grothe, H., Herenz, P., Hill, T. C. J., Höhler, K., Kanji, Z. A., Kiselev, A., Koop, T., Kristensen, T. B., Krüger, K., Kulkarni, G., Levin, E. J. T., Murray, B. J., Nicosia, A., O'Sullivan, D., Peckhaus, A., Polen, M. J., Price, H. C., Reicher, N., Rothenberg, D. A., Rudich, Y., Santachiara, G., Schiebel, T., Schrod, J., Seifried, T. M., Stratmann, F., Sullivan, R. C., Suski, K. J., Szakáll, M., Taylor, H. P., Ullrich, R., Vergara-Temprado, J., Wagner, R., Whale, T. F., Weber, D., Welti, A., Wilson, T. W., Wolf, M. J., and Zenker, J.: The Fifth International Workshop on Ice Nucleation phase 2 (FIN-02): laboratory intercomparison of ice nucleation measurements, Atmos. Meas. Tech., 11, 6231–6257, https://doi.org/10.5194/amt-11-6231-2018, 2018. a, b, c, d, e
Dibb, J. E.: Overview Of Field Data on the Deposition Of Aerosol-Associated Species to the Surface Snow Of Polar Glaciers, Particularly Recent Work in Greenland, in: Chemical Exchange Between the Atmosphere and Polar Snow, edited by: Wolff, E. W. and Bales R. C., Springer, Berlin, Heidelberg, Germany, 249–274, https://doi.org/10.1007/978-3-642-61171-1_11, 1996. a
Duce, R. A., Liss, P. S., Merrill, J. T., Atlas, E. L., Buat‐Menard, P., Hicks, B. B., Miller, J. M., Prospero, J. M., Arimoto, R., Church, T. M., Ellis, W., Galloway, J. N., Hansen, L., Jickells, T. D., Knap, A. H., Reinhardt, K. H., Schneider, B., Soudine, A., Tokos, J. J., Tsunogai, S., Wollast, R., and Zhou, M.: The atmospheric input of trace species to the world ocean, Global Biogeochem. Cy., 5, 193–259, https://doi.org/10.1029/91GB01778, 1991. a, b, c
Ebert, M., Worringen, A., Benker, N., Mertes, S., Weingartner, E., and Weinbruch, S.: Chemical composition and mixing-state of ice residuals sampled within mixed phase clouds, Atmos. Chem. Phys., 11, 2805–2816, https://doi.org/10.5194/acp-11-2805-2011, 2011. a
Eriksen Hammer, S., Mertes, S., Schneider, J., Ebert, M., Kandler, K., and Weinbruch, S.: Composition of ice particle residuals in mixed-phase clouds at Jungfraujoch (Switzerland): enrichment and depletion of particle groups relative to total aerosol, Atmos. Chem. Phys., 18, 13987–14003, https://doi.org/10.5194/acp-18-13987-2018, 2018. a
Fiacco, R. J., Thordarson, T., Germani, M. S., Self, S., Palais, J. M., Whitlow, S., and Grootes, P. M.: Atmospheric aerosol loading and transport due to the 1783–84 Laki eruption in Iceland, interpreted from ash particles and acidity in the GISP2 ice core, Quaternary Res., 42, 231–240, https://doi.org/10.1006/qres.1994.1074, 1994. a
Field, P. R., Möhler, O., Connolly, P., Krämer, M., Cotton, R., Heymsfield, A. J., Saathoff, H., and Schnaiter, M.: Some ice nucleation characteristics of Asian and Saharan desert dust, Atmos. Chem. Phys., 6, 2991–3006, https://doi.org/10.5194/acp-6-2991-2006, 2006. a
Fischer, H., Wagenbach, D., and Kipfstuhl, J.: Sulfate and nitrate firn concentrations on the Greenland ice sheet: (2) Temporal anthropogenic deposition changes, J. Geophys. Res.-Atmos., 103, 21935–21942, https://doi.org/10.1029/98JD01886, 1998. a
Fischer, H., Siggaard‐Andersen, M.-L., Ruth, U., Röthlisberger, R., and Wolff, E.: Glacial/interglacial changes in mineral dust and sea‐salt records in polar ice cores: Sources, transport, and deposition, Rev. Geophys., 45, RG1002, https://doi.org/10.1029/2005RG000192, 2007. a, b
Ganor, E., Osetinsky, I., Stupp, A., and Alpert, P.: Increasing trend of African dust, over 49 years, in the eastern Mediterranean, J. Geophys. Res.-Atmos., 115, D07201, https://doi.org/10.1029/2009JD012500, 2010. a
Grawe, S., Augustin-Bauditz, S., Hartmann, S., Hellner, L., Pettersson, J. B. C., Prager, A., Stratmann, F., and Wex, H.: The immersion freezing behavior of ash particles from wood and brown coal burning, Atmos. Chem. Phys., 16, 13911–13928, https://doi.org/10.5194/acp-16-13911-2016, 2016. a
Grawe, S., Augustin-Bauditz, S., Clemen, H.-C., Ebert, M., Eriksen Hammer, S., Lubitz, J., Reicher, N., Rudich, Y., Schneider, J., Staacke, R., Stratmann, F., Welti, A., and Wex, H.: Coal fly ash: linking immersion freezing behavior and physicochemical particle properties, Atmos. Chem. Phys., 18, 13903–13923, https://doi.org/10.5194/acp-18-13903-2018, 2018. a
Groot Zwaaftink, C. D., Grythe, H., Skov, H., and Stohl, A.: Substantial contribution of northern high‐latitude sources to mineral dust in the Arctic, J. Geophys. Res.-Atmos., 121, 13678–13697, https://doi.org/10.1002/2016JD025482, 2016. a
Hamilton, D. S., Lee, L. A., Pringle, K. J., Reddington, C. L., Spracklen, D. V., and Carslaw, K. S.: Pristine aerosol on a polluted planet, P. Natl. Acad. Sci. USA, 111, 18466–18471, https://doi.org/10.1073/pnas.1415440111, 2014. a
Hamilton, D. S., Hantson, S., Scott, C. E., Kaplan, J. O., Pringle, K. J., Nieradzik, L. P., Rap, A., Folberth, G. A., Spracklen, D. V., and Carslaw, K. S.: Reassessment of pre-industrial fire emissions strongly affects anthropogenic aerosol forcing, Nat. Commun., 9, 3182, https://doi.org/10.1038/s41467-018-05592-9, 2018. a
Hartmann, M., Blunier, T., Brügger, S. O., Schmale, J., Schwikowski, M., Vogel, A., Wex, H., and Stratmann, F.: Variation of ice nucleating particles in the European Arctic over the last centuries, Geophys. Res. Lett., 46, 4007–4016, https://doi.org/10.1029/2019GL082311, 2019. a, b, c, d, e, f, g, h, i, j, k, l
Hill, T. C. J., DeMott, P. J., Tobo, Y., Fröhlich-Nowoisky, J., Moffett, B. F., Franc, G. D., and Kreidenweis, S. M.: Sources of organic ice nucleating particles in soils, Atmos. Chem. Phys., 16, 7195–7211, https://doi.org/10.5194/acp-16-7195-2016, 2016. a
Hiranuma, N., Augustin-Bauditz, S., Bingemer, H., Budke, C., Curtius, J., Danielczok, A., Diehl, K., Dreischmeier, K., Ebert, M., Frank, F., Hoffmann, N., Kandler, K., Kiselev, A., Koop, T., Leisner, T., Möhler, O., Nillius, B., Peckhaus, A., Rose, D., Weinbruch, S., Wex, H., Boose, Y., DeMott, P. J., Hader, J. D., Hill, T. C. J., Kanji, Z. A., Kulkarni, G., Levin, E. J. T., McCluskey, C. S., Murakami, M., Murray, B. J., Niedermeier, D., Petters, M. D., O'Sullivan, D., Saito, A., Schill, G. P., Tajiri, T., Tolbert, M. A., Welti, A., Whale, T. F., Wright, T. P., and Yamashita, K.: A comprehensive laboratory study on the immersion freezing behavior of illite NX particles: a comparison of 17 ice nucleation measurement techniques, Atmos. Chem. Phys., 15, 2489–2518, https://doi.org/10.5194/acp-15-2489-2015, 2015. a, b, c
Hiranuma, N., Adachi, K., Bell, D. M., Belosi, F., Beydoun, H., Bhaduri, B., Bingemer, H., Budke, C., Clemen, H.-C., Conen, F., Cory, K. M., Curtius, J., DeMott, P. J., Eppers, O., Grawe, S., Hartmann, S., Hoffmann, N., Höhler, K., Jantsch, E., Kiselev, A., Koop, T., Kulkarni, G., Mayer, A., Murakami, M., Murray, B. J., Nicosia, A., Petters, M. D., Piazza, M., Polen, M., Reicher, N., Rudich, Y., Saito, A., Santachiara, G., Schiebel, T., Schill, G. P., Schneider, J., Segev, L., Stopelli, E., Sullivan, R. C., Suski, K., Szakáll, M., Tajiri, T., Taylor, H., Tobo, Y., Ullrich, R., Weber, D., Wex, H., Whale, T. F., Whiteside, C. L., Yamashita, K., Zelenyuk, A., and Möhler, O.: A comprehensive characterization of ice nucleation by three different types of cellulose particles immersed in water, Atmos. Chem. Phys., 19, 4823–4849, https://doi.org/10.5194/acp-19-4823-2019, 2019. a, b, c
IPCC, 2019: Summary for Policymakers, in: Climate Change and Land: an IPCC special report on climate change, desertification, land degradation, sustainable land management, food security, and greenhouse gas fluxes in terrestrial ecosystems, edited by: Shukla, P. R., Skea, J., Calvo Buendia, E., Masson-Delmotte, V., Pörtner, H.-O., Roberts, D. C., Zhai, P., Slade, R., Connors, S., van Diemen, R., Ferrat, M., Haughey, E., Luz, S., Neogi, S., Pathak, M., Petzold, J., Portugal Pereira, J., Vyas, P., Huntley, E., Kissick, K., Belkacemi, M., and Malley, J., in press, 2019. a, b
Kanji, Z. A., Ladino, L. A., Wex, H., Boose, Y., Burkert-Kohn, M., Cziczo, D. J., and Krämer, M.: Overview of Ice Nucleating Particles, Meteor. Mon., 58, 1.1–1.33, https://doi.org/10.1175/AMSMONOGRAPHS-D-16-0006.1, 2017. a, b
Kanji, Z. A., Welti, A., Corbin, J. C., and Mensah, A. A.: Black carbon particles do not matter for immersion mode ice nucleation, Geophys. Res. Lett., 46, e2019GL086764, https://doi.org/10.1029/2019GL086764, 2020. a
Kaspari, S., Mayewski, P. A., Handley, M., Osterberg, E., Kang, S., Sneed, S., Hou, S., and Qin, D.: Recent increases in atmospheric concentrations of Bi, U, Cs, S and Ca from a 350‐year Mount Everest ice core record, J. Geophys. Res.-Atmos., 114, D04302, https://doi.org/10.1029/2008JD011088, 2009. a
Kaspari, S. D., Schwikowski, M., Gysel, M., Flanner, M. G., Kang, S., Hou, S., and Mayewski, P. A.: Recent increase in black carbon concentrations from a Mt. Everest ice core spanning 1860–2000 AD, Geophys. Res. Lett., 38, L04703, https://doi.org/10.1029/2010GL046096, 2011. a
Kaufmann, P. R., Federer, U., Hutterli, M. A., Bigler, M., Schüpbach, S., Ruth, U., Schmitt, J., and Stocker, T. F.: An Improved Continuous Flow Analysis System for High-Resolution Field Measurements on Ice Cores, Environ. Sci. Technol., 42, 8044–8050, https://doi.org/10.1021/es8007722, 2008. a, b, c
Klein, H., Haunold, W., Bundke, U., Nillius, B., Wetter, T., Schallenberg, S., and Bingemer, H.: A new method for sampling of atmospheric ice nuclei with subsequent analysis in a static diffusion chamber, Atmos. Res., 96, 218–224, https://doi.org/10.1016/j.atmosres.2009.08.002, 2010. a, b
Levin, E. J. T., McMeeking, G. R., DeMott, P. J., McCluskey, C. S., Carrico, C. M., Nakao, S., Jayarathne, T., Stone, E. A., Stockwell, C. E., Yokelson, R. J., and Kreidenweis, S. M.: Ice‐nucleating particle emissions from biomass combustion and the potential importance of soot aerosol, J. Geophys. Res.-Atmos., 121, 5888–5903, https://doi.org/10.1002/2016JD024879, 2016. a
Lohmann, U.: Aerosol-Cloud Interactions and Their Radiative Forcing, Encyclopedia of Atmospheric Sciences, 1, 17–22, Amsterdam: Elsevier Academic Press, https://doi.org/10.1016/B978-0-12-382225-3.00052-9, 2015. a
Lupker, M. Aciego, S. M., Bourdon, B., Schwander, J., and Stocker, T. F.: Isotopic tracing (Sr, Nd, U and Hf) of continental and marine aerosols in an 18th century section of the Dye-3 ice core (Greenland), Earth Planet. Sc. Lett., 295, 277–286, https://doi.org/10.1016/j.epsl.2010.04.010, 2010. a
Marinou, E., Tesche, M., Nenes, A., Ansmann, A., Schrod, J., Mamali, D., Tsekeri, A., Pikridas, M., Baars, H., Engelmann, R., Voudouri, K.-A., Solomos, S., Sciare, J., Groß, S., Ewald, F., and Amiridis, V.: Retrieval of ice-nucleating particle concentrations from lidar observations and comparison with UAV in situ measurements, Atmos. Chem. Phys., 19, 11315–11342, https://doi.org/10.5194/acp-19-11315-2019, 2019. a
McCluskey, C. S., DeMott, P. J., Prenni, A. J., Levin, E. J. T., McMeeking, G. R., Sullivan, A. P., Hill, T. C. J., Nakao, S., Carrico, C. M., and Kreidenweis, S. M.: Characteristics of atmospheric ice nucleating particles associated with biomass burning in the US: Prescribed burns and wildfires, J. Geophys. Res.-Atmos., 119, 10458–10470, https://doi.org/10.1002/2014JD021980, 2014. a
McConnell, J. R., Edwards, R., Kok, G. L., Flanner, M. G., Zender, C. S., Saltzman, E. S., Banta, J. R., Pasteris, D. R., Carter, M. M., and Kahl, J. D. W.: 20th-Century Industrial Black Carbon Emissions Altered Arctic Climate Forcing, Science, 317, 1381–1384, https://doi.org/10.1126/science.1144856, 2007. a
Mülmenstädt, J., Sourdeval, O., Delanoë, J., and Quaas, J.: Frequency of occurrence of rain from liquid-, mixed-, and ice-phase clouds derived from A-Train satellite retrievals, Geophys. Res. Lett., 42, 6502–6509, https://doi.org/10.1002/2015GL064604, 2015. a
Murray, B. J.: Cracking the problem of ice nucleation, Science, 355, 346–347,https://doi.org/10.1126/science.aam5320, 2017. a
Murray, B. J., O'Sullivan, D., Atkinson, J. D., and Webb, M. E.: Ice nucleation by particles immersed in supercooled cloud droplets, Chem. Soc. Rev., 41, 6519–6554, https://doi.org/10.1039/C2CS35200A, 2012. a
Neff, J. C., Ballantyne, A. P., Farmer, G. L., Mahowald, N. M., Conroy, J. L., Landry, C. C., Overpeck, J. T., Painter, T. H., Lawrence C. R., and Reynolds, R. L.: Increasing eolian dust deposition in the western United States linked to human activity, Nat. Geosci., 1, 189–195, https://doi.org/10.1038/ngeo133, 2008. a
Niemand, M., Möhler, O., Vogel, B., Hoose, C., Conolly, P., Klein, H., Bingemer, H., DeMott, P., Skrotzki, J., and Leisner, T.: A Particle-Surface-Area-Based Parameterization of Immersion Freezing on Desert Dust Particles, J. Atmos. Sci., 69, 3077–3092, https://doi.org/10.1175/JAS-D-11-0249.1, 2012. a, b, c, d
O′Sullivan, D., Murray, B., Ross, J., Whale, T. F., Price, H. C., Atkinson, J. D., Umo, N. S., and Webb, M. E.: The relevance of nanoscale biological fragments for ice nucleation in clouds, Sci. Rep.-UK, 5, 8082, https://doi.org/10.1038/srep08082, 2015. a, b
Paramonov, M., David, R. O., Kretzschmar, R., and Kanji, Z. A.: A laboratory investigation of the ice nucleation efficiency of three types of mineral and soil dust, Atmos. Chem. Phys., 18, 16515–16536, https://doi.org/10.5194/acp-18-16515-2018, 2018. a, b
Petters, M. D. and Wright, T. P.: Revisiting ice nucleation from precipitation samples, Geophys. Res. Lett., 42, 8758–8766, https://doi.org/10.1002/2015GL065733, 2015. a, b, c, d
Polen, M., Brubaker, T., Somers, J., and Sullivan, R. C.: Cleaning up our water: reducing interferences from nonhomogeneous freezing of “pure” water in droplet freezing assays of ice-nucleating particles, Atmos. Meas. Tech., 11, 5315–5334, https://doi.org/10.5194/amt-11-5315-2018, 2018. a, b
Pongratz, J., Reick, C., Raddatz, T., and Claussen, M.: A reconstruction of global agricultural areas and land cover for the last millennium, Global Biogeochem. Cy., 22, GB3018, https://doi.org/10.1029/2007GB003153, 2008. a
Sanchez-Marroquin, A., Arnalds, O., Baustian-Dorsi, K. J., Browse, J., Dagsson-Waldhauserova, P., Harrison, A. D., Maters, E. C., Pringle, K. J., Vergara-Temprado, J., Burke, I. T., McQuaid, J. B., Carslaw, K. S., and Murray, B. J.: Iceland is an episodic source of atmospheric ice-nucleating particles relevant for mixed-phase clouds, Science Advances, 6, eaba8137, https://doi.org/10.1126/sciadv.aba8137, 2020. a
Schrod, J., Danielczok, A., Weber, D., Ebert, M., Thomson, E. S., and Bingemer, H. G.: Re-evaluating the Frankfurt isothermal static diffusion chamber for ice nucleation, Atmos. Meas. Tech., 9, 1313–1324, https://doi.org/10.5194/amt-9-1313-2016, 2016. a, b
Schrod, J., Weber, D., Drücke, J., Keleshis, C., Pikridas, M., Ebert, M., Cvetković, B., Nickovic, S., Marinou, E., Baars, H., Ansmann, A., Vrekoussis, M., Mihalopoulos, N., Sciare, J., Curtius, J., and Bingemer, H. G.: Ice nucleating particles over the Eastern Mediterranean measured by unmanned aircraft systems, Atmos. Chem. Phys., 17, 4817–4835, https://doi.org/10.5194/acp-17-4817-2017, 2017. a
Schrod, J., Kleinhenz, D., Hörhold, M., Erhardt, T., Richter, S., Wilhelms, F., Fischer, H., Ebert, M., Twarloh, B., Della Lunga, D., Jensen, C. M., Curtius, J., Bingemer, H. G.: Ice nucleating particle concentrations by droplet freezing assay measurements from the B17 ice core, Greenland, dating from 1370 to 1990, PANGAEA, https://doi.org/10.1594/PANGAEA.922047, 2020. a
Schüpbach, S., Fischer, H., Bigler, M., Erhardt, T., Gfeller, G., Leuenberger, D., Mini, O., Mulvaney, R., Abram, N. J., Fleet, L., Frey, M. M., Thomas, E., Svensson, A., Dahl-Jensen, D., Kettner, E., Kjaer, H., Seierstad, I., Steffensen, J. P., Rasmussen, S. O., Vallelonga, P., Winstrup, M., Wegner, A., Twarloh, B., Wolff, K., Schmidt, K., Goto-Azuma, K., Kuramoto, T., Hirabayashi, M., Uetake, J., Zheng, J., Bourgeois, J., Fisher, D., Zhiheng, D., Xiao, C., Legrand, M., Spolaor, A., Gabrieli, J., Barbante, C., Kang, J.-H., Hur, S. D., Hong, S. B., Hwang, H. J., Hong, S., Hansson, M., Iizuka, Y., Oyabu, I., Muscheler, R., Adolphi, F., Maselli, O., McConnell, J., and Wolff, E. W.: Greenland records of aerosol source and atmospheric lifetime changes from the Eemian to the Holocene, Nat. Commun., 9, 1476, https://doi.org/10.1038/s41467-018-03924-3, 2018. a
Seinfeld, J. H. and Pandis, S. N. (Eds.): Atmospheric Chemistry and Physics: From Air Pollution to Climate Change, 2nd Edition, John Wiley & Sons, New York, USA, ISBN 13:978-0-471-72018-8 ISBN 10:0-471-72018-6, 2006. a, b
Shao, Y.: Dust Transport and Deposition, in: Physics and Modelling of Wind Erosion. Atmospheric and Oceanographic Sciences Library, edited by: Shao, Y., Springer, Dordrecht, Germany, 37, 247–301, https://doi.org/10.1007/978-1-4020-8895-7_8, 1996. a, b
Shaw, G. E.: The Arctic Haze Phenomenon, Bull. Amer. Meteor. Soc., 76, 2403–2414, https://doi.org/10.1175/1520-0477(1995)076<2403:TAHP>2.0.CO;2, 1995. a
Shukla, P. R., Skea, J., Slade, R., van Diemen, R., Haughey, E., Malley, J., Pathak, M., and Portugal Pereira, J. (Eds.): Technical Summary, 2019, in: Climate Change and Land: an IPCC special report on climate change, desertification, land degradation, sustainable land management, food security, and greenhouse gas fluxes in terrestrial ecosystems, edited by: Shukla, P. R., Skea, J., Calvo Buendia, E., Masson-Delmotte, V., Pörtner, H.-O., Roberts, D. C., Zhai, P., Slade, R., Connors, S., van Diemen, R., Ferrat, M., Haughey, E., Luz, S., Neogi, S., Pathak, M., Petzold, J., Portugal Pereira, J., Vyas, P., Huntley, E., Kissick, K., Belkacemi, M., and Malley, J., in press, 2019. a
Sigl, M., Abram, N. J., Gabrieli, J., Jenk, T. M., Osmont, D., and Schwikowski, M.: 19th century glacier retreat in the Alps preceded the emergence of industrial black carbon deposition on high-alpine glaciers, The Cryosphere, 12, 3311–3331, https://doi.org/10.5194/tc-12-3311-2018, 2018. a
Steinke, I., Funk, R., Busse, J., Iturri, A., Kirchen, S., Leue, M., Möhler, O., Schwartz, T., Schnaiter, M., Sierau, B., Toprak, E., Ullrich, R., Ulrich, A., Hoose, C., and Leisner, T.: Ice nucleation activity of agricultural soil dust aerosols from Mongolia, Argentina, and Germany, J. Geophys. Res.-Atmos., 121, 13559–13576, https://doi.org/10.1002/2016JD025160, 2016. a
Stier, P., Feichter, J., Roeckner, E., Kloster, S., and Esch, M.: The evolution of the global aerosol system in a transient climate simulation from 1860 to 2100, Atmos. Chem. Phys., 6, 3059–3076, https://doi.org/10.5194/acp-6-3059-2006, 2006. a
Svensson, A., Biscaye, P. E., and Grousset, F. E.: Characterization of late glacial continental dust in the Greenland Ice Core Project ice core, J. Geophys. Res.-Atmos., 105, 4637–4656, https://doi.org/10.1029/1999JD901093, 2000. a
Thomson, E. S., Weber, D., Bingemer, H. G., Tuomi, J., Ebert, M., and Pettersson, J. B. C.: Intensification of ice nucleation observed in ocean ship emissions, Sci. Rep.-UK, 8, 1111, https://doi.org/10.1038/s41598-018-19297-y, 2018. a
Thordarson, T. and Self, A.: The Laki (Skaftar Fires) and Grimsvötn eruptions in 1783–1785, Bull. Volcanol., 55, 233–263, https://doi.org/10.1007/BF00624353, 1993. a
Thordarson, T. and Self, S.: Atmospheric and environmental effects of the 1783–1784 Laki eruption: A review and reassessment, J. Geophys. Res.-Atmos., 108, 4011, https://doi.org/10.1029/2001JD002042, 2003. a
Tison, J.-L., de Angelis, M., Littot, G., Wolff, E., Fischer, H., Hansson, M., Bigler, M., Udisti, R., Wegner, A., Jouzel, J., Stenni, B., Johnsen, S., Masson-Delmotte, V., Landais, A., Lipenkov, V., Loulergue, L., Barnola, J.-M., Petit, J.-R., Delmonte, B., Dreyfus, G., Dahl-Jensen, D., Durand, G., Bereiter, B., Schilt, A., Spahni, R., Pol, K., Lorrain, R., Souchez, R., and Samyn, D.: Retrieving the paleoclimatic signal from the deeper part of the EPICA Dome C ice core, The Cryosphere, 9, 1633–1648, https://doi.org/10.5194/tc-9-1633-2015, 2015. a
Tobo, Y., DeMott, P. J., Hill, T. C. J., Prenni, A. J., Swoboda-Colberg, N. G., Franc, G. D., and Kreidenweis, S. M.: Organic matter matters for ice nuclei of agricultural soil origin, Atmos. Chem. Phys., 14, 8521–8531, https://doi.org/10.5194/acp-14-8521-2014, 2014. a
Tsigaridis, K., Krol, M., Dentener, F. J., Balkanski, Y., Lathière, J., Metzger, S., Hauglustaine, D. A., and Kanakidou, M.: Change in global aerosol composition since preindustrial times, Atmos. Chem. Phys., 6, 5143–5162, https://doi.org/10.5194/acp-6-5143-2006, 2006. a
Twohy, C. H., DeMott, P. J., Pratt, K. A., Subramanian, R., Kok, G. L., Murphy, S. M., Lersch, T., Heymsfield, A. J., Wang, Z., Prather, K. A., and Seinfeld, J. H.: Relationships of Biomass-Burning Aerosols to Ice in Orographic Wave Clouds, J. Atmos. Sci., 67, 2437–2450, https://doi.org/10.1175/2010JAS3310.1, 2010. a
Ullrich, R., Hoose, C., Möhler, O., Niemand, M., Wagner, R., Höhler, K., Hiranuma, N., Saathoff, H., and Leisner, T.: A New Ice Nucleation Active Site Parameterization for Desert Dust and Soot, J. Atmos. Sci., 74, 699–717, https://doi.org/10.1175/JAS-D-16-0074.1, 2017. a, b, c, d
Umo, N. S., Murray, B. J., Baeza-Romero, M. T., Jones, J. M., Lea-Langton, A. R., Malkin, T. L., O'Sullivan, D., Neve, L., Plane, J. M. C., and Williams, A.: Ice nucleation by combustion ash particles at conditions relevant to mixed-phase clouds, Atmos. Chem. Phys., 15, 5195–5210, https://doi.org/10.5194/acp-15-5195-2015, 2015. a
Vali, G.: Quantitative Evaluation of Experimental Results an the Heterogeneous Freezing Nucleation of Supercooled Liquids, J. Atmos. Sci., 28, 402–409, https://doi.org/10.1175/1520-0469(1971)028<0402:QEOERA>2.0.CO;2, 1971. a
Weißbach, S., Wegner, A., Opel, T., Oerter, H., Vinther, B. M., and Kipfstuhl, S.: Spatial and temporal oxygen isotope variability in northern Greenland – implications for a new climate record over the past millennium, Clim. Past, 12, 171–188, https://doi.org/10.5194/cp-12-171-2016, 2016. a, b, c, d, e
Wolff, E. W.: The record of aerosol deposited species in ice cores, and problems of interpretation, in: Chemical Exchange Between the Atmosphere and Polar Snow, edited by: Wolff, E. W. and Bales, R. C., Springer, Berlin, Heidelberg, Germany, 43, 1–17, https://doi.org/10.1007/978-3-642-61171-1_1, 1996. a
Zalasiewicz, J., Williams, M., Haywood, A., and Ellis, M.: The Anthropocene: a new epoch of geological time?, Phil. Trans. R. Soc. A., 369, 835–841, https://doi.org/10.1098/rsta.2010.0339, 2011. a
Zhang, L. and He, Z.: Technical Note: An empirical algorithm estimating dry deposition velocity of fine, coarse and giant particles, Atmos. Chem. Phys., 14, 3729–3737, https://doi.org/10.5194/acp-14-3729-2014, 2014. a
Zhao, B., Wang, Y., Gu, Y., Liou, K.-N., Jiang, J. H., Fan, J., Liu, X., Huang, L., and Yung, Y. L.: Ice nucleation by aerosols from anthropogenic pollution, Nat. Geosci., 12, 602–607, https://doi.org/10.1038/s41561-019-0389-4, 2019. a