the Creative Commons Attribution 4.0 License.
the Creative Commons Attribution 4.0 License.
 | 29 Oct 2020
Validation of satellite formaldehyde (HCHO) retrievals using observations from 12 aircraft campaigns
Gonzalo González Abad
Caroline R. Nowlan
Christopher Chan Miller
Kelly Chance
Eric C. Apel
Joshua P. DiGangi
Alan Fried
Thomas F. Hanisco
Rebecca S. Hornbrook
Jennifer Kaiser
Frank N. Keutsch
Wade Permar
Jason M. St. Clair
Glenn M. Wolfe
Formaldehyde (HCHO) has been measured from space for more than 2 decades. Owing to its short atmospheric lifetime, satellite HCHO data are used widely as a proxy of volatile organic compounds (VOCs; please refer to Appendix A for abbreviations and acronyms), providing constraints on underlying emissions and chemistry. However, satellite HCHO products from different satellite sensors using different algorithms have received little validation so far. The accuracy and consistency of HCHO retrievals remain largely unclear. Here we develop a validation platform for satellite HCHO retrievals using in situ observations from 12 aircraft campaigns with a chemical transport model (GEOS-Chem) as the intercomparison method. Application to the NASA operational OMI HCHO product indicates negative biases (−44.5 % to −21.7 %) under high-HCHO conditions, while it indicates high biases (+66.1 % to +112.1 %) under low-HCHO conditions. Under both conditions, HCHO a priori vertical profiles are likely not the main driver of the biases. By providing quick assessment of systematic biases in satellite products over large domains, the platform facilitates, in an iterative process, optimization of retrieval settings and the minimization of retrieval biases. It is also complementary to localized validation efforts based on ground observations and aircraft spirals.
- Article
(3105 KB) - Full-text XML
-
Supplement
(6440 KB) - BibTeX
- EndNote


Formaldehyde (HCHO) is ubiquitous in the troposphere due to its high product yields from atmospheric oxidation of volatile organic compounds (VOCs). Methane mainly controls the tropospheric background, whereas regional enhancements are contributed largely by short-lived non-methane VOCs (NMVOCs) emitted from the biosphere, human activities, and wildfires. HCHO is detectable from space using solar ultraviolet backscattered radiation between 325 and 360 nm (Chance et al., 2000). HCHO vertical column densities (VCDs; in units of molecules cm−2) are obtained after the retrieval process and the consideration of a priori information. Because of the short atmospheric lifetime of HCHO (a few hours), satellite HCHO VCD has been used as a localized proxy for NMVOC emissions (e.g., Palmer et al., 2003; Shim et al., 2005; Stavrakou et al., 2009; Marais et al., 2012; Barkley et al., 2013; Zhu et al., 2014; Zhu et al., 2017a; Cao et al., 2018; Surl et al., 2018). In addition, previous applications of HCHO retrievals also include evaluating surface ozone sensitivity (Jin and Holloway, 2015; Jin et al., 2017), quantifying cancer risks of ambient HCHO (Zhu et al., 2017b), estimating organic aerosol abundance (Liao et al., 2019), and mapping hydroxyl (OH) radicals (Wolfe et al., 2019). However, validation of satellite HCHO products from different satellite sensors using different algorithms has received little attention so far. Validation exercises over different regions in different seasons remain extremely limited. Here we develop a validation platform built with HCHO observations from 12 aircraft campaigns over the United States, eastern Asia, and the remote Pacific Ocean. We further apply it to the NASA operational HCHO product and report the validation results.
HCHO has been continuously observed from space for more than 2 decades since the launch of GOME (1996–2003) (Chance et al., 2000; De Smedt et al., 2008) and SCIAMACHY (2003–2012) (Wittrock et al., 2006; De Smedt et al., 2008). Presently available observations are from OMI (2004–) (De Smedt et al., 2015; González Abad et al., 2015), GOME-2A (2006–) (De Smedt et al., 2012), OMPS (2011–) (Li et al., 2015; González Abad et al., 2016), GOME-2B (2012–) (De Smedt et al., 2012), and TROPOMI (2018–) (De Smedt et al., 2018). Hourly HCHO observations (in daytime) will be made available from a constellation of geostationary satellites to be launched in the coming 1–3 years, including GEMS (2020) (Kim et al., 2020; Kwon et al., 2019) over eastern Asia, TEMPO (2022) (Zoogman et al., 2017) over North America, and Sentinel-4 (2023) (Courrèges-Lacoste et al., 2017) over Europe. HCHO retrieved from the above satellites generally follows a two-step approach, slant column density (SCD) fitting and conversion of it to VCD using localized air mass factors (AMFs), with retrieval errors being introduced in each step (Marais et al., 2012; De Smedt et al., 2015; González Abad et al., 2015; Hewson et al., 2015; Kwon et al., 2017; Herman et al., 2018; Nowlan et al., 2018).
Previous validation of HCHO satellite data sets is often conducted by directly comparing coincident satellite pixels and observation points. Wittrock et al. (2006) and Vigouroux et al. (2009) found SCIAMACHY HCHO columns are unbiased compared with ground-based measurements over remote regions. De Smedt et al. (2015) reported OMI and GOME2 data are −20 % to −40 % biased against observed vertical profiles. Wang et al. (2017) reported biases in OMI and GOME2 data of −12 % to −20 % over eastern China from May to December. A recent study showed monthly bias in OMI data ranges from −11 % in summer to +26 % in winter in Beijing between 2010 and 2016 (Wang et al., 2019). Comparison with aircraft observations indicated that GOME data are +16 % biased during summer over eastern Texas in the United States (Martin et al., 2004) and that OMI data are biased by −37 % in October over Guyana (Barkley et al., 2013). Tan et al. (2018) found OMPS data are −18 % biased against ship-based measurements in June over the East China Sea.
Such direct validation approaches, however, face three practical challenges. First, they require the averaging of extensive observations to reduce large random noises associated with individual satellite retrievals. Second, they fail to make full use of precise in situ observations. Low earth orbit (LEO) satellites pass over a certain location within a fixed time window up to a couple of times per day, meaning only a small fraction of observations are coincident with satellite pixels and thus suitable for the purpose of direct validation. Finally, reliability of validation results is unclear for areas beyond the observation sites/domains.
Alternatively, Zhu et al. (2016) proposed an indirect validation approach with a chemical transport model (CTM) as the intercomparison method. This approach increases considerably the range of data and conditions that can be used for validation and therefore reduces random noises in satellite retrievals through averaging. Using this approach, Zhu et al. (2016) found current HCHO satellite products are biased by −20 % to −51 % against the SEAC4RS (Toon et al., 2016) aircraft measurements over the Southeastern United States during the summer of 2013. Here we follow this indirect validation approach to develop a validation platform for satellite HCHO retrievals using observations from 12 aircraft campaigns all over the world, as discussed below.
Figure 1 shows flight tracks of 12 aircraft campaigns used in this study. Detailed information is summarized in Table 1. The 12 aircraft campaigns are selected based on the data availability and spatial representativeness. Together, the 12 aircraft campaigns offer exceptional opportunities for validation of satellite HCHO retrievals with extensive observations over the United States (C1–C9; DISCOVER-AQ California 2013, NOMADSS, SENEX, DISCOVER-AQ Texas 2013, DISCOVER-AQ Colorado 2014, FRAPPÉ, WINTER, SONGNEX, and WE-CAN, respectively), eastern Asia (C10; KORUS-AQ), and the remote Pacific Ocean (C11–C12; ATom-1 and ATom-2). The aircraft campaigns have great spatial coverage over HCHO hotspots, such as the Southeastern United States (C2 and C3) dominated by strong biogenic isoprene emissions (Guenther et al., 2012), the Houston area (C4) featured with high anthropogenic NMVOCs (Zhu et al., 2014), and the Western United States (C9) influenced by wildfires. The campaigns also survey different seasons of the year, enabling assessment of seasonal biases in satellite HCHO products.
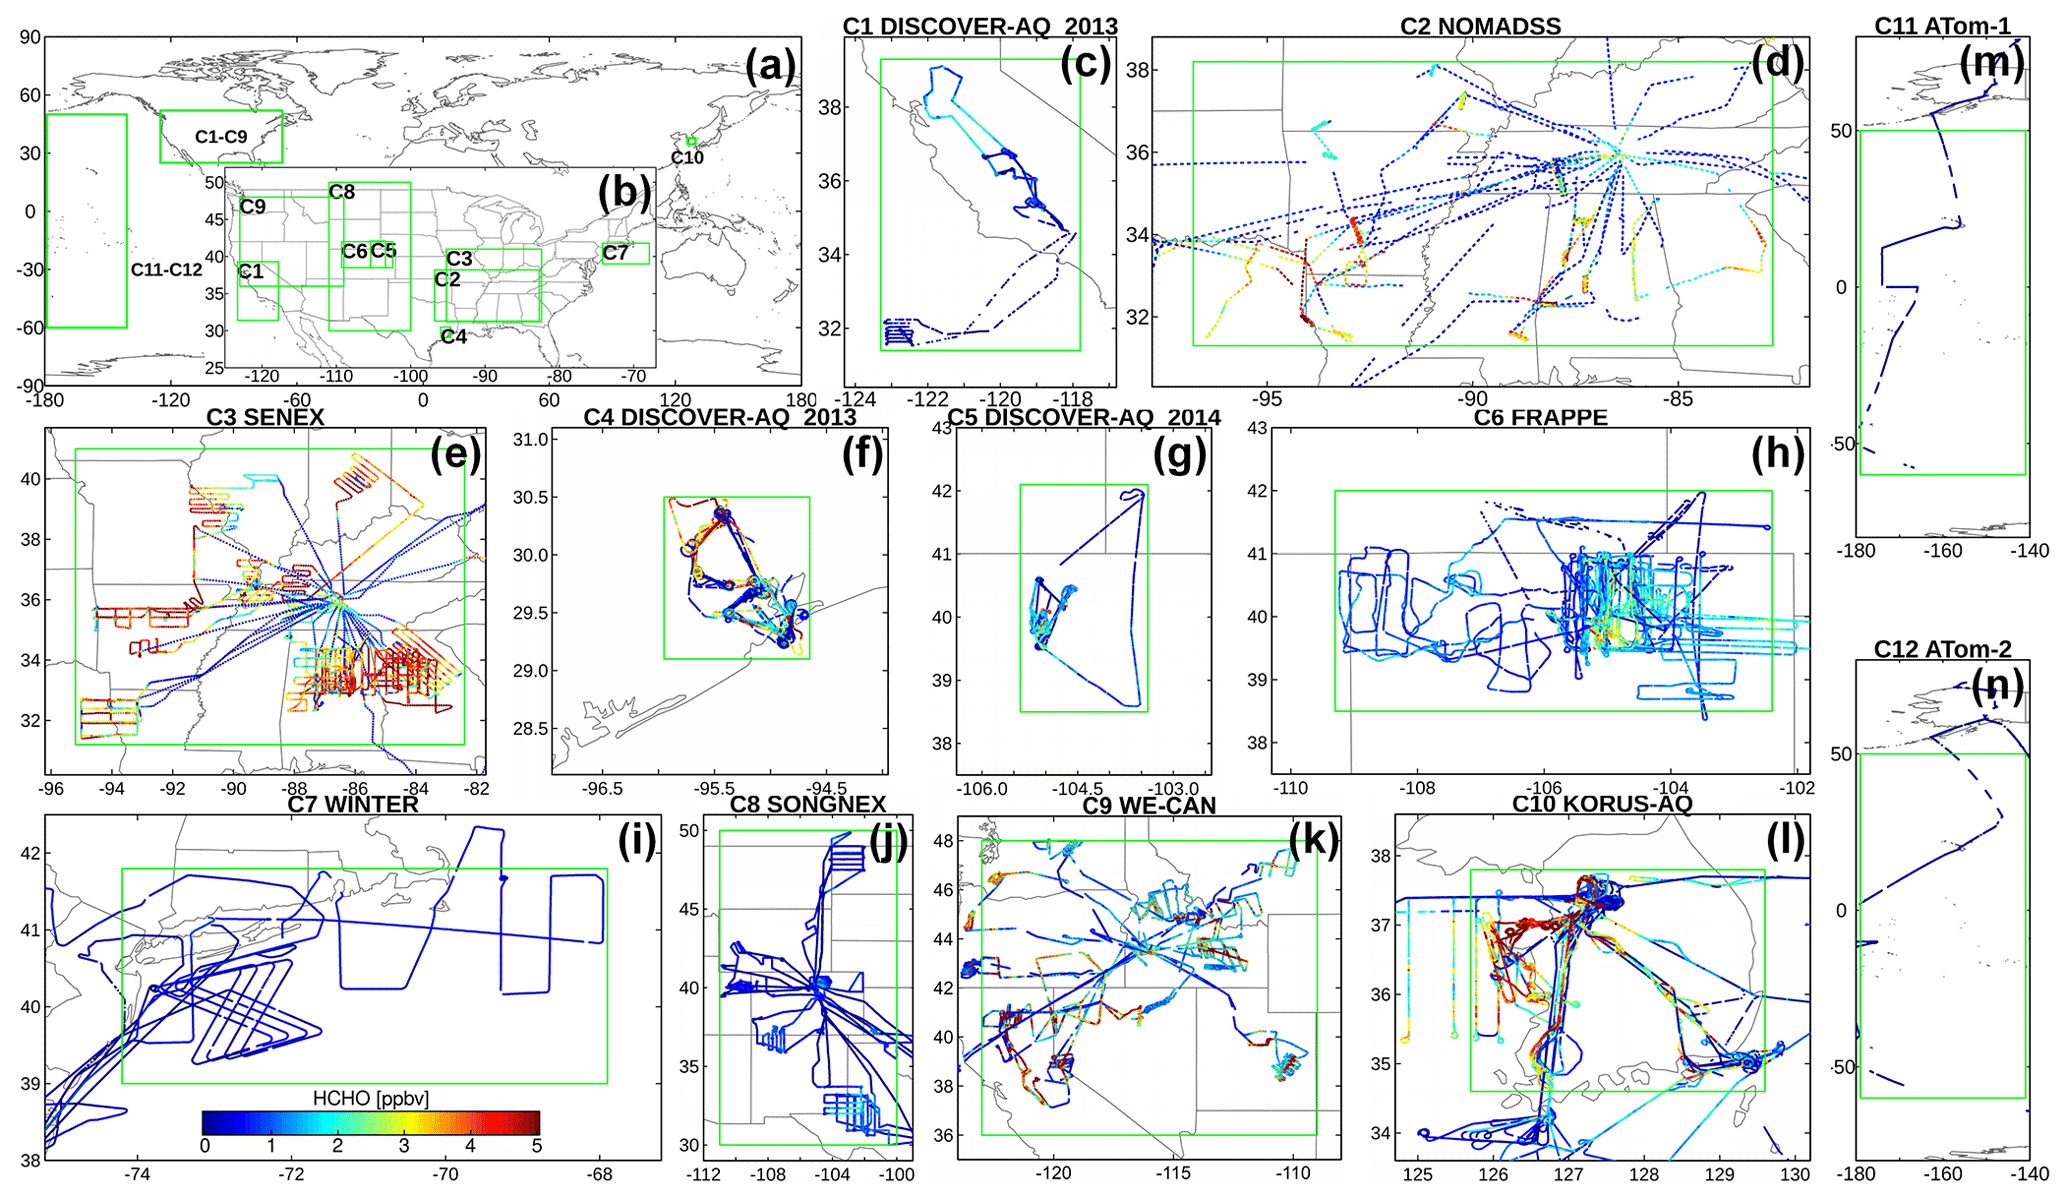
Figure 1Flight tracks of the 12 aircraft campaigns used in this study. Panel (a) shows the spatial coverage (green rectangles) of the campaigns. Panel (b) (inset) zooms in on campaigns over the United States. Aircraft campaigns are numbered as C1–C12. Table 1 summarizes detailed information of the 12 campaigns. Formaldehyde (HCHO) mixing ratios along aircraft flight tracks are shown in panel (c)–(n). Color bar saturates at 5 ppbV. The green rectangle in panel (c)–(n) is the same as that in (a) and (b), indicating spatial domain of a certain campaign. The same domain is also defined in Table 1.
Table 1Overview of the 12 aircraft campaigns used in this study.
a Instrument accuracy is given in parentheses. During C6,
C7, and C12, HCHO is measured by two independent instruments.
b Shown as green rectangles in Fig. 1.
c (1) Crawford and Pickering (2014); (2) DISCOVER-AQ
Science Team (2014); (3) Emmons (2016); (4) Warneke et al. (2016); (5) Pfister et al. (2017); (6) Richter et al. (2015); (7) UCAR/NCAR – Earth Observing Laboratory et al. (2016); (8) National Oceanic and Atmospheric
Administration (NOAA) (2017); (9) Pollack et al. (2019); (10) Hu and Permar (2019); (11) KORUS-AQ (2016); (12) Wofsy
et al. (2018).
d TOGA has an accuracy of 15 % or better.
During the aircraft campaigns, HCHO observations were made along the flight tracks with multiple instruments, including (1) NCAR Difference Frequency Generation Absorption Spectrometer (DFGAS) (Weibring et al., 2006, 2007, 2010); (2) Trace Organic Gas Analyzer (TOGA) (Apel et al., 2003; 2010; 2015); (3) In Situ Airborne Formaldehyde instrument (ISAF) (Cazorla et al., 2015); (4) Compact Atmospheric Multispecies Spectrometer (CAMS) (Fried et al., 2011; Richter et al., 2015); and (5) Proton Transfer Reaction Time-of-Flight Mass Spectrometer (PTR-ToF-MS) (Müller et al., 2014). The instrument accuracy (1σ level) is 4.5 %, 15 % (lower limit; https://airbornescience.nasa.gov/instrument/TOGA, last access: 23 October 2020), 10 % (Cazorla et al., 2015), 4 % (Richter et al., 2015), and 60 % (Hu and Permar, 2019) for DFGAS, TOGA, ISAF, CAMS, and PTR-ToF-MS, respectively. The corresponding instrument detection limits are 40–100 ppt (Nowlan et al., 2018), 20 ppt (Wofsy et al., 2018), 36 ppt (Cazorla et al., 2015), ∼40 ppt (Richter et al., 2015), and 300 ppt (Hu and Permar, 2019), respectively.
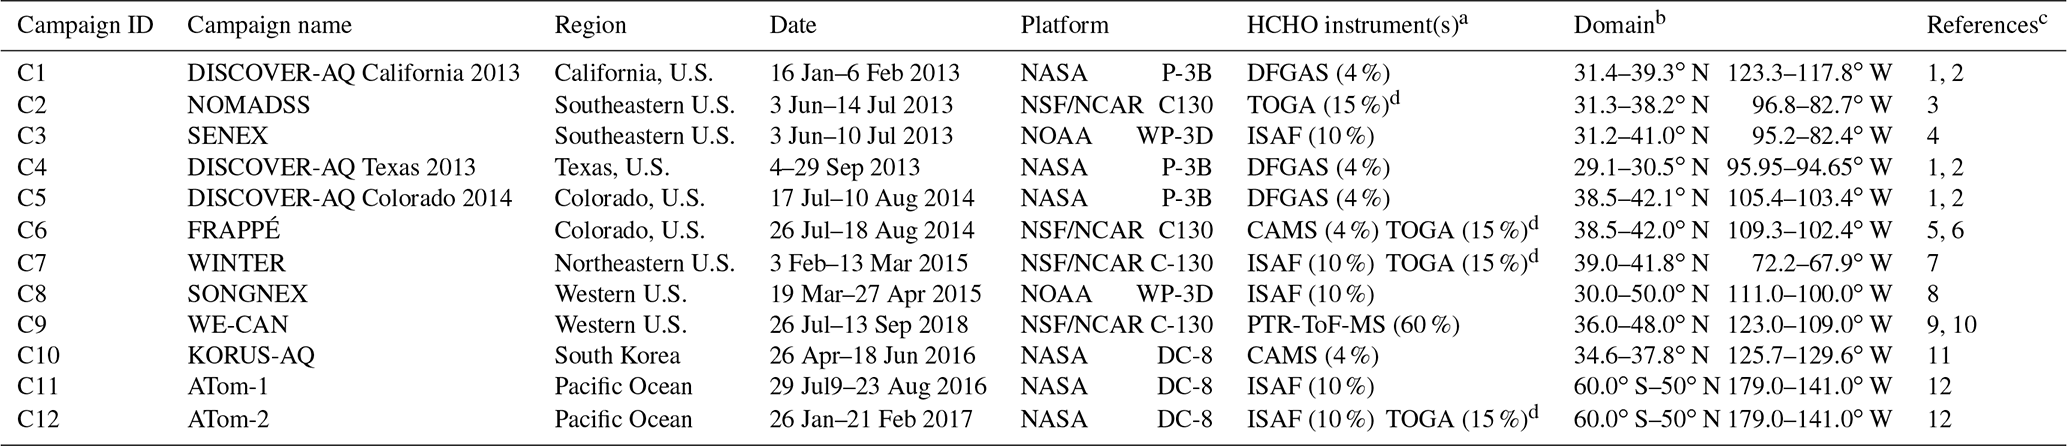
HCHO observations from different instruments are generally consistent. Zhu et al. (2016) reported ISAF to be in good agreement with CAMS during the SEAC4RS campaign with a correlation coefficient (r) of 0.99 and a slope of 1.10. ISAF is also found to be consistent (r=0.98) with DFGAS during the DC3 campaign (Barth et al., 2015), with a slope of 1.07 (Liao et al., 2019). Figure 2 shows point-to-point comparisons among 1 min averaged TOGA, ISAF, and CAMS HCHO observations aboard the aircraft. There is a high correlation in the mixed layer (here and elsewhere defined as below 2 km; r=0.86) and free troposphere (>2 km; r=0.93) between TOGA and CAMS during the FRAPPÉ campaign with a reduced major axis (RMA) regression slope of 1.05±0.01. During the WINTER campaign, TOGA generally matches with ISAF (r=0.72) within the mixed layer. However, consistency between the two instruments begins to fall apart in the free troposphere (r=0.33), which is likely driven by sampling differences. TOGA correlates highly with ISAF during the ATom-2 (C12) campaign in both the mixed layer (r=0.83) and free troposphere (r=0.82), but overall it is 48 % higher than ISAF, likely due to the fact that the two instruments are independently calibrated. In this study, we use CAMS data for FRAPPÉ (C6) and ISAF data for both WINTER (C7) and ATom-2 (C12), given their higher accuracies.
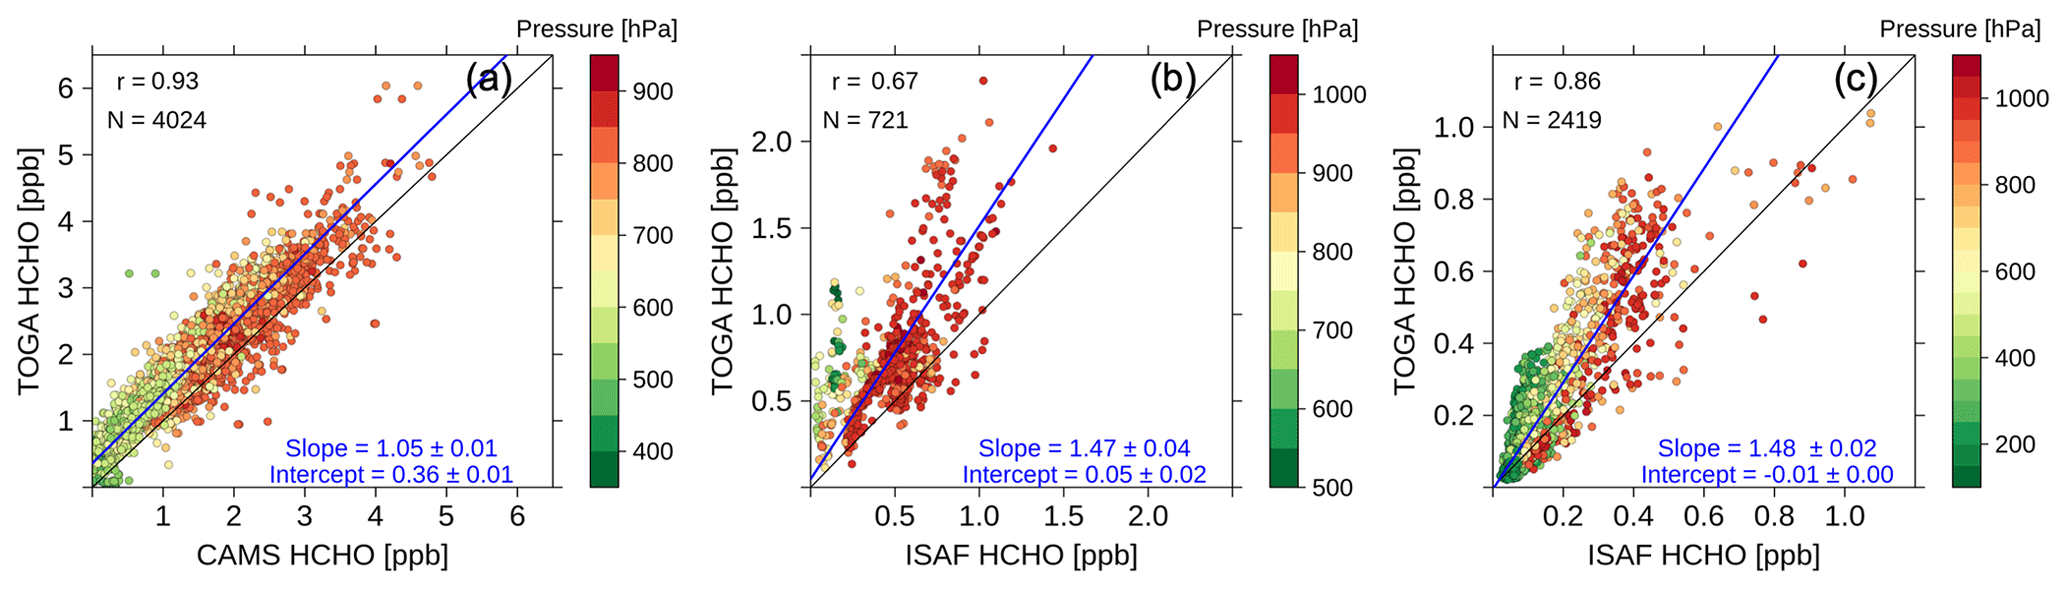
Figure 2Comparisons between 1 min averaged HCHO observations from multiple instruments. (a) Observations from TOGA and CAMS instruments aboard the NSF/NCAR C-130 during the FRAPPÉ campaign. (b) Observations from TOGA and ISAF instruments aboard the NSF/NCAR C-130 during the WINTER campaign. (c) Observations from TOGA and ISAF instruments aboard the NASA DC-8 during the ATom-2 campaign. HCHO data points are colored by atmospheric pressure. Reduced major axis (RMA) regression slopes and intercepts are shown along with the correlation coefficient (r), sample size (N), RMA regression line (blue), and 1:1 line (black).
Figure 3 shows mean vertical profiles measured from the 12 aircraft campaigns. For campaigns conducted over/near land (C1–C10), aircraft observations show a higher level of HCHO within the mixed layer as a result of biogenic and anthropogenic NMVOC emissions. In the free troposphere, HCHO starts to drop sharply due to short lifetimes of highly reactive NMVOCs, such as isoprene (∼1 h) and HCHO itself (∼2 h). We see enhanced HCHO (>3 ppb) in 3–5 km during the WE-CAN (C9) campaign, which is caused by intensive primary and secondary production of HCHO from wildfires in the Western United States. Mean HCHO over the remote Pacific Ocean (C11–C12) declines with altitudes through the troposphere (below 12 km), suggesting oxidation of well-mixed methane as the dominant source of the tropospheric background HCHO.
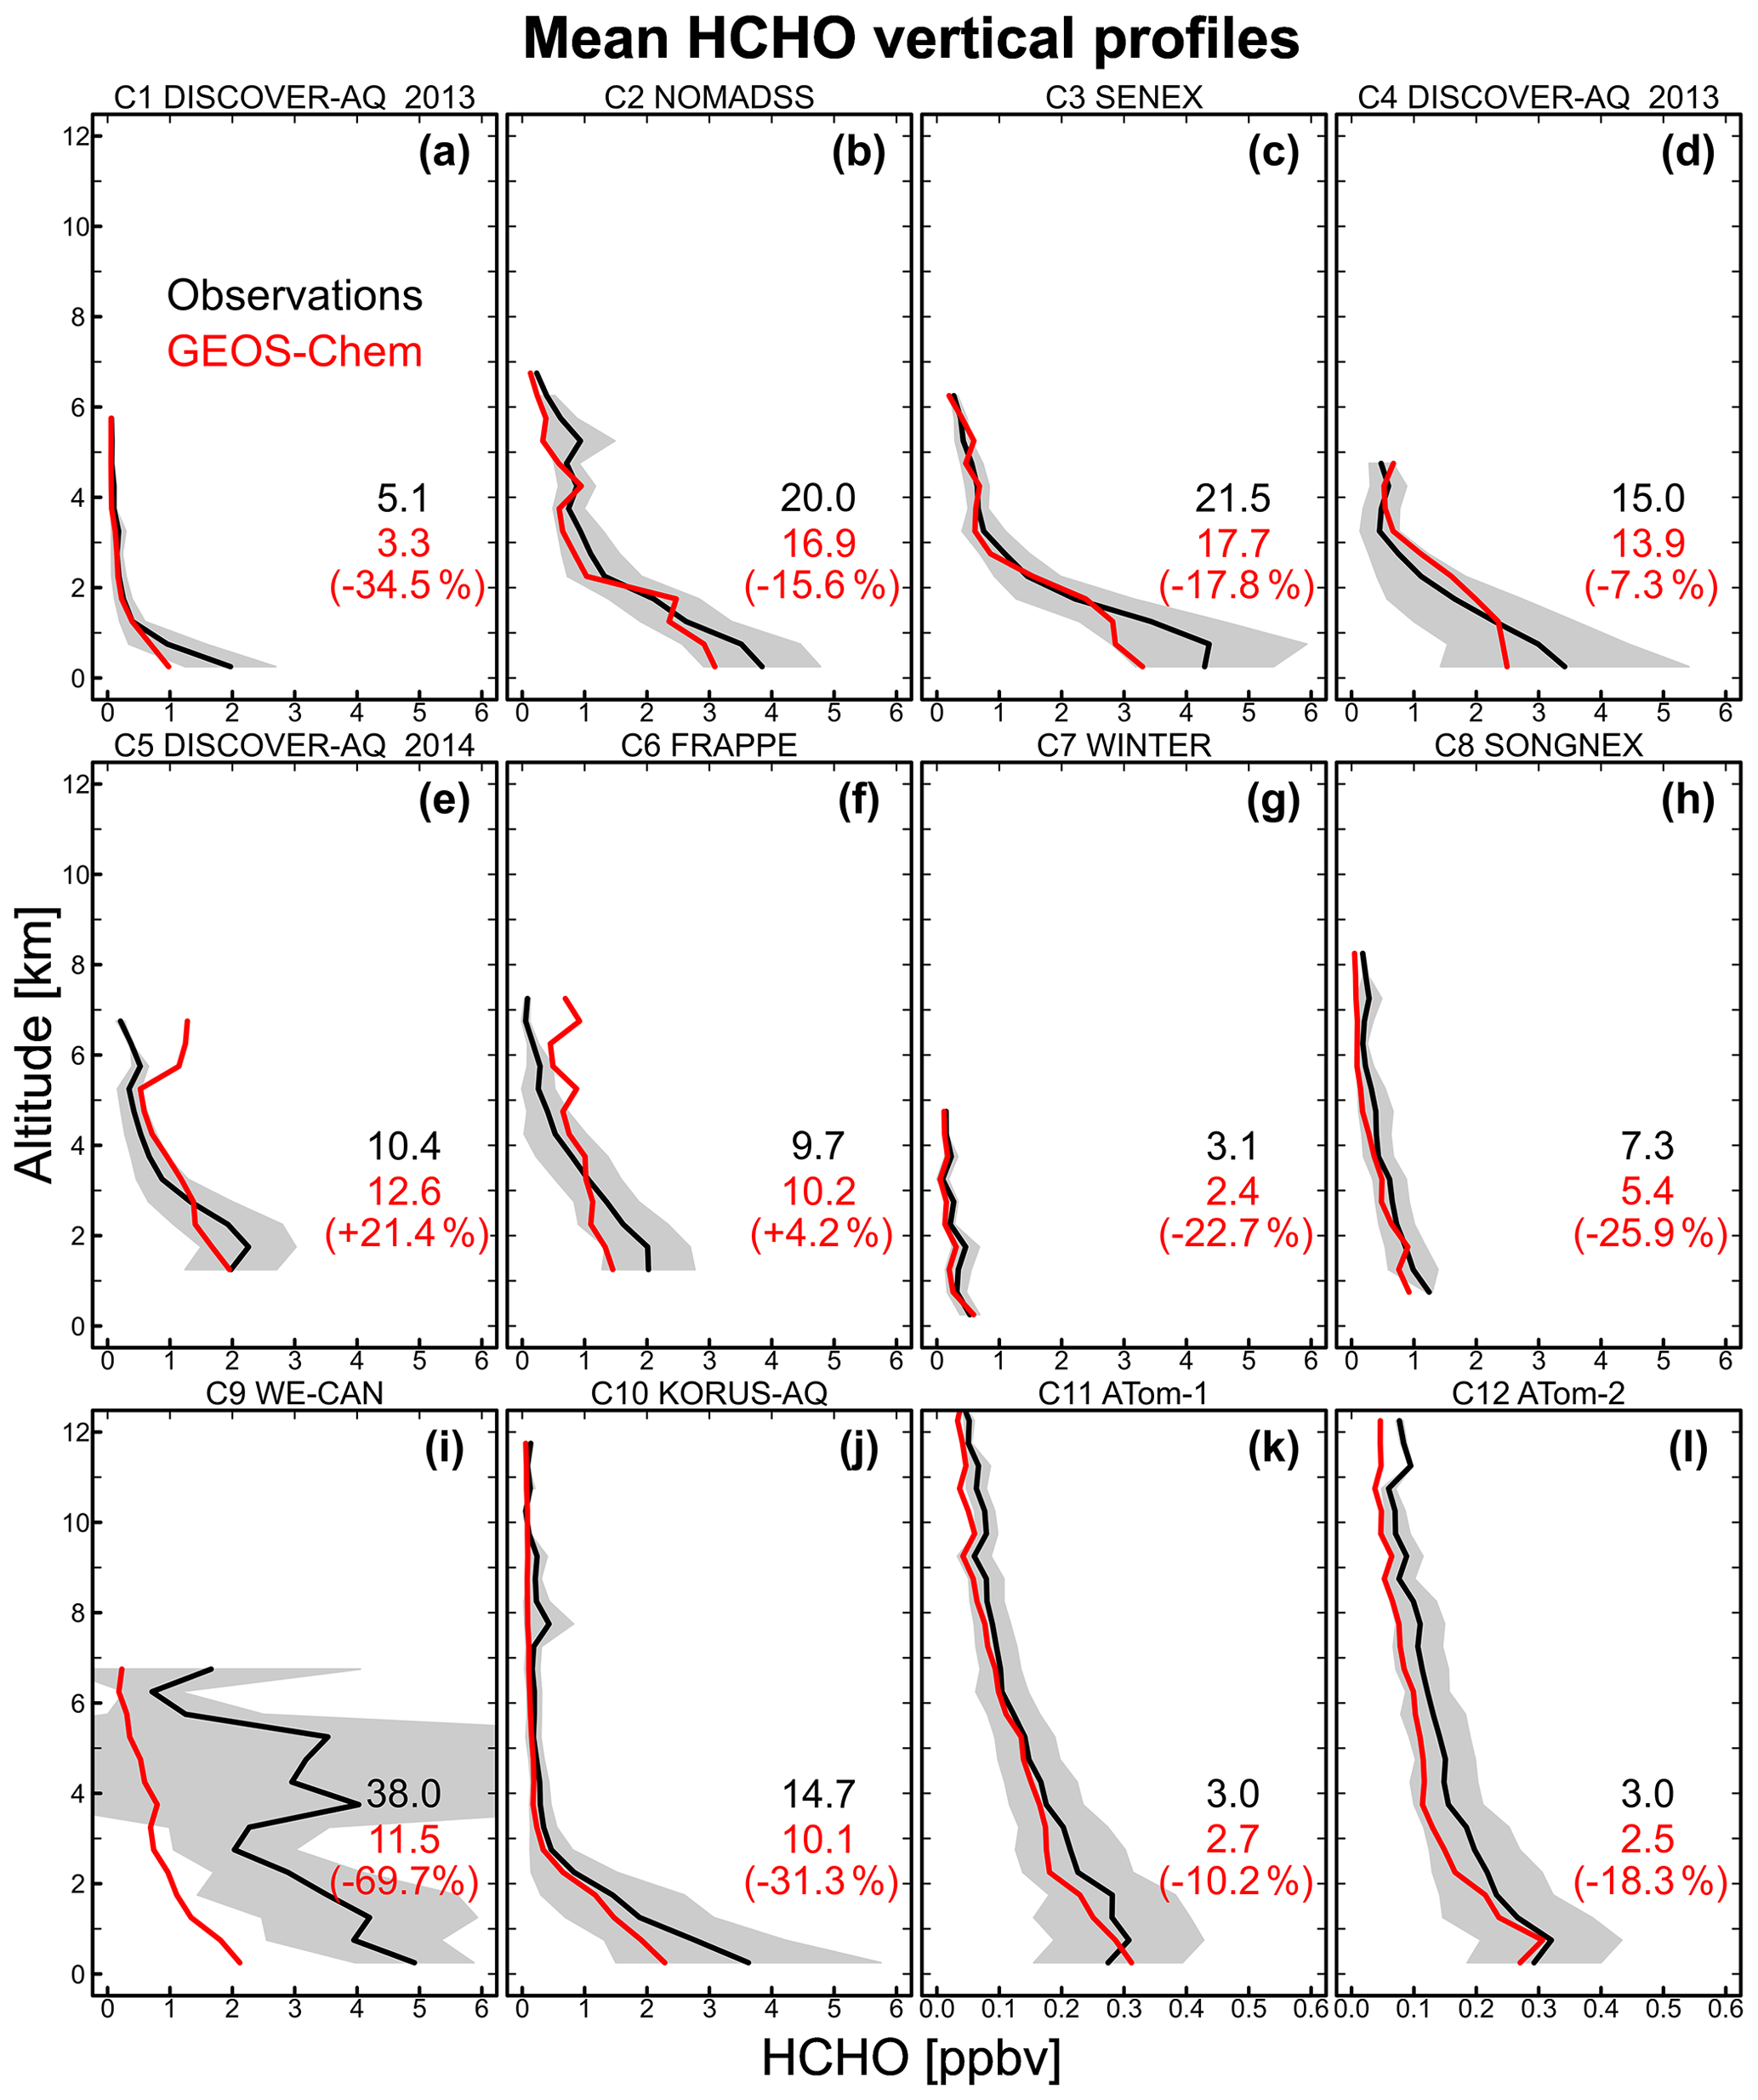
Figure 3Mean HCHO vertical profiles as observed during the 12 aircraft campaigns (Table 1) and simulated by GEOS-Chem. GEOS-Chem is sampled along the flight tracks at the time and locations of the measurements. We only use observed and modeled HCHO values within the study area, defined by the green rectangle for each campaign in Fig. 1. HCHO values are vertically binned in increments of 500 m. Shading gives the standard deviation in the observations. Observed (black) and modeled (red) HCHO column densities (1015 molecules cm−2) are given along with relative biases (in parentheses) in modeled column densities. The relative biases are further used as correction factors for GOES-Chem columns. Observed column densities are computed using mean observed mixing ratio (black lines), temperature, and pressure. Modeled column densities are computed according to GEOS-Chem HCHO vertical profiles (red lines) as well as temperature and pressure from GEOS-FP. Notice that the scale in panel (k) and (l) is different from that in other panels.
The indirect validation approach requires a CTM to bridge sampling gaps between aircraft observations and satellite retrievals (Zhu et al., 2016). Here we use GEOS-Chem version 12.0.0 (https://doi.org/10.5281/zenodo.1343547, The International GEOS-Chem User Community, 2018) as the intercomparison method for validation of satellite HCHO columns using aircraft observations. With a detailed representation of the tropospheric chemistry of ozone–NOx–VOCs–aerosol–halogens, the GEOS-Chem model has been used extensively in several studies to simulate HCHO, including comparisons with in situ observations (Jaeglé et al., 2015; Zhu et al., 2016; Chan Miller et al., 2017; Liao et al., 2019). Zhu et al. (2016) and Chan Miller et al. (2017) found that GEOS-Chem provides an unbiased simulation of SEAC4RS and SENEX aircraft observations within the mixed layer over the Southeastern United States in summer, including horizontal patterns and mean vertical profiles. In winter, GEOS-Chem is biased by −32 % compared against aircraft observations below 300 m over the Northeastern United States (Jaeglé et al., 2015).
The GEOS-Chem model is driven by the Goddard Earth Observing System–Forward Processing (GEOS-FP) assimilated meteorological data, produced by the NASA Global Modeling and Assimilation Office (GMAO) (Molod et al., 2012). The GEOS-FP meteorological data have a native horizontal resolution of , with 72 vertical pressure levels and 3 h temporal frequency (1 h for surface variables and mixed layer depths). Biogenic VOC emissions are from the MEGAN 2.1 model (Guenther et al., 2012) as implemented in GEOS-Chem by Hu et al. (2015). Anthropogenic emissions are based on the NEI2011 inventory (EPA, 2015) over the United States and the MIX inventory (Li et al., 2017) over the eastern Asia region. Fire emissions are from the fourth-generation Global Fire Emissions Database (GFED4) (Giglio et al., 2013). Surface-driven vertical mixing up to the mixing depth is based on the nonlocal mixing scheme of Holtslag and Boville (1993), as implemented in GEOS-Chem by Lin and McElroy (2010).
We run the GEOS-Chem model at a resolution to simulate the ATom-1 (C11) and ATom-2 (C12) campaigns as HCHO over the remote Pacific Ocean is relatively homogeneously distributed due to methane oxidation. Over the continents, we use the native resolution (, nested version) in GEOS-Chem to better represent heterogeneities in emissions and chemistry during the aircraft campaigns (C1–C10) over North America (130–60∘ W, 9.75–60∘ N) and eastern Asia (70–140∘ E, 15–55∘ N). Dynamic boundary conditions for the nested simulations are from global runs. Global and nested simulations are spun up for 10 months and 1 month, respectively, to remove the sensitivity to initial conditions. GEOS-Chem is sampled along the flight tracks at the time and locations of the aircraft measurements.
Figure 3 shows GEOS-Chem mean HCHO profiles. Previous studies (Scarino et al., 2014; Millet et al., 2015; Zhu et al., 2016) found GEOS-FP mixing depth in summer is biased low compared with observations by a factor of 30 %–50 %, which may partially contribute to the underestimation of HCHO in the mixed layer (Fig. 3) by GEOS-Chem over the United States (C1–C6, C9) and South Korea (C10). On top of that, underestimation of highly reactive VOC emissions as reported by Zhu et al. (2014) may be another reason for the lower simulated HCHO over the Houston area (C4). GEOS-Chem generally reproduces the observed vertical distribution of HCHO in the free troposphere. Exceptions are for campaigns surveying the Western United States in summer (C5, C6, and C9), likely caused by uncertainties in GFED4 fire emissions in the model.
By integrating the mean vertical profiles in Fig. 3, we estimate, for each aircraft campaign, a mean observed HCHO column, a mean GEOS-Chem modeled HCHO column, and the regional bias associated with the GEOS-Chem model as informed by comparison between observed and modeled HCHO columns. Figure 3 shows the regional bias for each aircraft campaign, which is later applied as the correction factor in the validation exercises.
The NASA operational OMI HCHO product is based on the Smithsonian Astrophysical Observatory (SAO) HCHO retrieval algorithm (González Abad et al., 2015). Briefly, the algorithm follows a two-step approach. First, a reference sector correction term (ΩS0) is subtracted from the fitted total SCD (ΩS), yielding the reference-sector-corrected SCD (ΔΩS):
Following Khokhar et al. (2005) and De Smedt et al. (2008), the reference sector correction (ΩS0) represents a daily post-processing normalization for the retrieved SCD, calculated as the difference between the retrieved SCD over the Pacific Ocean and the GEOS-Chem VCD climatology over the Pacific Ocean multiplied by the satellite air mass factor (AMF) (González Abad et al., 2015, 2016). ΔΩS is then converted to VCD (Ω) by applying the corresponding AMF:
The AMF depends on a number of factors, including solar zenith angle (θZ), satellite viewing angle (θV), cloud characteristics, scattering properties of the atmosphere and surface, and HCHO a priori profiles. Following Palmer et al. (2001), it is computed as the product of a geometrical AMF (AMFG) and a correction with scattering weights w applied to the vertical shape factors S:
Here the integration is over the pressure (p) coordinate from the surface (PS) to the top of atmosphere. S is the normalized vertical profile of HCHO mixing ratios C(p):
where ΩA(p) is the partial air column density at p and w measures the sensitivity of the backscattered radiation to HCHO. The OMI SAO HCHO product provides Ω, ΩS, ΔΩS, AMFG (in term of θZ and θV), AMF, S, and w for each pixel. Uncertainties associated with Ω are 30 %–100 %, contributed by uncertainties in both AMF (∼35 %) and ΔΩS (30–100 %) (González Abad et al., 2015).
Here we use the DISCOVER-AQ 2013 (C1) flight campaign as an example to demonstrate the validation process. Validation of the OMI SAO HCHO product starts with the selection of satellite pixels. This is done for each campaign within the corresponding study period (Table 1) and domain (defined in Table 1; shown in Fig. 1) based on the following criteria: (1) pass quality checks (MainDataQualityFlag =0), (2) have cloud fraction less than 0.3, (3) have θZ less than 60∘, and (4) have VCD within the range of to 7.6×10¹⁶ molecules cm−2. The last criterion is set based on 3 times the fitting uncertainty (30 %–100 %) and a typical VCD value between 4.0×10¹⁵ and 4×10¹⁶ molecules cm−2 (González Abad et al., 2015). We then compute campaign-averaged GEOS-Chem HCHO columns by sampling the model according to OMI's schedule. The original GEOS-Chem columns are further scaled using correction factors informed by comparison of model and aircraft columns (Fig. 3). Figure 4 shows campaign-averaged HCHO columns for both OMI SAO and corrected GEOS-Chem over the study domain (California, United States). Campaign-averaged OMI and corrected GEOS-Chem HCHO columns for other campaigns (C2–C12) are in the Supplement. Poor spatial correlations between OMI and corrected GEOS-Chem columns during some campaigns (Fig. 4 and Supplement) likely reflect large uncertainties in OMI columns. Finally, we compare spatially and temporally averaged HCHO columns, during the study period and over the study domain, as reported by the OMI SAO product and modeled by GEOS-Chem (with correction) to estimate the regional systematic bias in the OMI SAO HCHO product. Detailed validation results are summarized in Table 2.

Figure 4HCHO vertical column densities over California, United States, during DISCOVER-AQ California 2013 (C1; 16 January–6 February). Panel (a) shows data from the OMI SAO HCHO product. Panel (b) shows GEOS-Chem model results sampled on the OMI schedule (see text) and scaled by a factor of 1.53 to correct for the bias relative to aircraft measurements (Fig. 3). OMI and GEOS-Chem results are regridded onto the grids. The green rectangles represent the study domain (same as that in Fig. 1), which is also defined in Table 1. Here and elsewhere, validation results (e.g., in Table 2) are limited to the grids marked with black open circles, which represent grids that are sampled by the aircraft (i.e., intercepted with flight tracks in Fig. 1).
Table 2HCHO columns and validation results over the 12 aircraft campaignsa.

a Results are spatially and temporally averaged values for the grids sampled by the aircraft (marked with open circles in Figs. 4 and S1–S11) during the study periods (defined in Table 1). HCHO columns (GEOS-Chem columns, ΩS, ΩS0, Ωavg, and Ωcomp) are in units of 1015 molecules cm−2. For each aircraft campaign, biases relative to the corrected GEOS-Chem column are given in parentheses. b Sampled from the GEOS-Chem models according to OMI's schedule. c Corrected with the factors informed by comparison of observed and modeled HCHO columns (Fig. 3). d Spatial correlation between GEOS-Chem and OMI HCHO column over the study region (green rectangles in Fig. 1). e SCD computed using vertical column density without reference sector correction (“ColumnAmount” data field in the OMI SAO HCHO product) and air mass factor (AMF). f SCD correction term recomputed using averaged OMI ΩS, Ωavg, and AMF following Eq. (1). g Mean VCD by directly averaging valid satellite pixels. h VCD recomputed using averaged OMI ΩS, ΩS0, and AMF following Eq. (1). i Recomputed using averaged OMI AMFG, observed mean HCHO shape factors (Fig. 5), and mean OMI scattering weights (Fig. 5) following Eqs. (3)–(5). j VCD computed using recomputed AMF, averaged OMI ΩS, and averaged OMI ΩS0 following Eqs. (1)–(2). k Using CAMS observations. l Using ISAF observations. m Results reported by Zhu et al. (2016) over the Southeastern United States (30.5–39.0∘ N, 95.0–81.5∘ W) during 5 August–25 September 2013. Results are based on a different version of the GEOS-Chem model.
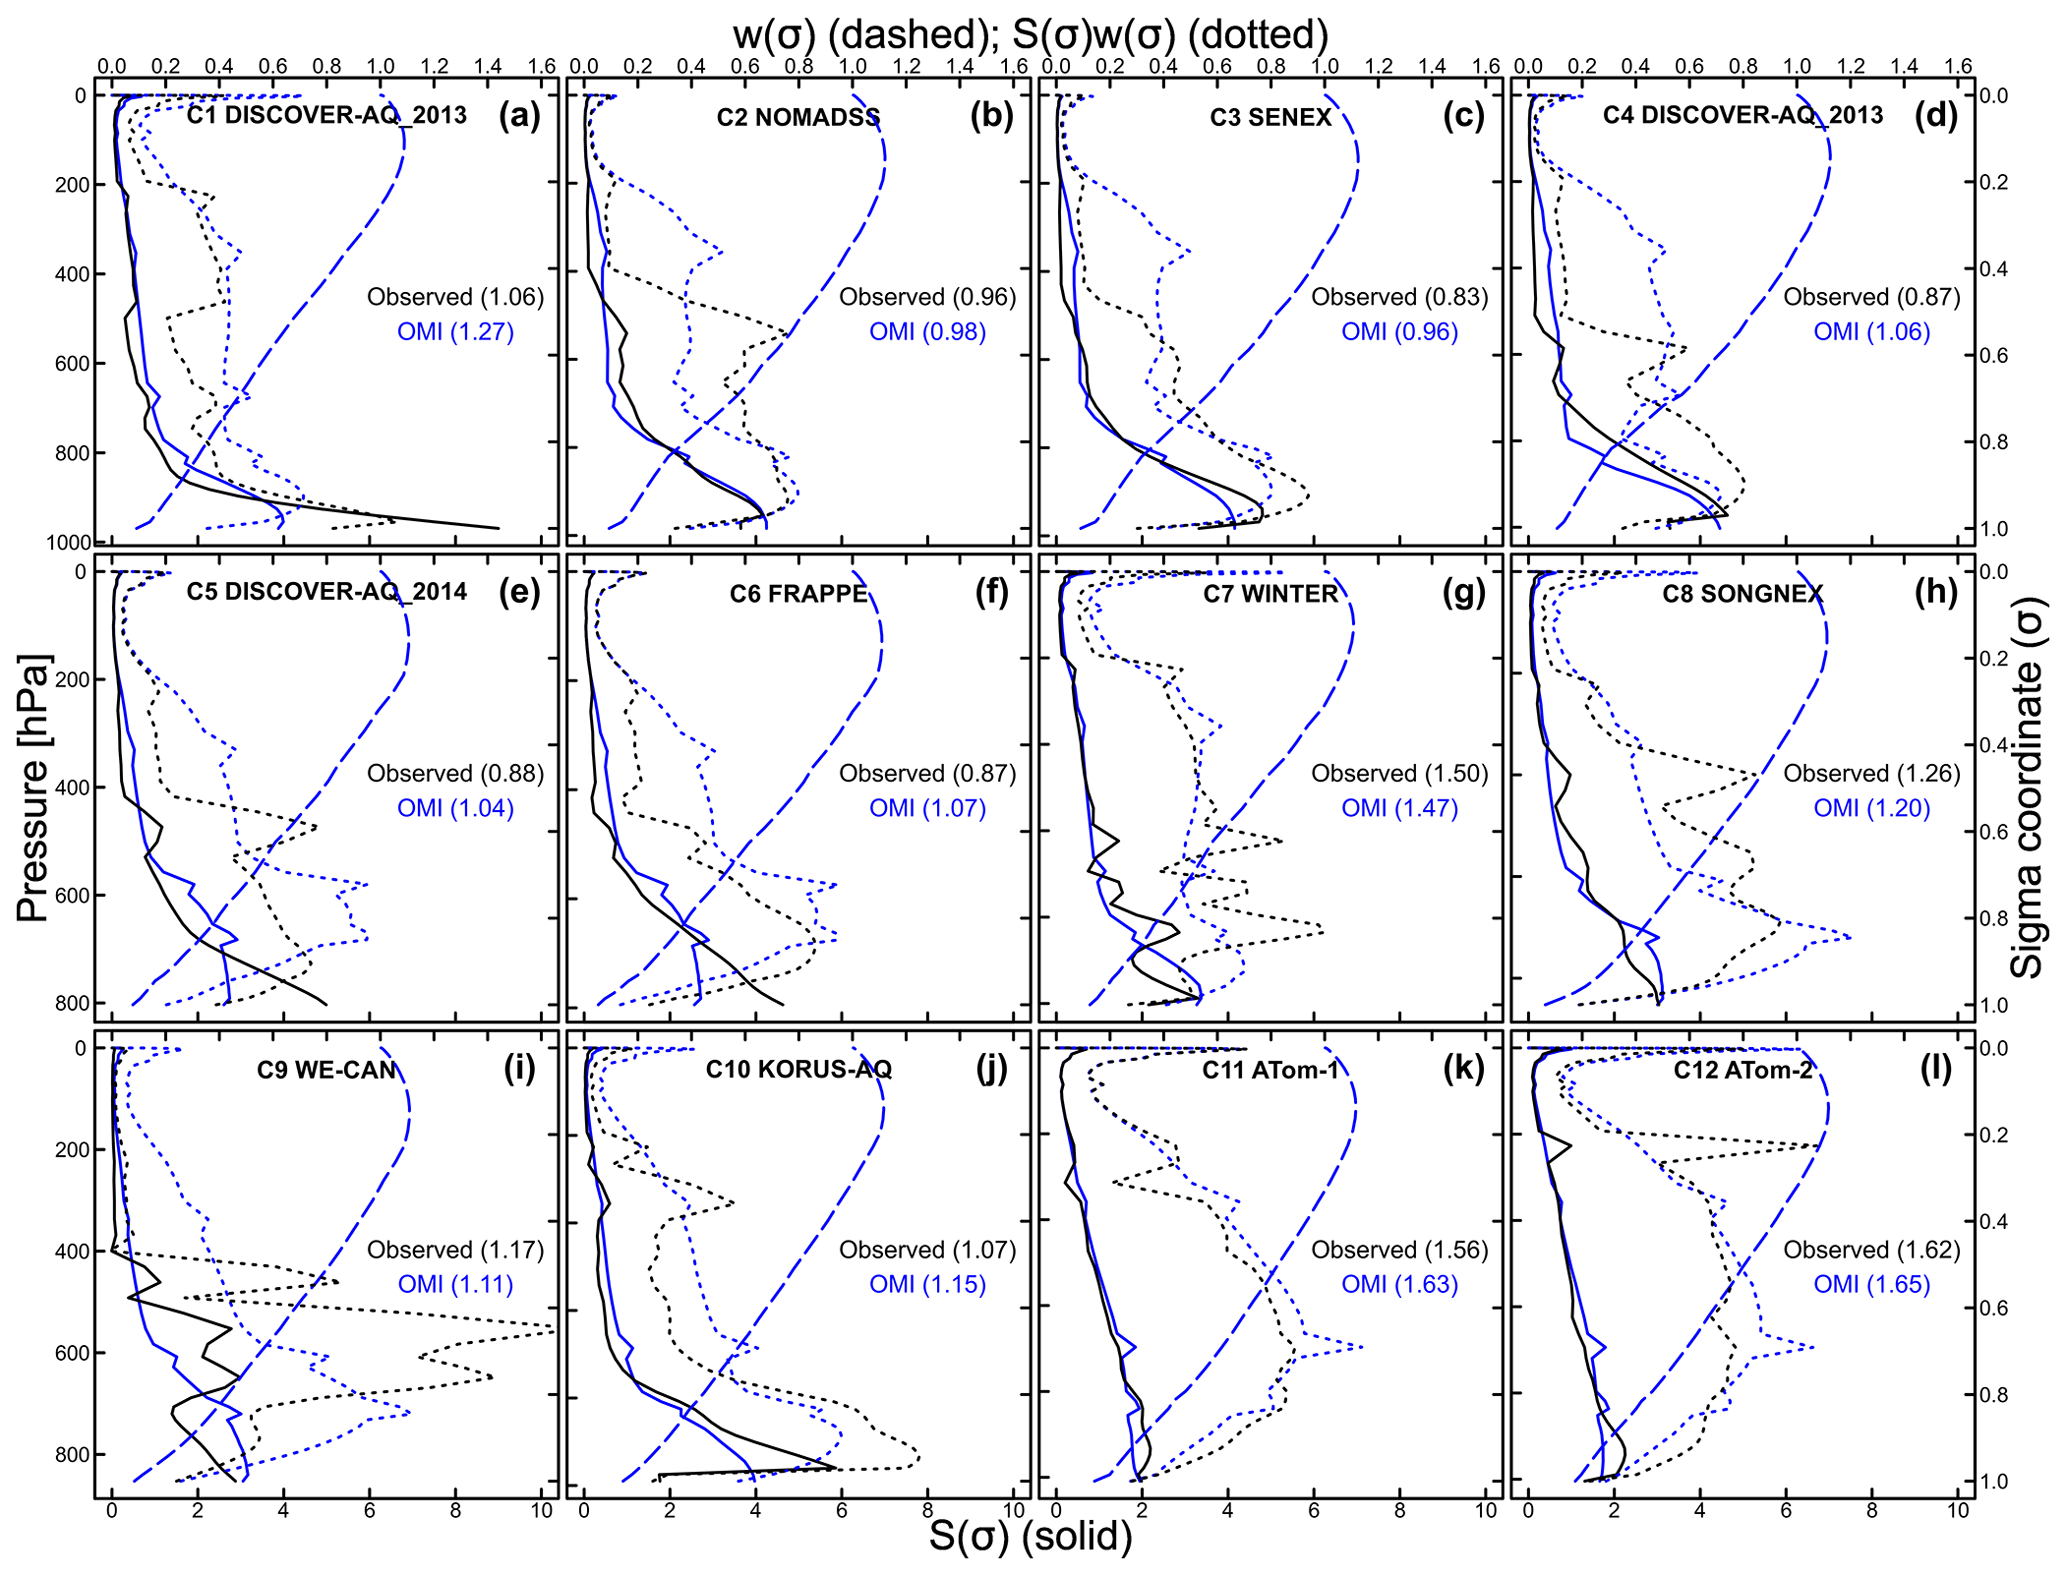
Figure 5Air mass factor (AMF) components over the 12 aircraft campaigns. Each panel shows mean scattering weights (w; dashed blue line) and shape factors (S; solid blue line) from the OMI SAO HCHO product averaged over the corresponding grids sampled by the aircraft (marked with open circles in Figs. 4 and S1–S11) during the campaign period (defined in Table 1), as well as the product of the two (dotted blue line) from which mean AMF is derived by vertical integration using Eq. (4). Each panel also shows observed HCHO shape factors (black solid) from the mean HCHO profile in Fig. 3. We use mean HCHO profiles from ATom-1 and ATom-2 (Fig. 3) to fill observations above 6 km. Also shown is the product (dotted black line) of mean OMI scattering weights (dashed blue line) and observed HCHO shape factor (black solid). Mean AMF values are given in the legend computed using OMI (blue) and observed (black) shape factors.
We see from Table 2 that relative biases in the OMI HCHO product depend on both locations and seasons, ranging from −44.5 % in summer (C9) to +112.1 % in spring (C8), both over the Western United States. Overall, the relative biases in the OMI SAO product fall into two categories. First, the product is negatively biased (−44.5 % to −21.7 %) under high-HCHO conditions (arbitrarily defined as mean HCHO column molecules cm−2), such as summertime Southeastern (C2, C3, C4) and Western (C9) United States as well as summertime South Korea (C10). A similar bias (−37.0 %) in the OMI SAO HCHO product is reported by Zhu et al. (2016) for summertime Southeastern United States. Second, the product is highly biased (+66.1 % to +112.1 %) under low-HCHO conditions, such as the Western United States (C5, C6, and C8), wintertime United States (C1 and C7), and the remote Pacific Ocean (C11 and C12). Our work points to a higher bias (∼70 %) in OMI SAO retrievals over the remote Pacific Ocean compared with the bias (∼10 %) reported by Wolfe et al. (2019). This is likely driven by a number of factors: (1) Wolfe et al. (2019) use all data, whereas we only use data over the Pacific region (Fig. 1); (2) selection criteria (e.g., θZ and data filtering) for OMI pixels are different; (3) mean observed HCHO column is computed from individual profiles in Wolfe et al. (2019), while it is computed based on a mean profile in this study; (4) and finally, the relative bias metric is more sensitive to absolute bias under low-HCHO conditions.
In both cases, a priori vertical profiles used in the SAO HCHO retrieval algorithm are likely not the main drivers of the biases. The SAO HCHO algorithm samples HCHO shape factors (S) from a monthly mean climatology based on GEOS-Chem simulations in 2007 at a spatial resolution of , which may not be able to represent the spatial heterogeneity in chemistry, nor able to model temporal variations in emissions. In the first case, after recomputing the AMF with observed HCHO shape factors following Eqs. (3)–(5), relative biases in HCHO reduce slightly on average from −36.5 % to −32.6 % (C3, C4, C9, and C10 in Table 2). The largest improvement is seen for C3 and C4, where relative biases are reduced on average from −35.4 % to −27.4 %, because using observed HCHO shape factors results in lower AMF by correcting underestimated a priori HCHO within the mixed layer (Fig. 5). During the WE-CAN campaign (C9), recomputed AMF is slightly higher than that reported by OMI (Table 2) because of elevated HCHO around 3–5 km from wildfire plumes (Fig. 5). In the second case, using observed HCHO shape factors, however, barely reduces biases in the OMI SAO HCHO product (Table 2).
Reference-sector-corrected SCD (ΔΩS=ΩS–ΩS0) and/or other AMF components (such as surface reflectivity and cloud correction) are likely the main drivers of high biases. This can be further examined with aircraft observations and OMI HCHO pixels over the remote Pacific Ocean (C11 and C12), where the contribution of ΩS0 to ΔΩS is much lower (∼18 %; Table 2). Integration of ATom1 (C11) and ATom2 (C12) vertical profiles indicates a Pacific background HCHO VCD of molecules cm−2 (Fig. 3), comparable with previous measured values (2.8×10¹⁵ to 4.6×10¹⁵ molecules cm−2) over the remote North Pacific Ocean (Singh et al., 2009) and modeled results (4.5×10¹⁵ molecules cm−2) (Wolfe et al., 2019). This is equivalent to a background SCD of molecules cm−2, with AMF computed using observed HCHO shape factors (Fig. 5). OMI SAO SCD (ΩS) and reference-sector-corrected SCD (ΔΩS) are much higher than such estimated background SCD values by a factor of ∼2.0 (Table 2), pointing to potential issues with SCD fitting and/or reference sector correction in the SAO HCHO retrieval algorithm.
We attribute the remaining biases to increased impact of interferers (e.g., O3 and BrO, O2–O2, and water vapor) when HCHO signals are weak. We also find that OMI SAO HCHO VCD correlates moderately (r=0.38 to 0.66) with surface albedo during some campaigns (i.e., C1, C5, and C6), suggesting possible bias introduced by using a reflectance climatology (Kleipool et al., 2008) in the retrievals. In summary, high biases under low-HCHO conditions are likely driven by both reference sector correction and SCD fitting. An updated SAO product is being developed to minimize the biases by optimizing the two processes accordingly.
We have used HCHO observations from 12 aircraft campaigns, together with the GEOS-Chem chemical transport model as an intercomparison method, to develop a validation platform for satellite HCHO retrievals. The validation platform offers an alternative way to quickly assess systematic biases in satellite products over large spatial domains and longer temporal periods, facilitating optimization of retrieval settings and the minimization of retrieval biases. Application to the NASA operational HCHO product (SAO retrievals) indicates that relative biases range from −44.5 % to +112.1 % depending on locations and seasons. The product is negatively biased (−44.5 % to −21.7 %) under high-HCHO conditions, such as summertime Southeastern United States, while it is positively biased (+66.1 % to +112.1 %) under low-HCHO conditions, such as wintertime United States and the remote Pacific Ocean. Under both conditions, HCHO a priori vertical profiles are likely not the main driver of the biases. Our work points to the need for improvement in the OMI SAO HCHO product to correct the systematic biases, particularly, optimization of the HCHO slant column fitting and reference sector correction.
| AMF | Air mass factor |
| AMFG | Geometrical air mass factor |
| ATom | Atmospheric Tomography mission |
| CAMS | Compact Atmospheric Multi-Species Spectrometer |
| CTM | Chemical transport model |
| DC3 | Deep Convective Clouds and Chemistry Experiment |
| DFGAS | Difference Frequency Generation Absorption Spectrometer |
| DISCOVER-AQ | Deriving Information on Surface Conditions from COlumn and VERtically |
| Resolved Observations Relevant to Air Quality | |
| FRAPPÉ | Front Range Air Pollution and Photochemistry Éxperiment |
| GEMS | Geostationary Environment Monitoring Spectrometer |
| GEOS-FP | Goddard Earth Observing System–Forward Processing |
| GFED4 | Fourth-generation Global Fire Emissions Database |
| GMAO | Global Modeling and Assimilation Office |
| GOME(-2) | Global Ozone Monitoring Experiment(-2) |
| HCHO | Formaldehyde |
| ISAF | In situ airborne formaldehyde |
| KORUS-AQ | Korea-United States Air Quality |
| LEO | Low Earth orbit |
| MEGAN | Model of Emissions of Gases and Aerosols from Nature |
| NEI | National Emissions Inventory |
| NMVOCs | Non-methane VOCs |
| NOMADSS | Nitrogen, Oxidants, Mercury, and Aerosol Distributions, Sources, and Sinks |
| OMI | Ozone Monitoring Instrument |
| OMPS | Ozone Mapping and Profiler Suite |
| PTR-ToF-MS | Proton-Transfer-Reaction Time-of-Flight Mass Spectrometer |
| RMA | Reduced major axis |
| SAO | (Harvard) Smithsonian Astrophysical Observatory |
| SCD | Slant column density |
| SCIAMACHY | Scanning Imaging Absorption spectroMeter for Atmospheric Chartography |
| SEAC4RS | Studies of Emissions, Atmospheric Composition, Clouds and Climate Coupling by Regional Surveys |
| SENEX | Southeast Nexus |
| SONGNEX | Shale Oil and Natural Gas Nexus |
| TEMPO | Tropospheric Emissions: Monitoring of Pollution |
| TOGA | Trace Organic Gas Analyzer |
| TROPOMI | TROPOspheric Monitoring Instrument |
| VCD | Vertical column density |
| VOCs | Volatile organic compounds |
| WE-CAN | Western wildfire Experiment for Cloud chemistry, Aerosol absorption and Nitrogen |
| WINTER | The Wintertime INvestigation of Transport, Emissions, and Reactivity campaign |
-
Source code
The validation platform (R scripts) is available at https://doi.org/10.7910/DVN/KG3XNC (Zhu, 2019).
Please download all the files and follow the instructions in NOTE to install required R packages and run the script.
Sample scripts for processing aircraft, chemical transport model (CTM), and satellite data are available at https://www.acmrsg.org/datasets (last access: 23 October 2020).
Please use process.R and compute.R for steps 2–5.
-
Ingesting additional field campaign data
To process additional field campaign data, a user needs to sample the CTM along the flight tracks. This can be done with GEOS-Chem flight diagnostic (http://wiki.seas.harvard.edu/geos-chem/index.php/Planeflight_diagnostic, last access: 23 October 2020). Please follow process.R (line 117–381) for processing GEOS-Chem flight diagnostic output files. For other CTMs, similar functionality may need to be developed/used.
-
Preparing CTM data
A user also needs to prepare CTM data according to satellite schedules. Please follow process.R (line 384–593) for more.
-
Processing new HCHO retrievals
To validate new HCHO retrievals, a user needs to read, clean, filter, and regrid level 2 satellite data. Please follow process.R (line 595–884) for more.
-
Validation of new HCHO retrievals
Finally, we have a sample script (compute.R) for computing and plotting the validation results.
The validation platform (R scripts) is available at https://doi.org/10.7910/DVN/KG3XNC (Zhu, 2019).
The GEOS-Chem model is available at https://doi.org/10.5281/zenodo.1343547 (the International GEOS-Chem User Community, 2018).
OMI-SAO HCHO data were downloaded from http://disc.sci.gsfc.nasa.gov/Aura/dataholdings/OMI/omhcho_v003.shtml (last access: 23 October 2020, González Abad et al., 2015.).
Aircraft observations are available respectively as follows.
-
DISCOVER-AQ California 2013 (C1): https://www-air.larc.nasa.gov/missions/discover-aq/discover-aq.html (last access: 23 October 2020, the DISCOVER-AQ California Science Team, 2013).
-
NOMADSS (C2): https://www.eol.ucar.edu/field_projects/nomadss/ (last access: 23 October 2020, the NOMADSS Science Team, 2013).
-
SENEX (C3): https://www.esrl.noaa.gov/csd/projects/senex/ (last access: 23 October 2020, the SENEX Science Team, 2013).
-
DISCOVER-AQ Texas 2013 (C4): https://www-air.larc.nasa.gov/missions/discover-aq/discover-aq.html (last access: 23 October 2020, the DISCOVER-AQ Texas Science Team, 2013).
-
DISCOVER-AQ Colorado 2014 (C5): https://www-air.larc.nasa.gov/missions/discover-aq/discover-aq.html (last access: 23 October 2020, the DISCOVER-AQ Colorado Science Team, 2014).
-
FRAPPÉ (C6): http://catalog.eol.ucar.edu/FRAPPE/ (last access: 23 October 2020, the FRAPPÉ Science Team, 2014).
-
WINTER (C7): http://catalog.eol.ucar.edu/winter/ (last access: 23 October 2020, the WINTER Science Team, 2015).
-
SONGNEX (C8): https://www.esrl.noaa.gov/csd/projects/songnex/ (last access: 23 October 2020, the SONGNEX Science Team, 2015).
-
WE-CAN (C9): https://www.eol.ucar.edu/field_projects/we-can/ (last access: 23 October 2020, the WE-CAN Science Team, 2018).
-
KORUS-AQ (C10): https://www-air.larc.nasa.gov/missions/korus-aq/ (last access: 23 October 2020, the KORUS-AQ Science Team, 2016).
-
ATom-1 (C11): https://daac.ornl.gov/ATOM/campaign/ (last access: 23 October 2020, the ATom-1 Science Team, 2016).
-
ATom-2 (C12): https://daac.ornl.gov/ATOM/campaign/ (last access: 23 October 2020, the ATom-2 Science Team, 2017).
The supplement related to this article is available online at: https://doi.org/10.5194/acp-20-12329-2020-supplement.
LZ, GGA, and CRN conducted the research and wrote the paper. CCM and KC helped with the OMI data. ECA, JPD, AF, TFH, RSH, LH, JK, FNK, WP, JMSC, and GMW provided aircraft HCHO observations.
The authors declare that they have no conflict of interest.
We acknowledge contributions from science teams of the 12 aircraft campaigns. This work is funded by NOAA Atmospheric Chemistry Carbon Cycle and Climate NA18OAR4310108, NASA Aura Science Team NNX17AH47G, NASA Science of TERRA, AQUA, and SUOMI NPP 80NSSC18K0691, and NASA Making Earth System Data Records for Use in Research Environments 80NSSC18M0091 grants. This work is supported by the Center for Computational Science and Engineering at the Southern University of Science and Technology. Lei Zhu acknowledges support from the Smithsonian Astrophysical Observatory (SAO) Visiting Scientist Fellowship. The 2018 WE-CAN campaign was supported by the National Science Foundation (grants NSF AGS-1650275, AGS-1650786, AGS-1650288, AGS-1650493, and AGS-1652688). Lu Hu and Wade Permar would like to acknowledge operational, technical, and scientific support provided by NCAR's Earth Observing Laboratory, sponsored by the National Science Foundation. This material is based upon work supported by the National Center for Atmospheric Research, which is a major facility sponsored by the National Science Foundation under Cooperative Agreement No. 1852977. The NASA Goddard Space Flight Center (GSFC) team acknowledges support for the ATom campaign from the NASA Earth Venture Suborbital-2 Program and support for DC3 and SEAC4RS campaigns from NASA.
This research has been supported by the NOAA (grant no. NA18OAR4310108) and the NASA (grant nos. NNX17AH47G, 80NSSC18K0691, and 80NSSC18M0091).
This paper was edited by Michel Van Roozendael and reviewed by two anonymous referees.
Apel, E. C., Hills, A. J., Lueb, R., Zindel, S., Eisele, S., and Riemer, D. D.: A Fast-GC/MS system to measure C2 to C4 carbonyls, and methanol aboard aircraft, J. Geophys. Res., 108, 8794, https://doi.org/10.1029/2002JD003199, 2003.
Apel, E. C., Emmons, L. K., Karl, T., Flocke, F., Hills, A. J., Madronich, S., Lee-Taylor, J., Fried, A., Weibring, P., Walega, J., Richter, D., Tie, X., Mauldin, L., Campos, T., Weinheimer, A., Knapp, D., Sive, B., Kleinman, L., Springston, S., Zaveri, R., Ortega, J., Voss, P., Blake, D., Baker, A., Warneke, C., Welsh-Bon, D., de Gouw, J., Zheng, J., Zhang, R., Rudolph, J., Junkermann, W., and Riemer, D. D.: Chemical evolution of volatile organic compounds in the outflow of the Mexico City Metropolitan area, Atmos. Chem. Phys., 10, 2353–2375, https://doi.org/10.5194/acp-10-2353-2010, 2010.
Apel, E. C., Hornbrook, R. S., Hills, A. J., Blake, N. J., Barth, M. C., Weinheimer, A., Cantrell, C., Rutledge, S. A., Basarab, B., Crawford, J., Diskin, G., Homeyer, C. R., Campos, T., Flocke, F., Fried, A., Blake, D. R., Brune, W., Pollack, I., Peischl, J., Ryer- son, T., Wennberg, P. O., Crounse, J. D., Wisthaler, A., Mikoviny, T., Huey, G., Heikes, B., O'Sullivan, D., and Riemer, D. D.: Upper tropospheric ozone production from lightning NOx-impacted convection: Smoke ingestion case study from the DC3 campaign, J. Geophys. Res.-Atmos., 120, 2505–2523, 2015.
ATom-1 Science Team: ATom-1 merge data, available at: https://daac.ornl.gov/ATOM/campaign/ (last access: 23 October 2020), 2016.
ATom-2 Science Team: ATom-2 merge data, available at: https://daac.ornl.gov/ATOM/campaign/ (last access: 23 October 2020), 2017.
Barkley, M. P., De Smedt, I., Van Roozendael, M., Kurosu, T. P., Chance, K., Arneth, A., Hagberg, D., Guenther, A., Paulot, F., Marais, E., and Mao, J.: Top-down isoprene emissions over tropical South America inferred from SCIAMACHY and OMI formaldehyde columns, J. Geophys. Res.-Atmos., 118, 6849–6868, 2013.
Barth, M. C., Cantrell, C. A., Brune, W. H., Rutledge, S. A., Crawford, J. H., Huntrieser, H., Carey, L. D., MacGorman, D., Weisman, M., Pickering, K. E., Bruning, E., Anderson, B., Apel, E., Biggerstaff, M., Campos, T., Campuzano-Jost, P., Cohen, R., Crounse, J., Day, D. A., Diskin, G., Flocke, F., Fried, A., Garland, C., Heikes, B., Honomichl, S., Hornbrook, R., Huey, L. G., Jimenez, J. L., Lang, T., Lichtenstern, M., Mikoviny, T., Nault, B., O'Sullivan, D., Pan, L. L., Peischl, J., Pollack, I., Richter, D., Riemer, D., Ryerson, T., Schlager, H., St Clair, J., Walega, J., Weibring, P., Weinheimer, A., Wennberg, P., Wisthaler, A., Wooldridge, P. J., and Ziegler, C.: The Deep Convective Clouds and Chemistry (DC3) Field Campaign, B. Am. Meteorol. Soc., 96, 1281–1309, https://doi.org/10.1175/Bams-D-13-00290.1, 2015.
Cao, H., Fu, T.-M., Zhang, L., Henze, D. K., Miller, C. C., Lerot, C., Abad, G. G., De Smedt, I., Zhang, Q., van Roozendael, M., Hendrick, F., Chance, K., Li, J., Zheng, J., and Zhao, Y.: Adjoint inversion of Chinese non-methane volatile organic compound emissions using space-based observations of formaldehyde and glyoxal, Atmos. Chem. Phys., 18, 15017–15046, https://doi.org/10.5194/acp-18-15017-2018, 2018.
Cazorla, M., Wolfe, G. M., Bailey, S. A., Swanson, A. K., Arkinson, H. L., and Hanisco, T. F.: A new airborne laser-induced fluorescence instrument for in situ detection of formaldehyde throughout the troposphere and lower stratosphere, Atmos. Meas. Tech., 8, 541–552, https://doi.org/10.5194/amt-8-541-2015, 2015.
Chance, K., Palmer, P. I., Spurr, R. J. D., Martin, R. V., Kurosu, T. P., and Jacob, D. J.: Satellite observations of formaldehyde over North America from GOME, Geophys. Res. Lett., 27, 3461–3464, 2000.
Chan Miller, C., Jacob, D. J., Marais, E. A., Yu, K., Travis, K. R., Kim, P. S., Fisher, J. A., Zhu, L., Wolfe, G. M., Hanisco, T. F., Keutsch, F. N., Kaiser, J., Min, K.-E., Brown, S. S., Washenfelder, R. A., González Abad, G., and Chance, K.: Glyoxal yield from isoprene oxidation and relation to formaldehyde: chemical mechanism, constraints from SENEX aircraft observations, and interpretation of OMI satellite data, Atmos. Chem. Phys., 17, 8725–8738, https://doi.org/10.5194/acp-17-8725-2017, 2017.
Courrèges-Lacoste, G. B., Sallusti, M., Bulsa, G., Bagnasco, G., Veihelmann, B., Riedl, S., Smith, D. J., and Maurer, R.: The Copernicus Sentinel 4 mission: a geostationary imaging UVN spectrometer for air quality monitoring, Proceedings Volume 10423, Sensors, Systems, and Next-Generation Satellites XXI, 1042307, https://doi.org/10.1117/12.2282158, 2017.
Crawford, J. H. and Pickering, K. E.: Discover-AQ: Advancing strategies for air quality observations in the next decade, EM Air Waste Manag. Assoc., 9, 4–7, 2014.
De Smedt, I., Müller, J.-F., Stavrakou, T., van der A, R., Eskes, H., and Van Roozendael, M.: Twelve years of global observations of formaldehyde in the troposphere using GOME and SCIAMACHY sensors, Atmos. Chem. Phys., 8, 4947–4963, https://doi.org/10.5194/acp-8-4947-2008, 2008.
De Smedt, I., Van Roozendael, M., Stavrakou, T., Müller, J.-F., Lerot, C., Theys, N., Valks, P., Hao, N., and van der A, R.: Improved retrieval of global tropospheric formaldehyde columns from GOME-2/MetOp-A addressing noise reduction and instrumental degradation issues, Atmos. Meas. Tech., 5, 2933–2949, https://doi.org/10.5194/amt-5-2933-2012, 2012.
De Smedt, I., Stavrakou, T., Hendrick, F., Danckaert, T., Vlemmix, T., Pinardi, G., Theys, N., Lerot, C., Gielen, C., Vigouroux, C., Hermans, C., Fayt, C., Veefkind, P., Müller, J.-F., and Van Roozendael, M.: Diurnal, seasonal and long-term variations of global formaldehyde columns inferred from combined OMI and GOME-2 observations, Atmos. Chem. Phys., 15, 12519–12545, https://doi.org/10.5194/acp-15-12519-2015, 2015.
De Smedt, I., Theys, N., Yu, H., Danckaert, T., Lerot, C., Compernolle, S., Van Roozendael, M., Richter, A., Hilboll, A., Peters, E., Pedergnana, M., Loyola, D., Beirle, S., Wagner, T., Eskes, H., van Geffen, J., Boersma, K. F., and Veefkind, P.: Algorithm theoretical baseline for formaldehyde retrievals from S5P TROPOMI and from the QA4ECV project, Atmos. Meas. Tech., 11, 2395–2426, https://doi.org/10.5194/amt-11-2395-2018, 2018.
DISCOVER-AQ California Science Team: DISCOVER-AQ merge data, available at: https://www-air.larc.nasa.gov/missions/discover-aq/discover-aq.html(last access: 23 October 2020), 2013.
DISCOVER-AQ Colorado Science Team: DISCOVER-AQ Colorado merge data, available at: https://www-air.larc.nasa.gov/missions/discover-aq/discover-aq.html (last access: 23 October 2020), 2014.
DISCOVER-AQ Science Team: DISCOVER-AQ P-3B Aircraft In-situ Trace Gas Measurements, NASA Langley Atmospheric Science Data Center DAAC, https://doi.org/10.5067/Aircraft/DISCOVER-AQ/Aerosol-TraceGas, 2014.
DISCOVER-AQ Texas Science Team: DISCOVER-AQ Texas merge data, available at: https://www-air.larc.nasa.gov/missions/discover-aq/discover-aq.html (last access: 23 October 2020), 2013.
Emmons, L.: Merged Data Files containing all C-130 1 Second Observations, Version 1.0, UCAR/NCAR – Earth Observing Laboratory, available at: https://data.eol.ucar.edu/dataset/373.045 (last access: 10 July 2019), 2016.
EPA: National Emissions Inventory, version 2 Technical Support Document, 2015, available at: https://www.epa.gov/sites/production/files/2015-10/documents/nei2011v2_tsd_14aug2015.pdf (last access: 9 July 2019), 2015.
FRAPPÉ Science Team: FRAPPÉ merge data, available at: http://catalog.eol.ucar.edu/FRAPPE/ (last access: 23 October 2020), 2014.
Fried, A., Cantrell, C., Olson, J., Crawford, J. H., Weibring, P., Walega, J., Richter, D., Junkermann, W., Volkamer, R., Sinreich, R., Heikes, B. G., O'Sullivan, D., Blake, D. R., Blake, N., Meinardi, S., Apel, E., Weinheimer, A., Knapp, D., Perring, A., Cohen, R. C., Fuelberg, H., Shetter, R. E., Hall, S. R., Ullmann, K., Brune, W. H., Mao, J., Ren, X., Huey, L. G., Singh, H. B., Hair, J. W., Riemer, D., Diskin, G., and Sachse, G.: Detailed comparisons of airborne formaldehyde measurements with box models during the 2006 INTEX-B and MILAGRO campaigns: potential evidence for significant impacts of unmeasured and multi-generation volatile organic carbon compounds, Atmos. Chem. Phys., 11, 11867–11894, https://doi.org/10.5194/acp-11-11867-2011, 2011.
Giglio, L., Randerson, J. T., and van der Werf, G. R.: Analysis of daily, monthly, and annual burned area using the fourth- generation global fire emissions database (GFED4), J. Geophys. Res.-Biogeo., 118, 317–328, https://doi.org/10.1002/jgrg.20042, 2013.
González Abad, G., Liu, X., Chance, K., Wang, H., Kurosu, T. P., and Suleiman, R.: Updated Smithsonian Astrophysical Observatory Ozone Monitoring Instrument (SAO OMI) formaldehyde retrieval, Atmos. Meas. Tech., 8, 19–32, https://doi.org/10.5194/amt-8-19-2015, 2015.
González Abad, G., Vasilkov, A., Seftor, C., Liu, X., and Chance, K.: Smithsonian Astrophysical Observatory Ozone Mapping and Profiler Suite (SAO OMPS) formaldehyde retrieval, Atmos. Meas. Tech., 9, 2797–2812, https://doi.org/10.5194/amt-9-2797-2016, 2016.
Guenther, A. B., Jiang, X., Heald, C. L., Sakulyanontvittaya, T., Duhl, T., Emmons, L. K., and Wang, X.: The Model of Emissions of Gases and Aerosols from Nature version 2.1 (MEGAN2.1): an extended and updated framework for modeling biogenic emissions, Geosci. Model Dev., 5, 1471–1492, https://doi.org/10.5194/gmd-5-1471-2012, 2012.
Herman, J., Spinei, E., Fried, A., Kim, J., Kim, J., Kim, W., Cede, A., Abuhassan, N., and Segal-Rozenhaimer, M.: NO2 and HCHO measurements in Korea from 2012 to 2016 from Pandora spectrometer instruments compared with OMI retrievals and with aircraft measurements during the KORUS-AQ campaign, Atmos. Meas. Tech., 11, 4583–4603, https://doi.org/10.5194/amt-11-4583-2018, 2018.
Hewson, W., Barkley, M. P., Gonzalez Abad, G., Bösch, H., Kurosu, T., Spurr, R., and Tilstra, L. G.: Development and characterisation of a state-of-the-art GOME-2 formaldehyde air-mass factor algorithm, Atmos. Meas. Tech., 8, 4055–4074, https://doi.org/10.5194/amt-8-4055-2015, 2015.
Holtslag, A. and Boville, B.: Local versus nonlocal boundary-layer diffusion in a global climate model, J. Climate, 6, 1825–1842, 1993.
Hu, L. and Permar, W.: PTR-ToF-MS Measurements of NMVOCs, HONO, HCN, CH3CN Data, Version 1.0. UCAR/NCAR – Earth Observing Laboratory. https://doi.org/10.26023/K9F4-2CNH-EQ0W, 2019.
Hu, L., Millet, D. B., Baasandorj, M., Griffis, T. J., Turner, P., Helmig, D., Curtis, A. J., and Hueber, J.: Isoprene emissions and impacts over an ecological transition region in the US Upper Midwest inferred from tall tower measurements, J. Geophys. Res.-Atmos., 120, 3553–3571, 2015.
International GEOS-Chem User Community: GEOS-Chem 12.0.0 release, Zenodo, https://doi.org/10.5281/zenodo.1343547, 2018.
Jaeglé, L., Thornton, J. A., Brown, S. S., Shah, V., Lopez-Hilfiker, F., Lee, B. H., Haskins, J., Fibiger, D. L., McDuffie, E. E., Sparks, T., Ebben, C. J., Wooldridge, P. J., Cohen, R. C., Veres, P. R., Weinheimer, A. J., Montzka, D. D., Dibb, J. E., Schroder, J. C., Jost, P. C., Day, D. A., Jimenez, J. L., Sullivan, A., Guo, H., Weber, R. J., Green, J. R., Fiddler, M. N., Bililign, S., Campos, T. L., Apel E. C., Blake, N. J., Hall, S. R., Ullmann, K., Wolfe, G. M., DiGangi, J. P., Hanisco, T. F., and Leen, J. B.: Sources, Chemistry, and Transport of Pollutants over the Eastern United States During the WINTER 2015 Aircraft Campaign, AGU Fall Meeting, 2015.
Jin, X. and Holloway, T.: Spatial and temporal variability of ozone sensitivity over China observed from the Ozone Monitoring Instrument, J. Geophys. Res.-Atmos., 120, 7229–7246, https://doi.org/10.1002/2015JD023250, 2015.
Jin, X., Fiore, A. M., Murray, L. T., Valin, L. C., Lamsal, L. N., Duncan, B., Folkert Boersma, K., De Smedt, I., Abad, G. G., Chance, K., and Tonnesen, G. S.: Evaluating a space-based indicator of surface ozone-NOx-VOC sensitivity over midlatitude source regions and application to decadal trends, J. Geophys. Res.-Atmos., 122, 439–461, https://doi.org/10.1002/2017JD026720, 2017.
Khokhar, M., Frankenberg, C., Roozendael, M. V., Beirle, S., Kuhl, S., Richter, A., Platt, U., and Wagner, T.: Satellite observations of atmospheric SO2 from volcanic eruptions during the time-period of 1996–2002, Adv. Space Res., 36, 879–887, https://doi.org/10.1016/j.asr.2005.04.114, 2005.
Kim, J., Jeong, U., Ahn, M., Kim, J. H., Park, R. J., Lee, H., Song, C. H., Choi, Y., Lee, K., Yoo, J., Jeong, M., Park, S. K., Lee, K., Song, C., Kim, S., Kim, Y., Kim, S., Kim, M., Go, S., Liu, X., Chance, K., Chan Miller, C., Al-Saadi, J., Veihelmann, B., Bhartia, P. K., Torres, O., González Abad, G., Haffner, D. P., Ko, D. H., Lee, S. H., Woo, J., Chong, H., Park, S. S., Nicks, D., Choi, W. J., Moon, K., Cho, A., Yoon, J., Kim, S., Hong, H., Lee, K., Lee, H., Lee, S., Choi, M., Veefkind, P., Levelt, P., Edwards, D. P., Kang, M., Eo, M., Bak, J., Baek, K., Kwon, H., Yang, J., Park, J., Han, K. M., Kim, B., Shin, H., Choi, H., Lee, E., Chong, J., Cha, Y., Koo, J., Irie, H., Hayashida, S., Kasai, Y., Kanaya, Y., Liu, C., Lin, J., Crawford, J. H., Carmichael, G. R., Newchurch, M. J., Lefer, B. L., Herman, J. R., Swap, R. J., Lau, A. K., Kurosu, T. P., Jaross, G., Ahlers, B., Dobber, M., McElroy, C., and Choi, Y.: New Era of Air Quality Monitoring from Space: Geostationary Environment Monitoring Spectrometer (GEMS), B. Am. Meteorol. Soc., 101, E1–E22, https://doi.org/10.1175/BAMS-D-18-0013.1, 2020.
Kleipool, Q. L., Dobber, M. R., de Haan, J. F., and Levelt, P. F.: Earth surface reflectance climatology from 3 years of OMI data, J. Geophys. Res.-Atmos., 113, D18308, https://doi.org/10.1029/2008JD010290, 2008.
KORUS-AQ Science Team: An International Cooperative Air Quality Field Study in Korea, available at: https://www-air.larc.nasa.gov/missions/korus-aq/ (last access: 22 October 2019), https://doi.org/10.5067/Suborbital/KORUSAQ/DATA01, 2016.
Kwon, H.-A., Park, R. J., Jeong, J. I., Lee, S., González Abad, G., Kurosu, T. P., Palmer, P. I., and Chance, K.: Sensitivity of formaldehyde (HCHO) column measurements from a geostationary satellite to temporal variation of the air mass factor in East Asia, Atmos. Chem. Phys., 17, 4673–4686, https://doi.org/10.5194/acp-17-4673-2017, 2017.
Kwon, H.-A., Park, R. J., González Abad, G., Chance, K., Kurosu, T. P., Kim, J., De Smedt, I., Van Roozendael, M., Peters, E., and Burrows, J.: Description of a formaldehyde retrieval algorithm for the Geostationary Environment Monitoring Spectrometer (GEMS), Atmos. Meas. Tech., 12, 3551–3571, https://doi.org/10.5194/amt-12-3551-2019, 2019.
Li, C., Joiner, J., Krotkov, N. A., and Dunlap, L.: A newmethod for global retrievals of HCHO total columns from the Suomi National Polar-orbiting Partnership Ozone Mapping and Profiler Suite, Geophys. Res. Lett., 42, 2515–2522, 2015.
Li, M., Zhang, Q., Kurokawa, J.-I., Woo, J.-H., He, K., Lu, Z., Ohara, T., Song, Y., Streets, D. G., Carmichael, G. R., Cheng, Y., Hong, C., Huo, H., Jiang, X., Kang, S., Liu, F., Su, H., and Zheng, B.: MIX: a mosaic Asian anthropogenic emission inventory under the international collaboration framework of the MICS-Asia and HTAP, Atmos. Chem. Phys., 17, 935–963, https://doi.org/10.5194/acp-17-935-2017, 2017.
Liao, J., Hanisco, T. F., Wolfe, G. M., St. Clair, J., Jimenez, J. L., Campuzano-Jost, P., Nault, B. A., Fried, A., Marais, E. A., Gonzalez Abad, G., Chance, K., Jethva, H. T., Ryerson, T. B., Warneke, C., and Wisthaler, A.: Towards a satellite formaldehyde – in situ hybrid estimate for organic aerosol abundance, Atmos. Chem. Phys., 19, 2765–2785, https://doi.org/10.5194/acp-19-2765-2019, 2019.
Lin, J.-T. and McElroy, M.: Impacts of boundary layer mixing on pollutant vertical profiles in the lower troposphere: Implications to satellite remote sensing, Atmos. Environ., 44, 1726–1739, 2010.
Marais, E. A., Jacob, D. J., Kurosu, T. P., Chance, K., Murphy, J. G., Reeves, C., Mills, G., Casadio, S., Millet, D. B., Barkley, M. P., Paulot, F., and Mao, J.: Isoprene emissions in Africa inferred from OMI observations of formaldehyde columns, Atmos. Chem. Phys., 12, 6219–6235, https://doi.org/10.5194/acp-12-6219-2012, 2012.
Martin, R. V., Parrish, D. D., Ryerson, T. B., Nicks Jr., D. K., Chance, K., Kurosu, T. P., Jacob, D. J., Sturges, E. D., Fried, A., and Wert, B. P.: Evaluation of GOME satellite measurements of tropospheric NO2 and HCHO using regional data from aircraft campaigns in the southeastern United States, J. Geophys. Res.-Atmos., 109, D24307, https://doi.org/10.1029/2004JD004869, 2004.
Millet, D. B., Baasandorj, M., Farmer, D. K., Thornton, J. A., Baumann, K., Brophy, P., Chaliyakunnel, S., de Gouw, J. A., Graus, M., Hu, L., Koss, A., Lee, B. H., Lopez-Hilfiker, F. D., Neuman, J. A., Paulot, F., Peischl, J., Pollack, I. B., Ryerson, T. B., Warneke, C., Williams, B. J., and Xu, J.: A large and ubiquitous source of atmospheric formic acid, Atmos. Chem. Phys., 15, 6283–6304, https://doi.org/10.5194/acp-15-6283-2015, 2015.
Molod, A., Takacs, L., Suarez, M., Bacmeister, J., Song, I.-S., and Eichmann, A.: The GEOS-5 Atmospheric General Circulation Model: Mean Climate and Development from MERRA to Fortuna, NASA/TM–2012, 104606, 28, 1–124, 2012.
Müller, M., Mikoviny, T., Feil, S., Haidacher, S., Hanel, G., Hartungen, E., Jordan, A., Märk, L., Mutschlechner, P., Schottkowsky, R., Sulzer, P., Crawford, J. H., and Wisthaler, A.: A compact PTR-ToF-MS instrument for airborne measurements of volatile organic compounds at high spatiotemporal resolution, Atmos. Meas. Tech., 7, 3763–3772, https://doi.org/10.5194/amt-7-3763-2014, 2014.
National Oceanic and Atmospheric Administration (NOAA): SONGNEX 2015 CSD Data Archive, Earth System Research Laboratory, Chemical Sciences Division, available at: https://www.esrl.noaa.gov/csd/projects/songnex/ (last access: 22 October 2019), 2017.
NOMADSS Science Team: NOMADSS merge data, available at: https://www.eol.ucar.edu/field_projects/nomadss/ (last access: 23 October 2020), 2013.
Nowlan, C. R., Liu, X., Janz, S. J., Kowalewski, M. G., Chance, K., Follette-Cook, M. B., Fried, A., González Abad, G., Herman, J. R., Judd, L. M., Kwon, H.-A., Loughner, C. P., Pickering, K. E., Richter, D., Spinei, E., Walega, J., Weibring, P., and Weinheimer, A. J.: Nitrogen dioxide and formaldehyde measurements from the GEOstationary Coastal and Air Pollution Events (GEO-CAPE) Airborne Simulator over Houston, Texas, Atmos. Meas. Tech., 11, 5941–5964, https://doi.org/10.5194/amt-11-5941-2018, 2018.
Palmer, P. I., Jacob, D. J., Chance, K., Martin, R. V., Spurr, R. J. D., Kurosu, T. P., Bey, I., Yantosca, R., Fiore, A., and Li, Q.: Air mass factor formulation for spectroscopic measurements from satellites: Application to formaldehyde retrievals from the Global Ozone Monitoring Experiment, J. Geophys. Res.-Atmos., 106, 14539–14550, 2001.
Palmer, P. I., Jacob, D. J., Fiore, A. M., Martin, R. V., Chance, K., and Kurosu, T. P.: Mapping isoprene emissions over North America using formaldehyde column observations from space, J. Geophys. Res.-Atmos., 108, 4180, https://doi.org/10.1029/2002JD002153, 2003.
Pfister, G., Flocke, F., Hornbrook, R., Orlando, J., Lee, S., Schroeder, J., and NASA Langley Research Center: Process-Based and Regional Source Impact Analysis for FRAPPEì and DISCOVER-AQ 2014, available at: https://www.colorado.gov/airquality/tech_doc_repository.aspx?action=open&file=FRAPPE-NCAR_Final_Report_July2017.pdf (last access: 2 November 2019), 2017.
Pollack, I. B., Lindaas, J., Roscioli, J. R., Agnese, M., Permar, W., Hu, L., and Fischer, E. V.: Evaluation of ambient ammonia measurements from a research aircraft using a closed-path QC-TILDAS operated with active continuous passivation, Atmos. Meas. Tech., 12, 3717–3742, https://doi.org/10.5194/amt-12-3717-2019, 2019.
Richter, D., Weibring, P., Walega, J. G., Fried, A., Spuler, S. M., and Taubman, M. S.: Compact highly sensitive multi-species airborne mid-IR spectrometer, Appl. Phys. B, 119, 119–131, 2015.
Scarino, A. J., Obland, M. D., Fast, J. D., Burton, S. P., Ferrare, R. A., Hostetler, C. A., Berg, L. K., Lefer, B., Haman, C., Hair, J. W., Rogers, R. R., Butler, C., Cook, A. L., and Harper, D. B.: Comparison of mixed layer heights from airborne high spectral resolution lidar, ground-based measurements, and the WRF-Chem model during CalNex and CARES, Atmos. Chem. Phys., 14, 5547–5560, https://doi.org/10.5194/acp-14-5547-2014, 2014.
SENEX Science Team: SENEX merge data, available at: https://www.eol.ucar.edu/field_projects/nomadss/ (last access: 23 October 2020), 2013.
Shim, C., Wang, Y., Choi, Y., Palmer, P. I., Abbot, D. S., and Chance, K.: Constraining global isoprene emissions with Global Ozone Monitoring Experiment (GOME) formaldehyde column measurements, J. Geophys. Res.-Atmos., 110, D24301, https://doi.org/10.1029/2004JD005629, 2005.
SONGNEX Science Team: SONGNEX merge data, available at: https://www.esrl.noaa.gov/csd/projects/songnex/ (last access: 23 October 2020), 2015.
Stavrakou, T., Müller, J.-F., De Smedt, I., Van Roozendael, M., van der Werf, G. R., Giglio, L., and Guenther, A.: Global emissions of non-methane hydrocarbons deduced from SCIAMACHY formaldehyde columns through 2003–2006, Atmos. Chem. Phys., 9, 3663–3679, https://doi.org/10.5194/acp-9-3663-2009, 2009.
Singh, H. B., Brune, W. H., Crawford, J. H., Flocke, F., and Jacob, D. J.: Chemistry and transport of pollution over the Gulf of Mexico and the Pacific: spring 2006 INTEX-B campaign overview and first results, Atmos. Chem. Phys., 9, 2301–2318, https://doi.org/10.5194/acp-9-2301-2009, 2009.
Surl, L., Palmer, P. I., and González Abad, G.: Which processes drive observed variations of HCHO columns over India?, Atmos. Chem. Phys., 18, 4549–4566, https://doi.org/10.5194/acp-18-4549-2018, 2018.
Tan, W., Liu, C., Wang, S., Xing, C., Su, W., Zhang, C., Xia, C., Liu, H., Cai, Z., and Liu, J.: Tropospheric NO2, SO2, and HCHO over the East China Sea, using ship-based MAX-DOAS observations and comparison with OMI and OMPS satellite data, Atmos. Chem. Phys., 18, 15387–15402, https://doi.org/10.5194/acp-18-15387-2018, 2018.
Toon, O. B., Maring, H., Dibb, J., Ferrare, R., Jacob, D. J., Jensen, E. J., Luo, Z. J., Mace, G. G., Pan, L. L., Pfister, L., Rosenlof, K. H., Redemann, J., Reid, J. S., Singh, H. B., Thompson, A. M., Yokelson, R., Minnis, P., Chen, G., Jucks, K. W., and Pszenny, A.: Planning, implementation, and scientific goals of the Studies of Emissions and Atmospheric Composition, Clouds and Climate Coupling by Regional Surveys (SEAC4RS) field mission, J. Geophys. Res.-Atmos., 121, 4967–5009, https://doi.org/10.1002/2015jd024297, 2016.
UCAR/NCAR – Earth Observing Laboratory, Jaeglé, L., and Shah, V.: 1s Merged dataset of all C-130 observations and GEOS-Chem near-realtime simulations for WINTER, Version 1.1. UCAR/NCAR – Earth Observing Laboratory, https://doi.org/10.5065/D68C9TDX, 2016.
Vigouroux, C., Hendrick, F., Stavrakou, T., Dils, B., De Smedt, I., Hermans, C., Merlaud, A., Scolas, F., Senten, C., Vanhaelewyn, G., Fally, S., Carleer, M., Metzger, J.-M., Müller, J.-F., Van Roozendael, M., and De Mazière, M.: Ground-based FTIR and MAX-DOAS observations of formaldehyde at Réunion Island and comparisons with satellite and model data, Atmos. Chem. Phys., 9, 9523–9544, https://doi.org/10.5194/acp-9-9523-2009, 2009.
Wang, Y., Beirle, S., Lampel, J., Koukouli, M., De Smedt, I., Theys, N., Li, A., Wu, D., Xie, P., Liu, C., Van Roozendael, M., Stavrakou, T., Müller, J.-F., and Wagner, T.: Validation of OMI, GOME-2A and GOME-2B tropospheric NO2, SO2 and HCHO products using MAX-DOAS observations from 2011 to 2014 in Wuxi, China: investigation of the effects of priori profiles and aerosols on the satellite products, Atmos. Chem. Phys., 17, 5007–5033, https://doi.org/10.5194/acp-17-5007-2017, 2017.
Wang, Y., Wang, Z., Yu, C., Zhu, S., Cheng, L., Zhang, Y., and Chen, L.: Validation of OMI HCHO Products Using MAX-DOAS observations from 2010 to 2016 in Xianghe, Beijing: Investigation of the Effects of Aerosols on Satellite Products, Remote Sens., 11, 203, https://doi.org/10.3390/rs11020203, 2019.
Warneke, C., Trainer, M., de Gouw, J. A., Parrish, D. D., Fahey, D. W., Ravishankara, A. R., Middlebrook, A. M., Brock, C. A., Roberts, J. M., Brown, S. S., Neuman, J. A., Lerner, B. M., Lack, D., Law, D., Hübler, G., Pollack, I., Sjostedt, S., Ryerson, T. B., Gilman, J. B., Liao, J., Holloway, J., Peischl, J., Nowak, J. B., Aikin, K. C., Min, K.-E., Washenfelder, R. A., Graus, M. G., Richardson, M., Markovic, M. Z., Wagner, N. L., Welti, A., Veres, P. R., Edwards, P., Schwarz, J. P., Gordon, T., Dube, W. P., McKeen, S. A., Brioude, J., Ahmadov, R., Bougiatioti, A., Lin, J. J., Nenes, A., Wolfe, G. M., Hanisco, T. F., Lee, B. H., Lopez-Hilfiker, F. D., Thornton, J. A., Keutsch, F. N., Kaiser, J., Mao, J., and Hatch, C. D.: Instrumentation and measurement strategy for the NOAA SENEX aircraft campaign as part of the Southeast Atmosphere Study 2013, Atmos. Meas. Tech., 9, 3063–3093, https://doi.org/10.5194/amt-9-3063-2016, 2016.
WE-CAN Science Team: WE-CAN merge data, available at: https://www.eol.ucar.edu/field_projects/we-can/ (last access: 23 October 2020), 2018.
Weibring, P., Richter, D., Fried, A., Walega, J., and Dyroff, C.: Ultra-high-precision mid-IR spectrometer II: system description and spectroscopic performance, Appl. Phys. B, 85, 207–218, https://doi.org/10.1007/s00340-006-2300-4, 2006.
Weibring, P., Richter, D., Walega, J. G., and Fried, A.: First demonstration of a high performance difference frequency spectrometer on airborne platforms, Opt. Express, 15, 13476–13495, https://doi.org/10.1364/OE.15.013476, 2007.
Weibring, P., Richter, D., Walega, J. G., Rippe, L., and Fried, A.: Difference frequency generation spectrometer for simultaneous multispecies detection., Opt. Express, 18, 27670–27681, https://doi.org/10.1364/OE.18.027670, 2010.
WINTER Science Team: WINTER merge data, available at: http://catalog.eol.ucar.edu/winter/ (last access: 23 October 2020), 2015.
Wittrock, F., Richter, A., Oetjen, H., Burrows, J. P., Kanakidou, M., Myriokefalitakis, S., Volkamer, R., Beirle, S., Platt, U., and Wagner, T.: Simultaneous global observations of glyoxal and formaldehyde from space, Geophys. Res. Lett., 33, L16804, https://doi.org/10.1029/2006GL026310, 2006.
Wofsy, S. C., Afshar, S., Allen, H. M., Apel, E., Asher, E. C., Barletta, B., Bent, J., Bian, H., Biggs, B. C., Blake, D. R., Blake, N., Bourgeois, I., Brock, C. A., Brune, W. H., Budney, J. W., Bui, T. P., Butler, A., Campuzano-Jost, P., Chang, C. S., Chin, M., Commane, R., Correa, G., Crounse, J. D., Cullis, P. D., Daube, B. C., Day, D. A., Dean-Day, J. M., Dibb, J. E., DiGangi, J. P., Diskin, G. S., Dollner, M., Elkins, J. W., Erdesz, F., Fiore, A. M., Flynn, C. M., Froyd, K., Gesler, D. W., Hall, S. R., Hanisco, T. F., Hannun, R. A., Hills, A. J., Hintsa, E. J., Hoffman, A., Hornbrook, R. S., Huey, L. G., Hughes, S., Jimenez, J. L., Johnson, B. J., Katich, J. M., Keeling, R. F., Kim, M. J., Kupc, A., Lait, L. R., Lamarque, J.-F., Liu, J., McKain, K., Mclaughlin, R. J., Meinardi, S., Miller, D. O., Montzka, S. A., Moore, F. L., Morgan, E. J., Murphy, D. M., Murray, L. T., Nault, B. A., Neuman, J. A., Newman, P. A., Nicely, J. M., Pan, X., Paplawsky, W., Peischl, J., Prather, M. J., Price, D. J., Ray, E., Reeves, J. M., Richardson, M., Rollins, A. W., Rosenlof, K. H., Ryerson, T. B., Scheuer, E., Schill, G. P., Schroder, J. C., Schwarz, J. P., St.Clair, J. M., Steenrod, S. D., Stephens, B. B., Strode, S. A., Sweeney, C., Tanner, D., Teng, A. P., Thames, A. B., Thompson, C. R., Ullmann, K., Veres, P. R., Vieznor, N., Wagner, N. L., Watt, A., Weber, R., Weinzierl, B., Wennberg, P., Williamson, C. J., Wilson, J. C., Wolfe, G. M., Woods, C. T., and Zeng, L. H.: ATom: Merged Atmospheric Chemistry, Trace Gases, and Aerosols, ORNL DAAC, Oak Ridge, Tennessee, USA, https://doi.org/10.3334/ornldaac/1581, 2018.
Wolfe, G. M., Nicely, J. M., St. Clair, J. M., Hanisco, T. F., Liao, J., Oman, L. D., Brune, W. B., Miller, D., Thames, A., González Abad, G., Ryerson, T. B., Thompson, C. R., Peischl, J., McKain, K., Sweeney, C., Wennberg, P. O., Kim, M., Crounse, J. D., Hall, S. R., Ullmann, K., Diskin, G., Bui, P., Chang, C., and Dean-Day, J.: Mapping hydroxyl variability throughout the global remote troposphere via synthesis of airborne and satellite formaldehyde observations, P. Natl. Acad. Sci. USA, 116, 11171–11180, https://doi.org/10.1073/pnas.1821661116, 2019.
Zhu, L.: Global validation platform for satellite HCHO retrievals, Harvard Dataverse, V2, https://doi.org/10.7910/DVN/KG3XNC, 2019.
Zhu, L., Jacob, D. J., Mickley, L. J., Marais, E. A., Cohan, D. S., Yoshida, Y., Duncan, B. N., González Abad, G., and Chance, K. V.: Anthropogenic emissions of highly reactive volatile organic compounds in eastern Texas inferred from oversampling of satellite (OMI) measurements of HCHO columns, Environ. Res. Lett., 9, 114004, https://doi.org/10.1088/1748-9326/9/11/114004, 2014.
Zhu, L., Jacob, D. J., Kim, P. S., Fisher, J. A., Yu, K., Travis, K. R., Mickley, L. J., Yantosca, R. M., Sulprizio, M. P., De Smedt, I., González Abad, G., Chance, K., Li, C., Ferrare, R., Fried, A., Hair, J. W., Hanisco, T. F., Richter, D., Jo Scarino, A., Walega, J., Weibring, P., and Wolfe, G. M.: Observing atmospheric formaldehyde (HCHO) from space: validation and intercomparison of six retrievals from four satellites (OMI, GOME2A, GOME2B, OMPS) with SEAC4RS aircraft observations over the southeast US, Atmos. Chem. Phys., 16, 13477–13490, https://doi.org/10.5194/acp-16-13477-2016, 2016.
Zhu, L., Mickley, L. J., Jacob, D. J., Marais, E. A., Sheng, J., Hu, L., Gonzaìlez Abad, G., and Chance, K.: Long-term (2005–2014) trends in formaldehyde (HCHO) columns across North America as seen by the OMI satellite instrument: Evidence of changing emissions of volatile organic compounds, Geophys. Res. Lett., 44, 7079–7086, https://doi.org/10.1002/2017GL073859, 2017a.
Zhu, L., Jacob, D. J., Keutsch, F. N., Mickley, L. J., Scheffe, R., Strum, M., Abad, G. G., Chance, K., Yang, K., Rappengluck, B., Millet, D. B., Baasandorj, M., Jaeglé, L., and Shah, V.: Formaldehyde (HCHO) As a Hazardous Air Pollutant: Mapping Surface Air Concentrations from Satellite and Inferring Cancer Risks in the United States, Environ. Sci. Technol., 51, 5650–5657, https://doi.org/10.1021/acs.est.7b01356, 2017b.
Zoogman, P., Liu, X., Suleiman, R. M., Pennington, W. F., Flittner, D. E., Al-Saadi, J. A., Hilton, B. B., Nicks, D. K., Newchurch, M. J., Carr, J. L., Janz, S. J., Andraschko, M. R., Arola, A., Baker, B. D., Canova, B. P., Chan Miller, C., Cohen, R. C., Davis, J. E., Dussault, M. E., Edwards, D. P., Fishman, J., Ghulam, A., Gonzaìlez Abad, G., Grutter, M., Herman, J. R., Houck, J., Jacob, D. J., Joiner, J., Kerridge, B. J., Kim, J., Krotkov, N. A., Lamsal, L., Li, C., Lindfors, A., Martin, R. V., McElroy, C. T., McLin- den, C., Natraj, V., Neil, D. O., Nowlan, C. R., OSullivan, E. J., Palmer, P. I., Pierce, R. B., Pippin, M. R., Saiz-Lopez, A., Spurr, R. J. D., Szykman, J. J., Torres, O., Veefkind, J. P., Veihelmann, B., Wang, H., Wang, J., and Chance, K.: Tropospheric emissions: Monitoring of pollution (TEMPO), J. Quant. Spectrosc. Ra., 186, 17–39, https://doi.org/10.1016/j.jqsrt.2016.05.008, 2017.
- Abstract
- Introduction
- HCHO observations from aircraft campaigns
- GEOS-Chem as the intercomparison method
- Application to the NASA operational HCHO product
- Conclusions
- Appendix A: Abbreviations and acronyms
- Appendix B: Validation platform
- Code and data availability
- Author contributions
- Competing interests
- Acknowledgements
- Financial support
- Review statement
- References
- Supplement