the Creative Commons Attribution 4.0 License.
the Creative Commons Attribution 4.0 License.
 | 29 Oct 2020
Radiative effects of long-range-transported Saharan air layers as determined from airborne lidar measurements
Silke Groß
Martin Wirth
Bernhard Mayer
The radiative effect of long-range-transported Saharan air layers is investigated on the basis of simultaneous airborne high-spectral-resolution and differential-absorption lidar measurements in the vicinity of Barbados. Within the observed Saharan air layers, increased water vapor concentrations compared to the dry trade wind atmosphere are found. The measured profiles of aerosol optical properties and water vapor mixing ratios are used to characterize the atmospheric composition in radiative transfer calculations, to calculate radiative effects of moist Saharan air layers and to determine radiative heating rate profiles. An analysis based on three case studies reveals that the observed enhanced amounts of water vapor within Saharan air layers have a much stronger impact on heating rate calculations than mineral dust aerosol. Maximum mineral dust short-wave heating and long-wave cooling rates are found at altitudes of highest dust concentration (short wave: +0.5 K d−1; long wave: −0.2 K d−1; net: +0.3 K d−1). However, when considering both aerosol concentrations and measured water vapor mixing ratios in radiative transfer calculations, the maximum heating/cooling rates shift to the top of the dust layer (short wave: +2.2 K d−1; long wave: −6.0 to −7.0 K d−1; net: −4.0 to −5.0 K d−1). Additionally, the net heating rates decrease with height – indicating a destabilizing effect in the dust layers. Long-wave counter-radiation of Saharan air layers is found to reduce cooling at the tops of the subjacent marine boundary layers and might lead to less convective mixing in these layers. The overall short-wave radiative effect of mineral dust particles in Saharan air layers indicates a maximum magnitude of −40 W m−2 at surface level and a maximum of −25 W m−2 at the top of the atmosphere.
- Article
(5982 KB) - Full-text XML
- BibTeX
- EndNote


Each year during the northern hemispheric summer months from June to August, large amounts of Saharan mineral dust particles are transported from the African continent towards the Caribbean islands (Moulin et al., 1997). Dust particles are injected into the atmosphere over the Saharan, for example by nocturnal low-level jets or convective activity (Schepanski et al., 2009), and form well-mixed convective aerosol layers from ground level to up to 4–6 km height (Esselborn et al., 2008; Ben-Ami et al., 2009; Ansmann et al., 2011). Easterlies subsequently transport the layers westwards over hot desert surfaces towards the Atlantic Ocean. At the Atlantic coast the layers are undercut and lifted by cooler North Atlantic air masses and form elevated layers, the so-called Saharan air layers (SALs; Carlson and Prospero, 1972; Prospero and Carlson, 1972).
Embedded in the trade wind flow, SALs can be transported over thousands of kilometers towards the Caribbean or Americas (Carlson and Prospero, 1972; Karyampudi and Carlson, 1988; Karyampudi et al., 1999). During the summer months from June to August, SALs are observed to remain relatively undisturbed during their transatlantic transport. However, previous field campaigns (e.g., the Puerto Rico Dust Experiment (PRIDE) in 2000) have shown that especially during the winter months dust transport also occurs at lower atmospheric levels down to the sea surface (Reid et al., 2002). Such transport would modify the aerosol composition inside the boundary layer and would potentially impact the boundary layer state.
Either way, Saharan mineral dust aerosol layers cannot be understood as a local phenomenon close to their source regions. They have an impact on the radiation budget as well as on the formation and physical properties of clouds over large areas far away from their origin.
Optical and microphysical properties of long-range-transported Saharan mineral dust (Groß et al., 2015; Haarig et al., 2017a; Toledano et al., 2019) were investigated during the SALTRACE field campaign (Saharan Aerosol Long-range Transport and Aerosol-Cloud-Interaction Experiment; Weinzierl et al., 2017). Studies that aimed to quantify the radiative effects of SALs have concentrated on regions near Africa at the beginning of transatlantic transport (Li et al., 2004; Zhu et al., 2007; Kanitz et al., 2013). However, detailed studies regarding radiative effects of long-range-transported SALs are lacking.
Gutleben et al. (2019b) investigated a SAL upstream of the Caribbean island of Barbados using the combined high-spectral-resolution lidar (HSRL) and water vapor differential-absorption lidar (DIAL) technique. They found enhanced water vapor mixing ratios within the SAL compared to the surrounding dry free troposphere. From radio soundings close to the source region they inferred an enhancement of water vapor within the SAL already at the beginning of its long-range transport. Radiosonde measurements and Raman lidar measurements conducted by Jung et al. (2013) and Kanitz et al. (2014) support these findings. They both show enhanced water vapor concentrations as high as 5 g kg−1 within SALs.
Water vapor represents the Earth's strongest greenhouse gas, and model calculations indicate that especially after long-range transport SAL heating rates are highly sensitive to the water vapor profile used (Wong et al., 2009). However, previous studies which focused on the radiative effect of SALs close to their source regions lacked simultaneous measurements of water vapor and aerosol optical properties and had to assume the water vapor vertical distribution from standard atmosphere or model simulations. Gutleben et al. (2019b), however, showed that radiative heating caused by SAL water vapor has a much greater magnitude than radiative heating by SAL mineral dust particles and might alter the radiative heating rate profile from the bottom to the top of the SAL. Moreover, SAL water vapor not only influences the SAL thermodynamic structure itself but potentially also has an impact on surrounding atmospheric layers.
Differences in shallow marine cloudiness between dust-free and dust-laden North Atlantic trade wind regions were found by Gutleben et al. (2019b), with the dust-laden regions containing less, shallower and smaller clouds. They conjectured that differences in radiative transfer could cause the observed changes. A suppressing characteristic of SAL on convection was also found by Wong and Dessler (2005), who showed that the convection barrier increases with increasing aerosol optical depth (AOD) of the SAL. However, up to now it is still not understood how changes in radiative transfer could modify shallow marine cloudiness in dust-laden trade wind regions.
The aim of this study is to investigate the radiative effect of long-range-transported SALs and to study their impact on the subjacent boundary layer. For this purpose, simultaneous measurements of water vapor concentrations and aerosol optical properties by an airborne lidar system during the Next-Generation Aircraft Remote Sensing for Validation Studies II (NARVAL-II Stevens et al., 2019) in August 2016 are used. The measurements are utilized to characterize the vertical structure of both aerosols and water vapor mixing ratio from flight level down to the surface. The retrieved lidar profiles are utilized for the calculation of radiative heating rate profiles of both aerosols and water vapor using the radiative transfer model libRadtran (Library for Radiative Transfer; Mayer and Kylling, 2005; Emde et al., 2016). Moreover, the radiative effect of long-range-transported SALs at surface level as well as at the top of the atmosphere (TOA) is investigated.
This paper is structured as follows. In Sect. 2 an overview of the NARVAL-II campaign, the applied instruments and the radiative transfer model setup used is given. Section 3 shows the results of radiative transfer calculations for three representative case studies during NARVAL-II with different vertical dust layer extents and optical thicknesses. Results are discussed in Sect. 4 and focus on the radiative impact of long-range-transported SALs on the subjacent marine boundary layer (MBL) and atmospheric stability. Section 5 concludes this paper and gives a short summary.
2.1 The NARVAL-II field campaign
NARVAL-II took place in August 2016 and aimed at studying the subtropical North Atlantic atmospheric circulation using a combination of airborne remote sensing instruments (Stevens et al., 2019). Grantley Adams International Airport on Barbados (TBPB, 13∘04′ 29′′ N, 59∘29′ 33′′ W) served as an air base for 10 measurement flights over the subtropical North Atlantic Ocean with the German High Altitude and Long Range Research Aircraft (HALO; Krautstrunk and Giez, 2012). During the campaign the aircraft was equipped with the lidar system WALES (Water Vapor Lidar Experiment in Space; Wirth et al., 2009) and a set of active and passive remote sensing instruments, i.e., the HALO Microwave Package (HAMP; Mech et al., 2014; Ewald et al., 2019), the hyper spectral cloud and sky imager specMACS (Ewald et al., 2016) and the Spectral Modular Airborne Radiation Measurement System (Wendisch et al., 2001). In addition, a total number of 218 dropsondes were launched during the flights for measurements of the atmosphere's thermodynamic state.
2.2 The WALES instrument
WALES is an airborne lidar system which was developed at the Institute for Atmospheric Physics of the German Aerospace Center (Wirth et al., 2009). The system is designed as a Differential Absorption Lidar (DIAL) for measurements of atmospheric water vapor distributions and operates at four different wavelengths around the water vapor absorption bands at 935 nm. In addition to the DIAL capabilities, WALES is equipped with a polarization-sensitive HSRL channel at 532 nm for cloud and aerosol characterization (Esselborn et al., 2008). As a result, WALES is able to perform simultaneous measurements of particle extinction coefficients (αp(532)), backscatter ratios ( – with βp(532) and βm(532) being the particle and molecular backscatter coefficients) and particle linear depolarization ratios (δp(532)) at 532 nm as well as water vapor mass mixing ratios (rm) from flight altitude to surface level. DIAL and HSRL measurements are temporally averaged for noise reduction. As a result horizontal resolutions are approximately 0.2 km for HSRL measurements and 3.0 km for DIAL measurements at typical aircraft speeds of around 200 m s−1. WALES measures in a near-nadir direction (2–3∘ off-nadir angle) with vertical resolutions of 15 m. Pulse repetition rates of 10 ms between online and offline pulses allow high-quality water vapor measurements with relative uncertainties of less than 5 % (Kiemle et al., 2008). Relative uncertainties of backscatter, particle linear depolarization and extinction measurements sum up to 5 %, 10–16 % and 10–20 %, respectively (Esselborn et al., 2008).
2.3 The radiative transfer model libRadtran
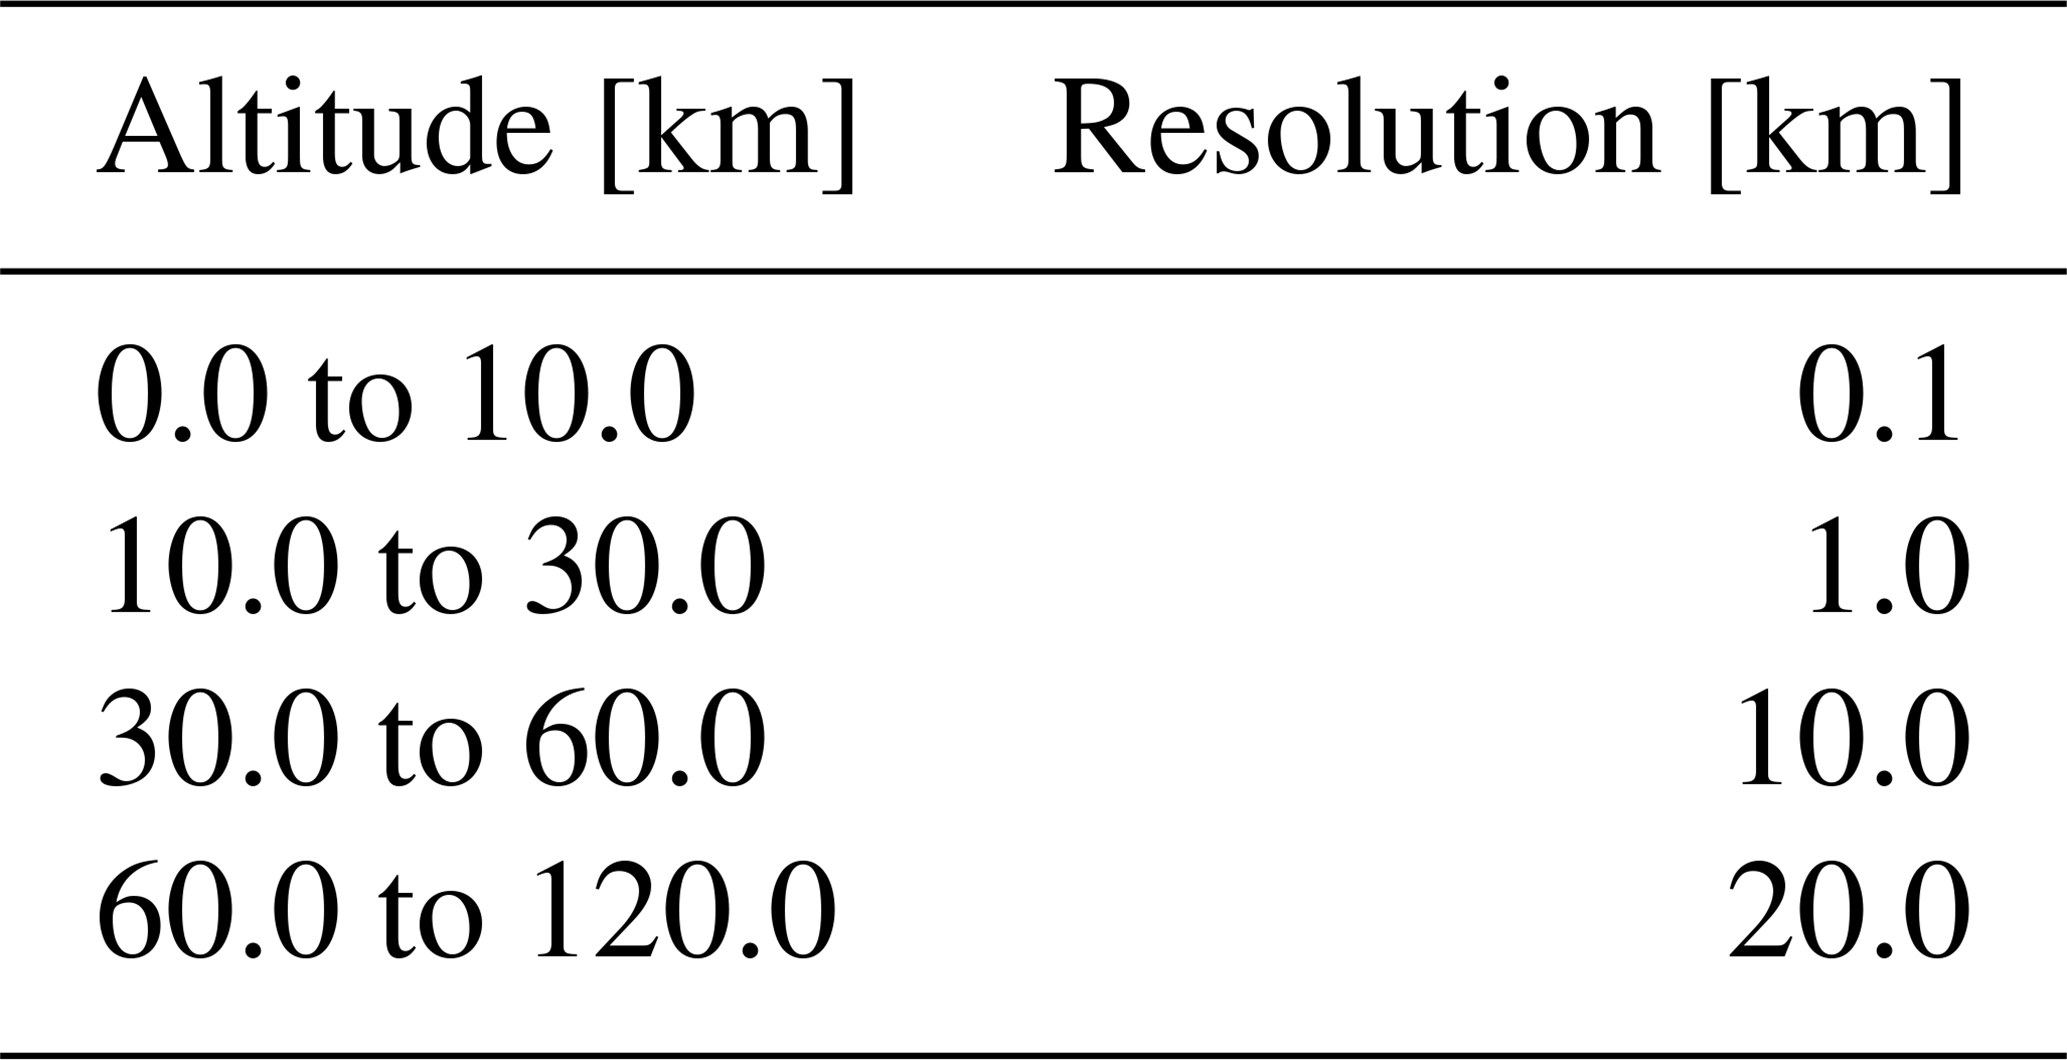
Calculations of both downward and upward irradiances as well as atmospheric heating rates are performed utilizing the radiative transfer equation solver DISORT (Stamnes et al., 1988) with an improved intensity correction (Buras et al., 2011). The solver is embedded in the Library for Radiative Transfer model (libRadtran; Mayer and Kylling, 2005; Emde et al., 2016) and is applied with 16 streams in the short-wave (0.12–4.0 µm) and long-wave (2.5–100.0 µm) spectra. At lower tropospheric levels (0–10 km) the model grid is set to vertical resolutions of 0.1 km. To save computational time, the grid setting is changed to coarser resolutions at higher altitudes (see Table 1).
Time-expensive line-by-line calculations of spectral molecular absorption in the short-wave and long-wave spectral ranges are avoided by employing the sufficiently accurate correlated k-distribution absorption band parametrizations (Kato et al., 1999; Fu and Liou, 1992). Irradiances are then calculated by integrating over the respective parametrized absorption bands and height-resolved diurnally averaged heating rates in the short-wave and long-wave spectra are derived from the difference in calculated radiation flux at the particular height intervals, solving
at any vertical level z. Here, is the change in temperature with time at altitude z, cp is the specific heat capacity of air at constant pressure, ρ(z) is the altitude-dependent air density and represents the vertical change in net radiative flux at altitude z. The model temperature is parametrized using collocated dropsonde measurements. Reference profiles described by Anderson et al. (1986) are used to parametrize the trace gas concentrations from 0 to 120 km altitude. However, water vapor profiles and any information on the atmospheric aerosol composition underneath the aircraft are taken from WALES lidar measurements, which are interpolated accordingly to fit the model grid.
To minimize uncertainties in surface albedo (Claquin et al., 1998; Liao and Seinfeld, 1998), the bidirectional reflectance distribution function (BRDF; Cox and Munk, 1954a, b; Bellouin et al., 2004) is used. The BRDF derives sea surface albedo from 10 m wind speeds measured by dropsondes and sea swell. Based on measurements by the MODIS (Moderate Resolution Imaging Spectroradiometer) instrument aboard the Aqua and Terra satellites during the field campaign, sea surface temperature is set to a fixed value of 302 K.
2.4 Aerosol optical properties from lidar measurements
In this study, the characterization of aerosol and water vapor profiles in libRadtran is performed using WALES DIAL and depolarization lidar measurements. Therefore, a method to identify profile regions of different aerosol species and aerosol concentrations using lidar measurements of αp(532), R532, δp(532) and rm was developed and is discussed in the following.
2.4.1 Aerosol classification
WALES lidar profiles of the particle linear depolarization ratio δp(532) can be used to detect and identify Saharan dust marine aerosols in vertical atmospheric columns (Burton et al., 2012; Groß et al., 2013). δp(532) for Saharan dust near source regions fluctuates around 0.3 (Freudenthaler et al., 2009; Tesche et al., 2009b; Groß et al., 2011b). Groß et al. (2015) showed that this ratio remains unchanged after long-range transport across the subtropical North Atlantic Ocean. Marine aerosol is composed of sea salt and water-soluble parts and is weakly depolarizing in a moist environment. Dry and stronger depolarizing marine aerosol (δp(532)>0.04; Murayama et al., 1999; Sakai et al., 2010; Haarig et al., 2017b) is therefore not expected since relative humidity at the lowest atmospheric levels was found to be always greater than 80 %. Other aerosol types, like African biomass burning aerosols, are also not expected in the measurement region, and no evidence for such types was found across the subtropical North Atlantic Ocean by looking at satellite imagery. As a result, δp(532) is a good proxy for the differentiation of mineral dust and less depolarizing marine aerosol (Sakai et al., 2010; Burton et al., 2012; Groß et al., 2013) in NARVAL-II WALES lidar profiles. In this way three aerosol regimes can be determined in the data set:
- i.
pure mineral dust regime: δp(532)≥0.26;
- ii.
pure marine aerosol regime: δp(532)≤0.04;
- iii.
mixed regime – marine aerosol mixed with mineral dust: .
Clear and aerosol-free regions are detected via filtering for no evident particle backscattering (R532<1.2). Cross sections of an aerosol mask along the HALO flight tracks for libRadtran aerosol input are generated using these criteria.
In addition to the application of the detection scheme, the Saharan origin of detected mineral dust layers is verified utilizing the Hybrid Single Particle Lagrangian Integrated Trajectory model (HYSPLIT; Stein et al., 2015) with NCEP GDAS (National Centers for Environmental Prediction Global Data Assimilation System) input data (shown in Gutleben et al., 2019a). Starting locations and times for the backward-trajectory calculations were chosen to match the center of detected mineral dust layers in lidar data.
2.4.2 Conversion of aerosol extinction coefficients to aerosol mass concentrations
To run UVSPEC with aerosol input, particle mass concentrations in the classified aerosol regimes have to be determined.
According to Groß et al. (2016), conversion factors can be used to convert measured αp(532) to mineral dust and marine aerosol concentrations per unit volume (cv, dust,cv, marine). These factors are taken from results of the AERONET inversion algorithm presented by Mamouri and Ansmann (2016) and are given in Groß et al. (2016). For long-range-transported Saharan dust a conversion factor of m was derived. Due to the similar size distribution of mineral dust and marine aerosols, the AERONET inversion deduced a similar conversion factor of m for marine aerosol. These values are adopted for this study. Mineral dust and marine aerosol mass concentrations (cm, dust,cm, marine) are then calculated by multiplying the derived aerosol volume concentrations with typical particle densities of ρdust=2.5 g cm−3 for long-range-transported mineral dust and ρmarine=2.2 g cm−3 for marine aerosol. Those particle densities are based on a study by Kaaden et al. (2009), who showed that SALs consist of a mixture of mineral dust particles together with sulfate particles.
The above equations allow the characterization of aerosol mass concentrations in the pure mineral dust regime (i) and marine aerosol regime (ii). However, in mixed regimes (iii), which appear frequently over the North Atlantic Ocean when SAL mineral dust is settling to lower atmospheric levels, the mineral dust contribution to αp(532) of the total aerosol mixture has to be determined before the application of the conversion coefficients. The aerosol extinction coefficient at 532 nm of a marine–mineral dust aerosol mixture αp(532),mix can be written as
with αp(532),marine and αp(532),dust being the marine aerosol and mineral dust particle extinction coefficient at 532 nm and . Using the known lidar ratios of marine and mineral dust aerosol at 532 nm ( and ; Burton et al., 2012; Groß et al., 2013) and following the methods described in Tesche et al. (2009a) and Groß et al. (2011a), one can calculate the fraction x of dust contributing to the total particle extinction coefficient of the mixture,
with the coefficients Ddust and Dmarine:
Finally, Eq. (3), νdust (532) and νmarine (532) as well as ρdust and ρmarine are used to calculate mineral dust and marine aerosol particle mass concentrations in mixed aerosol regimes (iii).
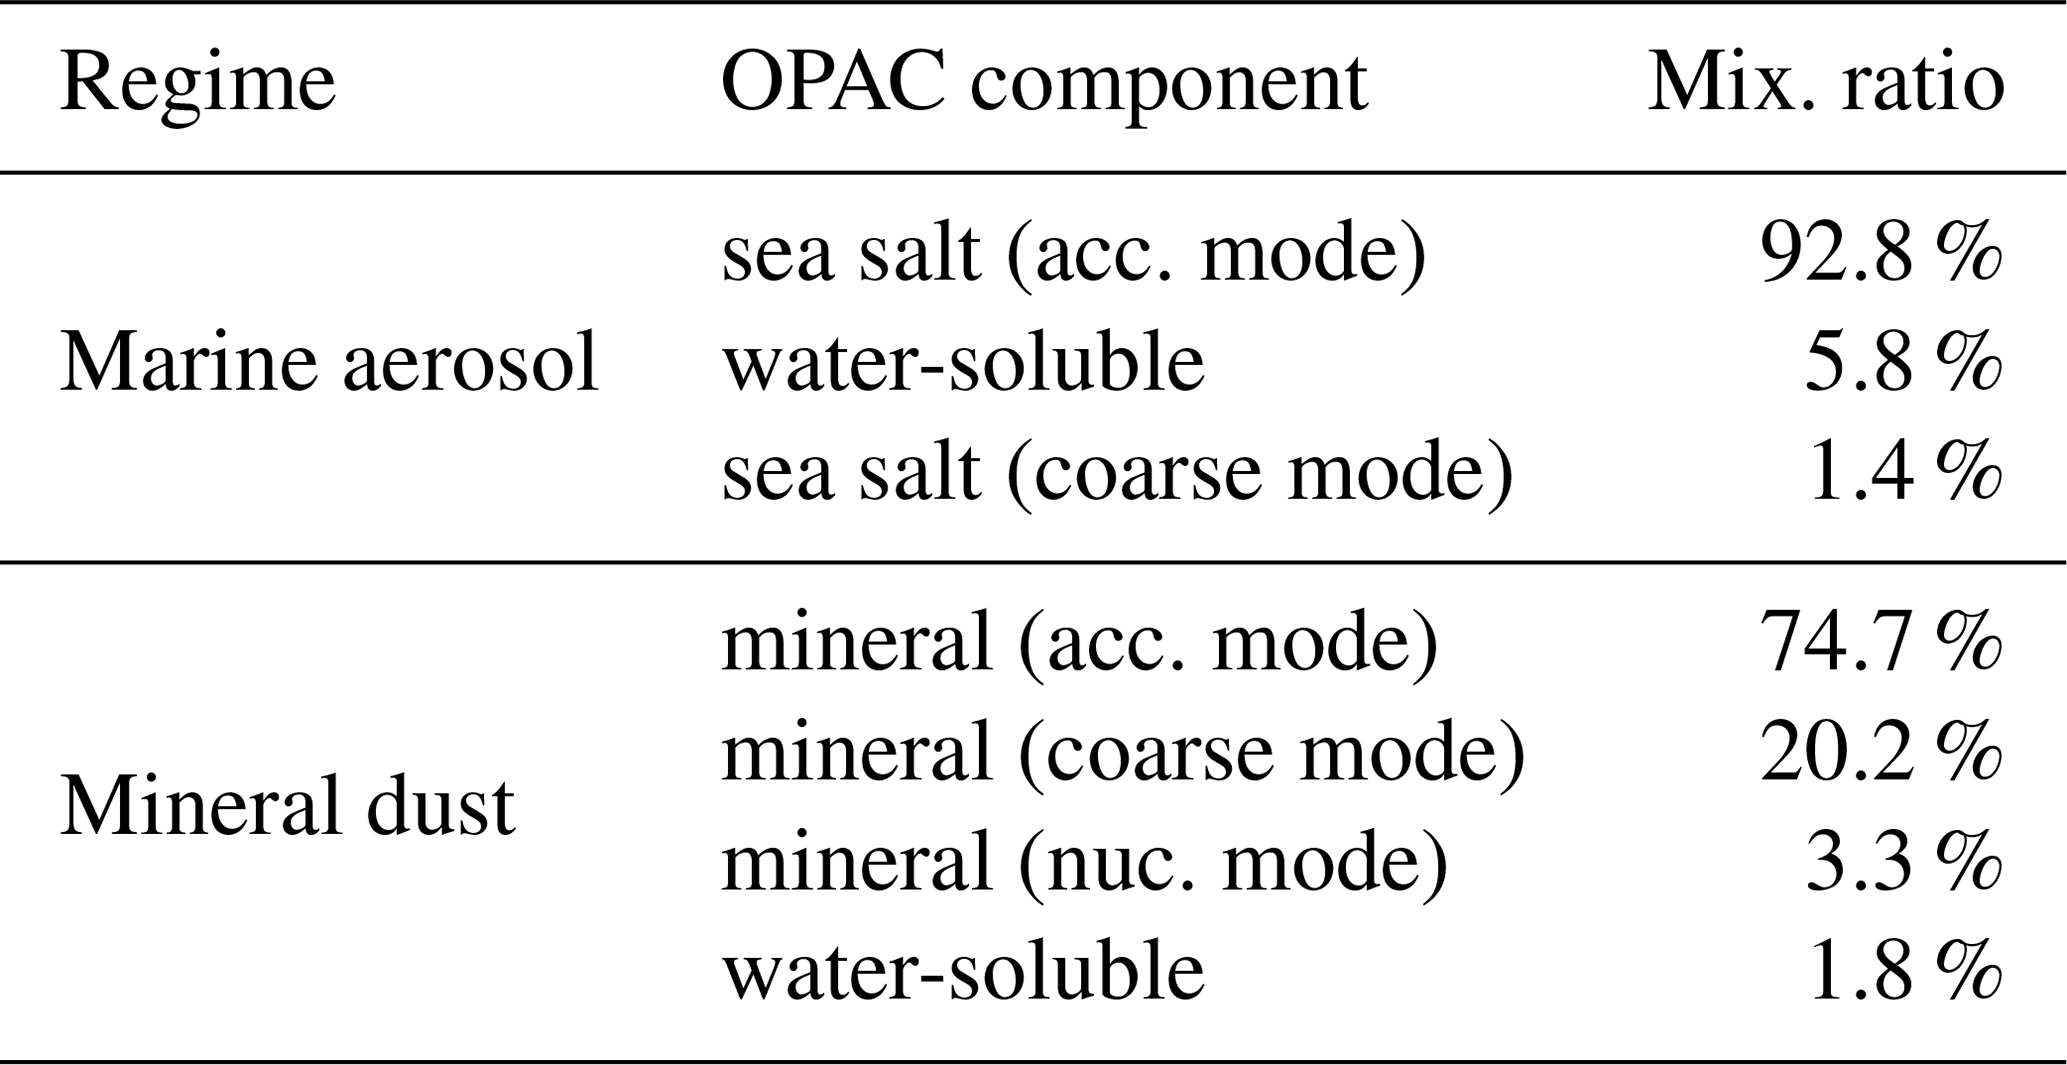
Table 2OPAC particle type composition of lidar-derived aerosol regimes used in the radiative transfer simulations. Shown percentages refer to mass mixing ratios.
2.4.3 OPAC aerosol microphysical properties
In a last step, converted aerosol mass concentrations are related to aerosol optical properties that are needed for radiative transfer calculations, i.e., the phase function P(Θ) and the single-scattering albedo ω. Those properties are commonly modeled using size distributions and spectral refractive indices of the desired aerosol species. Model assumptions always represent some source of uncertainty. For example, Yi et al. (2011) showed that different representations of particle shapes result in a change of P(Θ) and can cause up to 30 % difference in the dust radiative forcing at TOA. To minimize errors resulting from wavelength interpolations, Hess et al. (1998) established the readily available spectrally resolved OPAC database (Optical properties of Aerosols and Clouds). It includes modeled information on the abovementioned aerosol optical properties for 61 wavelengths in the spectral range from 0.25 to 40 µm for various aerosol species. OPAC is a widely used database in aerosol models and retrievals (e.g., Kim et al., 2004; Liu et al., 2004; Patadia et al., 2009) as well as general circulation and climate models for calculations in both the short-wave and the long-wave spectra. Thus, it is an appropriate tool for linking lidar-derived aerosol mass concentrations to aerosol optical properties in the classified aerosol regimes.
OPAC sea salt and water-soluble particle microphysical properties are modeled under the assumption of spherical particles using Mie theory (Mie, 1908). The assumption of spherical particles is legitimate for radiative transfer simulations in the period of NARVAL-II since no dry and aspherical marine aerosol particles are expected at observed relative humidities of greater than 80 % inside the derived marine aerosol regimes (Murayama et al., 1999; Sakai et al., 2010). Thus, a humidity-dependent marine aerosol composition which refers to WALES measurements of water vapor mixing ratios together with dropsonde-derived temperature profiles is used in this study (see Table 2).
Mineral dust particles, however, are characterized by highly irregular shapes (Falkovich et al., 2001; Kandler et al., 2011). Hence, an assumption of spherical mineral dust particles in radiative transfer models using Mie theory is inappropriate and may lead to wrong results. Especially when particles are significantly larger than the transmitted wavelength (which is the case for most backscatter lidar systems), phase functions of aspherical particles are characterized by an increased amount of sideward but a reduced amount of backward scattering compared to spherical particles (Koepke and Hess, 1988; Gobbi et al., 2002; Nousiainen, 2009; Wiegner et al., 2009; Gasteiger et al., 2011; Sakai et al., 2014). For this reason mineral dust particle microphysical properties were updated in the latest OPAC version (v4.0; Gasteiger et al., 2011; Koepke et al., 2015). They are now calculated by means of the T-matrix method (Waterman, 1971) under assumptions of an aspect ratio distribution for prolate spheroids observed during the Saharan mineral dust experiments SAMUM-I and SAMUM-II (Kandler et al., 2009, 2011). Several studies have shown that T-matrix theory substantially improves the agreement between measured and modeled aerosol optical properties of aspherical mineral dust particles (Mishchenko et al., 1997; Kahnert et al., 2005; Gasteiger et al., 2011) and are thus motivating its use in this study.
Results obtained from measurements during SALTRACE (Weinzierl et al., 2017) showed that the size distribution of long-range-transported mineral dust does not change significantly compared to the distributions measured at source regions. Gravitational settling processes of large submicron particles in the course of the SAL transatlantic transport are of a smaller magnitude than expected from Stokes gravitational settling calculations. Moreover, Denjean et al. (2015) found that the chemical composition and hygroscopicity of mineral dust remains unchanged after long-range transport. Thus, a mixture proposed by Hess et al. (1998) which consists of four OPAC v4.0 components for desert aerosol optical properties is assumed in this paper (see Table 2).
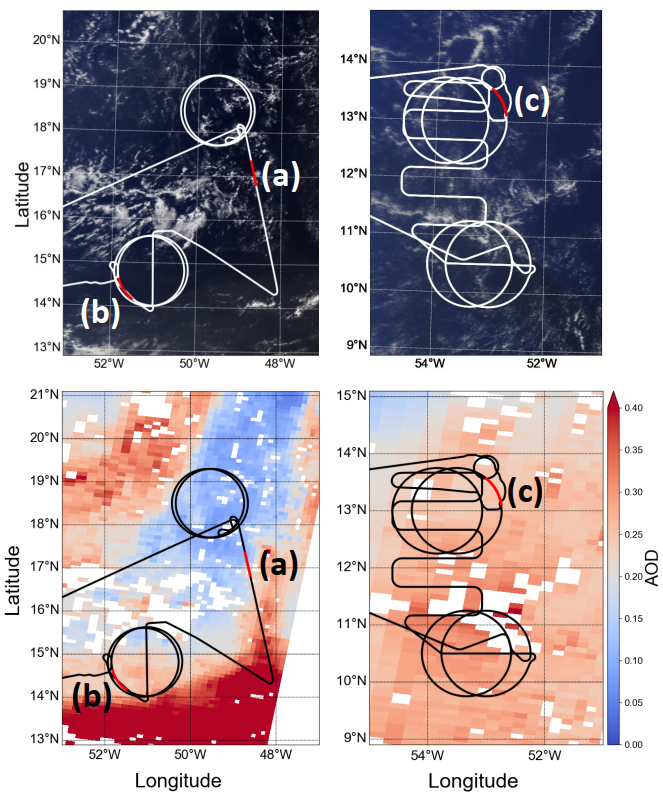
Figure 1Flight tracks of the research flights conducted on 12 (right) and 19 (left) August 2016 on top of images showing MODIS (Moderate Resolution Imaging Spectroradiometer) true color (top) and aerosol optical depth (AOD, bottom) around 13:40 UTC. Red lines and labels indicate the discussed flight segments (cases a, b and c).

Figure 2Left: cross sections of WALES backscatter ratio R(532); middle: averaged profiles of particle linear depolarization ratios δp(532) (black) and backscatter ratio R(532) (green); and right: derived aerosol mass concentrations (cm(dust) (green) and cm(marine) (black)) for cases (a) and (b) on 19 August 2016 and case (c) on 12 August 2016.
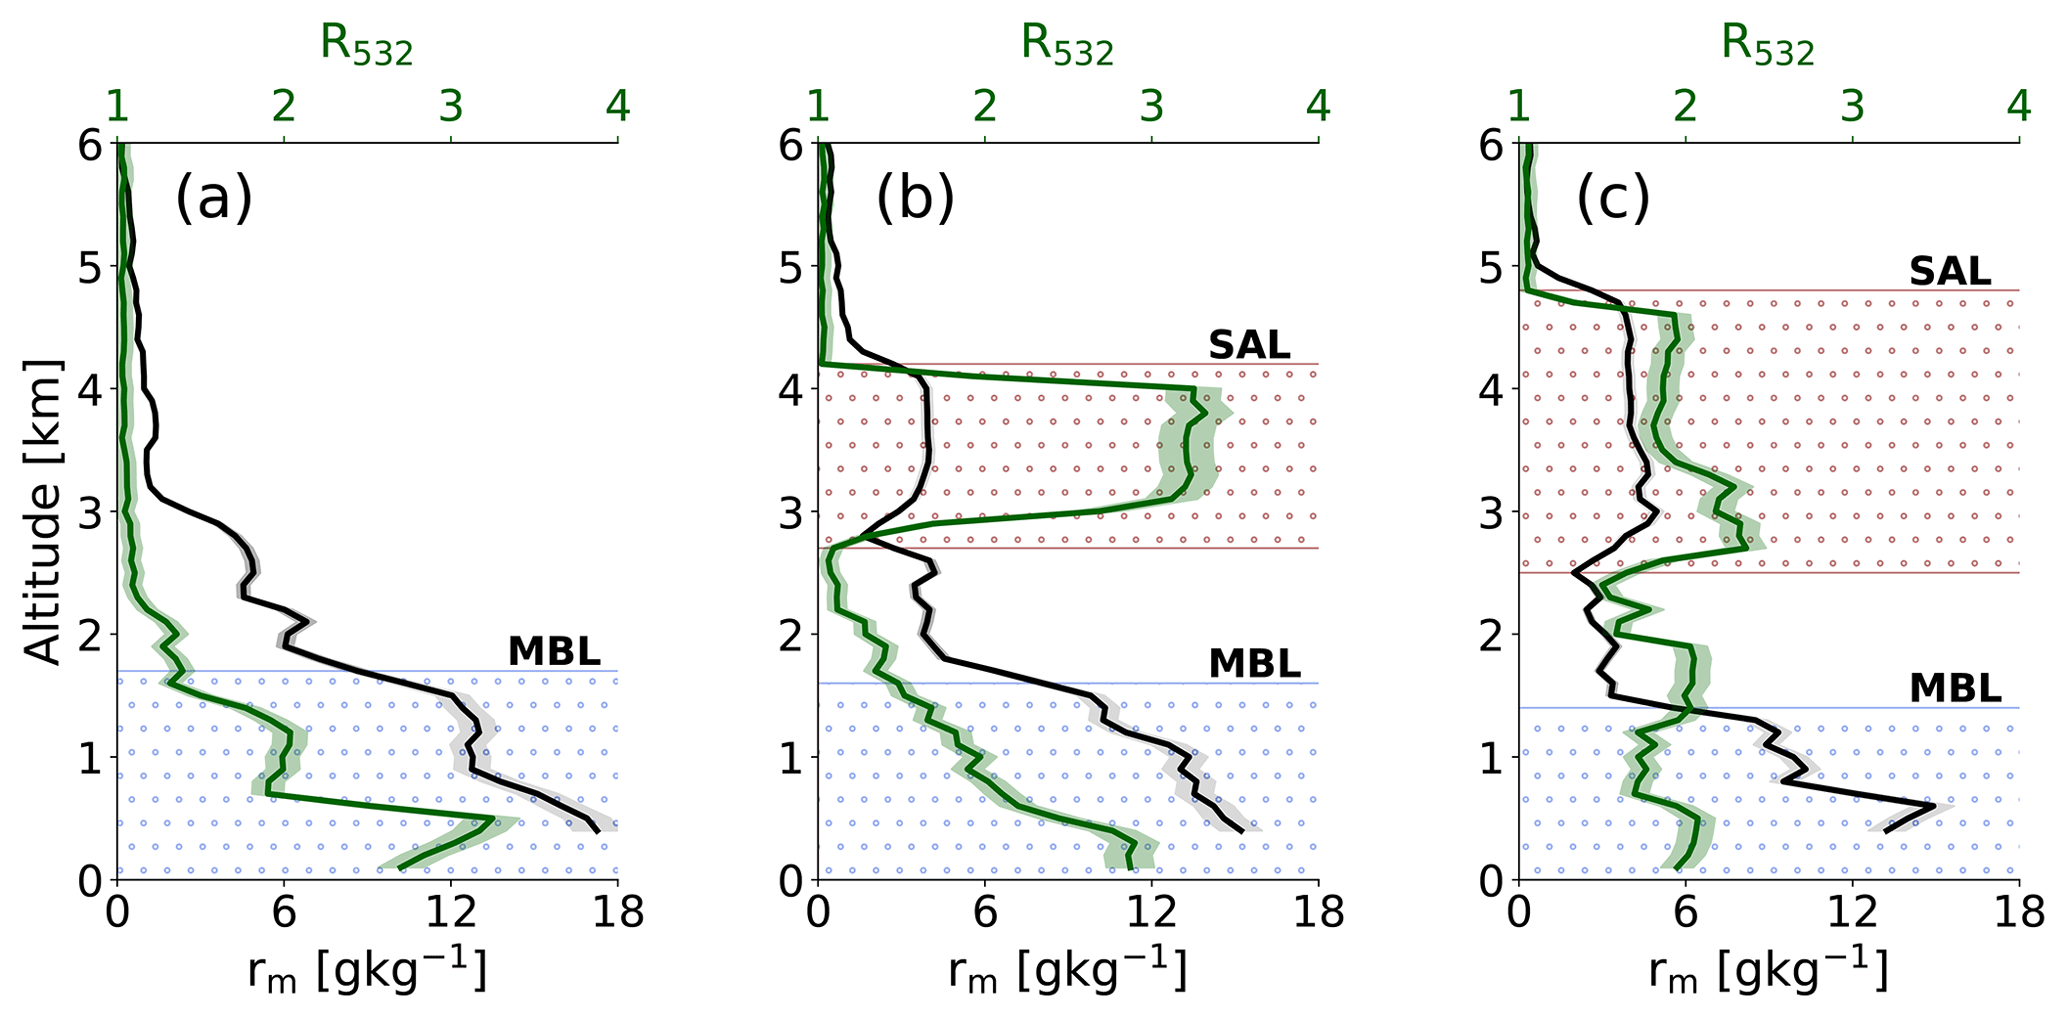
Figure 3Averaged vertical profiles of backscatter ratio (R532) and water vapor mass mixing ratio (rm) for cases (a), (b) and (c). Shaded: estimated measurement uncertainties. Colored height intervals highlight the approximate ranges of the Saharan air layer (SAL; dotted orange) and marine boundary layer (MBL; dotted light blue).
3.1 NARVAL-II lidar measurements
During two NARVAL-II research flights on 12 and 19 August 2016 pronounced elevated SALs could be observed. On 12 August (takeoff: 11:43 UTC; landing: 19:37 UTC) dust layers covered the whole research area. This is also seen in MODIS total column AOD, which had values around 0.3 along the whole flight track (Fig. 1). In contrast, the research flight on 19 August (takeoff: 12:28 UTC; landing: 20:52 UTC) led over trade wind regions comprising elevated mineral dust layers (AOD>0.3) as well as regions free of mineral dust and is therefore suitable for a comparison of radiative effects in SAL-influenced regions and SAL-free regions.
In this study three representative cloudless 5 min lidar cross sections observed during these two research flights are used for radiative transfer calculations (Fig. 2). MODIS imagery of the respective regions is additionally used to ensure that no cirrus clouds were present above the observed lidar scenes. While the first case represents a SAL-free scenario with some residual mineral dust at low atmospheric levels, the other two cases are both characterized by a long-range-transported SAL. Measured vertical profiles of both R532 and δp(532) are used for the detection of the SAL outlines. From enhanced values of R532 and typical values of δp(532) for mineral dust the vertical extent of SALs can be determined. Additionally, an approximation of the extent of the lowest layer in a marine atmosphere – the MBL – can be determined. The MBL represents a well-mixed layer that is characterized by high humidity. As the MBL is confined by the trade wind inversion (TWI), its upper limit is accompanied by a strong increase of potential temperature and a pronounced hydrolapse (Gutleben et al., 2019a). In the search for those features in measured profiles of rm (DIAL) and Θ (dropsondes), an approximation of the vertical extent of the MBL is additionally outlined.
All the three selected cross sections are of approximately 50 km length and described in the following:
- a.
SAL-free case – 19 August 2016 (16:51–16:56 UTC):
This case represents a SAL-free measurement segment during NARVAL-II. Lidar profiles of R532 and δp(532) show no dust-signatures at altitudes greater than 3 km. In the MBL, marine and mineral dust aerosol particles coexist (settling dust particles), and a maximum aerosol extinction coefficient of 0.03 km−1 was measured inside the MBL. δp(532) ranges roughly from 0.05 to 0.25, and aerosol mass concentrations of both marine and mineral dust aerosol reach maximum values of approximately 30 µg m−3. Above the MBL some signatures of depolarizing particles (δp(532)<0.25) with weak backscatter can be identified. Those signatures are most likely caused by settling dust particles from the dissipating SAL nearby (see Fig. 1). - b.
Elevated SAL – 19 August 2016 (14:26–14:31 UTC):
The second case represents a scenario with a detected elevated and long-range-transported SAL extending from 3 to 4 km altitude. The SAL shows increased backscatter ratios around 3.5 and high particle linear depolarization ratios > 0.26. δp(532) and R(532) profiles feature sharp gradients to the above free troposphere and to lower atmospheric levels. The SAL itself is associated with evenly distributed mineral dust mass concentrations of approximately 120 µg m−3 and aerosol extinction coefficients around 0.07 km−1. Marine aerosols are mainly confined to the MBL, which extends approximately from 0.0 to 1.6 km altitude. Similar to case (a) the aerosol composition within the MBL is not exclusively characterized by marine aerosols but also contains portions of mineral dust aerosols. An intermediate layer showing small values of δp(532), cm(dust) and R(532) is located between the MBL and the SAL and ranges approximately from 1.6 to 2.8 km altitude. - c.
Thick SAL – 12 August 2016 (14:26–14:31 UTC):
The third scenario represents the geometrically thickest SAL that was observed during the whole NARVAL-II campaign. Measured δp(532) around 0.3 clearly indicate the presence of Saharan mineral dust from ground level to almost 5 km altitude. The R(532) profile also shows enhanced particle backscatter greater than 2.0 at these altitudes. Compared to case (b) the observed SAL in case (c) shows some vertical layering in backscatter ratio. As it coincides with vertical changes of wind speed (sharp gradients of wind speed at ∼ 3.0 and ∼ 4.5 km altitude, not shown), wind shear may be the reason for the layering. Profiles of aerosol mass concentration highlight a pure dust regime (cm(dust)≈100 µg m−3; aerosol extinction coefficients around 0.06 km−1) at altitudes ranging approximately from 1.5 to 5.0 km altitude, transitioning to a mixed marine and dust aerosol regime at lower atmospheric levels (about 0–1.5 km). The lidar measurements again do not indicate a pure marine aerosol regime at low altitudes. Both marine and settling mineral dust aerosol are found in the MBL (about 0 to 1.5 km).
All observed SALs during the NARVAL-II period were associated with enhanced concentrations of water vapor compared to the surrounding dry free trade wind environment (Gutleben et al., 2019b). rm and R(532) in the lidar profiles (b) and (c) also show a distinct correlation (Fig. 3). The SALs show almost uniformly increased water vapor mixing ratios ranging from 3 to 5 g kg−1 compared to the surrounding free troposphere (case b: 2.8–4.2 km altitude; case c: 2.5–4.8 km altitude). Measured profiles of rm and R(532) for case (a) show that no enhanced water vapor concentrations could be observed in the SAL-free troposphere. The water vapor profile shows a drop of rm to values smaller than 1 g kg−1 at altitudes greater than 3 km, indicating the transition from the MBL to the dry free troposphere. Such a drop in humidity (which is accompanied by a strong TWI caused by Hadley cell subsidence) was observed during most SAL-free periods in NARVAL-II and is discussed by Gutleben et al. (2019a) in the framework of a detailed dropsonde analysis.
Enhanced water vapor concentrations at SAL altitudes are already seen at the beginning of the transport (using HYSPLIT backward trajectories) when analyzing radiosonde profiles from operationally launched sondes in Dakar, Senegal, 4 d before the measurements on 8 and 15 August 2016 (Gutleben et al., 2019b).
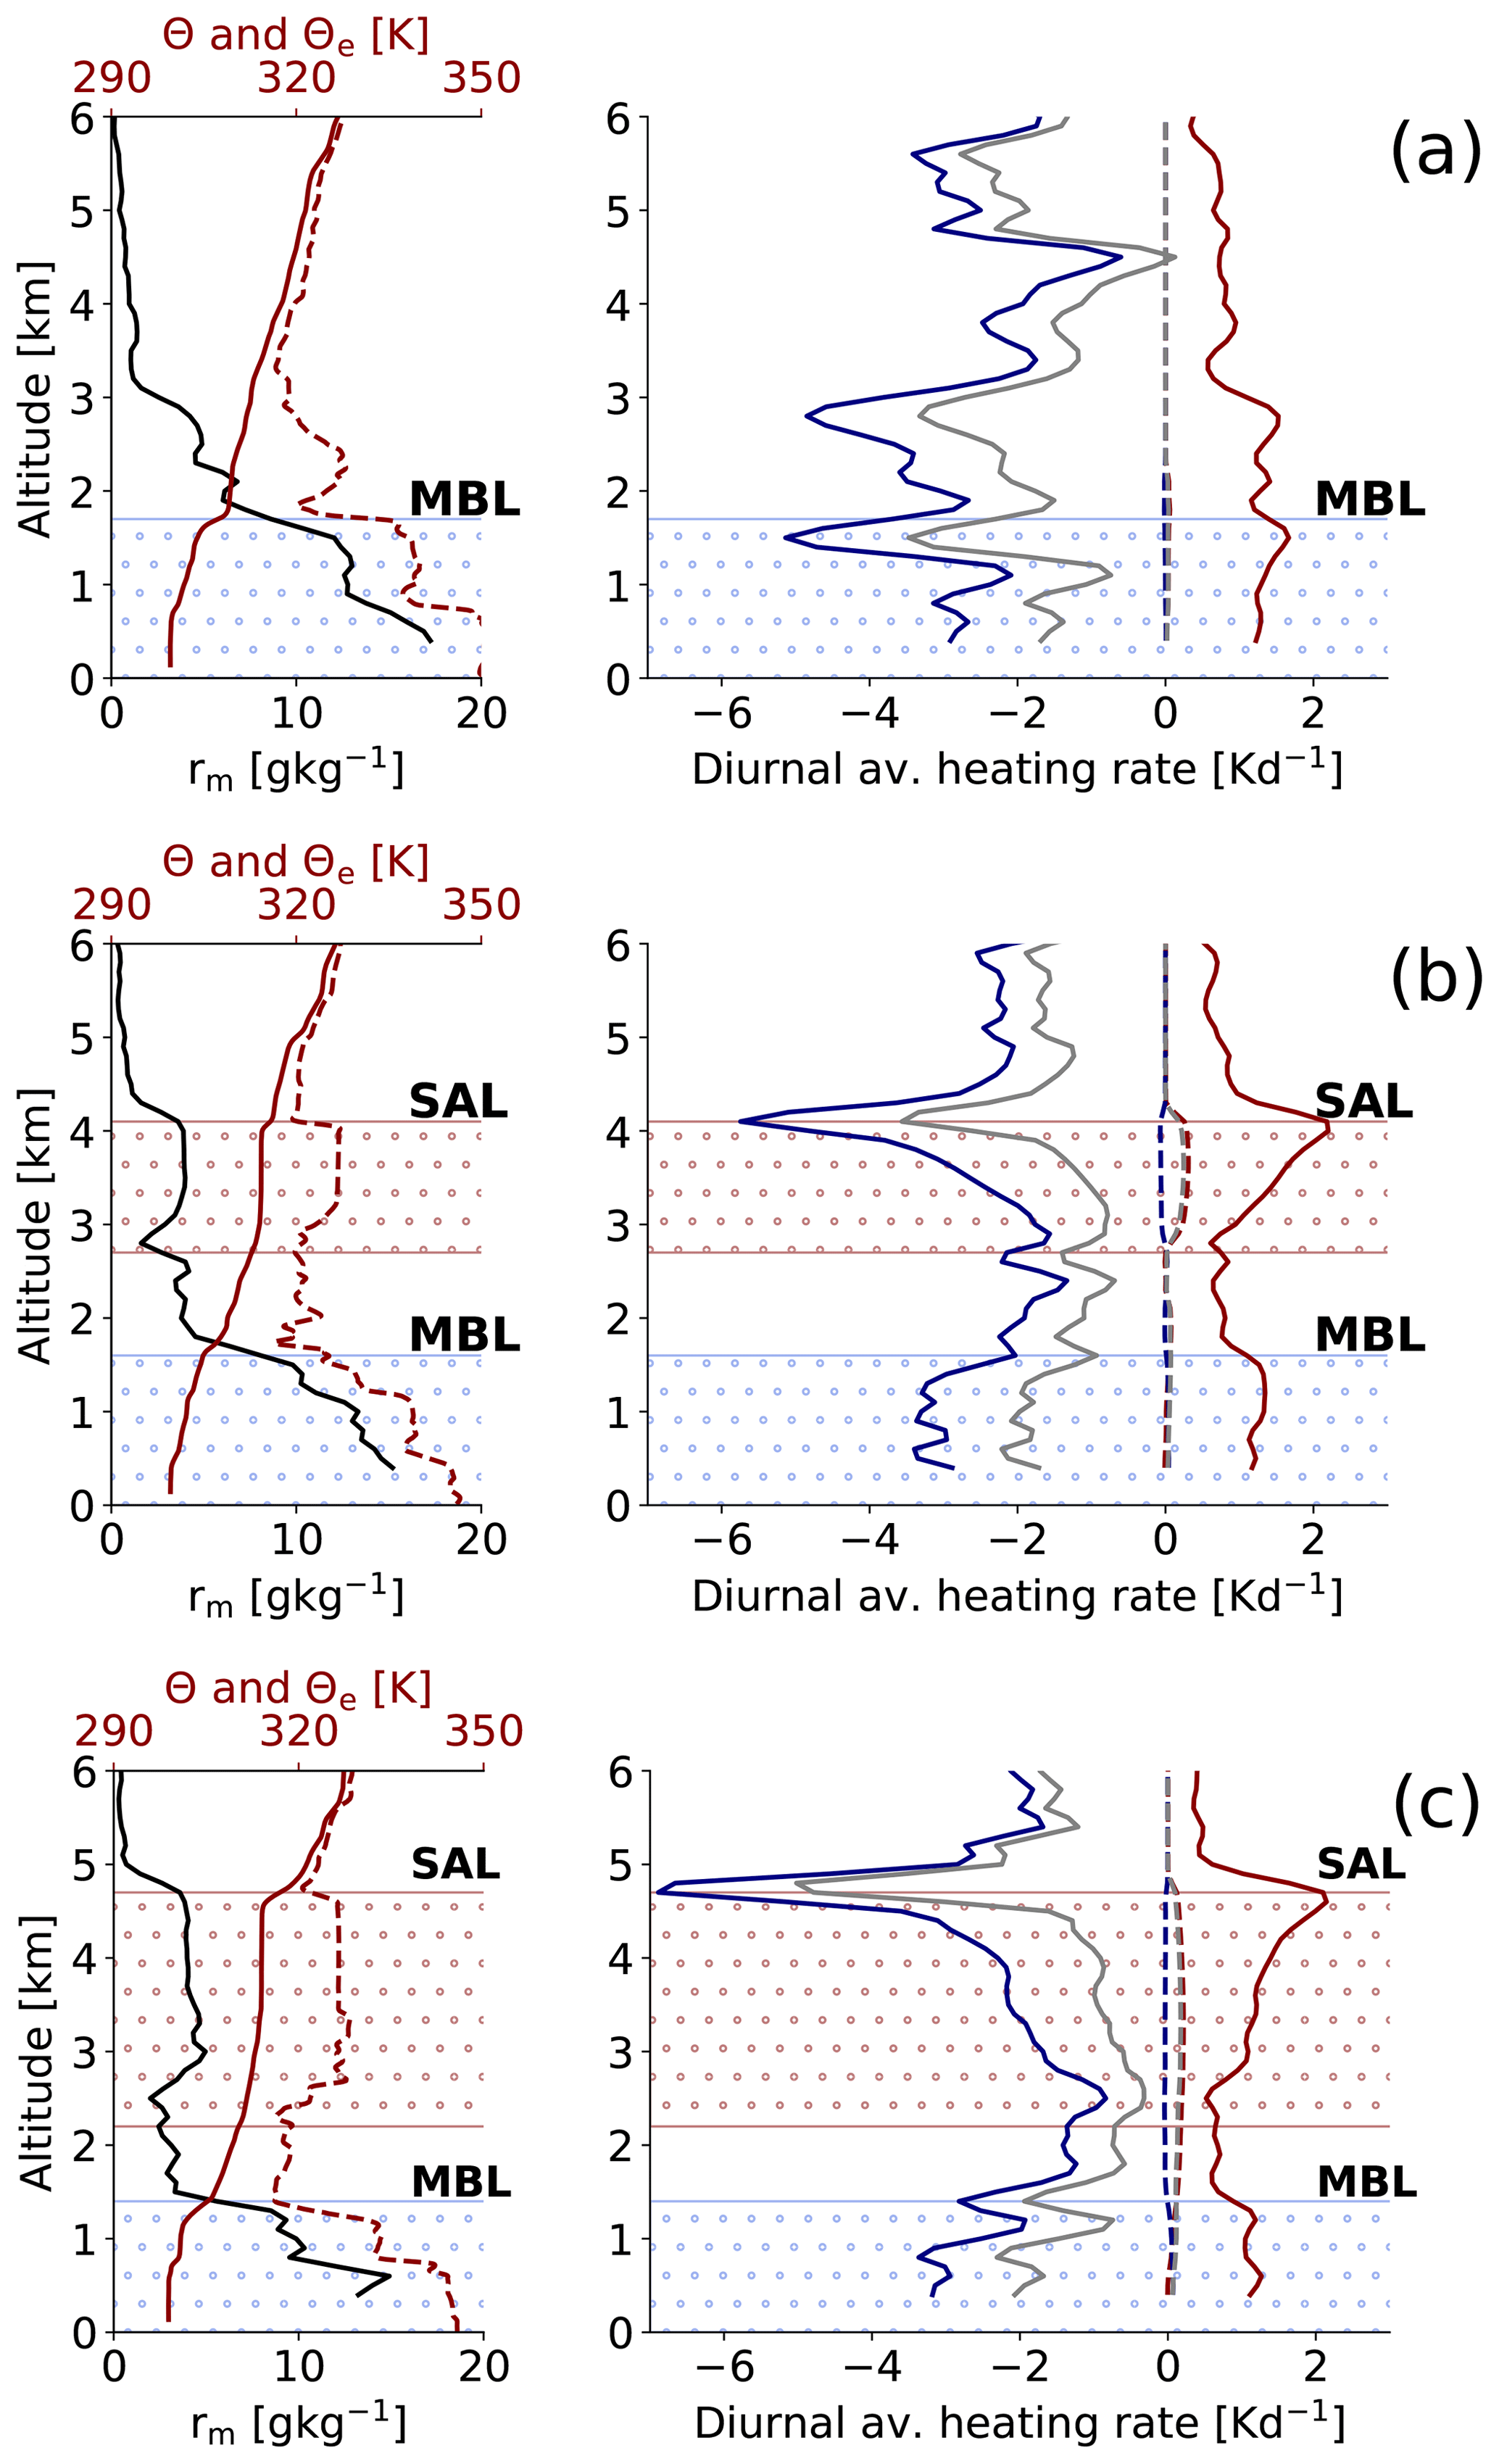
Figure 4Left: the vertical profiles of derived water vapor mass mixing ratio from DIAL measurements (black), potential temperature Θ (solid red) and equivalent potential temperature Θe (dashed red) from dropsonde measurements for the three scenarios (a), (b) and (c). Right: the diurnally averaged net (grey), short-wave (red) and long-wave (blue) heating rates (solid) for cases (a), (b) and (c). Dashed lines illustrate the aerosol-contributions to the total heating rate profiles. Colored height intervals highlight the approximate extent of observed Saharan air layers (SAL; dotted red) and marine boundary layers (MBL; dotted blue).
3.2 Saharan air layer heating rates
Profiles of calculated short-wave, long-wave and net heating rates (24 h average) for the three selected case studies are shown in Fig. 4. Since WALES is able to measure both water vapor mixing ratios and aerosol optical properties, total heating rate profiles and contributions of mineral dust to total heating rate profiles can be derived. The dust contribution to the total heating rate is derived as the difference between heating rates that consider dust in the model and heating rates with no dust in the model atmosphere.
Observed SALs in cases (b) and (c) are characterized by constant potential temperatures Θ around 315 K and show enhanced water vapor mass mixing ratios in the range from 3 to 5 g kg−1 compared to the surrounding dry free atmosphere. This is also reflected in increased equivalent potential temperatures Θe of approximately 330 K inside the SALs. Both profiles have strong gradients of rm, Θ and Θe at the upper edge of the SAL (at the boundary to the above dry and aerosol-free trade wind atmosphere), indicating the two well-known SAL-related bounding inversions (Lilly, 1968). The MBL in all three cases is characterized by high relative humidities (rm: 10–16 g kg−1) and is capped by a temperature inversion (trade wind inversion) and a pronounced hydrolapse (rm drops from > 15 to approximately 5 g kg−1).
Calculated profiles of diurnally averaged mineral dust short-wave heating rates for mean profiles of cases (b) and (c) indicate an atmospheric heating of less than 0.5 K d−1 at SAL altitudes. Maximum short-wave heating is hereby found at altitudes of highest dust mass concentration (case b: ∼ 3.5 km; case c: 2.5 km). Long-wave cooling rates of dust are also strongest at altitudes of highest dust mass concentration (∼ 0.2 K d−1). This results in a small net warming effect of long-range-transported dust aerosols of approximately 0.3 K d−1 for both cases (b) and (c). The net mineral dust radiative heating rate for the SAL-free case (a) is limited to the lowest atmospheric levels and takes small values of less than 0.1 K d−1.
Due to water vapor absorption and emission the total heating and cooling rate profiles have a completely different shape. The largest water vapor absorption of solar radiation takes place at the uppermost levels of the SAL, leading to strong heating at these levels. Long-wave cooling due to emission of radiation towards space is also strongest at the top edge of the SAL since there is no heating from atmospheric counter-radiation from higher atmospheric levels. This is why the greatest total heating and cooling rates are found at the upper edge of both observed SALs (short wave: ∼ 2.2 K d−1 (both cases); long wave: −6 K d−1 (case b) and −7 K d−1 (case c).
Adding short-wave and long-wave heating rates results in SAL net heating rates that are entirely negative for both cases, having values from −1.0 to −3.5 K d−1 (case b) and −0.5 to −5.5 K d−1 (case c). Moreover, an intensification of net radiative cooling with height towards the top of the SAL is evident.
Another increase in short-wave heating and long-wave cooling rates is found within the MBL, which is characterized by a moist mixture of mineral dust and marine aerosols in all three cases. However, the shape of the MBL heating rate profile in SAL-influenced regions differs to those in SAL-free regions. While for the SAL-free scenario strong cooling at the top of the MBL can be observed (strongly pronounced MBL inversion; case a), SAL-influenced regions show less cooling (weakly pronounced MBL inversion; cases b and c). Short-wave, long-wave and net heating rate profiles calculated for the dust-free case (a) show no distinct features above the MBL. In this case peak values of atmospheric heating and cooling correlate with regions of strongest gradients in rm (maximum long-wave cooling: −5 K d−1; maximum short-wave heating: 1.8 K d−1). This emphasizes the dominating effect of water vapor on atmospheric heating.
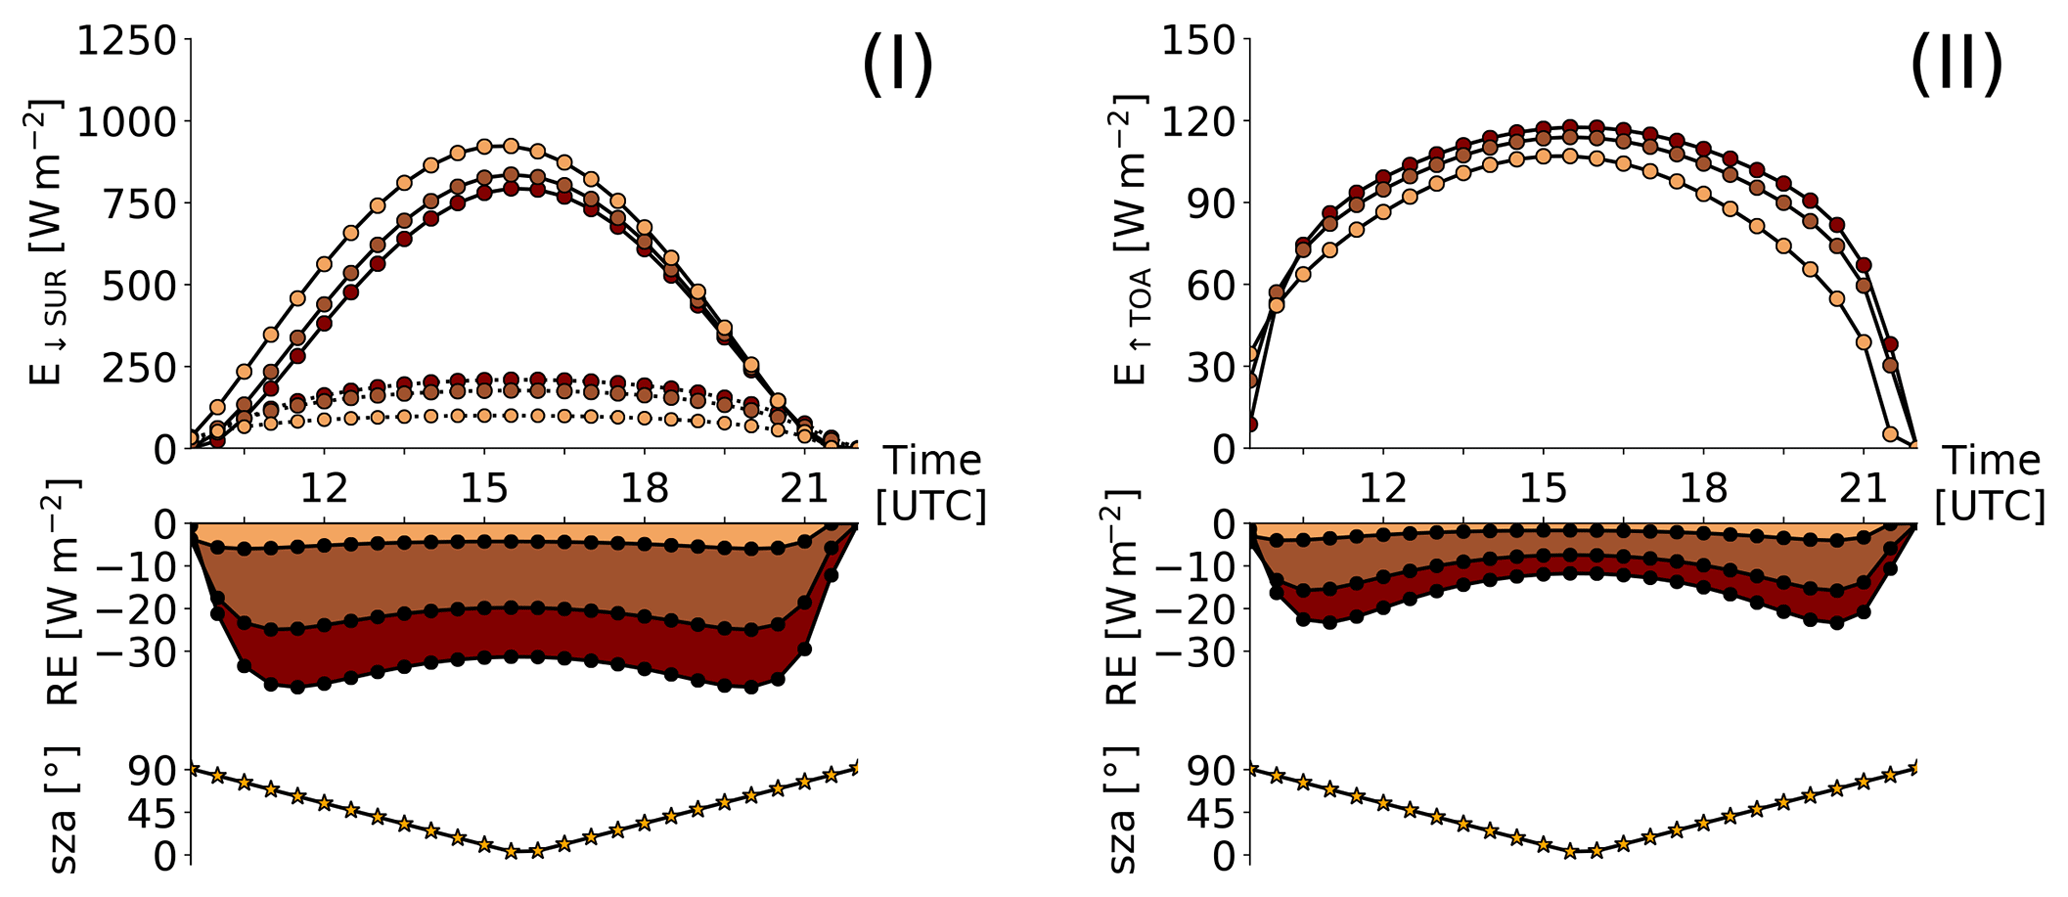
Figure 5Top: diurnal cycles of the modeled down-welling short-wave irradiances at surface level (I – E↓SUR: direct (solid), diffuse (dashed)) and up-welling short-wave irradiances at the top of the atmosphere (II – E↑TOA). Due to the different measurement locations and small differences in corresponding solar zenith angles (sza), calculated curves are slightly shifted along the x axis. Bottom: the corresponding diurnal cycles of the modeled Saharan dust short-wave radiative effects (RE) at surface level (I) and the top of the atmosphere (II). A representative sza for the whole measurement region is shown at the bottom (11∘ N, 55∘ W). Colors indicate the three cases: light orange (case a), orange (case b) and dark orange (case c).
3.3 SAL radiative effects at surface level and the top of the atmosphere
Saharan dust short-wave radiative effects at surface level and TOA (Fig. 5) are investigated by analyzing modeled solar-zenith-angle-dependent short-wave irradiances for the three discussed scenarios. Saharan dust short-wave radiative effects at surface level (RESUR) and the top of the atmosphere (RETOA) are inferred as the difference between modeled irradiances considering mineral dust particles in the model atmosphere (E↓tot(SUR), E↑tot(TOA)) and irradiances calculated under the assumption of no dust aerosol in the atmosphere (E↓nodust(SUR), E↑nodust(TOA)):
Water vapor distributions as measured by WALES are considered and included in the radiative transfer model setup.
Downward and upward irradiances are primarily determined by solar elevation, therefore having a symmetrical shape with maxima at noon (around 15:30 UTC). The longer the slant path of solar rays through SALs, the greater the amount of Mie- and Rayleigh-scattering processes and the larger the fraction of backscattered light to space. As a consequence, RESUR and RETOA show minimum magnitudes at low solar zenith angles around noon and maximum magnitudes at intermediate zenith angles in the morning and evening hours.
For case (c) the strongest radiative effects at surface level of almost −40 W m−2 are calculated for morning and evening hours (11:30 and 20:00 UTC). At noon the diffuse fraction of down-welling irradiance (E↓diff) at surface level reaches 200 W m−2, accounting for one-third of E↓tot at surface levels. At intermediate zenith angles the diurnal maxima in atmospheric backscattering also cause the strongest radiative effects at TOA for case (c) (−25 W m−2). E↑tot at TOA reaches maximum values of nearly 120 W m−2 at midday. For case (b) a lidar-derived RESUR of −25 W m−2 is computed for intermediate zenith angles. It weakens at noon (−20 W m−2). Compared to case (c), E↓diff at noon is slightly smaller (180 W m−2). This reduced diffuse fraction is also evident when looking at RETOA. Due to the decrease in scattering, the magnitude of RETOA is smaller than for case (b) (−17 W m−2). Compared to the other cases, case (a) shows the smallest magnitudes of RESUR ( W m−2) and strengthens only a little during sunrise and sunset. RETOA for case (a) is also the weakest ( W m−2) when comparing all three cases.
In this study the effects of mineral dust particles and water vapor on radiative heating rate profiles in SAL-influenced regions were studied. It was found that the enhanced water vapor concentrations within the SALs cause a decrease of radiative heating rates towards the top of the SALs. This negative gradient with height is in agreement with results found by Kim et al. (2004), who focused on the effect of enhanced water vapor concentrations on atmospheric heating rates within Asian dust plumes. They compared heating rate calculations that include measured water vapor profiles to calculations that were performed using reference profiles. Their comparisons highlighted that heating rates within the dust plumes are altered by enhanced water vapor concentrations. Calculated maximum short-wave heating and long-wave cooling rates were also found to be shifted from the center to the top of the dust layer when including the measured water vapor profile in their calculations. The strong negative trend of the heating rate profiles within the SALs is supposed to decrease the static stability in the layers and to promote vertical mixing and convective development. Vertical mixing in the SALs during their transport over the Atlantic Ocean was already proposed by Gasteiger et al. (2017) in an integrated study of active remote sensing, in situ measurements and optical modeling. They suggested that vertical mixing within the SALs may counteract the Stokes gravitational settling during transport. Dropsonde measurements discussed in Sect. 3.1 confirm the well-mixed and neutrally stratified layering in the interior of the SALs (Θ: constant; Θe: constant). It is bounded by inversions at the top and the bottom of the SALs (increase of net heating rates and positive changes of potential temperature), which separate the turbulent interior from the less turbulent free troposphere. An early model analysis by Lilly (1968) already suggested that these inversions are caused by radiative heating at SAL altitudes.
Enhanced moisture inside the SAL also has an impact on the cooling and heating rate profile of the MBL. The dust-laden cases are found to show less infrared cooling at the top of the MBL compared to the SAL-free case. The elevated and moist SAL is associated with down-welling long-wave irradiance which counteracts radiative cooling inside the MBL, thus weakening the cooling of the MBL. This leads to an almost homogeneous heating rate profile within the MBL. The SAL-free case in contrast indicates a negative heating rate gradient with strong negative heating rates at the top of the MBL. The nearly constant heating rate profile in the MBL counteracts convective development. Stevens et al. (2017) used idealized distributions of water vapor in the lower atmosphere to highlight the impact of elevated moist layers on the vertical distribution of heating rates. They claimed that such layers reduce the cooling at lower atmospheric levels and therefore modify the state of the boundary layer, potentially inducing low-level circulations. A theoretical study by Naumann et al. (2017) explained that variations in infrared cooling due to vertical gradients of tropospheric moisture may drive atmospheric circulations in trade wind regions. A correlation between long-range-transported elevated SAL and subjacent low-level cloudiness has been observed by Gutleben et al. (2019a). Their analysis showed reduced cloud fractions and lower cloud top heights in trade wind regions comprising elevated mineral dust layers compared to dust-free regions. Moreover, observed dusty regions contained smaller clouds and showed greater cloud gaps than dust-laden regions.
Kanitz et al. (2013) studied the Saharan dust radiative effect at the surface and TOA near source regions in the vicinity of the Cabo Verde islands using shipborne aerosol Raman/polarization lidar measurements to parametrize the atmosphere's aerosol composition. Based on their lidar measurements on 1 May 2010, they deduced a maximum diurnal dust short-wave radiative effect of approximately −60 W m−2 at surface level and −42 W m−2 at TOA. These results are in good agreement with calculated radiative effects in this study. However, results in this paper are of a slightly smaller magnitude due to thinning of the SAL during long-range transport (−40 W m−2 at the surface and −25 W m−2 at TOA). Foltz and McPhaden (2008) found that less down-welling solar radiation in dust-laden regions may cause gradients in sea surface temperature and potentially impacts the evolution of clouds in the MBL.
During NARVAL-II, the majority of mineral dust particles was always located above the MBL and inside the SAL. However, during previous field campaigns it was observed that the vertical distribution of long-range-transported mineral dust can be highly variable (Reid et al., 2002). During PRIDE in summer 2000, for example, the majority of dust was in some cases observed to be located at lower atmospheric levels inside the MBL, and in other cases it was observed to be located inside the SAL. A distinct seasonal pattern of Saharan dust transport towards the Atlantic Ocean was already found by Chiapello et al. (1995), who studied the vertical distribution of mineral dust particles at the beginning of long-range transport at the Cabo Verde islands. They found that, in contrast to the summer months, wintertime dust transport towards the Atlantic Ocean mainly takes place at lower atmospheric levels. Furthermore, the observed vertical water vapor distribution during NARVAL-II may only be representative for an undisturbed SAL transport during the summer months. Moisture originating from the outflow of the Intertropical Convergence Zone or from convective systems embedded in African easterly waves can modify the vertical moisture distribution in SAL regions during disturbed transatlantic transports. Questions as to the reasons for the variability in the vertical distributions of mineral dust and water vapor as well as whether there is a certain seasonal pattern in these vertical distributions not only at the beginning but also throughout the transatlantic transport can hopefully be answered in the near future by analyzing data collected during the recent EUREC4A field campaign (Elucidating the Role of Cloud–Circulation Coupling in Climate; Bony et al., 2017) in January/February 2020. An analysis of the EUREC4A data set will additionally provide valuable insights on the SAL radiative effects during subtropical winter months.
This study investigated the effects of dust and water vapor in long-range-transported SALs on atmospheric heating rates and radiative transport on the basis of airborne lidar measurements over the western subtropical North Atlantic Ocean. Simultaneously measured profiles of water vapor mass mixing ratios and aerosol optical properties were used to characterize both the vertically resolved aerosol and water vapor composition in radiative transfer simulations.
Lidar measurements in Saharan dust-laden regions indicated enhanced concentrations of water vapor at SAL altitudes, and radiative transfer simulations revealed that water vapor plays a dominant role for atmospheric heating rates at these heights. Compared to water vapor, dust aerosol was identified to have a minor effect on total heating rates at SAL altitudes, showing small positive maximum heating rates of 0.3–0.5 K d−1 in the short-wave and slightly negative maximum cooling rates of −0.1 to −0.2 K d−1 in the long-wave spectrum at altitudes of highest aerosol mass concentration. Water vapor, however, was found to contribute much more strongly to total SAL heating rates, with maximum short-wave and long-wave heating of 1.8–2.2 K d−1 and −6 to −7 K d−1 at the uppermost levels of the SAL, respectively. As a result, calculated net heating rates inside SALs are entirely negative and decrease with altitude.
SALs were also found to have a possible impact on cloud development in the MBL. Besides possible impacts on low-level circulations, SALs introduce additional atmospheric counter-radiation towards the top of the MBL. As a result, MBL tops in dust-laden regions do not experience as much cooling as those in SAL-free regions. This is also indicated by the heating rate profile in SAL regions, which increases with altitude and therefore counteracts the development of convection in the MBL.
Last but not least, NARVAL-II lidar data were used to quantify the radiative effect of long-range-transported Saharan dust at surface level and the top of the atmosphere. Maximum short-wave radiative effects of −40 W m−2 (surface) and 25 W m−2 (TOA) were found at intermediate zenith angles for the presented case studies.
Summed up, radiative transfer calculations with NARVAL-II lidar data input highlighted the importance of correct representations of water vapor profiles in radiative transfer models and depicted the influence of mineral dust on the modification of solar irradiance throughout the atmosphere.
The data used in this publication were collected during the NARVAL-II (Next-Generation Aircraft Remote Sensing for Validation Studies II) campaign and are made available through the DLR Institute for Atmospheric Physics in the HALO database (German Aerospace Center, 2016; https://doi.org/10.17616/R39Q0T).
In the framework of the NARVAL-II field experiment MW and SG carried out all airborne lidar measurements used in this study. MW did the initial data processing. MG performed the analytic computations, analyzed the data set and performed radiative transfer calculations with help from BM and under the supervision of SG. MG and SG took the lead in writing the manuscript. All authors discussed the results and contributed to the final manuscript.
The authors declare that they have no conflict of interest.
The authors would like to thank the staff members of the German Aerospace Center (DLR) HALO aircraft from DLR Flight Experiments for preparing and performing the measurement flights.
NARVAL-II was funded with the support of the Max Planck Society, the German Research Foundation (DFG Priority Program: HALO-SSP 1294) and DLR.
This study was funded by a DLR VO-R young investigator group within the Institute of Atmospheric Physics.
The article processing charges for this open-access
publication were covered by a Research
Centre of the Helmholtz Association.
This paper was edited by Matthias Tesche and reviewed by Jeffrey Reid and one anonymous referee.
Anderson, G. P., Clough, S. A., Kneizys, F. X., Chetwynd, J. H., and Shettle, E. P.: AFGL atmospheric constituent profiles (0–120 km), Tech. rep., 1986. a
Ansmann, A., Petzold, A., Kandler, K., Tegen, I., Wendisch, M., Müller, D., Weinzierl, B., Müller, T., and Heintzenberg, J.: Saharan Mineral Dust Experiments SAMUM–1 and SAMUM–2: what have we learned?, Tellus B, 63, 403–429, https://doi.org/10.1111/j.1600-0889.2011.00555.x, 2011. a
Bellouin, N., Boucher, O., Vesperini, M., and Tanré, D.: Estimating the direct aerosol radiative perturbation: Impact of ocean surface representation and aerosol non-sphericity, Q. J. Roy. Meteor. Soc., 130, 2217–2232, https://doi.org/10.1256/qj.03.136, 2004. a
Ben-Ami, Y., Koren, I., and Altaratz, O.: Patterns of North African dust transport over the Atlantic: winter vs. summer, based on CALIPSO first year data, Atmos. Chem. Phys., 9, 7867–7875, https://doi.org/10.5194/acp-9-7867-2009, 2009. a
Bony, S., Stevens, B., Ament, F., Bigorre, S., Chazette, P., Crewell, S., Delanoë, J., Emanuel, K., Farrell, D., Flamant, C., Groß, S., Hirsch, L., Karstensen, J., Mayer, B., Nuijens, L., Ruppert, J. H., Sandu, I., Siebesma, P., Speich, S., Szczap, F., Totems, J., Vogel, R., Wendisch, M., and Wirth, M.: EUREC4A: a field campaign to elucidate the couplings between clouds, convection and circulation, Surv. Geophys., 38, 1529–1568, https://doi.org/10.1007/s10712-017-9428-0, 2017. a
Buras, R., Dowling, T., and Emde, C.: New secondary-scattering correction in DISORT with increased efficiency for forward scattering, J. Quant. Spectrosc. Ra., 112, 2028–2034, https://doi.org/10.1016/j.jqsrt.2011.03.019, 2011. a
Burton, S. P., Ferrare, R. A., Hostetler, C. A., Hair, J. W., Rogers, R. R., Obland, M. D., Butler, C. F., Cook, A. L., Harper, D. B., and Froyd, K. D.: Aerosol classification using airborne High Spectral Resolution Lidar measurements – methodology and examples, Atmos. Meas. Tech., 5, 73–98, https://doi.org/10.5194/amt-5-73-2012, 2012. a, b, c
Carlson, T. N. and Prospero, J. M.: The large-scale movement of Saharan air outbreaks over the northern equatorial Atlantic, J. Appl. Meteorol., 11, 283–297, https://doi.org/10.1175/1520-0450(1972)011<0283:TLSMOS>2.0.CO;2, 1972. a, b
Chiapello, I., Bergametti, G., Gomes, L., Chatenet, B., Dulac, F., Pimenta, J., and Suares, E. S.: An additional low layer transport of Sahelian and Saharan dust over the north-eastern Tropical Atlantic, Geophys. Res. Lett., 22, 3191–3194, https://doi.org/10.1029/95gl03313, 1995. a
Claquin, T., Schulz, M., Balkanski, Y., and Boucher, O.: Uncertainties in assessing radiative forcing by mineral dust, Tellus B, 50, 491–505, https://doi.org/10.3402/tellusb.v50i5.16233, 1998. a
Cox, C. and Munk, W.: Measurement of the roughness of the sea surface from photographs of the Sun's glitter, J. Opt. Soc. Am., 44, 838–850, https://doi.org/10.1364/JOSA.44.000838, 1954a. a
Cox, C. and Munk, W.: Statistics of the sea surface derived from Sun glitter, J. Mar. Res., 13, 198–227, 1954b. a
Denjean, C., Caquineau, S., Desboeufs, K., Laurent, B., Maille, M., Rosado, M. Q., Vallejo, P., Mayol-Bracero, O. L., and Formenti, P.: Long-range transport across the Atlantic in summertime does not enhance the hygroscopicity of African mineral dust, Geophys. Re. Lett., 42, 7835–7843, https://doi.org/10.1002/2015gl065693, 2015. a
Emde, C., Buras-Schnell, R., Kylling, A., Mayer, B., Gasteiger, J., Hamann, U., Kylling, J., Richter, B., Pause, C., Dowling, T., and Bugliaro, L.: The libRadtran software package for radiative transfer calculations (version 2.0.1), Geosci. Model Dev., 9, 1647–1672, https://doi.org/10.5194/gmd-9-1647-2016, 2016. a, b
Esselborn, M., Wirth, M., Fix, A., Tesche, M., and Ehret, G.: Airborne high spectral resolution lidar for measuring aerosol extinction and backscatter coefficients, Appl. Opt., 47, 346–358, https://doi.org/10.1364/AO.47.000346, 2008. a, b, c
Ewald, F., Kölling, T., Baumgartner, A., Zinner, T., and Mayer, B.: Design and characterization of specMACS, a multipurpose hyperspectral cloud and sky imager, Atmos. Meas. Tech., 9, 2015–2042, https://doi.org/10.5194/amt-9-2015-2016, 2016. a
Ewald, F., Groß, S., Hagen, M., Hirsch, L., Delanoë, J., and Bauer-Pfundstein, M.: Calibration of a 35 GHz airborne cloud radar: lessons learned and intercomparisons with 94 GHz cloud radars, Atmos. Meas. Tech., 12, 1815–1839, https://doi.org/10.5194/amt-12-1815-2019, 2019. a
Falkovich, A. H., Ganor, E., Levin, Z., Formenti, P., and Rudich, Y.: Chemical and mineralogical analysis of individual mineral dust particles, J. Geophys. Res.-Atmos, 106, 18029–18036, https://doi.org/10.1029/2000jd900430, 2001. a
Foltz, G. R. and McPhaden, M. J.: Impact of Saharan dust on tropical North Atlantic SST, J. Climate, 21, 5048–5060, https://doi.org/10.1175/2008jcli2232.1, 2008. a
Freudenthaler, V., Esselborn, M., Wiegner, M., Heese, B., Tesche, M., Ansmann, A., Müller, D., Althausen, D., Wirth, M., Fix, A., Ehret, G., Knippertz, P., Toledano, C., Gasteiger, J., Garhammer, M., and Seefeldner, M.: Depolarization ratio profiling at several wavelengths in pure Saharan dust during SAMUM 2006, Tellus B, 61, 165–179, https://doi.org/10.1111/j.1600-0889.2008.00396.x, 2009. a
Fu, Q. and Liou, K. N.: On the correlated k-distribution method for radiative transfer in nonhomogeneous atmospheres, J. Atmos. Sci., 49, 2139–2156, https://doi.org/10.1175/1520-0469(1992)049<2139:OTCDMF>2.0.CO;2, 1992. a
Gasteiger, J., Wiegner, M., Groß, S., Freudenthaler, V., Toledano, C., Tesche, M., and Kandler, K.: Modelling lidar-relevant optical properties of complex mineral dust aerosols, Tellus B, 63, 725–741, https://doi.org/10.1111/j.1600-0889.2011.00559.x, 2011. a, b, c
Gasteiger, J., Groß, S., Sauer, D., Haarig, M., Ansmann, A., and Weinzierl, B.: Particle settling and vertical mixing in the Saharan Air Layer as seen from an integrated model, lidar, and in situ perspective, Atmos. Chem. Phys., 17, 297–311, https://doi.org/10.5194/acp-17-297-2017, 2017. a
German Aerospace Center: HALO database, https://doi.org/10.17616/R39Q0T, 2016. a
Gobbi, G., Barnaba, F., Blumthaler, M., Labow, G., and Herman, J.: Observed effects of particles nonsphericity on the retrieval of marine and desert dust aerosol optical depth by lidar, Atmos. Res., 61, 1–14, https://doi.org/10.1016/s0169-8095(01)00104-1, 2002. a
Groß, S., Tesche, M., Freudenthaler, V., Toledano, C., Wiegner, M., Ansmann, A., Althausen, D., and Seefeldner, M.: Characterization of Saharan dust, marine aerosols and mixtures of biomass-burning aerosols and dust by means of multi-wavelength depolarization and Raman lidar measurements during SAMUM 2, Tellus B, 63, 706–724, https://doi.org/10.1111/j.1600-0889.2011.00556.x, 2011a. a
Groß, S., Wiegner, M., Freudenthaler, V., and Toledano, C.: Lidar ratio of Saharan dust over Cape Verde Islands: Assessment and error calculation, J. Geophys. Res.-Atmos., 116, D15203, https://doi.org/10.1029/2010JD015435, d15203, 2011b. a
Groß, S., Esselborn, M., Weinzierl, B., Wirth, M., Fix, A., and Petzold, A.: Aerosol classification by airborne high spectral resolution lidar observations, Atmos. Chem. Phys., 13, 2487–2505, https://doi.org/10.5194/acp-13-2487-2013, 2013. a, b, c
Groß, S., Freudenthaler, V., Schepanski, K., Toledano, C., Schäfler, A., Ansmann, A., and Weinzierl, B.: Optical properties of long-range transported Saharan dust over Barbados as measured by dual-wavelength depolarization Raman lidar measurements, Atmos. Chem. Phys., 15, 11067–11080, https://doi.org/10.5194/acp-15-11067-2015, 2015. a, b
Groß, S., Gasteiger, J., Freudenthaler, V., Müller, T., Sauer, D., Toledano, C., and Ansmann, A.: Saharan dust contribution to the Caribbean summertime boundary layer – a lidar study during SALTRACE, Atmos. Chem. Phys., 16, 11535–11546, https://doi.org/10.5194/acp-16-11535-2016, 2016. a, b
Gutleben, M., Groß, S., and Wirth, M.: Cloud macro-physical properties in Saharan-dust-laden and dust-free North Atlantic trade wind regimes: a lidar case study, Atmos. Chem. Phys., 19, 10659–10673, https://doi.org/10.5194/acp-19-10659-2019, 2019a. a, b, c, d
Gutleben, M., Groß, S., Wirth, M., Emde, C., and Mayer, B.: Impacts of water vapor on Saharan Air Layer radiative heating, Geophys. Res. Lett., 46, 14854–14862, https://doi.org/10.1029/2019GL085344, 2019b. a, b, c, d
Haarig, M., Ansmann, A., Althausen, D., Klepel, A., Groß, S., Freudenthaler, V., Toledano, C., Mamouri, R.-E., Farrell, D. A., Prescod, D. A., Marinou, E., Burton, S. P., Gasteiger, J., Engelmann, R., and Baars, H.: Triple-wavelength depolarization-ratio profiling of Saharan dust over Barbados during SALTRACE in 2013 and 2014, Atmos. Chem. Phys., 17, 10767–10794, https://doi.org/10.5194/acp-17-10767-2017, 2017a. a
Haarig, M., Ansmann, A., Gasteiger, J., Kandler, K., Althausen, D., Baars, H., Radenz, M., and Farrell, D. A.: Dry versus wet marine particle optical properties: RH dependence of depolarization ratio, backscatter, and extinction from multiwavelength lidar measurements during SALTRACE, Atmos. Chem. Phys., 17, 14199–14217, https://doi.org/10.5194/acp-17-14199-2017, 2017b. a
Hess, M., Koepke, P., and Schult, I.: Optical Properties of Aerosols and Clouds: the software package OPAC, B. Am. Meteorol. Soc., 79, 831–844, https://doi.org/10.1175/1520-0477(1998)079<0831:opoaac>2.0.co;2, 1998. a, b
Jung, E., Albrecht, B., Prospero, J. M., Jonsson, H. H., and Kreidenweis, S. M.: Vertical structure of aerosols, temperature, and moisture associated with an intense African dust event observed over the eastern Caribbean, J. Geophys. Res.-Atmos., 118, 4623–4643, https://doi.org/10.1002/jgrd.50352, 2013. a
Kaaden, N., Massling, A., Schladitz, A., Müller, T., Kandler, K., Schütz, L., Weinzierl, B., Petzold, A., Tesche, M., Leinert, S., Deutscher, C., Ebert, M., Weinbruch, S., and Wiedensohler, A.: State of mixing, shape factor, number size distribution, and hygroscopic growth of the Saharan anthropogenic and mineral dust aerosol at Tinfou, Morocco, Tellus B, 61, 51–63, https://doi.org/10.1111/j.1600-0889.2008.00388.x, 2009. a
Kahnert, M., Nousianen, T., and Veihelmann, B.: Spherical and spheroidal model particles as an error source in aerosol climate forcing and radiance computations: A case study for feldspar aerosols, J. Geophys. Res.-Atmos., 110, D18S13, https://doi.org/10.1029/2004jd005558, 2005. a
Kandler, K., Schütz, L., Deutscher, C., Ebert, M., Hofmann, H., Jäckel, S., Jaenicke, R., Knippertz, P., Lieke, K., Massling, A., Petzold, A., Schladitz, A., Weinzierl, B., Wiedensohler, A., Zorn, S., and Weinbruch, S.: Size distribution, mass concentration, chemical and mineralogical composition and derived optical parameters of the boundary layer aerosol at Tinfou, Morocco, during SAMUM 2006, Tellus B, 61, 32–50, https://doi.org/10.1111/j.1600-0889.2008.00385.x, 2009. a
Kandler, K., Lieke, K., Benker, N., Emmel, C., Küpper, M., Müller-Ebert, D., Ebert, M., Scheuvens, D., Schladitz, A., Schütz, L., and Weinbruch, S.: Electron microscopy of particles collected at Praia, Cape Verde, during the Saharan Mineral Dust Experiment: particle chemistry, shape, mixing state and complex refractive index, Tellus B, 63, 475–496, https://doi.org/10.1111/j.1600-0889.2011.00550.x, 2011. a, b
Kanitz, T., Ansmann, A., Seifert, P., Engelmann, R., Kalisch, J., and Althausen, D.: Radiative effect of aerosols above the northern and southern Atlantic Ocean as determined from shipborne lidar observations, J. Geophys. Res.-Atmos., 118, 12556–12565, https://doi.org/10.1002/2013jd019750, 2013. a, b
Kanitz, T., Engelmann, R., Heinold, B., Baars, H., Skupin, A., and Ansmann, A.: Tracking the Saharan Air Layer with shipborne lidar across the tropical Atlantic, Geophys. Res. Lett., 41, 1044–1050, https://doi.org/10.1002/2013gl058780, 2014. a
Karyampudi, V. M. and Carlson, T. N.: Analysis and numerical simulations of the Saharan air layer and its effect on easterly wave disturbances, J. Atmos. Sci., 45, 3102–3136, 1988. a
Karyampudi, V. M., Palm, S. P., Reagen, J. A., Fang, H., Grant, W. B., Hoff, R. M., Moulin, C., Pierce, H. F., Torres, O., Browell, E. V., and Melfi, S. H.: Validation of the Saharan dust plume conceptual model using lidar, Meteosat, and ECMWF data, B. Am. Meteorol. Soc., 80, 1045–1075, https://doi.org/10.1175/1520-0477(1999)080<1045:VOTSDP>2.0.CO;2, 1999. a
Kato, S., Ackerman, T. P., Mather, J. H., and Clothiaux, E. E.: The k-distribution method and correlated-k approximation for a shortwave radiative transfer model, J. Quant. Spectrosc. Ra., 62, 109–121, https://doi.org/10.1016/s0022-4073(98)00075-2, 1999. a
Kiemle, C., Wirth, M., Fix, A., Ehret, G., Schumann, U., Gardiner, T., Schiller, C., Sitnikov, N., and Stiller, G.: First airborne water vapor lidar measurements in the tropical upper troposphere and mid-latitudes lower stratosphere: accuracy evaluation and intercomparisons with other instruments, Atmos. Chem. Phys., 8, 5245–5261, https://doi.org/10.5194/acp-8-5245-2008, 2008. a
Kim, S., Yoon, S., Jefferson, A., Won, J., Dutton, E. G., Ogren, J. A., and Anderson, T. L.: Observation of enhanced water vapor in Asian dust layer and its effect on atmospheric radiative heating rates, Geophys. Res. Lett., 31, L18113, https://doi.org/10.1029/2004gl020024, 2004. a, b
Koepke, P. and Hess, M.: Scattering functions of tropospheric aerosols: the effects of nonspherical particles, Appl. Opt., 27, 2422, https://doi.org/10.1364/ao.27.002422, 1988. a
Koepke, P., Gasteiger, J., and Hess, M.: Technical Note: Optical properties of desert aerosol with non-spherical mineral particles: data incorporated to OPAC, Atmos. Chem. Phys., 15, 5947–5956, https://doi.org/10.5194/acp-15-5947-2015, 2015. a
Krautstrunk, M. and Giez, A.: The transition from FALCON to HALO era airborne atmospheric research, in: Atmospheric Physics, edited by Schumann, U., Research Topics in Aerospace, Springer Berlin Heidelberg, 609–624, 2012. a
Li, F., Vogelmann, A. M., and Ramanathan, V.: Saharan dust aerosol radiative forcing measured from space, J. Climate, 17, 2558–2571, https://doi.org/10.1175/1520-0442(2004)017<2558:sdarfm>2.0.co;2, 2004. a
Liao, H. and Seinfeld, J. H.: Radiative forcing by mineral dust aerosols: sensitivity to key variables, J. Geophys. Res.-Atmos., 103, 31637–31645, https://doi.org/10.1029/1998JD200036, 1998. a
Lilly, D. K.: Models of cloud-topped mixed layers under a strong inversion, Q. J. Roy. Meteor. Soc., 94, 292–309, https://doi.org/10.1002/qj.49709440106, 1968. a, b
Liu, Z., Vaughan, M. A., Winker, D. M., Hostetler, C. A., Poole, L. R., Hlavka, D., Hart, W., and McGill, M.: Use of probability distribution functions for discriminating between cloud and aerosol in lidar backscatter data, J. Geophys. Res., 109, D15202, https://doi.org/10.1029/2004jd004732, 2004. a
Mamouri, R.-E. and Ansmann, A.: Potential of polarization lidar to provide profiles of CCN- and INP-relevant aerosol parameters, Atmos. Chem. Phys., 16, 5905–5931, https://doi.org/10.5194/acp-16-5905-2016, 2016. a
Mayer, B. and Kylling, A.: Technical note: The libRadtran software package for radiative transfer calculations - description and examples of use, Atmos. Chem. Phys., 5, 1855–1877, https://doi.org/10.5194/acp-5-1855-2005, 2005. a, b
Mech, M., Orlandi, E., Crewell, S., Ament, F., Hirsch, L., Hagen, M., Peters, G., and Stevens, B.: HAMP – the microwave package on the High Altitude and LOng range research aircraft (HALO), Atmos. Meas. Tech., 7, 4539–4553, https://doi.org/10.5194/amt-7-4539-2014, 2014. a
Mie, G.: Beiträge zur Optik trüber Medien, speziell kolloidaler Metallösungen, Ann. Phys., 330, 377–445, https://doi.org/10.1002/andp.19083300302, 1908. a
Mishchenko, M. I., Travis, L. D., Kahn, R. A., and West, R. A.: Modeling phase functions for dustlike tropospheric aerosols using a shape mixture of randomly oriented polydisperse spheroids, J. Geophys. Res.-Atmos., 102, 16831–16847, https://doi.org/10.1029/96jd02110, 1997. a
Moulin, C., Lambert, C. E., Dulac, F., and Dayan, U.: Control of atmospheric export of dust from North Africa by the North Atlantic Oscillation, Nature, 387, 691–694, https://doi.org/10.1038/42679, 1997. a
Murayama, T., Okamoto, H., Kaneyasu, N., Kamataki, H., and Miura, K.: Application of lidar depolarization measurement in the atmospheric boundary layer: effects of dust and sea-salt particles, J. Geophys. Res.-Atmos., 104, 31781–31792, https://doi.org/10.1029/1999jd900503, 1999. a, b
Naumann, A. K., Stevens, B., Hohenegger, C., and Mellado, J. P.: A conceptual model of a shallow circulation induced by prescribed low-level radiative cooling, J. Atmos. Sci., 74, 3129–3144, https://doi.org/10.1175/jas-d-17-0030.1, 2017. a
Nousiainen, T.: Optical modeling of mineral dust particles: a review, J. Quant. Spectrosc. Ra., 110, 1261–1279, https://doi.org/10.1016/j.jqsrt.2009.03.002, 2009. a
Patadia, F., Yang, E.-S., and Christopher, S. A.: Does dust change the clear sky top of atmosphere shortwave flux over high surface reflectance regions?, Geophys. Res. Lett., 36, L15825, https://doi.org/10.1029/2009gl039092, 2009. a
Prospero, J. M. and Carlson, T. N.: Vertical and areal distribution of Saharan dust over the western equatorial North Atlantic Ocean, J. Geophys. Res, 77, 5255–5265, https://doi.org/10.1029/JC077i027p05255, 1972. a
Reid, J. S., Westphal, D. L., Livingston, J. M., Savoie, D. L., Maring, H. B., Jonsson, H. H., Eleuterio, D. P., Kinney, J. E., and Reid, E. A.: Dust vertical distribution in the Caribbean during the Puerto Rico Dust Experiment, Geophys. Res. Lett., 29, 55-1–55-4, https://doi.org/10.1029/2001gl014092, 2002. a, b
Sakai, T., Nagai, T., Zaizen, Y., and Mano, Y.: Backscattering linear depolarization ratio measurements of mineral, sea-salt, and ammonium sulfate particles simulated in a laboratory chamber, Appl. Opt., 49, 4441–4449, https://doi.org/10.1364/ao.49.004441, 2010. a, b, c
Sakai, T., Orikasa, N., Nagai, T., Murakami, M., Tajiri, T., Saito, A., Yamashita, K., and Hashimoto, A.: Balloon-borne and Raman lidar observations of Asian dust and cirrus cloud properties over Tsukuba, Japan, J. Geophys. Res.-Atmos., 119, 3295–3308, https://doi.org/10.1002/2013jd020987, 2014. a
Schepanski, K., Tegen, I., Todd, M. C., Heinold, B., Bönisch, G., Laurent, B., and Macke, A.: Meteorological processes forcing Saharan dust emission inferred from MSG-SEVIRI observations of subdaily dust source activation and numerical models, J. Geophys. Res., 114, D10201, https://doi.org/10.1029/2008jd010325, 2009. a
Stamnes, K., Tsay, S.-C., Wiscombe, W., and Jayaweera, K.: Numerically stable algorithm for discrete-ordinate-method radiative transfer in multiple scattering and emitting layered media, Appl. Opt., 27, 2502–2509, https://doi.org/10.1364/ao.27.002502, 1988. a
Stein, A. F., Draxler, R. R., Rolph, G. D., Stunder, B. J. B., Cohen, M. D., and Ngan, F.: NOAA’s HYSPLIT atmospheric transport and dispersion modeling system, B. Am. Meteorol. Soc., 96, 2059–2077, https://doi.org/10.1175/BAMS-D-14-00110.1, 2015. a
Stevens, B., Brogniez, H., Kiemle, C., Lacour, J.-L., Crevoisier, C., and Kiliani, J.: Structure and dynamical influence of water vapor in the lower tropical troposphere, Surv. Geophys., 38, 1371–1397, https://doi.org/10.1007/s10712-017-9420-8, 2017. a
Stevens, B., Ament, F., Bony, S., Crewell, S., Ewald, F., Groß, S., Hansen, A., Hirsch, L., Jacob, M., Kölling, T., Konow, H., Mayer, B., Wendisch, M., Wirth, M., Wolf, K., Bakan, S., Bauer-Pfundstein, M., Brueck, M., Delanoë, J., Ehrlich, A., Farrell, D., Forde, M., Gödde, F., Grob, H., Hagen, M., Jäkel, E., Jansen, F., Klepp, C., Klingebiel, M., Mech, M., Peters, G., Rapp, M., Wing, A. A., and Zinner, T.: A high-altitude long-range aircraft configured as a cloud observatory – the NARVAL expeditions, B. Am. Meteorol. Soc., 100, 1061–1077, https://doi.org/10.1175/BAMS-D-18-0198.1, 2019. a, b
Tesche, M., Ansmann, A., Müller, D., Althausen, D., Engelmann, R., Freudenthaler, V., and Groß, S.: Vertically resolved separation of dust and smoke over Cape Verde using multiwavelength Raman and polarization lidars during Saharan Mineral Dust Experiment 2008, J. Geophys. Res., 114, D13202, https://doi.org/10.1029/2009jd011862, 2009a. a
Tesche, M., Ansmann, A., Müller, D., Althausen, D., Mattis, I., Heese, B., Freudenthaler, V., Wiegner, M., Esselborn, M., Pisani, G., and Knippertz, P.: Vertical profiling of Saharan dust with Raman lidars and airborne HSRL in southern Morocco during SAMUM, Tellus B, 61, 144–164, https://doi.org/10.1111/j.1600-0889.2008.00390.x, 2009b. a
Toledano, C., Torres, B., Velasco-Merino, C., Althausen, D., Groß, S., Wiegner, M., Weinzierl, B., Gasteiger, J., Ansmann, A., González, R., Mateos, D., Farrel, D., Müller, T., Haarig, M., and Cachorro, V. E.: Sun photometer retrievals of Saharan dust properties over Barbados during SALTRACE, Atmos. Chem. Phys., 19, 14571–14583, https://doi.org/10.5194/acp-19-14571-2019, 2019. a
Waterman, P. C.: Symmetry, unitarity, and geometry in electromagnetic scattering, Phys. Rev. D, 3, 825–839, https://doi.org/10.1103/PhysRevD.3.825, 1971. a
Weinzierl, B., Ansmann, A., Prospero, J. M., Althausen, D., Benker, N., Chouza, F., Dollner, M., Farrell, D., Fomba, W. K., Freudenthaler, V., Gasteiger, J., Groß, S., Haarig, M., Heinold, B., Kandler, K., Kristensen, T. B., Mayol-Bracero, O. L., Müller, T., Reitebuch, O., Sauer, D., Schäfler, A., Schepanski, K., Spanu, A., Tegen, I., Toledano, C., and Walser, A.: The Saharan Aerosol Long-Range Transport and Aerosol-Cloud-Interaction Experiment: overview and selected highlights, B. Am. Meteorol. Soc., 98, 1427–1451, https://doi.org/10.1175/BAMS-D-15-00142.1, 2017. a, b
Wendisch, M., Müller, D., Schell, D., and Heintzenberg, J.: An airborne spectral albedometer with active horizontal stabilization, J. Atmos. Ocean. Tech., 18, 1856–1866, https://doi.org/10.1175/1520-0426(2001)018<1856:aasawa>2.0.co;2, 2001. a
Wiegner, M., Gasteiger, J., Kandler, K., Weinzierl, B., Rasp, K., Esselborn, M., Freudenthaler, V., Heese, B., Toledano, C., Tesche, M., and Althausen, D.: Numerical simulations of optical properties of Saharan dust aerosols with emphasis on lidar applications, Tellus B, 61, 180–194, https://doi.org/10.1111/j.1600-0889.2008.00381.x, 2009. a
Wirth, M., Fix, A., Mahnke, P., Schwarzer, H., Schrandt, F., and Ehret, G.: The airborne multi-wavelength water vapor differential absorption lidar WALES: system design and performance, Appl. Phys. B, 96, 201–213, https://doi.org/10.1007/s00340-009-3365-7, 2009. a, b
Wong, S. and Dessler, A. E.: Suppression of deep convection over the tropical North Atlantic by the Saharan Air Layer, Geophys. Res. Lett., 32, L09808, https://doi.org/10.1029/2004gl022295, 2005. a
Wong, S., Dessler, A. E., Mahowald, N. M., Yang, P., and Feng, Q.: Maintenance of lower tropospheric temperature inversion in the Saharan Air Layer by dust and dry anomaly, J. Clim., 22, 5149–5162, https://doi.org/10.1175/2009jcli2847.1, 2009. a
Yi, B., Hsu, C. N., Yang, P., and Tsay, S.-C.: Radiative transfer simulation of dust-like aerosols: uncertainties from particle shape and refractive index, J. Aerosol Sci., 42, 631–644, https://doi.org/10.1016/j.jaerosci.2011.06.008, 2011. a
Zhu, A., Ramanathan, V., Li, F., and Kim, D.: Dust plumes over the Pacific, Indian, and Atlantic oceans: climatology and radiative impact, J. Geophys. Res., 112, D16208, https://doi.org/10.1029/2007jd008427, 2007. a