the Creative Commons Attribution 4.0 License.
the Creative Commons Attribution 4.0 License.
 | 03 Feb 2020
Observationally constrained modeling of atmospheric oxidation capacity and photochemical reactivity in Shanghai, China
Jian Zhu
Shanshan Wang
Hongli Wang
Shengao Jing
Shengrong Lou
Alfonso Saiz-Lopez
Bin Zhou
An observation-based model coupled to the Master Chemical Mechanism (V3.3.1) and constrained by a full suite of observations was developed to study atmospheric oxidation capacity (AOC), OH reactivity, OH chain length and HOx () budget for three different ozone (O3) concentration levels in Shanghai, China. Five months of observations from 1 May to 30 September 2018 showed that the air quality level is lightly polluted or worse (Ambient Air Quality Index, AQI, of > 100) for 12 d, of which ozone is the primary pollutant for 10 d, indicating ozone pollution was the main air quality challenge in Shanghai during summer of 2018. The levels of ozone and its precursors, as well as meteorological parameters, revealed the significant differences among different ozone levels, indicating that the high level of precursors is the precondition of ozone pollution, and strong radiation is an essential driving force. By increasing the input value by 40 %, the simulated O3 level increased by 30 %–40 % correspondingly under the same level of precursors. The simulation results show that AOC, dominated by reactions involving OH radicals during the daytime, has a positive correlation with ozone levels. The reactions with non-methane volatile organic compounds (NMVOCs; 30 %–36 %), carbon monoxide (CO; 26 %–31 %) and nitrogen dioxide (NO2; 21 %–29 %) dominated the OH reactivity under different ozone levels in Shanghai. Among the NMVOCs, alkenes and oxygenated VOCs (OVOCs) played a key role in OH reactivity, defined as the inverse of the OH lifetime. A longer OH chain length was found in clean conditions primarily due to low NO2 in the atmosphere. The high level of radical precursors (e.g., O3, HONO and OVOCs) promotes the production and cycling of HOx, and the daytime HOx primary source shifted from HONO photolysis in the morning to O3 photolysis in the afternoon. For the sinks of radicals, the reaction with NO2 dominated radical termination during the morning rush hour, while the reactions of radical–radical also contributed to the sinks of HOx in the afternoon. Furthermore, the top four species contributing to ozone formation potential (OFP) were HCHO, toluene, ethylene and m/p-xylene. The concentration ratio (∼23 %) of these four species to total NMVOCs is not proportional to their contribution (∼55 %) to OFP, implying that controlling key VOC species emission is more effective than limiting the total concentration of VOC in preventing and controlling ozone pollution.
- Article
(3936 KB) - Full-text XML
-
Supplement
(1702 KB) - BibTeX
- EndNote


Air quality in urban areas has received increasing attention in recent years, especially photochemical smog pollution during summer. It is well known that high concentrations of ozone (O3), an essential product of atmospheric photochemistry and free radical chemistry, have adverse effects on human health, plants and crops (National Research Council, 1992; Seinfeld and Pandis, 2016) The abundance of tropospheric O3 is primarily determined by the external transport (transport down from the stratosphere, dry deposition to the earth surface) and in situ photochemical generation through a series of reactions involving volatile organic compounds (VOCs) and nitrogen oxides (NOx) under sunlight (Jenkin and Clemitshaw, 2000; Seinfeld and Pandis, 2016). Both the removal of these O3 precursors, such as methane (CH4), non-methane volatile organic compounds (NMVOCs), carbon monoxide (CO) and NOx, and the formation of secondary pollutants like ozone and secondary organic/inorganic aerosols are controlled by the oxidation capacity of the atmosphere (Prinn, 2003; Hofzumahaus et al., 2009; Ma et al., 2010, 2012; Feng et al., 2019). The term “atmospheric oxidation capacity (AOC)” is defined as the sum of the respective oxidation rates of primary pollutants (CH4, NMVOCs and CO) by the oxidants (OH, O3 and NO3; Elshorbany et al., 2009; Xue et al., 2016). Therefore, understanding the processes and rates under which these species are oxidized in the atmosphere is critical to identify the controlling factors of secondary pollution in the atmosphere.
As the most reactive species in the atmosphere, hydroxyl (OH), poses a significant role in atmospheric chemistry, driving AOC (Li et al., 2018). OH is removed by reactions with primary pollutants and with intermediate products of these oxidation reactions. The OH loss frequency (referred as OH reactivity) is defined as the inverse of the OH lifetime and has been widely used to evaluate the oxidation intensity of the atmosphere (Kovacs et al., 2003; Li et al., 2018). The OH and hydroperoxy radical (HO2), collectively called HOx, in which OH initiates a series of oxidation reactions, while HO2 is the primary precursor of ozone generation in the presence of NOx. OH can react with many species in the atmosphere such as CO, CH4 and NMVOCs, which directly produce HO2 in some cases, and initiate a reaction sequence that produces HO2 in other cases, e.g., . Meanwhile, HO2 can react with NO or O3 to produce OH. High temperature and high radiation promote HOx cycling reactions, which is also affected by the abundance of other atmospheric compounds (Coates et al., 2016; Xing et al., 2017). This cycling is closely related to atmospheric photochemical reactivity, especially the generation of ozone, secondary aerosols and other pollutants (Mao et al., 2010; Xue et al., 2016). The radical cycling is terminated by their cross-reactions with NOx under high-NOx conditions (e.g., OH+NO2, RO2+NO and RO2+NO2) and ROx under low-NOx conditions (e.g., HO2+HO2, RO2+HO2 and RO2+RO2), which results in the formation of nitric acid, organic nitrates and peroxides (Wood et al., 2009; Liu et al., 2012; Xue et al., 2016).
To further understand the atmospheric oxidation capacity and radical chemistry, it is necessary to explore the HOx budget. In general, significant sources of HOx include the photolysis of ozone (O(1D)+H2O), HONO, HCHO and other oxygenated VOCs (OVOCs), as well as other non-photolytic sources such as the reactions of ozone with alkenes and the reactions of NO3 with unsaturated VOCs (Xue et al., 2016). In past decades, research on the sources of HOx has shown that although air pollution problems are visually very similar, radical chemistry, especially the relative importance of primary radical sources, is unique in different metropolitan areas. For example, ozone photolysis is the dominant OH source in Nashville (Martinez et al., 2003); HONO photolysis has a more important role in New York City (Ren et al., 2003), Paris (Michoud et al., 2012), Santiago (Elshorbany et al., 2009), Wangdu, China (Tan et al., 2017), and London (Whalley et al., 2016, 2018); HCHO photolysis is a significant source of OH in Milan (Alicke et al., 2002); while OVOCs photolysis plays a more critical role in Mexico City (Sheehy et al., 2010), Beijing (Liu et al., 2012), London (Emmerson et al., 2007) and Hong Kong (Xue et al., 2016). However, it also should be noted that the sources of HOx also changed with different observational seasons/periods even in the same place. The HOx production in New York City was reported to be dominated by HONO photolysis during daytime but O3 reactions with alkenes dominant at night in winter (Ren et al., 2006). The main source of radicals was the reaction of O3 and alkenes throughout the day in winter, while HONO photolysis dominated the source of radicals in the morning and photolysis of carbonyls was dominant at noon in the summer in Tokyo (Kanaya et al., 2007). Previous studies reported that the reaction of OH with NO2 dominates HOx sinks all day, and the reactions between radicals themselves, e.g., HO2+HO2 and HO2+RO2, start to be important for the contribution of HOx sinks in the afternoon (Guo et al., 2013; Ling et al., 2014; Mao et al., 2010). Overall, atmospheric oxidation capacity, OH reactivity and HOx budget are three crucial aspects for understanding the complex photochemistry of an urban atmosphere.
As a photochemical product, ozone pollution has been increasingly severe during the past few years in China (Wang et al., 2017). At a rural site 50 km north of the center of Beijing, a 6-week observation experiment in June and July 2005 reported the maximum average hourly ozone reached 286 ppbv (Wang et al., 2006). Even in the first 2 weeks under an emissions control scenario, for the Beijing Olympic Games, the hourly ozone level was 160–180 ppbv in urban Beijing (Wang et al., 2010). In comparison, the highest hourly ozone also frequently exceeded 200 ppbv in the Pearl River Delta region and Hong Kong (Zhang et al., 2007; Guo et al., 2009; Cheng et al., 2010; Xue et al., 2016; Zhang et al., 2016). Long-term observations show that the mean mixing ratio of O3 at the downtown urban site in Shanghai increased 67 % from 2006 to 2015 at a growth rate of 1.1 ppbv yr−1 (Gao et al., 2017). Most of the previous studies on ozone pollution in Shanghai had a focus on the precursor–O3 relationships, cause of O3 formation and local or regional contributions (Gao et al., 2017; Wang et al., 2018; Li et al., 2008). The NCAR Master Mechanism model and measurement results between 2006 and 2007 indicated that the O3 formation is clearly under a VOC-sensitive regime in Shanghai, pointing to the essential role of aromatics and alkenes in O3 formation (Geng et al., 2008). A regional modeling study using the Weather Research and Forecasting with Chemistry (WRF-Chem) model suggested that the variations of ambient O3 levels in 2007 in Shanghai were mainly driven by the ozone precursors, along with regional transport (Tie et al., 2009). The sensitivity study of the WRF-Chem model quantified the threshold value of the emission ratio of NOx∕VOCs for switching from a VOC-limited regime to a NOx-limited regime in Shanghai (Tie et al., 2013). Another study has estimated that future ozone will be reduced by 2–3 ppbv in suburban areas, and more than 4 ppbv in rural areas in Shanghai after 2020 (Xu et al., 2019). However, few of these earlier studies investigated atmospheric oxidation capacity and radical chemistry in Shanghai with an observation-constrained model.
In this study, a spring–summer observational experiment was conducted from 1 May to 30 September in 2018 in Shanghai that helped to construct a detailed observation-based model (OBM) to quantify atmospheric oxidation capacity, OH reactivity, OH chain length and HOx budget. Here we selected three cases with different ozone mixing ratio levels to better illustrate the characteristics of atmospheric oxidation and radical chemistry in this megacity. The AOC, OH reactivity, OH chain length and HOx budget in three cases were analyzed and compared to investigate their relationships with ozone pollution. Additionally, some major VOCs species were identified as contributing significantly to ozone formation potential (OFP).
2.1 Measurement site and techniques
Shanghai, China, is one of the largest cities in the world, located at the estuary of the Yangtze River, with more than 24 million people and more than 3 million motor vehicles (National Bureau of Statistics, 2018) The measurements were conducted at the Jiangwan campus of Fudan University in the northeast of Shanghai (121.5∘ E, 31.33∘ N). It is a typical urban environment, surrounded by commercial and residential areas. The campus itself faces relatively clean air conditions without significant sources of air pollutants, mainly affected by traffic emissions from viaducts and residential areas nearby.
O3, HONO, NO2, NO, SO2 and HCHO were monitored in real-time. O3 and NO were measured with a short-path DOAS (differential optical absorption spectroscopy) instrument with a light path of 0.15 km and time resolution of 1 min. The fitting windows of them are 250–266 and 212–230 nm, respectively. HONO, NO2, SO2 and HCHO were measured by the long-path DOAS apparatus with a light path of 2.6 km and time resolution of 6 min. The spectral fitting intervals are 339–371, 341–382, 295–309 and 313–341 nm, respectively. Meteorological parameters, including temperature, relative humidity, wind direction and wind speed, were recorded by the collocated automatic weather station (CAMS620-HM, Huatron Technology Co. Ltd). The photolysis frequency of NO2 () was measured with a filter radiometer (Meteorologie Consult Gmbh). CO was measured by a Gas Filter Correlation CO Analyzer (Thermo-Model 48i) with a time resolution of 1 h. Additionally, NMVOCs were monitored using the TH-300B online VOCs Monitoring system that includes an ultralow-temperature (−150 ∘C) preconcentration combined with gas chromatography and mass spectrometry (GC/MS). Under ultralow-temperature conditions, the volatile organic compounds in the atmosphere are frozen and captured in the empty capillary trap column; then a rapid heating analysis is performed to make the mixture enter the GC/MS analysis system. After separation by chromatography, NMVOCs are detected by FID (flame ionization detector) and MS detectors. Typically, the complete detection cycle was 1 h. CH4 was measured with a Methane and Non-Methane Hydrocarbon Analyzer (Thermo-Model 55i) with a time resolution of 1 h.
All of the above techniques have been validated and applied in many previous studies, and their measurement principles, quality assurance, and control procedures were described in detail (Wang et al., 2015; Hui et al., 2018, 2019; Shen et al., 2016; Zhao et al., 2015; Nan et al., 2017).
2.2 Observation-based model
In this study, the in situ atmospheric photochemistry was simulated using an observation-based model (OBM) incorporating the latest version of the Master Chemical Mechanism (MCM, v3.3.1; http://mcm.leeds.ac.uk/MCM/, last access: 30 January 2020), a near-explicit chemical mechanism which describes the degradation of methane and 142 non-methane VOCs and over 17 000 elementary reactions of 6700 primary, secondary and radical species (Jenkin et al., 2003; Saunders et al., 2003). The model can simulate the concentration of highly active radicals, so that the critical aspects of atmospheric chemistry can be quantitatively evaluated, including secondary product formation (e.g., O3 and PAN), VOC oxidation and radical budgets.
The observed data of O3, NO2, NO, CO, SO2, HONO, CH4, 54 species of NMVOCs, , water vapor (converted from relative humidity) and temperature were interpolated to a time resolution of 5 min and then input into the model as constraints. The photolysis rates of other molecules such as O3, HCHO, HONO and OVOCs were driven by solar zenith angle and scaled by measured (Jenkin et al., 1997; Saunders et al., 2003). Considering the potential impact of cloud cover on the frequency of photolysis, we have discussed the impacts of cloud cover on the scaled photolysis rates in the Supplement. In addition to the chemistry, deposition process within the boundary layer height is also included in the model. The loss of all unrestricted and model-generated species caused by the deposition is set as the accumulation of the deposition velocity of 0.01 m s−1 in the boundary layer (Santiago et al., 2016). Given that the boundary layer height (BLH) varied typically from 400 m at night to 1400 m in the afternoon during summer (Shi et al., 2015), the lifetime of the model-generated species ranged between ∼11 h at night and ∼40 h during the afternoon. We have also carried out a sensitivity study on the deposition velocity and boundary layer height, as referred to the Supplement. The model simulation period for three different ozone levels is 7 d, including 4 d of pre-simulation to allow unconstrained compounds to reach a steady state.
2.3 Evaluation of AOC and photochemical reactivity
According to the definition of AOC, it can be calculated by the Eq. (1) (Elshorbany et al., 2009; Xue et al., 2016):
where Yi are VOCs, CO and CH4, X are oxidants (OH, O3 and NO3) and is the bi-molecular rate constant for the reaction of Yi with X. Atmospheric oxidation capacity determines the rate of Yi removal (Prinn, 2003).
Additionally, another widely used indicator of atmospheric oxidation intensity is OH reactivity, which is defined as the reaction rate coefficients multiplied by the concentrations of the reactants with OH and depends on the abundances and compositions of primary pollutants. As the inverse of the OH lifetime, OH reactivity is calculated by Eq. (2) (Mao et al., 2010):
where [Xi] represents the concentration of species (VOC, NO2, CO etc.) which react with OH and is the corresponding reaction rate coefficients.
Moreover, the ratio of the OH cycling to OH terminal loss, known as the OH chain length, can characterize atmospheric photochemical activity. The OH chain length can be calculated by Eq. (3) when the reaction between OH and NO2 is the main termination reaction of radicals (Martinez et al., 2003; Mao et al., 2010):
This is one of several definitions available based on the assumption that OH + NO2 is the main chain termination reaction, which is further discussed in Sect. 3.3.
The AOC, OH reactivity and OH chain length, as well as HOx budget, can be quantitatively assessed by tracking the relative reactions and corresponding rates of the reactions in the OBM simulation.
3.1 Overview of O3 and its precursors
All the measured data were hourly averaged. Figure 1 shows the observed time series of major pollutant mixing ratios and meteorological parameters during the campaign from 1 May to 30 September 2019 at Jiangwan campus in Shanghai. During the 5-month observation period, the average temperature and humidity levels were 26.4 ∘C and 78.78 %, respectively, while the mean mixing ratios of O3, NO2, NO, HONO and HCHO were 35.14±18.72, 13.0±4.31, 5.30±9.26, 0.29±0.18 and 2.78±1.33 ppbv, respectively. According to the air quality index (AQI) data released by the Shanghai Environmental Monitoring Center (SEMC) and the ozone mixing ratio data observed, the overall air quality in Shanghai was good in the spring–summer season of 2018. Days with good air quality (AQI < 100) accounted for 92.2 % of the experiment period. However, there were occasionally high-ozone pollution days, during which the primary pollutant of 10 d of the residual 12 polluted days was ozone (the average hourly ozone exceeded the Class 2 standard 93 ppbv, GB 3095–2012, China; Ambient air quality standards, 2012)
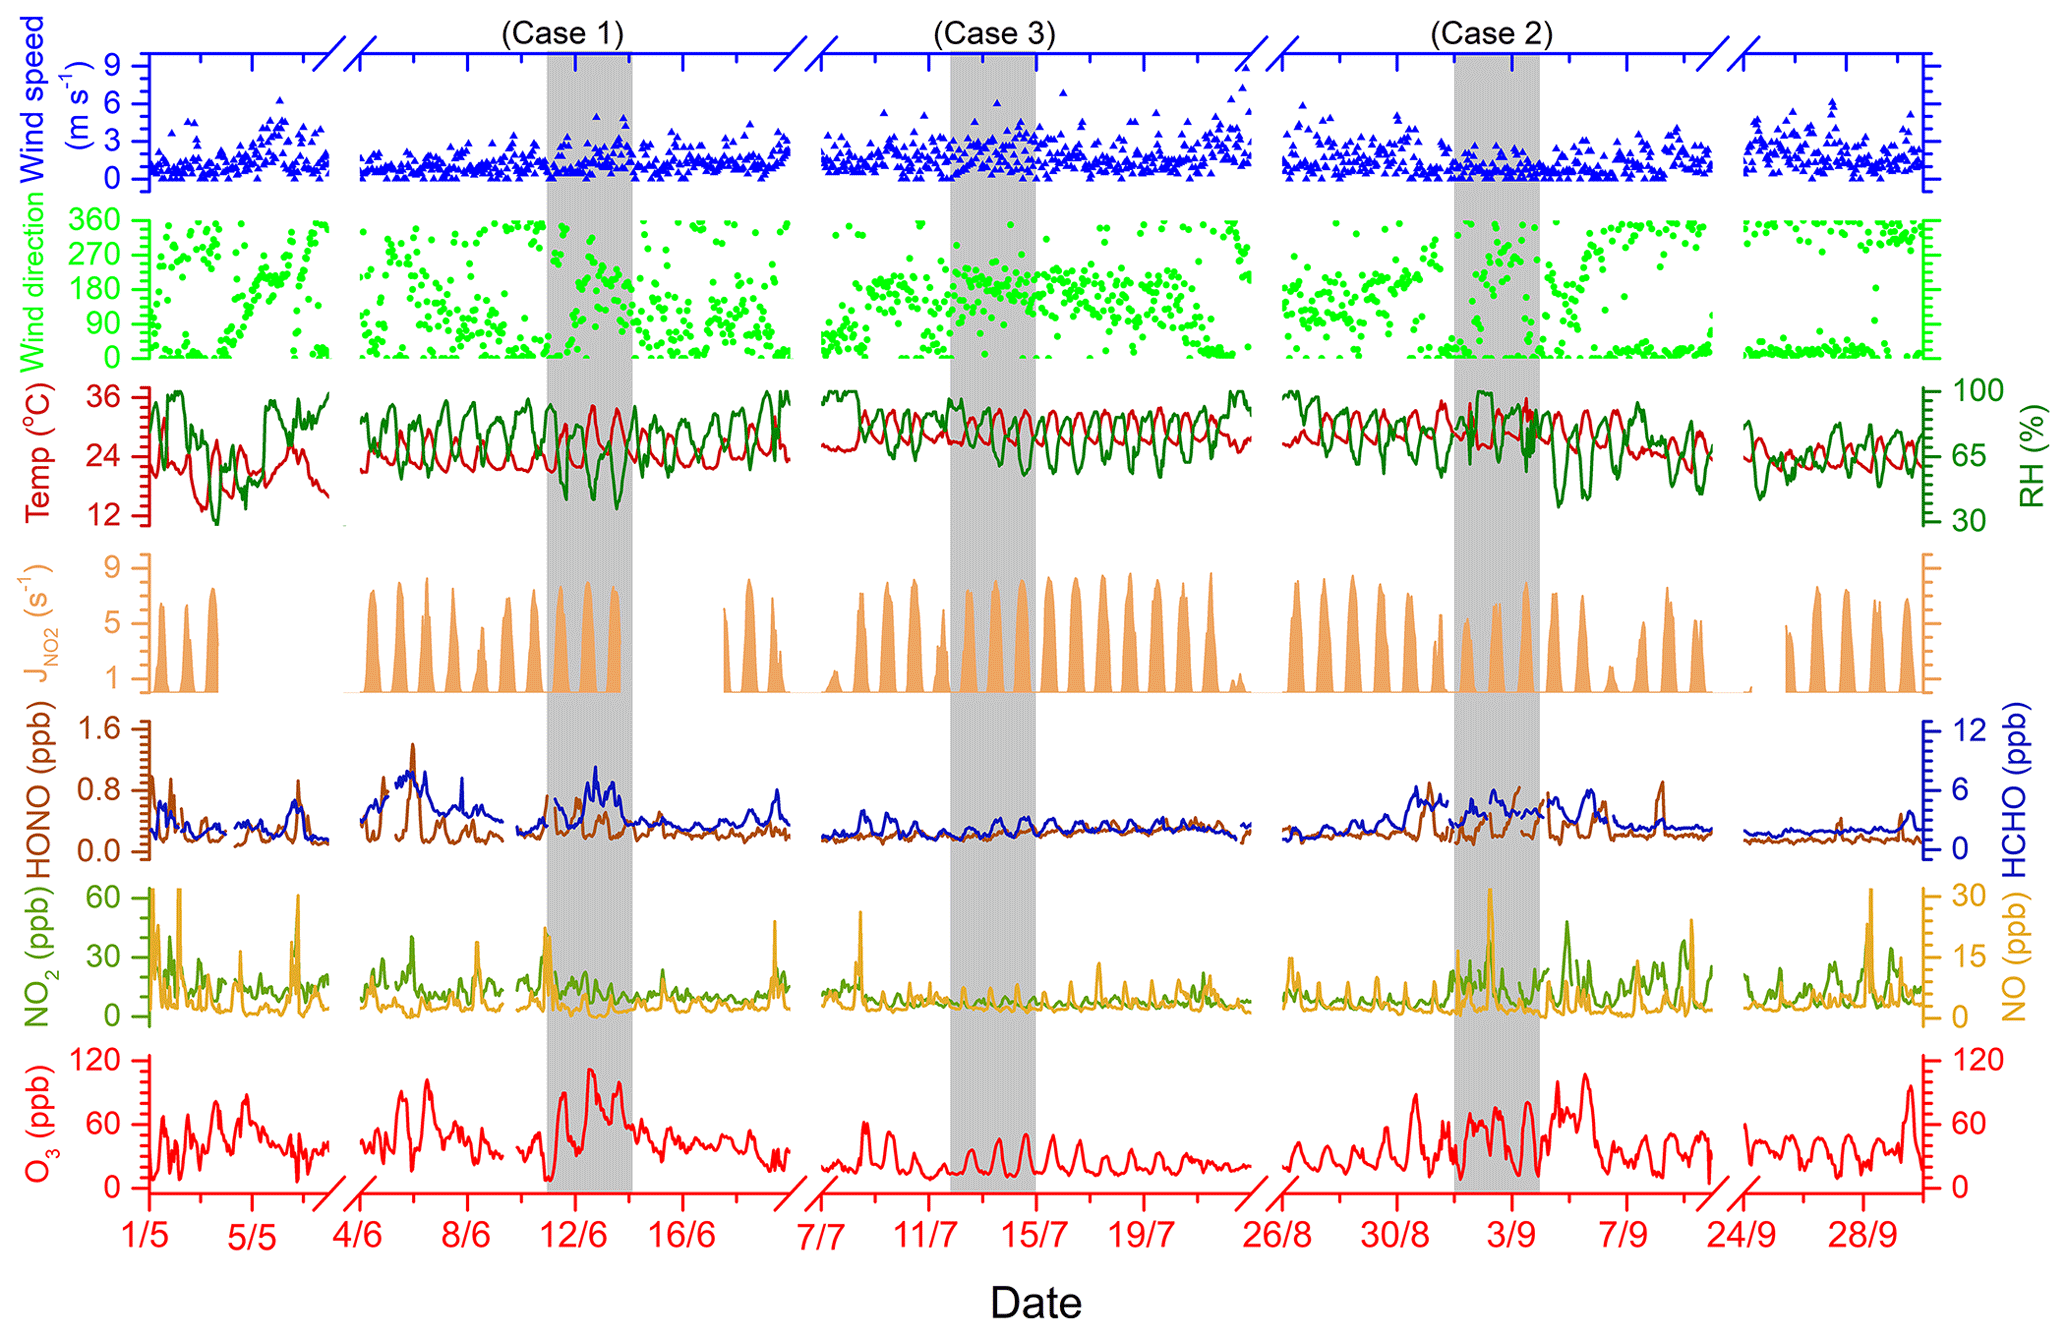
Figure 1Time series of major pollutant mixing ratios and meteorological parameters at an urban site in Shanghai from 1 May to 30 September 2018, with three cases highlighted.
As indicated by the gray rectangle in Fig. 1, three cases of different ozone levels were selected to study atmospheric oxidation and free radical chemistry. These are the polluted period (Case 1) between 11 and 13 June, the semi-polluted period (Case 2) from 2 to 4 September and the non-polluted period (Case 3) of 12 to 14 July, respectively. As can be seen in Table 1 (also refer to Fig. S1 in the Supplement), the averaged O3 mixing ratios in Case 1, Case 2 and Case 3 were 65.13±27.16, 46.12±21.14 and 23.95±11.89 ppbv, during which the maximum mixing ratios reached 111.87, 80.76 and 50.74 ppbv, respectively. By comparing the meteorological parameters, the wind speed of Case 3 was highest, followed by Case 2 and Case 1, indicating that the unfavorable diffusion conditions are one cause of ozone pollution. Although the ozone mixing ratio of Case 2 was much lower than that of Case 1, the levels of NOx, CO, HONO in Case 2 were also high or close to Case 1. This is explained by the fact that meteorological parameters of Case 1 and Case 2 were quite different (Fig. S2); i.e., higher radiation, greater differences in temperature during day and night and lower humidity and air pressure during Case 1 are conductive to enhancing atmospheric photochemistry and lead to ozone formation. In addition, when the value input to the OBM was artificially increased by 40 % for Case 2, simulation results showed that the peak value of ozone increased by 30 %–40 % as a consequence. The observations and simulations suggested that high radiation is an influencing factor in ozone pollution. However, ozone levels were lowest during the most intensive radiation in Case 3. Under such favorable meteorological conditions, the low-ozone mixing ratio was attributed to the low mixing ratios of O3 precursors NOx and VOCs. Therefore, it can be inferred that ozone pollution was caused by the combination of high levels of O3 precursors and strong radiation.
Table 1Summary of pollutant mixing ratios (unit: ppbv) and meteorological parameters for three cases of different ozone levels.

Statistical information of each species group of VOCs classified based on their chemical nature and composition is also shown in Table 1. In general, the mixing ratios of VOCs were highest in Case 2, followed by Case 1 and Case 3, with average total VOC mixing ratios of 25.31±6.16, 29.73±12.10 and 12.18±3.69 ppbv, respectively. During Case 1, OVOCs and alkanes accounted for the vast majority of total NMVOCs, reaching 36.3 % and 36.4 %, followed by alkenes (12.8 %), other VOCs (8.7 %) and aromatics (5.8 %). For Case 2, alkanes and OVOCs also dominated total NMVOCs (35.5 % and 31.6 %), followed by alkenes (12.1 %), other VOCs (11.1 %) and aromatics (9.7 %). During Case 3, OVOCs represented the largest contribution to total NMVOCs (33.8 %), followed by alkanes (30.1 %), other VOCs (14.4 %), alkenes (11.6 %) and aromatics (10.1 %). Table 2 shows the average mixing ratios and standard deviation of 54 VOCs including methane during the three cases. The key species in different groups were consistent in three cases; for example, ethane and propane were the two highest mixing ratio alkanes, the main alkene species were ethylene and acetylene, the highest concentrations in aromatics were benzene and toluene and HCHO and acetone were the dominant fraction in OVOCs.
Table 2Summary of the mixing ratios of measured VOCs (unit: pptv, except for ppbv of methane) in three cases and their maximum incremental reactivity (MIR; unit: g O3/g VOC, the ozone formation coefficient for VOC species in the maximum increment reactions of ozone).
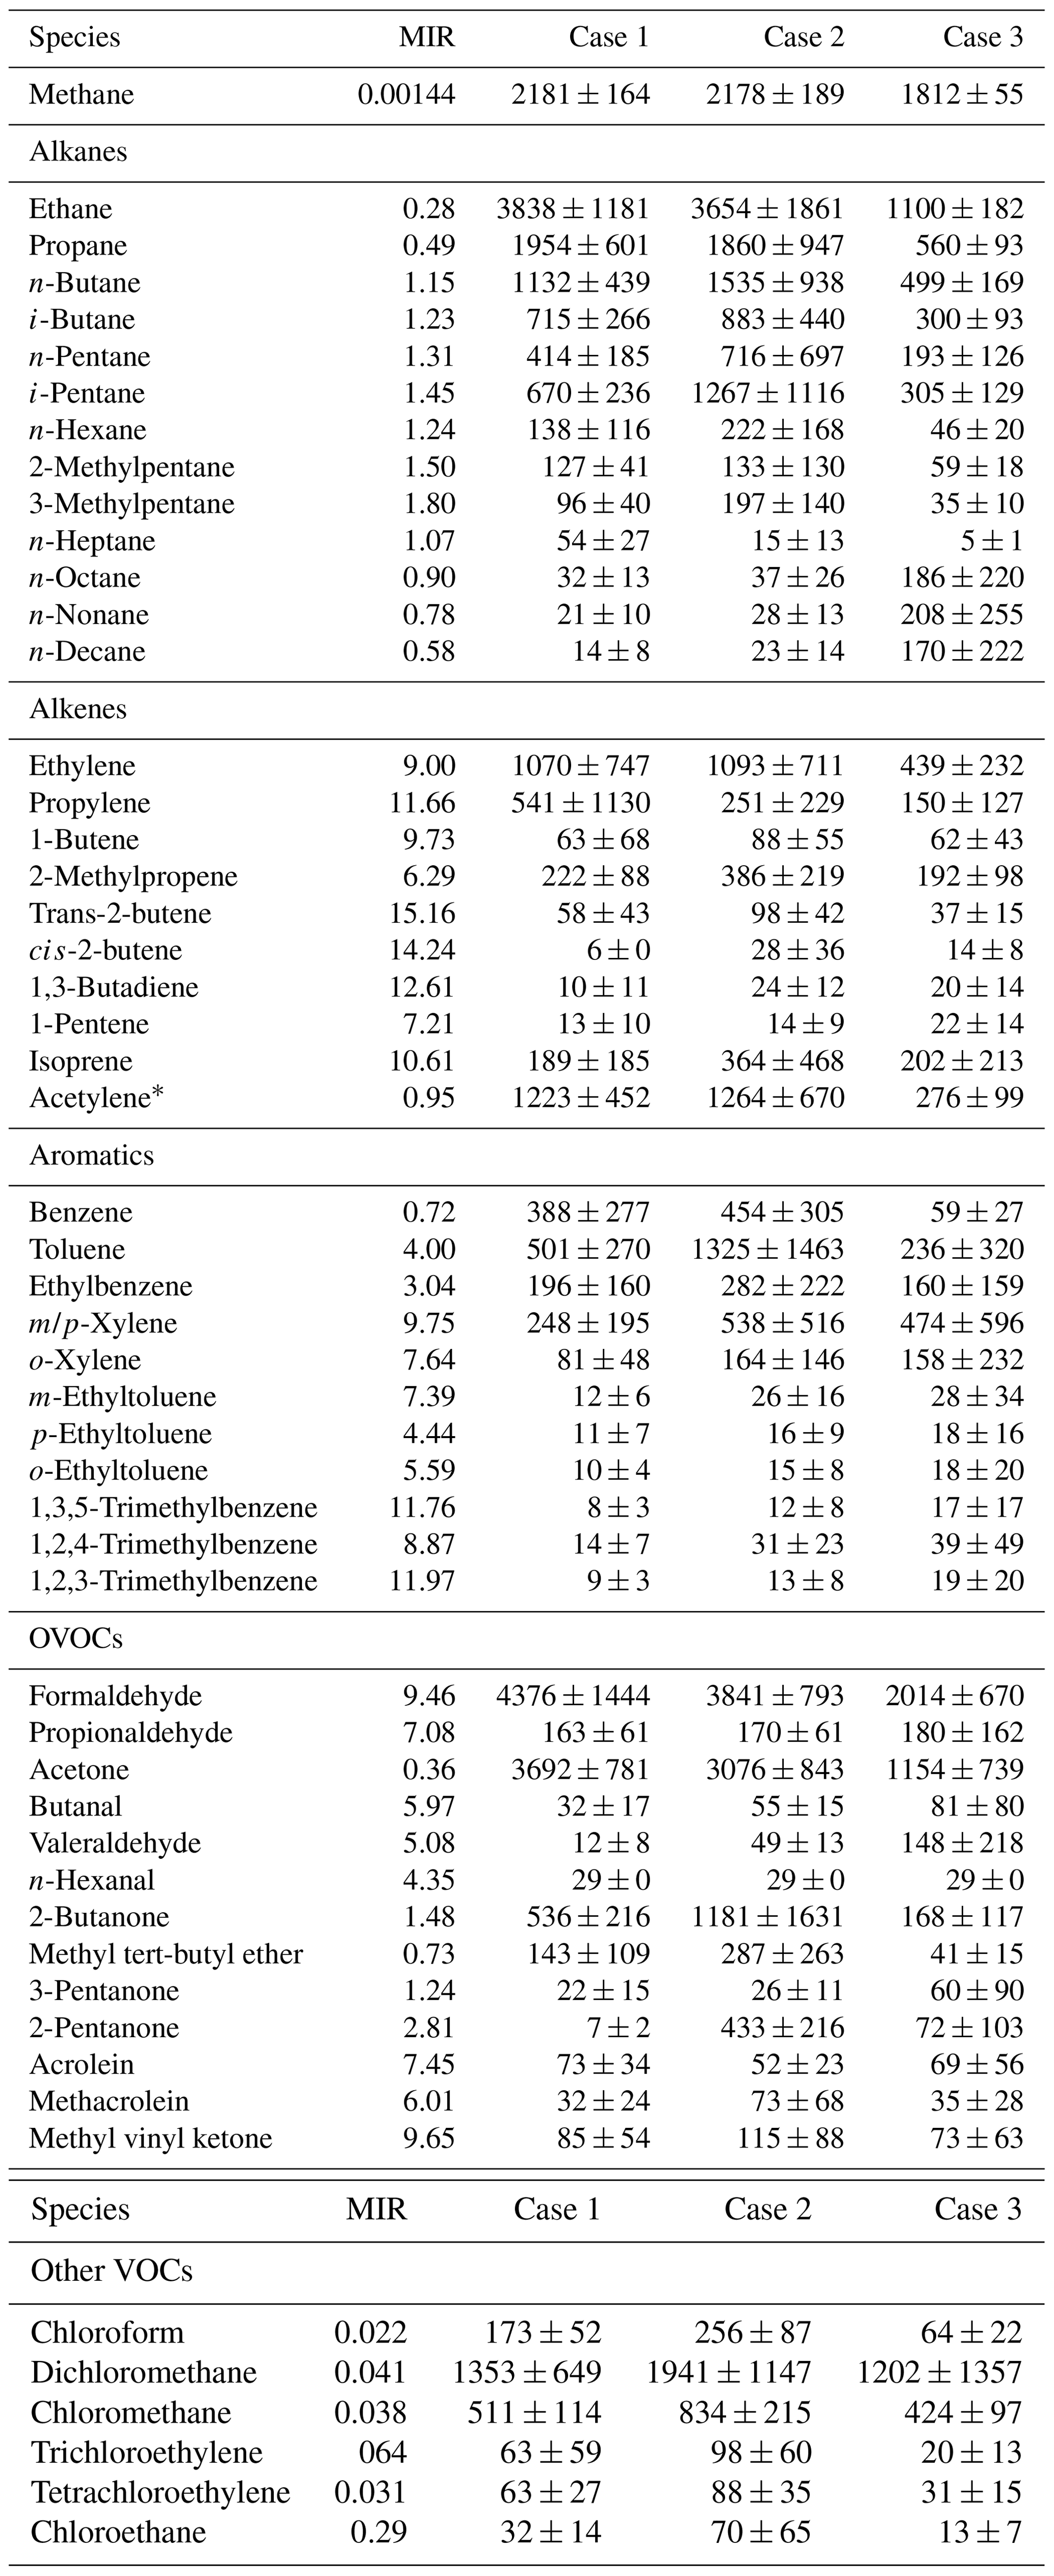
Note: Alcohols were not measured. * Due to acetylene being similar in nature to alkenes, acetylene is classified into the alkenes category. It should be noted that the reactivity of acetylene with OH is far less than that of alkenes with OH.
3.2 Atmospheric oxidation capacity and OH reactivity
According to Eq. (1), AOC during the three case periods was quantified based on the OBM, as shown in Fig. 2. The calculated maximum AOC for the three Cases was 1.0×10⁸, 9.1×10⁷ and 8.8×10⁷ molecules cm−3 s−1, respectively. Comparatively, these are much lower than those computed for Santiago de Chile, Chile, with a peak of 3.2×10⁸ molecules cm−3 s−1 (Elshorbany et al., 2009), but much higher than that in Berlin, Germany with 1.4×10⁷ molecules cm−3 s−1 (Geyer et al., 2001). It can be seen from Fig. 2 that the time profile of the AOC exhibits a diurnal variation, which is the same as the time series of the model calculated OH concentration and the observed , with a peak at noon. Daytime average AOC values were , and molecules cm−3 s−1, while nighttime average AOC value were , and molecules cm−3 s−1, for the three cases, respectively. These values were in line with the ozone levels, suggesting that atmospheric oxidation capacity during the ozone pollution period is greater than under clean conditions.
As expected, OH was calculated to be the main contributor to AOC. In the three cases, the average contribution of OH to AOC during the daytime was over 96 %. O3, as the second important oxidant, accounted for 1 %–3 % of the daytime AOC. The contribution of NO3 to nighttime AOC was , and molecules cm−3 s−1, respectively (or see Fig. S3). During Case 1 and 2 with relatively polluted conditions, NO3 became the primary oxidant in AOC, accounting for 48.3 % and 52.3 % of the nighttime AOC, respectively. It is worth noting that the chlorine atom produced by the photolysis of ClNO2 may also contribute to AOC (Bannan et al., 2015) , but unfortunately it has not been quantitatively characterized in this study. In general, OH dominated AOC during daytime and NO3 is the main oxidant at night, which is consistent with previous studies (Asaf et al., 2009; Elshorbany et al., 2009).
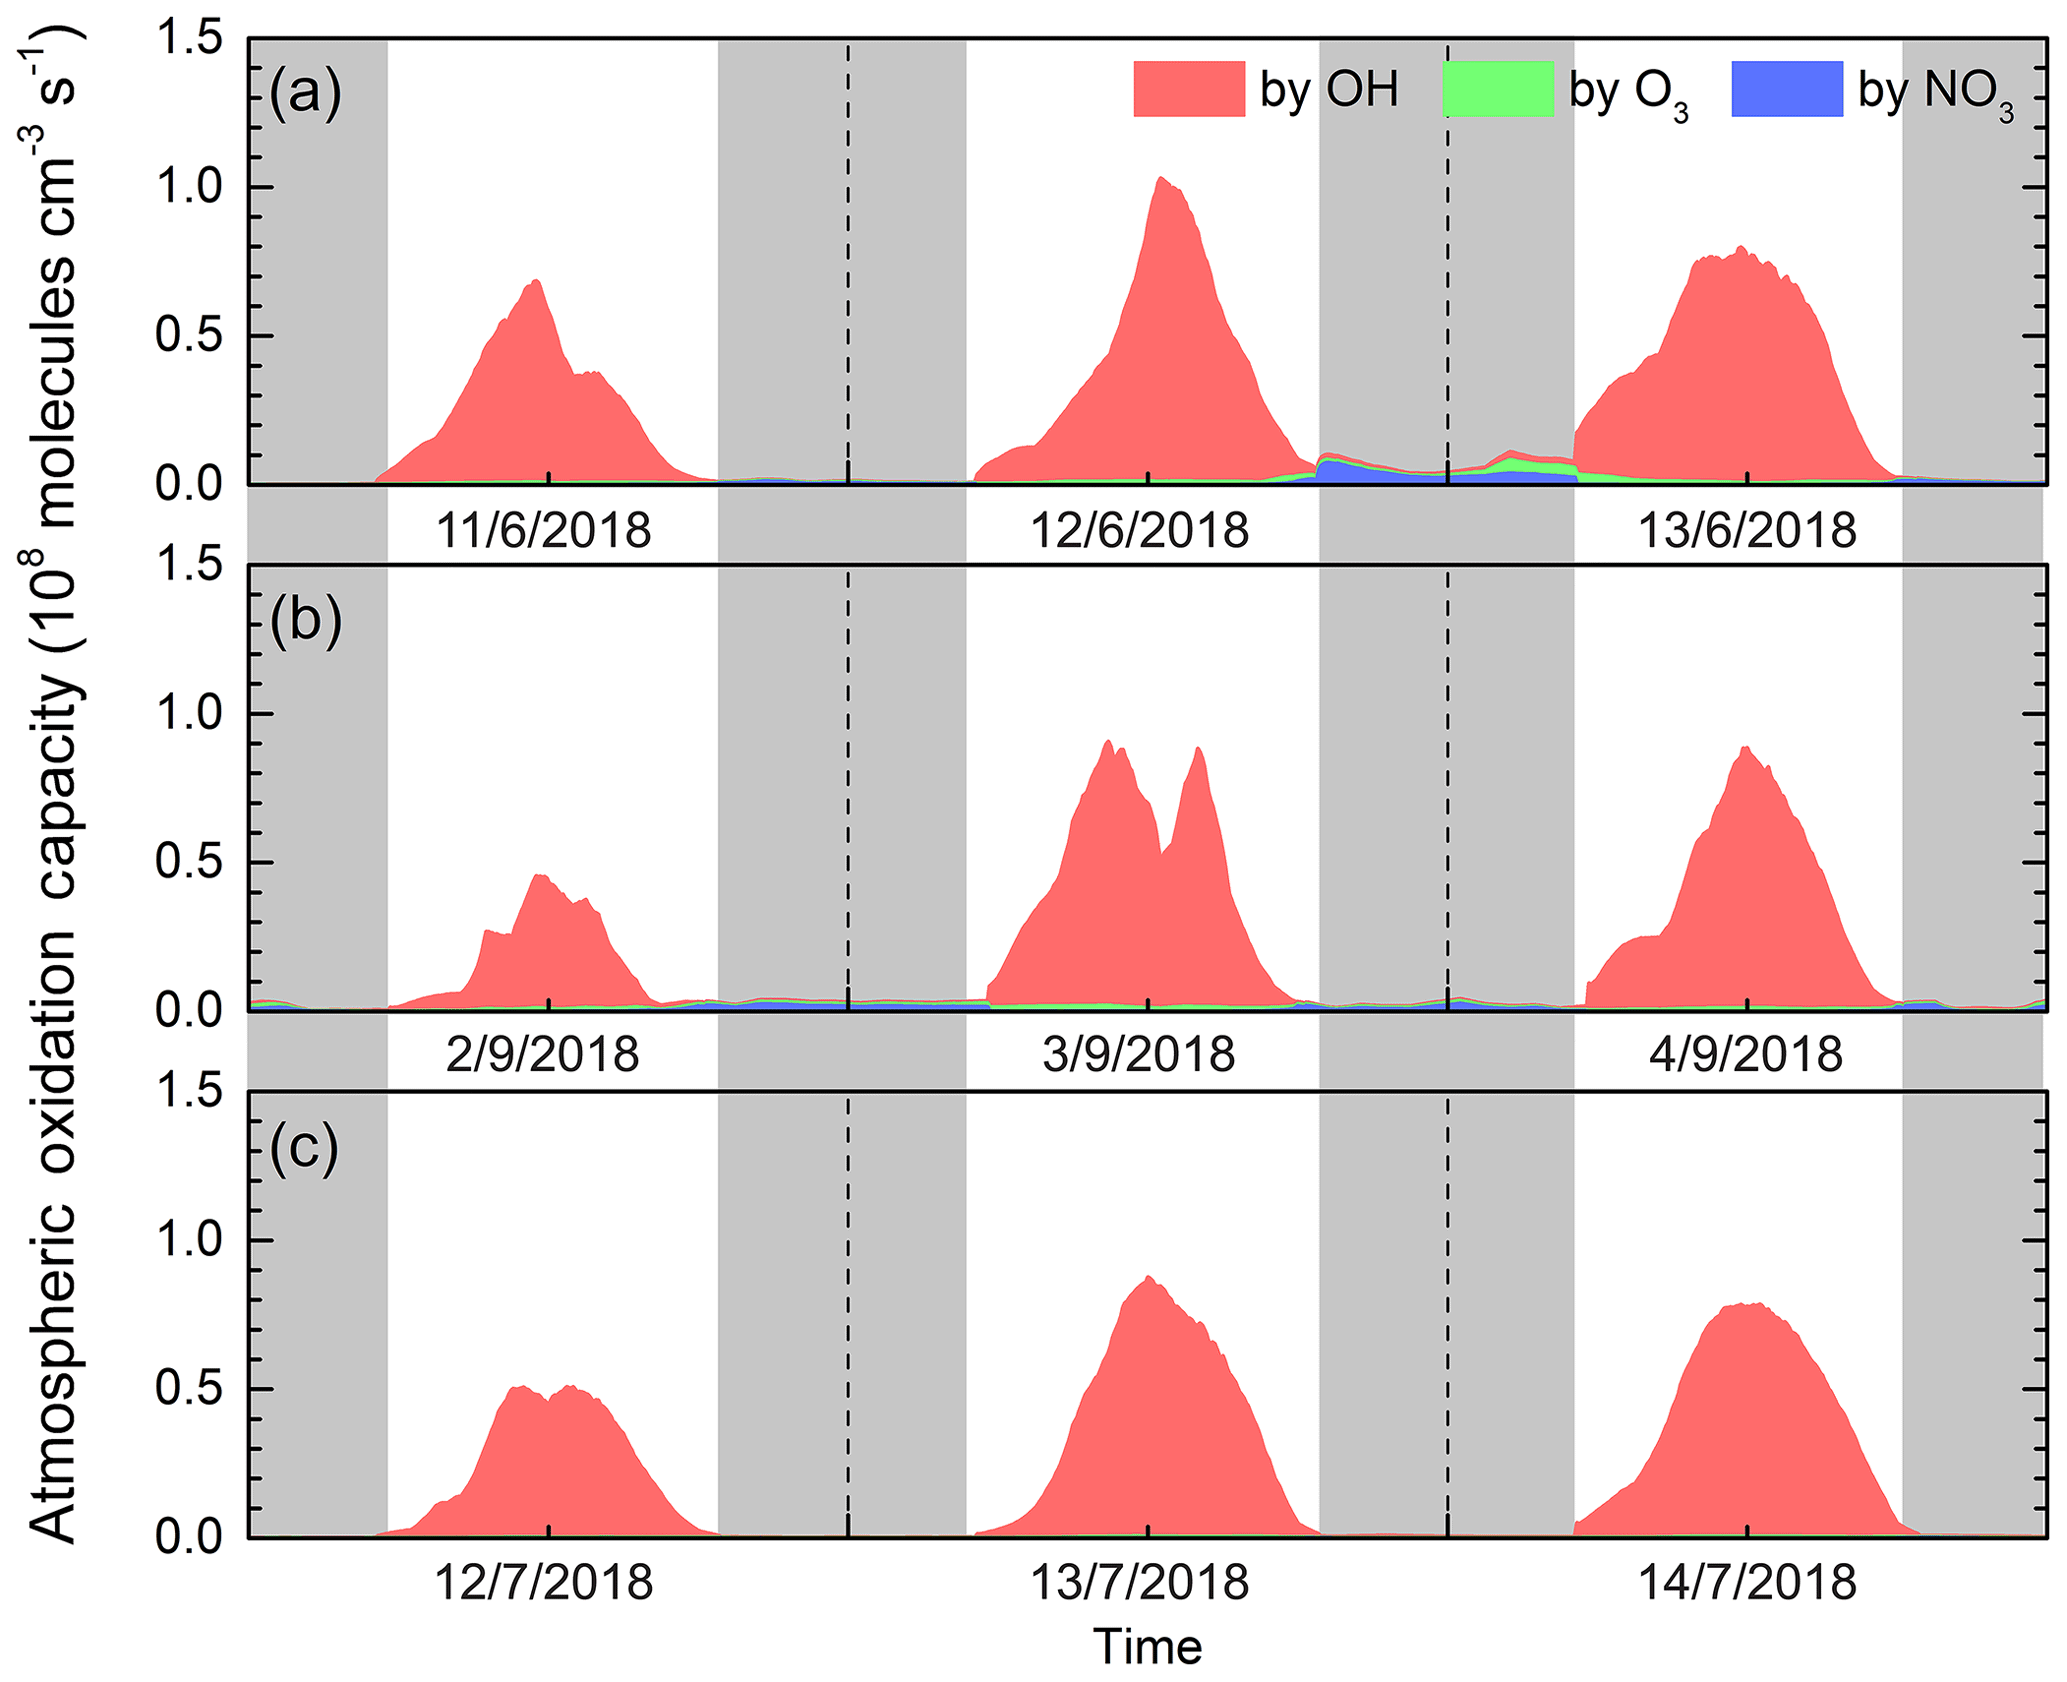
Figure 2Modeled daytime atmospheric oxidation capacity and contributions of major oxidants at an urban site of Shanghai during (a) Case 1, (b) Case 2 and (c) Case 3. The gray areas denote the nighttime periods.
We now evaluate the loss frequency of the different reactants to OH using the indicator of OH reactivity according to Eq. (2). The diurnal variations of OH reactivity calculated via the OBM are presented in Fig. 3, including the contribution from measured VOCs, NOx, CO and model-generated intermediate species during three cases. It is evident that the OH reactivity peaked in the morning, with maximum values of 19.61, 24.55 and 13.32 s−1 for three cases, respectively. This is due to the increased NOx during rush hour traffic (Sheehy et al., 2010). The average values in the three cases were 11.72±2.84, 13.45±4.25 and 7.56±1.52 s−1, respectively. The OH reactivity of Case 3 in the clean environment was significantly lower than that of Case 1 and Case 2, which is consistent with previous studies (Mao et al., 2010; Li et al., 2018). In general, the OH reactivity assessed in Shanghai was in the range of 4.6–25.0 s−1 under different air quality conditions, which was at a relatively low level compared to that calculated for other big cities in China such as Guangzhou (20–30 s−1), Chongqing (15–25 s−1) and Beijing (15–25 s−1; Tan et al., 2019b), reflecting that the abundance of pollutants in Shanghai is relatively lower compared to other metropolitan areas in China.
Total OH reactivity has been measured in many urban areas over the past two decades. Compared to studies in other regions, the estimated average OH reactivity in Shanghai was much lower than that in Paris (Dolgorouky et al., 2012), New York (Ren et al., 2003, 2006) and Tokyo (Yoshino et al., 2006), and was equivalent to Nashville (Kovacs et al., 2003), Houston (Mao et al., 2010) and London (Whalley et al., 2018). In addition, there are some differences between the actual measured values and the estimated values of OH reactivity as mentioned in previous studies, which may be attributed to missing OH reactivity that originates from secondary products such as other OVOCs and nitrates produced by photochemical reactions (Di Carlo et al., 2004; Yoshino et al., 2006; Dolgorouky et al., 2012). We also calculated the OH reactivity only considering the measured species, and the contribution of OVOCs to OH reactivity was 1.28, 1.43 and 0.82 s−1, while the OH reactivity of OVOCs was calculated by considering the simulated intermediate species was 1.77, 2.05 and 1.26 s−1 in three cases, respectively. These differences indicates unmeasured species and unknown secondary products contributed considerably to the actual OH reactivity.
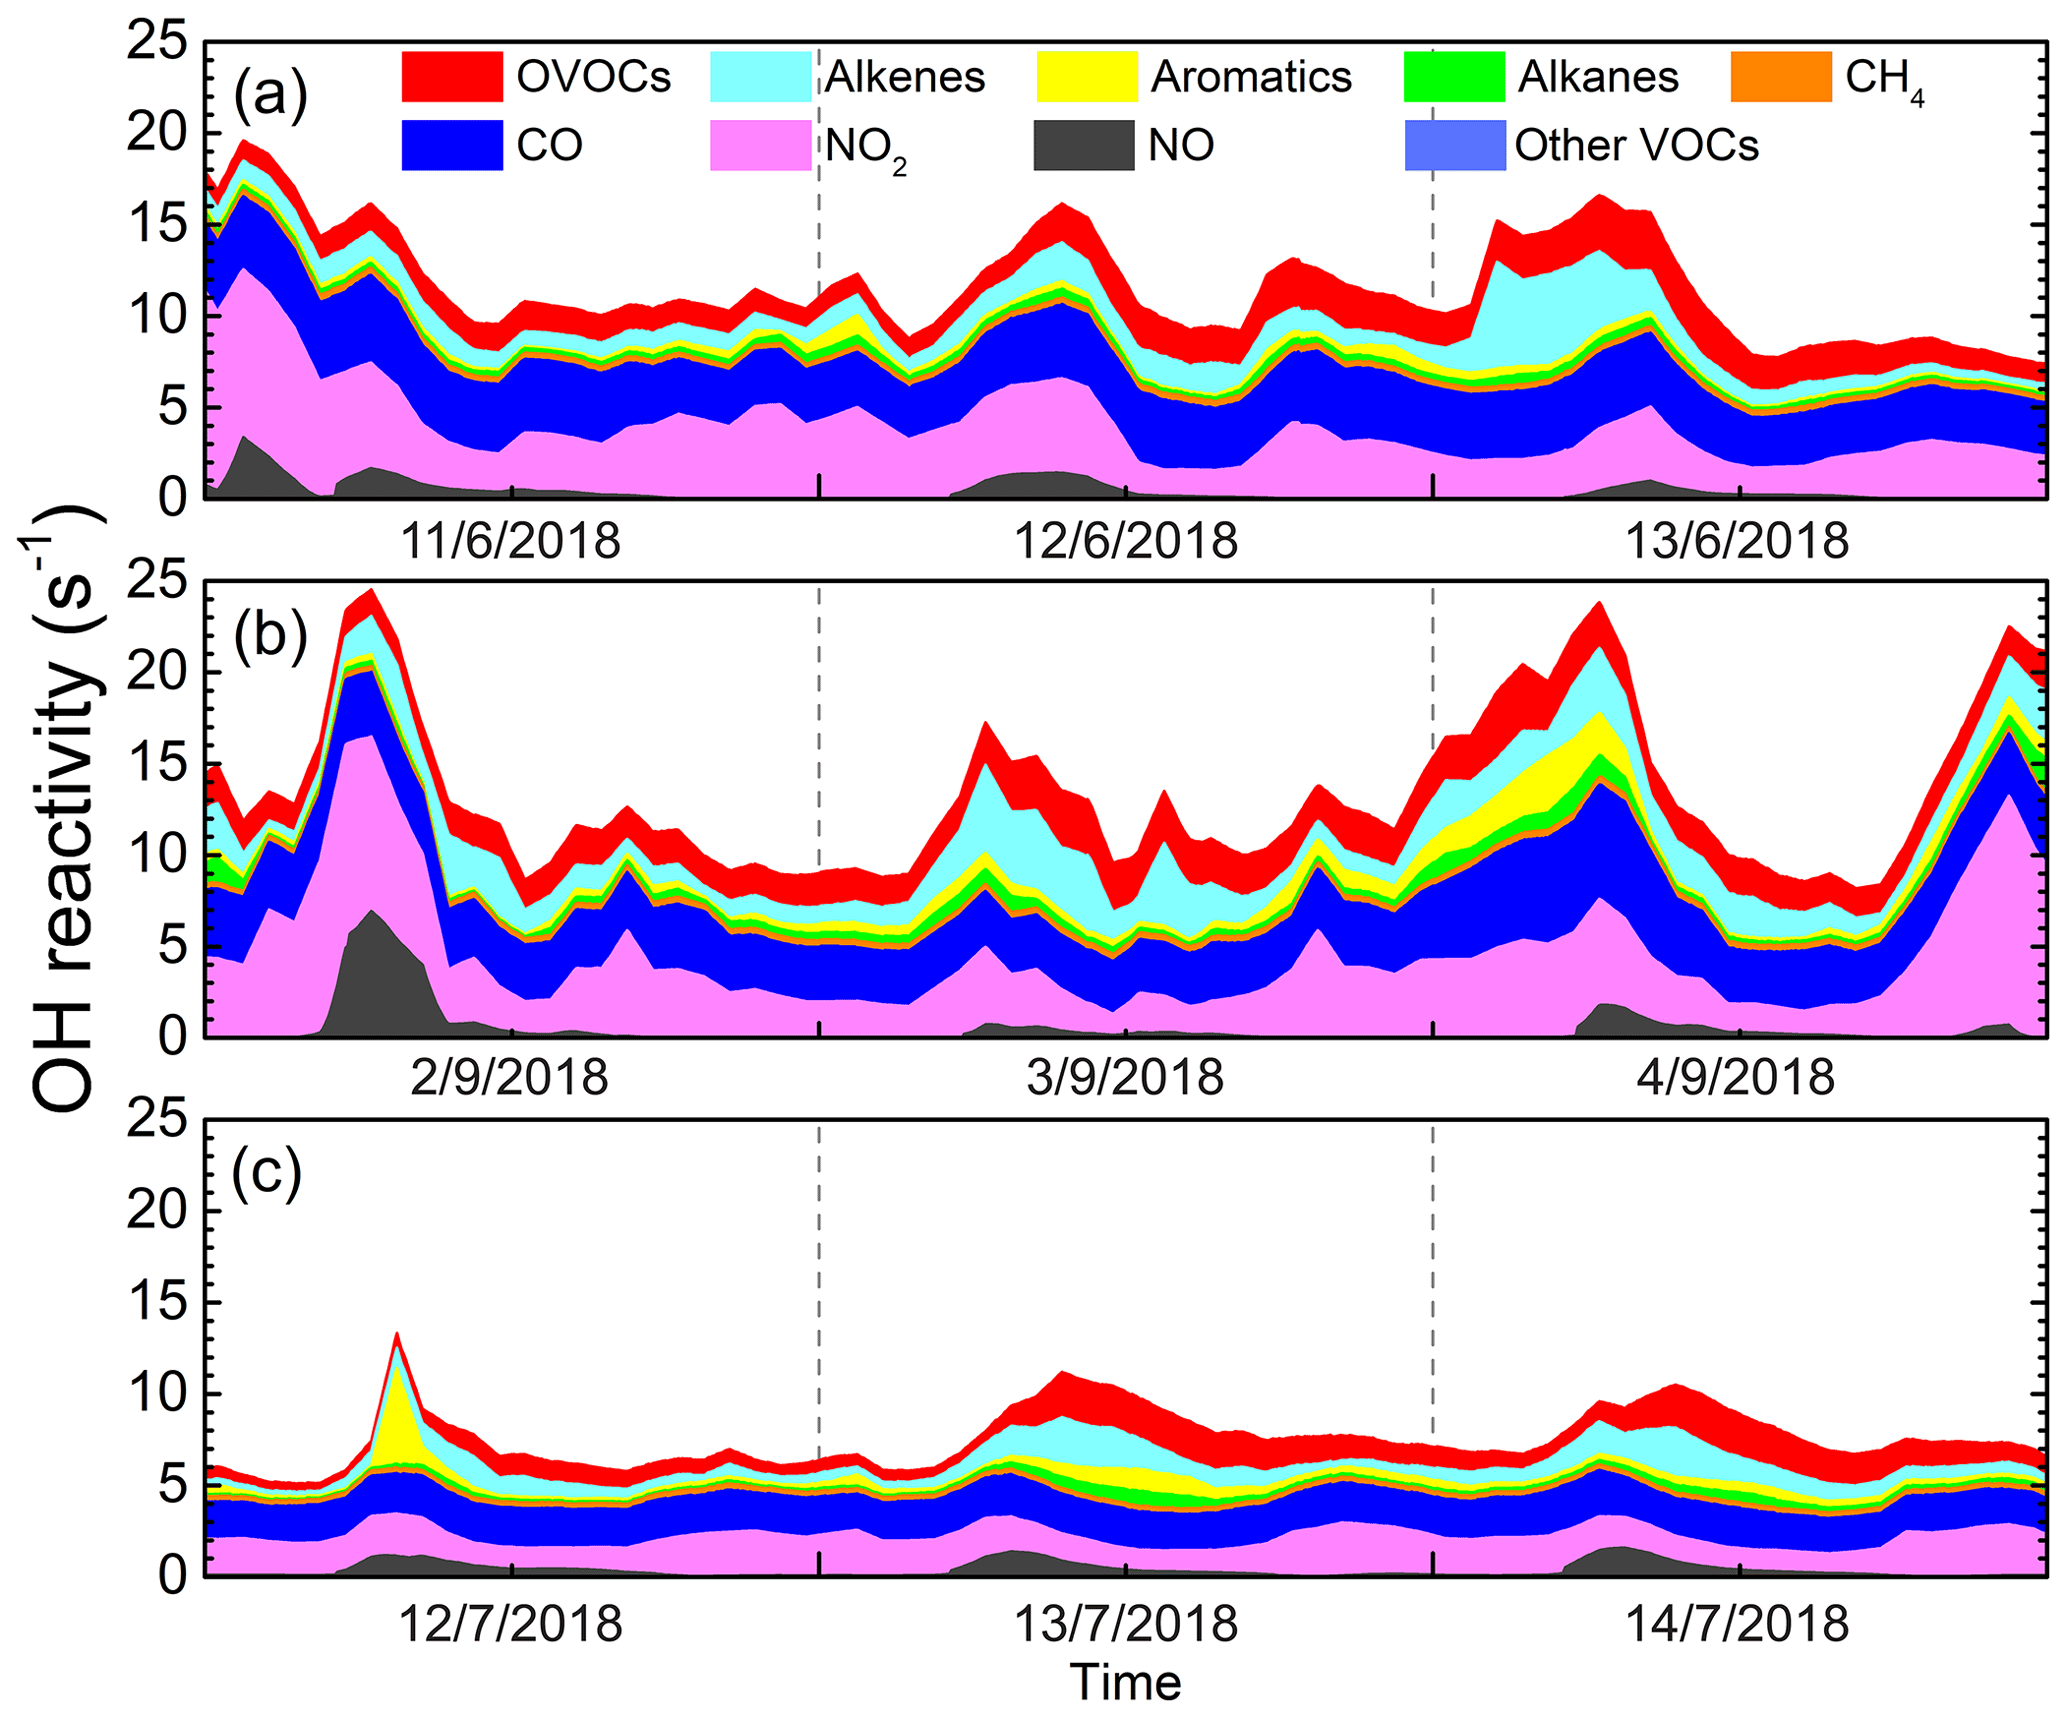
Figure 3Diurnal profiles of OH reactivity by oxidation of all measured reactant groups at an urban site of Shanghai during (a) Case 1, (b) Case 2 and (c) Case 3.
Figure 4a shows the average contribution of major groups of reactants to the total OH reactivity for three cases, including NMVOCs, NO2, NO, CO and CH4. Overall, NMVOCs, CO and NO2 are major contributors to OH reactivity, in line with past studies carried out in urban environments (Ling et al., 2014; Gilman et al., 2009). The remarkable contribution of CO to the total OH reactivity in Case 1 points to effective CO+OH and its significant contribution to ozone formation (Ling et al., 2014). The main difference in the composition of OH reactivity was that the absolute contribution of NMVOCs in Case 1 was about 1.45 times than that of Case 2, while the absolute contributions of CO and NOx to OH reactivity in Case 1 were comparable to those of Case 2. This is caused by the higher VOCs levels of 29.73±12.10 ppbv during Case 2 as compared to Case 1 of about 15 % lower. Since the mixing ratios of pollutants in Case 3 were quite low, the contribution of each reactant component to OH reactivity was much lower than the other cases.
Figure 4b also presents the detailed contribution of each NMVOC group to the total OH reactivity. It can be seen that the contribution of OVOCs to OH reactivity is predominant, accounting for 46.87 %, 40.79 % and 43.03 % of the total OH reactivity of NMVOCs in the three cases. The contribution rate of OVOCs to OH reactivity in Case 1 was 3 to 6 percentage points higher than Case 2 and Case 3, illustrating the importance of OVOCs in atmospheric photochemistry and ozone generation (Fuchs et al., 2017). The contribution of alkenes to OH reactivity was important in three cases, reaching about 36 %, which may be caused by the relatively higher contribution of alkenes emitted by motor vehicles at the urban site, indicating that ozone pollution was severely affected by vehicle emissions in Shanghai (Ling et al., 2014; Guo et al., 2013). The contribution of aromatics and alkanes to OH reactivity were comparable in the three periods, both in the range of 0.3–0.6 s−1, accounting for 10 %–20 %. The contribution of other VOCs to OH reactivity was negligible, with contributions of only 0.4 % or less. Tan et al. (2019b) also reported a comparable average OH reactivity of about 13.5 s−1 (kOH=13.45 s−1 in Case 2 this study) and a similar contribution distribution of OH reactivity during summer in Shanghai.
In summary, the mixing ratios of ozone precursors and their contribution to OH reactivity were found to be different in the three cases. To further investigate these differences, HOx budget, OH chain length and OFP (ozone formation potential) are discussed in depth in the following sections.
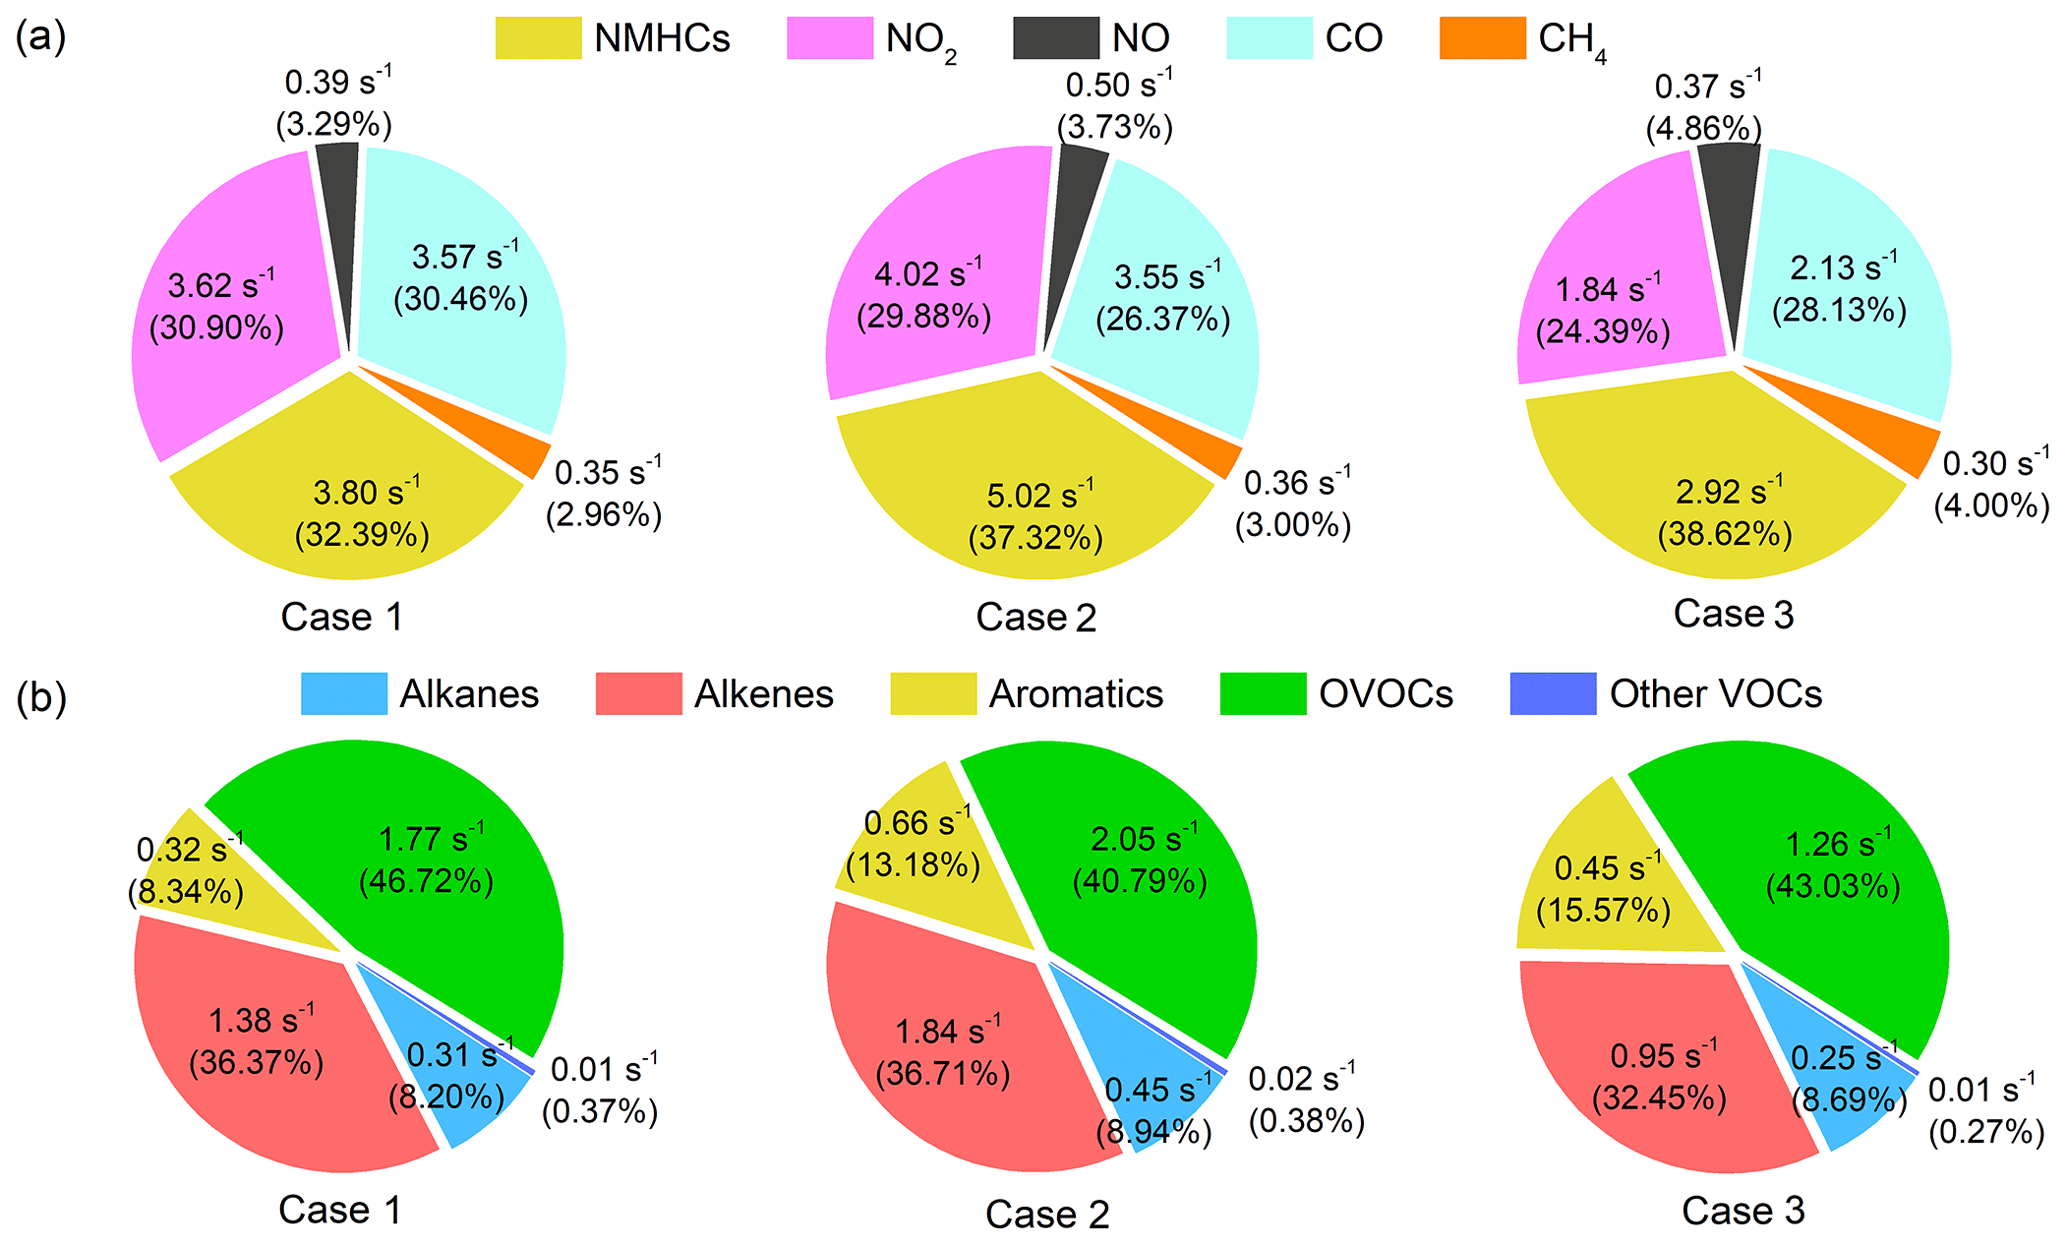
Figure 4(a) The average contribution of major groups of reactants to the total OH reactivity during the three cases. (b) The contribution of each NMVOC group to the OH reactivity of NMVOCs during three cases.
3.3 OH chain length and HOx budget
The OH chain length serves as an indicator for evaluating HOx cycling and is closely related to ozone production efficiency. The OH concentration and the terminal loss rate of OH by the reaction with NO2 were simulated by the OBM. The longer chain length means that more OH radicals are generated in the HOx cycling and more O3 is produced before the OH terminal reaction occurs (Mao et al., 2010; Ling et al., 2014). As a previous studies showed, the OH chain length began to rise in the morning and peaked at noon (Mao et al., 2010; Ling et al., 2014; Emmerson et al., 2007). As illustrated in Fig. 5, the OH chain lengths were all less than 8, with a peak at noon. Interestingly, it was found that the OH chain length peak in Case 1 appeared around 14:00 LT (UTC+8), coinciding with the observed NOx variability (see Fig. S1). The OH chain lengths for the three cases peaked at 6.3 in Case 3, followed by Case 2 (peak of 5.5) and Case 1 (peak of 4.1), the opposite of O3 levels (Table 1). This is due to the relatively higher NOx level in Case 1 (see Fig. S1), resulting in a relatively bigger sink of OH+NO2. In summary, the longer OH chain length in Case 3 indicated per NOx converted into HNO3 produces more O3, whereas the NOx mixing ratio in Case 3 is almost half that of Case 1 and 2 during daytime (see Fig. S1), causing the ozone mixing ratio to be lower than Case 1 and 2. In addition, previous studies also found that the OH chain length was the opposite of the ozone level, and gave the possible explanation also due to the lower NOx concentrations (Mao et al., 2010; Ling et al., 2014).
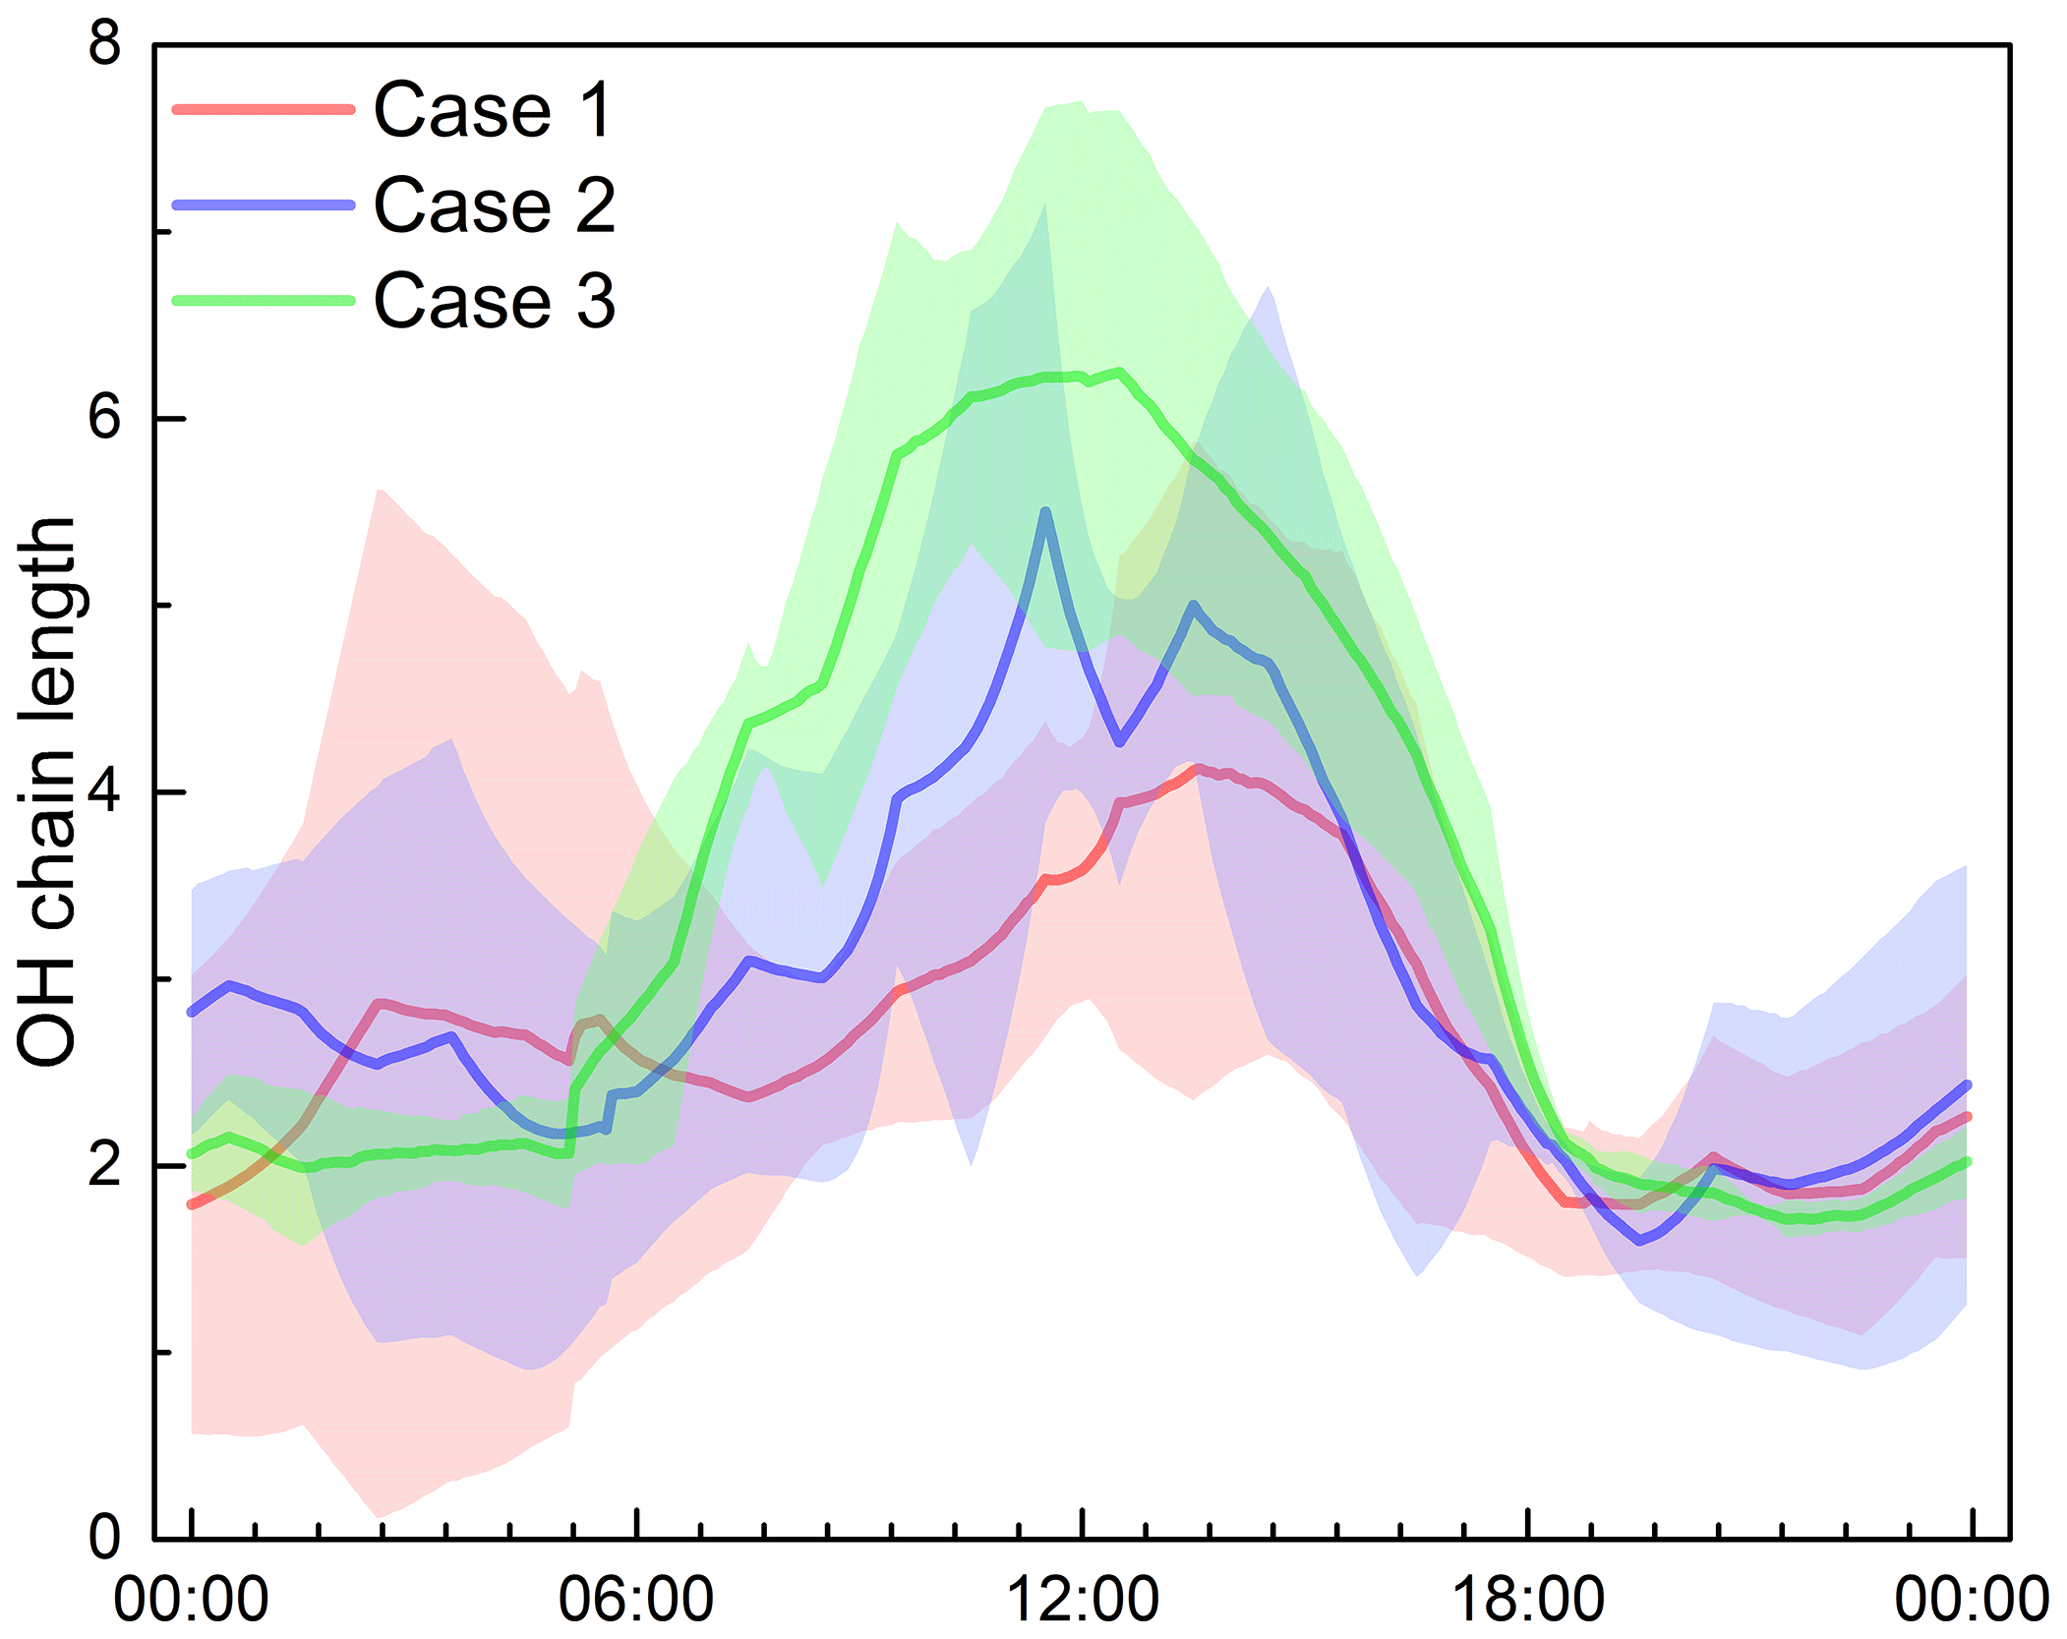
Figure 5Average diurnal profiles of OH chain length during three cases at an urban site of Shanghai. The shaded area indicates the standard deviation of OH chain length.
We calculated the primary sources of HOx, including the photolysis of O3, HONO, HCHO and other OVOCs, as well as the ozonolysis of alkenes, excluding parts (i.e., H2O2, CH3OOH) that contribute less to HOx (Mao et al., 2010; Ling et al., 2014; Sommariva et al., 2004) and any reactions in HOx cycling such as HO2+NO that dominate OH generation that are just the cycling between OH and HO2 (Mao et al., 2010). At the same time, the sinks of HOx were also simulated, including the reactions of OH+NO2, HO2+HO2 and HO2+RO2, and any reactions of HOx cycling as well as smaller contributing reactions were also excluded. These HOx production and loss pathways have been considered and well investigated in other studies and locations (Mao et al., 2010; Ling et al., 2014; Wang et al., 2018).
Figure 6 shows the diurnal variability of the main generation and loss pathways of HOx. It can be seen that the intensity of the sources and sinks of HOx was different, but the primary contributions to HOx budget of three cases were consistent, i.e., O3 photolysis and reaction of OH with NO2, respectively. The average generation rates of HOx were , and molecules cm−3 s−1, while the average loss rates were , and molecules cm−3 s−1, respectively. During the daytime, the biggest contribution to HOx production was ozone photolysis, around 40 % in Case 1 and Case 2, while HONO photolysis contributed 41.1 % in Case 3. This indicates that ozone photolysis dominates the production of HOx under high-ozone conditions, whereas photolysis of HONO is important at lower ozone concentrations (Wang et al., 2018; Ling et al., 2014; Ren et al., 2008). Additionally, the model results show that the photolysis of HCHO was also an important contributor to HOx production in the three cases, reaching 25.9 %, 22.9 % and 21.0 %, respectively (Ling et al., 2014; Liu et al., 2012; Lu et al., 2012; Mao et al., 2010).
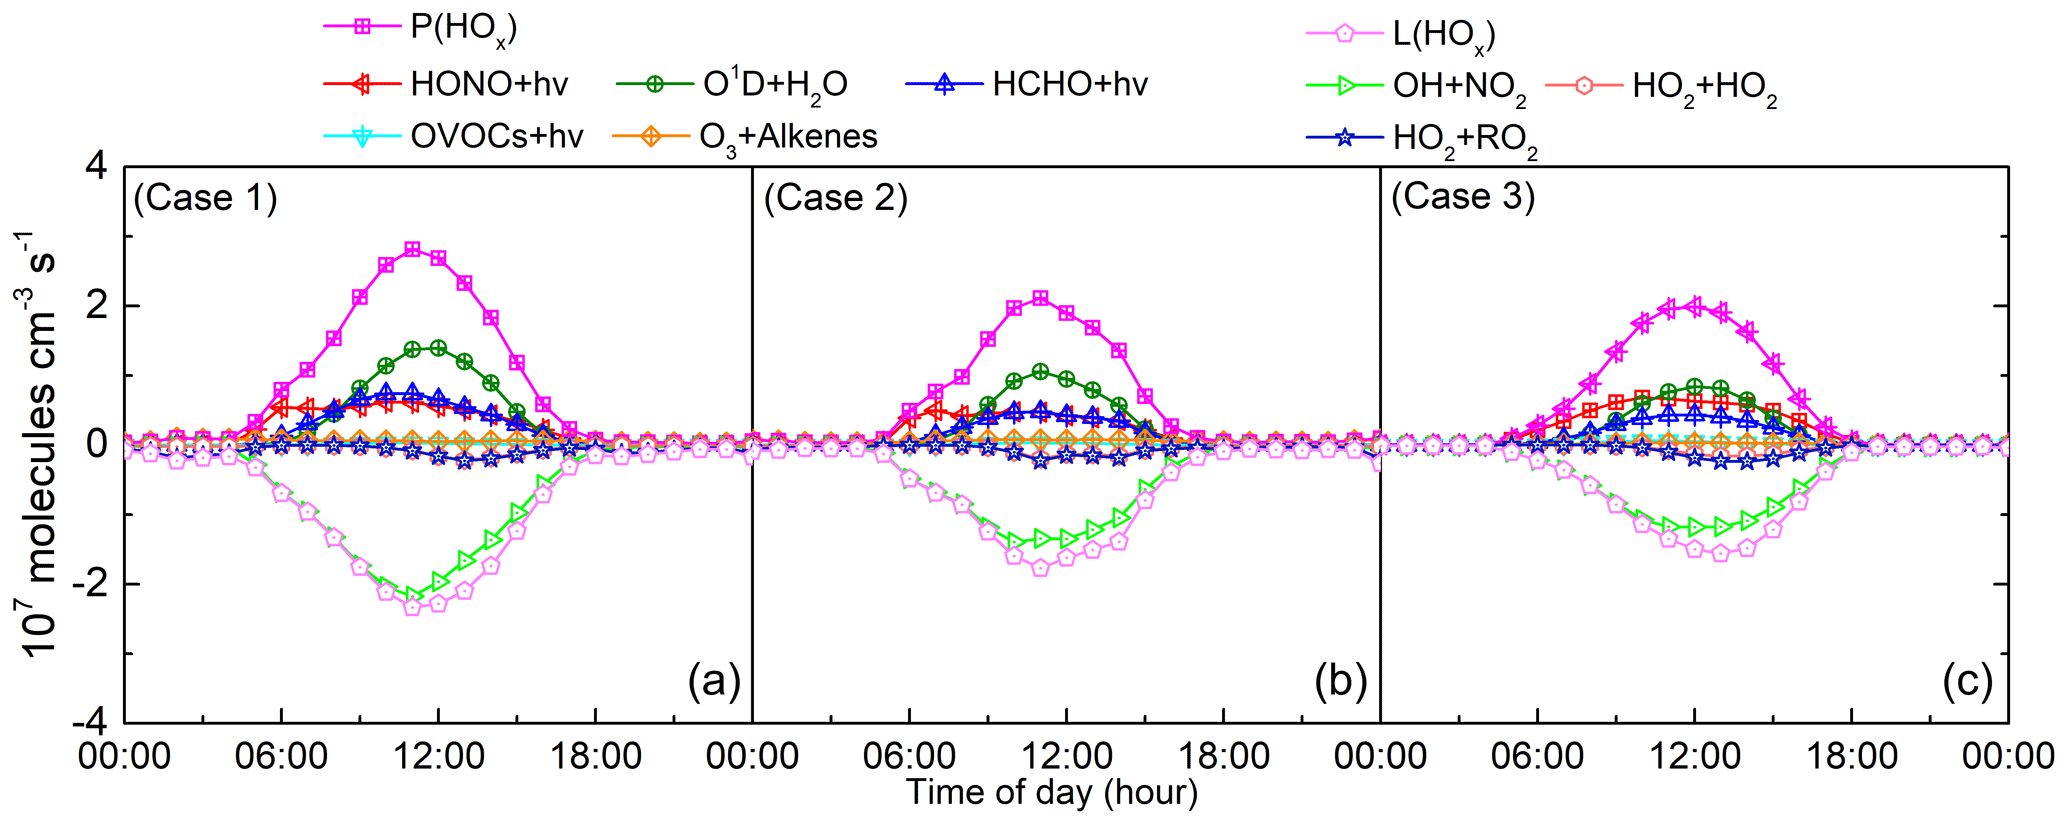
Figure 6The average diurnal profiles of HOx sources and sinks in (a) Case 1, (b) Case 2 and (c) Case 3 at an urban site of Shanghai.
Moreover, the diurnal profile of the HOx budget was explored. Before 09:00, 09:30 and 11:00 during the three cases, respectively, HONO photolysis dominated the production of HOx in the morning due to the accumulation of HONO at night. This is consistent with a previous report in Shanghai in July 2014 which found that the contribution of HONO photolysis could reach up to 80 % of HOx production in the morning (Chan et al., 2017). In addition, ClNO2 photolysis is also reported to be an important source of radicals in the morning (Young et al., 2012). In the afternoon, the HONO mixing ratio decreased with photolysis, O3 levels increased with the enhancement of photochemical intensity and O3 photolysis becomes the main contributor to HOx production. Note however that the contribution of HONO and HCHO photolysis are not negligible in the afternoon. The other two HOx formation pathways, OVOCs photolysis and alkenes ozonolysis, accounted for less than 5 % in the three cases.
For the HOx sink, the reaction of OH and NO2 was dominant all day, and its average contribution reached , and molecules cm−3 s−1, accounting for 89.11 %, 84.56 % and 83.29 % in three cases, respectively. In Case 2 and Case 3, the reaction of OH and NO2 dominates the sinks of HOx before 09:00 when NOx was at a high level due to rush hour traffic. However, the reaction of OH and NO2 completely dominated the HOx sinks from 05:30 to 11:00 in Case 1, almost constituting the entire HOx sinks, which indicates that the rush hour traffic was prolonged and the NOx was maintained at a high concentration. This is consistent with the fact that the peak of the OH chain length appears at 14:00 in Case 1, as mentioned above. The reaction with NO2 was the main sink of HOx, confirming that Eq. (3) of the OH chain length chosen in this study is appropriate. The reactions between radicals themselves such as HO2+HO2 and HO2+RO2 became more important for the contribution of HOx sinks in the afternoon for the three cases, in agreement with previous studies in other regions (Guo et al., 2013; Ling et al., 2014; Mao et al., 2010).
Regarding the model-simulated concentrations of OH and HO2, as shown in Fig. S4, the maximum concentrations of OH for three cases were 9.97×10⁶, 8.34×10⁶ and 10.3×10⁶ molecule cm−3, respectively, and the maximum concentrations of HO2 for three cases were 4.06×10⁸, 3.84×10⁸ and 3.41×10⁸ molecule cm−3, respectively. The previous simulated maximum concentrations of OH and HO2 for the urban site in Shanghai were 6.9×10⁶ and 1.9×10⁸ molecule cm−3 in summer, lower than the simulated results here probably because of the different atmospheric conditions (Tan et al., 2019b). Due to lack of measured values of HOx in Shanghai, we compared the measured values of other places in China. For instance, daily maximum concentrations were in the range of (4–17)×106 molecule cm−3 for OH and (2–24)×108 molecule cm−3 for HO2 at both the suburban site Yufa and rural site Wangdu during summer in the North China Plain (Lu et al., 2013; Tan et al., 2017). In autumn, maximum median radical concentrations of4.5×106 molecule cm−3 for OH at noon and 3×10⁸ molecule cm−3 for HO2 were reported for the Pearl River Delta in the early afternoon (Tan et al., 2019a). The simulated HOx concentrations in this study were comparable with the measured results of other places in China, suggesting the moderate abundance of the HOx radical in Shanghai.
3.4 Ozone formation potential
Different VOC species have a wide range of reactivity and different potentials for O3 formation, which can be calculated by the maximum incremental reactivity (MIR; Carter, 2010). The calculated ozone formation potential (OFP) of each VOC species is used to characterize the maximum contribution of the species to ozone formation (Bufalini and Dodge, 1983). The following equation is used to calculate the OFP for each VOC species (Schmitz et al., 2000; Ma et al., 2019):
where OFPi (ppbv) is the ozone formation potential of VOC species i, [VOCi] (ppbv) is the atmospheric mixing ratio of VOC species i, MIRi (g O3/g VOC, as listed in Table 1) is the ozone formation coefficient for VOC species i in the maximum increment reactions of ozone, Mozone and Mi are the molar mass (g mol−1) of O3 and VOC species i, respectively.
In this study, OFP was introduced to estimate the photochemical reactivity of VOCs. The comparison of the average mixing ratios of the five VOC groups and their OFP during three cases is shown in Fig. 7. VOC mixing ratios of Case 2 were higher than in Case 1 and Case 3, as was the OFP level of Case 2. However, it is obvious that the mixing ratio of the VOC group was not proportional to its OFP. The biggest contribution to VOCs mixing ratios here was alkanes (36.4 %) and OVOCs (36.3 %) in Case 1, while OVOCs (45.4 %), alkenes (25.2 %) and aromatics (18.6 %) were the top three contributing to OFP. In Case 2, the mixing ratio of total NMVOCs reached 29.73 ppbv, the main contributors of which were alkanes (accounting for 35.5 %) and OVOCs (31.6 %), while the top three contributions to total OFP (96.16 ppbv) were OVOCs (accounting for 36.1 %), aromatics (30.4 %) and alkenes (21.8 %). Our results are consistent with those reported for Beijing in summer 2006 where OVOCs (40 %), aromatics (28 %) and alkenes (20 %) were also the top three contributors (Duan et al., 2008). In Case 3, the NMVOCs mixing ratio (12.2 ppbv) and the corresponding OFP (53.7 ppbv) were both at a relatively lower level.
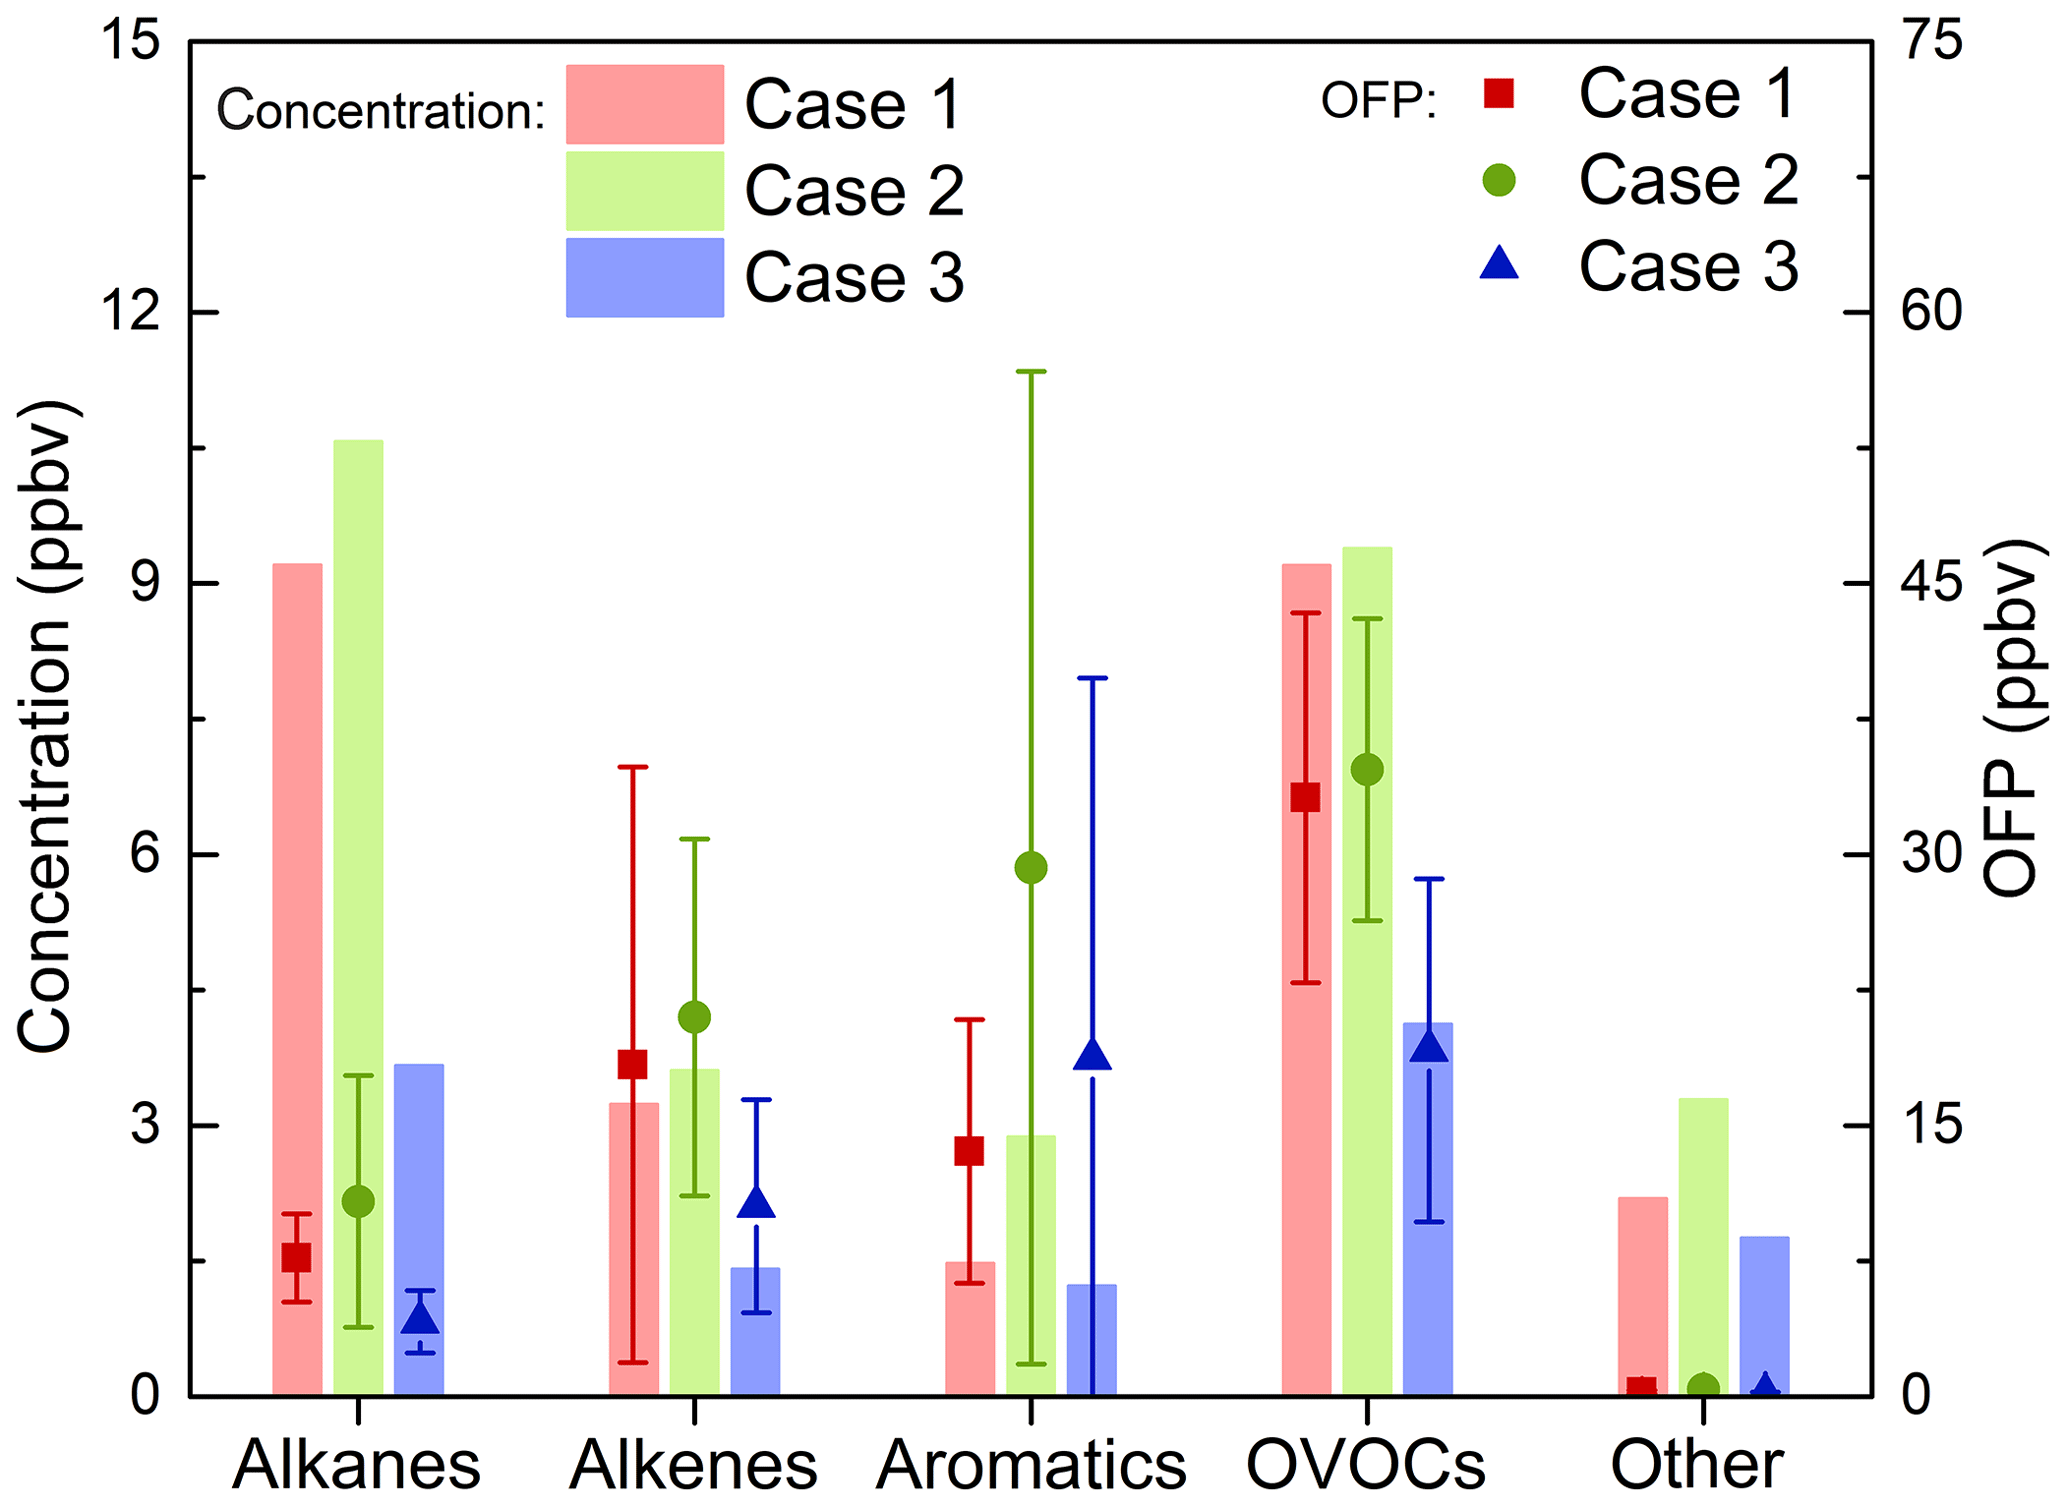
Figure 7Average mixing ratios and OFP (ozone formation potential) of five VOC groups for the three cases.
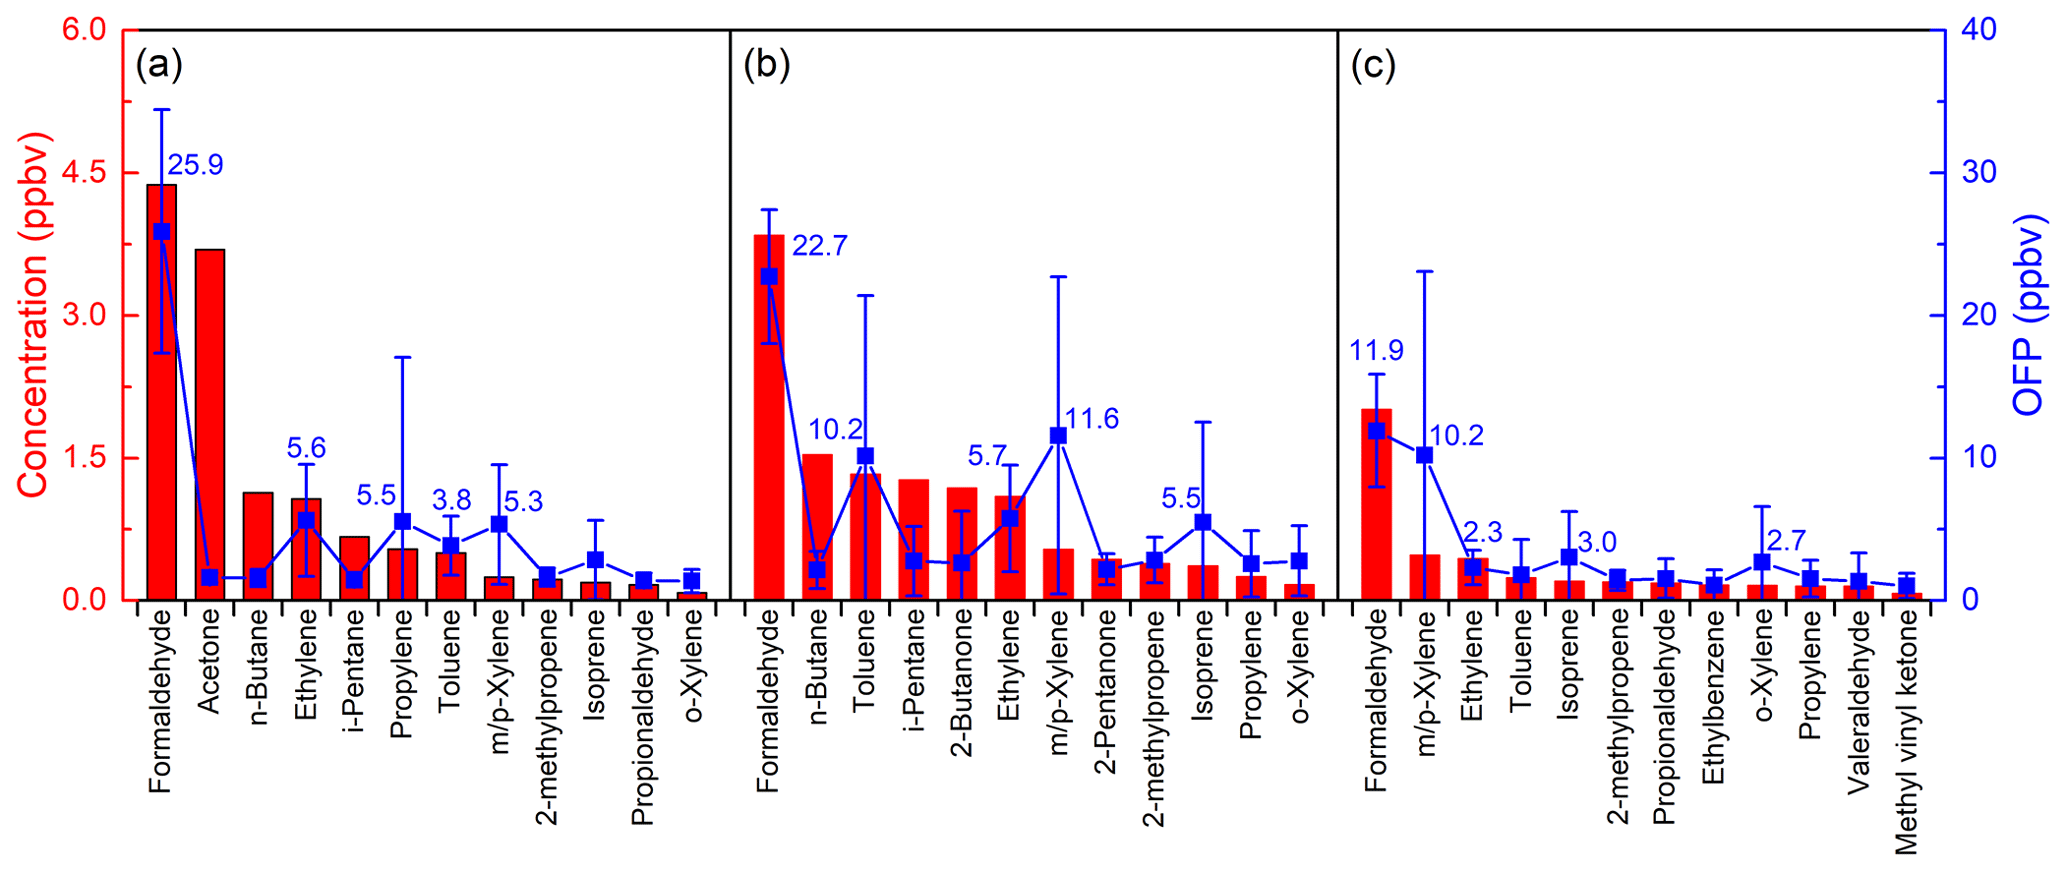
Figure 8The top 12 NMVOCs in ozone potential formation and their average mixing ratios during (a) Case 1, (b) Case 2 and (c) Case 3 at an urban site of Shanghai.
According to the comparison between VOC groups mixing ratios and their OFP in Case 1 and Case 2 with relatively high-ozone mixing ratios, alkanes and OVOCs were the most important contributors to NMVOCs in both cases. Although the mixing ratios of these two groups were comparable in both Case 1 and 2, the contribution of OVOCs to OFP was about 3.5 times that of alkanes, indicating that the reactivity of alkanes is so low that it contributes less to the formation of ozone than other groups. Conversely, OVOCs show significant contributions to ozone formation with higher mixing ratios leading to higher OFP. The contribution of aromatics to OFP reached 30.2 % in Case 2. At the same time, the contribution of alkenes to ozone generation cannot be ignored, and for example, it reached 26.7 % in Case 1. Due to the different composition profile of VOCs, the contribution of VOC to OFP is quite different in the other areas of China. For example, in Shenyang the top three contributors were aromatics (31.2 %), alkenes (25.7 %) and OVOCs (25.6 %; Ma et al., 2019); OVOCs (34.0 %–50.8 %) dominated OFP in Guangzhou (Yuan et al., 2012); alkenes (48.34 %) were the main contributor in Wuhan (Hui et al., 2018), while alkanes, alkenes and aromatics accounted for 57 %, 23 % and 20 % in Lanzhou, respectively (Jia et al., 2016).
The top 12 NMVOCs in OFP and their average mixing ratios during the three cases are shown in Fig. 8. These 12 species accounted for 50.90 %, 41.63 % and 36.33 % of the total NMVOCs observed and contributed about 79.57 %, 76.55 % and 75.73 % to the ozone formation in the three cases, respectively. As mentioned above, not all high-concentration species had substantial OFP contributions. As shown in Fig. 8, acetone was the third most abundant species in total NMVOCs, accounting for 14.6 % of the total NMVOCs mixing ratio, but it only contributed 2.2 % to total OFP in Case 1. And m/p-xylene ranked second in the contribution of OFP, accounting for 12.1 %, while it represents only 1.8 % of total NMVOCs mixing ratio in Case 2. The results show that HCHO was the most important OFP contributor, accounting for 35.6 %, 23.6 % and 22.1 % in each of the three cases, respectively. Under high-ozone mixing ratios during Case 1 and Case 2, four of the top five species contributing to OFP were the same, i.e., HCHO, toluene, ethylene and m/p-xylene, while the mixing ratio and OFP of these four species were at a lower level under the clean conditions in Case 3, indicating that these four species can play a very different role in ozone formation under different chemical conditions. These results are similar to the research in the Pearl River Delta region in 2006 where the top four contributions to OFP were isoprene, m/p-xylene, ethylene and toluene (Zheng et al., 2009). Additionally, it was found that the total mixing ratios of HCHO, toluene, ethylene and m/p-xylene accounted for only 23.5 %, 22.6 % and 26.0 % of the total NMVOCs, whereas the overall contribution of these four species to OFP was 55.7 %, 55.3 % and 49.8 % in the three cases, respectively. This suggests that controlling different key VOC components is effective in preventing ozone pollution episodes. For instance, by controlling the concentration of these four species in Case 1 to the level of Case 3 (reduced by 2.78 ppbv), the contribution of NMVOCs to OFP would be reduced by nearly 20 %.
We conducted a 5-month observational experiment at the Jiangwan Campus of Fudan University in Shanghai from May to September of 2018. Three cases with different ozone mixing ratios were selected for the investigation of atmospheric oxidation capacity and photochemical reactivity. Also, the OBM constrained by a full set of measurement data is applied to evaluate atmospheric oxidation and radical chemistry during the three cases. We presented atmospheric oxidation capacity, OH reactivity, OH chain length, HOx budget and the ozone formation potential of observed VOCs, and compared their similarities and differences under the three different scenarios. The atmospheric oxidation capacity was related to pollution levels during the observational period. The different levels of VOCs and NOx in the three cases resulted in differences in OH reactivity and subsequently in photochemical reactivity. The OH reactivity in Case 2 with a higher mixing ratio of ozone precursors (VOCs and NOx) was the strongest, and CO and alkenes dominated the OH loss. HONO photolysis in the morning and O3 photolysis in the afternoon dominated HOx sources. For the sinks of radicals, the reaction of OH with NO2 dominated HOx sinks all day, and HO2+HO2 and HO2+RO2 became important for HOx sinks under the increase of radical levels in the afternoon. Moreover, a longer OH chain length, commonly used to evaluate ozone production efficiency, was found in Case 3, meaning that per NOx converted into HNO3 produces more O3. Furthermore, according to the OFP calculated in the three cases, formaldehyde, toluene, ethylene and m/p-xylene were significant for ozone formation in Shanghai. Finally, we conclude that to develop effective O3 control strategies in Shanghai, the focus should be on controlling key VOC component emissions.
Data are available for scientific purposes upon request to the corresponding author.
The supplement related to this article is available online at: https://doi.org/10.5194/acp-20-1217-2020-supplement.
JZ and SW designed and implemented the research, and prepared the manuscript; HW, SJ and SL contributed to the VOC and photolysis frequency of NO2 measurements; AS and BZ provided constructive comments and support for the DOAS measurements and observation-based model simulation in this study.
The authors declare that they have no conflict of interest.
We thank all participants of the field campaign for their contribution and Likun Xue's group (Shangdong University) for the cooperation in the OBM MCM simulations. We also would like to thank the two anonymous reviewers for their insightful and constructive comments.
This research has been supported by the National Key Research and Development Program of China (grant nos. 2017YFC0210002, 2016YFC0200401 and 2018YFC0213801), the National Natural Science Foundation of China (grant nos. 41775113, 21777026 and 21607104), the Shanghai Pujiang Talent Program (grant no. 17PJC015), and the Shanghai Rising-Star Program (grant no. 18QA1403600). This work was also funded by The Program for Professor of Special Appointment (Eastern Scholar) at Shanghai Institutions of Higher Learning and Shanghai Thousand Talents Program.
This paper was edited by Jianzhong Ma and reviewed by two anonymous referees.
Alicke, B., Platt, U., and Stutz, J.: Impact of nitrous acid photolysis on the total hydroxyl radical budget during the Limitation of Oxidant Production/Pianura Padana Produzione di Ozono study in Milan, J. Geophys. Res.-Atmos., 107, 8196, https://doi.org/10.1029/2000jd000075, 2002.
Asaf, D., Pedersen, D., Matveev, V., Peleg, M., Kern, C., Zingler, J., Platt, U., and Luria, M.: Long-term measurements of NO3 radical at a semiarid urban site: 1. Extreme concentration events and their oxidation capacity, Environ. Sci. Technol., 43, 9117–9123, https://doi.org/10.1021/es900798b, 2009.
Bannan, T. J., Booth, A. M., Bacak, A., Muller, J. B. A., Leather, K. E., Le Breton, M., Jones, B., Young, D., Coe, H., Allan, J., Visser, S., Slowik, J. G., Furger, M., Prévôt, A. S. H., Lee, J., Dunmore, R. E., Hopkins, J. R., Hamilton, J. F., Lewis, A. C., Whalley, L. K., Sharp, T., Stone, D., Heard, D. E., Fleming, Z. L., Leigh, R., Shallcross, D. E., and Percival, C. J.: The first UK measurements of nitryl chloride using a chemical ionization mass spectrometer in central London in the summer of 2012, and an investigation of the role of Cl atom oxidation, J. Geophys. Res.-Atmos., 120, 5638–5657, https://doi.org/10.1002/2014jd022629, 2015.
Bufalini, J. J. and Dodge, M. C.: Ozone-forming potential of light saturated hydrocarbons, Environ. Sci. Technol., 17, 308–311, https://doi.org/10.1021/es00111a013, 1983.
Carter, W. P.: Updated maximum incremental reactivity scale and hydrocarbon bin reactivities for regulatory applications, California Air Resources Board Contract, 07-339, 2010.
Chan, K. L., Wang, S., Liu, C., Zhou, B., Wenig, M. O., and Saiz-Lopez, A.: On the summertime air quality and related photochemical processes in the megacity Shanghai, China, Sci. Total Environ., 580, 974–983, https://doi.org/10.1016/j.scitotenv.2016.12.052, 2017.
Cheng, H., Guo, H., Wang, X., Saunders, S. M., Lam, S. H., Jiang, F., Wang, T., Ding, A., Lee, S., and Ho, K. F.: On the relationship between ozone and its precursors in the Pearl River Delta: application of an observation-based model (OBM), Environ. Sci. Pollut. Res., 17, 547–560, https://doi.org/10.1007/s11356-009-0247-9, 2010.
Ministry of Environmental Protection of the People's Republic of China: Ambient air quality standards (GB3095-2012), Chinese Environmental Science Press, Beijing, China, 2012 (in Chinese).
Coates, J., Mar, K. A., Ojha, N., and Butler, T. M.: The influence of temperature on ozone production under varying NOx conditions – a modelling study, Atmos. Chem. Phys., 16, 11601–11615, https://doi.org/10.5194/acp-16-11601-2016, 2016.
Di Carlo, P., Brune, W. H., Martinez, M., Harder, H., Lesher, R., Ren, X., Thornberry, T., Carroll, M. A., Young, V., and Shepson, P. B.: Missing OH reactivity in a forest: Evidence for unknown reactive biogenic VOCs, Science, 304, 722–725, https://doi.org/10.1126/science.1094392, 2004.
Dolgorouky, C., Gros, V., Sarda-Esteve, R., Sinha, V., Williams, J., Marchand, N., Sauvage, S., Poulain, L., Sciare, J., and Bonsang, B.: Total OH reactivity measurements in Paris during the 2010 MEGAPOLI winter campaign, Atmos. Chem. Phys., 12, 9593–9612, https://doi.org/10.5194/acp-12-9593-2012, 2012.
Duan, J., Tan, J., Yang, L., Wu, S., and Hao, J.: Concentration, sources and ozone formation potential of volatile organic compounds (VOCs) during ozone episode in Beijing, Atmos. Res., 88, 25–35, https://doi.org/10.1016/j.atmosres.2007.09.004, 2008.
Elshorbany, Y. F., Kurtenbach, R., Wiesen, P., Lissi, E., Rubio, M., Villena, G., Gramsch, E., Rickard, A. R., Pilling, M. J., and Kleffmann, J.: Oxidation capacity of the city air of Santiago, Chile, Atmos. Chem. Phys., 9, 2257–2273, https://doi.org/10.5194/acp-9-2257-2009, 2009.
Emmerson, K. M., Carslaw, N., Carslaw, D. C., Lee, J. D., McFiggans, G., Bloss, W. J., Gravestock, T., Heard, D. E., Hopkins, J., Ingham, T., Pilling, M. J., Smith, S. C., Jacob, M., and Monks, P. S.: Free radical modelling studies during the UK TORCH Campaign in Summer 2003, Atmos. Chem. Phys., 7, 167–181, https://doi.org/10.5194/acp-7-167-2007, 2007.
Feng, T., Zhao, S., Bei, N., Wu, J., Liu, S., Li, X., Liu, L., Qian, Y., Yang, Q., Wang, Y., Zhou, W., Cao, J., and Li, G.: Secondary organic aerosol enhanced by increasing atmospheric oxidizing capacity in Beijing–Tianjin–Hebei (BTH), China, Atmos. Chem. Phys., 19, 7429–7443, https://doi.org/10.5194/acp-19-7429-2019, 2019.
Fuchs, H., Tan, Z., Lu, K., Bohn, B., Broch, S., Brown, S. S., Dong, H., Gomm, S., Häseler, R., He, L., Hofzumahaus, A., Holland, F., Li, X., Liu, Y., Lu, S., Min, K.-E., Rohrer, F., Shao, M., Wang, B., Wang, M., Wu, Y., Zeng, L., Zhang, Y., Wahner, A., and Zhang, Y.: OH reactivity at a rural site (Wangdu) in the North China Plain: contributions from OH reactants and experimental OH budget, Atmos. Chem. Phys., 17, 645–661, https://doi.org/10.5194/acp-17-645-2017, 2017.
Gao, W., Tie, X., Xu, J., Huang, R., Mao, X., Zhou, G., and Chang, L.: Long-term trend of O3 in a mega City (Shanghai), China: Characteristics, causes, and interactions with precursors, Sci. Total Environ., 603, 425–433, https://doi.org/10.1016/j.scitotenv.2017.06.099, 2017.
Geng, F., Tie, X., Xu, J., Zhou, G., Peng, L., Gao, W., Tang, X., and Zhao, C.: Characterizations of ozone, NOx, and VOCs measured in Shanghai, China, Atmos. Environ., 42, 6873–6883, https://doi.org/10.1016/j.atmosenv.2008.05.045, 2008.
Geyer, A., Alicke, B., Konrad, S., Schmitz, T., Stutz, J., and Platt, U.: Chemistry and oxidation capacity of the nitrate radical in the continental boundary layer near Berlin, J. Geophys. Res.-Atmos., 106, 8013–8025, https://doi.org/10.1029/2000jd900681, 2001.
Gilman, J. B., Kuster, W. C., Goldan, P. D., Herndon, S. C., Zahniser, M. S., Tucker, S. C., Brewer, W. A., Lerner, B. M., Williams, E. J., Harley, R. A., Fehsenfeld, F. C., Warneke, C., and de Gouw, J. A.: Measurements of volatile organic compounds during the 2006 TexAQS/GoMACCS campaign: Industrial influences, regional characteristics, and diurnal dependencies of the OH reactivity, J. Geophys. Res.-Atmos., 114, D00F06, https://doi.org/10.1029/2008jd011525, 2009.
Guo, H., Jiang, F., Cheng, H. R., Simpson, I. J., Wang, X. M., Ding, A. J., Wang, T. J., Saunders, S. M., Wang, T., Lam, S. H. M., Blake, D. R., Zhang, Y. L., and Xie, M.: Concurrent observations of air pollutants at two sites in the Pearl River Delta and the implication of regional transport, Atmos. Chem. Phys., 9, 7343–7360, https://doi.org/10.5194/acp-9-7343-2009, 2009.
Guo, H., Ling, Z. H., Cheung, K., Jiang, F., Wang, D. W., Simpson, I. J., Barletta, B., Meinardi, S., Wang, T. J., Wang, X. M., Saunders, S. M., and Blake, D. R.: Characterization of photochemical pollution at different elevations in mountainous areas in Hong Kong, Atmos. Chem. Phys., 13, 3881–3898, https://doi.org/10.5194/acp-13-3881-2013, 2013.
Hofzumahaus, A., Rohrer, F., Lu, K., Bohn, B., Brauers, T., Chang, C.-C., Fuchs, H., Holland, F., Kita, K., and Kondo, Y.: Amplified trace gas removal in the troposphere, Science, 324, 1702–1704, https://doi.org/10.1126/science.1164566, 2009.
Hui, L., Liu, X., Tan, Q., Feng, M., An, J., Qu, Y., Zhang, Y., and Jiang, M.: Characteristics, source apportionment and contribution of VOCs to ozone formation in Wuhan, Central China, Atmos. Environ., 192, 55–71, https://doi.org/10.1016/j.atmosenv.2018.08.042, 2018.
Hui, L., Liu, X., Tan, Q., Feng, M., An, J., Qu, Y., Zhang, Y., and Cheng, N.: VOC characteristics, sources and contributions to SOA formation during haze events in Wuhan, Central China, Sci. Total Environ., 650, 2624–2639, https://doi.org/10.1016/j.scitotenv.2018.10.029, 2019.
Jenkin, M. E. and Clemitshaw, K. C.: Ozone and other secondary photochemical pollutants: chemical processes governing their formation in the planetary boundary layer, Atmos. Environ., 34, 2499–2527, https://doi.org/10.1016/S1352-2310(99)00478-1, 2000.
Jenkin, M. E., Saunders, S. M., and Pilling, M. J.: The tropospheric degradation of volatile organic compounds: a protocol for mechanism development, Atmos. Environ., 31, 81–104, https://doi.org/10.1016/S1352-2310(96)00105-7, 1997.
Jenkin, M. E., Saunders, S. M., Wagner, V., and Pilling, M. J.: Protocol for the development of the Master Chemical Mechanism, MCM v3 (Part B): tropospheric degradation of aromatic volatile organic compounds, Atmos. Chem. Phys., 3, 181–193, https://doi.org/10.5194/acp-3-181-2003, 2003.
Jia, C., Mao, X., Huang, T., Liang, X., Wang, Y., Shen, Y., Jiang, W., Wang, H., Bai, Z., Ma, M., Yu, Z., Ma, J., and Gao, H.: Non-methane hydrocarbons (NMHCs) and their contribution to ozone formation potential in a petrochemical industrialized city, Northwest China, Atmos. Res., 169, 225–236, https://doi.org/10.1016/j.atmosres.2015.10.006, 2016.
Kanaya, Y., Cao, R., Akimoto, H., Fukuda, M., Komazaki, Y., Yokouchi, Y., Koike, M., Tanimoto, H., Takegawa, N., and Kondo, Y.: Urban photochemistry in central Tokyo: 1. Observed and modeled OH and HO2 radical concentrations during the winter and summer of 2004, 112, D21312, https://doi.org/10.1029/2007JD008670, 2007.
Kovacs, T. A., Brune, W. H., Harder, H., Martinez, M., Simpas, J. B., Frost, G. J., Williams, E., Jobson, T., Stroud, C., Young, V., Fried, A., and Wert, B.: Direct measurements of urban OH reactivity during Nashville SOS in summer 1999, J. Environ. Monit., 5, 68–74, https://doi.org/10.1039/b204339d, 2003.
Li, L., Chen, C.-H., Huang, C., Huang, H.-Y., Li, Z.-P., Fu, J. S., Jang, C. J., and Streets, D. G.: Regional air pollution characteristics simulation of O3 and PM10 over Yangtze River Delta Region, Chinese Environmental Science, 29, 237–245, 2008.
Li, Z., Xue, L., Yang, X., Zha, Q., Tham, Y. J., Yan, C., Louie, P. K., Luk, C. W., Wang, T., and Wang, W.: Oxidizing capacity of the rural atmosphere in Hong Kong, Southern China, Sci. Total Environ., 612, 1114–1122, https://doi.org/10.1016/j.scitotenv.2017.08.310, 2018.
Ling, Z. H., Guo, H., Lam, S. H. M., Saunders, S. M., and Wang, T.: Atmospheric photochemical reactivity and ozone production at two sites in Hong Kong: Application of a Master Chemical Mechanism-photochemical box model, J. Geophys. Res.-Atmos., 119, 10567–10582, https://doi.org/10.1002/2014jd021794, 2014.
Liu, Z., Wang, Y., Gu, D., Zhao, C., Huey, L. G., Stickel, R., Liao, J., Shao, M., Zhu, T., Zeng, L., Amoroso, A., Costabile, F., Chang, C.-C., and Liu, S.-C.: Summertime photochemistry during CAREBeijing-2007: ROx budgets and O3 formation, Atmos. Chem. Phys., 12, 7737–7752, https://doi.org/10.5194/acp-12-7737-2012, 2012.
Lu, K. D., Rohrer, F., Holland, F., Fuchs, H., Bohn, B., Brauers, T., Chang, C. C., Häseler, R., Hu, M., Kita, K., Kondo, Y., Li, X., Lou, S. R., Nehr, S., Shao, M., Zeng, L. M., Wahner, A., Zhang, Y. H., and Hofzumahaus, A.: Observation and modelling of OH and HO2 concentrations in the Pearl River Delta 2006: a missing OH source in a VOC rich atmosphere, Atmos. Chem. Phys., 12, 1541–1569, https://doi.org/10.5194/acp-12-1541-2012, 2012.
Lu, K. D., Hofzumahaus, A., Holland, F., Bohn, B., Brauers, T., Fuchs, H., Hu, M., Häseler, R., Kita, K., Kondo, Y., Li, X., Lou, S. R., Oebel, A., Shao, M., Zeng, L. M., Wahner, A., Zhu, T., Zhang, Y. H., and Rohrer, F.: Missing OH source in a suburban environment near Beijing: observed and modelled OH and HO2 concentrations in summer 2006, Atmos. Chem. Phys., 13, 1057–1080, https://doi.org/10.5194/acp-13-1057-2013, 2013.
Ma, J. Z., Chen, Y., Wang, W., Yan, P., Liu, H. J., Yang, S. Y., Hu, Z. J., and Lelieveld, J.: Strong air pollution causes widespread haze-clouds over China, J. Geophys. Res.-Atmos., 115, D18204, https://doi.org/10.1029/2009JD013065, 2010.
Ma, J. Z., Wang, W., Chen, Y., Liu, H. J., Yan, P., Ding, G. A., Wang, M. L., Sun, J., and Lelieveld, J.: The IPAC-NC field campaign: a pollution and oxidization pool in the lower atmosphere over Huabei, China, Atmos. Chem. Phys., 12, 3883–3908, https://doi.org/10.5194/acp-12-3883-2012, 2012.
Ma, Z., Liu, C., Zhang, C., Liu, P., Ye, C., Xue, C., Zhao, D., Sun, J., Du, Y., Chai, F., and Mu, Y.: The levels, sources and reactivity of volatile organic compounds in a typical urban area of Northeast China, J. Environ. Sci., 79, 121–134, https://doi.org/10.1016/j.jes.2018.11.015, 2019.
Mao, J., Ren, X., Shuang, C., Brune, W. H., Zhong, C., Martinez, M., Harder, H., Lefer, B., Rappenglück, B., and Flynn, J.: Atmospheric oxidation capacity in the summer of Houston 2006: Comparison with summer measurements in other metropolitan studies, Atmos. Environ., 44, 4107–4115, https://doi.org/10.1016/j.atmosenv.2009.01.013, 2010.
Martinez, M., Harder, H., Kovacs, T. A., Simpas, J. B., Bassis, J., Lesher, R., Brune, W. H., Frost, G. J., Williams, E. J., and Stroud, C. A.: OH and HO2 concentrations, sources, and loss rates during the Southern Oxidants Study in Nashville, Tennessee, summer 1999, J. Geophys. Res.-Atmos., 108, 4617, https://doi.org/10.1029/2003JD003551, 2003.
Michoud, V., Kukui, A., Camredon, M., Colomb, A., Borbon, A., Miet, K., Aumont, B., Beekmann, M., Durand-Jolibois, R., Perrier, S., Zapf, P., Siour, G., Ait-Helal, W., Locoge, N., Sauvage, S., Afif, C., Gros, V., Furger, M., Ancellet, G., and Doussin, J. F.: Radical budget analysis in a suburban European site during the MEGAPOLI summer field campaign, Atmos. Chem. Phys., 12, 11951–11974, https://doi.org/10.5194/acp-12-11951-2012, 2012.
Nan, J., Wang, S., Guo, Y., Xiang, Y., and Zhou, B.: Study on the daytime OH radical and implication for its relationship with fine particles over megacity of Shanghai, China, Atmos. Environ., 154, 167–178, https://doi.org/10.1016/j.atmosenv.2017.01.046, 2017.
National Bureau of Statistics: China Statistical Yearbook, China Stat. Press, Beijing, 2018.
National Research Council: Rethinking the ozone problem in urban and regional air pollution, Natl. Acad. Press, Washington D.C., USA, 1992.
Prinn, R. G.: The cleansing capacity of the atmosphere, Annu. Rev. Environ. Resour., 28, 29–57, https://doi.org/10.1146/annurev.energy.28.011503.163425, 2003.
Ren, X., Harder, H., Martinez, M., Lesher, R. L., Oliger, A., Shirley, T., Adams, J., Simpas, J. B., and Brune, W. H.: HOx concentrations and OH reactivity observations in New York City during PMTACS-NY2001, Atmos. Environ., 37, 3627–3637, https://doi.org/10.1016/S1352-2310(03)00460-6, 2003.
Ren, X., Brune, W. H., Mao, J., Mitchell, M. J., Lesher, R. L., Simpas, J. B., Metcalf, A. R., Schwab, J. J., Cai, C., and Li, Y.: Behavior of OH and HO2 in the winter atmosphere in New York City, Atmos. Environ., 40, 252–263, https://doi.org/10.1016/j.atmosenv.2005.11.073, 2006.
Ren, X., Olson, J. R., Crawford, J. H., Brune, W. H., Mao, J., Long, R. B., Chen, Z., Chen, G., Avery, M. A., Sachse, G. W., Barrick, J. D., Diskin, G. S., Huey, L. G., Fried, A., Cohen, R. C., Heikes, B., Wennberg, P. O., Singh, H. B., Blake, D. R., and Shetter, R. E.: HOx chemistry during INTEX-A 2004: Observation, model calculation, and comparison with previous studies, J. Geophys. Res.-Atmos., 113, 2156–2202, https://doi.org/10.1029/2007jd009166, 2008.
Santiago, J.-L., Martilli, A., and Martin, F.: On dry deposition modelling of atmospheric pollutants on vegetation at the microscale: Application to the impact of street vegetation on air quality, Bound.-Lay. Meteorol., 162, 451–474, https://doi.org/10.1007/s10546-016-0210-5, 2016.
Saunders, S. M., Jenkin, M. E., Derwent, R. G., and Pilling, M. J.: Protocol for the development of the Master Chemical Mechanism, MCM v3 (Part A): tropospheric degradation of non-aromatic volatile organic compounds, Atmos. Chem. Phys., 3, 161–180, https://doi.org/10.5194/acp-3-161-2003, 2003.
Schmitz, T., Hassel, D., and Weber, F.-J.: Determination of VOC-components in the exhaust of gasoline and diesel passenger cars, Atmos. Environ., 34, 4639–4647, https://doi.org/10.1016/s1352-2310(00)00303-4, 2000.
Seinfeld, J. H. and Pandis, S. N.: Atmospheric chemistry and physics: from air pollution to climate change, John Wiley & Sons, 2016.
Sheehy, P. M., Volkamer, R., Molina, L. T., and Molina, M. J.: Oxidative capacity of the Mexico City atmosphere – Part 2: A ROx radical cycling perspective, Atmos. Chem. Phys., 10, 6993–7008, https://doi.org/10.5194/acp-10-6993-2010, 2010.
Shen, S., Wang, S., and Zhou, B.: Investigation of Atmospheric Formaldehyde and Glyoxal Based on Differential Optical Absorption Spectroscopy, Spectrosc. Spect. Anal., 36, 2384–2390, 2016.
Shi, C., Wang, S., Liu, R., Zhou, R., Li, D., Wang, W., Li, Z., Cheng, T., and Zhou, B.: A study of aerosol optical properties during ozone pollution episodes in 2013 over Shanghai, China, Atmos. Res., 153, 235–249, https://doi.org/10.1016/j.atmosres.2014.09.002, 2015.
Sommariva, R., Haggerstone, A.-L., Carpenter, L. J., Carslaw, N., Creasey, D. J., Heard, D. E., Lee, J. D., Lewis, A. C., Pilling, M. J., and Zádor, J.: OH and HO2 chemistry in clean marine air during SOAPEX-2, Atmos. Chem. Phys., 4, 839–856, https://doi.org/10.5194/acp-4-839-2004, 2004.
Tan, Z., Fuchs, H., Lu, K., Hofzumahaus, A., Bohn, B., Broch, S., Dong, H., Gomm, S., Häseler, R., He, L., Holland, F., Li, X., Liu, Y., Lu, S., Rohrer, F., Shao, M., Wang, B., Wang, M., Wu, Y., Zeng, L., Zhang, Y., Wahner, A., and Zhang, Y.: Radical chemistry at a rural site (Wangdu) in the North China Plain: observation and model calculations of OH, HO2 and RO2 radicals, Atmos. Chem. Phys., 17, 663–690, https://doi.org/10.5194/acp-17-663-2017, 2017.
Tan, Z., Lu, K., Hofzumahaus, A., Fuchs, H., Bohn, B., Holland, F., Liu, Y., Rohrer, F., Shao, M., Sun, K., Wu, Y., Zeng, L., Zhang, Y., Zou, Q., Kiendler-Scharr, A., Wahner, A., and Zhang, Y.: Experimental budgets of OH, HO2, and RO2 radicals and implications for ozone formation in the Pearl River Delta in China 2014, Atmos. Chem. Phys., 19, 7129–7150, https://doi.org/10.5194/acp-19-7129-2019, 2019a.
Tan, Z., Lu, K., Jiang, M., Su, R., Wang, H., Lou, S., Fu, Q., Zhai, C., Tan, Q., Yue, D., Chen, D., Wang, Z., Xie, S., Zeng, L., and Zhang, Y.: Daytime atmospheric oxidation capacity in four Chinese megacities during the photochemically polluted season: a case study based on box model simulation, Atmos. Chem. Phys., 19, 3493–3513, https://doi.org/10.5194/acp-19-3493-2019, 2019b.
Tie, X., Geng, F., Peng, L., Gao, W., and Zhao, C.: Measurement and modeling of O3 variability in Shanghai, China: Application of the WRF-Chem model, Atmos. Environ., 43, 4289–4302, https://doi.org/10.1016/j.atmosenv.2009.06.008, 2009.
Tie, X., Geng, F., Guenther, A., Cao, J., Greenberg, J., Zhang, R., Apel, E., Li, G., Weinheimer, A., Chen, J., and Cai, C.: Megacity impacts on regional ozone formation: observations and WRF-Chem modeling for the MIRAGE-Shanghai field campaign, Atmos. Chem. Phys., 13, 5655–5669, https://doi.org/10.5194/acp-13-5655-2013, 2013.
Wang, S., Nan, J., Shi, C., Fu, Q., Gao, S., Wang, D., Cui, H., Saiz-Lopez, A., and Zhou, B.: Atmospheric ammonia and its impacts on regional air quality over the megacity of Shanghai, China, Sci. Rep., 5, 15842, https://doi.org/10.1038/srep15842, 2015.
Wang, T., Ding, A., Gao, J., and Wu, W. S.: Strong ozone production in urban plumes from Beijing, China, Geophys. Res. Lett., 33, L21806, https://doi.org/10.1029/2006gl027689, 2006.
Wang, T., Nie, W., Gao, J., Xue, L. K., Gao, X. M., Wang, X. F., Qiu, J., Poon, C. N., Meinardi, S., Blake, D., Wang, S. L., Ding, A. J., Chai, F. H., Zhang, Q. Z., and Wang, W. X.: Air quality during the 2008 Beijing Olympics: secondary pollutants and regional impact, Atmos. Chem. Phys., 10, 7603–7615, https://doi.org/10.5194/acp-10-7603-2010, 2010.
Wang, T., Xue, L., Brimblecombe, P., Lam, Y. F., Li, L., and Zhang, L.: Ozone pollution in China: A review of concentrations, meteorological influences, chemical precursors, and effects, Sci. Total Environ., 575, 1582–1596, https://doi.org/10.1016/j.scitotenv.2016.10.081, 2017.
Wang, Y., Guo, H., Zou, S., Lyu, X., Ling, Z., Cheng, H., and Zeren, Y.: Surface O3 photochemistry over the South China Sea: Application of a near-explicit chemical mechanism box model, Environ. Pollut., 234, 155–166, https://doi.org/10.1016/j.envpol.2017.11.001, 2018.
Wood, E. C., Herndon, S. C., Onasch, T. B., Kroll, J. H., Canagaratna, M. R., Kolb, C. E., Worsnop, D. R., Neuman, J. A., Seila, R., Zavala, M., and Knighton, W. B.: A case study of ozone production, nitrogen oxides, and the radical budget in Mexico City, Atmos. Chem. Phys., 9, 2499–2516, https://doi.org/10.5194/acp-9-2499-2009, 2009.
Whalley, L. K., Stone, D., Bandy, B., Dunmore, R., Hamilton, J. F., Hopkins, J., Lee, J. D., Lewis, A. C., and Heard, D. E.: Atmospheric OH reactivity in central London: observations, model predictions and estimates of in situ ozone production, Atmos. Chem. Phys., 16, 2109–2122, https://doi.org/10.5194/acp-16-2109-2016, 2016.
Whalley, L. K., Stone, D., Dunmore, R., Hamilton, J., Hopkins, J. R., Lee, J. D., Lewis, A. C., Williams, P., Kleffmann, J., Laufs, S., Woodward-Massey, R., and Heard, D. E.: Understanding in situ ozone production in the summertime through radical observations and modelling studies during the Clean air for London project (ClearfLo), Atmos. Chem. Phys., 18, 2547–2571, https://doi.org/10.5194/acp-18-2547-2018, 2018.
Xing, J., Wang, J., Mathur, R., Wang, S., Sarwar, G., Pleim, J., Hogrefe, C., Zhang, Y., Jiang, J., Wong, D. C., and Hao, J.: Impacts of aerosol direct effects on tropospheric ozone through changes in atmospheric dynamics and photolysis rates, Atmos. Chem. Phys., 17, 9869–9883, https://doi.org/10.5194/acp-17-9869-2017, 2017.
Xu, J., Tie, X., Gao, W., Lin, Y., and Fu, Q.: Measurement and model analyses of the ozone variation during 2006 to 2015 and its response to emission change in megacity Shanghai, China, Atmos. Chem. Phys., 19, 9017–9035, https://doi.org/10.5194/acp-19-9017-2019, 2019.
Xue, L., Gu, R., Wang, T., Wang, X., Saunders, S., Blake, D., Louie, P. K. K., Luk, C. W. Y., Simpson, I., Xu, Z., Wang, Z., Gao, Y., Lee, S., Mellouki, A., and Wang, W.: Oxidative capacity and radical chemistry in the polluted atmosphere of Hong Kong and Pearl River Delta region: analysis of a severe photochemical smog episode, Atmos. Chem. Phys., 16, 9891–9903, https://doi.org/10.5194/acp-16-9891-2016, 2016.
Yoshino, A., Sadanaga, Y., Watanabe, K., Kato, S., Miyakawa, Y., Matsumoto, J., and Kajii, Y.: Measurement of total OH reactivity by laser-induced pump and probe technique–comprehensive observations in the urban atmosphere of Tokyo, Atmos. Environ., 40, 7869–7881, https://doi.org/10.1016/j.atmosenv.2006.07.023, 2006.
Young, C. J., Washenfelder, R. A., Roberts, J. M., Mielke, L. H., Osthoff, H. D., Tsai, C., Pikelnaya, O., Stutz, J., Veres, P. R., Cochran, A. K., VandenBoer, T. C., Flynn, J., Grossberg, N., Haman, C. L., Lefer, B., Stark, H., Graus, M., de Gouw, J., Gilman, J. B., Kuster, W. C., and Brown, S. S.: Vertically Resolved Measurements of Nighttime Radical Reservoirs; in Los Angeles and Their Contribution to the Urban Radical Budget, Environ. Sci. Technol., 46, 10965–10973, https://doi.org/10.1021/es302206a, 2012.
Yuan, B., Chen, W., Shao, M., Wang, M., Lu, S., Wang, B., Liu, Y., Chang, C.-C., and Wang, B.: Measurements of ambient hydrocarbons and carbonyls in the Pearl River Delta (PRD), China, Atmos. Res., 116, 93–104, https://doi.org/10.1016/j.atmosres.2012.03.006, 2012.
Zhang, J., Wang, T., Chameides, W. L., Cardelino, C., Kwok, J., Blake, D. R., Ding, A., and So, K. L.: Ozone production and hydrocarbon reactivity in Hong Kong, Southern China, Atmos. Chem. Phys., 7, 557–573, https://doi.org/10.5194/acp-7-557-2007, 2007.
Zhang, L., Wang, T., Zhang, Q., Zheng, J., Xu, Z., and Lv, M.: Potential sources of nitrous acid (HONO) and their impacts on ozone: A WRF-Chem study in a polluted subtropical region, J. Geophys. Res.-Atmos., 121, 3645–3662, https://doi.org/10.1002/2015jd024468, 2016.
Zhao, H., Wang, S., Wang, W., Liu, R., and Zhou, B.: Investigation of Ground-Level Ozone and High-Pollution Episodes in a Megacity of Eastern China, PLoS One, 10, e0131878, https://doi.org/10.1371/journal.pone.0131878, 2015.
Zheng, J., Shao, M., Che, W., Zhang, L., Zhong, L., Zhang, Y., and Streets, D.: Speciated VOC emission inventory and spatial patterns of ozone formation potential in the Pearl River Delta, China, Environ. Sci. Technol., 43, 8580–8586, https://doi.org/10.1021/es901688e, 2009.