the Creative Commons Attribution 4.0 License.
the Creative Commons Attribution 4.0 License.
 | 27 Oct 2020
Drivers of cloud droplet number variability in the summertime in the southeastern United States
Aikaterini Bougiatioti
Athanasios Nenes
Jack J. Lin
Charles A. Brock
Joost A. de Gouw
Jin Liao
Ann M. Middlebrook
André Welti
Here we analyze regional-scale data collected on board the NOAA WP-3D aircraft during the 2013 Southeast Nexus (SENEX) campaign to study the aerosol–cloud droplet link and quantify the sensitivity of droplet number to aerosol number, chemical composition, and vertical velocity. For this, the observed aerosol size distributions, chemical composition, and vertical-velocity distribution are introduced into a state-of-the-art cloud droplet parameterization to show that cloud maximum supersaturations in the region range from 0.02 % to 0.52 %, with an average of 0.14±0.05 %. Based on these low values of supersaturation, the majority of activated droplets correspond to particles with a dry diameter of 90 nm and above. An important finding is that the standard deviation of the vertical velocity (σw) exhibits considerable diurnal variability (ranging from 0.16 m s−1 during nighttime to over 1.2 m s−1 during day), and it tends to covary with total aerosol number (Na). This σw–Na covariance amplifies the predicted response in cloud droplet number (Nd) to Na increases by 3 to 5 times compared to expectations based on Na changes alone. This amplified response is important given that droplet formation is often velocity-limited and therefore should normally be insensitive to aerosol changes. We also find that Nd cannot exceed a characteristic concentration that depends solely on σw. Correct consideration of σw and its covariance with time and Na is important for fully understanding aerosol–cloud interactions and the magnitude of the aerosol indirect effect. Given that model assessments of aerosol–cloud–climate interactions do not routinely evaluate for overall turbulence or its covariance with other parameters, datasets and analyses such as the one presented here are of the highest priority to address unresolved sources of hydrometeor variability, bias, and the response of droplet number to aerosol perturbations.
- Article
(515 KB) - Full-text XML
-
Supplement
(3083 KB) - BibTeX
- EndNote


Atmospheric particles (aerosols) interact with incoming solar radiation and tend to cool the earth, especially over dark surfaces such as oceans and forests (Charlson et al., 1992). Aerosols also act as cloud condensation nuclei (CCN), form droplets in clouds, and indirectly affect climate by modulating precipitation patterns and cloud radiative properties. Aerosol–cloud interactions constitute the most uncertain aspects of anthropogenic climate change (Seinfeld et al., 2016). Studies often highlight the importance of constraining the aerosol size distribution, particle composition, and mixing state for predicting CCN concentrations (Cubison et al., 2008; Quinn et al., 2008). Model assumptions often cannot consider the full complexity required to comprehensively compute CCN, which together with other emissions and process uncertainties lead to CCN prediction errors that can be significant (e.g., Fanourgakis et al., 2019). Owing to the sublinear response of cloud droplet number concentration (Nd) to aerosol perturbations, prediction errors in CCN generally result in errors in Nd which are less than those for CCN (Fanourgakis et al., 2019). The sublinear response arises because elevated CCN concentration generally increases the competition of the potential droplets for water vapor; this in turn depletes supersaturation and the Nd that can eventually form (Reutter et al., 2009; Bougiatioti et al., 2016; Fanourgakis et al., 2019; Kalkavouras et al., 2019). A critically important parameter is the vertical velocity as it is responsible for generation of supersaturation that drives droplet formation and growth. Droplet number variability may be driven primarily by vertical-velocity variations (Kacarab et al., 2020; Sullivan et al., 2016). Compared to aerosols, vertical velocity is much less observed, constrained, and evaluated in aerosol–cloud interaction studies and hence may be a source of persistent biases in models (Sullivan et al., 2016).
The southeastern United States (SEUS) presents a particularly interesting location for studying regional climate change as it has not considerably warmed over the past 100 years, except during the last decade (Carlton et al., 2018; Yu et al., 2014; Leibensperger et al., 2012a, b). These trends are in contrast with the trends observed in most locations globally (IPCC, 2013), and several hypotheses have been proposed to explain this regional phenomenon, including the effect of involving short-lived climate forcers such as secondary aerosols combined with the enhanced humidity in the region and their impact on clouds (Carlton et al., 2018; Yu et al., 2014). Here, we analyze data collected during the Southeast Nexus (SENEX) campaign of climate change and air quality in June–July 2013, which was the airborne component led by the National Oceanic and Atmospheric Administration (NOAA) of a greater measurement campaign throughout the SEUS, the Southeast Atmosphere Studies (SAS; Carlton et al., 2018). Here we analyze data collected on board the NOAA WP-3D and apply a state-of-the-art droplet parameterization to determine the maximum supersaturation and Nd achieved in cloudy updrafts for all science flights with available number size distribution and chemical composition data. We also determine the sensitivity of droplet formation to vertical velocity and aerosol, with the purpose of understanding the drivers of droplet variability in the boundary layer of the SEUS by obtaining regional-scale, representative values of the relationship between the driving parameters and cloud droplet number.
2.1 Aircraft instrumentation
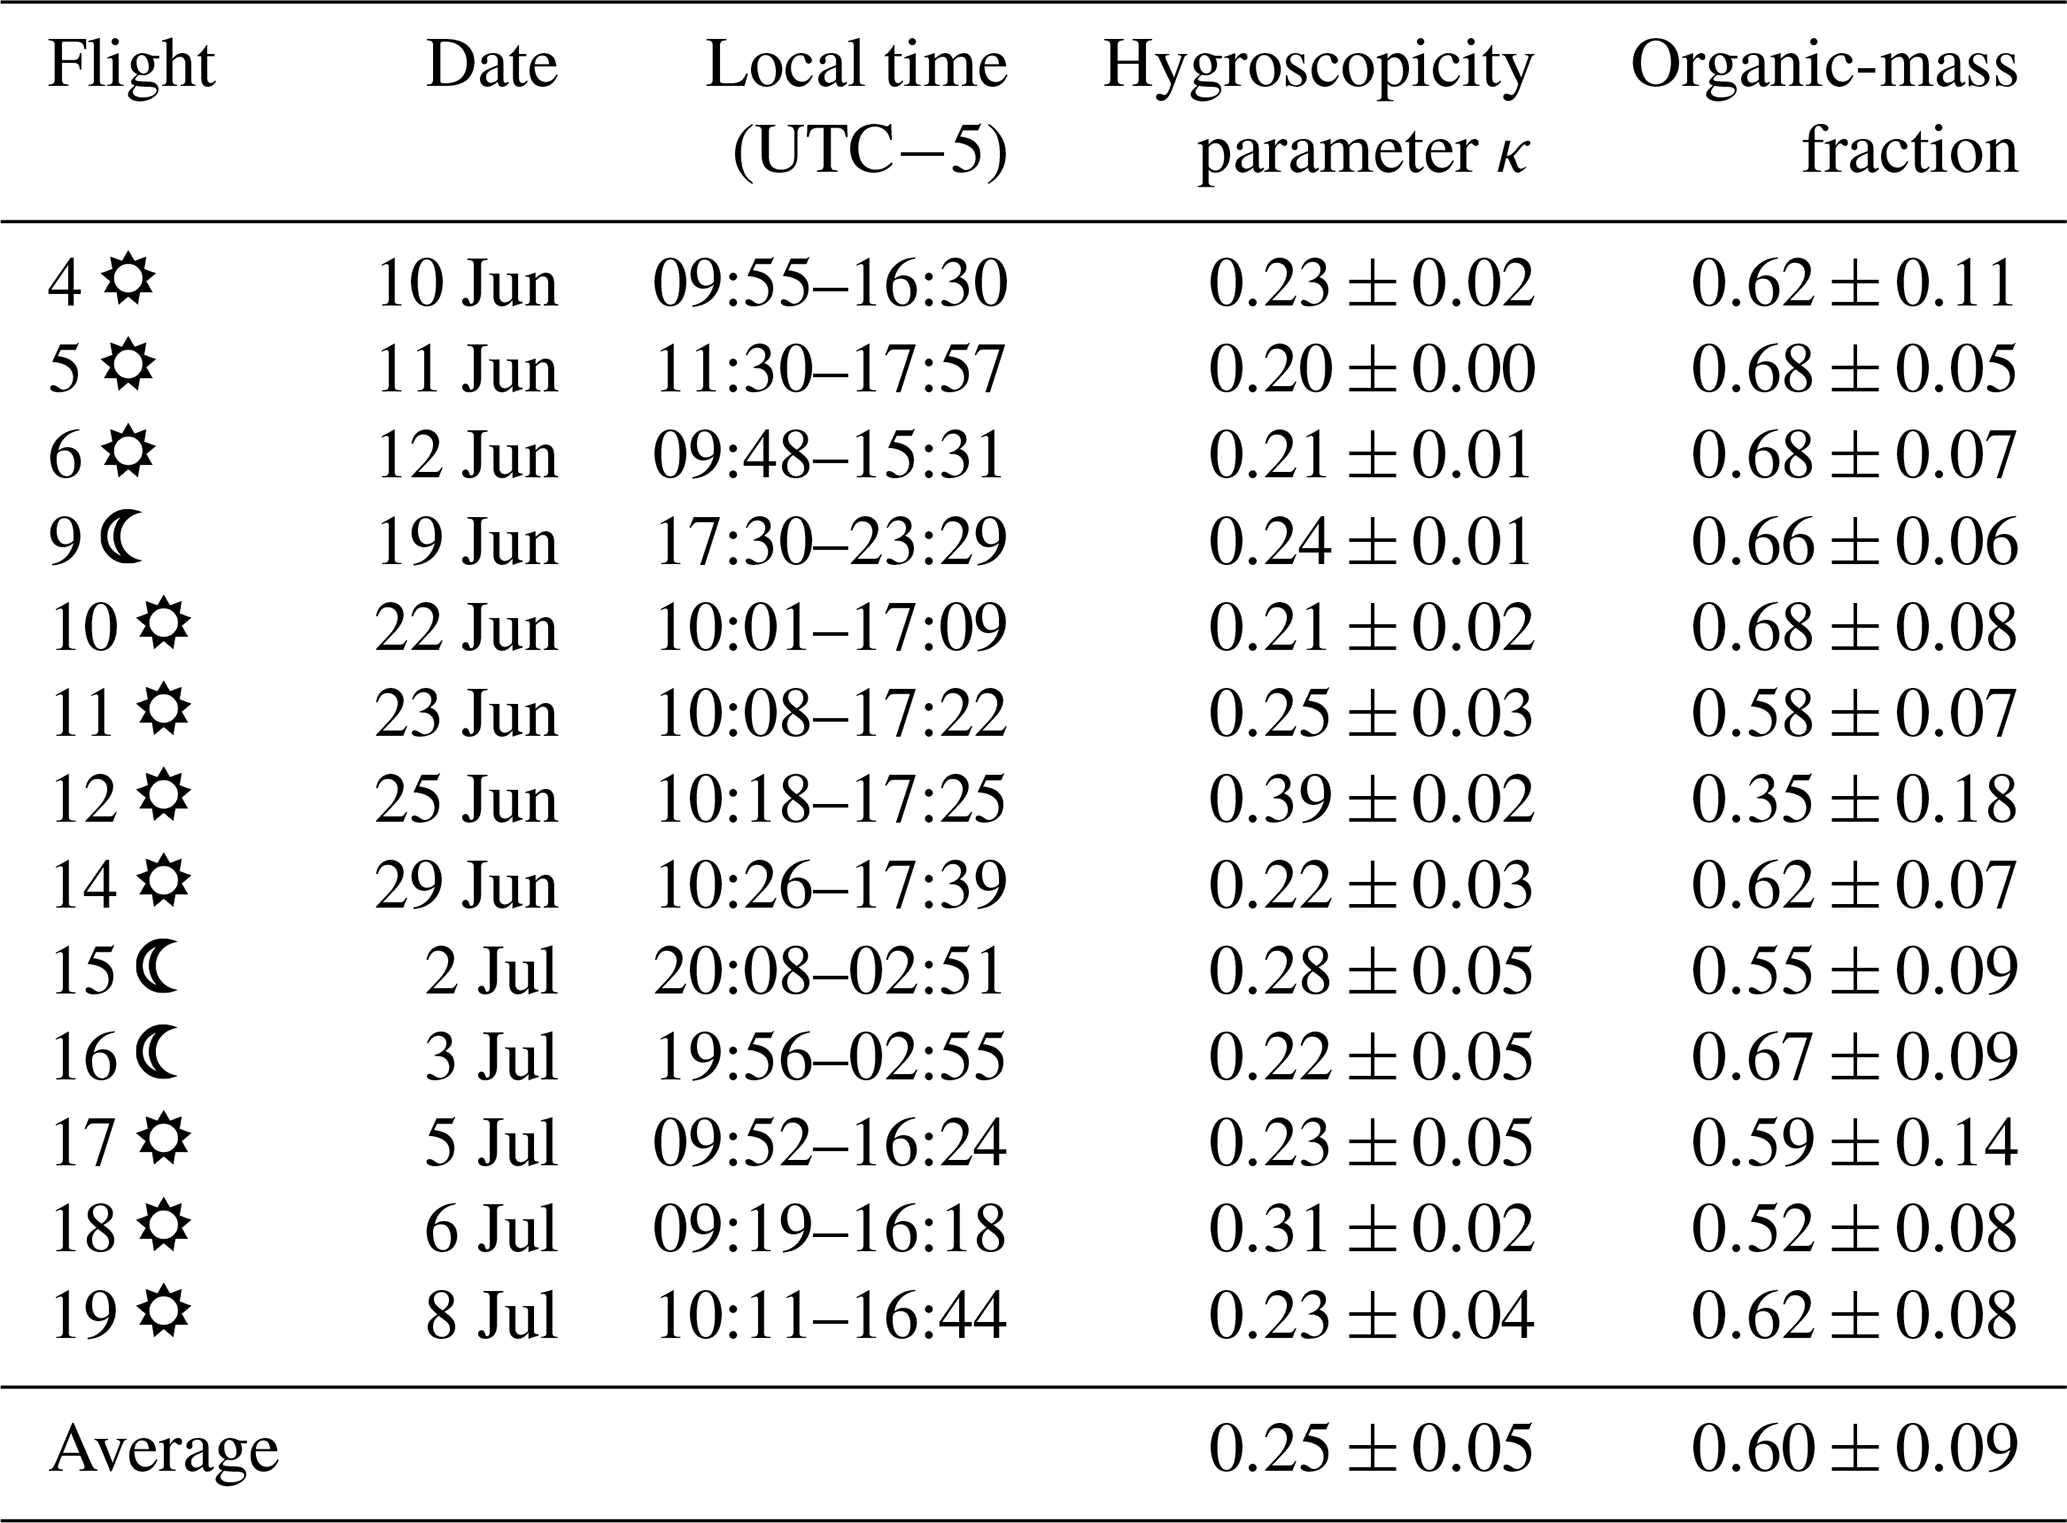
The analysis utilizes airborne in situ data collected during the June–July 2013 SENEX mission aboard the NOAA WP-3D aircraft (typical airspeed: ∼100 m s−1) based in Smyrna, Tennessee (36∘00′32′′ N, 86∘31′12′′ W). In total, 20 research flights were conducted. Based on the availability of the relevant data described below, 13 flights are analyzed in this work. Table 1 provides a synopsis of the analyzed research flights, where times are local (UTC-5). Detailed information on the instrumentation and measurement strategy during the SENEX campaign is provided by Warneke et al. (2016).
Table 1Research flights from the SENEX 2013 campaign used in this study.
The symbol
“ ![]() ” next to each flight number refers to a daytime flight, and
“
” next to each flight number refers to a daytime flight, and
“ ![]() ” refers to a nighttime flight.
” refers to a nighttime flight.
Dry particle number distributions from 4 to 7000 nm were measured using multiple condensation and optical particle counters; 4–700 nm particles were measured by a nucleation-mode aerosol size spectrometer (NMASS; Warneke et al., 2016) and an ultra-high-sensitivity aerosol spectrometer (UHSAS; Brock et al., 2011), while for larger particles with dry diameters between 0.7 and 7.0 µm, a custom-built white-light optical particle counter (WLOPC) was used (Brock et al., 2011).
Measurements of the composition of submicron (<0.7 µm vacuum aerodynamic diameter) nonrefractory particles were made with a compact time-of-flight aerosol mass spectrometer (C-ToF-AMS; Aerodyne, Billerica, Massachusetts, US; Canagaratna et al., 2007; Kupc et al., 2018) customized for aircraft use, with a 10 s time resolution (Warneke et al., 2016). Particles entering the instrument are focused and impacted on a 600 ∘C inverted-cone vaporizer. The volatilized vapors are analyzed by electron ionization mass spectrometry, providing mass loadings of sulfate, nitrate, organics, ammonium, and chloride. For the C-ToF-AMS, the transmission efficiency of particles between 100 and 700 nm is assumed to be 100 % through the specific aerodynamic focusing lens used, while mass concentrations are calculated using a chemical composition-dependent collection efficiency (Middlebrook et al., 2012; Wagner et al., 2015). The C-ToF-AMS measures only nonrefractory aerosol chemical composition; therefore this analysis provides mass loadings of sulfate, nitrate, ammonium, and organic constituents with a 10 s time resolution and neglects the contribution of black carbon (BC). The calculation of the average volume fractions from the mass loading follows that of Moore et al. (2012). An average organic density of 1.4 g cm−3 is used, characteristic of aged aerosol (Moore et al., 2011; Lathem et al., 2013), while for the inorganic species the respective densities are used, assuming the aerosol to be internally mixed (Lance et al., 2009; Bougiatioti et al., 2009; Wang et al., 2010)
The aircraft was equipped by the NOAA Aircraft Operations Center (AOC) flight facility with a suite of instruments to provide information on exact aircraft position as well as numerous meteorological parameters (Warneke et al., 2016). The analysis in this work makes use of vertical wind velocity; aircraft pressure altitude; and ambient temperature, pressure, and relative humidity (RH) provided by the NOAA AOC. The location of the instrumentation on the aircraft is described elsewhere (Warneke et al., 2016). For measurements inside the fuselage, a low-turbulence inlet (Wilson et al., 2004) and sampling system (Brock et al., 2011; 2016a) was used to decelerate the sample flow to the instruments. The C-ToF-AMS was connected downstream of an impactor with 50 % efficiency at a 1.0 µm aerodynamic diameter (PM1) cut point (Warneke et al., 2016).
2.2 Aerosol hygroscopicity parameter
The aerosol hygroscopicity parameter (Petters and Kreidenweis, 2007), κ, is calculated assuming a mixture of an organic and inorganic component with volume fractions εorg and εinorg as well as characteristic hygroscopicities κorg and κinorg, respectively (). The organic and inorganic volume fraction are derived from the C-ToF-AMS data. Since throughout the summertime in the SEUS, aerosol inorganic-nitrate mass and volume fraction are very low (Weber et al., 2016; Fry et al., 2018), κinorg=0.6, representative of ammonium sulfate, is used. For the organic fraction, a hygroscopicity value of κorg=0.14 is used based on concurrent measurements conducted at the ground site of the SAS at the rural site of Centreville, Alabama (Cerully et al., 2015). This value is also in accordance with the cumulative result of studies conducted in the southeastern US using measurements of droplet activation diameters in subsaturated regimes, providing a κorg of >0.1 (Brock et al., 2016a).
2.3 Cloud droplet number and maximum supersaturation
Using the observed aerosol number size distribution (1 s time resolution) and the hygroscopicity derived from the chemical composition measurements (10 s time resolution) and vertical velocity, we calculate the (potential) cloud droplet number (Nd) and maximum supersaturation (Smax) that would form in clouds in the air masses sampled. Droplet number and maximum supersaturation calculations are carried out using an approach similar to that of Bougiatioti et al. (2017) and Kalkavouras et al. (2019), with the sectional parameterization of Nenes and Seinfeld (2003), later improved by Barahona et al. (2010) and Morales Betancourt and Nenes (2014a). A sectional representation of the size distribution is used for each 1 s data point (e.g., for Flight 5, n=23 213 data points). Given that chemical composition is provided with a 10 s time resolution, the same hygroscopicity values are used for 10 successive size distributions throughout the flight. Temperature and pressure required for droplet number calculations are obtained from the NOAA AOC flight facility dataset.
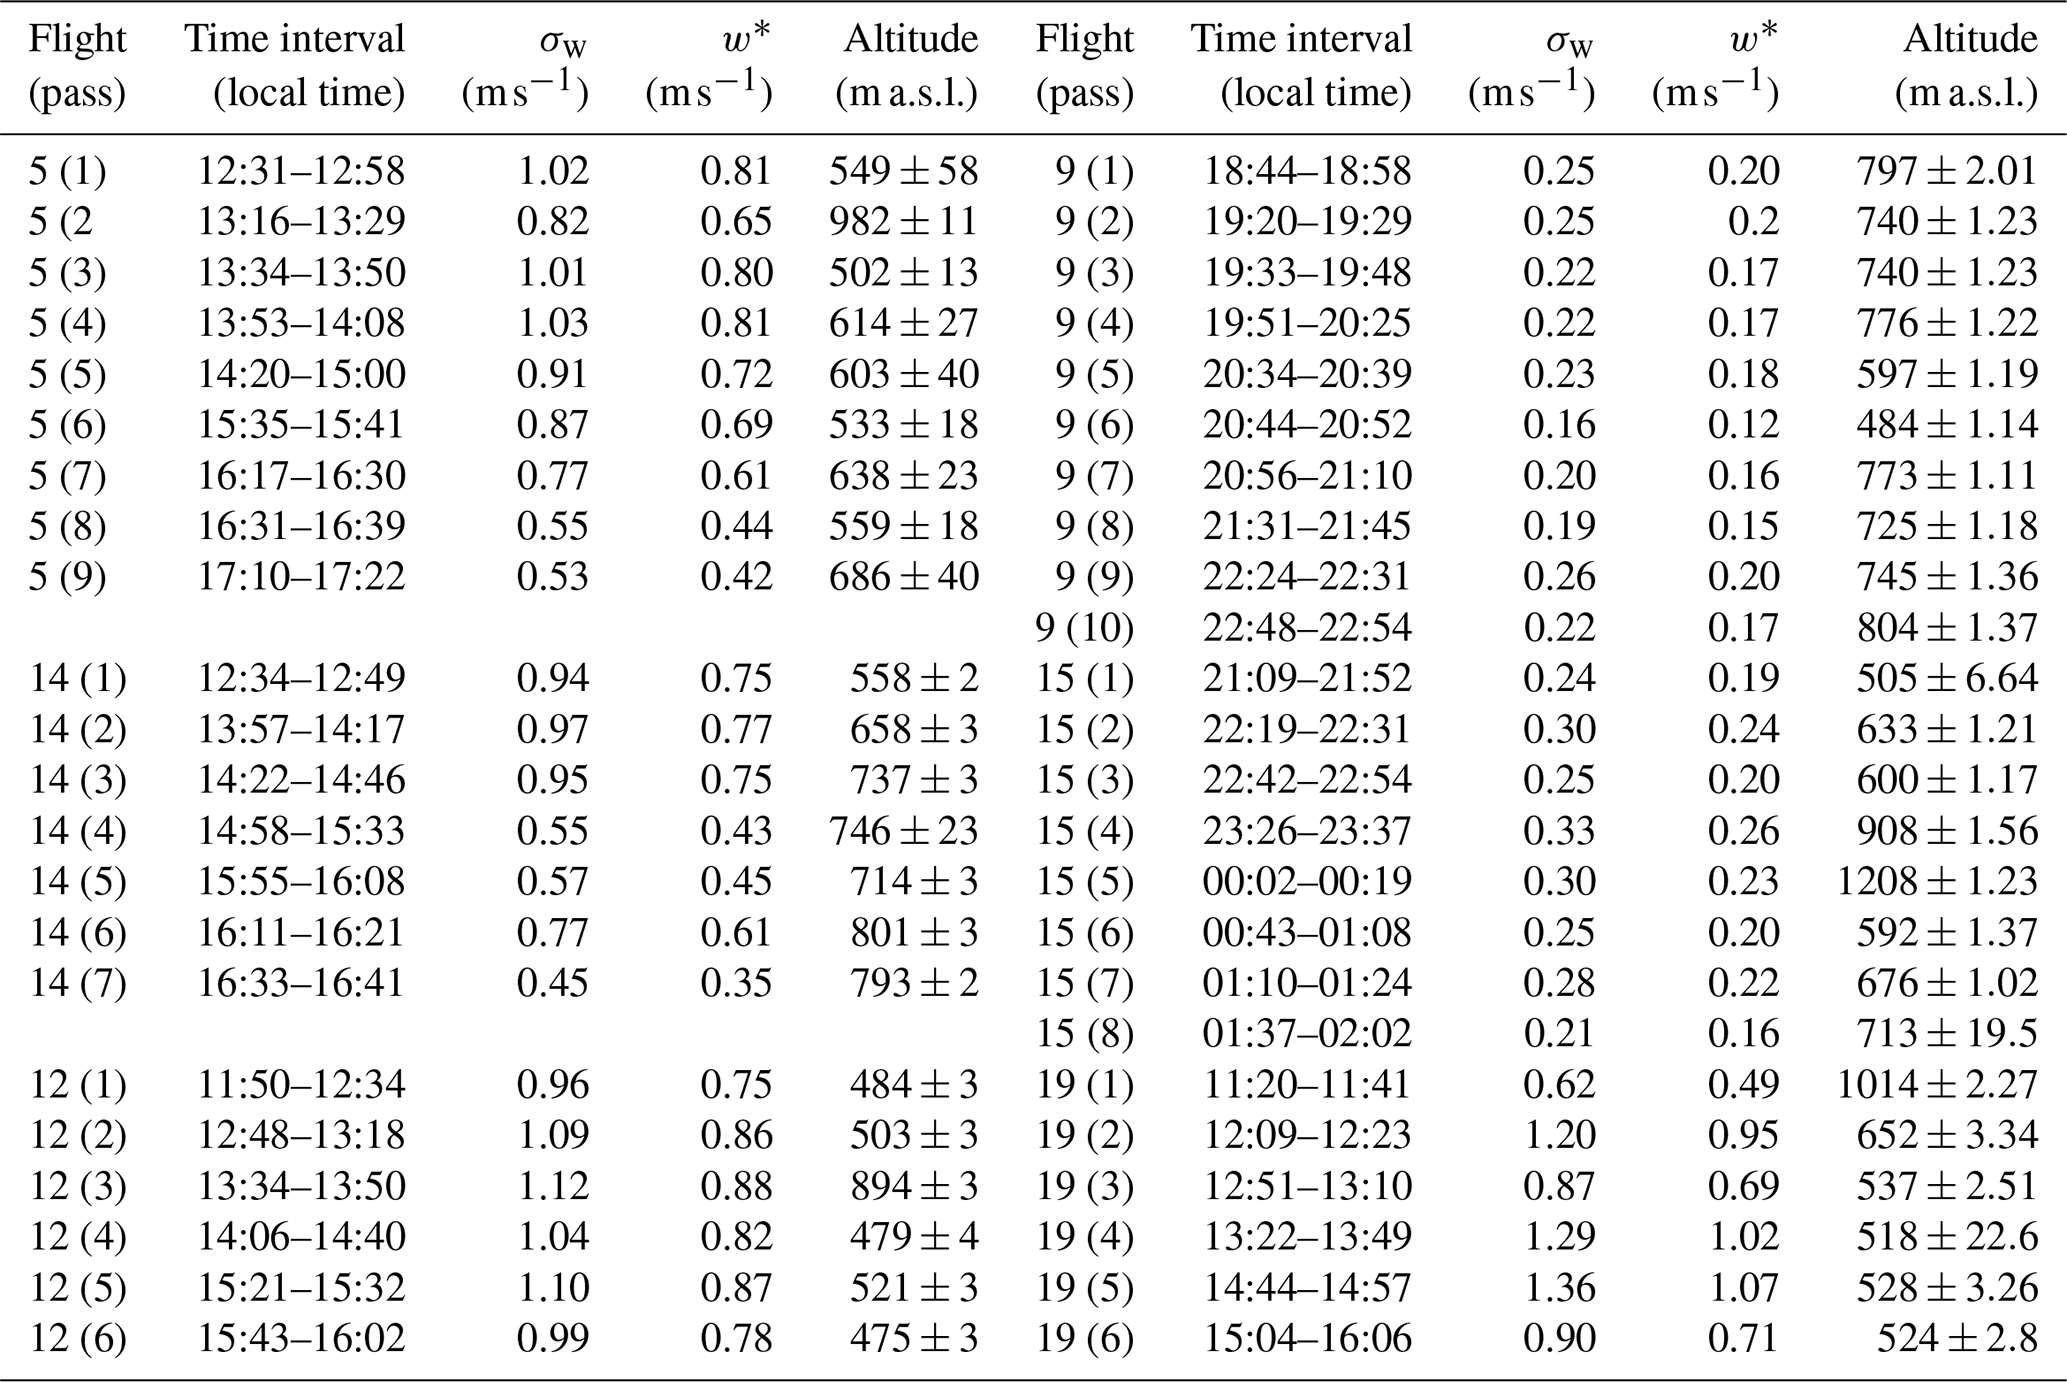
Given that vertical velocity varies considerably inside the boundary layer, we obtain a droplet number that is representative of the vertical-velocity distribution: the average concentration that results from integrating over the distribution (probability density function, PDF) of observed updraft velocities. To accomplish this, each flight is divided into segments where the aircraft flew at a constant height. For each segment, only the non-negative vertical velocities are fit to the positive half of a Gaussian distribution around a mean of 0 and standard deviation σw. Only positive vertical velocities (“updrafts”) were used in this fit as they are the part of the vertical-velocity spectrum that is responsible for cloud droplet formation. The σw values derived from the level-leg segments are then averaged into one single σw value to represent each flight. The PDF-averaged droplet number concentration is then obtained using the “characteristic velocity” approach of Morales and Nenes (2010), where applying the droplet parameterization at a single “characteristic” velocity, (Morales and Nenes, 2010), directly gives the PDF-averaged value. The flight-averaged σw and subsequently the respective w∗ is applied to each size distribution measured. Apart from its theoretical basis, this methodology has shown to provide good closure with observed droplet numbers in ambient clouds (e.g., Kacarab et al., 2020).
In determining σw, we consider horizontal segments most likely to be in the boundary layer. A total of 91 % of the segments are below 1000 (mean altitude: ∼700 m; Tables 2 and S1 in the Supplement for all flights), within the boundary layer in the summertime in the US (Seidel et al., 2012). Also according to Wagner et al. (2015) the mixed-layer height in the area during the measurements had a median of 1.2 km, while during nighttime, values are <0.5 km (Seidel et al., 2012). The vertical-velocity distributions observed gave for daytime flights and for nighttime flights (Tables 2 and S1).
Table 2Flight number, time interval, standard deviation of vertical wind velocity (σw), and characteristic vertical velocity during flight segments where the aircraft flew at a constant altitude.
Potential droplet formation is evaluated at four characteristic velocities w* that cover the observed range in σw, namely 0.1, 0.3, 0.6, and 1 m s−1. The σw=0.3 m s−1 case is most representative of nighttime conditions, while σw=1 m s−1 is most representative of the daytime boundary layer (Table 3).
Table 3Derived cloud parameters (maximum supersaturation, droplet number)
and relative contribution (Eq. 2) of chemical composition and total
aerosol number for different vertical velocities. Numbers in parentheses
indicate standard deviation values. The symbol “ ![]() ” next to each flight
number refers to a daytime flight, and “
” next to each flight
number refers to a daytime flight, and “ ![]() ” refers to a nighttime
flight.
” refers to a nighttime
flight.
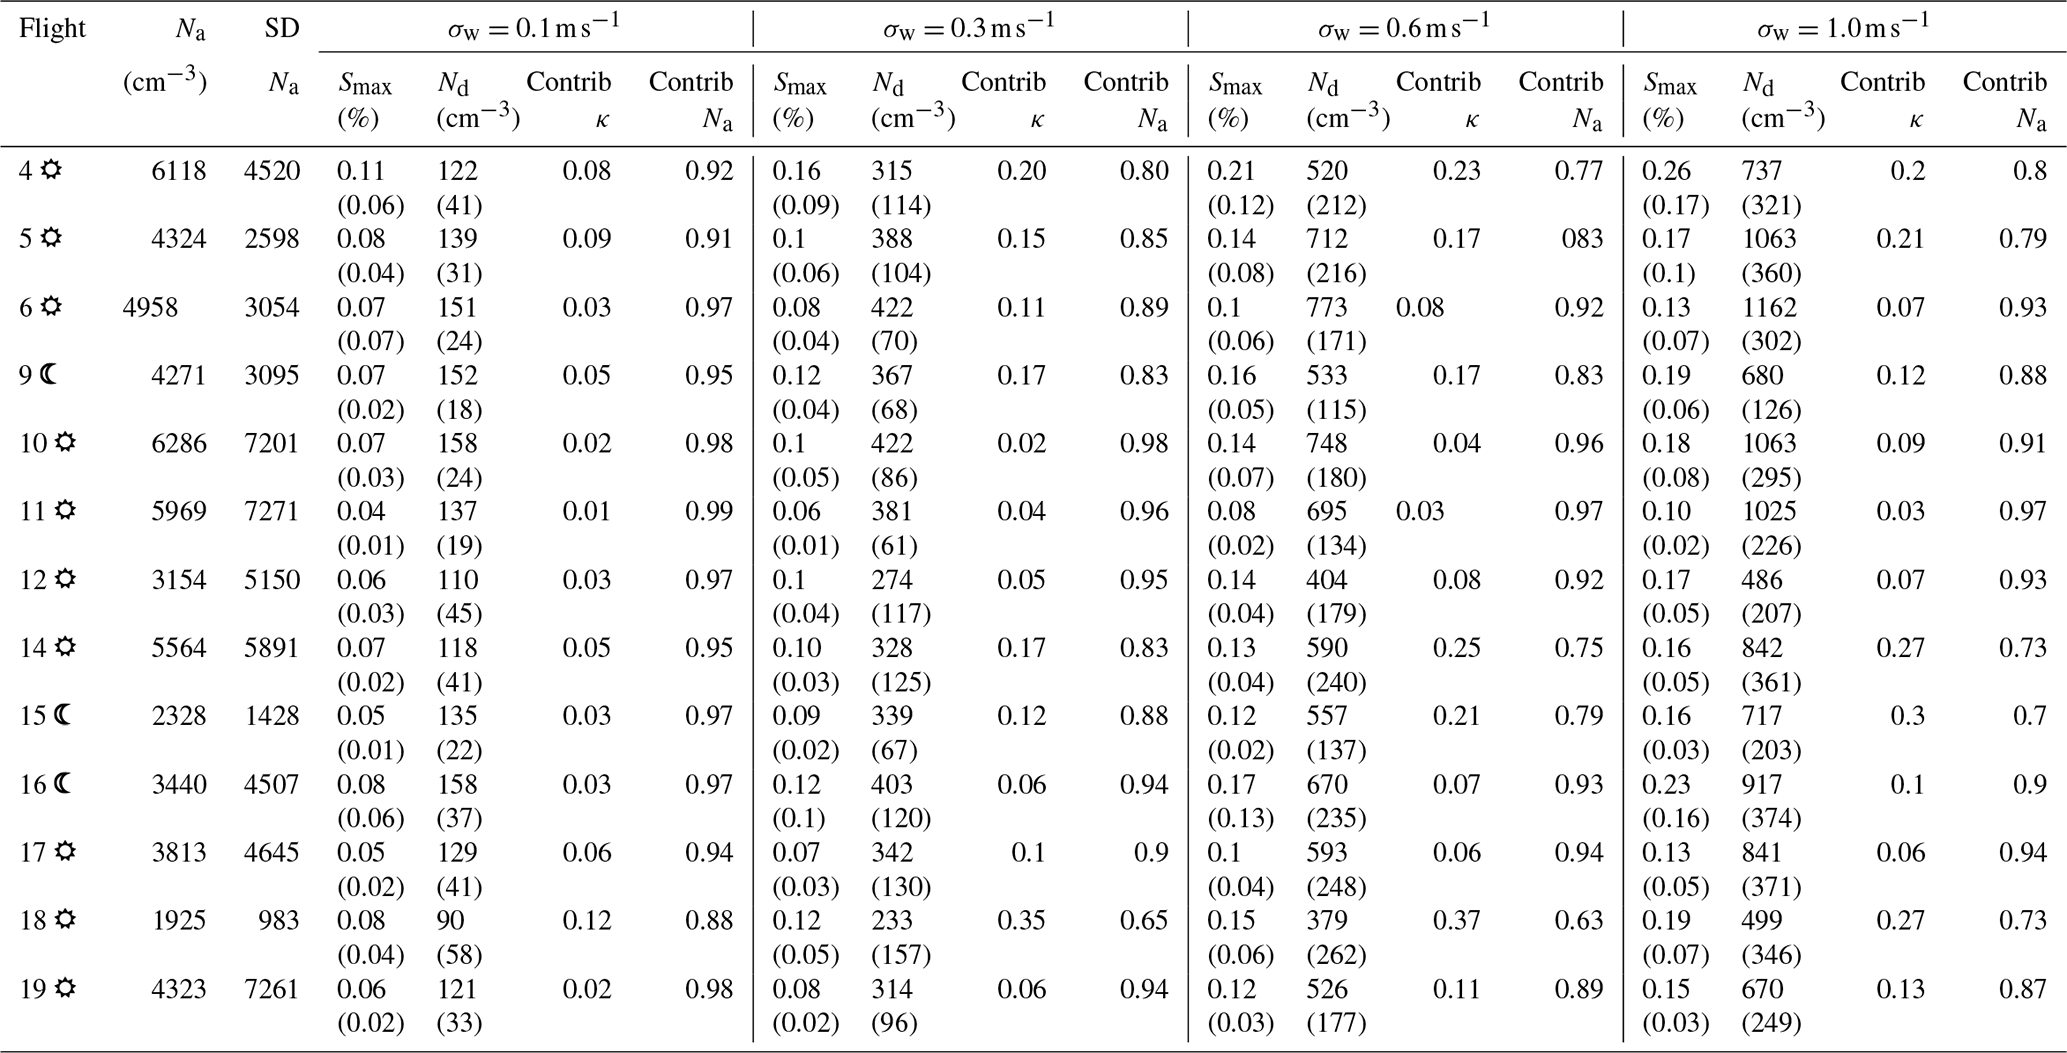
We also compute the variance in the derived Nd, estimated from the sensitivity to changes in aerosol number concentration Na, κ, and σw, expressed by the partial derivatives , , and computed from the parameterization using a finite-difference approximation (Bougiatioti et al., 2017; Kalkavouras et al., 2019) using
These sensitivities, together with the observed variance in Na, κ, and σw, are also used to attribute droplet number variability to variations in the respective aerosol and vertical-velocity parameters following the approach of Bougiatioti et al. (2017) and Kalkavouras et al. (2019):
3.1 Particle composition and size distribution
For the determination of the different aerosol species present, neutral and acidic sulfate salts are distinguished by the molar ratio of ammonium to sulfate ions in the aerosol. A molar ratio higher than 2 indicates the presence of only ammonium sulfate, while values between 1 and 2 indicate a mixture of ammonium sulfate and bisulfate (Seinfeld and Pandis, 1998). For most flights, the molar ratio of ammonium versus sulfate was above 2 (mean value of 2.41±0.72 and median of 2.06). For the nighttime flights, the values were somewhat lower (mean value of 1.91±0.42 and median of 1.85). Nevertheless, ammonium sulfate is always the predominant sulfate salt. Organic-mass fractions for the SENEX research flights are provided in Table 1. Overall, organic aerosol dominated the composition during all flights, contributing 66 %–75 % of the total aerosol volume. Most of the remaining aerosol volume consisted of ammonium sulfate, ranging from 12 % to 39 % (with a mean of 23 %±6 %). The organic-mass fraction during the flights varied with height (see Fig. 1). This vertical variability of the chemical composition can impact droplet number within the boundary layer as air masses from aloft may descend and interact with that underneath. Figure 1 represents the organic-mass fractions during Flights 6, 12, and 16, with all flights provided in the supplementary material (Fig. S1 in the Supplement). The dashed line represents the boundary layer for daytime (1200 m; Wagner et al., 2015) and for nighttime (500 m; Seidel et al., 2012). The lowest organic-mass fractions were observed during Flight 12 (36 %±10 %, with values almost 2-fold higher for altitudes >3000 m; Fig. 1b), while the highest organic-mass fractions were observed during flights over predominantly rural areas (Flights 5, 10, and 16; Fig. 1c). During Flight 5 the organic-mass fraction was high (68 %±5 %), with the highest values found in the free troposphere at altitudes >3000 m, as was the case for four other flights (5∕13 in total; Fig. S1 in the Supplement). High organic-mass fractions were also found during nighttime Flight 9, which included portions of the Atlanta metropolitan area, with values up to 78 %. The impact of the aerosol composition variability on droplet number is discussed in Sect. 3.2.

Figure 1Altitude as a function of time (UTC) colored by organic-mass fraction. Spatial and vertical distribution of the organic-mass fraction (a) for Flight 6, (b) for Flight 12, and (c) for Flight 16, denoting the difference in chemical composition, which in turn may influence cloud droplet number concentration. The dashed line represents the boundary layer height, derived from Wagner et al. (2015) for daytime (1200 m) and from Seidel et al. (2012) for nighttime (500 m).
The predominance of the organic fraction is also reflected in the hygroscopicity parameter values, with an overall , close to the proposed global average of 0.3 (Pringle et al., 2010). The highest values of κ, as expected, are observed during flights exhibiting the lowest organic-mass fraction, namely Flight 12, with κ=0.39 (Table 1). The rest of the κ values are close to the overall value of 0.25, corresponding to an organic-mass fraction of around 0.60.
Median aerosol size distributions and the respective total aerosol number are obtained from the median and interquartile range in each size bin from the aerosol size distribution measurements during segments where the aircraft flew at a constant height. Aerosol size distributions and changes in them during each flight are crucial as they are used as input for the droplet number parameterization. Overall, Na ranged from around 500 to over 100 000 cm−3, with number size distributions varying markedly over the course of a flight (Fig. 2). Free-tropospheric distributions exhibited characteristics of a bimodal distribution with a prominent broad accumulation-mode peak (80–200 nm) and an Aitken-mode peak (30–60 nm; Fig. 2a), while boundary layer size distributions exhibited a more prominent accumulation mode (Fig. 2b). There was considerable variability in the contributions of the nucleation, Aitken, and accumulation modes to total Na, depending on altitude and proximity to aerosol sources (Fig. 2c). Nevertheless, the modal diameters did not vary considerably, dictating that mostly particles in the same mode will activate, depending on the developed supersaturation. Distributions during nighttime flights exhibited similar total Na and variability between them; nevertheless, size distributions were more complex, exhibiting up to three distinct modes (20–40, 70–100, and 130–200 nm; Fig. 2d).
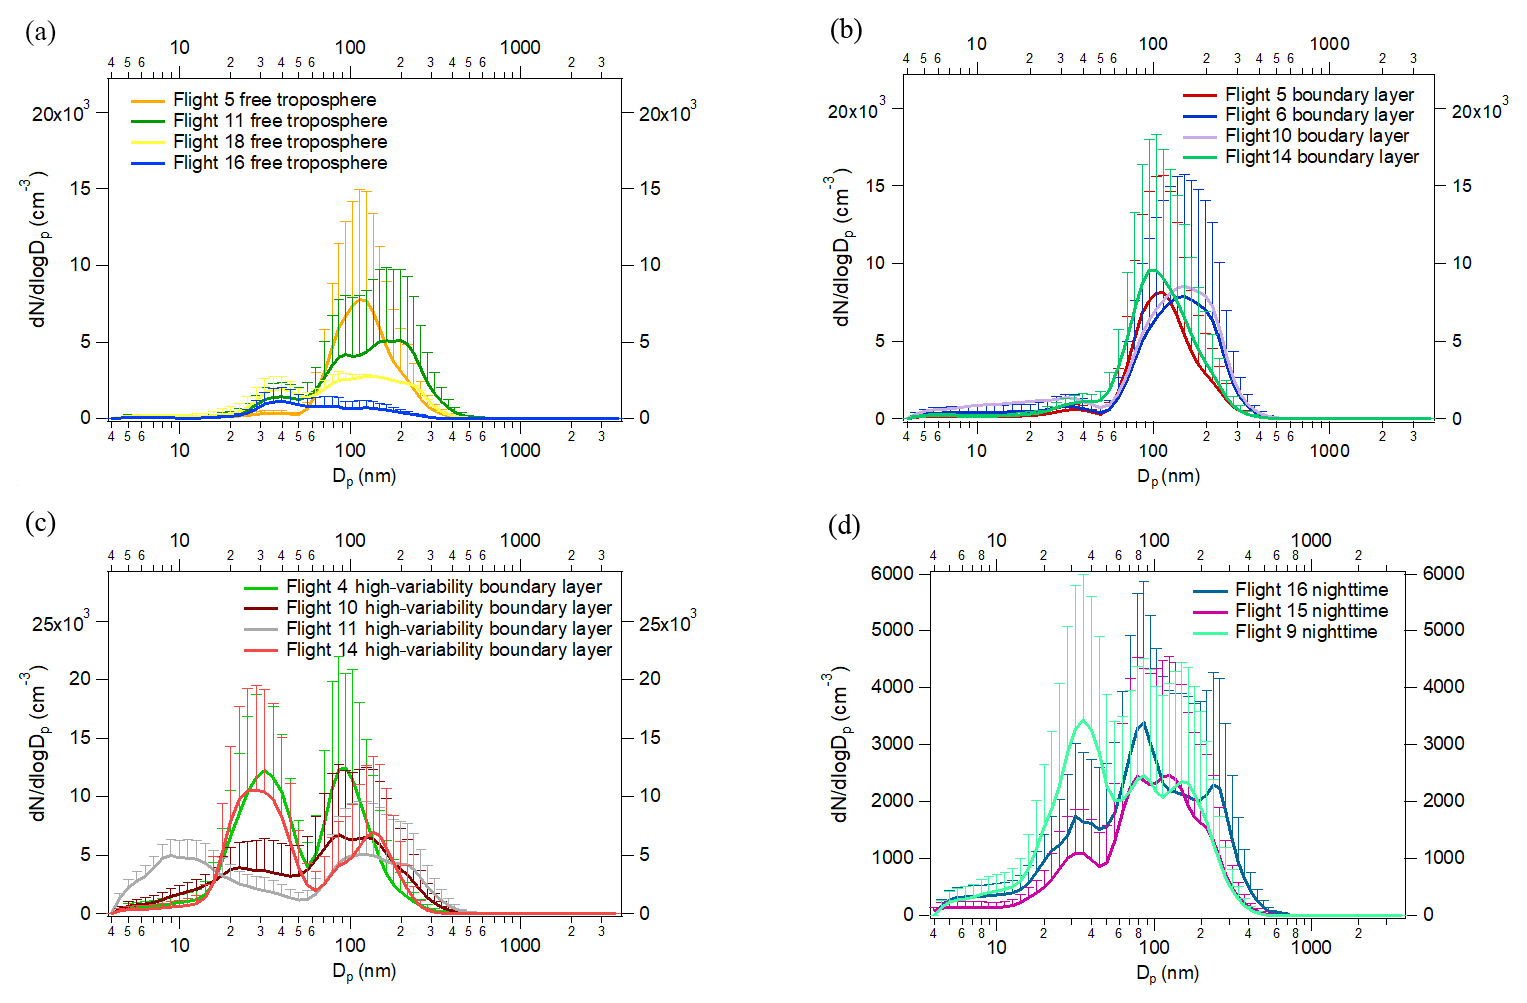
Figure 2Average particle number size distributions for (a) free-tropospheric conditions, (b) within the boundary layer, (c) during segments with high variability in total aerosol number, and (d) during nighttime passes. Error bars represent the 75th percentile of the distributions within each segment.
3.2 Potential cloud droplet number and maximum supersaturation
We first focus on calculation of the potential Nd and Smax for data from all 13 research flights and for the four prescribed values of σw that represent the observed range. These calculations are helpful in understanding the sensitivity of droplet formation to Na and κ for all the air masses sampled without considering the added variability induced by changes in turbulence expressed by σw (considered later). Results from this analysis are provided in Table 3. The highest Nd values were found for Flights 6 and 10, which correspond to ambient conditions with the highest Na, consistent with the sampling of the Atlanta urban environment. For a given σw, the variance in Nd is predominantly caused by changes in Na rather than changes in hygroscopicity (i.e., chemical composition). The highest influence of κ on Nd variability is found for Flight 18 (12 % and 35 % for 0.1 and 0.3 m s−1, respectively), during which Na was the lowest, and the organic-mass fraction was ∼50 %. The contribution of κ to the Nd variability is as high as 37 % (for 0.6 m s−1); despite this large contribution, droplet formation is usually considerably more sensitive to changes in aerosol concentration than to variations in composition. Overall, the relative contribution of the hygroscopicity to the variation in Nd increases from 5±3 % for σw=0.1 m s−1 to 12.3±8 % for σw=0.3 m s−1, 14.5±10 % for σw=0.3 m s−1, and 16.5±9 % for σw=1 m s−1. As σw increases, so does supersaturation and consequently Nd. On average, Nd increases by 62 % as σw increases from 0.1 to 0.3 m s−1, 70 % as σw increases from 0.3 to 0.6 m s−1, and another 39 % as σw increases from 0.6 to 1 m s−1. Tripling σw from 0.1 to 0.3 m s−1 results in a 31 % increase in Smax, while doubling σw from 0.3 to 0.6 m s−1 results in a 26.2 % increase in Smax, and a further σw increase to 1 m s−1 leads to an additional 20.7 % increase in Smax.
Considering the changes in vertical velocity between flights (Table 4), we observe that average σw during daytime varied little between flights and was large, ranging between 0.85 and 1.2 m s−1, with a mean of 0.97±0.21 m s−1. Under such conditions, water availability during droplet formation is high so that Nd is sensitive to Na. The degree of water availability is expressed by the Smax, which for all the evaluated SENEX data is 0.14±0.05 %. This level of maximum supersaturation activates particles of roughly >90 nm diameter (e.g., accumulation mode particles) into cloud droplets. The highest Smax ranged from 0.2 % to 0.3 % and was found during flights which exhibited large and highly variable σw (Flights 4, 5, 12, and 19), while the lowest Smax was below 0.10 % and was found during nighttime flights (Flights 9, 15, and 16). Contrasts in droplet formation between daytime and nighttime conditions may be driven primarily by the total aerosol number in the accumulation mode and not be affected by ultrafine particles.
Table 4Derived Smax, Nd, and σw for all research flights
along with the estimated contribution of each parameter to the variability
of the droplet number. The symbol “ ![]() ” next to each flight number refers to
a daytime flight, and “
” next to each flight number refers to
a daytime flight, and “ ![]() ” refers to a nighttime flight.
” refers to a nighttime flight.
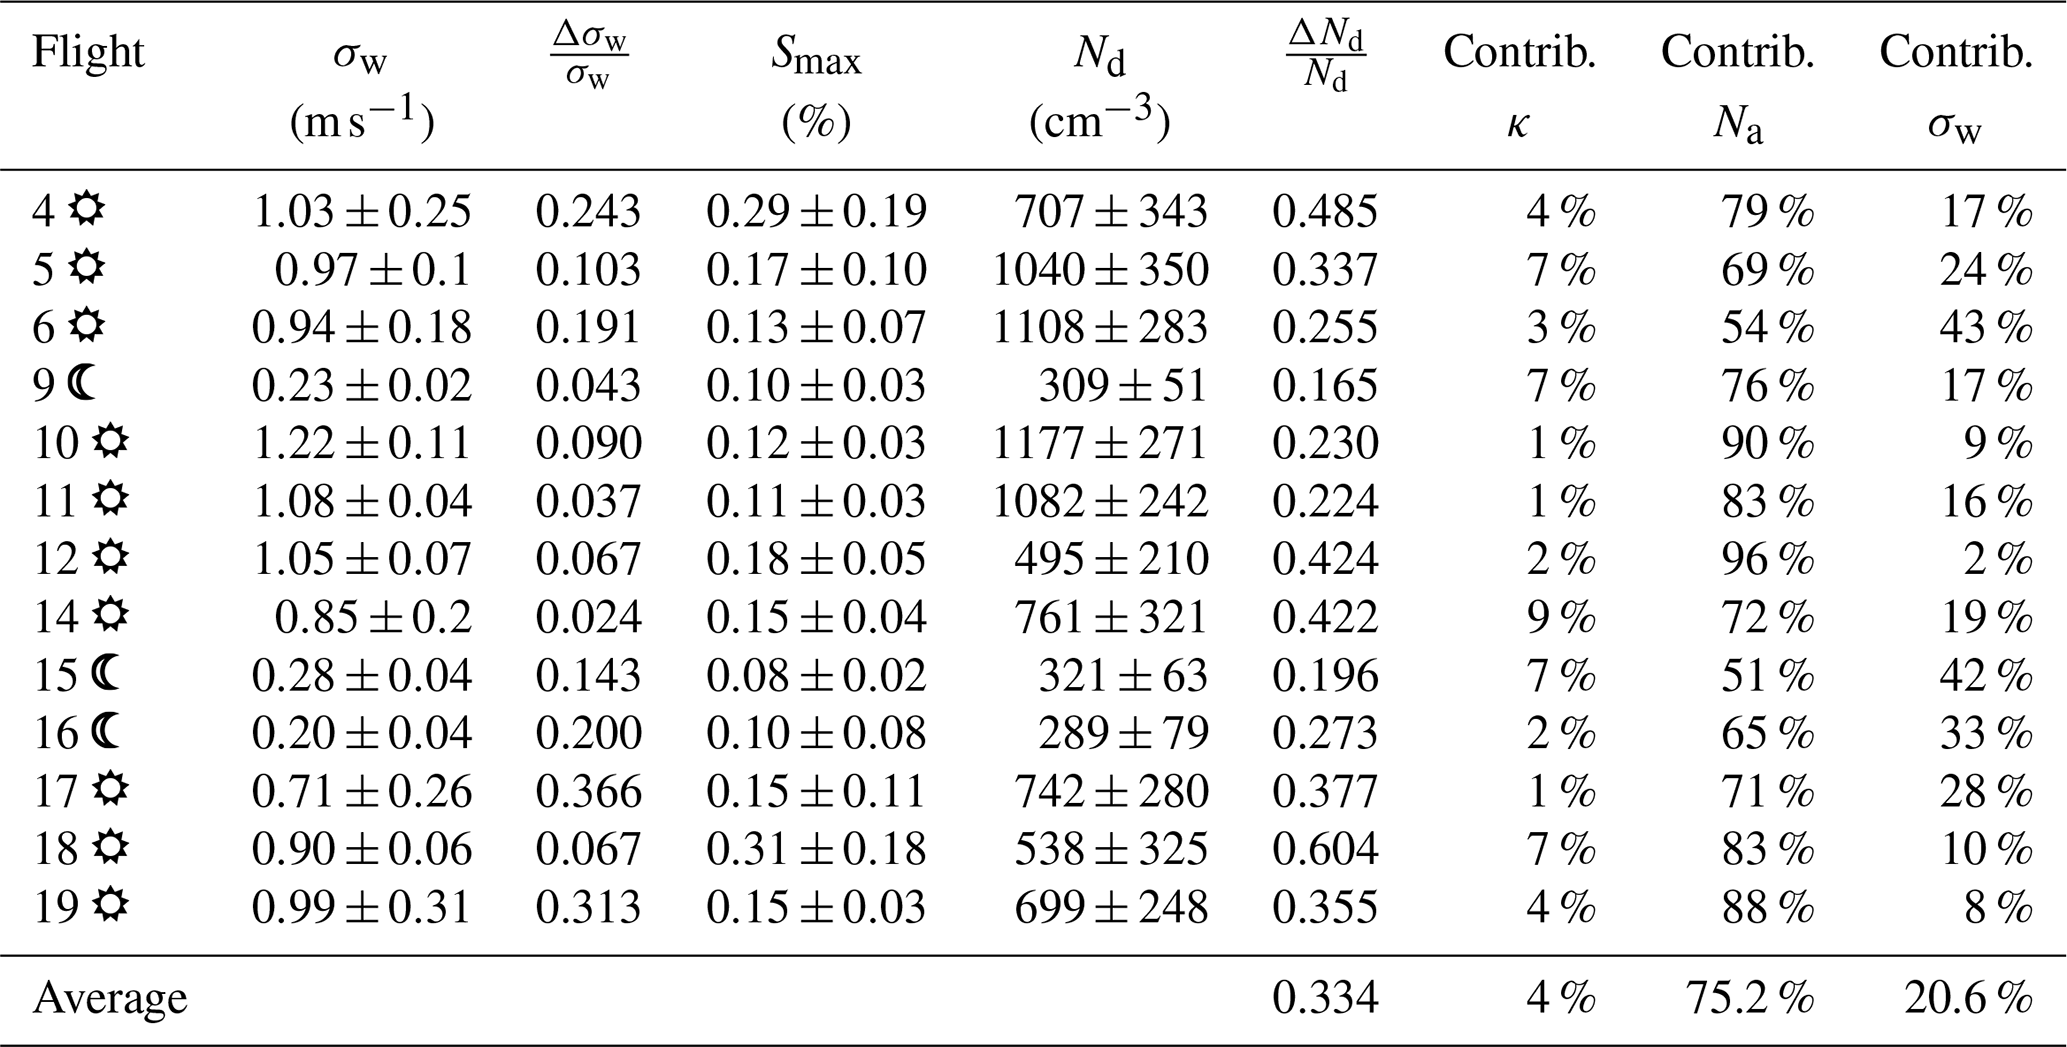
The large diurnal variability in σw (from 0.3 m s−1 at night to 1.0 m s−1 during the day) contributes considerably to the diurnal variability in Nd. To understand the relative importance of all parameters affecting droplet formation (σw, Na, κ), we estimate their contribution to the total variability in Nd based on the variances in κ, Na, and σw and the sensitivity of droplet formation to those parameters. The results of the analysis are summarized in Table 4. The σw variation during nighttime, although small (always less than 10 %), consistently remains an important contributor to Nd variability because droplet formation tends to be in the updraft velocity-limited regime. At higher values of σw (Table 4), the contribution of Na variability becomes a relatively dominant contributor to Nd variability.
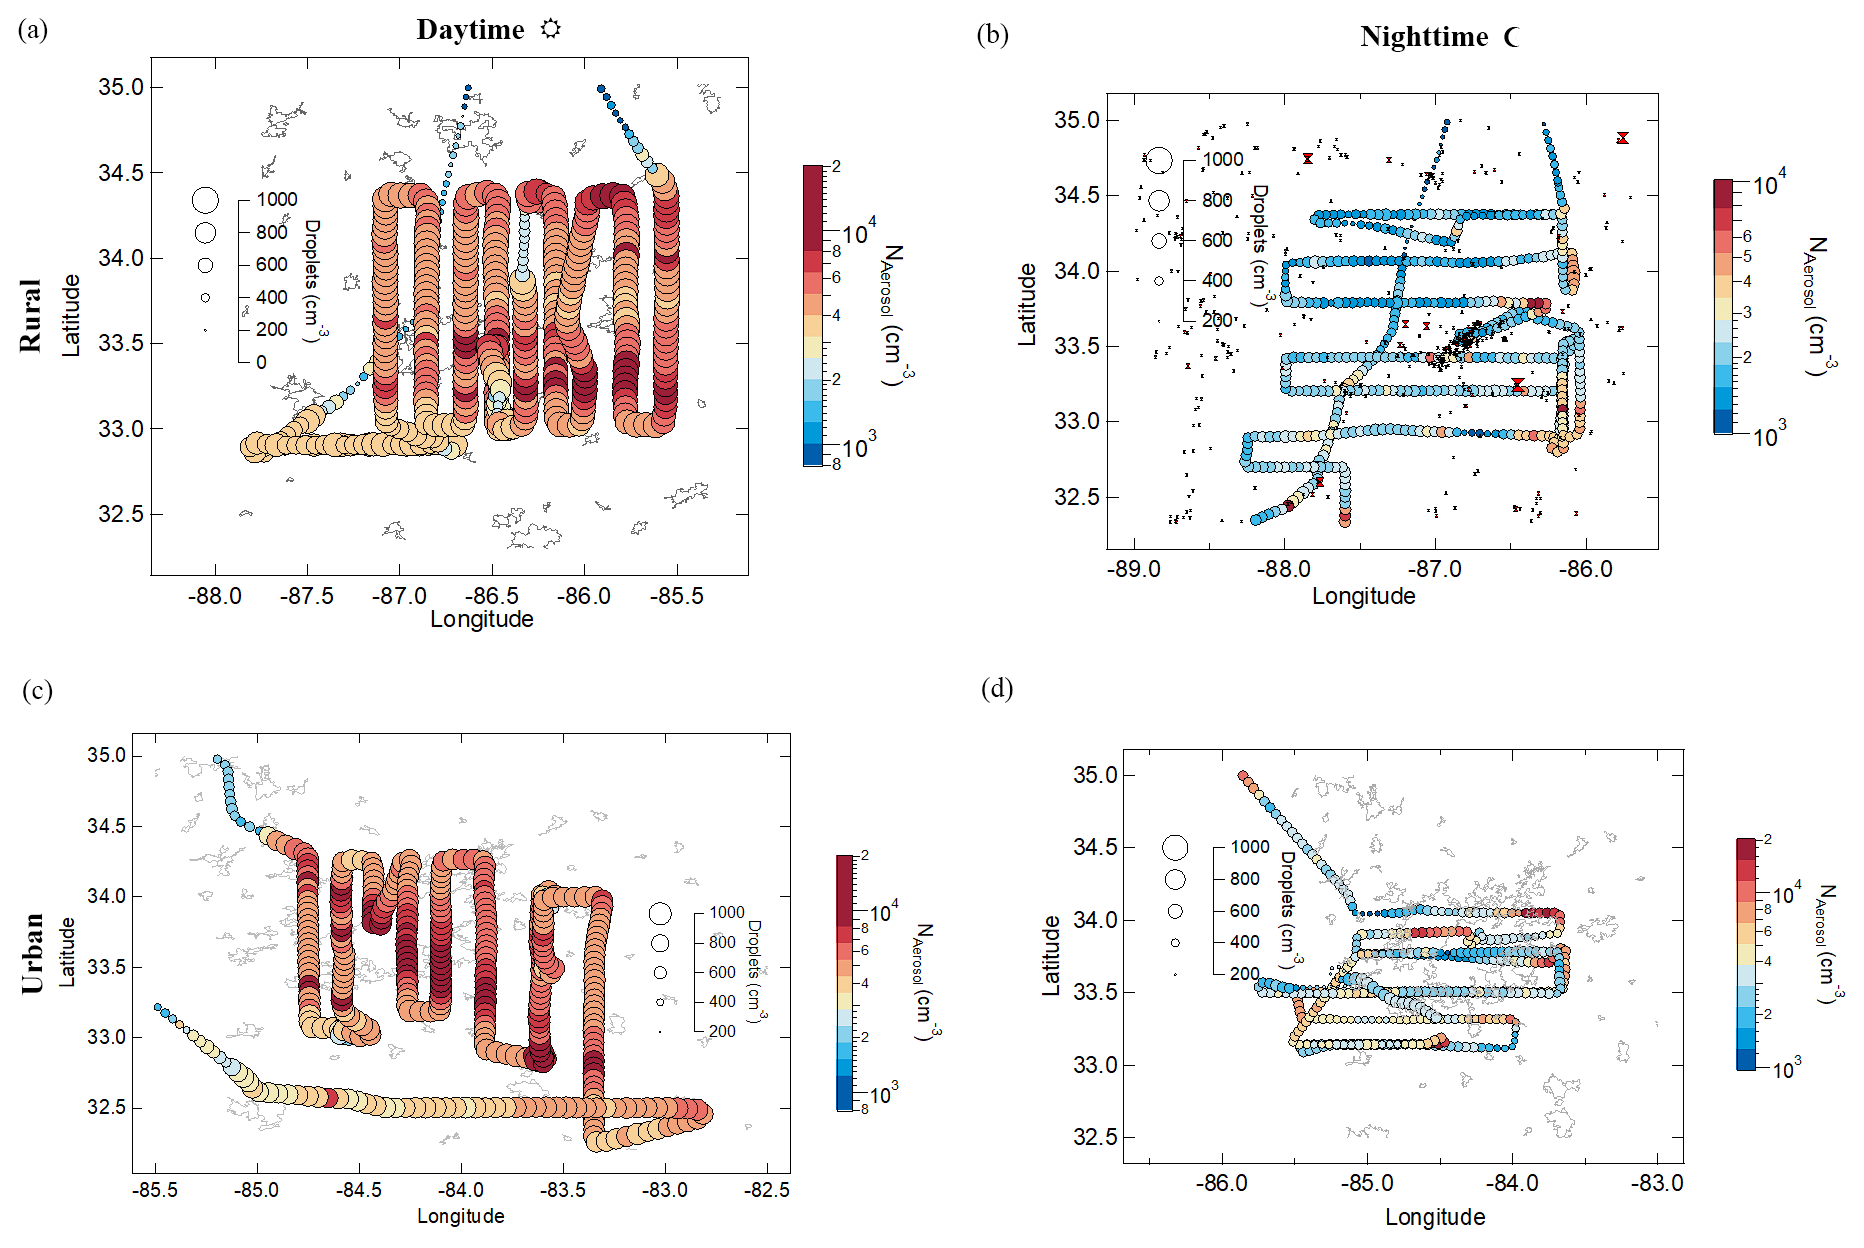
Figure 3Map of aircraft flight tracks showing calculated cloud droplet number (indicated by marker size in cubic centimeters) and total aerosol number (indicated by marker color) for the observed characteristic vertical velocity (w*). (a) For the rural sector during daytime (Flight 5) and (b) nighttime (Flight 15). (c) For urban Atlanta during daytime (Flight 6) and (d) nighttime (Flight 9). Note that the plotted data are 1 min averaged in order to better show the size and color of the markers.
Another way to express the importance of vertical velocity and aerosol number for the levels of droplet number is to compare flights where aerosol number or σw varies in a similar way. For this, we focus on two day–night flight pairs (Flights 5 and 15 and Flights 6 and 9), shown in Fig. 3. The first pair of flights were conducted over a rural area under moderate aerosol number conditions, while the second pair exhibited somewhat higher aerosol numbers owing to its proximity to the Atlanta metropolitan area. The size of the markers in Fig. 3 represents the potential number of droplets in clouds forming in each air mass sampled, while their color reflects the respective total aerosol number. In both pairs of flights, σw varies about the same between night and day (Table 4). For the Flights 5 and 15 pair, the difference in Nd between day and night (Nd is 69 % higher during daytime) is driven primarily by aerosol concentrations, with κ having limited influence (69 % by Na and 7 % from κ), and only 24 % by σw. For nighttime (Flight 15), the majority of variability in Nd is driven again by aerosol concentrations and to a limited extent by κ (51 % by Na and 7 % from κ) and 42 % by σw. For the second pair of night–day flights (Flights 6 and 9), Na is on average similar, σw varies by a factor of 4.0 between day and night, and κ varies by 13 %.
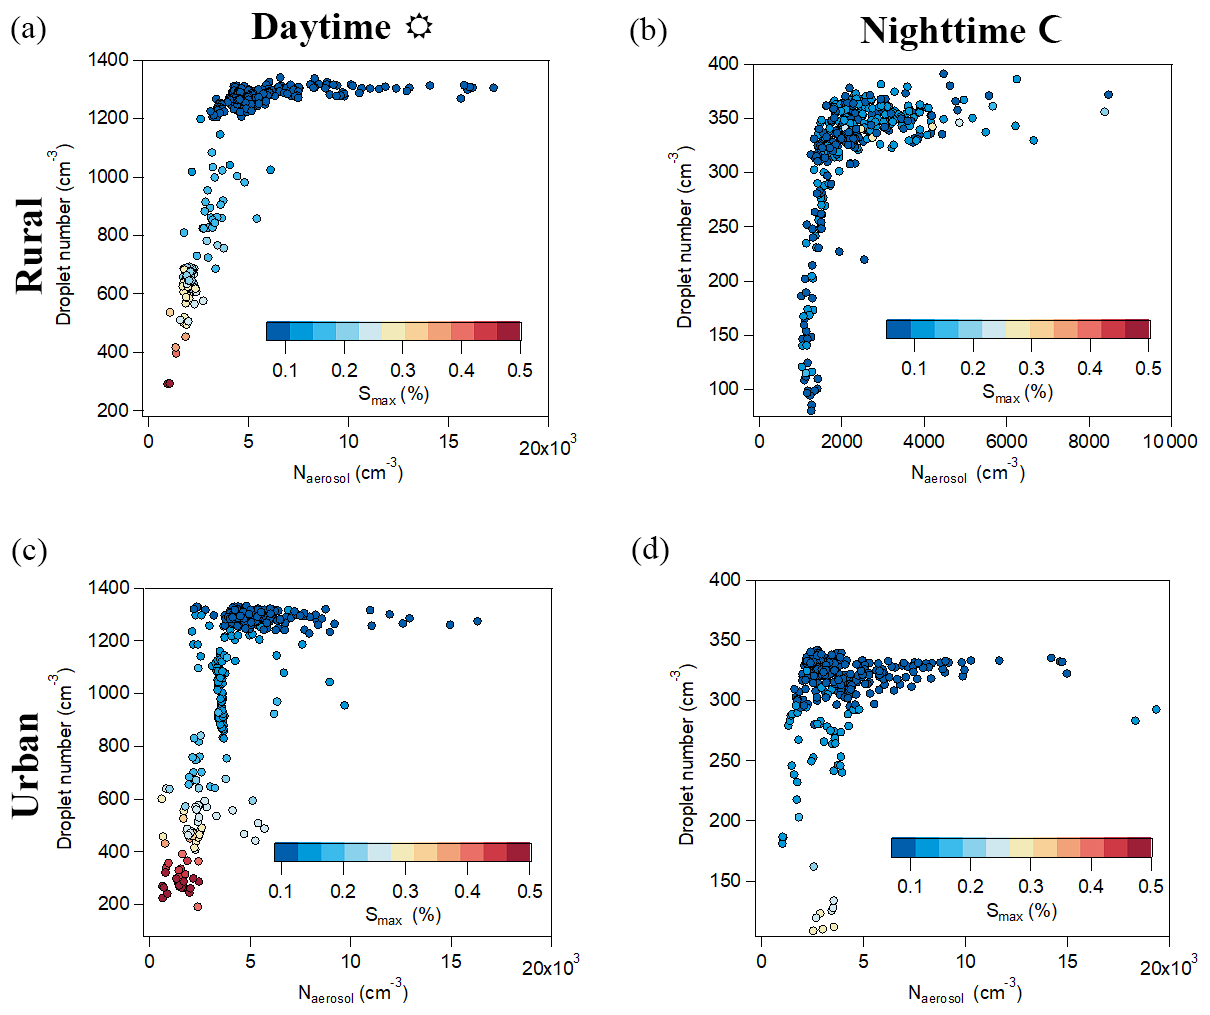
Figure 4Cloud droplet number vs. total aerosol number for the derived characteristic vertical velocity (w*) of each flight (Table 4). (a) For the rural sector during daytime (Flight 5) and (b) nighttime (Flight 15). (c) For urban Atlanta during daytime (Flight 6) and (d) nighttime (Flight 9). Data are colored by maximum supersaturation.
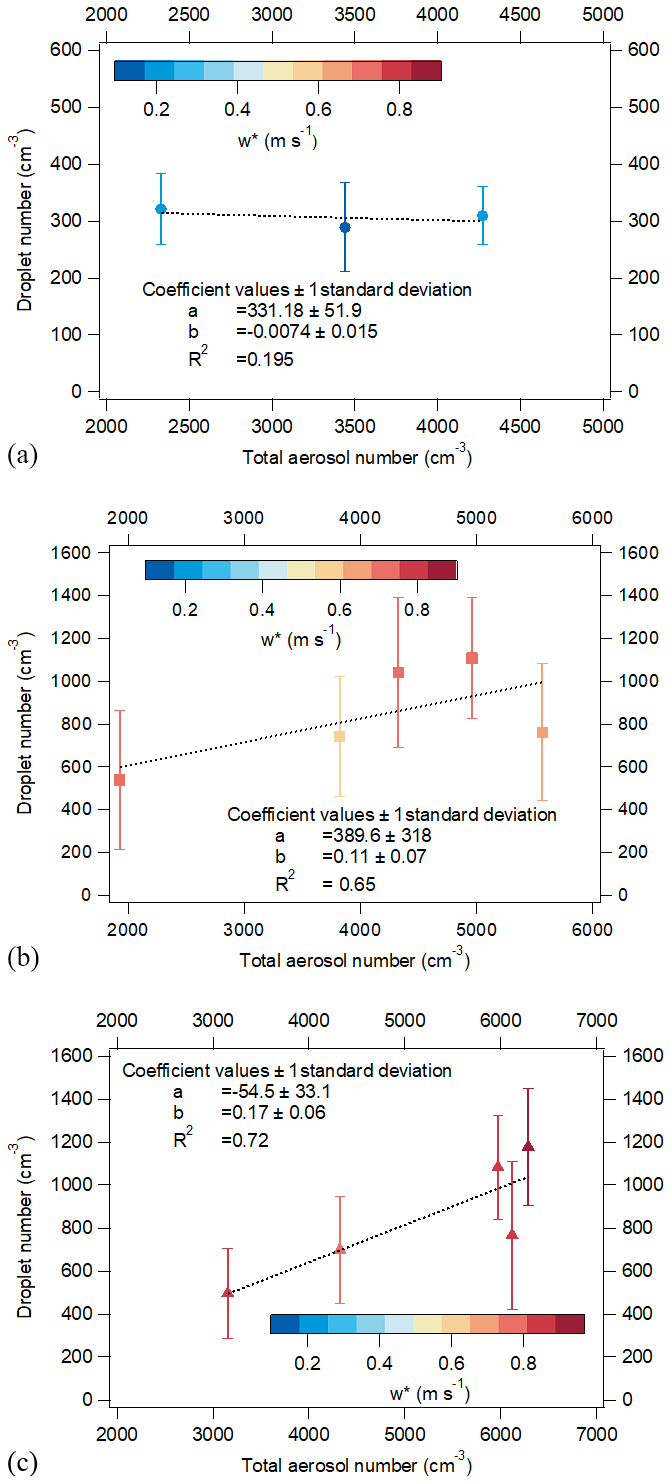
Figure 5Average cloud droplet number vs. total aerosol number, colored by characteristic velocity w* for each flight. Error bars represent the standard deviation of cloud droplet number during each flight.
The difference in Nd between day and night (where daytime values are 72.1 % higher than nighttime) is almost equally driven by Na and σw changes during the day (54 % and 43 % respectively), while it is predominantly driven by Na during the night (76 %; Table 4). Overall, in the proximity of an urban environment with higher aerosol concentrations, 57 % of the Nd variability is driven by aerosol (Na and κ) during the day and 83 % during the night.
Figure 4 shows Nd relative to Na for flights conducted in the two aforementioned areas during day (Flights 5 and 15) and night (Flights 6 and 9). For high enough Na, Nd becomes insensitive to additional amounts of aerosol and reaches a “limiting” Nd, which Kacarab et al. (2020) denote as . This limit in Nd is reached when the competition for water vapor to form droplets is high enough to inhibit the formation of droplets with further increase in Na. The intense competition for water vapor is reflected in the low value of Smax, which drops below 0.1 % when Nd is in the vicinity of (Fig. 4). The availability of water vapor during droplet formation is driven by σw; hence droplet formation is limited by σw and thus by velocity when Nd approaches . Figure 5 illustrates these effects by presenting the relationship between Na and Nd for “low” w∗ (<0.25 m s−1; upper panel), “medium” w∗ (0.5–0.7 m s−1; middle panel), and “high” w∗ (0.75–1 m s−1; lower panel) for all flights. Under low-w* conditions, changes in Na do not result in an large change in Nd, so its value corresponds to Nlim. When w∗ increases to “medium” values (Fig. 5b), Nd becomes sensitive to Na, which is further amplified at “high” values of w∗ (Fig. 5c). The covariance of aerosol number and vertical velocity (Fig. S3) means that the latter significantly enhances the inherent response of Nd to Na, which points to the importance of constraining vertical velocity and its variance to correctly capture the aerosol–cloud droplet relationship in any model. The covariance, also observed in other environments (e.g., Kacarab et al., 2020), may be a result of more effective convective transfer of aerosol-rich air to cloud-forming regions but requires further investigation.
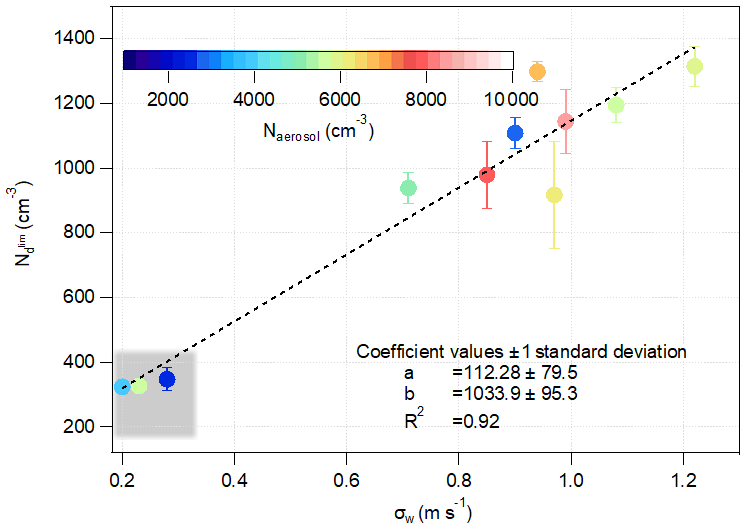
Figure 6Limiting droplet number vs. standard deviation of vertical velocity during flights where a velocity-limited regime is reached (all except Flights 4 and 12). The shaded area represents the segments of the flights conducted during nighttime, while the color scale denotes total aerosol number levels.
Analysis of Fig. 4 also shows that varies between 1200 cm−3 during day and around 350 cm−3 during night, which points to its strong dependence on σw. Indeed, when the for all flights (except Flights 4 and 12, for which insufficient aerosol is present to reach ) is expressed as a function of σw, a remarkable correlation emerges between the two parameters (Fig. 6). Even more interesting is that this relationship is quantitatively similar to the corresponding –σw relationship Kacarab et al. (2020) found for biomass-burning-influenced boundary layer clouds in the southeastern Atlantic. The implication of the –σw relationship and its potential universality is that when Nd approaches , its variability is a reflection of vertical-velocity variability alone, not variability in Na. This opens up the possibility to infer the vertical-velocity distribution from the droplet number concentration in regions where considerable amounts of aerosol are present.
Measurements of vertical wind velocity, ambient temperature, humidity, aerosol number size distribution, and composition in the SEUS obtained during the SENEX 2013 project are used to analyze the drivers of droplet formation. Overall, 13 research flights are studied, covering environments over sectors with different aerosol sources, aerosol number, size distribution, chemical composition, and updraft velocity. Aerosol volume is largely dominated by an organic fraction resulting in an estimated hygroscopicity of 0.25±0.05.
Based on the calculation of cloud droplet number concentration (Nd) and maximum supersaturation (Smax), we find that Nd variability is largely driven by fluctuations in Na (Table 4), in accordance with other recent studies (e.g., Fanourgakis et al., 2019; Kalkavouras et al., 2019; Kacarab et al., 2020). Nonetheless, Nd levels are also sensitive to vertical-velocity variations, σw; change in σw on its own by a factor of 4.0 may lead to an almost proportional change in Nd (factor of 3.6). However, these responses occur over the diurnal timescale, during which Na also changes; the covariance between σw and Na enhances the apparent response of Nd to changes in Na levels by a factor of 5 (Fig. 4). In “cleaner” environments where total aerosol number is not impacted by local sources, the relative response of Nd to σw is almost twice as great at night than during the day (24 % for daytime Flight 5 vs. 42 % for nighttime Flight 15). On the other hand, the relative response of Nd to Na is slightly lower during the night than during the day (51 % at night vs. 69 % during the day). In environments with elevated concentrations of accumulation-mode particles, the majority of Nd variations can be attributed to changes in Na and to a lesser extent to changes in σw. Variations in chemical composition (expressed by κ) do not contribute substantially to droplet number variability in most cases. As expected, Smax partially mitigates the response of Nd to Na. Overall, maximum supersaturation levels remain quite low (0.14 %±0.05 %), with the lowest levels (0.05 %±0.1 %) estimated closest to the surface. As a result, particles with diameters of >90 nm were the most substantial contributors to CCN.
Our analysis also reveals the importance of the variance in vertical velocity as a key driver of cloud droplet formation and its variability in the region. When the boundary layer turbulence is low (e.g., during nighttime), and water vapor supersaturations are low, σw and, as a consequence, vertical-velocity variability can be as important of a contributor to Nd as is Na. Even for situations with both high σw and Na, the large σw enables enough water vapor availability to activate significant numbers of particles to cloud droplets. On average, the two variables (Na and σw) contribute almost equally to the variability in Nd and together account for more than 90 % of variability. This finding is consistent with recent modeling studies noting the importance of vertical-velocity variability as a driver of the temporal variability of global hydrometeor concentration (Morales Betancourt and Nenes, 2014b; Sullivan et al., 2016). Furthermore, the Nd response from changes in Na is magnified up to 5-fold by correlated changes in σw. A similar situation was seen in marine boundary layers influenced by biomass burning in the southeastern Atlantic (Kacarab et al., 2020). Finally, we identify an upper limit to the number of droplets that can form in clouds which depends only on σw. This upper-limit value tends to be achieved near the surface, where Na tends to be higher. Whenever Nd values approach this upper limit, observed droplet variability is driven by σw and as a consequence by vertical-velocity changes only.
Many aspects of warm-cloud physics and especially droplet formation have been known for decades. Ensuring that global models simulate Nd for the “right reasons” (i.e., aerosol variability and/or vertical-velocity variability) is critical for constraining aerosol–cloud–climate interactions. Our study provides important constraints on the relationships between σw, Na, potential Nd, and Smax and shows the importance of covariance between σw and Na in controlling the maximum Nd that can result from a given value of σw. Given that global model assessments of aerosol–cloud–climate interactions do not evaluate for vertical velocity or its covariance with other parameters, our work shows that this omission can lead to an underappreciated source of hydrometeor variability and bias and thus a biased response of droplet number to aerosol perturbations.
The data used in this study can be downloaded from the NOAA public data repository at https://www.esrl.noaa.gov/csd/projects/senex/ (NOAA, 2020). The Gaussian fits used for determining σw and the droplet parameterization used for the calculations in the study are available from Athanasios Nenes (athanasios.nenes@epfl.ch) upon request.
The supplement related to this article is available online at: https://doi.org/10.5194/acp-20-12163-2020-supplement.
AB and AN designed and initiated the study. Analysis methodology and software were provided by AN. The analysis was carried out by AB and AN, with comments from JJL, CAB, and AMM. Data curation was provided by AB, JJL, CAB, JAdG, JL, AMM, and AW. The manuscript was written by AB and AN with additional comments provided by JJL, CAB, AW, and AMM. All authors reviewed the manuscript.
The authors declare that they have no conflict of interest.
This study was supported by the Environmental Protection Agency STAR grant (grant no. R835410) and the European Research Council, CoG-2016 project PyroTRACH (grant no. 726165), funded by H2020-EU.1.1. – Excellent Science. Aikaterini Bougiatioti also acknowledges support from the action “Supporting of Postdoctoral Researchers” of the Operational Program “Education and Lifelong Learning” (action's beneficiary: General Secretariat for Research and Technology) and is cofinanced by the European Social Fund (ESF) and the Greek State. Charles A. Brock, Joost A. de Gouw, Jin Liao, and André Welti were supported in part by the NOAA's Health of the Atmosphere and Atmospheric Chemistry, Carbon Cycle, and Climate programs. Jack J. Lin acknowledges funding from the Academy of Finland (grant no. 331532).
This research has been supported by the US Environmental Protection Agency (STAR grant no. R835410), the General Secretariat for Research and Technology (“Supporting of Postdoctoral Researchers” action of the Operational Program “Education and Lifelong Learning”), and the H2020 European Research Council (PyroTRACH; grant no. 726165).
This paper was edited by Lynn M. Russell and reviewed by two anonymous referees.
Barahona, D., West, R. E. L., Stier, P., Romakkaniemi, S., Kokkola, H., and Nenes, A.: Comprehensively accounting for the effect of giant CCN in cloud activation parameterizations, Atmos. Chem. Phys., 10, 2467–2473, https://doi.org/10.5194/acp-10-2467-2010, 2010.
Bougiatioti, A., Fountoukis, C., Kalivitis, N., Pandis, S. N., Nenes, A., and Mihalopoulos, N.: Cloud condensation nuclei measurements in the marine boundary layer of the Eastern Mediterranean: CCN closure and droplet growth kinetics, Atmos. Chem. Phys., 9, 7053–7066, https://doi.org/10.5194/acp-9-7053-2009, 2009.
Bougiatioti, A., Bezantakos, S., Stavroulas, I., Kalivitis, N., Kokkalis, P., Biskos, G., Mihalopoulos, N., Papayannis, A., and Nenes, A.: Biomass-burning impact on CCN number, hygroscopicity and cloud formation during summertime in the eastern Mediterranean, Atmos. Chem. Phys., 16, 7389–7409, https://doi.org/10.5194/acp-16-7389-2016, 2016.
Bougiatioti, A., Argyrouli, A., Solomos, S., Vratolis, S., Eleftheriadis, K., Papayannis, A., and Nenes, A.: CCN activity, variability and influence on droplet formation during the HygrA-Cd campaign in Athens, Atmosphere, 8, 108, https://doi.org/10.3390/atmos8060108, 2017.
Brock, C. A., Cozic, J., Bahreini, R., Froyd, K. D., Middlebrook, A. M., McComiskey, A., Brioude, J., Cooper, O. R., Stohl, A., Aikin, K. C., de Gouw, J. A., Fahey, D. W., Ferrare, R. A., Gao, R.-S., Gore, W., Holloway, J. S., Hübler, G., Jefferson, A., Lack, D. A., Lance, S., Moore, R. H., Murphy, D. M., Nenes, A., Novelli, P. C., Nowak, J. B., Ogren, J. A., Peischl, J., Pierce, R. B., Pilewskie, P., Quinn, P. K., Ryerson, T. B., Schmidt, K. S., Schwarz, J. P., Sodemann, H., Spackman, J. R., Stark, H., Thomson, D. S., Thornberry, T., Veres, P., Watts, L. A., Warneke, C., and Wollny, A. G.: Characteristics, sources, and transport of aerosols measured in spring 2008 during the aerosol, radiation, and cloud processes affecting Arctic Climate (ARCPAC) Project, Atmos. Chem. Phys., 11, 2423–2453, https://doi.org/10.5194/acp-11-2423-2011, 2011.
Brock, C. A., Wagner, N. L., Anderson, B. E., Attwood, A. R., Beyersdorf, A., Campuzano-Jost, P., Carlton, A. G., Day, D. A., Diskin, G. S., Gordon, T. D., Jimenez, J. L., Lack, D. A., Liao, J., Markovic, M. Z., Middlebrook, A. M., Ng, N. L., Perring, A. E., Richardson, M. S., Schwarz, J. P., Washenfelder, R. A., Welti, A., Xu, L., Ziemba, L. D., and Murphy, D. M.: Aerosol optical properties in the southeastern United States in summer – Part 1: Hygroscopic growth, Atmos. Chem. Phys., 16, 4987–5007, https://doi.org/10.5194/acp-16-4987-2016, 2016.
Canagaratna, M. R., Jayne, J. T., Jimenez, J. L., Allan, J. D., Alfarra,M. R., Zhang, Q., Onasch, T. B., Drewnick, F., Coe, H., Middlebrook, A., Delia, A., Williams, L. R., Trimborn, A. M., Northway, M. J., DeCarlo, P. F., Kolb, C. E., Davidovits, P., and Worsnop, D. R.: Chemical and microphysical characterization of ambient aerosols with the aerodyne aerosol mass spectrometer, Mass Spectrom. Rev., 26, 185–222, 2007.
Carlton, A.G., de Gouw, J. A., Jimenez, J. L., Ambrose, J. L., Attwood, A. R., Brown, S., Baker, K. R., Brock, C., Cohen, R. C., Edgerton, S., Farkas, C., Farmer, D., Goldstein, A. H., Gratz, L., Guenther, A., Hunt, S., Jaeglé, L., Jaffe, D. A., Mak, J., McClure, C., Nenes, A., Nguyen, T. K. V., Pierce, J. R., de Sa, S., Selin, N. E., Shah, V., Shaw, S., Shepson, P. B., Song, S., Stutz, J., Surratt, J., Turpin, B. J., Warneke, C., Washenfelder, R. A., Wennberg, P. O., and Zhou, X.: A synthesis of the southeast atmosphere studies: coordinated investigation of fundamental atmospheric chemistry questions, B. Am. Meteorol. Soc., 99, 547–567, https://doi.org/10.1175/BAMS-D-16-0048.1, 2018.
Cerully, K. M., Bougiatioti, A., Hite Jr., J. R., Guo, H., Xu, L., Ng, N. L., Weber, R., and Nenes, A.: On the link between hygroscopicity, volatility, and oxidation state of ambient and water-soluble aerosols in the southeastern United States, Atmos. Chem. Phys., 15, 8679–8694, https://doi.org/10.5194/acp-15-8679-2015, 2015.
Charlson, R. J., Schwartz, S. E., Hales, J. M., Cess, J. M., Coakley Jr., J. A., Hansen, J. E., and Hofmann, D. J.: Climate forcing by anthropogenic aerosol, Science, 225, 5043, 423–430, https://doi.org/10.1126/science.255.5043.423, 1992.
Cubison, M. J., Ervens, B., Feingold, G., Docherty, K. S., Ulbrich, I. M., Shields, L., Prather, K., Hering, S., and Jimenez, J. L.: The influence of chemical composition and mixing state of Los Angeles urban aerosol on CCN number and cloud properties, Atmos. Chem. Phys., 8, 5649–5667, https://doi.org/10.5194/acp-8-5649-2008, 2008.
Fanourgakis, G. S., Kanakidou, M., Nenes, A., Bauer, S. E., Bergman, T., Carslaw, K. S., Grini, A., Hamilton, D. S., Johnson, J. S., Karydis, V. A., Kirkevåg, A., Kodros, J. K., Lohmann, U., Luo, G., Makkonen, R., Matsui, H., Neubauer, D., Pierce, J. R., Schmale, J., Stier, P., Tsigaridis, K., van Noije, T., Wang, H., Watson-Parris, D., Westervelt, D. M., Yang, Y., Yoshioka, M., Daskalakis, N., Decesari, S., Gysel-Beer, M., Kalivitis, N., Liu, X., Mahowald, N. M., Myriokefalitakis, S., Schrödner, R., Sfakianaki, M., Tsimpidi, A. P., Wu, M., and Yu, F.: Evaluation of global simulations of aerosol particle and cloud condensation nuclei number, with implications for cloud droplet formation, Atmos. Chem. Phys., 19, 8591–8617, https://doi.org/10.5194/acp-19-8591-2019, 2019.
Fry, J. L., Brown, S. S., Middlebrook, A. M., Edwards, P. M., Campuzano-Jost, P., Day, D. A., Jimenez, J. L., Allen, H. M., Ryerson, T. B., Pollack, I., Graus, M., Warneke, C., de Gouw, J. A., Brock, C. A., Gilman, J., Lerner, B. M., Dubé, W. P., Liao, J., and Welti, A.: Secondary organic aerosol (SOA) yields from NO3 radical + isoprene based on nighttime aircraft power plant plume transects, Atmos. Chem. Phys., 18, 11663–11682, https://doi.org/10.5194/acp-18-11663-2018, 2018.
IPCC (Intergovernmental Panel on Climate Change): Climate Change 2013: The Physical Science Basis, Summary for Policymakers, Cambridge University Press, Cambridge, UK and New York, 2013.
Kacarab, M., Thornhill, K. L., Dobracki, A., Howell, S. G., O'Brien, J. R., Freitag, S., Poellot, M. R., Wood, R., Zuidema, P., Redemann, J., and Nenes, A.: Biomass burning aerosol as a modulator of the droplet number in the southeast Atlantic region, Atmos. Chem. Phys., 20, 3029–3040, https://doi.org/10.5194/acp-20-3029-2020, 2020.
Kalkavouras, P., Bougiatioti, A., Kalivitis, N., Stavroulas, I., Tombrou, M., Nenes, A., and Mihalopoulos, N.: Regional new particle formation as modulators of cloud condensation nuclei and cloud droplet number in the eastern Mediterranean, Atmos. Chem. Phys., 19, 6185–6203, https://doi.org/10.5194/acp-19-6185-2019, 2019.
Kupc, A., Williamson, C., Wagner, N. L., Richardson, M., and Brock, C. A.: Modification, calibration, and performance of the Ultra-High Sensitivity Aerosol Spectrometer for particle size distribution and volatility measurements during the Atmospheric Tomography Mission (ATom) airborne campaign, Atmos. Meas. Tech., 11, 369–383, https://doi.org/10.5194/amt-11-369-2018, 2018.
Lance, S., Nenes, A., Mazzoleni, C., Dubey, M. K., Gates, H., Varutbangkul, V., Rissman, T. A., Murphy, S. M., Sorooshian, A., Flagan, T. A., Seinfeld, J. H., Feingold, G., and Jinsson, H.: Cloud condensation nuclei activity, closure, and droplet growth kinetics of Houston aerosol during the Gulf of Mexico Atmospheric Composition and Climate Study (GoMACCS), J. Geophys. Res., 114, D00F15, https://doi.org/10.1029/2008JD011699, 2009.
Lathem, T. L., Beyersdorf, A. J., Thornhill, K. L., Winstead, E. L., Cubison, M. J., Hecobian, A., Jimenez, J. L., Weber, R. J., Anderson, B. E., and Nenes, A.: Analysis of CCN activity of Arctic aerosol and Canadian biomass burning during summer 2008, Atmos. Chem. Phys., 13, 2735–2756, https://doi.org/10.5194/acp-13-2735-2013, 2013.
Leibensperger, E. M., Mickley, L. J., Jacob, D. J., Chen, W.-T., Seinfeld, J. H., Nenes, A., Adams, P. J., Streets, D. G., Kumar, N., and Rind, D.: Climatic effects of 1950–2050 changes in US anthropogenic aerosols – Part 1: Aerosol trends and radiative forcing, Atmos. Chem. Phys., 12, 3333–3348, https://doi.org/10.5194/acp-12-3333-2012, 2012a.
Leibensperger, E. M., Mickley, L. J., Jacob, D. J., Chen, W.-T., Seinfeld, J. H., Nenes, A., Adams, P. J., Streets, D. G., Kumar, N., and Rind, D.: Climatic effects of 1950–2050 changes in US anthropogenic aerosols – Part 2: Climate response, Atmos. Chem. Phys., 12, 3349–3362, https://doi.org/10.5194/acp-12-3349-2012, 2012b.
Middlebrook, A. M., Bahreini, R., Jimenez, J. L., and Canagaratna, M. R.: Evaluation of composition-dependent collection efficiencies for the Aerodyne aerosol mass spectrometer using field data, Aerosol Sci. Tech., 46, 258–271, 2012.
Moore, R. H., Bahreini, R., Brock, C. A., Froyd, K. D., Cozic, J., Holloway, J. S., Middlebrook, A. M., Murphy, D. M., and Nenes, A.: Hygroscopicity and composition of Alaskan Arctic CCN during April 2008, Atmos. Chem. Phys., 11, 11807–11825, https://doi.org/10.5194/acp-11-11807-2011, 2011.
Moore, R. H., Cerully, K., Bahreini, R., Brock, C. A., Middlebrook, A. M., and Nenes, A.: Hygroscopicity and composition of California CCN during summer 2010, J. Geophys. Res., 117, D00V12, https://doi.org/10.1029/2011JD017352, 2012.
Morales, R. and Nenes, A.: Characteristic updrafts for computing distribution-averaged cloud droplet number, autoconversion rate effective radius, J. Geophys. Res., 115, D18220, https://doi.org/10.1029/2009JD013233, 2010.
Morales Betancourt, R. and Nenes, A.: Droplet activation parameterization: the population-splitting concept revisited, Geosci. Model Dev., 7, 2345–2357, https://doi.org/10.5194/gmd-7-2345-2014, 2014a.
Morales Betancourt, R. and Nenes, A.: Understanding the contributions of aerosol properties and parameterization discrepancies to droplet number variability in a global climate model, Atmos. Chem. Phys., 14, 4809–4826, https://doi.org/10.5194/acp-14-4809-2014, 2014b.
Nenes, A. and Seinfeld, J. H.: Parameterization of cloud droplet formation in global climate models, J. Geophys. Res., 108, 4415, https://doi.org/10.1029/2002JD002911, 2003.
NOAA: SENEX 2013, available at: https://www.esrl.noaa.gov/csd/projects/senex/, last access: 13 October 2020.
Petters, M. D. and Kreidenweis, S. M.: A single parameter representation of hygroscopic growth and cloud condensation nucleus activity, Atmos. Chem. Phys., 7, 1961–1971, https://doi.org/10.5194/acp-7-1961-2007, 2007.
Pringle, K. J., Tost, H., Pozzer, A., Pöschl, U., and Lelieveld, J.: Global distribution of the effective aerosol hygroscopicity parameter for CCN activation, Atmos. Chem. Phys., 10, 5241–5255, https://doi.org/10.5194/acp-10-5241-2010, 2010.
Quinn, P. K., Bates, T. S., Coffman, D. J., and Covert, D. S.: Influence of particle size and chemistry on the cloud nucleating properties of aerosols, Atmos. Chem. Phys., 8, 1029–1042, https://doi.org/10.5194/acp-8-1029-2008, 2008.
Reutter, P., Su, H., Trentmann, J., Simmel, M., Rose, D., Gunthe, S. S., Wernli, H., Andreae, M. O., and Pöschl, U.: Aerosol- and updraft-limited regimes of cloud droplet formation: influence of particle number, size and hygroscopicity on the activation of cloud condensation nuclei (CCN), Atmos. Chem. Phys., 9, 7067–7080, https://doi.org/10.5194/acp-9-7067-2009, 2009.
Seidel, D. J., Zhang, Y., Beljaars, A., Golaz, J.-C., Jacobson, A. R., and Medeiros, B.: Climatology of the planetary boundary layer over the continental United States and Europe, J. Geophys. Res., 117, D17106, https://doi.org/10.1029/2012JD018143, 2012.
Seinfeld, J., and Pandis, S.: Atmospheric Chemistry and Physics: From Air Pollution to Climate Change, John Wiley, Hoboken, NJ, 1998.
Seinfeld, J. H., Bretherton, C. S., Carslaw, K. S., Coe, H., De- Mott, P. J., Dunlea, E. J., Feingold, G., Ghan, S. J., Guenther, A. B., Kahn, R. A., Kracunas, I. P., Kreidenweis, S. M., Molina, M. J., Nenes, A., Penner, J. E., Prather, K. A., Ramanathan, V., Ramaswamy, V., Rasch, P. J., Ravishankara, A. R., Rosenfeld, D., Stephens, G., and Wood R.: Improving our fundamental understanding of the role of aerosol-cloud interactions in the climate system, P. Natl. Acad. Sci. USA, 113, 5781–5790, https://doi.org/10.1073/pnas.1514043113, 2016.
Sullivan, S. C., Lee, D., Oreopoulos, L., and Nenes, A.: The role of updraft velocity in temporal variability of cloud hydrometeor number, P. Natl. Acad. Sci. USA, 113, 5791–5796, https://doi.org/10.1073/pnas.1514039113, 2016.
Wagner, N. L., Brock, C. A., Angevine, W. M., Beyersdorf, A., Campuzano-Jost, P., Day, D., de Gouw, J. A., Diskin, G. S., Gordon, T. D., Graus, M. G., Holloway, J. S., Huey, G., Jimenez, J. L., Lack, D. A., Liao, J., Liu, X., Markovic, M. Z., Middlebrook, A. M., Mikoviny, T., Peischl, J., Perring, A. E., Richardson, M. S., Ryerson, T. B., Schwarz, J. P., Warneke, C., Welti, A., Wisthaler, A., Ziemba, L. D., and Murphy, D. M.: In situ vertical profiles of aerosol extinction, mass, and composition over the southeast United States during SENEX and SEAC4RS: observations of a modest aerosol enhancement aloft, Atmos. Chem. Phys., 15, 7085–7102, https://doi.org/10.5194/acp-15-7085-2015, 2015.
Wang, J., Cubison, M. J., Aiken, A. C., Jimenez, J. L., and Collins, D. R.: The importance of aerosol mixing state and size-resolved composition on CCN concentration and the variation of the importance with atmospheric aging of aerosols, Atmos. Chem. Phys., 10, 7267–7283, https://doi.org/10.5194/acp-10-7267-2010, 2010.
Warneke, C., Trainer, M., de Gouw, J. A., Parrish, D. D., Fahey, D. W., Ravishankara, A. R., Middlebrook, A. M., Brock, C. A., Roberts, J. M., Brown, S. S., Neuman, J. A., Lerner, B. M., Lack, D., Law, D., Hübler, G., Pollack, I., Sjostedt, S., Ryerson, T. B., Gilman, J. B., Liao, J., Holloway, J., Peischl, J., Nowak, J. B., Aikin, K. C., Min, K.-E., Washenfelder, R. A., Graus, M. G., Richardson, M., Markovic, M. Z., Wagner, N. L., Welti, A., Veres, P. R., Edwards, P., Schwarz, J. P., Gordon, T., Dube, W. P., McKeen, S. A., Brioude, J., Ahmadov, R., Bougiatioti, A., Lin, J. J., Nenes, A., Wolfe, G. M., Hanisco, T. F., Lee, B. H., Lopez-Hilfiker, F. D., Thornton, J. A., Keutsch, F. N., Kaiser, J., Mao, J., and Hatch, C. D.: Instrumentation and measurement strategy for the NOAA SENEX aircraft campaign as part of the Southeast Atmosphere Study 2013, Atmos. Meas. Tech., 9, 3063–3093, https://doi.org/10.5194/amt-9-3063-2016, 2016.
Weber, R. J., Guo, H., Russell, A. G., and Nenes, A.: High aerosol acidity despite declining atmospheric sulfate concentrations over the past 15 years, Nat. Geosci., 9, 282–285, https://doi.org/10.1038/ngeo2665, 2016.
Wilson, J. C., Lafleur, B. G., Hilbert, H., Seebaugh, W. R., Fox, J., Gesler, D. W., Brock, C. A., Huebert, B. J., and Mullen, J.: Function and performance of a low turbulence inlet for sampling supermicron particles from aircraft platforms, Aerosol Sci. Tech., 38, 790–802, https://doi.org/10.1080/027868290500841, 2004.
Yu, S., Alapaty, K., Mathur, R., Pleim, J., Zhang, Y., Nolte, C., Eder, B., Foley, K., and Nagashima, T.: Attribution of the United States “warming hole”: Aerosol indirect effect and precipitable water vapor, Sci. Rep., 4, 6929, https://doi.org/10.1038/srep06929, 2014.