the Creative Commons Attribution 4.0 License.
the Creative Commons Attribution 4.0 License.
 | 26 Oct 2020
Source apportionment of PM2.5 in Shanghai based on hourly organic molecular markers and other source tracers
Rui Li
Qiongqiong Wang
Xiao He
Shuhui Zhu
Kun Zhang
Yusen Duan
Qingyan Fu
Liping Qiao
Yangjun Wang
Ling Huang
Identification of various emission sources and quantification of their contributions comprise an essential step in formulating scientifically sound pollution control strategies. Most previous studies have been based on traditional offline filter analysis of aerosol major components (usually inorganic ions, elemental carbon – EC, organic carbon – OC, and elements). In this study, source apportionment of PM2.5 using a positive matrix factorization (PMF) model was conducted for urban Shanghai in the Yangtze River Delta region, China, utilizing a large suite of molecular and elemental tracers, together with water-soluble inorganic ions, OC, and EC from measurements conducted at two sites from 9 November to 3 December 2018. The PMF analysis with inclusion of molecular makers (i.e., MM-PMF) identified 11 pollution sources, including 3 secondary-source factors (i.e., secondary sulfate; secondary nitrate; and secondary organic aerosol, SOA, factors) and 8 primary sources (i.e., vehicle exhaust, industrial emission and tire wear, industrial emission II, residual oil combustion, dust, coal combustion, biomass burning, and cooking). The secondary sources contributed 62.5 % of the campaign-average PM2.5 mass, with the secondary nitrate factor being the leading contributor. Cooking was a minor contributor (2.8 %) to PM2.5 mass while a significant contributor (11.4 %) to the OC mass. Traditional PMF analysis relying on major components alone (PMFt) was unable to resolve three organics-dominated sources (i.e., biomass burning, cooking, and SOA source factors). Utilizing organic tracers, the MM-PMF analysis determined that these three sources combined accounted for 24.4 % of the total PM2.5 mass. In PMFt, this significant portion of PM mass was apportioned to other sources and thereby was notably biasing the source apportionment outcome. Backward trajectory and episodic analysis were performed on the MM-PMF-resolved source factors to examine the variations in source origins and composition. It was shown that under all episodes, secondary nitrate and the SOA factor were two major source contributors to the PM2.5 pollution. Our work has demonstrated that comprehensive hourly data of molecular markers and other source tracers, coupled with MM-PMF, enables examination of detailed pollution source characteristics, especially organics-dominated sources, at a timescale suitable for monitoring episodic evolution and with finer source breakdown.
- Article
(2656 KB) - Full-text XML
-
Supplement
(1384 KB) - BibTeX
- EndNote


Airborne PM2.5 (i.e., particulate matter with an aerodynamic diameter of less than 2.5 µm) has attracted increased global attention due to its well-recognized impact on climate, visibility, and human health (Chow et al., 2004; Liu et al., 2016; Foley et al., 2010). In recent years, with the increasingly prominent air pollution problems in China, more and more attention has been paid to characterizing the pollution characteristics. Identifying the pollution sources and quantifying their contributions to ambient PM2.5 are of fundamental significance for PM reduction and air quality improvement (Chen et al., 2007; Y. X. Zhang et al., 2009).
Receptor models are widely used tools to carry out the source apportionment of atmospheric PM2.5 (Hopke, 2016; Jaeckels et al., 2007; Lee et al., 2008; Sofowote et al., 2014). Compared with other methods, such as chemical mass balance (CMB) and multilinear engine (ME-2), positive matrix factorization (PMF; Paatero and Tapper, 1994) does not need to input source profiles and is able to provide as model outcome both the source profiles and contributions of various sources (Wang et al., 2018; Zhou et al., 2019). PMF relies on marker species to separate and identify different source factors, and in principle more comprehensive data sets, especially chemical data of high source specificity, would enable more accurate and finer source breakdown for potential sources contributing to PM2.5.
High-time-resolution measurements are inherently advantageous to the source analysis, as they are able to capture the diurnal variations in the main source activities (such as vehicle exhaust) and secondary formation processes. Sample sizes of over 100 could be acquired within a short time span on the order of a week, thus providing opportunities to study pollution source variations for short-term time windows. Online measurement-based source apportionment studies available in the literature have so far been mainly based on the PM1 Aerodyne aerosol mass spectrometer (AMS) or aerosol chemical speciation monitoring (ACSM) measurements (Al-Naiema et al., 2018), which utilize the individual mass fragment from bulk organics. Multiple parent molecules could lead to the same fragments during the ionization process in AMS or ACSM, which introduce ambiguity in relying on fragment ions for source differentiation. In comparison, molecular markers alleviate such ambiguity and therefore could significantly improve our ability in source identification and quantification. The recently commercialized thermal desorption aerosol gas chromatography–mass spectrometry (TAG) system (Williams et al., 2006; Y. L. Zhao et al., 2013; Isaacman et al., 2014) has enabled acquiring hourly data of individual molecular markers, providing opportunities for more refined source apportionment.
Shanghai, a megacity with a population of 24.3 million and a total area of 6340 km2, represents a typical economic zone in China. Air pollution issues in Shanghai are complex and our knowledge of its aerosol sources still fall short of being sufficiently quantitative or comprehensive. Past source apportionment studies of PM2.5 in Shanghai are based on either offline filter-based data that are inherently of a low time resolution (Du et al., 2017; Chang et al., 2018) or emissions-based numerical models (Li et al., 2015, 2019; Shu et al., 2019; Feng et al., 2019). PM2.5 source apportionment studies using online data as inputs have so far been limited to the major aerosol species (i.e., inorganic ions, carbonaceous components, and elements; Wang et al., 2018), preventing proper separation of aerosol sources dominated by organic compounds.
We recently carried out online monitoring of atmospheric PM2.5 composition, including inorganic ions, organic carbon (OC), elemental carbon (EC), trace elements, and organic molecular markers, in an urban environment in Shanghai from 9 November to 3 December 2018. The description of the organic speciation data was provided in Wang et al. (2020) and He et al. (2020). The objective of this work is to carry out source apportionment of PM2.5 using molecular-marker-based PMF. Through this work we demonstrate that the comprehensive hourly data of molecular markers and other source tracers have significantly enhanced our ability in resolving organics-dominated PM2.5 sources and the source apportionment could be achieved at a timescale suitable for monitoring episodic evolution. The results from this work can provide support for the development of air pollution prevention and control strategies.
2.1 Online measurements
Online PM2.5 and its major chemical composition (i.e., inorganic ions, OC, EC, and elements) and organic markers were measured from 9 November to 3 December 2018. Two urban sites were involved. The PM2.5 mass, inorganic ions, OC, EC, and elements were measured at Shanghai Pudong Environmental Monitoring Station (PD; 31.23∘ N, 121.53∘ E), a typical urban site for the city (Q. Zhao et al., 2013). The organic markers were measured at the Shanghai Academy of Environmental Sciences (SAES; 31.17∘ N, 121.43∘ E), also a representative urban site of the city (Wang et al., 2018).
The concentration of hourly PM2.5 was measured by an online beta attenuation particulate monitor (FH 62 C14 series, Thermo Fisher Scientific; Qiao et al., 2014). Carbonaceous components (OC and EC) were monitored by a semicontinuous OC–EC analyzer (model RT-4, Sunset Laboratory, Tigard, OR, USA; Nicolosi et al., 2018; Zhang et al., 2017). The water-soluble inorganic ions were measured by the Monitor for AeRosols and GAses (MARGA, Model ADI 2080, Applikon Analytical BV; Makkonen et al., 2012; Griffith et al., 2015). Concentrations of elements in PM2.5 were measured by an ambient elemental monitor (Xact 625 Ambient Continuous Multi-metals Monitor, Cooper Environmental Services, Tigard, OR, USA) using energy-dispersive X-ray fluorescence (XRF) analysis (Battelle, 2012; Jeong et al., 2019). The meteorological parameters and gas pollutants data were obtained from the open data set at Shanghai Hongqiao International Airport (available at http://www.wunderground.com, last access: 7 September 2020).
Quantification of hourly speciated organic markers was achieved using thermal desorption aerosol gas chromatography–mass spectrometry (TAG; Aerodyne Research Inc., https://www.aerodyne.com/wp-content/themes/aerodyne/fs/TAG_0.pdf, last access: 7 September 2020). The operation details and data quality are described in a separate paper (Wang et al., 2020), and only a brief description will be presented here. Briefly, ambient air was drawn through a PM2.5 cyclone, then the sampled air was collected after passing through a carbon denuder to remove the gas phase, and only particles were collected onto the collection matrix. The organics were then desorbed and transferred from the collection matrix to the gas chromatography (GC) spectrometer column, with in situ derivatization of the polar organics under a variable stream of saturated helium with a derivatization agent (N-methyl-N-(trimethylsilyl)trifluoroacetamide). After GC column separation, the target organics entered the mass spectrometry (MS) chamber for analysis. It should be noted that with the current TAG instrument setup, 1 hourly sample was collected at every odd hour, thus generating 12 hourly samples in a 24 h cycle. The postsampling steps, including in situ derivatization, thermal desorption, and gas chromatography–mass spectrometer (GC–MS) analysis, took ∼1.5 h, and the next sampling started concurrently with the GC–MS analysis step, lasting for a full hour.
The two measurement sites involved in this work are 12 km apart. Map locations of the two monitoring sites are shown in Fig. 1. Figure S1 in the Supplement provides aerial site photos, showing similar urban surroundings at the two sites. More importantly, monitoring data indicate that the two sites shared similar pollutant characteristics. Figure S2 compares the time series of PM2.5 mass and gaseous criteria pollutants (CO, SO2, and NO2), exhibiting excellent site-to-site agreement in pollutant concentrations (Table S1 in the Supplement). No OC and EC measurements were made at SAES. Instead, black carbon (BC) and bulk organic aerosol (OA) in PM1 were monitored at this site by an aethalometer and an AMS. Figure S3 compares BC at SAES with EC at PD and compares PM1 OA at SAES with OM (organic matter, estimated from OC) at PD, showing a high degree of consistency between these two pairs of related quantities. We refer readers to Sect. S1 in the Supplement for more details. Overall, it is rational to pool together data from the two sites to form a more comprehensive data set for source apportionment of PM2.5 pollution sources that are typical of the general urban environment in Shanghai as represented by the two sites.

Figure 1Location of the two sampling sites in Shanghai, China.
2.2 PMF receptor model
PMF is a bilinear factor analysis method, which is widely used to identify pollution sources and quantify their contributions to the ambient air pollutants at receptor sites, with an assumption of mass conservation between emission sources and receptors. In this study, the United States Environmental Protection Agency (USEPA) PMF version 5.0 (Norris et al., 2014) was applied to perform the analysis. PMF decomposes the measured data matrix, Xij, into a factor profile matrix, fkj, and a factor contribution matrix, gik, (Eq. 1):
where Xij is the measured ambient concentration of target pollutants, gik is the source contribution of the kth factor to the ith sample, fkj is the factor profile of the jth species in the kth factor, and eij is the residual concentration for each data point. PMF seeks a solution that minimizes an object function Q (Eq. 2), with the uncertainties in each observation (uij) provided by the user.
The PMF model assumes that the quantity of the input species is conserved and the source profile is unchanged. In order to minimize the impact of organics degradation on the deviation of the mass conservation hypothesis, organic species with low volatility and low reactivity are selected as input. The assumption of constant source profiles is not strictly met when the receptor model is applied to measurement data covering a long duration (e.g., months or longer). The source profiles parsed by PMF can be viewed as the averaged profile over the entire sampling period. In an atmospheric environment, both primary and secondary emission sources have the problem of changing source profiles. Therefore, it is highly recommended to obtain high-time-resolution measurement data, preferably of several hours or shorter, as an input for the PMF model. The input data in this study are hourly data for every odd hour, as limited by the organic tracer measurements, and the time span of the whole campaign is less than 1 month. As such, the source type information will not change significantly.
In this study, a total of 289 samples were collected. The chemical species selected as input to the PMF model include 13 elements, 4 inorganic species, OC, EC, organic markers (including anhydrosugars, secondary organic aerosol – SOA – tracers, organic acids, and polycyclic aromatic hydrocarbons – PAHs). Two types of PMF, PMFt and MM-PMF as explained below, were performed. PMFt, referring to traditional PMF, considers only elements, inorganic ions, OC, and EC as inputs. MM-PMF, referring to molecular-marker-based PMF (Al-Naiema et al., 2018; Wang et al., 2017; Y. Zhang et al., 2009), includes organic markers as inputs in addition to the chemical species considered by PMFt.
The uncertainty in each data point was calculated according to Eq. (3):
where MDL is the method detection limit and EF is the error fraction determined by the user and associated with the measurement uncertainties. The concentration data below the MDL were replaced by 0.5 of the MDL, and the corresponding uncertainty uij was calculated as five-sixths of the MDL. Missing values were replaced by the median value of the species, and its uij was assigned as 4 times the median value (Norris et al., 2014).
2.3 Backward trajectory analysis
Backward trajectory analysis is a useful tool to identify the influence of air mass paths on PMF-resolved sources (Wang et al., 2017). Backward trajectories of 36 h duration and arriving at an altitude of 100 m above ground level (a.g.l.) over the PD site were calculated deploying the 0.5∘ Global Data Assimilation System (GDAS) meteorological data (https://www.ready.noaa.gov/archives.php, last access: 7 September 2020). The trajectories were then classified into different clusters according to the geographical origins and movement process of the trajectories using the TrajStat model (Zhang et al., 2020).
The time series of hourly meteorological parameters and PM2.5 major components during the whole monitoring period are shown in Fig. 2. The average temperature (T) was 14.6±2.9 ∘C, the relative humidity (RH) was 80±15 %, and the wind speed (WS) was 3.2±1.6 m s−1 during the campaign. The average concentrations of the PMF input species are listed in Table 1 for PM2.5 and its major components and in Table 2 for the organic markers. The average PM2.5 concentration was 46±34 µg m−3, with nitrate and OM contributing 32 % and 25 % of the total mass, respectively. Sulfate and ammonium contributed 16.5 % and 16.2 % of the PM2.5, respectively. The measured total elements account for 3.5 % of PM2.5 mass on average. Reconstructed PM2.5 using the individual major components and the measured PM2.5 mass showed good mass closure (slope=0.93 and R2=0.98 in Fig. S4).
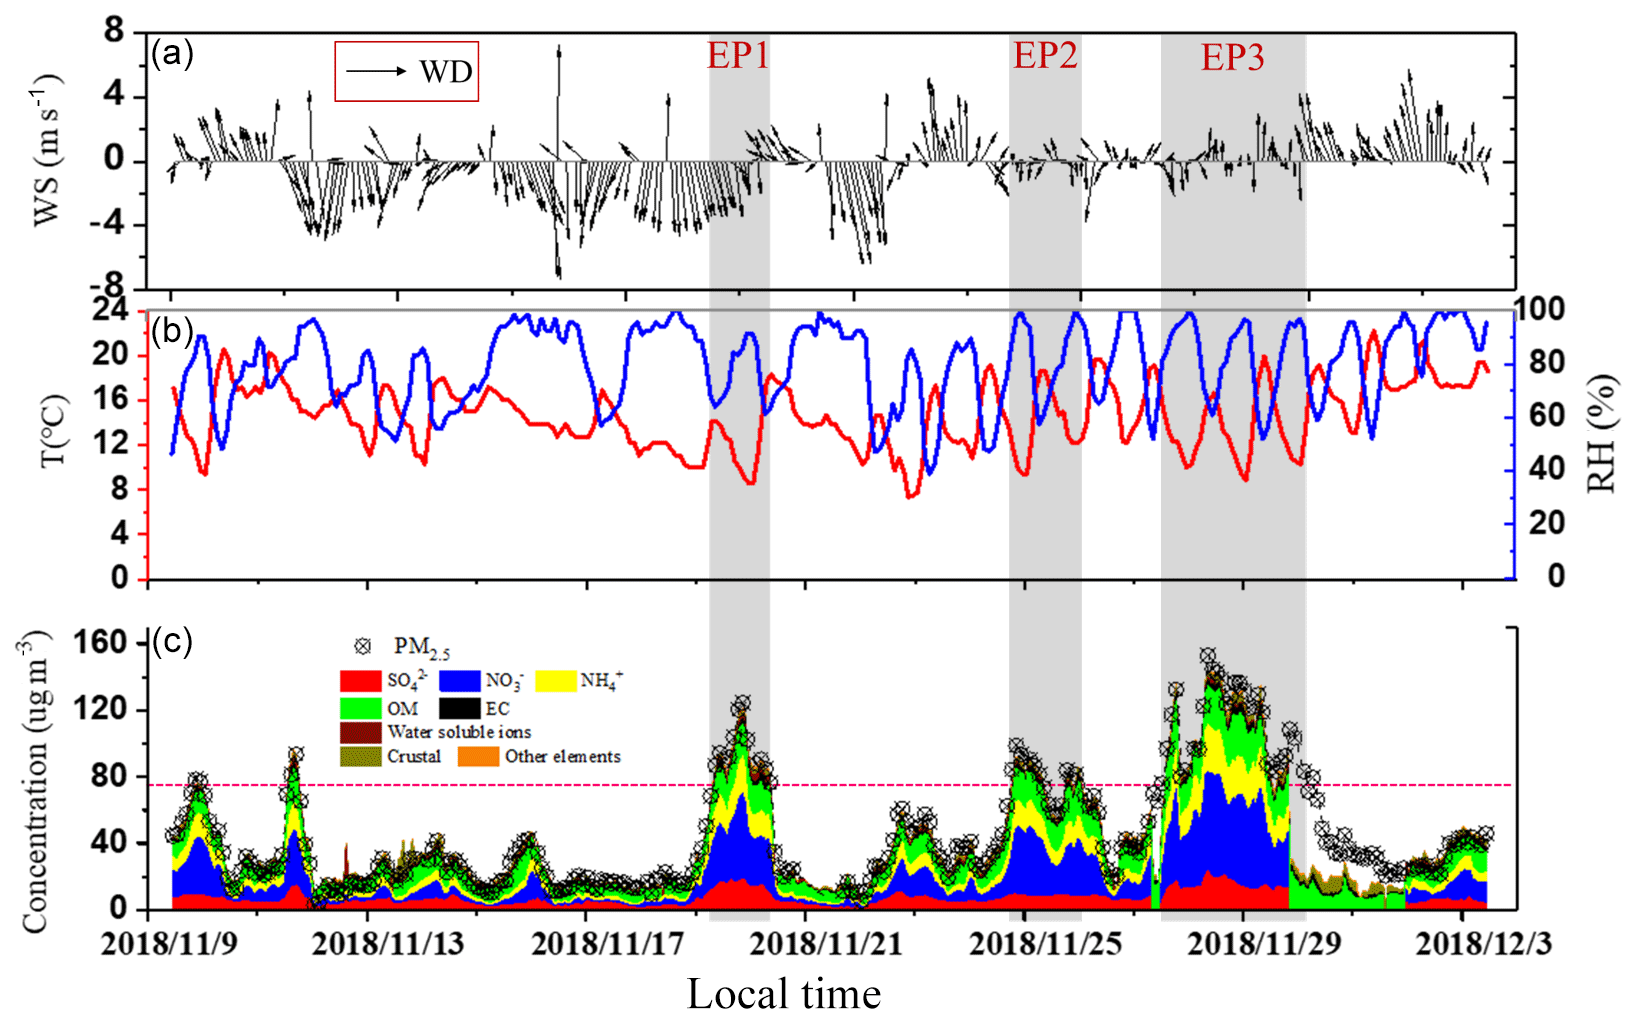
Figure 2(a) Time series of wind speed (WS) and wind direction (WD), (b) time series of temperature (T) and relative humidity (RH), and (c) time series of PM2.5 and its major components during the sampling period from 9 November to 3 December 2018. OM is estimated by assuming an OM∕OC ratio of 1.8. Water soluble ions are the sum of Cl−, Na+, K+, and Mg2+. Crustal materials are calculated as the sum of the oxidized form of the crustal elements (i.e., crustal=2.49[Si] + 1.63[Ca] + 2.42[Fe]). During 30 November to 1 December 2018, the major inorganic ions measured by MARGA are not available. The red line in (c) indicates the PM2.5 level at 75 µg m−3; PM2.5 concentrations higher than that are denoted as episodes; and the three episodes (EP1–3) are shaded in gray.
Table 1Measured PM2.5 major components (µg m−3) used in the PMF analysis in this study.
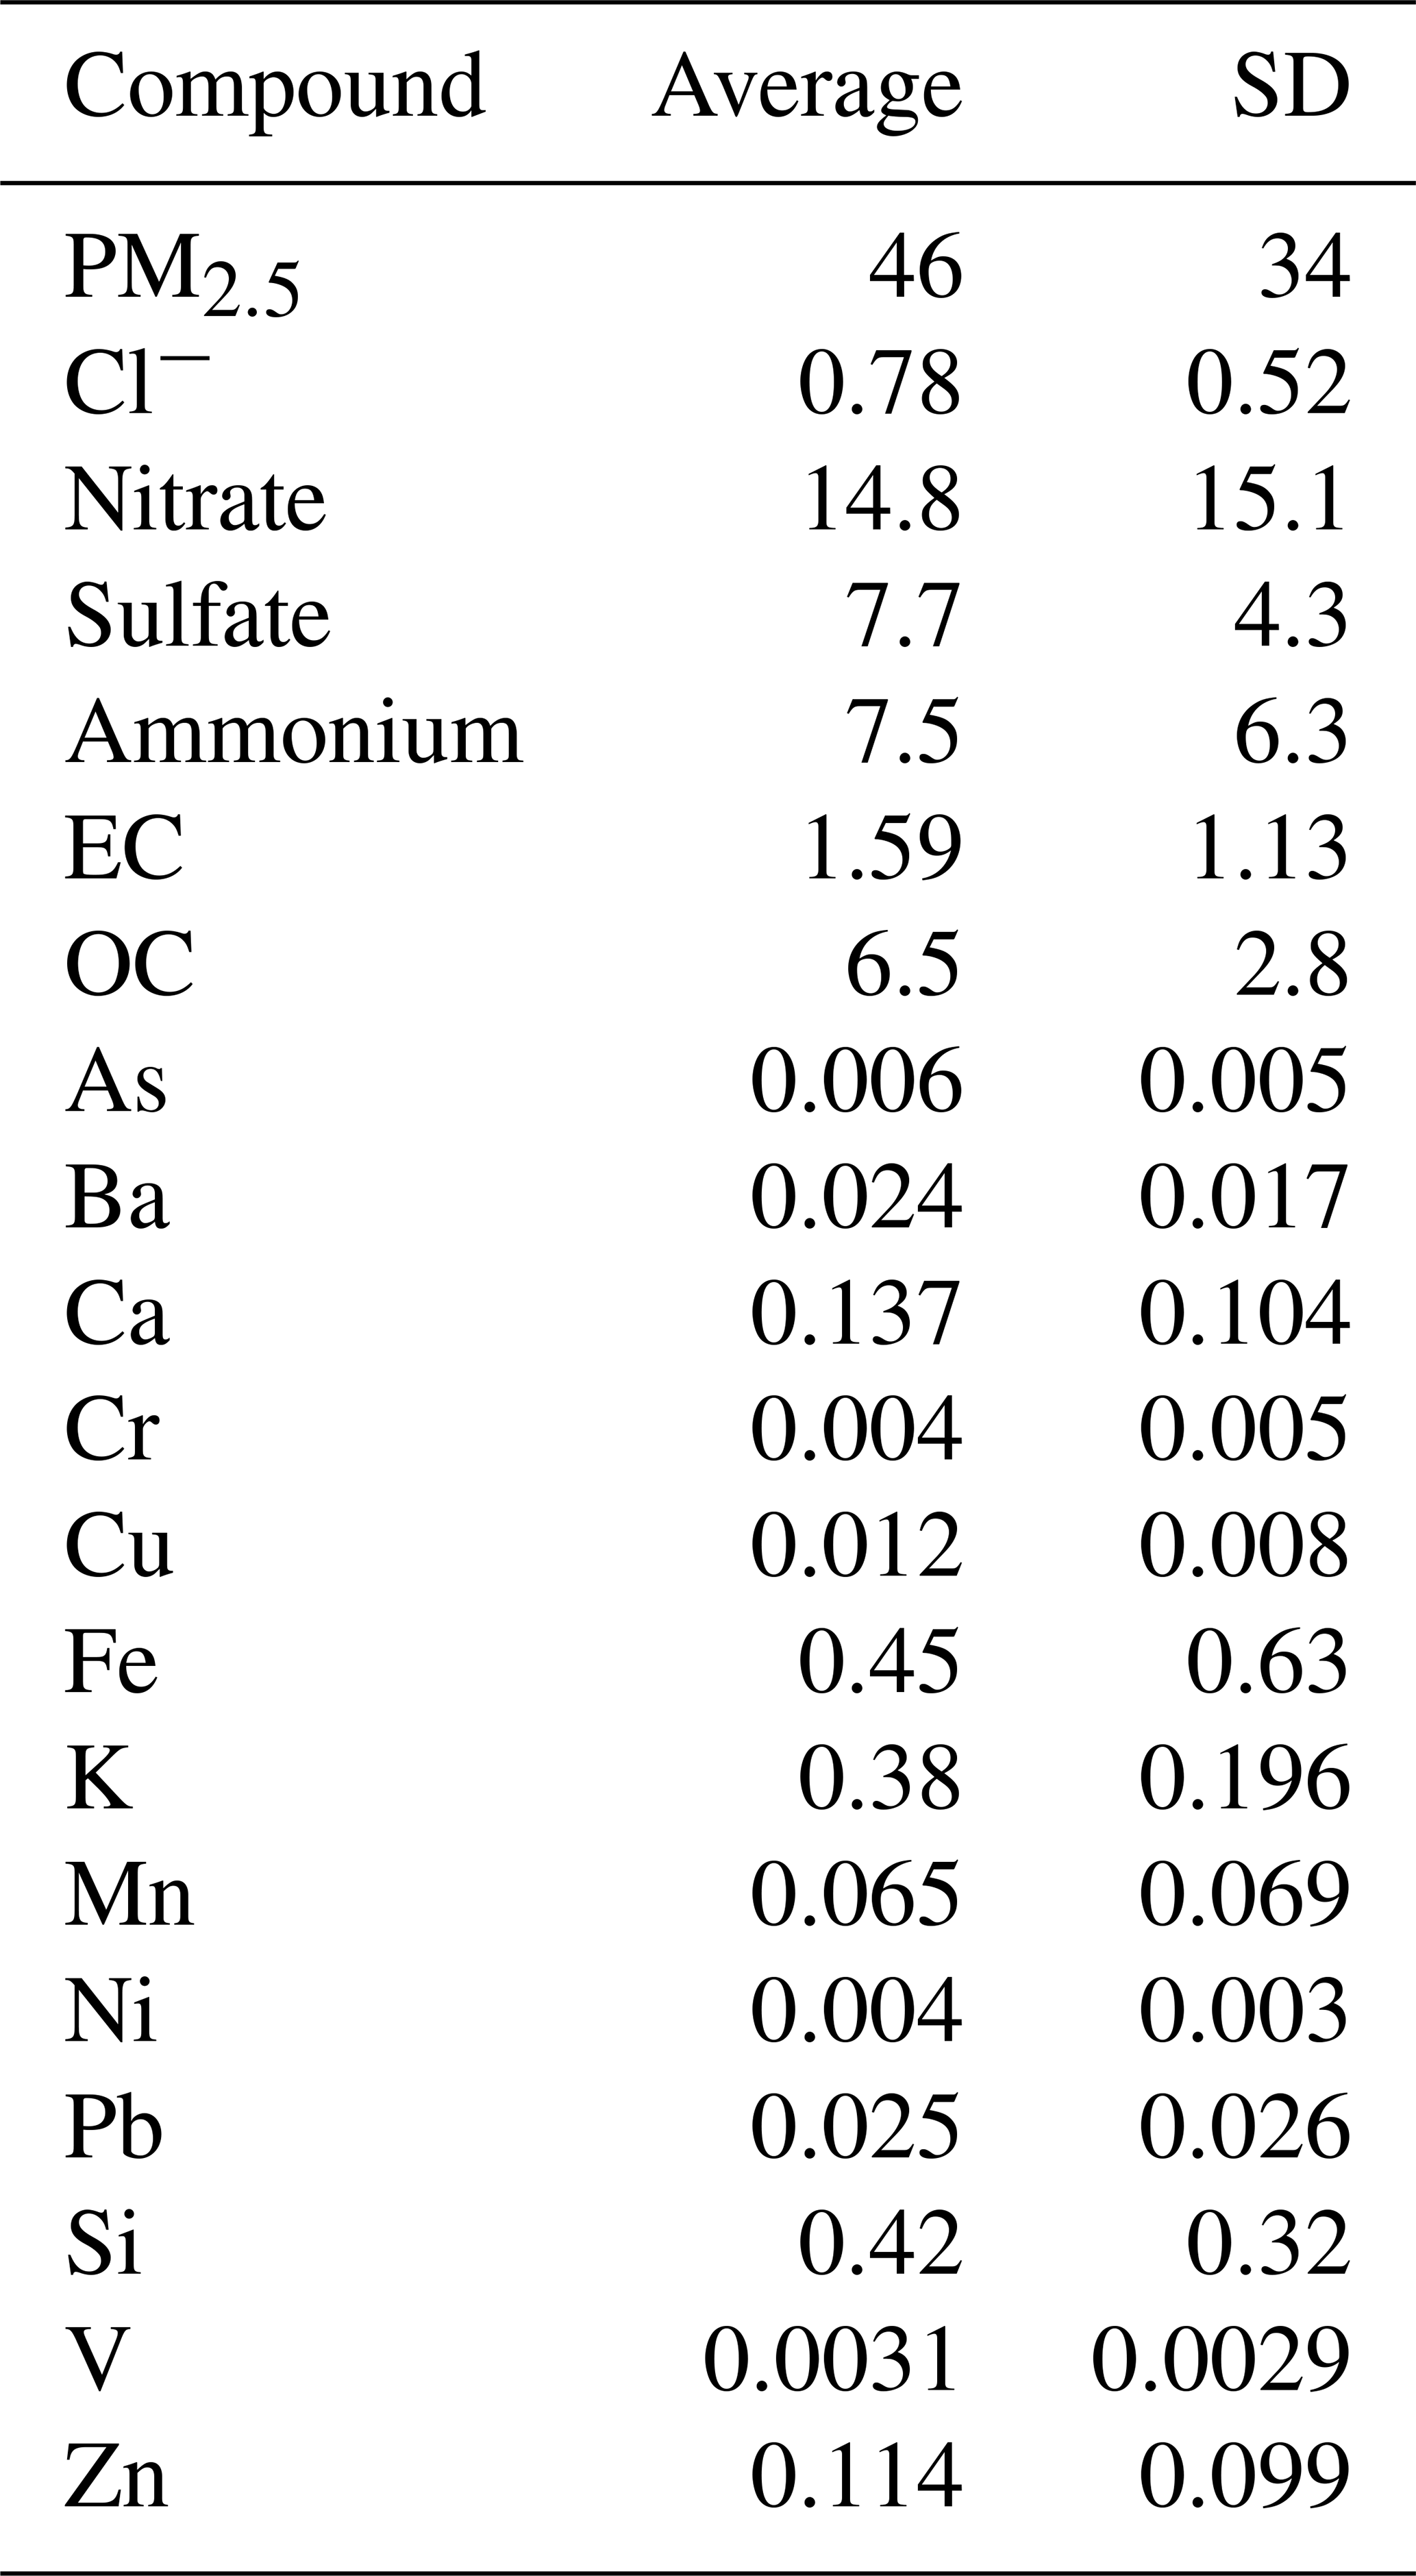
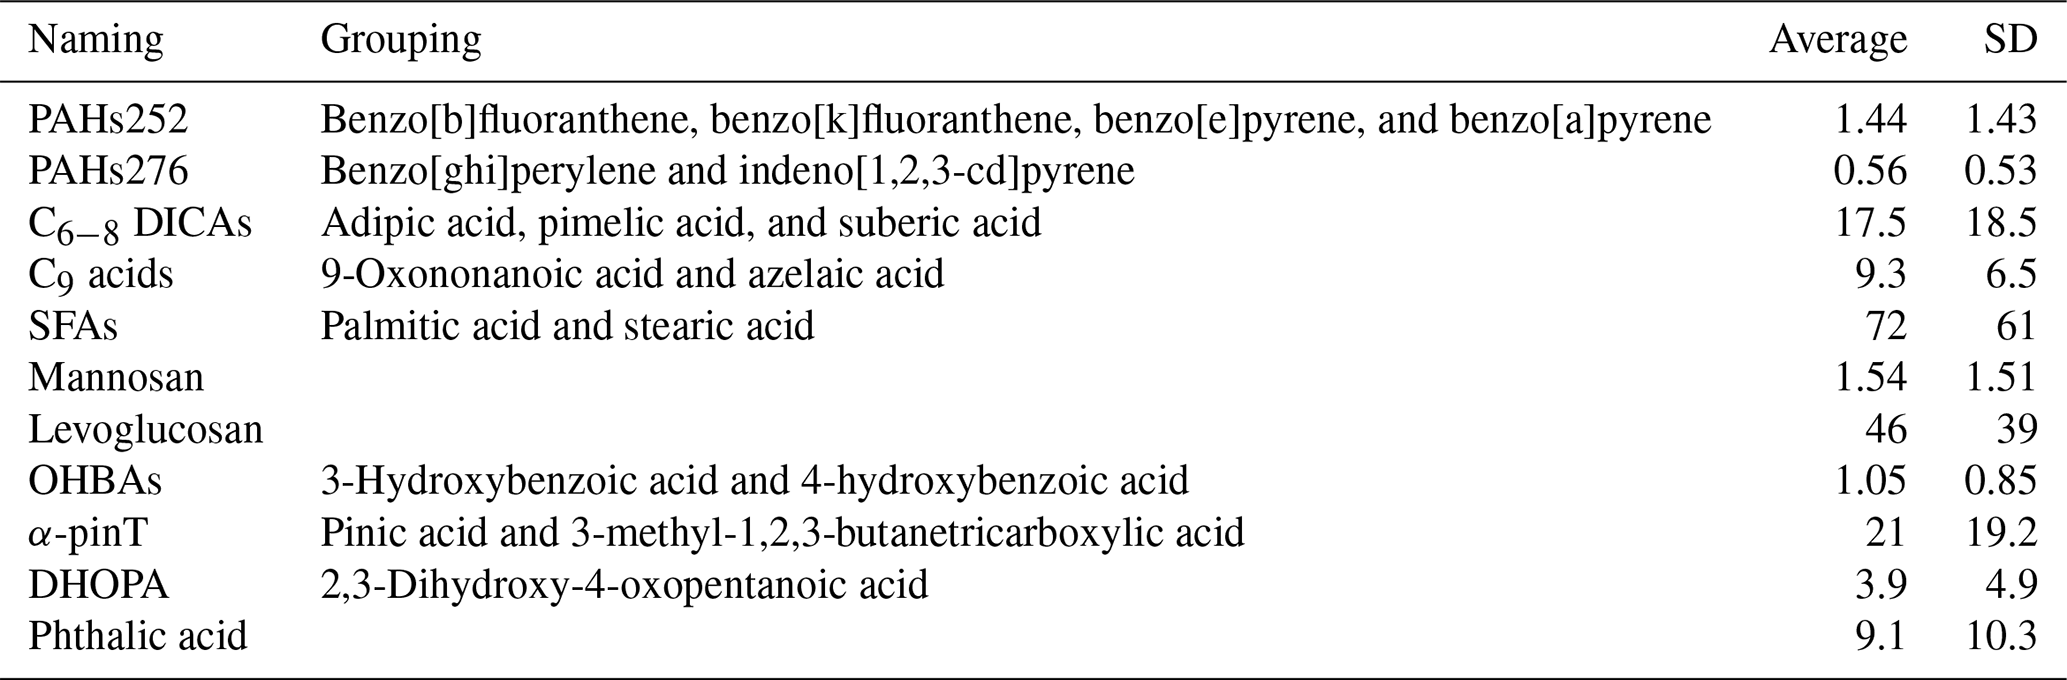
Table 2Abundance and naming of measured organic markers (ng m−3) used in the MM-PMF analysis.
3.1 PM2.5 source apportionment
In this study, PMF source analysis was conducted in two scenarios, i.e., MM-PMF with molecular markers and PMFt without inclusion of molecular markers. The abundance and nomenclature of the organic markers used are summarized in Table 2. The preferential input species for PMF analysis are those with high abundance and known to be specific to certain sources. Generally, organic markers with lower volatility and lower reactivity were selected as input species for MM-PMF. Highly correlated organic markers (R>0.8), indicating common sources, were grouped together to reduce the number of species and to avoid collinearity problems in MM-PMF (Wang et al., 2017).
3.1.1 MM-PMF results
In PMF, the optimal number of factors is a compromise between identifying factors with the best physical explanations and achieving a sufficiently good fit for all species. In PMF solutions of too few factors, different sources are combined and unresolved and the resolved sources cannot fully explain the individual species. On the other hand, in PMF solutions of too many factors, one source may be split into multiple uninterpretable factors. Initially, 7 to 14 factors were tested, and the optimal factor number was determined by examining the changes in Q∕Qexp (Fig. S5). Finally, the 11-factor solution for MM-PMF was selected as it gives the most reasonable factor profiles (detailed description in Sect. S2). Table S2 shows the summary of error estimation diagnostics from bootstrap (BS), displacement (DISP), and bootstrap combined with displacement (BS–DISP) for the MM-PMF base run. Generally, BS and DISP results indicated robust PMF solutions. However, BS–DISP results showed higher uncertainties which may be due to the limited sample size in the study. It should be noted that vehicle exhaust showed the lowest BS mappings and a high chance of mixing with the secondary nitrate factor. The base run results show certain degrees of factor mixing; for example ∼20 % of biomass burning tracers levoglucosan and mannosan were mixed with the secondary nitrate factor. Subsequently, a constrained run was performed to constrain levoglucosan and mannosan to be only present in the biomass burning factor (Wang et al., 2017). The summary of the model performance of individual input species for the 11-factor solution in MM-PMF is given in Table S4.
The factor profiles of the 11-factor constrained run of MM-PMF are shown in Fig. 3, together with the time series of contributions from individual source factors. The diurnal variations in individual factor contributions are shown in Fig. 4. In summary, three secondary sources are resolved, namely, the secondary sulfate factor, secondary nitrate factor, and SOA factor. Eight primary sources are resolved, and they are vehicle exhaust, industrial emission and tire wear, industrial emission II, residual oil combustion, dust, coal combustion, biomass burning, and cooking. The correlations of each factor contribution with meteorological parameters (WS, T, and RH) and gaseous pollutants (SO2, CO, and NOx) are shown in Table S6. The average factor contributions to PM2.5 and OC from individual source factors are shown in Fig. 5.
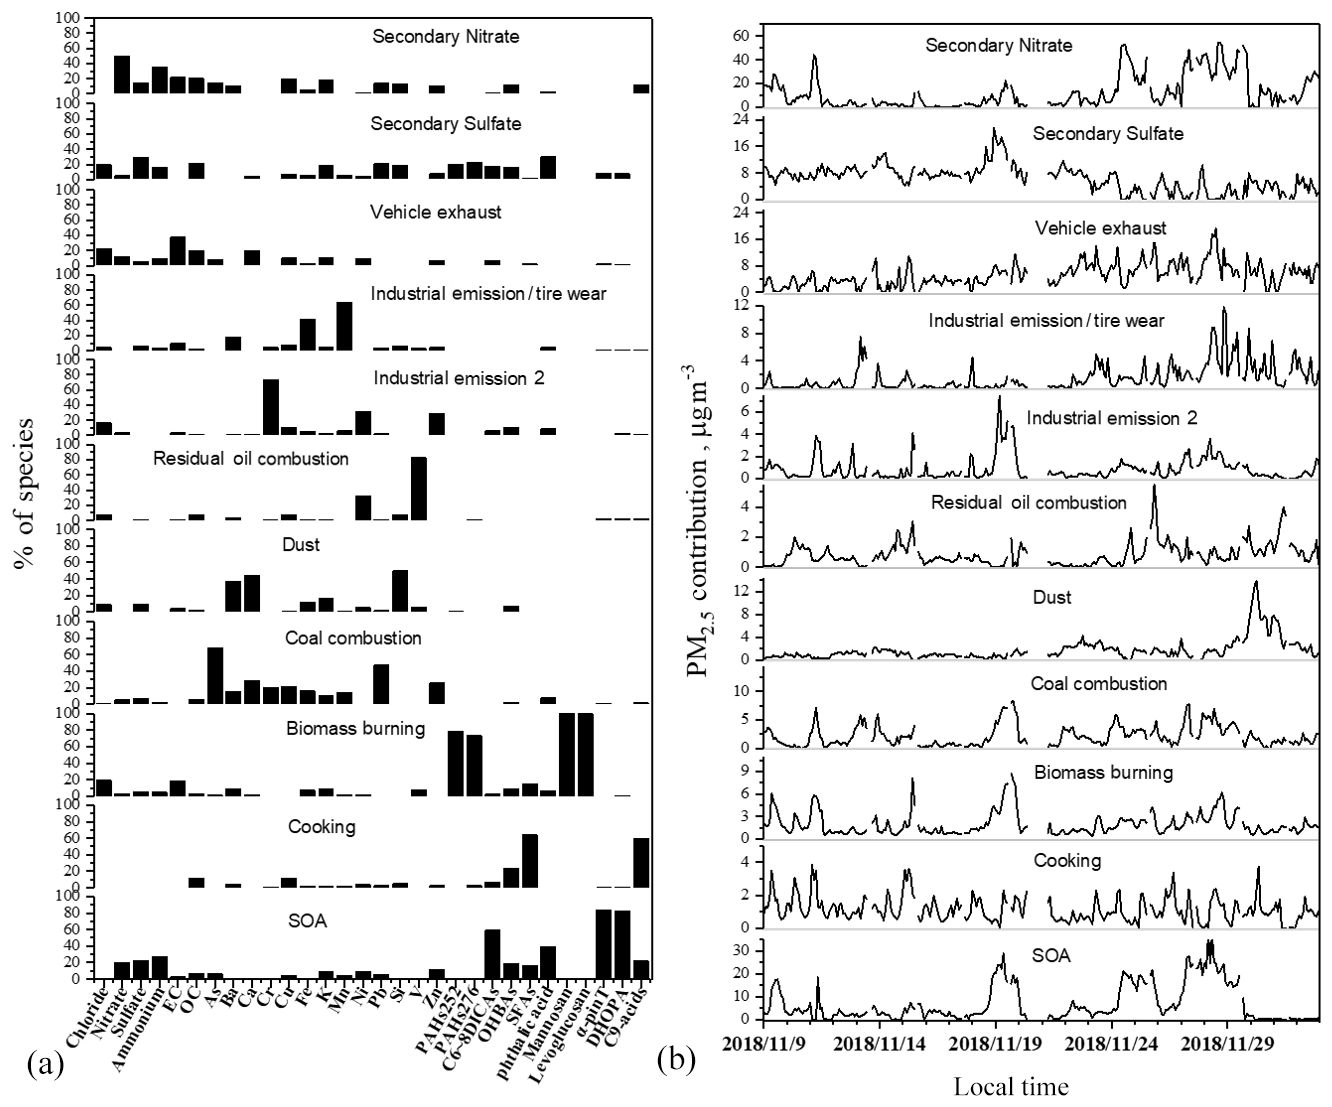
Figure 3Individual source profiles of the 11 factors resolved in the constrained MM-PMF run (a) and time series of individual factor contributions (b).
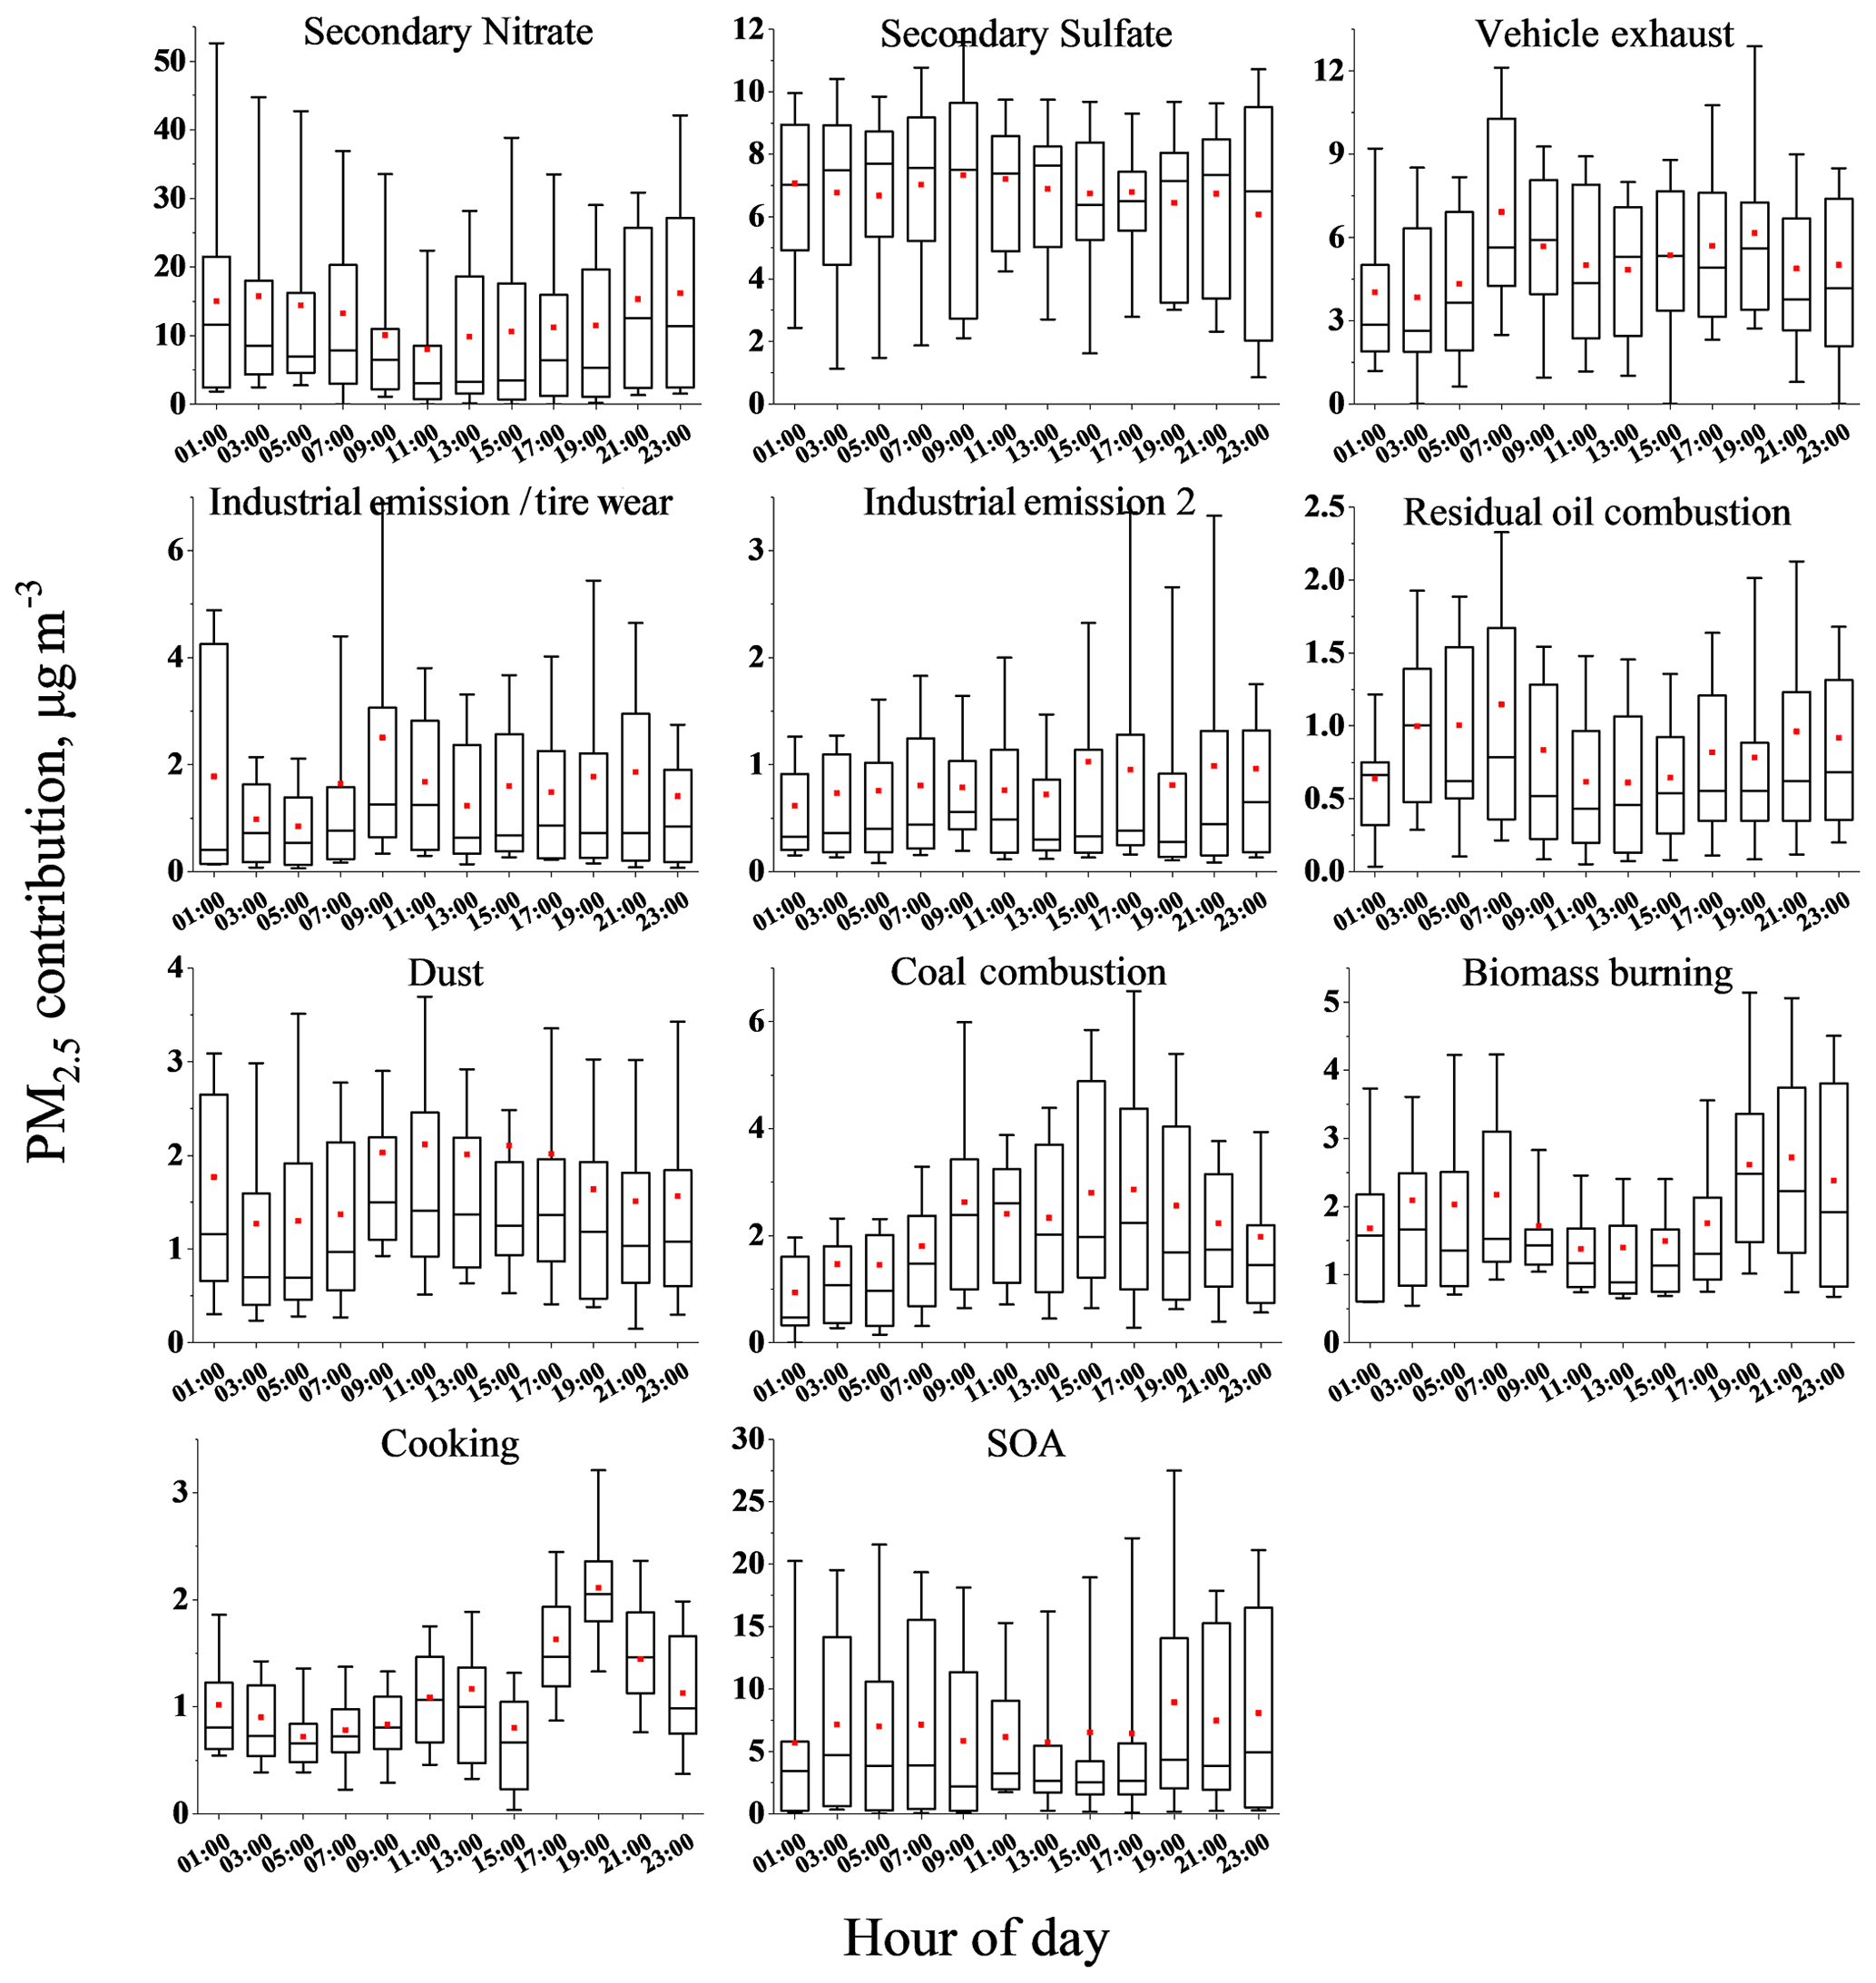
Figure 4Diurnal variation in individual source factors resolved by MM-PMF (25th and 75th percentile boxes, 10th and 90th percentile whiskers; lines inside the boxes represent the hourly median, and the red points represent the hourly mean).

Figure 5Percentage contributions of individual source factors to (a) PM2.5 and (b) OC based on MM-PMF.
The secondary nitrate factor (F1) is identified by high contributions of nitrate and ammonium (36 % and 50 %, respectively). The secondary sulfate factor (F2) is characterized by high loadings of sulfate (30 %) and ammonium (17 %). Small amounts of organic acids and PAHs are also present in the factor. The diurnal variations in F1 show higher contributions during the nighttime (e.g., 21:00–05:00 LT; all times throughout the paper are given in local time) and lower contributions during the daytime (e.g., 09:00–13:00). The higher contributions of secondary nitrate in the nighttime hours may be due to the lower nighttime temperature favoring the shifting of ammonium nitrate to the particle phase. Contributions of F2 lack obvious diurnal patterns (Fig. 4), which may indicate the influence from regional transport, and this speculation is supported by the backward trajectory analysis in Sect. 3.2. F1 has a moderate correlation with NOx (R=0.50) and a high correlation with CO (R=0.70), while F2 does not show evident correlations with gaseous pollutants or meteorological parameters (Table S6). F1 and F2 contributed 30.4 % and 15.3 % to the total PM2.5 mass and 20.4 % and 21.2 % to the total OC, respectively (Fig. 5).
The third factor (F3) shows a high abundance of EC (38 %) and is identified to be vehicle exhaust. It also contains high loadings of OC, Ca, and Cu, as well as some organic tracers (PAHs and organic acids) in the profile. Vehicle exhaust is an important source of carbonaceous species, and the presence of Cu in vehicle exhaust may originate from both fuel or lubricant combustion and brake abrasions (Adachi and Tainosho, 2004; Pant and Harrison, 2013), and the element Ca may be derived from road dust. The influence of vehicle exhaust on this factor is supported by the peak hours at 07:00–09:00 and 17:00–19:00 in the diurnal variation (Fig. 4), coinciding with the morning and afternoon rush hours. In addition, F3 has high correlations with NOx (R=0.68) and CO (R=0.48), further supporting the association of this factor with vehicle exhaust. F3 contributed with 12.6 % of the total PM2.5 mass and 19.4 % of OC on average.
The profile of the fourth factor (F4) contains high loadings of Fe and Mn. Industry activities related to steel production often emit a large quantity of these metallic elements (Men et al., 2019). These metals, together with Cu and Zn, are also reported by Pant and Harrison (2013) and Wang et al. (2018) to be associated with nonexhaust vehicle emissions such as tire wear. The diurnal variation in F4 is similar to that of F3 and shares the commonality of peaking during the morning and afternoon rush hours, supporting its association with tire wear emissions. F4 shows a high correlation with NOx (R=0.49), and NOx in the Yangtze River Delta mainly originates from industrial and vehicular pollution sources (Fu et al., 2013). Therefore, F4 is considered a mixed source of industrial emissions and tire wear. The contributions of this factor to the total PM2.5 mass and OC were minor, only 3.8 % and 2.1 %, respectively. Industrial emission and tire wear could not be resolved as a separate source in the source apportionment analysis based on offline filter samples in this region (Du et al., 2017; Huang et al., 2014; Qiao et al., 2016). This inability is lifted with the hourly data, thus indicating the benefit of online high-time-resolution measurements.
The fifth factor (F5) is characterized by high loadings of Cr (74 %), Ni (31 %), and Zn (29 %); see Fig. 3. Cr compounds are widely used in industrial activities such as plating, tanning, and metallurgy (Karar et al., 2006; Borai et al., 2002). In addition, this factor shows a strong correlation with CO (R=0.68). Thus, it is regarded as industrial emission II. No diurnal variation is observed in this factor (Fig. 4). Factor contributions of F5 to total PM2.5 and OC mass were minor, only 2.0 % and 1.1 %, respectively.
The residual oil combustion factor (F6) is identified by high loadings of V (83 %) and Ni (32 %); see Fig. 3. V is often used as a source tracer for residual oil combustion (M. J. Zhao et al., 2013). The contributions of the residual oil combustion mainly come from shipping transportation due to the coastal geographical location of Shanghai. The V∕Ni ratio in the factor profile is 2.7, close to the ratio of fuel oil used in the Shanghai port (3.6 in M. J. Zhao et al., 2013). The diurnal variation in this factor shows slightly higher concentrations during the nighttime (e.g., 21:00–23:00 and 03:00–07:00). F6 is a minor contributor to PM2.5, accounting for 2.0 %, while its contribution to OC is higher (7.1 %). Therefore, residual oil combustion is an important pollution source, especially to OM.
The dust factor (F7) is distinguished by crustal elements Ca, Si, and Ba. The diurnal variation in this factor shows a broad peak during the daytime, which could be explained by more activities causing dust suspension in the daytime (e.g., construction, road traffic). This factor contributes 4.2 % and 2.0 % to the total PM2.5 and OC mass, respectively.
F8 contains a high abundance of As and Pb, which identifies this factor to be associated with coal combustion (Chen et al., 2013). The diurnal variation in the factor shows higher contributions in the daytime. Good correlations with SO2 (R=0.68) and CO (R=0.68) further support the identification of this factor. No specific organic tracers such as PAHs are present in this source profile (Fig. 3). These results are different from those of Wang et al. (2017) and Yu et al. (2016), which may be attributed to regional differences in source profiles. F8 contributes with 5.3 % of total PM2.5 and 5.6 % of OC, respectively.
The ninth factor (F9) is identified as biomass burning by high loadings of levoglucosan and mannosan. Levoglucosan and mannosan are uniquely emitted by biomass burning activities (Engling et al., 2006; Feng et al., 2013), thereby serving as reliable source tracers to indicate biomass burning in source analysis (Wang et al., 2019; Bond et al., 2007). In comparison, it is well documented that elemental potassium (K) suffers from potential interferential sources such as dust and firework emissions (Yu et al., 2019). The source profile of the biomass burning factor also contains high loadings of five-ring and six-ring PAHs that are considered to be derived from mixed combustion sources (including coal combustion and biomass burning; Fig. 3). The diurnal variation in biomass burning shows higher contributions during the nighttime. On average, this factor contributes 4.8 % and 2.7 % to the total PM2.5 and OC mass, respectively.
The cooking factor (F10) was distinguished by SFAs (palmitic acid and stearic acid) and C9 acids (9-oxononanoic acid and azelaic acid). The diurnal variation in the cooking factor shows obvious peaks at lunchtime (11:00–13:00) and dinnertime (17:00–21:00), which are in accordance with the local dining consumption habits in Shanghai. Although the cooking factor contributes only a small fraction of PM2.5 (2.8 %), it accounts for 11.4 % of the total OC, indicating the importance of cooking emissions to OM in the urban metropolis.
As shown in Fig. 3, F11 is identified as an SOA factor on the basis of high loadings of a toluene SOA tracer (2,3-dihydroxy-4-oxopentanoic acid), α-pinene SOA tracers (pinic acid and 3-methyl-1,2,3-butanetricarboxylic acid), and phthalic acid. Thus, the factor represents mixed anthropogenic and biogenic SOA. The diurnal variation shows slightly higher contributions in the nighttime hours (Fig. 4). High correlations with SO2 (R=0.69) and CO (R=0.79) are observed (Table S6). Similar temporal variations between SOA and the secondary nitrate factor are observed (R=0.63), especially during episodic hours, which may indicate some commonality in their formation processes. Many studies have documented the enhancement of biogenic SOA production by anthropogenic species through creating a more acidic environment in the aerosol (Jang et al., 2002; Wang et al., 2017). The SOA factor accounts for 16.8 % of PM2.5 and 7.0 % of OC on average (Fig. 5).
Overall, the MM-PMF source apportionment results indicate that the three secondary sources combined account for 62.5 % (28.9 µg m−3) of the total PM2.5 mass, of which secondary nitrate and SOA are two major source contributors. Vehicle exhaust is the largest primary source contributing to PM2.5. OC contributions from the secondary sulfate, secondary nitrate, and SOA factors are assumed to be secondary OC (SOC), whereas OC from the other factors is assumed to be primary OC (POC). The SOC from the three secondary factors accounts for 48.6 % (3.09 µgC m−3) of the total OC mass on average across the whole study period. The high loadings of OC in the secondary nitrate and sulfate factors may indicate commonality in the formation processes leading to secondary inorganic and organic products and a lack of specific tracers to separately account for the formation pathways of many of the secondary organic products. POC accounted for 51.4 % (3.27 µgC m−3) of the total OC, with vehicle exhaust and cooking emissions contributing the most.
3.1.2 Impact of organic markers on source apportionment
The PMF model without organic markers (PMFt) was performed to examine the impact of inclusion of organic tracers on PMF. The input data for PMFt are the same as for MM-PMF except the organic molecular markers. In PMFt, eight factors are resolved, and three factors, biomass burning, cooking, and SOA, cannot be extracted due to the lack of the corresponding organic markers. The source profile and error estimation of the eight-factor solution of PMFt are shown in Fig. S7 and Sect. S2. The correlations of the factor contributions for the common factors between PMFt and MM-PMF are shown in Table 3. Generally, the eight common factors, except for secondary sulfate and vehicle exhaust, correlate well between the two PMF runs (R=0.84 to 0.99), indicating the robustness of the resolved factors. The secondary sulfate factor and vehicle exhaust show moderate correlations (R=0.46 and 0.53) between PMFt and MM-PMF, reflecting the larger inaccuracy in their PMF-resolved source profiles and contributions. This difference is in turn rooted in the lack of distinct source tracers for the two factors. In the factor profiles (Figs. 3 and S7), the corresponding highest-loading species (i.e., sulfate for the secondary sulfate factor and EC for the vehicle exhaust factor) accounted for less than 30 %, leading to higher uncertainties in the two factors.
Table 3Correlation (R) of common source factors between PMFt and MM-PMF. The highest correlation for each factor was highlighted in bold.

A comparison of individual factor contributions to PM2.5 and OC between MM-PMF and PMFt is shown in Fig. 6. Generally, larger differences between the two PMF runs are noted for OC apportionment results than for PM2.5. The contributions from the combined secondary sources are relatively stable, i.e., 62.5 % in MM-PMF vs. 63.9 % in PMFt to PM2.5 and 48.6 % in MM-PMF vs. 49.1 % in PMFt to OC. In the absence of organic marker data, the contribution from the SOA factor is not resolved and distributed into the secondary sulfate and the secondary nitrate factors, thereby notably inflating the contributions from the latter two source factors. For the primary sources, MM-PMF estimates that biomass burning and cooking combined contribute to 7.6 % of PM2.5 and 13.9 % of OC. Without organic markers, the PMFt model would distribute the contributions from these two sources to other factors, more specifically to coal combustion and residual oil combustion. Both the two latter sources show a relatively larger difference between the two PMF runs, especially to OC contributions. The coal combustion contribution to OC increases from 5.6 % in MM-PMF to 11.1 % in PMFt, and the residual oil combustion contribution increases from 7.2 % in MM-PMF to 11.1 % in PMFt. In summary, MM-PMF generates a more refined allocation of PM2.5 sources through identifying more contributing sources. In other words, the source contributions of certain factors are notably biased in PMF analysis without the organic markers due to either factor mixing or distortion.

Figure 6Comparison of individual factor contributions to PM2.5 (a, b) and to OC (c, d) between MM-PMF and PMFt: (b, d) average mass contributions (µg m−3) and (a, c) average percentage contributions (%).
3.2 Backward trajectory analysis of MM-PMF-resolved sources
Figure 7 shows the distributions of backward-trajectory-cluster means. Four clusters are extracted based on the clustering analysis using the TrajStat model. Cluster 1 represents air masses originating from the northeastern continental region, accounting for 17 % of all trajectories. Cluster 2 is the locally circulating air mass and accounts for 36 % of all trajectories. Cluster 3 (28 % of all trajectories) and cluster 4 (20 % of all trajectories) represent oceanic air masses and long-range transport air masses, respectively. Based on the mean trajectory length, more locally formed pollutants are expected under clusters 2 and 3, while more regionally transported pollutants could be linked to clusters 4 and 1. The distributions of individual air mass trajectories during the observation period are shown in Fig. S8. The average concentrations of PM2.5 and its major compositions under each cluster are provided in Fig. S9. Briefly, the PM2.5 concentration was the highest under the influence of local air masses (i.e., cluster 2), with an average value of 67.7 µg m−3, followed by the northeastern continental air masses (cluster 1, 59.1 µg m−3). Lower PM concentrations were observed under the influence of long-range transport air masses (cluster 4, 20.4 µg m−3) and oceanic air masses (cluster 3, 30.0 µg m−3).
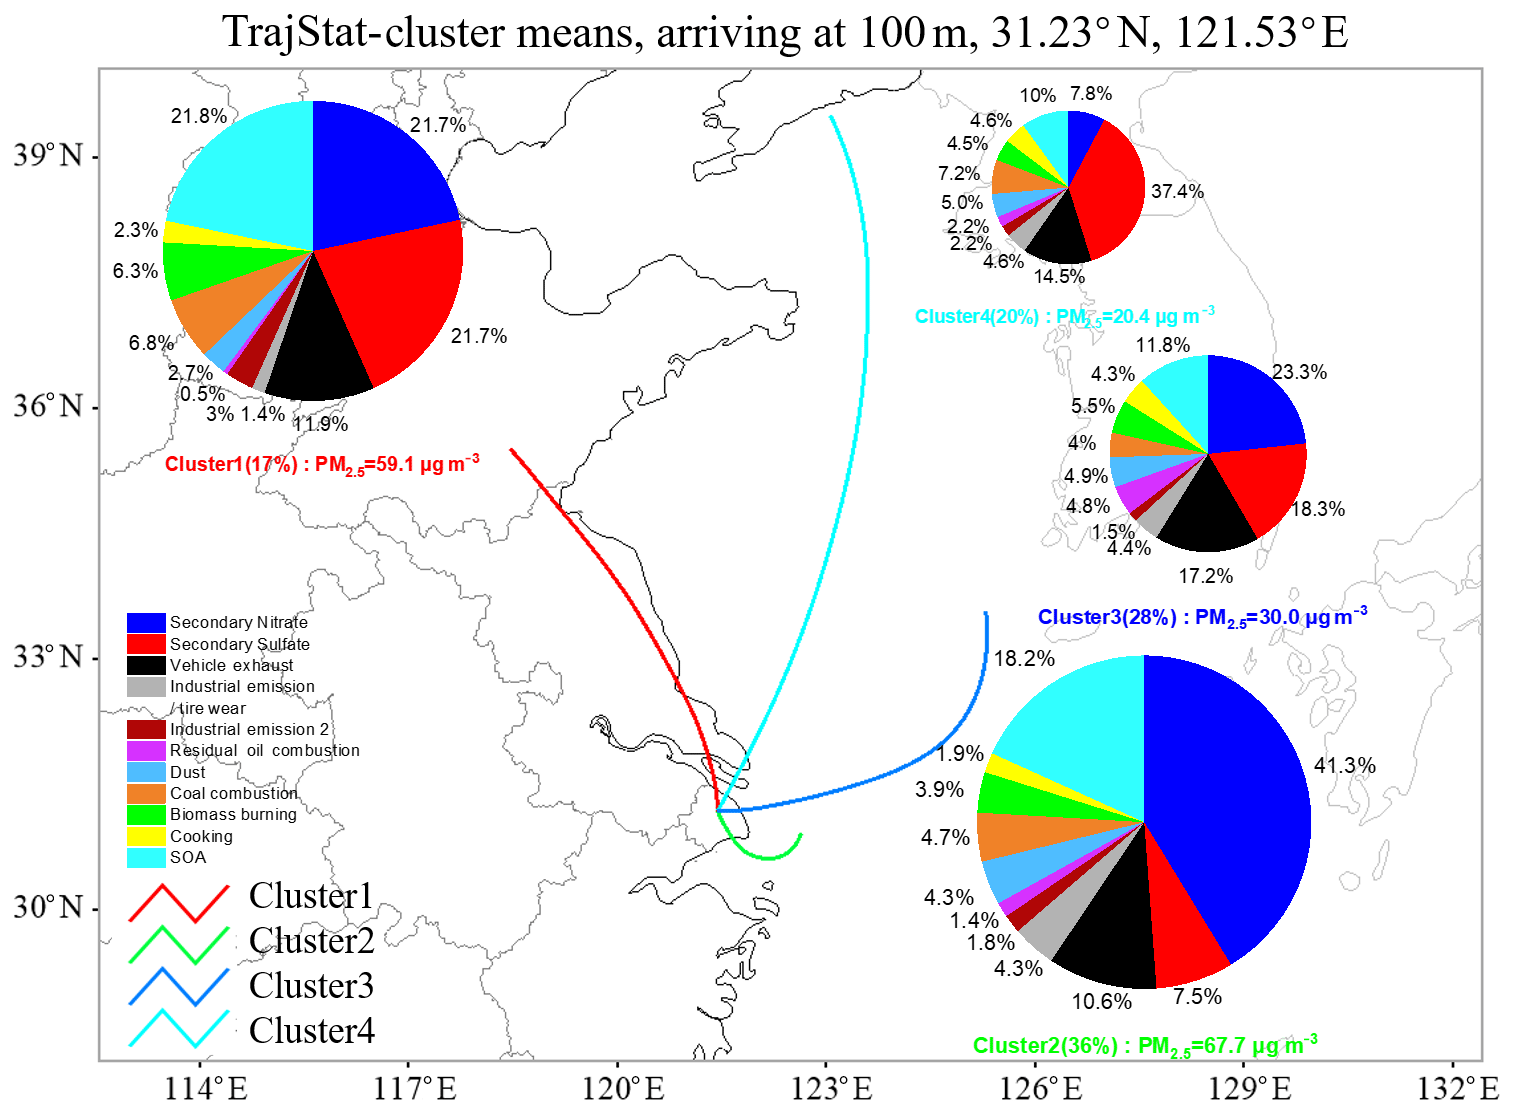
Figure 7MM-PMF-resolved source factor contributions to PM2.5 in different clusters during the sampling period. The colored lines in the map show the backward-trajectory-cluster means of the four clusters resolved by the TrajStat model. The percentage in parentheses after each cluster is the contribution of the corresponding cluster to all trajectories. The pie chart components represent the percentage contributions of individual source factors. The size of the pie chart is proportional to the total PM2.5 mass in each cluster.
The MM-PMF factor percentage contributions to PM2.5 under each cluster during the sampling period are shown as pie charts in Fig. 7, and the mass contributions of the individual factors under different clusters are shown in Fig. S10. The PM2.5 sources evidently vary in their contributions under the influence of air masses of different origins. Secondary nitrate, secondary sulfate, SOA, and the vehicle exhaust factor are the top four source contributors to PM2.5, regardless of air mass cluster type. The secondary nitrate factor shows the highest contribution under cluster 2 (41.3 %, 23.8 µg m−3) and the lowest contribution under cluster 4 (7.8 %, 1.8 µg m−3), indicating the important contribution of NOx precursors from local vehicular emissions to the secondary formation of nitrate aerosol. Secondary sulfate, however, showed much higher contributions under cluster 4 (37.4 %, 8.5 µg m−3) and cluster 1 (21.7 %, 10.1 µg m−3), compared with cluster 2 (7.5 %, 4.3 µg m−3). The results suggest the regionally sourced characteristic of sulfate-rich aerosols. The sulfate input from the northeastern continental region may arise from the increased SO2 emissions from coal burning due to need of heating supply (Sun et al., 2015). The SOA factor showed higher contributions under cluster 1 (21.8 %, 10.1 µg m−3) and cluster 2 (18.2 %, 10.5 µg m−3), compared to clusters 3 and 4 (11.8 % and 10 %, 3.5 and 2.3 µg m−3, respectively), suggesting the combined influence of locally formed SOA and regionally transported SOA from the northern continental area. The vehicle exhaust and cooking emissions show comparable mass contributions under different clusters (3.3–6.0 and 1.1–1.3 µg m−3), consistent with the local emission characteristics of the two sources (Fig. S10). For other factors, industrial emission and tire wear showed the highest mass contributions under cluster 2, in agreement with the influence of local vehicular emissions. Residual oil combustion showed the highest contributions under cluster 3, consistent with the increased influence of ship emissions when air masses pass over the Shanghai port. Industrial emission II, biomass burning, and coal combustion show higher mass contributions under clusters 1 and 2. Dust shows similar mass contributions among different clusters.
In summary, in the winter period, the accumulation of pollutants caused by local emission sources such as vehicle emissions, secondary nitrate, and SOA formation in Shanghai is an important cause of PM2.5 pollution. Additionally, coal burning in northeastern China also significantly affects the PM pollution in Shanghai under the influence of air mass movement.
3.3 Episodic analysis of MM-PMF-resolved sources
PM2.5 concentrations higher than 75 µg m−3 and lasting for more than 24 h are regarded as a PM episode in this study. Three episodes occurred during the entire measurement period (Fig. 2), and they are examined next to understand the source compositions of PM2.5 during pollution episodes. The first episode (EP1) occurred from 09:00 on 19 November to 09:00 on 20 November 2018. The second episode (EP2) occurred from 19:00 on 24 November to 01:00 on 26 November 2018. The third episode (EP3) lasted for almost 3 d, starting from 13:00 on 27 November to 07:00 on 30 November 2018. The average wind speed was 3.3, 1.6, and 1.7 m s−1 for EP1, EP2, and EP3, respectively. The distributions of backward trajectories during the three episodes are shown in Fig. S11. Briefly, EP1 mainly falls under the influence of cluster 1, i.e., northeastern continental air masses. EP2 and EP3 are mainly influenced by cluster 2, i.e., air mass trajectories circulating around the local area. The average PM2.5 concentrations observed during the three episodes were 96.2 µg m−3 for EP1, 79.8 µg m−3 for EP2, and 109.1 µg m−3 for EP3. The episodic PM concentrations are 3.3 times higher than during the nonepisodic hours. The highest PM pollution was observed in EP3 under local air mass influence (i.e., cluster 2) with a calm wind speed conducive to the accumulation of pollutants. The chemical compositions of PM2.5 for the three episodes are shown in Fig. S12.
The source contributions of PM2.5 under the three episodes are shown in Fig. 8 and compared with the average contributions during the nonepisodic hours. In the three episodes, obviously increased contributions from SOA and secondary nitrate are noted, with contributions increased from 3.4 and 7.0 µg m−3 in the nonepisodes to 17.2–20.2 and 10.6–38.5 µg m−3 in the episodes, respectively. Comparing source contributions among the three episodes, EP2 and EP3 show similar percent source contributions among the sources, while the source contributions in EP1 are different. In EP1, under the influence of the northeastern continental air mass, enhanced contributions are noted from secondary sulfate, coal combustion, biomass burning, and industrial emission II, in line with the study of Hua et al. (2018) on the source analysis of PM2.5 in the Beijing area. EP2 and EP3, under the influence of a locally circulating air mass, showed obviously higher contributions to PM2.5 from secondary nitrate than EP1 (45 %–49 % vs. 15 %; Fig. 8). Common to all three episodes is the consistent high contribution of the SOA factor to PM2.5 (24 %–28 %), indicating the persistent input of this source factor on PM pollution during different episodes. Vehicle exhaust also showed similar percentage contributions to PM2.5 among the three episodes (9 %–10 %). The remaining factors, all being minor contributors to PM under the episodic hours, showed similar contributions among the three episodes.
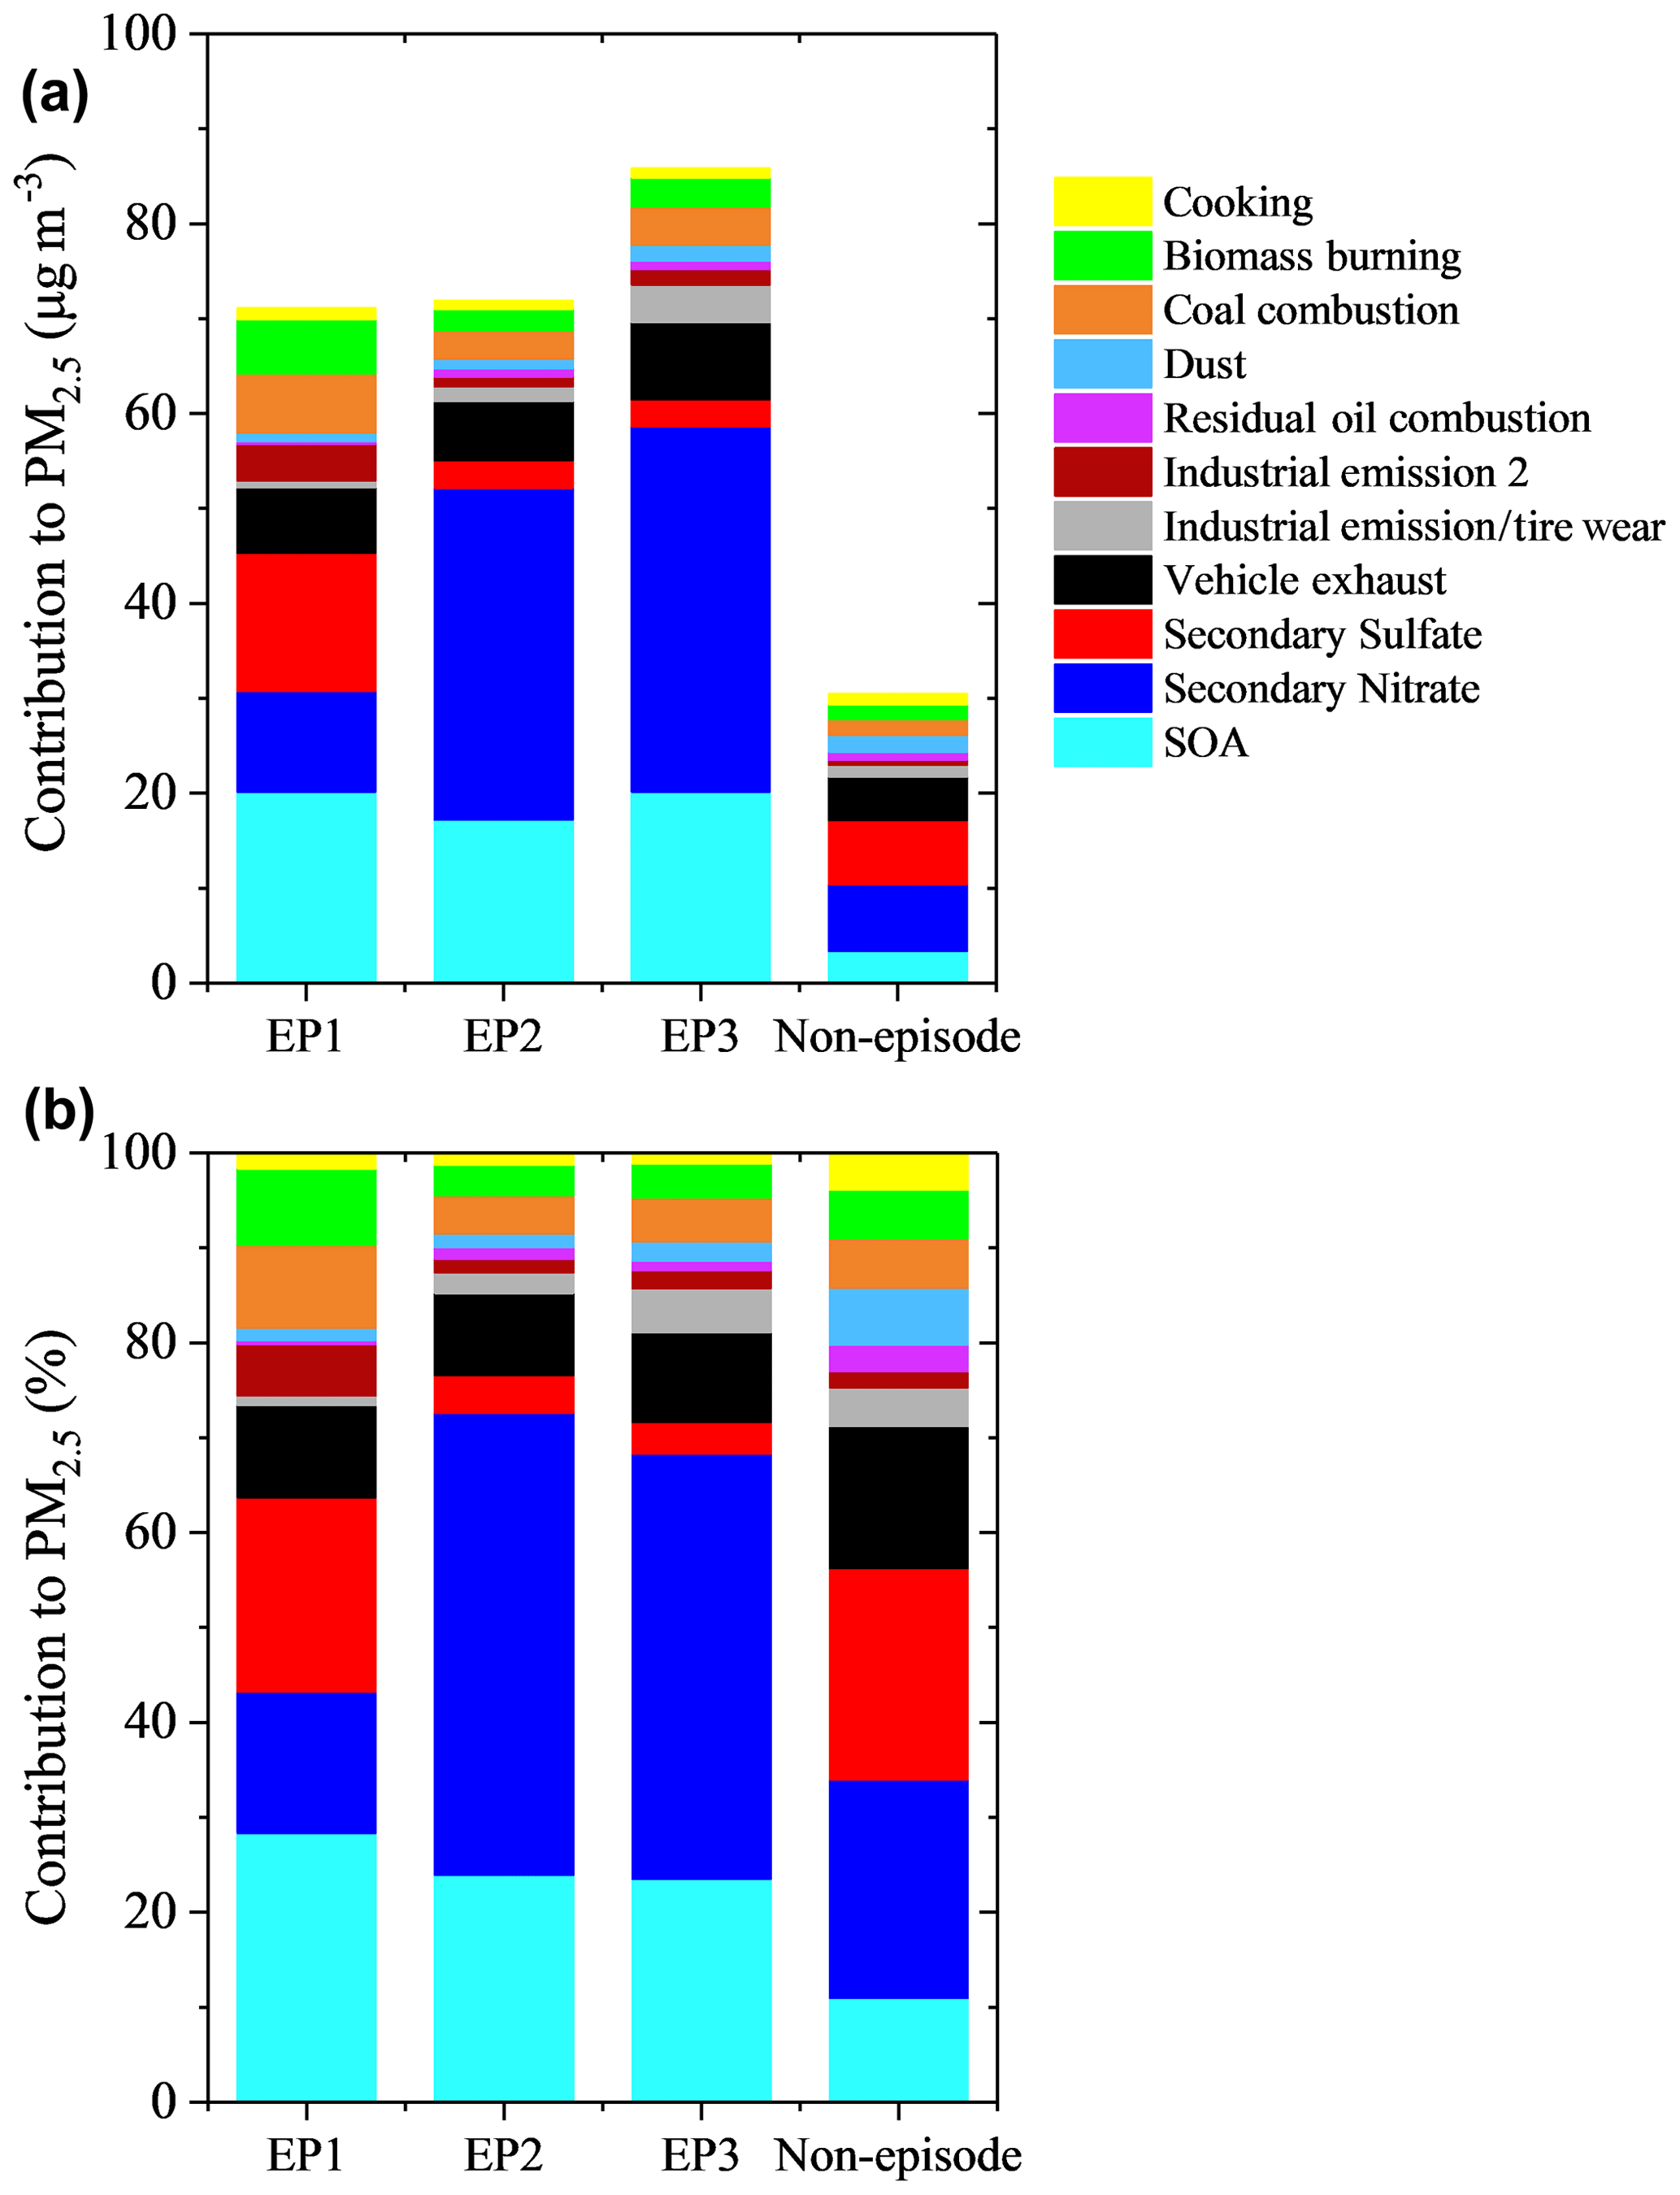
Figure 8Source contributions to PM2.5 from individual MM-PMF source factors during the three episodes encountered in the measurement period: (a) mass contributions (µg m−3) and (b) percentage contributions (%). The source contributions for nonepisodic hours are also included for comparison.
We carried out a source apportionment study through utilizing hourly measured PM2.5 and its chemical components, including water-soluble inorganic ions, carbonaceous species, and trace elements, and organic molecular markers which were measured at every odd hour in a 3-week field campaign in winter in urban Shanghai, a megacity in the Yangtze River Delta region, China. The PMF receptor modeling, with the comprehensive chemical speciation data as inputs (i.e., MM-PMF), has resolved 11 source factors, among which 3 organics-dominated factors, namely an SOA factor, biomass burning, and cooking factor, were resolved from other sources due to the availability of the organic marker data. Secondary nitrate and SOA are two major sources contributing to PM pollution in this urban environment. The three secondary sources combined (i.e., sum of the secondary nitrate, secondary sulfate, and SOA factor) contributed to more than 60 % of PM2.5 mass and 48.6 % of the total OC. PMF analysis without organic markers (i.e., PMFt) was also conducted for comparison. The three factors (i.e., SOA factor, biomass burning, and cooking emissions) could not be resolved as separate sources without the organic markers. Consequently, their source contributions would be distributed to other sources, biasing the source apportionment results by PMFt.
The backward trajectory clustering analysis on the MM-PMF-resolved source contributions revealed the impact of the air mass origins on different source factors. Secondary nitrate showed much higher contributions under local air mass influence, while secondary sulfate showed higher contributions under the influence of northeastern continental and long-range transport air masses. Three episodic events occurred during the measurement period, and our analysis showed enhanced contributions from secondary nitrate and SOA factors in episodic hours. Increased contribution from secondary sulfate was observed in the episode influenced by northeastern continental air masses. The results indicated that PM pollution in winter in the Shanghai area is greatly affected by both local pollutant emissions and the regional transport from the northeastern continental regions.
This study has demonstrated with field observation data that the combination of online organic molecular markers and elemental tracers and other PM major components provides more comprehensive characterization of the PM pollution sources, in particular those dominated by organics which would otherwise be mixed into other sources and bias the sources apportioned to these “other sources”. The hourly resolution in source factor contributions allows convenient utilization of those hourly data that have been routinely measured or obtained (e.g., meteorological conditions, gas pollutants, and backward trajectories analysis) to achieve an in-depth understanding of the source origins. The high-time-resolution data have also enabled the examination of pollution characteristics of different short-term PM pollution episodes. It is suggested that future studies deploying online MM-PMF include more organic markers such as hopanes and additional SOA tracers to resolve more source types of PM pollution. Also, MM-PMF for different ambient conditions is recommended to gain a more comprehensive understanding of the PM pollution sources at a given location.
The data presented in this article are available from the authors upon request.
RL and QW performed the receptor modeling and prepared the manuscript with contributions from all co-authors. LL and JZY formulated the project goals and edited and reviewed the manuscript. QW, XH, SZ, LQ, and RL conducted the measurements at the SAES site. YD and QF conducted the measurements at the PD site. KZ, YW, and LH contributed to data curation and interpretation.
The authors declare that they have no conflict of interest.
We thank the Shanghai Academy of Environmental Sciences for logistic help with the TAG measurements.
This research has been supported by the National Natural Science Foundation of China (grant no. 41875161) and the Hong Kong Research Grants Council (grant nos. 16305418 and R6011-18).
This paper was edited by Willy Maenhaut and reviewed by four anonymous referees.
Adachi, K. and Tainosho, Y.: Characterization of heavy metal particles embedded in tire dust, Environ. Int., 30, 1009–1017, 2004.
Al-Naiema, I. M., Hettiyadura, A. P. S., Wallace, H. W., Sanchez, N. P., Madler, C. J., Cevik, B. K., Bui, A. A. T., Kettler, J., Griffin, R. J., and Stone, E. A.: Source apportionment of fine particulate matter in Houston, Texas: insights to secondary organic aerosols, Atmos. Chem. Phys., 18, 15601–15622, https://doi.org/10.5194/acp-18-15601-2018, 2018.
Battelle: Environmental technology verification report, available at: http://cooperenvironmental.com/wp-content/uploads/2014/09/Xact625_ETVReport-full.pdf (last access: 7 September 2020), 2012.
Bond, T. C., Bhardwaj, E., Dong, R., Jogani, R., Jung, S., Roden, C., Streets, D. G., and Trautmann, N. M.: Historical emissions of black and organic carbon aerosols from energy-related combustion, 1850–2000, Global Biogeochem. Cy., 21, GB2018, https://doi.org/10.1029/2006GB002840, 2007.
Borai, E. H., El-Sofany, E. A., Abdel-Halim, A. S., and Soliman, A. A.: Speciation of hexavalent chromium in atmospheric particulate samples by selective extraction and ion chromatographic determination, Trac-Trend. Anal. Chem., 21, 741–745, 2002.
Chang, Y., Huang, K., Xie, M., Deng, C., Zou, Z., Liu, S., and Zhang, Y.: First long-term and near real-time measurement of trace elements in China's urban atmosphere: temporal variability, source apportionment and precipitation effect, Atmos. Chem. Phys., 18, 11793–11812, https://doi.org/10.5194/acp-18-11793-2018, 2018.
Chen, J., Liu, G. J., Kang, Y., Wu, B., Sun, R. Y., Zhou, C. C., and Wu, D.: Atmospheric emissions of F, As, Se, Hg, and Sb from coal-fired power and heat generation in China, Chemosphere, 90, 1925–1932, 2013.
Chen, L. W. A., Watson, J. G., Chow, J. C., and Magliano, K. L.: Quantifying PM2.5 source contributions for the San Joaquin Valley with multivariate receptor models, Environ. Sci. Technol., 41, 2818–2826, 2007.
Chow, J. C., Watson, J. G., Kuhns, H., Etyemezian , V., Lowenthal, D. H., Crow, D., Kohl, S. D., Engelbrecht, J. P., and Green, M. C.: Source profiles for industrial, mobile, and area sources in the Big Bend Regional aerosol visibility and observational study, Chemosphere, 54, 185–208, 2004.
Du, W. J., Zhang, Y. R., Chen, Y. T., Xu, L. L., Chen, J. S., Deng, J. J., Hong, Y. W., and Xiao, H.: Chemical characterization and source apportionment of PM2.5 during spring and winter in the Yangtze River Delta, China, Aerosol. Air. Qual. Res., 17, 2165–2180, 2017.
Engling, G., Carrico, C. M., Kreldenweis, S. M., Collett, J. L., Day, D. E., Malm, W. C., Lincoln, E., Hao, W. M., Iinuma, Y., and Herrmann, H.: Determination of levoglucosan in biomass combustion aerosol by high-performance anion-exchange chromatography with pulsed amperometric detection, Atmos. Environ., 40, S299–S311, 2006.
Feng, J., Zhang, Y., Li, S., Mao, J., Patton, A. P., Zhou, Y., Ma, W., Liu, C., Kan, H., Huang, C., An, J., Li, L., Shen, Y., Fu, Q., Wang, X., Liu, J., Wang, S., Ding, D., Cheng, J., Ge, W., Zhu, H., and Walker, K.: The influence of spatiality on shipping emissions, air quality and potential human exposure in the Yangtze River Delta/Shanghai, China, Atmos. Chem. Phys., 19, 6167–6183, https://doi.org/10.5194/acp-19-6167-2019, 2019.
Feng, J. L., Li, M., Zhang, P., Gong, S. Y., Zhong, M. A., Wu, M. H., Zheng, M., Chen, C. H., Wang, H. L., and Lou, S. R.: Investigation of the sources and seasonal variations of secondary organic aerosols in PM2.5 in Shanghai with organic tracers, Atmos. Environ., 79, 614–622, 2013.
Foley, K. M., Roselle, S. J., Appel, K. W., Bhave, P. V., Pleim, J. E., Otte, T. L., Mathur, R., Sarwar, G., Young, J. O., Gilliam, R. C., Nolte, C. G., Kelly, J. T., Gilliland, A. B., and Bash, J. O.: Incremental testing of the Community Multiscale Air Quality (CMAQ) modeling system version 4.7, Geosci. Model Dev., 3, 205–226, https://doi.org/10.5194/gmd-3-205-2010, 2010.
Fu, X., Wang, S. X., Zhao, B., Xing, J., Cheng, Z., Liu, H., and Hao, J. M.: Emission inventory of primary pollutants and chemical speciation in 2010 for the Yangtze River Delta region, China, Atmos. Environ., 70, 39–50, 2013.
Griffith, S. M., Huang, X. H. H., Louie, P. K. K., and Yu, J. Z.: Characterizing the thermodynamic and chemical composition factors controlling PM2.5 nitrate: Insights gained from two years of online measurements in Hong Kong, Atmos. Environ., 122, 864–875, 2015.
He, X., Wang, Q. Q., Huang, X. H. H., Huang, D. D., Zhou, M., Qiao, L. P., Zhu, S. H., Ma, Y. G., Wang, H. L., Li, L., Huang, C., Xu, W., Worsnop, D. R., Goldstein, A. H., and Yu, J. Z.: Hourly measurements of organic molecular markers in urban Shanghai, China: Observation of enhanced formation of secondary organic aerosol during particulate matter episodic periods, Atmos. Environ., 240, 117807, 2020.
Hopke, P. K.: Review of receptor modeling methods for source apportionment, J. Air Waste Manage., 66, 237–259, https://doi.org/10.1080/10962247.2016.1140693, 2016.
Hua, Y., Wang, S. X., Jiang, J. K., Zhou, W., Xu, Q. C., Li, X. X., Liu, B. X., Zhang, D. W., and Zheng, M.: Characteristics and sources of aerosol pollution at a polluted rural site southwest in Beijing, China, Sci. Total. Environ., 626, 519–527, 2018.
Huang, R. J., Zhang, Y., Bozzetti, C., Ho, K. F., Cao, J. J., Han, Y. M., Daellenbach, K. R., Slowik, J. G., Platt, S. M., Canonaco, F., Zotter, P., Wolf, R., Pieber, S. M., Bruns, E. A., Crippa, M., Ciarelli, G., Piazzalunga, A., Schwikowski, M., Abbaszade, G., Schnelle-Kreis, J., Zimmermann, R., An, Z. S., Szidat, S., Baltensperger, U., El Haddad, I., and Prevot, A. S. H.: High secondary aerosol contribution to particulate pollution during haze events in China, Nature, 514, 218–222, 2014.
Isaacman, G., Kreisberg, N. M., Yee, L. D., Worton, D. R., Chan, A. W. H., Moss, J. A., Hering, S. V., and Goldstein, A. H.: Online derivatization for hourly measurements of gas- and particle-phase semi-volatile oxygenated organic compounds by thermal desorption aerosol gas chromatography (SV-TAG), Atmos. Meas. Tech., 7, 4417–4429, https://doi.org/10.5194/amt-7-4417-2014, 2014.
Jaeckels, J. M., Bae, M. S., and Schauer, J. J.: Positive matrix factorization (PMF) analysis of molecular marker measurements to quantify the sources of organic aerosols, Environ. Sci. Technol., 41, 5763–5769, 2007.
Jang, M. S., Czoschke, N. M., Lee, S., and Kamens, R. M.: Heterogeneous atmospheric aerosol production by acid-catalyzed particle-phase reactions, Science, 298, 814–817, 2002.
Jeong, C. H., Wang, J. M., Hilker, N., Debosz, J., Sofowote, U., Su, Y. S., Noble, M., Healy, R. M., Munoz, T., Dabek-Zlotorzynska, E., Celo, V., White, L., Audette, C., Herod, D., and Evans, G. J.: Temporal and spatial variability of traffic-related PM2.5 sources: Comparison of exhaust and non-exhaust emissions, Atmos. Environ., 198, 55–69, 2019.
Karar, K., Gupta, A. K., Kumar, A., and Biswas, A. K.: Characterization and identification of the sources of chromium, zinc, lead, cadmium, nickel, manganese and iron in PM10 particulates at the two sites of Kolkata, India, Environ. Monit. Assess., 120, 347–360, 2006.
Lee, S., Liu, W., Wang, Y. H., Russell, A. G., and Edgerton, E. S.: Source apportionment of PM2.5: Comparing PMF and CMB results for four ambient monitoring sites in the southeastern United States, Atmos. Environ., 42, 4126–4137, 2008.
Li, L., An, J. Y., Zhou, M., Yan, R. S., Huang, C., Lu, Q., Lin, L., Wang, Y. J., Tao, S. K., Qiao, L. P., Zhu, S. H., and Chen, C. H.: Source apportionment of fine particles and its chemical components over the Yangtze River Delta, China during a heavy haze pollution episode, Atmos. Environ., 123, 415–429, 2015.
Li, R., Mei, X., Wei, L. F., Han, X., Zhang, M. G., and Jing, Y. Y.: Study on the contribution of transport to PM2.5 in typical regions of China using the regional air quality model RAMS-CMAQ, Atmos. Environ., 214, 116856, https://doi.org/10.1016/j.atmosenv.2019.116856, 2019.
Liu, B., Song, N., Dai, Q., Mei, R., Sui, B., Bi, X., and Feng, Y.: Chemical composition and source apportionment of ambient PM2.5 during the non-heating period in Tai'an, China, Atmos. Res., 170, 23–33, 2016.
Makkonen, U., Virkkula, A., Mäntykenttä, J., Hakola, H., Keronen, P., Vakkari, V., and Aalto, P. P.: Semi-continuous gas and inorganic aerosol measurements at a Finnish urban site: comparisons with filters, nitrogen in aerosol and gas phases, and aerosol acidity, Atmos. Chem. Phys., 12, 5617–5631, https://doi.org/10.5194/acp-12-5617-2012, 2012.
Men, C., Liu, R. M., Wang, Q. R., Guo, L. J., Miao, Y. X., and Shen, Z. Y.: Uncertainty analysis in source apportionment of heavy metals in road dust based on positive matrix factorization model and geographic information system, Sci. Total Environ., 625, 27–39, 2019.
Nicolosi, E. M. G., Quincey, P., Font, A., and Fuller, G. W.: Light attenuation versus evolved carbon (AVEC) – A new way to look at elemental and organic carbon analysis, Atmos. Environ., 175, 145–153, 2018.
Norris, G., Duvall, R., Brown, S., and Bai, S.: EPA positive matrix factorization (PMF) 5.0 fundamentals and user guide, U.S. Environmental Protection Agency, Washington, DC, EPA/600/R-14/108 (NTIS PB2015-105147), 2014.
Paatero, P. and Tapper, U.: Positive matrix factorization: A nonnegative factor model with optimal utilization of error estimates of data values, Environmetrics, 5, 111–126, 1994.
Pant, P. and Harrison, R. M.: Estimation of the contribution of road traffic emissions to particulate matter concentrations from field measurements: A review, Atmos. Environ., 77, 78–97, 2013.
Qiao, L. P., Cai, J., Wang, H. L., Wang, W. B., Zhou, M., Lou, S. R., Lou, S. R., Chen, R. J., Dai, H. X., Chen, C. H., and Kan, H. D.: PM2.5 constituents and hospital emergency-room visits in Shanghai, China, Environ. Sci. Technol., 48, 10406–10414, 2014.
Qiao, T., Zhao, M. F., Xiu, G. L., and Yu, J. Z.: Simultaneous monitoring and compositions analysis of PM1 and PM2.5 in Shanghai: Implications for characterization of haze pollution and source apportionment, Sci. Total Environ., 557, 386–394, 2016.
Shu, L., Wang, T. J., Xie, M., Li, M. M., Zhao, M., Zhang, M., and Zhao, X. Y.: Episode study of fine particle and ozone during the CAPUM-YRD over Yangtze River Delta of China: Characteristics and source attribution, Atmos. Environ., 203, 87–101, 2019.
Sofowote, U. M., Rastogi, A. K., Debosz, J., and Hopke, P. K.: Advanced receptor modeling of near-real-time, ambient PM2.5 and its associated components collected at an urban-industrial site in Toronto, Ontario, Atmos. Pollut. Res., 5, 13–23, 2014.
Sun, Y. L., Wang, Z. F., Du, W., Zhang, Q., Wang, Q. Q., Fu, P. Q., Pan, X. L., Li, J., Jayne, J., and Worsnop, D. R.: Long-term real-time measurements of aerosol particle composition in Beijing, China: seasonal variations, meteorological effects, and source analysis, Atmos. Chem. Phys., 15, 10149–10165, https://doi.org/10.5194/acp-15-10149-2015, 2015.
Wang, Q., He, X., Zhou, M., Huang, D. D., Qiao, L., Zhu, S., Ma, Y., Wang, H., Li, L., Huang, H., Xu, W., Worsnop, D., Goldstein, Guo, H., and Yu, J. Z.: Hourly measurements of organic molecular markers in urban Shanghai, China: Primary organic aerosol source identification and observation of cooking aerosol aging, ACS Earth Space Chem., 4, 1670–1685, 2020.
Wang, Q. Q., He, X., Huang, X. H. H., Griffith, S. M., Feng, Y. M., Zhang, T., Zhang, Q. Y., Wu, D., and Yu, J. Z.: Impact of secondary organic aerosol tracers on tracer-based source apportionment of organic carbon and PM2.5: A case study in the Pearl River Delta, China, ACS Earth Space Chem., 1, 562–571, 2017.
Wang, Q. Q., Qiao, L. P., Zhou, M., Zhu, S. H., Griffith, S., Li, L., and Yu, J. Z.: Source apportionment of PM2.5 using hourly measurements of elemental tracers and major constituents in an urban environment: investigation of time-resolution influence, J. Geophys. Res.-Atmos., 123, 5284–5300, 2018.
Wang, Q. Q., Huang, X. H. H., Tam, F. C. V., Zhang, X. X., Liu, K. M., Yeung, C., Feng, Y. M., Cheng, Y. Y., Wong, Y. K., Ng, W. M., Wu, C., Zhang, Q. Y., Zhang, T., Lau, N. T., Yuan, Z. B., Lau, A. K. H., and Yu, J. Z.: Source apportionment of fine particulate matter in Macao, China with and without organic tracers: A comparative study using positive matrix factorization, Atmos. Environ., 198, 183–193, 2019.
Williams, B., Goldstein, A., Kreisberg, N., and Hering, S.: An in-situ instrument for speciated organic composition of atmospheric aerosols: Thermal desorption aerosol GC/MS-FID (TAG), Aerosol Sci. Technol., 40, 627–638, 2006.
Yu, Q. Q., Gao, B., Li, G. H., Zhang, Y. L., He, Q. F., Deng, W., Huang, Z. H., Ding, X., Hu, Q. H., Huang, Z. Z., Wang, Y. J., Bi, X. H., and Wang, X. M.: Attributing risk burden of PM2.5-bound polycyclic aromatic hydrocarbons to major emission sources: Case study in Guangzhou, south China, Atmos. Environ., 142, 313–323, 2016.
Yu, S. Y., Liu, W. J., Xu, Y. S., Yi, K., Zhou, M., Tao, S., and Liu, W. X.: Characteristics and oxidative potential of atmospheric PM2.5 in Beijing: Source apportionment and seasonal variation, Sci. Total Environ., 650, 277–287, 2019.
Zhang, K., Li, L., Huang, L., Wang, Y. J., Huo, J. T., Duan, Y. S., Wang, Y. H., and Fu, Q. Y.: The impact of volatile organic compounds on ozone formation in the suburban area of Shanghai, Atmos. Environ., 232, 117511, https://doi.org/10.1016/j.atmosenv.2020.117511, 2020.
Zhang, Q., Ning, Z., Shen, Z. X., Li, G. L., Zhang, J. K., Lei, Y. L., Xu, H. M., Sun, J., Zhang, L. M., Westerdahl, D., Gali, N. K., and Gong, X. S.: Variations of aerosol size distribution, chemical composition and optical properties from roadside to ambient environment: A case study in Hong Kong, China, Atmos. Environ., 166, 234–243, 2017.
Zhang, Y., Sheesley, R. J., Schauer, J. J., Lewandowski, M., Jaoui, M., Offenberg, J. H., Kleindienst, T. E., and Edney, E. O.: Source apportionment of primary and secondary organic aerosols using positive matrix factorization (PMF) of molecular markers, Atmos. Environ., 43, 5567–5574, https://doi.org/10.1016/j.atmosenv.2009.02.047, 2009.
Zhang, Y. X., Sheesley, R. J., Bae, M. S., and Schauer, J. J.: Sensitivity of a molecular marker based positive matrix factorization model to the number of receptor observations, Atmos. Environ., 43, 4951–4958, 2009.
Zhao, M. J., Zhang, Y., Ma, W. C., Fu, Q. Y., Yang, X., Li, C. L., Zhou, B., Yu, Q., and Chen, L. M.: Characteristics and ship traffic source identification of air pollutants in China's largest port, Atmos. Environ., 64, 277–286, 2013.
Zhao, Q., Gao, W., Xiang, W. N., Shi, R. H., Liu, G. S., Zhai, T. Y., Huang, H. L. A., Gumley. L. E., and Strabala, K.: Analysis of air quality variability in Shanghai using AOD and API data in the recent decade, Front. Earth. Sci., 7, 159–168, 2013.
Zhao, Y. L., Kreisberg, N. M., Worton, D. R., Teng, A. P., Hering, S. V., and Goldstein, A. H.: Development of an in situ thermal desorption gas chromatography instrument for quantifying atmospheric semi-volatile organic compounds, Aerosol. Sci. Tech., 47, 258–266, 2013.
Zhou, H., Hopke, P. K., Zhou, C. L., and Holsenc, T. M.: Ambient mercury source identification at a New York State urban site: Rochester, NY, Sci. Total Environ., 650, 1327–1337, 2019.